Embed Size (px)
Citation preview
Page 1 of 74
The Effects of Highway Noise on Birds
Prepared by:
Robert J. Dooling1 and Arthur N. Popper1
Environmental BioAcoustics LLC
Rockville, MD 20853
September 30, 2007
Prepared for:
The California Department of Transportation Division of Environmental Analysis
1120 N Street Sacramento, CA 94274
Contact: Amy Pettler and Suzanne Theiss
Prepared Under Contract 43A0139Jones and Stokes Associates 2600 V Street
Sacramento, CA 95818-1914 Contact: David Buehler
1 Center for Comparative and Evolutionary Biology of Hearing, University of Maryland, College Park MD 20742, [email protected]; [email protected]

Page 2 of 74
Table of Contents
Executive Summary...................................................................................................................... 4 1. Introduction, Overview, Direction........................................................................................ 9
A. Definition of “Effect”........................................................................................................................................ 9 B. Organization and Purpose of Report ................................................................................................................ 9 C. Analysis of United States Fish and Wildlife Service (2006) Report ................................................................ 10 D. Literature Surveyed ........................................................................................................................................ 11 E. Metrics and Terminology ................................................................................................................................ 11 F. Typical Highway Operational and Construction Noise Levels ....................................................................... 12
Table I. Typical Roadway Traffic Conditions.................................................................................................12 Figure 1: Typical Highway Noise Levels .........................................................................................................13
G. Relation between dB(A) and Spectrum Level................................................................................................. 13 Table 2. Construction Equipment Noise Emission Levels (greatest-to-least) ..............................................14
2. The Bird Ear and Hearing ..................................................................................................... 16 A. The Bird Ear.................................................................................................................................................... 17
Figure 2: Avian Inner Ear Anatomy ................................................................................................................18 Figure 3: Sensory Hair Cells in the Avian Ear................................................................................................19
B. Physiology of Avian Hearing.......................................................................................................................... 19 C. Behavioral Measures of Avian Hearing – The Audiogram ............................................................................. 20
Figure 4: Bird Hearing Thresholds ..................................................................................................................21 D. Biological Correlates of the Avian Audiogram............................................................................................... 21 E. The Hearing Range and Vocalization Spectrum of Birds ............................................................................... 22 F. The Hearing Capabilities of Nestlings ............................................................................................................ 22
3. General Principles of the Effects of Noise on Birds............................................................. 23 A. Direct Effects of Noise on Hearing in Birds – Threshold Shift ...................................................................... 24
Figure 5: Effects of Highway Noise on Birds...................................................................................................24 Table 3: Recommended Interim Guidelines for Potential Effects from Different Noise Sources...............25 Figure 6: Threshold Shift in Birds Exposed to Noise .....................................................................................27
B. Masking and the characteristics of noise ........................................................................................................ 27 C. Direct Effects of Noise on Hearing by Birds – Critical Masking Ratios......................................................... 29
Figure 7: Avian critical ratios...........................................................................................................................29 Figure 8: Critical Ratios in Birds and Humans ..............................................................................................31
D. Understanding Basic Facts about Masking and Hearing in Noise................................................................. 31 Figure 9: Relation Between Overall Noise, Spectrum Level, and Hearing Thresholds...............................32
E. The Origin of the 60 dB(A) Level for Estimating the Effects of Traffic Noise and Masking on Avian Vocal Communication.................................................................................................................................................... 33
4. Effects of Highway Noise on Birds ....................................................................................... 35 A. Overview ......................................................................................................................................................... 35 B. Effects of Non-Highway Noise on Birds.......................................................................................................... 35 C. Birds and Highway Noise ............................................................................................................................... 36 D. Lessons from the Work on Human Responses to Traffic Noise....................................................................... 39 E. Long-Term Adaptations to Noise Masking...................................................................................................... 39 F. Short-Term Adaptations to Noise Masking ..................................................................................................... 40
Figure 10: Spatial Release from Masking........................................................................................................41 G. Estimating Maximum Communication Distance between Two Birds Using Laboratory Masking Data ........ 41
Figure 11: Noise Used in Hearing Tests ...........................................................................................................42 Figure 12: Vocalizations Used in Behavioral Tests.........................................................................................42 Figure 13. Call Detection and Discrimination Distance .................................................................................43 Figure 14. Maximum Song Detection Distance In Different Environments .................................................44
H. Putting It All Together – Predicting the Effect of Noise on Acoustic Communication by Birds ..................... 44 Figure 15: Conceptual Model for Estimating Masking Effects of Noise.......................................................45
I. Defining Guidelines for Effects ....................................................................................................................... 46 5. Summary and Overview of the Effects of Traffic Noise on Birds ...................................... 48

Page 3 of 74
A. Classes of Potential Effects on Birds .............................................................................................................. 48 B. Summary of Review Findings .......................................................................................................................... 48
6. Recommendations for Future Research ............................................................................... 50 Table 4: Research recommendations based on interim guidelines (see Table 5) .........................................51 Table 5: Additions to basic science data that could inform decisions on interim guidelines and future analyses. ..............................................................................................................................................................52
7. Estimating Effects of Traffic Noise on Birds, Rationale, and Interim Guidelines ............ 53 8. Literature Cited ...................................................................................................................... 55 Appendix A: Glossary of Terms Used....................................................................................... 63 Appendix B: Complete Table of all Behavioral Studies of Hearing in Birds........................ 66 Appendix C: Complete Table of all Behavioral Studies of Critical Ratios in Birds............. 68 Appendix D: Fundamentals of Highway Traffic Noise ........................................................... 69
Page 4 of 74
Executive Summary
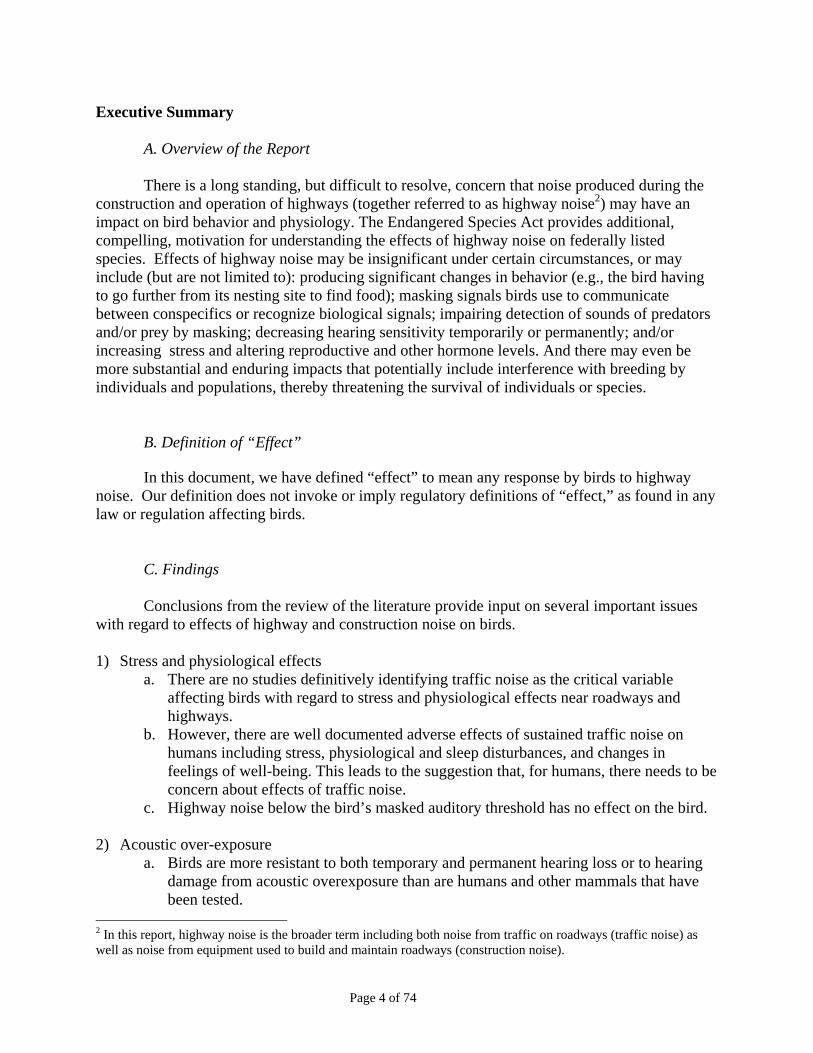
A. Overview of the Report There is a long standing, but difficult to resolve, concern that noise produced during the
construction and operation of highways (together referred to as highway noise2) may have an impact on bird behavior and physiology. The Endangered Species Act provides additional, compelling, motivation for understanding the effects of highway noise on federally listed species. Effects of highway noise may be insignificant under certain circumstances, or may include (but are not limited to): producing significant changes in behavior (e.g., the bird having to go further from its nesting site to find food); masking signals birds use to communicate between conspecifics or recognize biological signals; impairing detection of sounds of predators and/or prey by masking; decreasing hearing sensitivity temporarily or permanently; and/or increasing stress and altering reproductive and other hormone levels. And there may even be more substantial and enduring impacts that potentially include interference with breeding by individuals and populations, thereby threatening the survival of individuals or species.
B. Definition of “Effect”
In this document, we have defined “effect” to mean any response by birds to highway
noise. Our definition does not invoke or imply regulatory definitions of “effect,” as found in any law or regulation affecting birds.
C. Findings
Conclusions from the review of the literature provide input on several important issues with regard to effects of highway and construction noise on birds.
1) Stress and physiological effects
a. There are no studies definitively identifying traffic noise as the critical variable affecting birds with regard to stress and physiological effects near roadways and highways.
b. However, there are well documented adverse effects of sustained traffic noise on humans including stress, physiological and sleep disturbances, and changes in feelings of well-being. This leads to the suggestion that, for humans, there needs to be concern about effects of traffic noise.
c. Highway noise below the bird’s masked auditory threshold has no effect on the bird. 2) Acoustic over-exposure
a. Birds are more resistant to both temporary and permanent hearing loss or to hearing damage from acoustic overexposure than are humans and other mammals that have been tested.
2 In this report, highway noise is the broader term including both noise from traffic on roadways (traffic noise) as well as noise from equipment used to build and maintain roadways (construction noise).
Page 5 of 74
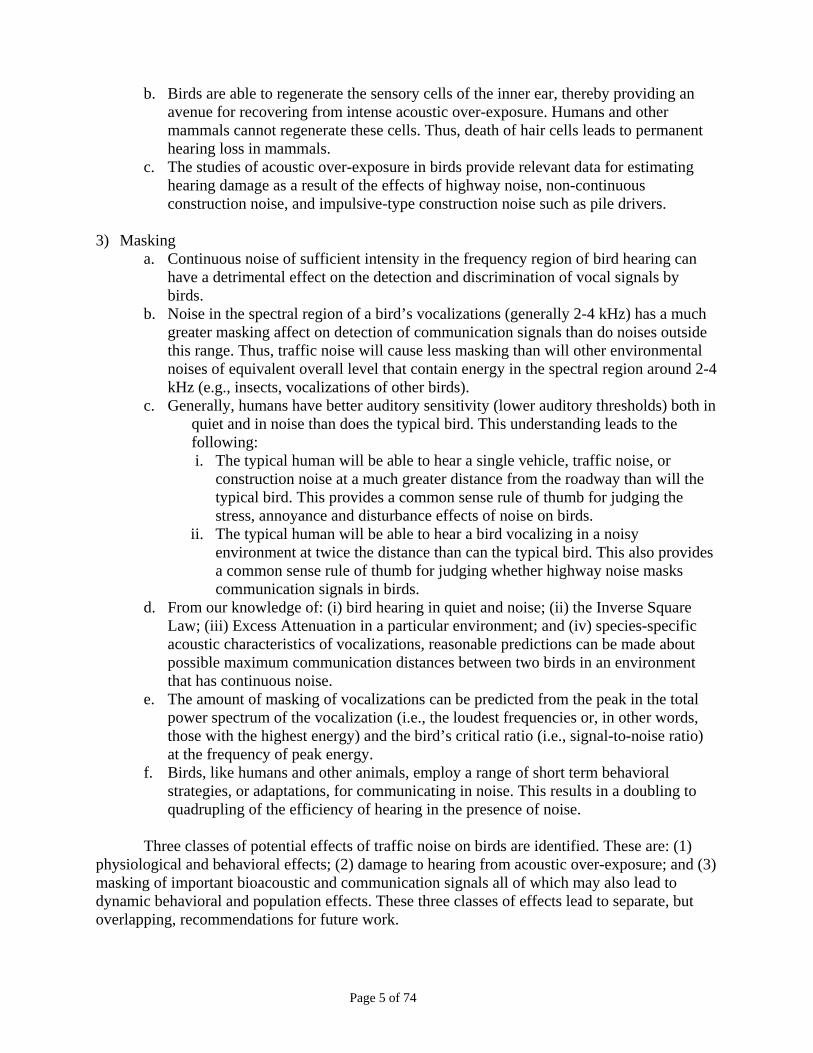
b. Birds are able to regenerate the sensory cells of the inner ear, thereby providing an avenue for recovering from intense acoustic over-exposure. Humans and other mammals cannot regenerate these cells. Thus, death of hair cells leads to permanent hearing loss in mammals.
c. The studies of acoustic over-exposure in birds provide relevant data for estimating hearing damage as a result of the effects of highway noise, non-continuous construction noise, and impulsive-type construction noise such as pile drivers.
3) Masking
a. Continuous noise of sufficient intensity in the frequency region of bird hearing can have a detrimental effect on the detection and discrimination of vocal signals by birds.
b. Noise in the spectral region of a bird’s vocalizations (generally 2-4 kHz) has a much greater masking affect on detection of communication signals than do noises outside this range. Thus, traffic noise will cause less masking than will other environmental noises of equivalent overall level that contain energy in the spectral region around 2-4 kHz (e.g., insects, vocalizations of other birds).
c. Generally, humans have better auditory sensitivity (lower auditory thresholds) both in quiet and in noise than does the typical bird. This understanding leads to the following: i. The typical human will be able to hear a single vehicle, traffic noise, or
construction noise at a much greater distance from the roadway than will the typical bird. This provides a common sense rule of thumb for judging the stress, annoyance and disturbance effects of noise on birds.
ii. The typical human will be able to hear a bird vocalizing in a noisy environment at twice the distance than can the typical bird. This also provides a common sense rule of thumb for judging whether highway noise masks communication signals in birds.
d. From our knowledge of: (i) bird hearing in quiet and noise; (ii) the Inverse Square Law; (iii) Excess Attenuation in a particular environment; and (iv) species-specific acoustic characteristics of vocalizations, reasonable predictions can be made about possible maximum communication distances between two birds in an environment that has continuous noise.
e. The amount of masking of vocalizations can be predicted from the peak in the total power spectrum of the vocalization (i.e., the loudest frequencies or, in other words, those with the highest energy) and the bird’s critical ratio (i.e., signal-to-noise ratio) at the frequency of peak energy.
f. Birds, like humans and other animals, employ a range of short term behavioral strategies, or adaptations, for communicating in noise. This results in a doubling to quadrupling of the efficiency of hearing in the presence of noise.
Three classes of potential effects of traffic noise on birds are identified. These are: (1)
physiological and behavioral effects; (2) damage to hearing from acoustic over-exposure; and (3) masking of important bioacoustic and communication signals all of which may also lead to dynamic behavioral and population effects. These three classes of effects lead to separate, but overlapping, recommendations for future work.
Page 6 of 74
1) Stress and physiological effects: a. Obtain a definitive answer to the question of whether traffic noise alone can produce
stress, physiological reactions, and/or disturbances in social behavior in birds by using artificial traffic noises broadcast in large areas while birds (preferably captive) are monitored for stress indices (low priority).
b. Conduct studies comparatively to determine if stress effects, like hearing effects, are species specific (low priority).
c. Conduct studies on birds of different ages and with different degrees of experience with loud noises to determine if experience is a factor in stress-related impacts (low priority).
2) Acoustic over-exposure:
a. Conduct laboratory experiments to test and strengthen the hypothesis that continuous loud traffic noise can damage avian hearing (low priority).
b. Examine effects of different levels of continuous noise on temporary and permanent hearing loss in different bird species (high priority).
c. Examine effects of impulsive noise such as that produced by construction equipment and pile driving on hearing loss in different bird species. Consider a range of variables including: the intensity of the noise, the number of impulses, inter-pulse interval, and effects of different “rest periods” between pulses on hearing loss (high priority).
3) Masking effects
a. Extend what is known about masking effectiveness of highway noise on the vocalizations of birds by conducting behavioral tests with a wider range of individual and species-specific vocalizations, different types and levels of highway noise, highway noises filtered through various habitats, and highway noise recorded at various distances from the roadway (high priority)
b. Assemble current data or generate new data on vocalizations of endangered species including types, levels, preferred singing location preferences, habitat characteristics, territory size, effect of habitat characteristics on vocalization and noise transmission. This will allow precise modeling of the masking effect of traffic noise acoustic communication (high priority).
c. Obtain ABR measures of hearing (audiogram) and masking (critical ratios) in endangered species to determine how well they conform to the emerging model of masking of vocalizations by noise which, to date, is based primarily on laboratory species of birds (high priority).
d. Develop a generalized quantitative model for estimating communication distance based on masking data, habitat characteristics, territory size, the bird’s singing position preferences, and different traffic noise profiles (high priority).
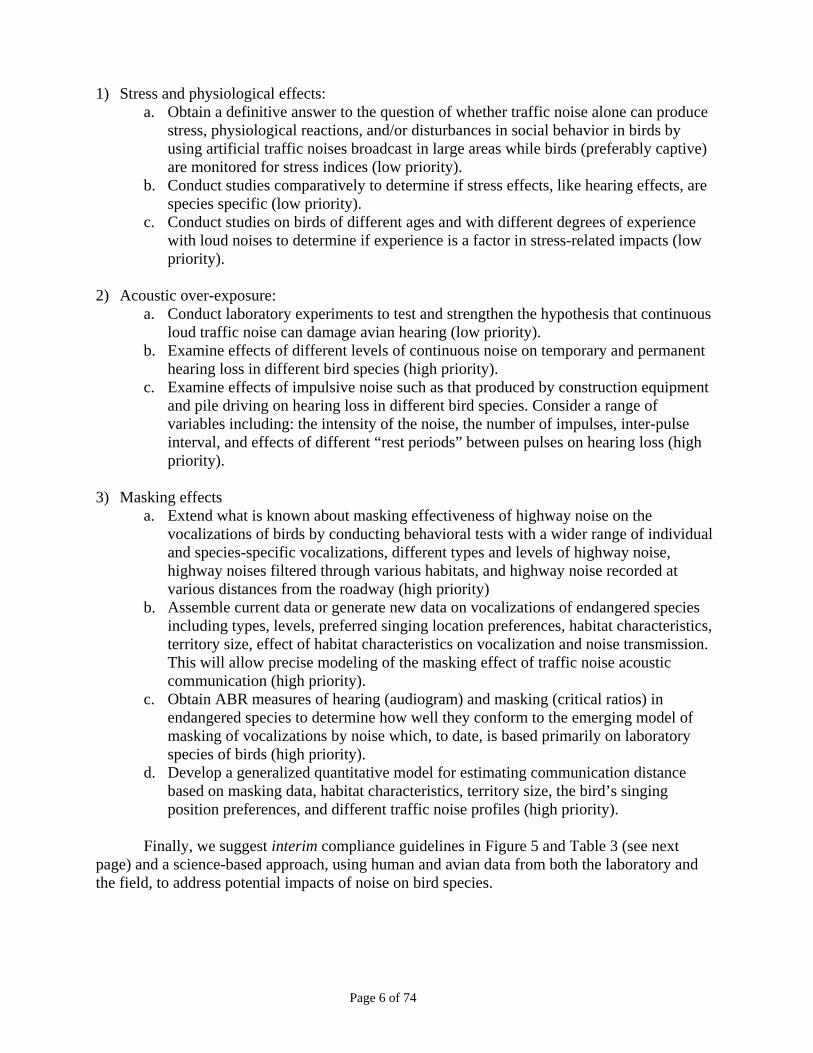
Finally, we suggest interim compliance guidelines in Figure 5 and Table 3 (see next
page) and a science-based approach, using human and avian data from both the laboratory and the field, to address potential impacts of noise on bird species.

Page 7 of 74
Figure 5: Effects of Highway Noise on Birds Categories of highway noise effects on birds with distance from the source. Zone 1 is closest to the source while Zone 4 is furthest away. Sound level decreases further from the source. See text for discussion.
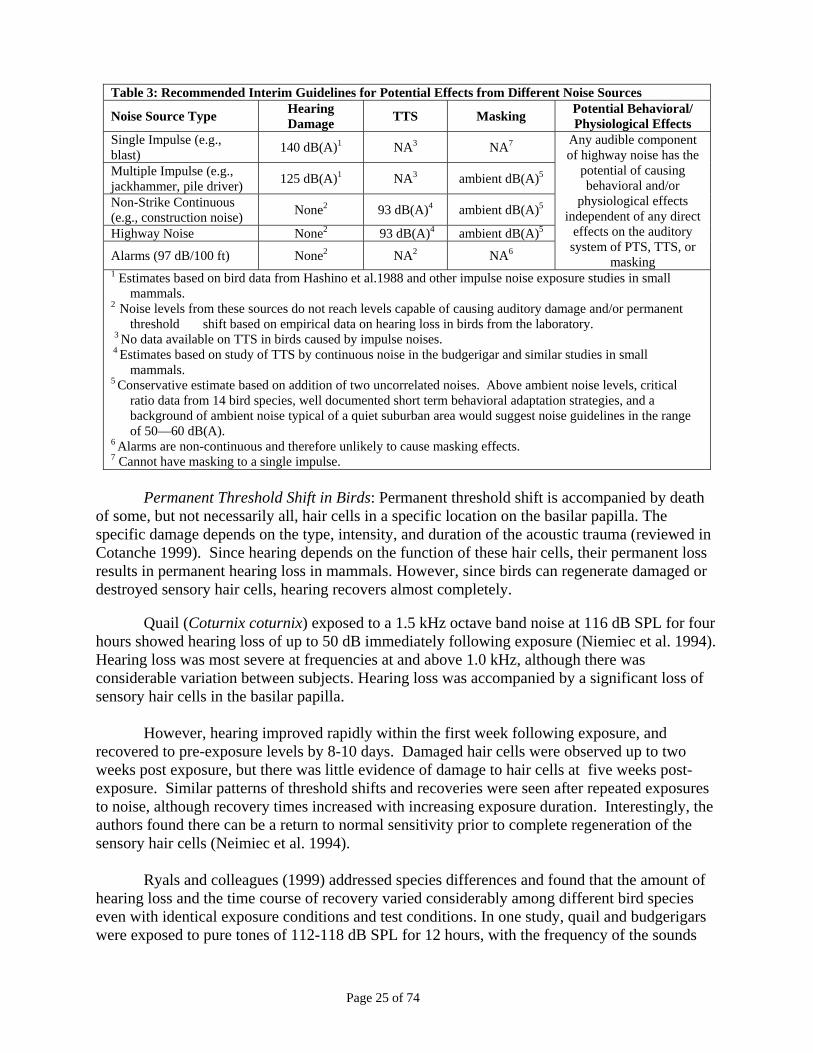
Table 3: Recommended Interim Guidelines for Potential Effects from Different Noise Sources
Noise Source Type Hearing Damage TTS Masking Potential Behavioral/
Physiological Effects Single Impulse (e.g., blast) 140 dB(A)1 NA3 NA7
Multiple Impulse (e.g., jackhammer, pile driver)
125 dB(A)1 NA3 ambient dB(A)5
Non-Strike Continuous (e.g., construction noise)
None2 93 dB(A)4 ambient dB(A)5
Highway Noise None2 93 dB(A)4 ambient dB(A)5 Alarms (97 dB/100 ft) None2 NA2 NA6
Any audible component of highway noise has
the potential of causing behavioral and/or
physiological effects independent of any direct effects on the auditory system of
PTS, TTS, or masking 1 Estimates based on bird data from Hashino et al.1988 and other impulse noise exposure studies in small
mammals. 2 Noise levels from these sources do not reach levels capable of causing auditory damage and/or permanent
threshold shift based on empirical data on hearing loss in birds from the laboratory. 3 No data available on TTS in birds caused by impulse noises. 4 Estimates based on study of TTS by continuous noise in the budgerigar and similar studies in small
mammals. 5 Conservative estimate based on addition of two uncorrelated noises. Above ambient noise levels, critical
ratio data from 14 bird species, well documented short term behavioral adaptation strategies, and a background of ambient noise typical of a quiet suburban area would suggest noise guidelines in the range of 50—60 dB(A).
6 Alarms are non-continuous and therefore unlikely to cause masking effects. 7 Cannot have masking to a single impulse.
Page 8 of 74
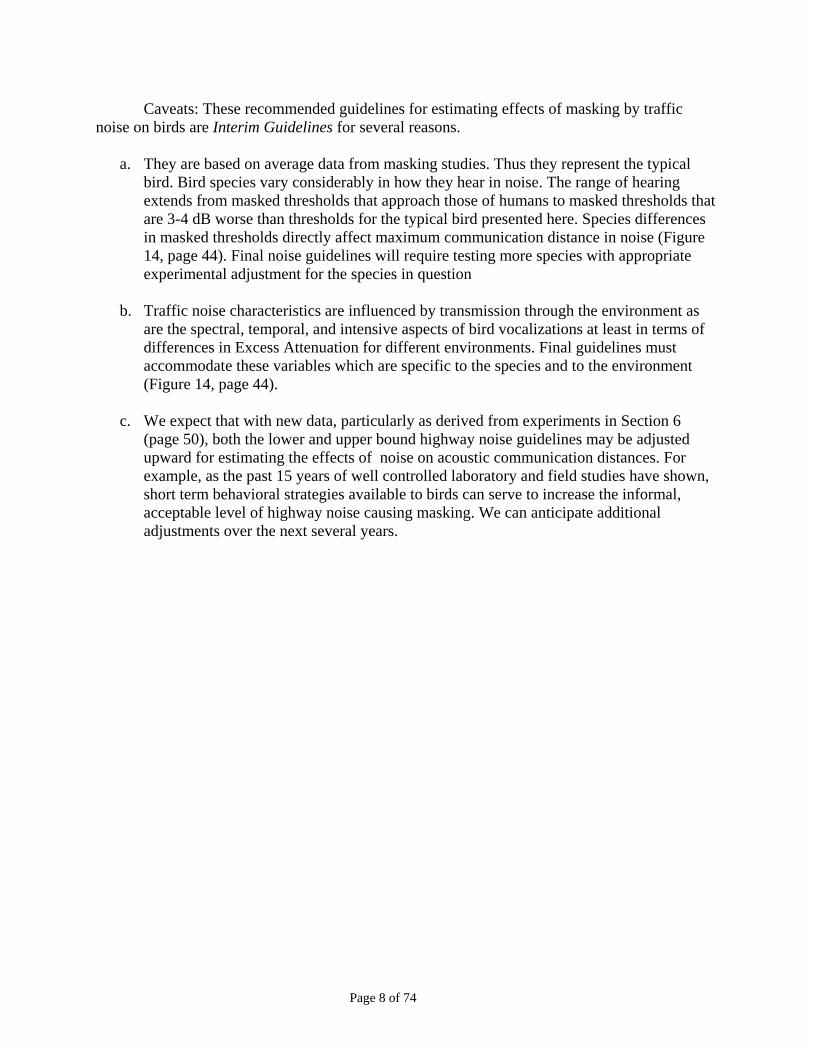
Caveats: These recommended guidelines for estimating effects of masking by traffic
noise on birds are Interim Guidelines for several reasons. a. They are based on average data from masking studies. Thus they represent the typical
bird. Bird species vary considerably in how they hear in noise. The range of hearing extends from masked thresholds that approach those of humans to masked thresholds that are 3-4 dB worse than thresholds for the typical bird presented here. Species differences in masked thresholds directly affect maximum communication distance in noise (Figure 14, page 44). Final noise guidelines will require testing more species with appropriate experimental adjustment for the species in question
b. Traffic noise characteristics are influenced by transmission through the environment as
are the spectral, temporal, and intensive aspects of bird vocalizations at least in terms of differences in Excess Attenuation for different environments. Final guidelines must accommodate these variables which are specific to the species and to the environment (Figure 14, page 44).
c. We expect that with new data, particularly as derived from experiments in Section 6
(page 50), both the lower and upper bound highway noise guidelines may be adjusted upward for estimating the effects of noise on acoustic communication distances. For example, as the past 15 years of well controlled laboratory and field studies have shown, short term behavioral strategies available to birds can serve to increase the informal, acceptable level of highway noise causing masking. We can anticipate additional adjustments over the next several years.
Page 9 of 74
1. Introduction, Overview, Direction
There is a long standing, but difficult to resolve, concern that noise produced during the construction and operation of highways (together referred to as “highway noise”) may have an impact on bird behavior and physiology. The Endangered Species Act provides additional, compelling motivation for understanding the effects of such noise on federally listed species. Exposure to highway noise may have little or no impact on birds, have minor or trivial biological impact as in very small changes in the location or size of a breeding or feeding site relative to the highway, or have more substantial impacts including interference with breeding by individuals and populations which threatens the survival of individuals or species (e.g., Brumm and Slabbekoorn 2005). The acoustic mechanisms of these effects of highway noise most likely involve altering conspecific acoustic communication, masking of detection and recognition of biological relevant signals, hindering detection of sounds of predators and/or prey, decreasing hearing sensitivity temporarily or permanently, and/or altering stress and reproductive hormone levels as birds adapt to increased background noise levels.
A. Definition of “Effect”
In this document, we have defined “effect” to mean any response by birds to highway
noise. Our definition does not invoke or imply regulatory definitions of “effect,” as found in any law or regulation affecting birds. B. Organization and Purpose of Report
Sections 2 (page 16) and 4 (page 23) of this Report provide an extensive discussion of bird audition which includes how birds hear, what they hear, and how environmental noise can generally affect the auditory system and hearing. This is followed in Section 4 (page 35) by a discussion of the effects of highway noise on birds, the “challenges” in surveying what is known about the effects of highway noise on birds, and issues with the literature. Section 5 (page 48) summarizes and provides an overview of the different classes of effects of noise on birds. Section 6 (page 50) suggests a set of experiments that should be performed as the basis for future interim criteria. Finally, Section 7 (page 53) poses a first set of interim criteria to protect birds from highway noise.
The purpose of this Report is intended to be three-fold. First, the Report critically discusses the little that is actually known about the effects of
highway noise on birds, with emphasis on the “best available science.” Generally the work in the literature to be discussed was directed at assessing and mitigating the impacts on birds of noise produced by highway construction and operation. The Report shows that there are major gaps in this body of literature and points to areas for future research.
Page 10 of 74
Second, this Report provides a strategic research plan to provide data needed to address key uncertainties related to bioacoustic impacts on birds, including effects on thresholds, metrics for effect criteria, and protocols for monitoring noise sources.
Third, the Report suggests interim compliance guidelines and a science-based approach, using human and avian data from both the laboratory and the field, to address potential impacts of noise to bird species. In areas such as hearing and masking of sounds by noise, rigorous data are available from such a wide range of species that extrapolations to federally listed species are reasonable. Such guidelines are done in coordination and consultation with compliance protocols for the Federal Endangered Species Act.
C. Analysis of United States Fish and Wildlife Service (2006) Report On July 31, 2006, the Arcata Fish and Wildlife Service Office of the U. S. Fish and
Wildlife Service (USFWS) issued guidance for estimating the effects of auditory and visual disturbance to Northern Spotted Owls and Marbled Murrelets in Northwestern California. The purpose of this guidance was to promote consistent and reasonable determinations of effects for activities that occur in or near northern spotted owl or marbled murrelet suitable habitat and result in elevated human generated sounds or human activities in close proximity to nest trees. The guidance applies to activities which have the potential to harass the northern spotted owl or the marbled murrelet as a result of substantially elevated sound levels or human presence near nests during the breeding season. The USFWS acknowledges that their report is to be viewed as a living document subject to continued, ongoing revision and improvement as additional data and experience are acquired.
The USFWS document provides guidance as to how a person in the field should make
determinations with regard to the potential effects of construction and highway noise on these two avian species. This guidance is particularly valuable because it takes into consideration critical variables and tries to integrate them into a simple practical model. These variables include: types of sound sources, distances from the sound sources to the birds, level of ambient noise in the environment, levels of anthropogenic (human-generated) noise, sound-modifying features of the environment, visual cues correlated with the noise, and the hearing sensitivity of the bird. In this regard, the USFWS report provides an extremely worthwhile potential strategy for estimating noise effects.
One limitation of the USFWS report, however, is that it is based on limited data from one
species. As discussed at length in the present Report, there are significant species differences in the ability to hear in noisy environments. These differences lead us to suggest that one model, or one noise level above ambient, is not likely to fit all species under all conditions. Moreover, how a bird integrates acoustic (i.e., noise) and visual stimuli in different contexts (e.g., breeding season or brooding) will have a profound effect on whether harassment occurs. For example, very low level sounds bearing some resemblance to the sounds of a natural predator are likely to be far more important to the bird than other sounds with no history of signaling danger. Such experiential factors will undoubtedly vary significantly by species.

Page 11 of 74
The noise levels discussed in the USFWS (2006) guidance are geared toward those that result in harassment or ‘flushing’ from the roost or nest. Independent, or in addition to, these effects, is the possibility of a more insidious effect of continuous highway noise on birds that rely on acoustic communication and song learning. The ability of conspecific birds to communicate acoustically may be affected by low levels of noise. Independently of such masking effects, birds may be driven from the area by flushing from either noise alone or some acoustic-visual stimulus. The USFWS report, together with what we review in this Report about bird hearing, may have value in helping reach a decision metric on possible effects of highway noise on birds. The specific recommendations made in the USFWS guidance report do not appear to be directly applicable to continuous traffic noise but may have utility for intermittent, impulse-type construction noise.
D. Literature Surveyed
The material presented in this Report is based on a careful evaluation of technical reports (gray literature) and peer-reviewed articles. The approach and analysis in each study reviewed differs, and so extrapolation between studies, and especially those done in different locations or by different groups of investigators, is difficult. Moreover, we have been particularly conservative in our use of the gray literature because we have no way of knowing if these studies have undergone the same rigorous scientific review that is imposed on peer-reviewed publications.
To further resolve the problems in using the gray literature material, we have attempted to review the material ourselves, and have used this material based on our views about the quality of the science and the validity of the conclusions reached in these studies. We have avoided use of material that is presented only as pages on the Internet because we have no basis for knowing if that material received any review whatsoever, and often so little information is provided that we cannot do our own evaluation.
In addition to primary peer-reviewed literature and gray literature reports, we also include citations to a number of reviews and overviews of various aspects of the material presented here. It must be recognized that the reviews, even if they have gone through appropriate peer review, are often the opinions of the authors and may be based on analysis of material from peer-reviewed articles and/or the gray literature.
E. Metrics and Terminology
This report contains a number of acoustic and biological terms. To facilitate understanding of terminology, most of the terms are defined in a Glossary that appears in Appendix A at the end of the report (page 63). Appendix D (page 69) discusses fundamentals of highway traffic noise.3 Those unfamiliar with fundamental concepts relating to highway traffic noise are advised to review information published by the California Department of Transportation (Caltrans). This includes the Technical Noise Supplement of the Caltrans Traffic
3 Material in Appendix D was prepared by Jones and Stokes and not by the authors of this Report
Page 12 of 74
Noise Analysis Protocol (Caltrans 1998) and Caltrans on-line noise training. Both are available at: http://www.dot.ca.gov/hq/env/noise/index.htm.
It is also important to define what is meant by “behavior” in this report because the word is used for a wide range of activities, and usage varies between different investigators. For example, behavior may be used to refer to the complex interaction of signals and rituals that animals use during mating, or the movements of animals from one feeding ground to another. In the context of this report, “behavior” is used in its broadest possible sense unless otherwise qualified and may include small startle movements when the sound is heard or, at the other extreme, behavior may include gross changes in the reproductive rituals of birds due to stress and hormonal effects, etc. caused by chronic exposure to long-duration noise.
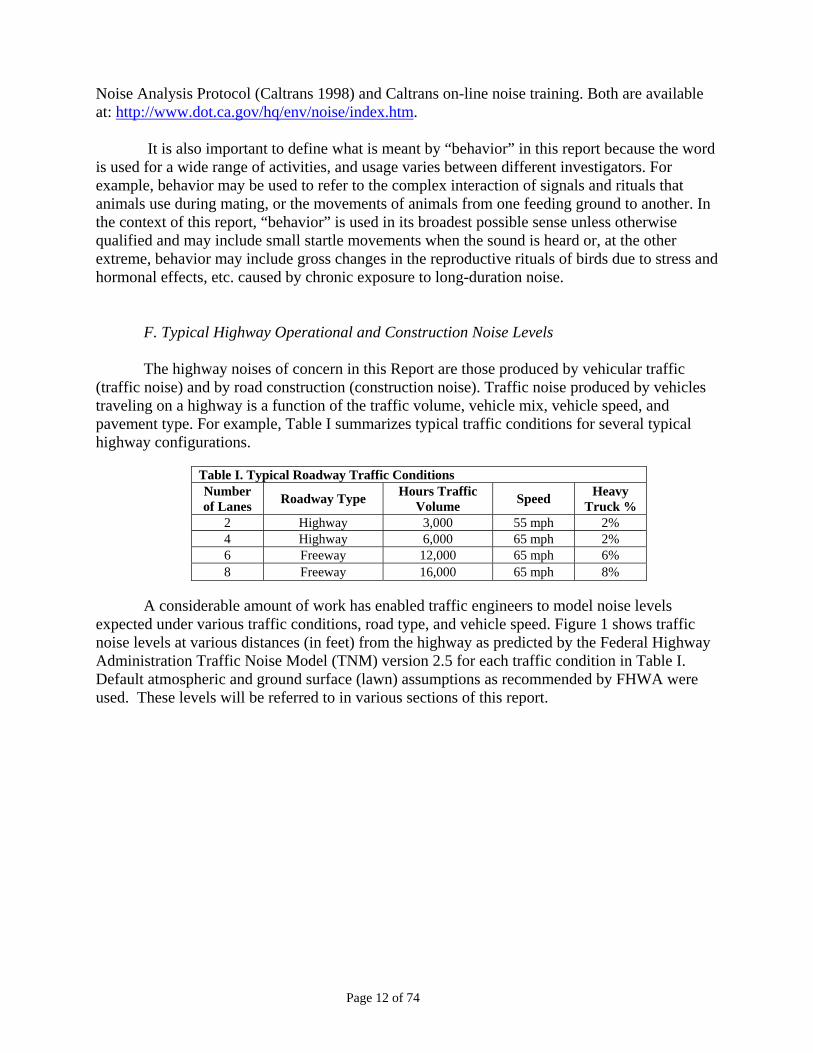
F. Typical Highway Operational and Construction Noise Levels The highway noises of concern in this Report are those produced by vehicular traffic
(traffic noise) and by road construction (construction noise). Traffic noise produced by vehicles traveling on a highway is a function of the traffic volume, vehicle mix, vehicle speed, and pavement type. For example, Table I summarizes typical traffic conditions for several typical highway configurations.
Table I. Typical Roadway Traffic Conditions Number of Lanes Roadway Type Hours Traffic
Volume Speed Heavy Truck %
2 Highway 3,000 55 mph 2% 4 Highway 6,000 65 mph 2% 6 Freeway 12,000 65 mph 6% 8 Freeway 16,000 65 mph 8%
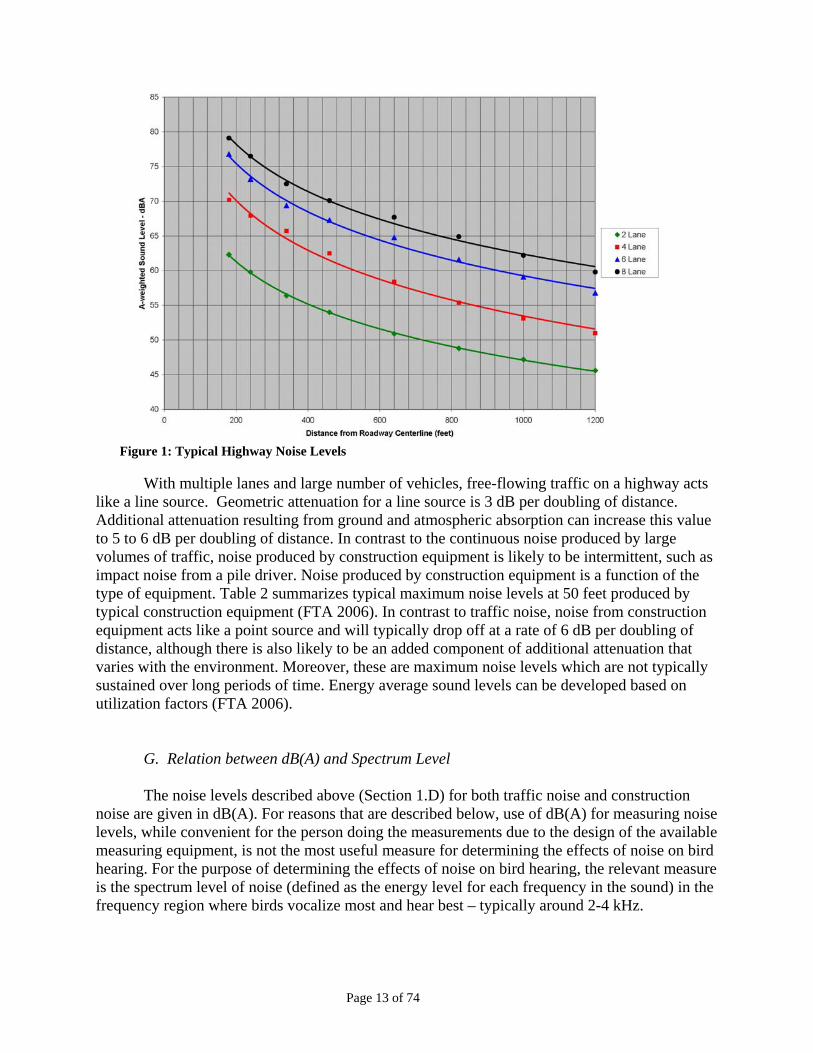
A considerable amount of work has enabled traffic engineers to model noise levels
expected under various traffic conditions, road type, and vehicle speed. Figure 1 shows traffic noise levels at various distances (in feet) from the highway as predicted by the Federal Highway Administration Traffic Noise Model (TNM) version 2.5 for each traffic condition in Table I. Default atmospheric and ground surface (lawn) assumptions as recommended by FHWA were used. These levels will be referred to in various sections of this report.
Page 13 of 74
Figure 1: Typical Highway Noise Levels
With multiple lanes and large number of vehicles, free-flowing traffic on a highway acts
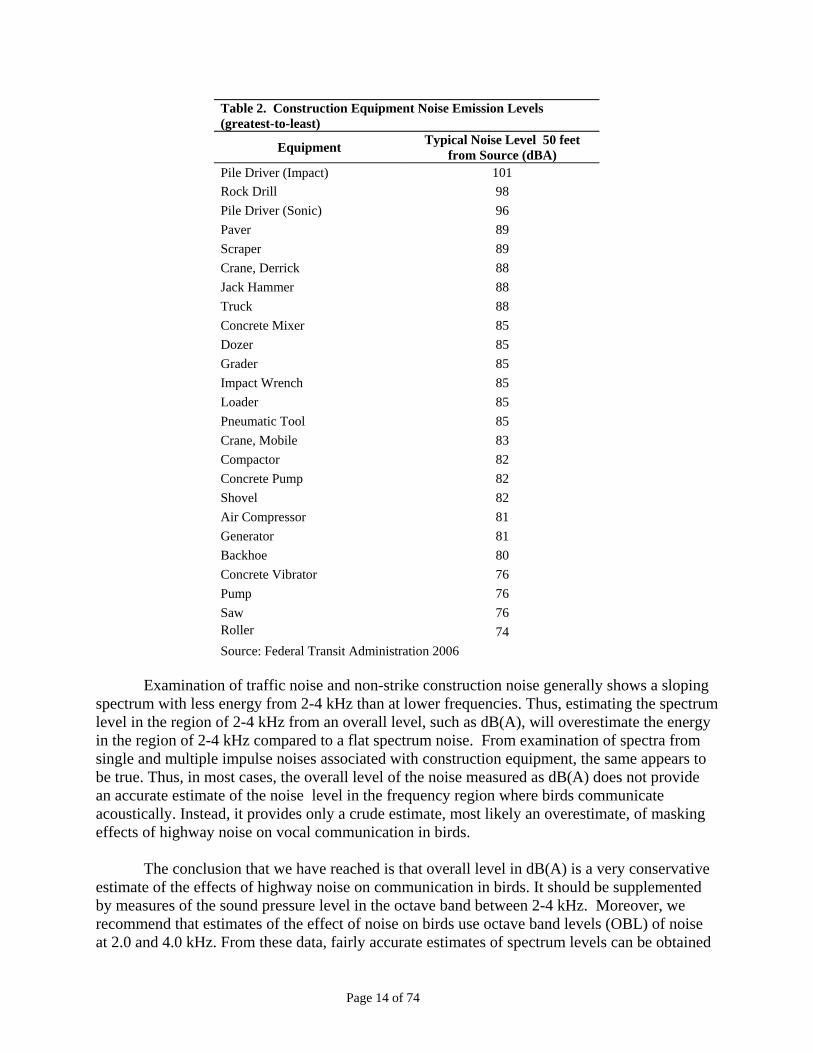
like a line source. Geometric attenuation for a line source is 3 dB per doubling of distance. Additional attenuation resulting from ground and atmospheric absorption can increase this value to 5 to 6 dB per doubling of distance. In contrast to the continuous noise produced by large volumes of traffic, noise produced by construction equipment is likely to be intermittent, such as impact noise from a pile driver. Noise produced by construction equipment is a function of the type of equipment. Table 2 summarizes typical maximum noise levels at 50 feet produced by typical construction equipment (FTA 2006). In contrast to traffic noise, noise from construction equipment acts like a point source and will typically drop off at a rate of 6 dB per doubling of distance, although there is also likely to be an added component of additional attenuation that varies with the environment. Moreover, these are maximum noise levels which are not typically sustained over long periods of time. Energy average sound levels can be developed based on utilization factors (FTA 2006).
G. Relation between dB(A) and Spectrum Level The noise levels described above (Section 1.D) for both traffic noise and construction
noise are given in dB(A). For reasons that are described below, use of dB(A) for measuring noise levels, while convenient for the person doing the measurements due to the design of the available measuring equipment, is not the most useful measure for determining the effects of noise on bird hearing. For the purpose of determining the effects of noise on bird hearing, the relevant measure is the spectrum level of noise (defined as the energy level for each frequency in the sound) in the frequency region where birds vocalize most and hear best – typically around 2-4 kHz.
Page 14 of 74
Table 2. Construction Equipment Noise Emission Levels (greatest-to-least)
Equipment Typical Noise Level 50 feet from Source (dBA)
Pile Driver (Impact) 101 Rock Drill 98 Pile Driver (Sonic) 96 Paver 89 Scraper 89 Crane, Derrick 88 Jack Hammer 88 Truck 88 Concrete Mixer 85 Dozer 85 Grader 85 Impact Wrench 85 Loader 85 Pneumatic Tool 85 Crane, Mobile 83 Compactor 82 Concrete Pump 82 Shovel 82 Air Compressor 81 Generator 81 Backhoe 80 Concrete Vibrator 76 Pump 76 Saw 76 Roller 74 Source: Federal Transit Administration 2006
Examination of traffic noise and non-strike construction noise generally shows a sloping
spectrum with less energy from 2-4 kHz than at lower frequencies. Thus, estimating the spectrum level in the region of 2-4 kHz from an overall level, such as dB(A), will overestimate the energy in the region of 2-4 kHz compared to a flat spectrum noise. From examination of spectra from single and multiple impulse noises associated with construction equipment, the same appears to be true. Thus, in most cases, the overall level of the noise measured as dB(A) does not provide an accurate estimate of the noise level in the frequency region where birds communicate acoustically. Instead, it provides only a crude estimate, most likely an overestimate, of masking effects of highway noise on vocal communication in birds.
The conclusion that we have reached is that overall level in dB(A) is a very conservative
estimate of the effects of highway noise on communication in birds. It should be supplemented by measures of the sound pressure level in the octave band between 2-4 kHz. Moreover, we recommend that estimates of the effect of noise on birds use octave band levels (OBL) of noise at 2.0 and 4.0 kHz. From these data, fairly accurate estimates of spectrum levels can be obtained
Page 15 of 74
for the critical frequency range in which birds communicate. And from these spectrum levels, decisions can be made about whether the noise will interfere with vocal communication. At 2.0 kHz, the spectrum level is roughly 33 dB less than the octave band level; at 4.0 kHz, the spectrum level is about 36 dB less than the octave band level.
Page 16 of 74
2. The Bird Ear and Hearing
In order to appreciate the potential effects of highway and construction noise on bird hearing, it is important to understand the bird ear and the basic hearing capabilities of birds both in quiet and in noise. Therefore, this section provides a background on the basic structure and function of the avian auditory system followed by a discussion, with data, of how well birds hear. This is followed by sections on the effects of noise on hearing capabilities, and how sounds may have a long-term effect on the ability of birds to hear sounds.
It is relevant to start with the question of why birds, or any animals (including humans)
hear, and why hearing may have evolved. Clearly, in the case of birds, one immediate and correct assumption is that hearing is closely related to acoustic communication. Indeed, birds, more than most any vertebrate group other than primates, make use of a rich array of sounds for communicating, finding mates, expressing territorial occupation, and numerous other social behaviors. But hearing is also more than this. Birds, as other animals, also use hearing to learn about their overall environments – in effect, they use sound to sample what Bregman (1991) called the “acoustic scene.” This acoustic scene is the array of sounds in the environment which may arise from biological or non-biological sources such as predators moving through the environment or the wind moving through trees. This acoustic scene covers an area all around an animal, and it is just as rich at night as it is in daylight. In effect, the acoustic scene enables an animal to “see” beyond its eyes and learn a great deal about its extended environment.
Some investigators (see Popper and Fay 1999; Fay and Popper 2000) have argued that
hearing originally evolved not for communication, but, instead, to enable animals to learn about their environment at some distance from themselves, thereby gaining better protection from predators and more precise information about the location of prey. The logic of this is clear when one thinks about what a human learns about her/his environment from the acoustic scene, and how much richer the environment is because of our being aware of a much larger space than one gets from all of the other senses.
Beyond the detection of the acoustic scene, the evolution of hearing must also have
involved the emergence of capabilities now referred to as “stream segregation.” This is best understood as the ability to differentiate between environmental sounds. In other words, while it is important to know there is something in the environment, stream segregation enables an animal to determine which sounds go together and which do not. This capability facilitates learning the location of the sound, its distance, and whether it is biologically relevant or not. For instance, an animal might run towards its predator if the source of the sound could not be localized and differentiated from the myriad of other signals in the environment.
Thus, hearing serves to inform animals of their acoustic scene. While it is reasonable to
suggest that hearing first evolved for the detection of the acoustic scene, it is likely that this basic hearing ability was quickly followed by the emergence of more complex perceptual capabilities such as the ability to accomplish stream segregation. It is also likely that it was not until somewhat later in evolution that acoustic communication evolved. At the same time, the use of sound for acoustic communication itself most certainly had an impact on the further evolution of hearing capabilities.

Page 17 of 74
From the perspective of this Report, we must consider that both environmental and communication sounds are important in the lives of birds. Thus, while we tend to think in terms of effects of human-generated sounds on communication, it must be kept in mind that the use of sound by birds extends beyond sounds used for communication to the much larger acoustic scene. Such sounds enable birds to be aware of their whole (acoustic) environment. When noise interferes with a bird sampling the environment and learning the relationship among sound sources and the environment, the individual, and perhaps the species, is at risk.
A. The Bird Ear
The bird ear consists of an external membrane (tympanic membrane), a middle ear, and an inner ear. There is no external structure that resembles the mammalian outer ear flap, or pinna (except for in owls). Instead, the tympanic membrane is the outermost covering of the middle ear. The function of the bird tympanic membrane is to gather sound, as it does in mammals (although in mammals the tympanic membrane is embedded in the head at the termination of the external ear canal). The middle ear acoustically couples air-borne sound to the fluids of the inner ear by impedance matching.4
The avian inner ear is similar to that of most vertebrates in having three semicircular
canals to determine angular acceleration of the head and three otolith organs for detection of motion of the head relative to gravity (Fig. 2). In addition, birds have a cochlear duct which contains a basilar papilla upon which sit the sensitive sensory hair cells (discussed below) used for hearing. However, the basilar papilla is shorter and rather different in structure than that found in mammals (Tanaka and Smith 1978; Smith 1985) and the differences may, to a degree, account for the much narrower range of frequencies detected by birds as compared to mammals.
Another factor that probably limits the frequency range over which birds hear is the
presence of a single-bone middle ear (columella – see left side of Fig. 2) rather than the three-bone middle bones (malleus, incus, stapes) that are characteristic of mammals. It is likely that the presence of a single columella (which is likely to be homologous to the mammalian stapes) rather than three ear bones found in mammals generally limits hearing in most avian species to not much more than 10 kHz (Saunders et al. 2000).
Birds and mammals (as well as all other vertebrates) have highly specialized sensory hair cells in each of the end organs of the ear (Fig. 3). These cells convert (transduce) mechanical energy into energy that is compatible with the nervous system. Each sensory cell has a group of cilia (called stereocilia or sterovilli) on its surface (hence the name “hair” cell). A sound stimulus produces a motion in the membranes of the inner ear which, in turn, results in bending of the cilia. This produces a cascade of chemical events in the cells that culminates in the release of a chemical signal (called a neurotransmitter) that stimulates the nerve that goes from the hair cells to the brain.
4 In effect, the middle ear increases the power of air-borne sounds so that they can move the much denser fluids of the inner ear. The evolution of the middle ear to “amplify” the power of the sound so it can stimulate the inner ear is one of the major features of hearing in terrestrial (land) vertebrates.

Page 18 of 74
Figure 2: Avian Inner Ear Anatomy Schematic of the avian ear and vestibular apparatus (left) showing the single bone columella and a short, uncoiled ‘cochlear’ duct containing the basilar membrane. A schematic cross section (right) of the cochlear duct shows an array of sensory hair cells (labeled THC and SHC, see Fig. 3) across the width and length of the basilar papilla. Taken from Smith 1985 and Tanaka and Smith1978. (Legend for major structures in the right figure: BM – basilar membrane; NF – fibers of the 8th cranial nerve; SHC – short sensory hair cells; THC – tall sensory hair cells
Sensory hair cells are the fundamental structures involved in hearing (and also in the
senses of balance and detection of head motion). Damage to sensory hair cells, and/or their death, can have a profound effect on the function of the ear, and results in a loss of hearing in both birds and mammals. While there is a normal attrition of hair cells with age of an organism, and an associated loss of hearing (especially at higher frequencies in humans), exposure to an excess of certain medications or loud sounds can result in premature death of sensory hair cells, and a loss of hearing.
The sensory surface of the avian ear, the basilar papilla, is an elongated membrane that contains thousands of sensory hair cells (Fig. 2, right side). The cilia project upwards into a fluid-filled space and are over overlain by a “tectorial membrane.” Bird ears are very complex and have many hair cells across the width of the sensory epithelium, and remarkable variation across the epithelium in the pattern of how the ciliary bundles are oriented, the shape of the hair cell bundle, and the number and height of stereovilli on each hair cell (Gleich and Manley 2000). The sensory epithelium of the avian cochlea in birds is much shorter than that in mammals (e.g., about 2 mm in canary and zebra finch versus 30 mm in humans) which may also reduce the ability of birds to hear at both low and high frequencies as compared to most mammals. At the same time, and in spite of its diminutive size, the bird ear is a highly specialized organ capable of supporting very fine auditory discrimination and perception which, in some cases, exceeds the acuity of many mammals, including humans.
Page 19 of 74
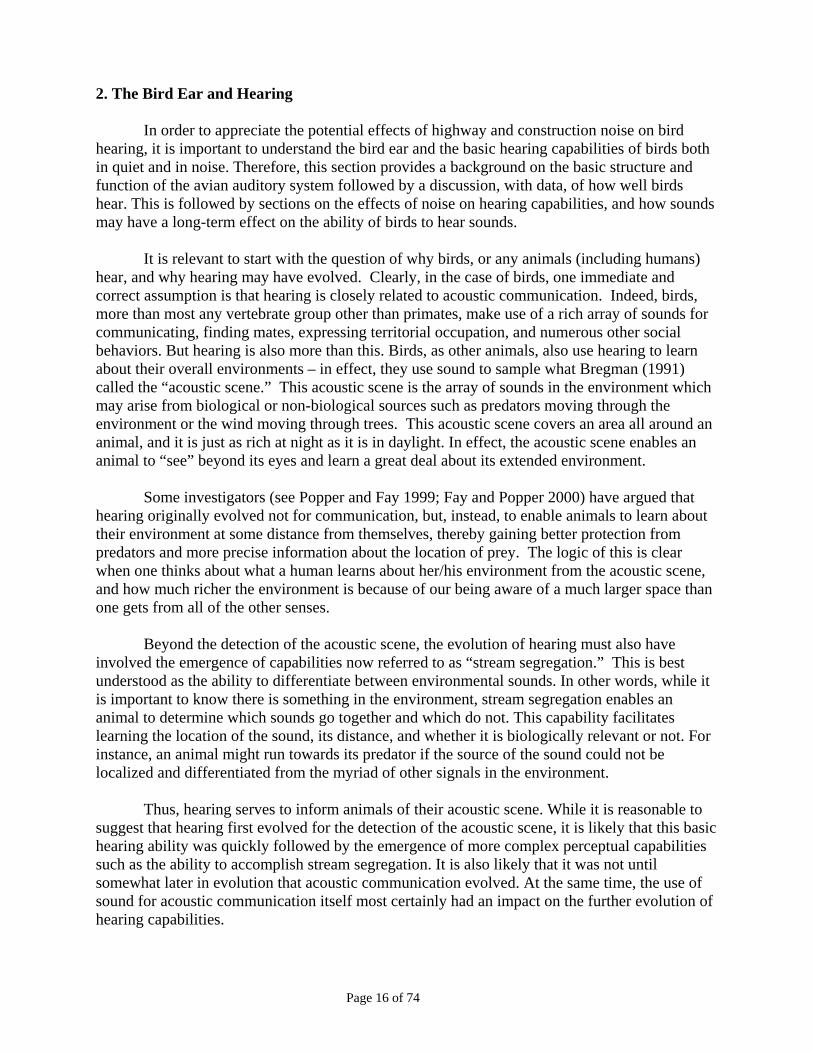
Figure 3: Sensory Hair Cells in the Avian Ear A: Schematic drawing of a sensory hair cell. The cell has a cell body with nucleus and is innervated by a neuron from the 8th cranial (acoustic) nerve (primary afferent nerve). The apical (top) end of each sensory hair cell has a series of cilia that makes up the ciliary bundle. The cilium at the end of the bundle is the kinocilium, while the rest are called stereocilia (or sterovilli). Bending of the ciliary bundle from mechanical (acoustic) disturbance results in opening of channels (“holes”) in the cilia and the entry of calcium ions from the surrounding fluid. This causes a cascade of chemical events within the cell which results in the release of a chemical (neurotransmitter) that stimulates the innervating neuron. Source: http://www.cardiff.ac.uk/biosi/staff/jacob/teaching/sensory/haircell.gif
B: Scanning electron micrograph (colorized) looking down on the top of the basilar papilla (see Fig. 2, right). Each blue area is the top of a single avian sensory hair cell, while the orange structures are the cilia making up the ciliary bundle. The kinocilium is not apparent in all of the ciliary bundles, but it can be differentiated on the right side of the second from right ciliary bundle on the bottom row. Source: http://depts.washington.edu/hearing/images/top1.jpg
B. Physiology of Avian Hearing
Physiological recordings from various points in the ear and brain have long been used as a tool for understanding how the auditory system works in animals and humans, and can be used in animals that cannot, for one reason or another, be “asked” if they can detect sounds.5 Generally, there is a correspondence between these types of physiological measures across species and vertebrate groups.
For example, one measure, the auditory brainstem response (ABR),6 is proving to be
quite useful. This is an electrical potential generated in the earliest stages of the auditory system (8th nerve from the ear to the brain or the parts of the brain closest to the ear) in response to sound stimulation. This potential can be recorded non-invasively (i.e., with electrodes on the
5 Indeed, these kinds of measures, often called the auditory brainstem response, are often used to test whether neonatal humans have normal auditory function shortly after birth. 6 Sometime also referred to as an Auditory Evoked Potential (AEP).

Page 20 of 74
surface of the skin or small pins inserted just under the skin)7 in anesthetized birds (as well as humans and other animals). The size of this potential in birds is directly correlated with the intensity of sound stimulating the ear. This correlation is sufficiently robust in birds so that the ABR, with appropriate adjustments, can be successfully used as an estimate of behavioral hearing threshold including masking (Noirot et al. 2006). The significance of this is that it makes possible the rapid measurement of auditory sensitivity of a bird in natural or field conditions as compared to the months of training and testing required to measure the hearing of birds behaviorally in the laboratory.8 With this procedure, it becomes feasible to measure hearing in those species affected by proposed highway development as part of a comprehensive environmental impact assessment without harming the animal and with less time investment than behavioral studies would require.
C. Behavioral Measures of Avian Hearing – The Audiogram The minimum audible sound pressure that can be detected at frequencies throughout an
animal’s range of hearing defines the audiogram or audibility curve.9 This is the most basic measure of hearing and one most people are familiar with from having their own hearing tested. Over the past 50 years, behavioral audibility curves have been collected for 39 species of birds, and this database can be extended by another 10 species of birds by including data from physiological recordings (Appendix B, page 66). We fit these data with a polynomial function to provide a continuous curve describing the minimum audible sound pressure over the range of hearing for a particular species.
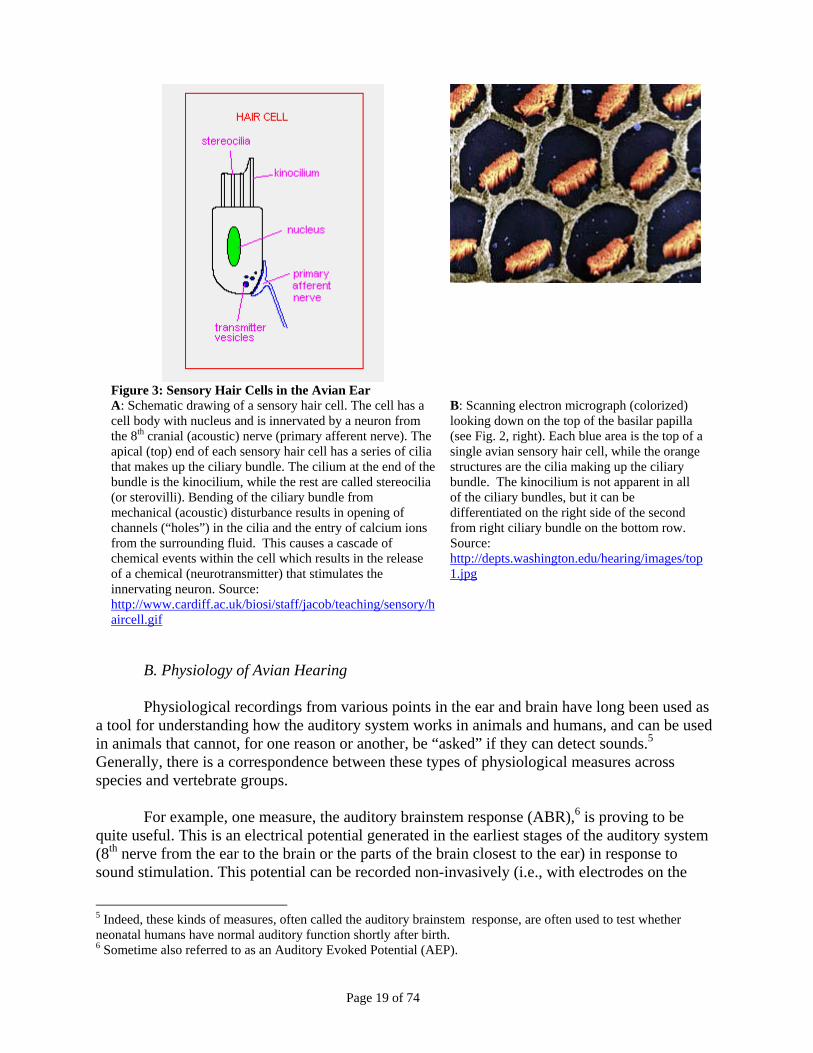
Figure 4 shows the median audiogram based on these species along with the human
audiogram for comparisons. These audiograms are often described and compared on several features such as the softest sound that can be heard (best, or lowest, intensity), the frequency at which hearing is best (best frequency – the frequency at which the subject can hear the lowest possible sound), the bandwidth (the width of the audiogram 30 dB on either side of the frequency), lowest intensity (at the best frequency), and the low and high frequency limits of hearing (the frequencies at which thresholds are 30 dB above the best intensity) for both birds and humans. So, in describing the bird audiogram in Figure 4, the best intensity is about 10 dB SPL, the best frequency is about 2-3 kHz, the low frequency cut-off of hearing is about 300 Hz, the high frequency cut-off is about 6 kHz, and the bandwidth of the bird audiogram is about 5.7 kHz,. By contrast, humans hear sounds as soft as 0 dB SPL around approximately 3 kHz and have a much broader bandwidth of about 16 kHz. Thus, and most people find this surprising, humans hear as well or better than birds over a much wider range of frequencies. The audiogram is typically measured in an audiometric test chamber. Thus the audiogram represents an ideal 7 This results in survival of the animal as opposed to studies where the electrode has to be put into the ear or brain. 8 This does not mean that ABR can replace behavioral testing. Indeed, while the ABR gives a general sense of the hearing range and sensitivity of the bird ear, it does not tell much about how the rest of the brain processes the acoustic signal. In general, there is a great deal of acoustic processing in the brain, and the ultimate hearing capabilities of an animal result from such processing. Behavioral studies allow examination of the complete hearing capabilities of an organism. 9 This is a measure of hearing “threshold.” It should be noted that the threshold (the lowest sound detectable at a given frequency) is not a fixed value. It is not only variable from animal to animal, but it also depends on testing conditions and context. The “threshold” is actually a statistical measure indicating the lowest sound pressure level that an animal can detect some percentage of time. Typically this is 50% correct.
Page 21 of 74
detection threshold that cannot normally be attained in the real world. We will return to this point later in discussions of auditory masking under more natural conditions.
D. Biological Correlates of the Avian Audiogram
Compared to other vertebrate groups, the variation in hearing sensitivity among bird species is not great. A complete list of the common names of the species tested to date is given in Appendix B (page 66). Generally, birds hear best at frequencies between about 1 and 5 kHz, with absolute (best) sensitivity often approaching 0-10 dB SPL at the most sensitive frequency, which is usually in the region of 2–4 kHz (Dooling 1980, 1982, 1992; Dooling et al., 2000). Nocturnal predators, such as most owls, can generally detect much softer sounds than can either Passeriformes (e.g., songbirds such as sparrows, canaries, starlings, finches) or other non-Passeriformes (e.g., chickens, turkeys, pigeons, parrots, owls) over their entire range of hearing, sometimes with levels as low as -10 to -15 dB SPL.
Passeriformes also tend to have better hearing at high frequencies than non-
Passeriformes, while non-Passeriformes can detect softer signals at low frequencies than do Passeriformes. This difference is usually on the order of 5 to 10 dB SPL. A recent correlative study of hearing characteristics (using the database in Appendix B) with several biological parameters confirms significant correlations among body weight, inner ear anatomy, and low- and high-frequency hearing in birds, with the exception of owls (Gleich et al. 2005). Simply put, large birds hear better at low frequencies and small birds hear better at high frequencies. On average, however, the frequency range available to the typical bird for long distance vocal communication extends, at best, from about 0.5 to about 6.0 kHz (the frequency range or bandwidth 30 dB above the most sensitive region of the audiogram).
Figure 4: Bird Hearing Thresholds Median bird hearing thresholds from 49 bird species measured behaviorally and physiologically in the quiet in the free field (solid line) compared to the human (dashed line). The typical bird hears less well than humans and over a narrower bandwidth.
Frequency (kHz)0.1 0.3 0.6 1 2 4 6 10 30
Abso
lute
thre
shol
d (d
B SP
L)
-20
0
20
40
60
80
100MEDIAN BIRDHuman

Page 22 of 74
E. The Hearing Range and Vocalization Spectrum of Birds
Almost all avian species rely heavily on acoustic communication for species and
individual recognition, mate selection, territorial defense, and other social activities. Students of bird hearing have long recognized that there is a strong correlation between the range of hearing in birds and the frequency spectrum of bird vocalizations (Konishi 1969; Dooling 1980, 1982). That is, with the exception of some nocturnal predators, birds hear best in the spectral region of their species-specific vocalizations. This is an important observation. It highlights the fact that considerations of the masking or hearing damage effects of noise on acoustic communication in birds should focus attention on the critical frequency region of about 1-6 kHz (Dooling 1982).
F. The Hearing Capabilities of Nestlings
A limited amount of data from songbirds and parrots suggest that the auditory system of
altricial birds (i.e., birds that develop in the nest10) is not functioning well at hatching. ABR studies of budgerigars and canaries indicates that hearing thresholds during the first two weeks of hatching are 30-40 dB higher than hearing thresholds of adults. This suggests they are even less sensitive to damage from acoustic overexposure than adults. By the time nestlings are 20-30 days old and just getting ready to leave the nest, however, hearing thresholds as measured by the ABR approach adult levels of sensitivity (Brittan-Powell et al. 2004). Masked thresholds have not been measured in nestlings, but since this is also a critical stage in vocal development, masking by highway noise at this stage in development could have serious effects on a bird’s ability to acquire and develop its species-typical vocalizations.
10 Altricial birds include all Passeriformes (song birds). Altricial birds hatch with their eyes closed and with few, if any, feathers. In contract, precocial birds hatch with eyes open and are generally ready to leave the nest within two days of hatching – see: http://www.stanford.edu/group/stanfordbirds/text/essays/Precocial_and_Altricial.html

Page 23 of 74
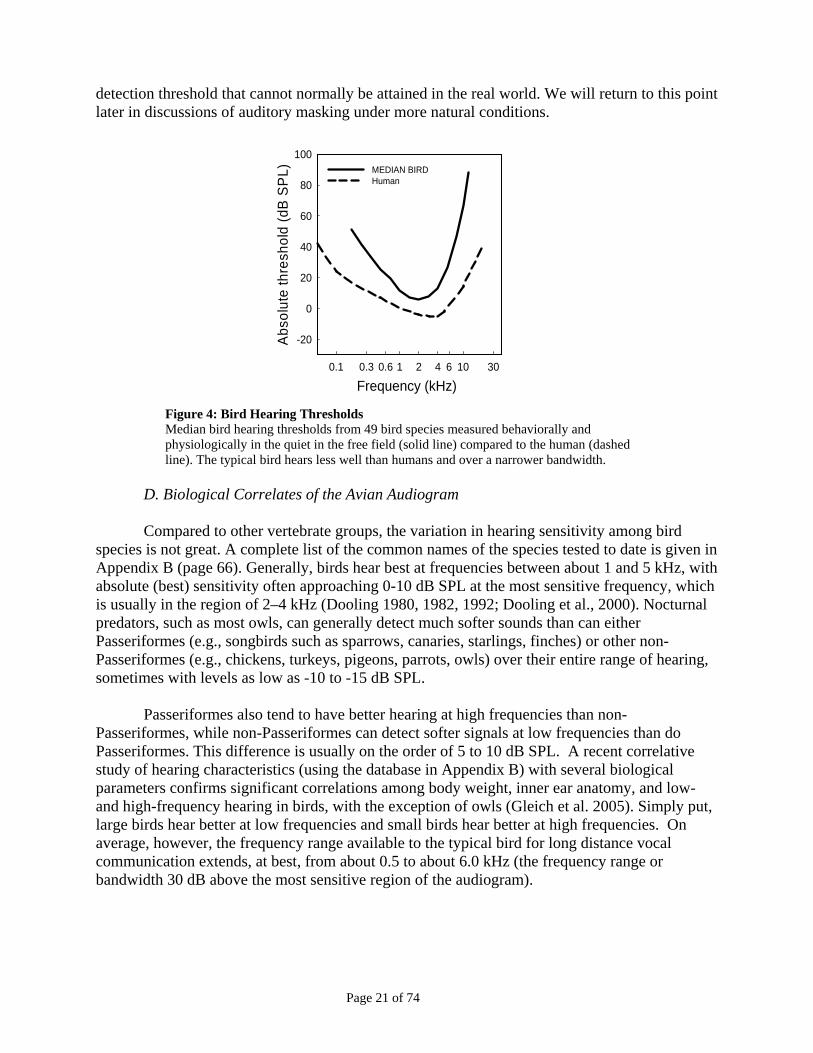
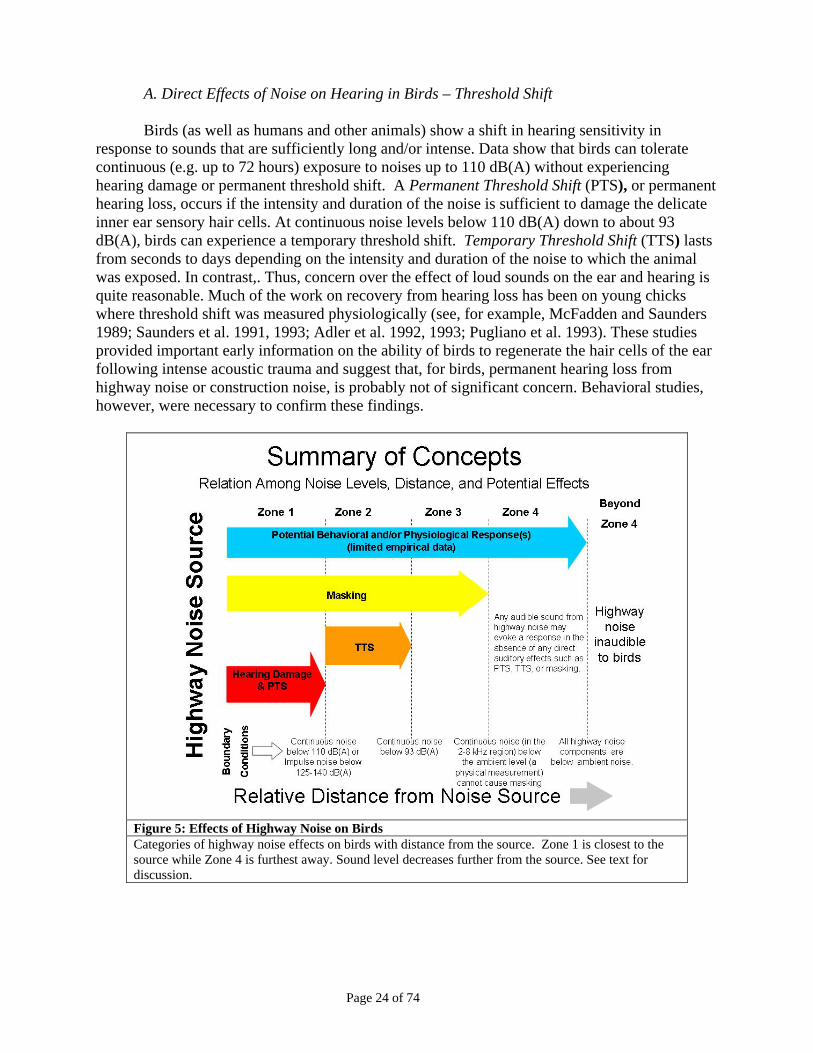
3. General Principles of the Effects of Noise on Birds There are three general overlapping categories of highway noise effects on birds: hearing damage and temporary threshold shift, masking, and other physiological and behavioral responses. In the case of direct auditory effects, the specific category depends primarily on the level of noise exposure which is highly correlated with the proximity of the bird(s) to the noise source (Fig. 5 [page 24], Table 3 [page 25]).The existing scientific literature provides solid guidelines for defining the boundaries between these categories of effects.
a. Zone 1: If a bird is in this region, traffic noise and construction noise can potentially result in hearing loss, threshold shift, masking, and/or other behavioral and/or physiological effects. Laboratory evidence shows that continuous noise levels above 110 dB(A) SPL or a single blast noise over 140 dB SPL (125 dB SPL for multiple blasts) will likely result in damage.
b. Zone 2: At greater distances from the highway, starting where the noise levels fall
below 110 dB(A) continuous exposure, hearing loss and permanent threshold shift are unlikely to occur. However, highway noise above 93 dB(A) SPL might still temporarily elevated a bird’s threshold, mask important communication signals, and possibly lead to other behavioral and/or physiological effects.
c. Zone 3: At even greater distances from the highway, but where the spectrum level of the
highway noise is still at or above the natural ambient noise level, masking of communication signals from highway noise will occur beyond that which already occurs from natural ambient noise. This in turn may also result in other behavioral and/or physiological effects.
d. Zone 4: Once the level of highway noise falls below ambient noise levels in the critical
frequencies for communication, masking of communication signals is no longer an issue. However, faintly heard sounds falling outside the region of bird vocalizations, such as the low rumble of a truck, may still potentially cause other behavioral and/or physiological effects.
e. Beyond Zone 4: At this boundary, the energy in traffic noise and construction noise at all
frequencies is completely inaudible (i.e., falls below the bird’s masked threshold) to the bird and has no effects of any kind on the bird.
Before considering the direct effects on the auditory system of birds from highway noise,
it is important to understand three facts about behavioral and physiological effects of highway noise. One is that these effects can occur alone or in combination with direct effects of highway noise on the auditory system of birds. Second, these effects may be less dependent on noise level and more dependent on the salience of the highway noise component(s) to the bird. Third, in comparison with the direct effects of noise on the bird auditory system, there are very few empirical data available on these effects, and especially those that occur alone as in Zone 4.
Page 24 of 74
A. Direct Effects of Noise on Hearing in Birds – Threshold Shift
Birds (as well as humans and other animals) show a shift in hearing sensitivity in response to sounds that are sufficiently long and/or intense. Data show that birds can tolerate continuous (e.g. up to 72 hours) exposure to noises up to 110 dB(A) without experiencing hearing damage or permanent threshold shift. A Permanent Threshold Shift (PTS), or permanent hearing loss, occurs if the intensity and duration of the noise is sufficient to damage the delicate inner ear sensory hair cells. At continuous noise levels below 110 dB(A) down to about 93 dB(A), birds can experience a temporary threshold shift. Temporary Threshold Shift (TTS) lasts from seconds to days depending on the intensity and duration of the noise to which the animal was exposed. In contrast,. Thus, concern over the effect of loud sounds on the ear and hearing is quite reasonable. Much of the work on recovery from hearing loss has been on young chicks where threshold shift was measured physiologically (see, for example, McFadden and Saunders 1989; Saunders et al. 1991, 1993; Adler et al. 1992, 1993; Pugliano et al. 1993). These studies provided important early information on the ability of birds to regenerate the hair cells of the ear following intense acoustic trauma and suggest that, for birds, permanent hearing loss from highway noise or construction noise, is probably not of significant concern. Behavioral studies, however, were necessary to confirm these findings.
Figure 5: Effects of Highway Noise on Birds Categories of highway noise effects on birds with distance from the source. Zone 1 is closest to the source while Zone 4 is furthest away. Sound level decreases further from the source. See text for discussion.
Page 25 of 74
Table 3: Recommended Interim Guidelines for Potential Effects from Different Noise Sources
Noise Source Type Hearing Damage TTS Masking Potential Behavioral/
Physiological Effects Single Impulse (e.g., blast) 140 dB(A)1 NA3 NA7
Multiple Impulse (e.g., jackhammer, pile driver) 125 dB(A)1 NA3 ambient dB(A)5
Non-Strike Continuous (e.g., construction noise) None2 93 dB(A)4 ambient dB(A)5
Highway Noise None2 93 dB(A)4 ambient dB(A)5
Alarms (97 dB/100 ft) None2 NA2 NA6
Any audible component of highway noise has the
potential of causing behavioral and/or
physiological effects independent of any direct
effects on the auditory system of PTS, TTS, or
masking 1 Estimates based on bird data from Hashino et al.1988 and other impulse noise exposure studies in small
mammals. 2 Noise levels from these sources do not reach levels capable of causing auditory damage and/or permanent
threshold shift based on empirical data on hearing loss in birds from the laboratory. 3 No data available on TTS in birds caused by impulse noises. 4 Estimates based on study of TTS by continuous noise in the budgerigar and similar studies in small
mammals. 5 Conservative estimate based on addition of two uncorrelated noises. Above ambient noise levels, critical
ratio data from 14 bird species, well documented short term behavioral adaptation strategies, and a background of ambient noise typical of a quiet suburban area would suggest noise guidelines in the range of 50—60 dB(A).
6 Alarms are non-continuous and therefore unlikely to cause masking effects. 7 Cannot have masking to a single impulse.
Permanent Threshold Shift in Birds: Permanent threshold shift is accompanied by death
of some, but not necessarily all, hair cells in a specific location on the basilar papilla. The specific damage depends on the type, intensity, and duration of the acoustic trauma (reviewed in Cotanche 1999). Since hearing depends on the function of these hair cells, their permanent loss results in permanent hearing loss in mammals. However, since birds can regenerate damaged or destroyed sensory hair cells, hearing recovers almost completely.
Quail (Coturnix coturnix) exposed to a 1.5 kHz octave band noise at 116 dB SPL for four hours showed hearing loss of up to 50 dB immediately following exposure (Niemiec et al. 1994). Hearing loss was most severe at frequencies at and above 1.0 kHz, although there was considerable variation between subjects. Hearing loss was accompanied by a significant loss of sensory hair cells in the basilar papilla.
However, hearing improved rapidly within the first week following exposure, and
recovered to pre-exposure levels by 8-10 days. Damaged hair cells were observed up to two weeks post exposure, but there was little evidence of damage to hair cells at five weeks post-exposure. Similar patterns of threshold shifts and recoveries were seen after repeated exposures to noise, although recovery times increased with increasing exposure duration. Interestingly, the authors found there can be a return to normal sensitivity prior to complete regeneration of the sensory hair cells (Neimiec et al. 1994).
Ryals and colleagues (1999) addressed species differences and found that the amount of hearing loss and the time course of recovery varied considerably among different bird species even with identical exposure conditions and test conditions. In one study, quail and budgerigars were exposed to pure tones of 112-118 dB SPL for 12 hours, with the frequency of the sounds
Page 26 of 74
centered in the region of best hearing of each species. Quail showed much greater susceptibility to acoustic trauma than did budgerigars, and showed significantly larger threshold shifts and hair cell loss. Quail showed a threshold shift of 70 dB at 2.86 kHz at one day following over-exposure and this hearing loss remained virtually unchanged for 8-9 days post-exposure. Hearing then began to improve by about 1 dB/day until recovery day 50, at which time recovery reached asymptote. This left the quail with a permanent threshold shift of approximately 20 dB which remained even one year following exposure. In contrast, budgerigars showed a threshold shift of about 35-40 dB and a much faster recovery than quail. By three days post-exposure, budgerigars’ thresholds had improved to within 10 dB of normal.
Another experiment in this study exposed budgerigars, canaries (Serinus canaria), and
zebra finches (Taeniopygia guttata) to the same bandpass noise (2-6 kHz) at 120 dB(A) SPL for 24 hours and confirmed the existence of species differences in susceptibility to noise. Thresholds at 1.0 kHz were initially elevated by 10-30 dB but improved to within normal limits by about 10 days post-exposure in all three species. Moreover, at 2.86 kHz, the center of the exposure band, budgerigars, canaries, and zebra finches all showed a 50 dB threshold shift. Recovery began immediately after the noise was terminated for canaries, while zebra finches recovered to within 10 dB of normal by about 30 days post-exposure. However, in budgerigars, thresholds remained elevated for 10 days before recovery begin to occur. By 50 days post-exposure, thresholds recovered to about 20 dB above normal. Thus, in this experiment, there was significantly more rapid recovery in canaries and zebra finches than in budgerigars.
These studies by Ryals and her colleagues (Ryals et al. 1985, 1999) are critically important for discussions of the effect of intense noise on hearing in birds. This is the only comparative study that tested different species of birds under identical noise exposure and test conditions and it led to two important conclusions. One is that birds are highly resistant to hearing damage from noise. The other conclusion is that there is considerable variation among species in the amount of damage and the time-course of loss and recovery from acoustic trauma, and that these differences cannot be predicted from a species’ appearance, behavior, or life style. Moreover, these differences can only be due to species differences in the susceptibility to damage by acoustic overexposure and not from any other experimental variables since, in many instances, all species were all tested in the same apparatus using the same procedures.
Temporary Threshold Shift in Birds: The first work on temporary threshold shifts in adult
birds measured behaviorally following acoustic overexposure is still the most complete in the literature. Budgerigars (Melopsittacus undulatus) exposed to a narrow band of noise centered at 2 kHz for 72 hours at levels of 76 to 106 dB SPL showed maximum hearing losses at 2 kHz with a temporary threshold shift ranging from 10 to 40 dB depending on the level of the noise to which the birds were exposed (Saunders and Dooling 1974; Dooling 1980) (Fig. 6). Importantly, a permanent threshold shift was observed only with the 106 dB exposure, indicating that birds, compared to mammals, are much more resistant to damage from noise (Dooling 1980). A 72-hour continuous exposure to a narrowband of noise at 106 dB would result in severe and permanent hearing loss in humans due to death of the sensory cells of the inner ear. Temporary threshold shifts in these birds also lasted less time than typically seen in mammals and were also restricted to a narrower range of frequencies (e.g., Luz and Hodge 1971; Price 1979; Dooling 1980; Henderson and Hamernik 1986). The maximum threshold shift in budgerigars occurred at
Page 27 of 74
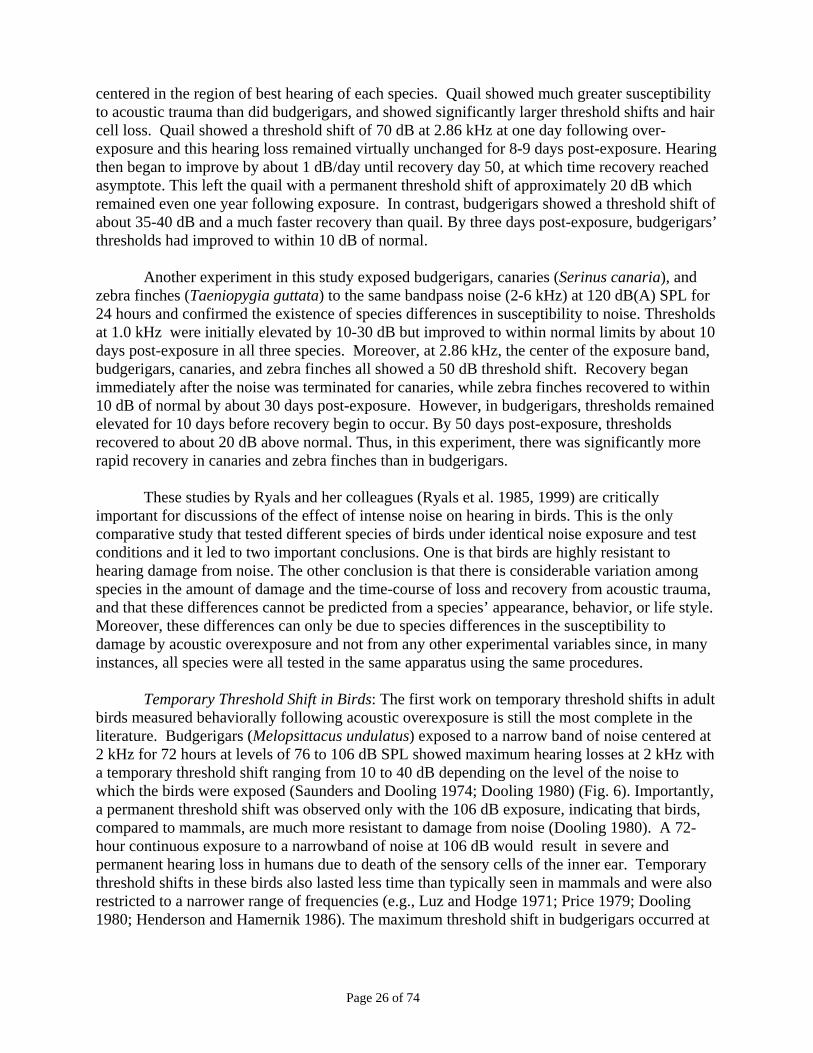
the exposure frequency (rather than at higher frequencies in mammals) and showed much less spread of threshold shift to other frequencies.
Finally, all the experiments described above were conducted with continuous noise, much
as would be expected with dense highway traffic or non-strike continuous construction noise (Table 1, Figure 1). Impulse noises, such as those produced by single pieces of highway construction equipment, are short, intermittent, and high intensity (Table 2). There is much less known about the effects of high level impulse sounds, such as from construction equipment, on avian hearing. There is a single report in the literature that exposed budgerigars to four 169 dB SPL impulses produced by pistol shots in close proximity (20 cm) to the bird. In contrast to continuous noise exposure, this exposure initially caused more low frequency (~60 dB) than high frequency (~40 dB) hearing loss (Hashino et al. 1988). Even from this extremely intense exposure, however, thresholds at 1 and 4 kHz (the frequency where budgerigars sing and hear best) returned to almost normal within 20 days following the exposure. At 500 Hz, there remained a permanent threshold shift of about 20 dB even 40 days after exposure. These results confirm that birds are resistant to permanent auditory damage and hearing loss from noise exposure, even following extraordinarily intense impulse noise exposures.
B. Masking and the characteristics of noise
Masking is the interference with the detection of one (biologically relevant) sound by
another. For a common example, two people in a room by themselves talking at a comfortable
Thre
shol
d S
hift
(at 2
.0 k
Hz)
0
10
20
30
40
50
76 dB86 dB96 dB106 dB
GROWTH OF TTS DECAY OF TTS
41 dB
25 dB
21 dB
14 dB
Noise exposure
Time in noise (minutes)
Minutes Hours Days
Time after noise (minutes)
30 K
Minutes
22 10 30 1 4 12 1 4
Hours Days
4 10 30 1 4 12 1 4
Weeks
103 5 10030 50 1 K300 500 10 K3 K 5 K 105 10030 50 1 K300 500 10 K3 K 5 K
Figure 6: Threshold Shift in Birds Exposed to Noise The growth and decay of threshold shift in four budgerigars exposed to four different levels of a 1/3rd octave band of noise for 72 hours. Threshold shift reaches an asymptote after 12-24 hours regardless of the exposure level. Exposure to a 76 dB noise results in a threshold shift of 14 dB which recovers within a few hours following the termination of the noise. Exposure to a 106 dB noise, however, leads to longer recovery time and a permanent threshold due to damage to the inner ear.
Page 28 of 74
level can easily hear one another. If they are having the same conversation in a room with 50 other people, it is much harder for them to hear one another. Masking can also occur from other kinds of noises than a group of humans talking.
More specifically, masking refers to the increase in thresholds for detection or
discrimination of sounds in the presence of another sound. The simplest kind of masking experiment is to measure the sound detection thresholds for pure tones in the presence of a broadband noise (see Glossary, page 63). The noise in such an experiment is usually described in terms of a spectrum level (i.e., sound energy per Hertz) rather than the overall sound pressure level. The signal level in the case of a pure tone is, of course, simply the level of the tone in dB. The ratio of the level of the tone to the spectrum level of the noise is called the critical ratio or the signal-to-noise ratio. At threshold for the pure tone, the critical ratio (or signal-to-noise ratio) is a measure of the amount of masking provided by the masker. Experiments on masking demonstrate that at low levels, it is the noise in the frequency region of a signal that is most important in masking the signal—not noise at more distant frequency regions (Dooling et al. 2000).
For example, a typical simple masking experiment will have a pure tone and a masker,
usually a noise. The investigator first determines the lowest sound level (or absolute threshold) for the pure tone in a quiet environment. The masker is then presented and the threshold for the pure tone is again determined. If the masker has energy in the same frequency band as the pure tone, the threshold for the tone is elevated. If, however, the masker energy is not in the same frequency range as the pure tone, there may be no change in threshold for the pure tone.11 This is an important point we will return to below. Common sense tells us that acoustic communication can be severely constrained if background noise is of a sufficient level.12 Such noise decreases signal-to-noise-ratios and therefore limits the active space (the combination of sound frequencies and levels that are audible) of a sound. In effect, background noise makes it harder for an animal (or human) to hear sounds that may be biologically relevant. Thus, only the most intense biologically relevant sounds, usually those closer to the animal, may be detected in a noisy environment.
Aside from the masking case described above, it has been extraordinarily difficult to
come up with a broad definition of noise because of extreme variations in both the physical properties of noise and the perceptual preferences of listeners.13 For humans, perhaps the broadest, and therefore most accurate definition, is that noise is simply unwanted sound. While useful for human listeners, this definition is not useful in animal work. What is noise for an animal must be determined by how it affects an animal’s normal behavior.
Noises can be continuous or intermittent, broadband or narrowband, or predictable or
unpredictable in time or space. These noise characteristics determine the strategies that birds might employ to minimize the effect of noise on acoustic communication. Most laboratory
11 The amount of masking depends primarily on the amount of energy in the masker in the frequency region surrounding the pure tone. This band of frequencies around the pure tone in which masking will still occur is called the “critical band.” 12 The exact level depends on many factors, including masker level and the hearing sensitivity of the species of concern. 13 What is “noise” to one listener may be music to another, and vice versa.

Page 29 of 74
experimental approaches estimating the effects of noise on signal detection use continuous noises with precisely defined bandwidths, intensities, and spectral shapes. Fortunately, traffic noise on heavily traveled roads can approximate these features (e.g., relatively continuous, relatively constant spectrum and intensity), thus providing increased validity in moving from laboratory results based on continuous noises to the field predictions of behaviors affected by noise such as communication distance.
C. Direct Effects of Noise on Hearing by Birds – Critical Masking Ratios The ratio between the power in a pure tone at threshold and the power per Hertz (the
spectrum level) of the background noise is called the critical ratio. The masking principles discussed above which govern the critical ratio are shown schematically in Figure 7. The critical ratio (left panel) is defined as the sound pressure level of a tone (when it is just masked) minus the spectrum level of the noise. In this case, the spectrum level of the noise is 40 dB SPL and the level of a 3 kHz pure tone that can just be heard is 60 dB SPL resulting in a critical ratio of 20 dB. Since it is noise in the spectral region of the tone that contributes most to the masking of the tone, measuring overall noise level over a very wide band of frequencies is not very useful unless the noise is flat. A flat noise with a spectrum level of 40 dB would result in an overall noise level of about 80 dB(A) when measured across the whole band of noise. Of course, the level of noise falling in the octave band from 2-4 kHz and 4-8 kHz would be considerably less – 73 dB and 76 dB respectively. Since, highway noise has most of its energy at low frequencies (the spectrum slopes downward from low to high frequencies), measuring overall noise level (the dB(A) measure) will overestimate how much energy there is in the region of 2-4 kHz and therefore how much masking of bird vocalizations will occur.
Figure 7: Avian critical ratios (left) Schematic representation of the critical ratio. A 60 dB tone at 3 kHz is just masked by a broad band noise with a spectrum level of 40 dB. The critical ratio is defined as the level of the tone minus the spectrum level of the noise. (Right) The relationship for overall sound pressure level, spectrum level, and octave band levels between 2 and 8 kHz for a flat broad band noise. The overall level of noise of 80 dB(A) is greater than the amount of noise falling in the octave band of 2-4 kHz (73 dB) and 4-8 kHz (76 dB). Much of the energy in highway noise falls in lower frequencies, while bird vocalizations fall in higher frequencies. Measuring in the region of bird vocalizations is critical to understanding whether masking occurs because it only noise in this region contributes to the masking.
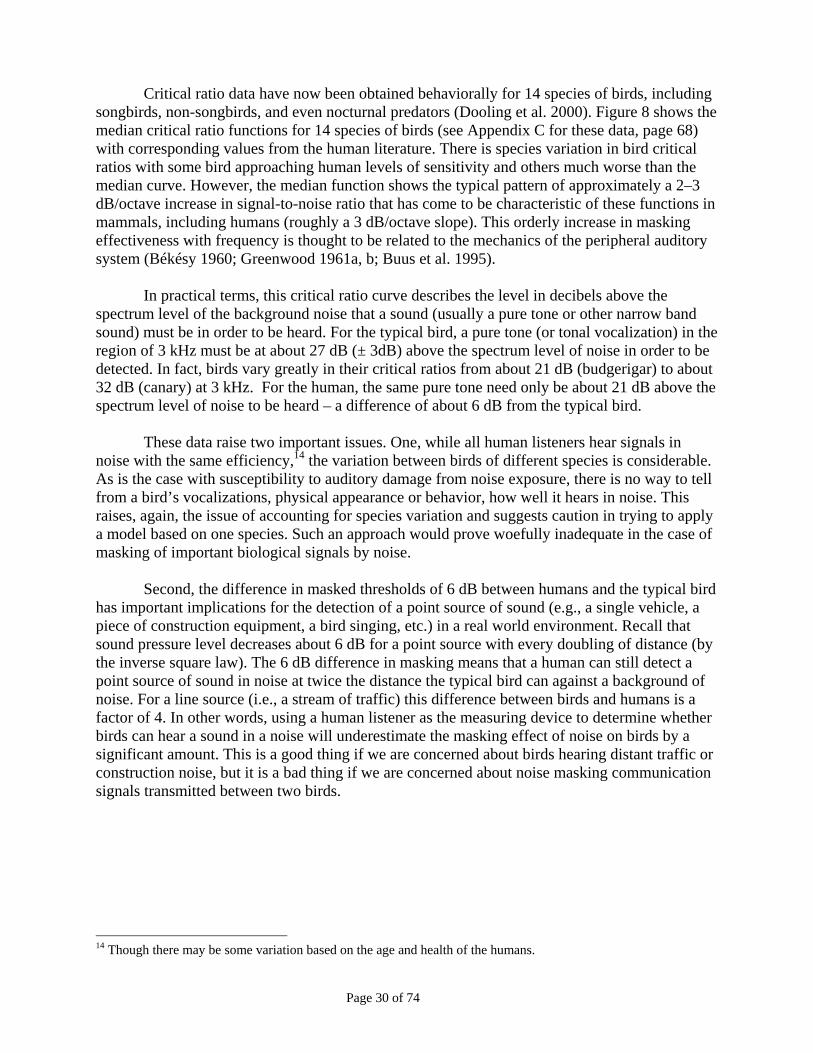
Page 30 of 74
Critical ratio data have now been obtained behaviorally for 14 species of birds, including songbirds, non-songbirds, and even nocturnal predators (Dooling et al. 2000). Figure 8 shows the median critical ratio functions for 14 species of birds (see Appendix C for these data, page 68) with corresponding values from the human literature. There is species variation in bird critical ratios with some bird approaching human levels of sensitivity and others much worse than the median curve. However, the median function shows the typical pattern of approximately a 2–3 dB/octave increase in signal-to-noise ratio that has come to be characteristic of these functions in mammals, including humans (roughly a 3 dB/octave slope). This orderly increase in masking effectiveness with frequency is thought to be related to the mechanics of the peripheral auditory system (Békésy 1960; Greenwood 1961a, b; Buus et al. 1995).
In practical terms, this critical ratio curve describes the level in decibels above the
spectrum level of the background noise that a sound (usually a pure tone or other narrow band sound) must be in order to be heard. For the typical bird, a pure tone (or tonal vocalization) in the region of 3 kHz must be at about 27 dB (± 3dB) above the spectrum level of noise in order to be detected. In fact, birds vary greatly in their critical ratios from about 21 dB (budgerigar) to about 32 dB (canary) at 3 kHz. For the human, the same pure tone need only be about 21 dB above the spectrum level of noise to be heard – a difference of about 6 dB from the typical bird.
These data raise two important issues. One, while all human listeners hear signals in noise with the same efficiency,14 the variation between birds of different species is considerable. As is the case with susceptibility to auditory damage from noise exposure, there is no way to tell from a bird’s vocalizations, physical appearance or behavior, how well it hears in noise. This raises, again, the issue of accounting for species variation and suggests caution in trying to apply a model based on one species. Such an approach would prove woefully inadequate in the case of masking of important biological signals by noise.
Second, the difference in masked thresholds of 6 dB between humans and the typical bird
has important implications for the detection of a point source of sound (e.g., a single vehicle, a piece of construction equipment, a bird singing, etc.) in a real world environment. Recall that sound pressure level decreases about 6 dB for a point source with every doubling of distance (by the inverse square law). The 6 dB difference in masking means that a human can still detect a point source of sound in noise at twice the distance the typical bird can against a background of noise. For a line source (i.e., a stream of traffic) this difference between birds and humans is a factor of 4. In other words, using a human listener as the measuring device to determine whether birds can hear a sound in a noise will underestimate the masking effect of noise on birds by a significant amount. This is a good thing if we are concerned about birds hearing distant traffic or construction noise, but it is a bad thing if we are concerned about noise masking communication signals transmitted between two birds.
14 Though there may be some variation based on the age and health of the humans.

Page 31 of 74
Figure 8: Critical Ratios in Birds and Humans Median critical ratios for 14 birds (solid line) and the human (dashed line). Dotted line is a slope of 3 dB/octave. The critical ratio (s/n ratio) at threshold is about 6 dB greater in the typical bird compared to humans over the frequency range of 1-5 kHz.
D. Understanding Basic Facts about Masking and Hearing in Noise The audiogram represents the lowest sound pressure level (in dB) of pure tones
throughout the range of hearing that can be detected in a quiet background of a test booth (see Fig. 4). Typically, this curve describes the sound pressure level that can be detected 50% of the time. The shape of the audiogram is unique to hearing tested in the quiet background of an audiometric test booth. It does not represent hearing in noise, and since all hearing in the real world is hearing in noise, it is useless for estimating what a bird can hear in the real world. In other words, in all environments, other than a quiet background of a test booth, ambient noise in the background determines what can be heard (i.e., the shape of the audiogram). The critical ratio (Fig. 9) provides the metric for estimating the effect of noise on the audiogram because it shows the level (in dB) that a pure tone must be above the spectrum level of noise in order to be heard.
These two concepts together can provide an estimate of the effect a particular continuous
noise on the hearing of the typical bird. The simplest case is if the noise is flat (energy equally distributed) over a broad range of frequencies (e.g., 0-10 kHz). Figure 9 (page 32) shows the effect of masking by various levels of flat, broadband, background noise on the typical avian audiogram. In the case of flat broadband noise from 0-10 kHz, the spectrum level in dB at any frequency is about 40 dB less than the overall level of the noise in dB SPL. As noise levels increase, the most sensitive regions of the audiogram are affected first. As the noise levels continue to increase, higher frequency regions are affected more than lower frequency regions (because the bandwidths of the auditory system are progressively wider as frequency increases).
Page 32 of 74
Noise level in the plot in Figure 9 is shown both as a spectrum level (the per Hertz
distribution of energy – the right column of numbers) and the overall noise level, which
Figure 9: Relation Between Overall Noise, Spectrum Level, and Hearing Thresholds The effect of broadband noise of different levels on bird auditory thresholds. The solid line shows the auditory thresholds (audiogram) in the quiet. The dashed lines above the audiogram show elevated thresholds in the presence of different levels of broadband noise. These levels of noise are shown with the thin flat dashed lines in the lower half of the figure both as overall dB(A) levels (left) and spectrum level of the same noise (right). Note that for a flat broadband spectrum, the overall sound level is always about 40 dB greater than spectrum level. For example, if the noise is flat from 0-10 kHz, an overall background noise level of 20 dB (left column) is equivalent to a spectrum level of -20 dB (right column). This level of noise would have no masking effect on tone thresholds and the audiogram looks like it does in quiet (solid line). Higher background noise levels, however, raise the thresholds for detecting tones of frequencies in the center of the audiogram (around 2-4 kHz). Thus, in the presence of a noise of a spectrum level of about -5 to 0 dB around 2-4 kHz (typical of a quiet rural area), hearing thresholds for pure tones are raised to 0-15 dB depending on frequency (0 dB dashed line). In the presence of a noise of a spectrum level of 5-10 dB in the region of 2-4 kHz (typical of a quiet suburban area), hearing thresholds are raised 0-25 dB (10 dB dashed line). Unlike the flat noise shown above, traffic noise has a sloping spectrum with more energy at low frequencies than in the critical frequencies of 2 – 8 kHz containing most bird song. Thus, the difference between overall noise levels and spectrum levels at 2-4 kHz will be greater than the differences illustrated above for flat spectrum noise.

Page 33 of 74
integrates (sums) the energy across all frequencies (the left column of numbers). The overall sound pressure level, given in dB SPL, is the value obtained from the typical sound level meter which sums all the energy between the frequencies of about 100 Hz to 10 kHz – a bandwidth of about 10 kHz. The A weighting is selectively biased against frequencies below 1000 Hz and above 10 kHz in a manner approximately equal to the sensitivity of the human ear at low sound pressure levels. Thus, the relation between overall level in dB(A) and spectrum level would be approximate in Figure 9. To put these sound pressure levels in perspective, overall noise levels in the range of 10-20 dB(A) are what one would find inside a broadcast studio, 20-30 dB(A) in a quiet bedroom in the evening, 40-45 dB(A) outdoors in a quiet rural area, and 50-55 dB(A) outdoors in a quiet suburban area (Ouis 2001). The spectrum of natural ambient noise is not likely to be flat, so the conversion from overall sound pressure level in dB(A) to a spectrum level is also only approximate. Nevertheless, Figure 9 clearly shows that except for lowest ambient noise levels (i.e., typical of a broadcast booth or a quiet bedroom at night), there is always some effect of background noise on hearing in a natural environment as compared to when the audiogram is measured in a quiet acoustic test booth.
E. The Origin of the 60 dB(A) Level for Estimating the Effects of Traffic Noise and Masking on Avian Vocal Communication
The informal, but well known, 60 dB(A) noise level for evaluating the effects of noise on
avian acoustic communication was based on the facts and reasoning presented above. The question posed was this: At what noise level, above that of a quiet natural environment, could one begin to see effects of highway noise on avian vocal communication? A quiet, natural environment was taken to be an overall sound pressure level of approximately 45-55 dB(A) - typical of a quiet rural to suburban area. From Figure 9, it can be seen that a bird will already be experiencing considerable masking (e.g., 20-25 dB) in its region of best hearing from such a level of environmental noise. The spectrum level in the region of 2-4 kHz (for a 40-50 dB(A) ambient noise) is already about 0-10 dB which significantly elevates the thresholds that one could obtain in a quiet test booth (see dotted lines of 0 and +10 in the audiogram). In other words, masking is always occurring in natural environments.
So, how much highway noise causes an increase the bird’s thresholds above what it
already experiences in a quiet suburban area15? The answer depends on the level of ambient noise. Once highway noise reaches the level of ambient noise in the natural environment, additional masking of bioacoustic signals, including bird vocalizations, can occur. Most energy in traffic noise is below about 1 kHz, with the spectrum sloping downward above 1 kHz. Traffic noise of an overall level of 60 dB(A) SPL will have a spectrum level of noise around 3 kHz of perhaps 10 dB SPL – roughly equivalent to the spectrum level of noise at 3 kHz in a quiet suburban area. It is this rationale, based on masking data from the laboratory and estimates of traffic noise spectra, that an overall traffic noise level of about 60 dB(A) would begin to affect a bird’s behavior (i.e., would increase a bird’s masked threshold above that experienced by noise levels found in a typical rural to suburban areas). One can easily see that this value of 60 dB(A) is entirely dependent on the existing natural ambient noise levels. 15 One would adopt a lower guideline for a quiet rural area and a higher noise guideline for a noisy urban area where ambient noise levels might reach 70 dB(A). In other words, decisions by regulators must take into account the existing ambient noise levels in the region where the highway is being constructed and operated.
Page 34 of 74
The 60 dB(A) noise guideline as an absolute value was a good starting point, but new data, based on a number of findings, suggest that it is now outdated. One reason for new caution is that 60 dB(A) was based on detection thresholds (i.e., critical ratios) from only a few birds. And we now have data from many more birds and there is now evidence that birds require even better signal-to-noise ratios to discriminate and to recognize sounds – in other words to communicate effectively. Since communication – not just detection of a sound - is the animal’s goal, arguing for a lower noise level guideline of 55 dB(A) is probably safer and more realistic. On the other hand, 60 dB(A) can be viewed as quite conservative since it is based on continuous noise in a controlled, artificial (i.e., laboratory) setting – a situation that is unlikely to occur in the real world.
The 60 dB(A) level should also be reconsidered because it does not take into account any
of the newly documented strategies a freely moving bird in its natural environment is highly likely to employ to communicate in noise . Indeed, these are strategies that we now know birds, as well as humans and other animals, routinely use. These strategies including scanning the environment by turning the head, changing height or location, raising voice level, and timing vocal communication when there is non-continuous noise.16 Each of these factors alone can enhance communication in noise by as much as 10-15 dB (see below). This translates into well over a hundred meters in terms of transmission distance. Together, the combined effect of these strategies could be significant in reducing the effects of noise on acoustic communication in a natural environment. Since the typical bird normally experiences masking from ambient noise in its environment, how much traffic noise is a problem in any environment? The answer is complex and depends on the level of ambient noise, the species’ communication lifestyle and its critical ratio. It is unlikely that a traffic noise level below an overall level of about 50-60 dB(A) would have much of an effect on acoustic communication or the biology of a bird in a quiet suburban area. An overall level of 60 dB(A) from traffic noise is already close to what is likely present in the region of 2-4 kHz from ambient noise alone if a quiet suburban area is taken as the standard.
16 Similar strategies are used by humans to detect speech a noisy room.
Page 35 of 74
4. Effects of Highway Noise on Birds A. Overview
This review has been challenging in several ways. It is one thing to review the array of literature available on the effect of highway noise on birds, and quite another to find an effective way to evaluate information from very diverse perspectives to arrive at a useful predictive tool. One serious challenge in doing a review on this topic is the considerable unevenness in the quality of the available literature. Another challenge is separating the effects of noise on birds from the effects of other variables (usually visual, but possibly chemical) that are correlated with the noise (i.e., the motion of vehicles along a highway). A third challenge is applying findings from well-controlled laboratory studies on noise exposure to birds behaving in their natural environments.
B. Effects of Non-Highway Noise on Birds
Studies and reviews of the effects of highway noise are often included in a broader
literature on the effects of other noise sources, most notably those produced by aircraft (airplane or helicopter) over-flight, on birds (e.g., Brown 1990). Such studies sometimes provide insight into the effects of noise on breeding biology (e.g., Bunnell et al. 1981), survival of eggs and young (Burger 1983), and non-auditory physiological effects. A number of these papers might also serve as more controlled experimental studies where the effects of noise on birds could be isolated and understood, and such studies may provide guidance for the type(s) of studies that are needed in order to better understand the effects of highway noise on birds.
At the same time, the characteristics of noise from aircraft is sufficiently different from that produced by highways that extrapolation from one set of response data to the other is very difficult, and perhaps should not be done at all. These differences include sound level and temporal distribution. Generally aircraft noise is far more intense than noise from roadways. Moreover, exposure to aircraft noise is highly intermittent, whereas highway noise can often be characterized and modeled as a continuous, lower level, noise source. Such differences in sounds are responded to in different ways by birds, and so it becomes questionable whether it is possible to extrapolate between sound sources in trying to address the issue of effects of highway noise on birds.
Fortunately, interest in the effects of noise on animals in their natural habitat is increasingly becoming of academic and scientific interest (see recent reviews of Kaseloo 2004; Brumm and Slabbekoorn 2005). It is widely known that exposure to high level sounds can alter the physiology and structure of terrestrial vertebrates (e.g., Fletcher and Busnel 1978; Saunders et al. 1991). Moreover, there are standards set by the Occupational Safety and Health Administration (OSHA) recognizing that high levels of background sound have an impact on human well-being (e.g., Miller 1970; NIH 1990; von Gierke and Eldred 1993; Pearsons et al. 1995). These changes may include cellular changes, organ system changes, or stress level effects caused by exposure to sound. These standards also recognize that lower level sounds for extended periods of time can have a range of effects on humans and other animals.
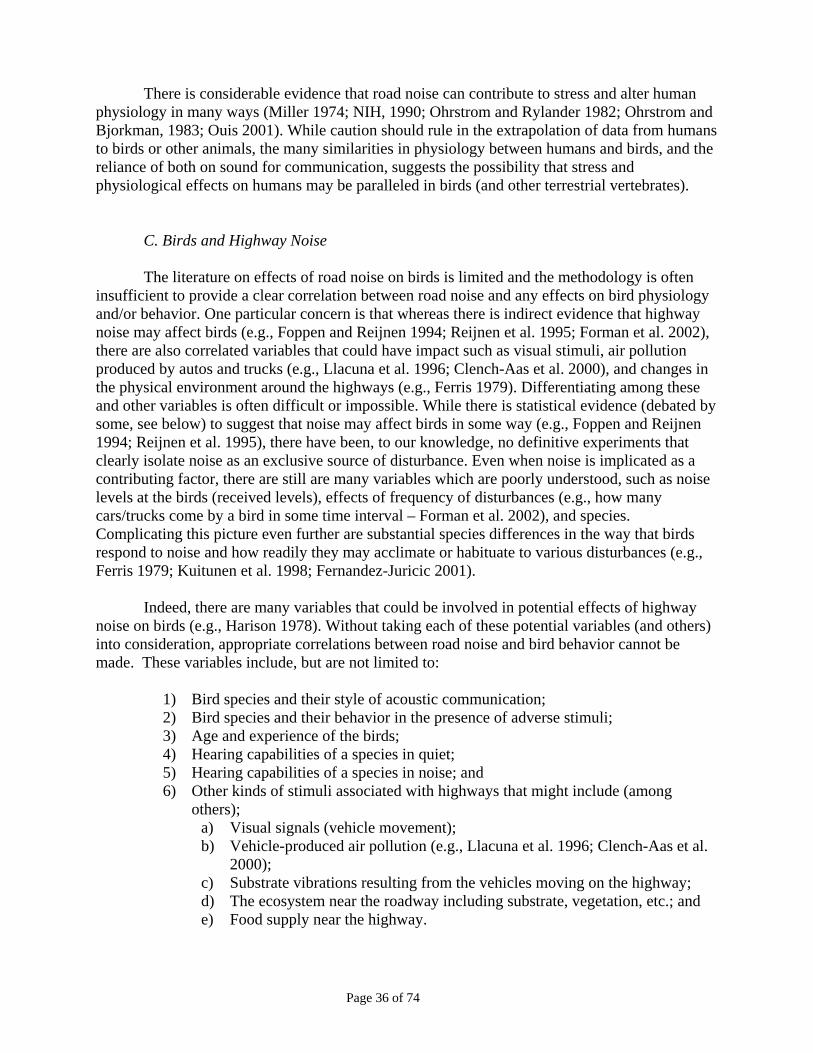
Page 36 of 74
There is considerable evidence that road noise can contribute to stress and alter human physiology in many ways (Miller 1974; NIH, 1990; Ohrstrom and Rylander 1982; Ohrstrom and Bjorkman, 1983; Ouis 2001). While caution should rule in the extrapolation of data from humans to birds or other animals, the many similarities in physiology between humans and birds, and the reliance of both on sound for communication, suggests the possibility that stress and physiological effects on humans may be paralleled in birds (and other terrestrial vertebrates). C. Birds and Highway Noise
The literature on effects of road noise on birds is limited and the methodology is often insufficient to provide a clear correlation between road noise and any effects on bird physiology and/or behavior. One particular concern is that whereas there is indirect evidence that highway noise may affect birds (e.g., Foppen and Reijnen 1994; Reijnen et al. 1995; Forman et al. 2002), there are also correlated variables that could have impact such as visual stimuli, air pollution produced by autos and trucks (e.g., Llacuna et al. 1996; Clench-Aas et al. 2000), and changes in the physical environment around the highways (e.g., Ferris 1979). Differentiating among these and other variables is often difficult or impossible. While there is statistical evidence (debated by some, see below) to suggest that noise may affect birds in some way (e.g., Foppen and Reijnen 1994; Reijnen et al. 1995), there have been, to our knowledge, no definitive experiments that clearly isolate noise as an exclusive source of disturbance. Even when noise is implicated as a contributing factor, there are still are many variables which are poorly understood, such as noise levels at the birds (received levels), effects of frequency of disturbances (e.g., how many cars/trucks come by a bird in some time interval – Forman et al. 2002), and species. Complicating this picture even further are substantial species differences in the way that birds respond to noise and how readily they may acclimate or habituate to various disturbances (e.g., Ferris 1979; Kuitunen et al. 1998; Fernandez-Juricic 2001).
Indeed, there are many variables that could be involved in potential effects of highway
noise on birds (e.g., Harison 1978). Without taking each of these potential variables (and others) into consideration, appropriate correlations between road noise and bird behavior cannot be made. These variables include, but are not limited to:
1) Bird species and their style of acoustic communication; 2) Bird species and their behavior in the presence of adverse stimuli; 3) Age and experience of the birds; 4) Hearing capabilities of a species in quiet; 5) Hearing capabilities of a species in noise; and 6) Other kinds of stimuli associated with highways that might include (among
others); a) Visual signals (vehicle movement); b) Vehicle-produced air pollution (e.g., Llacuna et al. 1996; Clench-Aas et al.
2000); c) Substrate vibrations resulting from the vehicles moving on the highway; d) The ecosystem near the roadway including substrate, vegetation, etc.; and e) Food supply near the highway.

Page 37 of 74
The overall literature has been critically reviewed several times in recent years (e.g., Transportation Noise Control Center [TNCC] 1997; Kaseloo 2004; Warren et al. 2006). These reviews suggest that a good portion of the literature is not relevant to the issues at hand since it often does not take into consideration all appropriate variables (e.g., variables other than sound) or that they have problems with data analysis and/or interpretation. In one of the recent excellent analyses, Warren et al. (2006) evaluated data suggesting that noise could affect bird behavior. However, the authors pointed out that while these papers could be interpreted as indicating that noise may affect birds, none of the earlier work can clearly be used to reach any firm conclusions about any one species, or all species. Indeed, Warren et al. (2006) point out the need for very specific and highly controlled laboratory and field studies to assess how highway (or any other) noise will affect birds. Such experiments are very difficult to design and execute, and all other variables must be taken into consideration in design of these experiments.
The four major sets of studies considered by Warren et al. (2006) are helpful to our understanding of the issues. In one series of papers, Reijnen and colleagues (Reijnen and Foppen 1994, 1995; Reijnen et al. 1995a, b; reviewed in Reijnen et al. 1995c) examined the effects of motorway traffic on breeding bird populations in the Netherlands. Reijnen and his colleagues concluded that highway noise has an impact on birds within several hundred meters of the highway. They also concluded that highway noise lowers the extent of bird breeding near highways. The study by Reijnen and colleagues showed that when traffic noise level was constant, there was no discernable effect from visual disturbance. But when visual disturbance was kept constant, bird distribution patterns were statistically correlated with traffic noise. Furthermore the authors noted that visual disturbance and vehicular pollutants extended outward only a short distance from the highway, whereas both traffic noise and reduced bird densities extended outward much further. This differential effect distance approach suggests that if it is appropriately integrated into the experimental designs of future studies, it could provide more tractable means for isolating the effects of the confounding variables and better extracting focused information on noise-specific impacts.
While the data in the Reijnen et al. studies are interesting and possibly instructive, the
work has been severely criticized for poor statistical analysis and poor controls, and for lack of analysis of individual bird species (TNCC 1997). TNCC (1997) suggested that the number of birds studied was too low for reliable statistical measures and that levels of significance used varied between study years. TNCC (1997) also concluded that Reijnen et al., in reaching their conclusions, also did not consider highway construction as another potential point of impact on birds.
Most importantly, TNCC (1997) points out that Reijnen and colleagues pooled all of their
data so that they presented a possible effect on all birds, rather than determine whether there are species-specific effects. The importance of the species variability in response to noise (and other factors) has been emphasized in several other studies which have shown variability in whether different bird species will respond to noise or not (e.g., Clark and Karr 1979; Ferris 1979; van der Zande et al. 1980; Kuitunen et al. 1998; Fernandez-Juricic 2001; Peris and Pescador 2004). Indeed, lack of consideration of species variability is also the basis for the major criticism of the
Page 38 of 74
USFWS (2006) recommended procedures for analysis of the effects of sounds on spotted owls and marbled murrelets.
In another study, Stone (2000) did transects to determine bird populations over a wide range of land use types. The results led to the suggestion that there is a marked decrease in bird populations in noisier areas, despite the specific land use. However, Warren et al. (2006) criticized the Stone (2000) study and pointed out that while noise was one variable that could have affected bird populations in some types of land use and not in others, Stone (2000) did not do a multi-factor analysis to determine if other habitat issues, such as whether there were also differences ground surface, vegetative type, or other variables that could have altered a bird’s behavior.
A more convincing case that road noise may affect birds is a recent study by Forman et al. (2002) which looked at the presence of five species of grassland bird populations in grasslands at different distances from roads in and around Boston. The authors argue that there is an effect on density of species studied by road noise, but that the extent of the effect, in terms of decreased populations at different distances, varied depending upon the level of activity of the road. They found that low traffic (less than 8000 vehicles/day) had no effect on grassland bird populations. In areas with from 8,000-15,000 vehicles per day, there was no effect on population levels per se, but there were fewer breeding birds up to 400 m from the road. Bird presence and breeding was decreased at up to 700 m from the roadway when there were from 15,000-30,000 vehicles per day, whereas this distance increased to 1,200 m for more than 30,000 vehicles per day (a multilane highway). While the authors conclude that noise may be the major factor affecting these grassland species, and that other environmental variables such as visual signals, air pollutants, and lack of prey near the roadways may help explain the decline in bird populations, direct experimental evidence of effects of increased chronic noise of different levels and sound spectra (Lee and Fleming 1996) is needed to confirm this hypothesis (also see Warren et al. 2006).
At the same time, the results from Forman et al. (2002) may not be applicable to all species, or in all situations. For example, Peris and Pescador (2004) examined the effects of low, medium, and high traffic volumes on bird populations of 20 passerine bird species in pasture-woodland environments near several roads in western central Spain. While it is hard to specifically compare results between the two studies since Peris and Pescador (2004) did not define road density in terms of actual number of vehicles/day, the different results are instructive. In contrast to Forman et al. (2002), Peris and Pescador (2004) provided sound level measures at distances of 50-100 m from the roadways. They reported that the high traffic volume area had sound levels of 69±5 dB, medium density 46±3 dB, and low density at 36±2 dB (it was not indicated if this was dB SPL or dBA). Peris and Pescador (2004) showed that there were differences between the number of birds and the extent of breeding populations in each of the three areas, but the differences varied by species. In effect, no one pattern of bird presence was appropriate for all of the species studied over the two year period. For example, corn bunting (Miliaria calandra), rock sparrow (Petronia petronia), and house sparrow (Passer domesticus) actually had a higher breeding density in the high traffic (noisier) environment than they did in the low traffic volume areas. In contrast, breeding density was higher for Wheatear (Oenanthe sp.) in low and moderate traffic areas (quieter) than in high traffic areas. The authors concluded that 55% of the species did not show any difference in breeding density between the three noise

Page 39 of 74
level sites, whereas other birds did show statistically significant differences. The authors suggest that the differences in responses of the various species may depend on hearing sensitivity of the species, with birds that have more sensitive hearing showing greater avoidance of road noise than birds with poorer hearing.
D. Lessons from the Work on Human Responses to Traffic Noise
There is a long history of the study of traffic noise and its abatement on humans (e.g.,
Ohrstrom and Bjorkman 1982; Osada 1991; Watts 1996; Ouis 2005). While not directly relevant to the present situation, there are important lessons that should be learned from these efforts. In particular, these studies point out the myriad of adverse effects of noise on humans (e.g., stress hormone elevation, alterations in sleep patterns) and the variability of the responses to noise of different individuals.
One fundamental lesson is that it is impossible to come up with a single noise index or
collection of noise indices that accurately predict the effects of traffic noise on humans. But aside from this problem, researchers have long realized that the primary difficulty arises not from specific characteristics of the noise, but from a host of non-acoustical factors having to do with differences among individual humans. In general, reviews by Ouis (2005) and Schultz (1978) suggest that when traffic noise levels approach a day-night average sound level of 75-80 dB(A), a majority of people report being highly annoyed. In the absence of any hard data on birds, we should expect similar effects with similar issues arising between bird species and even within members of the same species (e.g., of different ages, experience). These factors, along with habituation, are almost certainly at play in all birds coping with high levels of noise.
It must also be remembered that what is perceived as noise by one person might not be perceived as noise by another. It is clear that annoyance is more related to attitudes than to noise levels (Ouis 2005). Important non-acoustic factors include the hearers socio-economic status, knowledge about of the cause of the noise, age, gender, etc., all play an important role in determining whether a given noise creates annoyance or not. One would expect that for birds there might also be large individual differences in the perception of noise itself, or in non-acoustic correlates of noise, such as moving vehicles. These individual differences could play a significant role in whether traffic noise is a problem for a given species of bird, or for given individuals within a species, and whether it is annoying enough to significantly affect the long term or short term biology of the species.
E. Long-Term Adaptations to Noise Masking Even without human-generated noise, natural habitats have particular patterns of ambient
noise (the acoustic scene) resulting from, among other things, wind, animal and insect sounds, and other noise-producing environmental factors such as a streams, waterfalls, etc. Biologists have long suspected that such noise exerts a selection pressure on the evolution of acoustic signals especially in birds (e.g., Morton 1975; Brenowitz 1982; Ryan and Brenowitz 1985; Wiley and Richards 1982; Slabbekoorn 2004). Brumm and Slabbekoorn (2005) report that the large-billed leaf-warbler (Phylloscopus magnirostris) which lives close to river torrents in the
Page 40 of 74
Himalayas evade masking of their territorial songs by producing high-pitched notes in narrow frequency bands around 6 kHz (Dubois and Martens 1984). In fact, differences in song or call structure based on differences in habitat have been reported, or suspected, in a number of avian species (Douglas and Conner 1999; Slabbekoorn and Smith 2002; Slabbekoorn and Peet 2003) such as for the songs of little greenbuls (Andropadus virens). However, it remains an issue whether a given vocalization is adapted to environmental noise by evolutionary or ontogenetic changes.
F. Short-Term Adaptations to Noise Masking
Birds are also able to adjust the characteristics of their vocalizations in response to temporary changes in the background noise. As one example, there is now a considerable literature demonstrating that birds can adjust the amplitude of their vocalizations in response to noise by a phenomenon first referred to in humans as the Lombard effect. A number of species of birds have been shown to raise the level of their vocal output by as much as 10 dB in the presence of moderate background noise which is loud enough affect the bird’s perception of its own vocalizations (Potash 1972; Cynx et al. 1998; Manabe, et al. 1998; Brumm and Todt 2002, 2003).
This has now been conclusively demonstrated by studying behaving birds trained to wear
headphones while vocalizing (Osmanski and Dooling 2006). In these experiments, presenting noise through headphones causes the bird to raise the amplitude of vocal output by as much as 10 dB. While most of the work on amplitude control has been done in the lab, a recent study has shown that nightingale males sing louder in noisier territories and birds in urban areas sing louder on working days than on weekend days when noise levels are reduced (Brumm 2004).
There is limited evidence that at least some birds can use repetition to increase the efficiency of signal transmission. Japanese quail increase the number of call syllables per call series in noise (Potash 1972) and penguins respond to increasing levels of background noise due to wind by increasing the number of syllables in their calls (Lengagne et al. 1999).
There is also evidence that some birds are capable of making short term alterations in the spectrum of their vocalizations (Hultsch and Todt 1996; Manabe 1997). In other recent laboratory experiments with budgerigars, birds were trained to produce vocalizations while wearing headphones. Artificially shifting the pitch of auditory feedback of the bird’s own vocalizations resulted in the bird compensating by shifting the pitch of its vocalization in the opposite direction (Osmanski and Dooling 2006). These experiments demonstrate that birds have some short term control over the pitch of their vocalizations and may use this ability to maximize information transfer in a noisy environment.
It is well known that birds can adjust the timing of their vocalizations to avoid competition for acoustic space with other species or to coincide with low noise periods to prevent auditory masking (Cody and Brown 1969; Wasserman 1977; Popp and Ficken 1987; Popp et al. 1985; Ficken et al. 1985; Evans 1991).

Page 41 of 74
Birds (both sender and receiver) can also counteract the effect of masking noise on acoustic communication by changing their location. One strategy that will improve signal-to-noise ratio is to move to a position in the habitat in which the transmission pathway is better for the signal than the noise (Brumm and Slabbekoorn 2005). Thus, moving higher in the vegetation is one response that will improve the signal-to-noise ratio (Mathevon et al. 1996; Holland et al. 1998). With European blackbirds (Turdus merula), it is estimated that moving up from the ground to a perch at about 9 meters high would result in an increase in audibility that is comparable to the receiver moving 90 meters closer to the sender horizontally (Dabelsteen et al. 1993).
Finally, birds (like humans and other animals) enjoy a “spatial release” from masking when the noise source can be spatially separated from the signal source (Fig. 10). Laboratory work with budgerigars under highly controlled conditions has shown that the amount of this masking release is considerable and can be as much as 10-15 dB when the noise source and the signal source are separated by 90 degrees (Dent et al. 1997). Recalling that sound pressure decreases roughly 6 dB with each doubling of distance, this could translate into a quadrupling of distance over which two birds could communicate if they position themselves optimally with regards the noise source (i.e., at 90 degrees).
Figure 10: Spatial Release from Masking The bird is in the center of the circle (left panel) facing forwards (0 degrees). The amount of masking from the noise speaker changes as the location of the tone speaker is moved around the head (right panel). Thus, when both masker and tone are at 0 degrees, there is almost 30 dB of masking, whereas when the tone source is at 90 degrees, masking declines to about 20 dB (redrawn from Dent et al. 1997). G. Estimating Maximum Communication Distance between Two Birds Using Laboratory
Masking Data
Continuing with the simple example of a continuous broadband noise, it is possible to
Target Speaker Azimuth (degrees) -180 -90 0 90 180
Am
ount
of M
aski
ng (d
B S
PL)
0
15
20
25
30
35Noise
Speaker 0�
Tone Speaker
90�
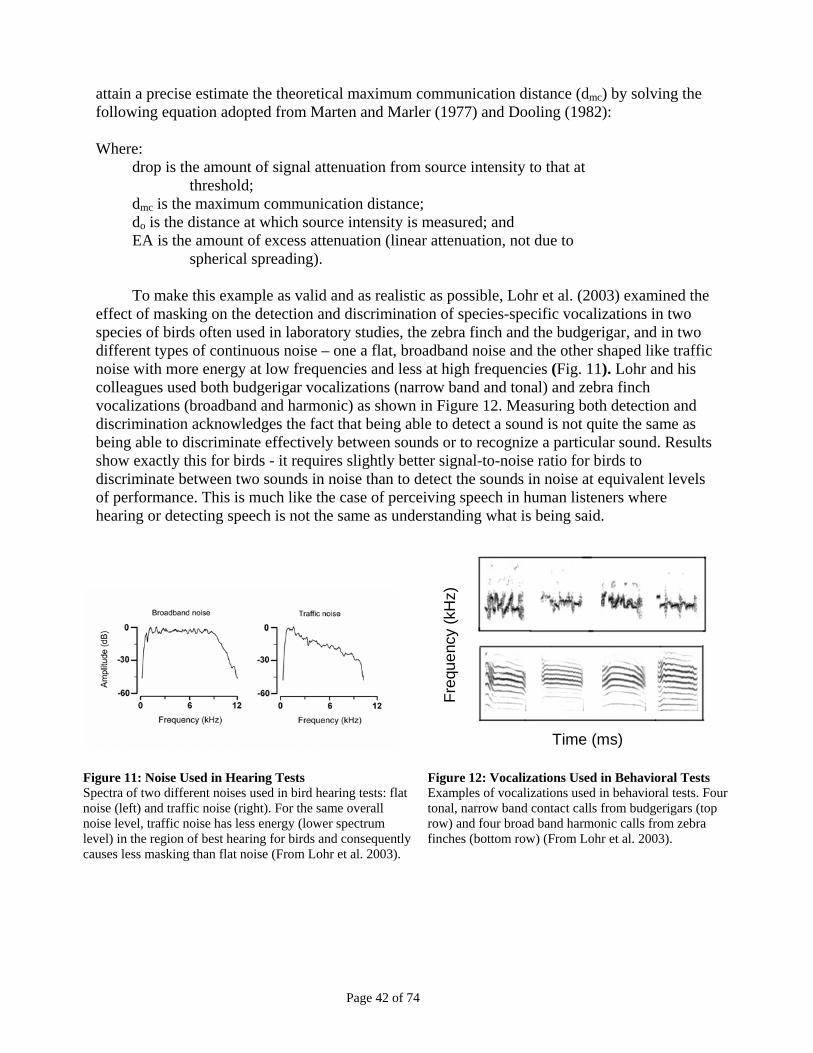
Page 42 of 74
attain a precise estimate the theoretical maximum communication distance (dmc) by solving the following equation adopted from Marten and Marler (1977) and Dooling (1982):
Where:
drop is the amount of signal attenuation from source intensity to that at threshold;
dmc is the maximum communication distance; do is the distance at which source intensity is measured; and EA is the amount of excess attenuation (linear attenuation, not due to
spherical spreading).
To make this example as valid and as realistic as possible, Lohr et al. (2003) examined the effect of masking on the detection and discrimination of species-specific vocalizations in two species of birds often used in laboratory studies, the zebra finch and the budgerigar, and in two different types of continuous noise – one a flat, broadband noise and the other shaped like traffic noise with more energy at low frequencies and less at high frequencies (Fig. 11). Lohr and his colleagues used both budgerigar vocalizations (narrow band and tonal) and zebra finch vocalizations (broadband and harmonic) as shown in Figure 12. Measuring both detection and discrimination acknowledges the fact that being able to detect a sound is not quite the same as being able to discriminate effectively between sounds or to recognize a particular sound. Results show exactly this for birds - it requires slightly better signal-to-noise ratio for birds to discriminate between two sounds in noise than to detect the sounds in noise at equivalent levels of performance. This is much like the case of perceiving speech in human listeners where hearing or detecting speech is not the same as understanding what is being said.
Freq
uenc
y (k
Hz)
Time (ms)
Figure 11: Noise Used in Hearing Tests Figure 12: Vocalizations Used in Behavioral Tests Spectra of two different noises used in bird hearing tests: flat noise (left) and traffic noise (right). For the same overall noise level, traffic noise has less energy (lower spectrum level) in the region of best hearing for birds and consequently causes less masking than flat noise (From Lohr et al. 2003).
Examples of vocalizations used in behavioral tests. Four tonal, narrow band contact calls from budgerigars (top row) and four broad band harmonic calls from zebra finches (bottom row) (From Lohr et al. 2003).
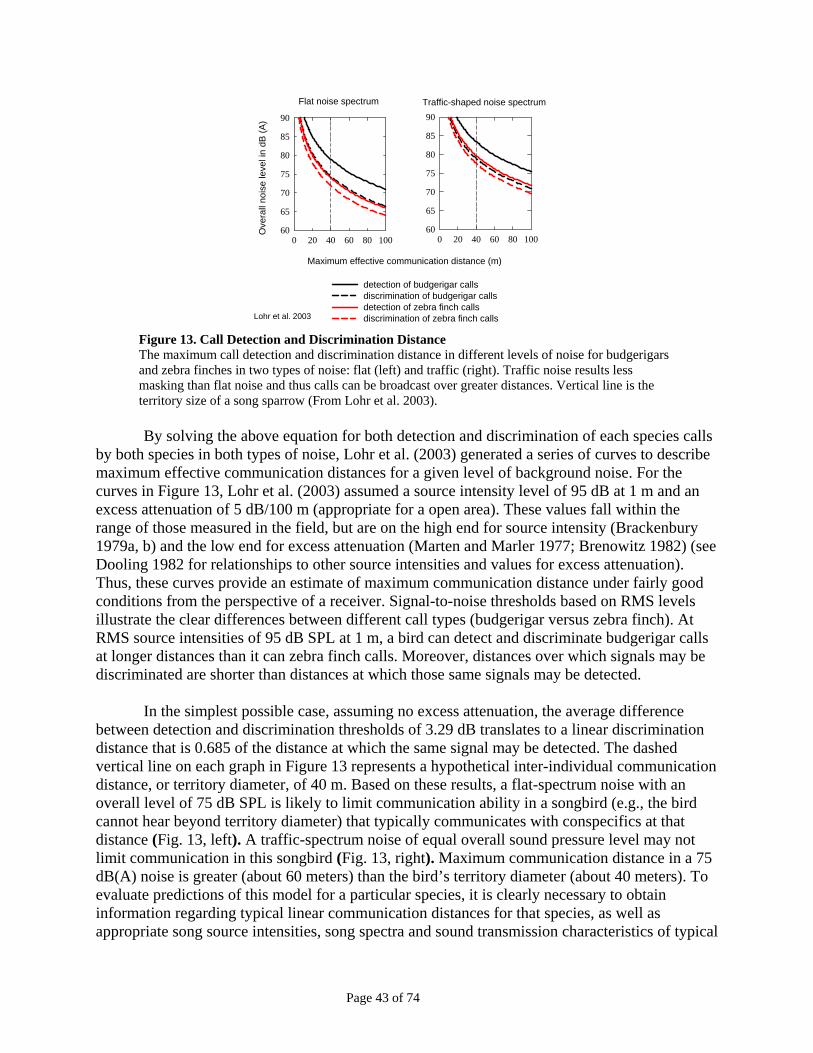
Page 43 of 74
Flat noise spectrum
0 20 40 60 80 100
Ove
rall
nois
e le
vel i
n dB
(A)
60
65
70
75
80
85
90
Traffic-shaped noise spectrum
Maximum effective communication distance (m)
0 20 40 60 80 10060
65
70
75
80
85
90
detection of budgerigar callsdiscrimination of budgerigar callsdetection of zebra finch callsdiscrimination of zebra finch callsLohr et al. 2003
Figure 13. Call Detection and Discrimination Distance The maximum call detection and discrimination distance in different levels of noise for budgerigars and zebra finches in two types of noise: flat (left) and traffic (right). Traffic noise results less masking than flat noise and thus calls can be broadcast over greater distances. Vertical line is the territory size of a song sparrow (From Lohr et al. 2003). By solving the above equation for both detection and discrimination of each species calls
by both species in both types of noise, Lohr et al. (2003) generated a series of curves to describe maximum effective communication distances for a given level of background noise. For the curves in Figure 13, Lohr et al. (2003) assumed a source intensity level of 95 dB at 1 m and an excess attenuation of 5 dB/100 m (appropriate for a open area). These values fall within the range of those measured in the field, but are on the high end for source intensity (Brackenbury 1979a, b) and the low end for excess attenuation (Marten and Marler 1977; Brenowitz 1982) (see Dooling 1982 for relationships to other source intensities and values for excess attenuation). Thus, these curves provide an estimate of maximum communication distance under fairly good conditions from the perspective of a receiver. Signal-to-noise thresholds based on RMS levels illustrate the clear differences between different call types (budgerigar versus zebra finch). At RMS source intensities of 95 dB SPL at 1 m, a bird can detect and discriminate budgerigar calls at longer distances than it can zebra finch calls. Moreover, distances over which signals may be discriminated are shorter than distances at which those same signals may be detected.
In the simplest possible case, assuming no excess attenuation, the average difference
between detection and discrimination thresholds of 3.29 dB translates to a linear discrimination distance that is 0.685 of the distance at which the same signal may be detected. The dashed vertical line on each graph in Figure 13 represents a hypothetical inter-individual communication distance, or territory diameter, of 40 m. Based on these results, a flat-spectrum noise with an overall level of 75 dB SPL is likely to limit communication ability in a songbird (e.g., the bird cannot hear beyond territory diameter) that typically communicates with conspecifics at that distance (Fig. 13, left). A traffic-spectrum noise of equal overall sound pressure level may not limit communication in this songbird (Fig. 13, right). Maximum communication distance in a 75 dB(A) noise is greater (about 60 meters) than the bird’s territory diameter (about 40 meters). To evaluate predictions of this model for a particular species, it is clearly necessary to obtain information regarding typical linear communication distances for that species, as well as appropriate song source intensities, song spectra and sound transmission characteristics of typical
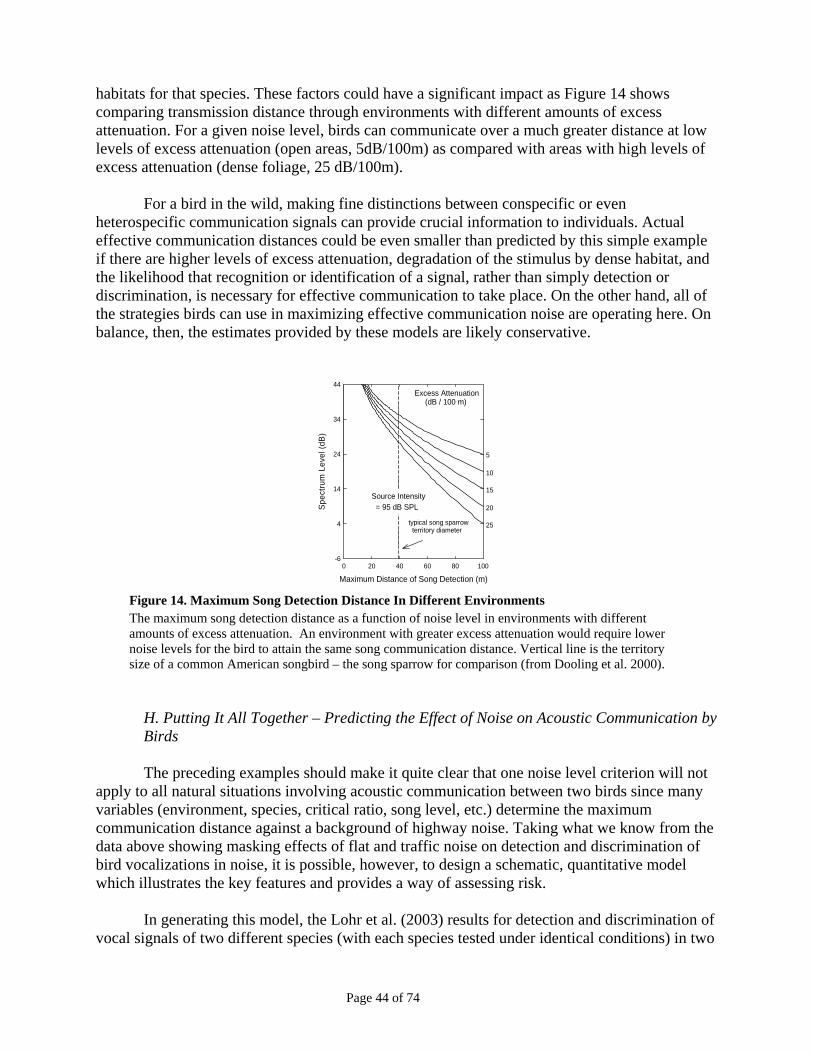
Page 44 of 74
habitats for that species. These factors could have a significant impact as Figure 14 shows comparing transmission distance through environments with different amounts of excess attenuation. For a given noise level, birds can communicate over a much greater distance at low levels of excess attenuation (open areas, 5dB/100m) as compared with areas with high levels of excess attenuation (dense foliage, 25 dB/100m).
For a bird in the wild, making fine distinctions between conspecific or even
heterospecific communication signals can provide crucial information to individuals. Actual effective communication distances could be even smaller than predicted by this simple example if there are higher levels of excess attenuation, degradation of the stimulus by dense habitat, and the likelihood that recognition or identification of a signal, rather than simply detection or discrimination, is necessary for effective communication to take place. On the other hand, all of the strategies birds can use in maximizing effective communication noise are operating here. On balance, then, the estimates provided by these models are likely conservative.
H. Putting It All Together – Predicting the Effect of Noise on Acoustic Communication by Birds The preceding examples should make it quite clear that one noise level criterion will not
apply to all natural situations involving acoustic communication between two birds since many variables (environment, species, critical ratio, song level, etc.) determine the maximum communication distance against a background of highway noise. Taking what we know from the data above showing masking effects of flat and traffic noise on detection and discrimination of bird vocalizations in noise, it is possible, however, to design a schematic, quantitative model which illustrates the key features and provides a way of assessing risk.
In generating this model, the Lohr et al. (2003) results for detection and discrimination of
vocal signals of two different species (with each species tested under identical conditions) in two
Maximum Distance of Song Detection (m)0 20 40 60 80 100
Spec
trum
Lev
el (d
B)
-6
4
14
24
34
44
Source Intensity = 95 dB SPL
Excess Attenuation (dB / 100 m)
5
10
15
20
25typical song sparrow territory diameter
Figure 14. Maximum Song Detection Distance In Different Environments The maximum song detection distance as a function of noise level in environments with different amounts of excess attenuation. An environment with greater excess attenuation would require lower noise levels for the bird to attain the same song communication distance. Vertical line is the territory size of a common American songbird – the song sparrow for comparison (from Dooling et al. 2000).

Page 45 of 74
different types of noise provides additional validation. In aggregate, these and other data lead to the following important conclusions particularly relevant to the analysis provided in this Report:
1. Noise in the frequency region of the vocalizations is most effective in masking the vocalization.
2. A higher signal-to-noise ratio is required for a bird to recognize or discriminate between two vocalizations than for a bird to detect them.
3. Species differences in the effectiveness of the noise to mask the vocalization is predictable from species differences in critical ratios.
4. Differences in the detectability (and discriminability) of broadband versus narrowband vocalizations in noise is related to the signal-to-noise ratio at the peak in the power spectrum of the vocalization.
Effect of Ambient Noise
on Communication Distance
Distance Between Birds (m)0 100 200 300 400 500
Spe
ctru
m L
evel
dB
(SP
L)
0
5
10
15
20
25
30
35
40
45
50
Communication:
Impossible
Possible
At Risk
Difficult
A B C
Figure 15: Conceptual Model for Estimating Masking Effects of Noise Schematic model for estimating the masking effects of ambient noise on vocal communication in birds. At high levels of noise and/or large inter-bird distances, communication is impossible. At low levels of noise and/or short inter-bird distances, communication is possible. The dashed white line is based on masking results for a typical bird (i.e., mean critical ratio of 27 dB). The width of the light and dark grey areas is based on ± 1 standard deviation (or about 66% of the cases) of the mean critical ratio of 14 species. Dotted lines A, B, and C represent performance of a bird with a large critical ratio such as a canary (A), the typical bird with a critical ratio of 27 dB (B), and a bird with a small critical ratio like the budgerigar (C). The intermediate (darker) grey zone between ‘At Risk’ and “’Impossible’ represents performance when birds are able to employ short term behavioral strategies to counteract the effect of a noisy environment. This model provides a way to assess whether a given level of (traffic) noise will have an effect on the distance over which birds can communicate.
Page 46 of 74
Using the formula presented previously (page 42) and assuming a bird vocalizing at 95 dB SPL in an open area (excess attenuation = 5 dB/100 meters), it is possible to estimate how far away two birds could still hear one another. For typical birds (i.e., a critical ratio of 27 dB), the relation between spectrum level of ambient noise and maximum communication distance is described by the curved white dashed line in Figure 15. In a noise with a spectrum level of 20 dB, these two birds would have a maximum communication distance (B) of about 225 meters. Not all birds have the same critical ratio. In fact, the standard deviation of all bird critical ratios is ± about 3 dB which is represented by the width of the light gray area. Birds such as a canary, with much larger (i.e., poorer) critical ratios (more than one standard deviation above the mean) would achieve a maximum communication distance of only about 175 meters (A). For bird species, like the budgerigar, with smaller (i.e., better) critical ratios (more than one standard deviation below the mean), the maximum communication distance is considerably greater in the same noise at about 325 meters (C). If these species with smaller critical ratios also employ short term behavioral strategies for communicating in noise (e.g., changing singing position, scanning by head turning, and raising their voices) communication may be possible, with difficulty, up to 200 meters (dark grey area). At higher noise levels, or greater inter-bird distances, communication would be impossible (black area). In summary, for a given noise spectrum level, maximum communication distance could vary from 50-125 meters depending on the species and the short term behavioral strategies employed. By the same token, at a given communication distance, the noise level that effectively interferes with communication can vary over about a 10 dB range depending on the species and whether short term behavioral strategies are employed.
I. Defining Guidelines for Effects The model described above makes clear that many factors go into establishing guidelines for the effects of highway noise on birds. Figure 15 shows maximum communication distance for a typical bird based on the intensity with which the bird vocalizes and the transmission loss from the environment due to the excess attenuation. The threshold for effect would also have to take into account what is known about the spectral characteristics of vocalizations, the distance over which conspecific acoustic communication (e.g., the territory size) normally occurs, and of course, existing levels of ambient noise. Noise levels that limit the maximum communication distances to a distance that is less than the diameter of the bird’s territory size (or known communication distances in ambient noise) may have serious biological consequences. The natural ambient noise already present in the bird’s environment is a key factor in determining whether highway noise will have a deleterious effect. Clearly, variation in territory size, the size of the critical ratio among birds, and natural ambient noise levels are key variables that make it impossible to use a single noise level as a one-size-fits-all level in terms of estimating whether traffic noise is limiting communication distance by causing additional masking. An example is the 60 dB(A) level mentioned earlier in relation to what we now know of birds’ critical ratios. New data would now suggest that level should probably be 55 dB(A) for the typical bird (critical ratio of 27 dB). If we accept this level based on the typical bird, it means that 50% of the tested birds would fall above this level and 50% below. On the other hand, to be most conservative, one should choose the canary which has the worst critical ratio (32 dB) of all birds tested so far (hears the poorest in noise). An acceptable dB(A) noise level based on the canary would be closer to 50 dB(A) and it would be

Page 47 of 74
conservative estimate and cover 100% of the species for which we have experimental hearing data. At the other end of the continuum, a level based on the critical ratio of the budgerigar (21 dB), which hears the best in noise, would still be about 60 dB(A), but this level would not be suitable for any other bird. Moreover, all of this depends on the distance over which birds need to communicate and the existing levels of natural ambient noise. Based on our evaluations, and given the typical noise levels in a quite suburban area, levels of highway noise approaching 50-60 dB(A)can reasonably be assumed to begin to measurably interfere with acoustic communication. Based on laboratory data, this report recommends several guidelines – two dealing with hearing damage and threshold shift, one dealing with masking, and a fourth dealing with stress and annoyance. As illustrated in Figure 5, these guidelines are: (1) Noise levels less than 110 dB(A) continuous are extremely unlikely to cause hearing damage or permanent threshold shift in birds. (2) Continuous noise levels below 93 dB(A) are unlikely to cause even temporary threshold shifts in birds. This value, based solely on bird studies, is in harmony with much of the human literature. Consider, for example, that OSHA standards require hearing conservation procedures only when noise levels in the workplace reach continuous levels of 85 dB(A) for eight hours. (3) At further distances from the highway, once the level of highway noise falls below the ambient noise level (particularly in the region of 2-4 kHz), there is, little or no additional masking of communication signals beyond what already occurs from natural ambient noise. (4). In the absence of empirical data from birds, levels of highway noise known to annoy humans provide a useful interim guideline for the potential to cause physiological stress and behavioral disturbance in birds.
Two common sense guidelines also arise from review of the data on masking. First, the typical human listener can hear highway noise at distances 2-4 times greater than can the typical bird. It follows that highway noise from either traffic or construction activity that is just barely audible to humans at any given distance, almost certainly cannot be heard by birds at the same distance. Second, the converse is also true, if a human listener can barely hear a bird singing against a background of highway noise, masking data suggest that another bird would have to half again as close to singing bird in order to hear it.
Page 48 of 74
5. Summary and Overview of the Effects of Traffic Noise on Birds
A. Classes of Potential Effects on Birds
Along with others (Kaseloo 2004; Warren et al. 2006), we have identified essentially three classes of potential effects of traffic noise on birds. These are: (1) behavioral and/or physiological effects, (2) damage to hearing from acoustic over-exposure, and (3) masking of communication signals and other biologically relevant sounds. Taken together, the data currently available on the adverse effect of traffic noise on birds remains somewhat ambiguous as to whether these classes of effects interact and which is most detrimental to birds.
In the case of non-auditory behavioral and/or physiological, laboratory studies of birds do
not translate well to the field. Rarely is noise separable from other correlated variables in field studies. Moreover, there are examples of animals habituating to relatively high levels of noise (e.g., rabbits grazing alongside heavily used airport runways, birds vocalizing in large colonies, or nesting in areas with high levels of airplane or traffic noise (e.g., Awbry et al. 1995). Finally, field studies actually measuring stress and physiological variables in birds in response to noise are practically non-existent. Much of what we suspect about these effects comes from our knowledge of how humans react to continuous traffic noise exposure. Clearly though, these effects, as well as direct auditory effects, can cause dynamic behavioral and populations effects on birds.
In the case of damage to the ear by acoustic over-exposure, laboratory data provide an
extremely clear and precise picture of the effects of acoustic-exposure on hearing and damage to auditory structures. There is no evidence that such noise affects other body structures but vibrations can be felt at very low frequencies (Kaleloo 2006). Since the noise levels required to cause damage to the ear and hearing of birds are so high, the risk of adverse effects from traffic noise are non-existent. In effect, sound levels from traffic noise never reach the levels that could cause hearing loss or ear damage and, even if it did, birds (just like humans) are unlikely to remain in the presence of such loud noise for a sufficient time to cause damage.
The possibility of traffic noise masking communication signals or other biologically
important sounds is more complicated and intriguing for several reasons. For one, answering the question definitively requires getting “into the bird’s head” and asking what the bird can and cannot hear. For another, most traffic noise is variable and challenging to characterize. Nevertheless, findings from masking studies in controlled laboratory settings can be scientifically extrapolated to field settings with some confidence especially at the limits.
Finally, birds, as well as humans and other animals can, and do, routinely employ a
number of behavioral strategies which demonstrably maximize communication in noise. B. Summary of Review Findings
1) Stress and physiological effects a) There are no studies definitively identifying traffic noise as the critical variable affect
bird behavior near roadways and highways.
Page 49 of 74
b) There are well documented adverse effects of sustained traffic noise on humans including stress, physiological and sleep disturbances, and changes in feelings of well being.
c) Traffic/construction noise below the bird’s masked threshold has no effect.
2) Acoustic over-exposure a) Birds are more resistant to both temporary and permanent hearing loss or to hearing
damage from acoustic overexposure than are humans and other animals that have been tested.
b) Birds can regenerate the sensory hair cells of the inner ear, thereby providing a mechanism for recovering from intense acoustic over-exposure, a capability not found in mammals.
c) The studies of acoustic over-exposure in birds have considerable relevance for estimating hearing damage effects of highway noise, non-continuous construction noise, and for impulsive-type construction noise such as pile drivers.
3) Masking
a) Continuous noise of sufficient intensity in the frequency region of bird hearing can have a detrimental effect on the detection and discrimination of vocal signals by birds.
b) Noise in the spectral region of the vocalizations has a greater masking affect than noises outside this range. Thus, traffic noise will cause less masking than other environmental noises of equal overall level but that contain energy in a higher spectral region around 2-4 kHz (e.g., insects, vocalizations of other birds).
c) Generally, human auditory thresholds in quiet and in noise are better than that of the typical bird which leads to the following:
(1) The typical human will be able to hear single vehicle, traffic noise, and construction noise at a much greater distance from the roadway than will the typical bird, thereby providing a valuable, common sense, risk criterion.
(2) The typical human will be able to hear a bird vocalizing in a noisy environment at twice the distance that a typical bird can.
d) From our knowledge of: (i) bird hearing in quiet and noise, (ii) the Inverse Square Law, (iii) Excess Attenuation in a particular environment, and (iv) species-specific acoustic characteristics of vocalizations, reasonable predictions can be made about possible maximum communication distances between two birds in continuous noise.
e) The amount of masking of vocalizations can be predicted from the peak in the total power spectrum of the vocalization and the bird’s critical ratio (i.e., signal-to-noise ratio) at that frequency of peak energy.
f) Birds, like humans and other animals, employ a range of short term behavioral strategies, or adaptations, for communicating in noise resulting in a doubling to quadrupling of the efficiency of hearing in noise.
4) Dynamic Behavioral and Population Effects a) Any components of highway noise that are audible to birds may have effects independent
of and beyond the effects listed above. At distances from the roadway where highway noise levels fall below ambient noise levels in the spectral region for vocal communication (i.e. 2-8 kHz), low level but audible sound in non-communication frequencies (e.g. the rumbling of a truck) can potentially cause may cause physiological or behavioral responses).

Page 50 of 74
6. Recommendations for Future Research
The three classes of potential effects of traffic noise on birds: (1) behavioral and/or physiological effects; (2) damage to hearing from acoustic over-exposure; and (3) masking of communication signals. All of these can cause dynamic behavioral, and population effects. These three classes of potential effects lead to separate, but overlapping, recommendations for future work (see Table 4, page 51, and Table 5, page 52). Some of this work is at high priority while other work is of lower priority depending on the criteria for making decisions. High priority could be to go for those issues that can be tackled by efficiency of data collection and the precision of the results (e.g., noise exposure studies in the laboratory), or, at by taking on the problem that extends the furthest from the roadway (e.g., field studies of stress and disturbance effects at distances far beyond those at which hearing damage and masking from highway noise might occur). Or highest priority could be assigned to some combination of studies which give the greatest potential value for moving us forward to better and more useful interim guidelines. Thus, in our view, experiments that can quickly improve the interim guidelines are given a higher priority than longer-term (and often more difficult) experiments that may not refine the interim guidelines efficiently. It should be noted that while not always stated explicitly, all studies should be done on several species.
1) Stress and physiological effects:17
a) Obtain a definitive answer to the question of whether traffic noise alone can cause stress, physiological reactions, and disturbances in social behavior in birds by using artificial traffic noises broadcast in large areas while birds (preferably captive) are monitored for stress indices (low priority).
b) Conduct studies comparatively to determine if stress effects are species specific (low priority).
c) Conduct studies on birds of different ages and with different degrees of experience with loud noises to determine if experience is a factor in stress-related impacts (low priority).
2) Acoustic over-exposure effects:
a) Conduct lab experiments to definitively rule out the possibility that continuous loud traffic noise can damage avian hearing (low priority).
b) Examine effects of different levels of continuous noise on temporary and permanent hearing loss in different bird species (high priority).
c) Examine effects of impulsive noise such as that produced by construction equipment and pile driving on hearing loss in different bird species. Consider a range of variables including: the intensity of the noise, the number of impulses, inter-pulse interval, and effects of different “rest periods” between pulses on hearing loss. Also include combinations of continuous traffic noise and impulse noises since some mammalian data suggest a synergistic effect (high priority).
3) Masking effects:
a) Extend what is known about masking effectiveness of traffic noise on the vocalizations of birds by conducting behavioral tests with a wider range of individual and species
17 It should be noted that precise definition of the questions and issues of the effects of highway noise on birds should be developed with the guidance of individuals who are expert on avian endocrinology and the literature on this topic.
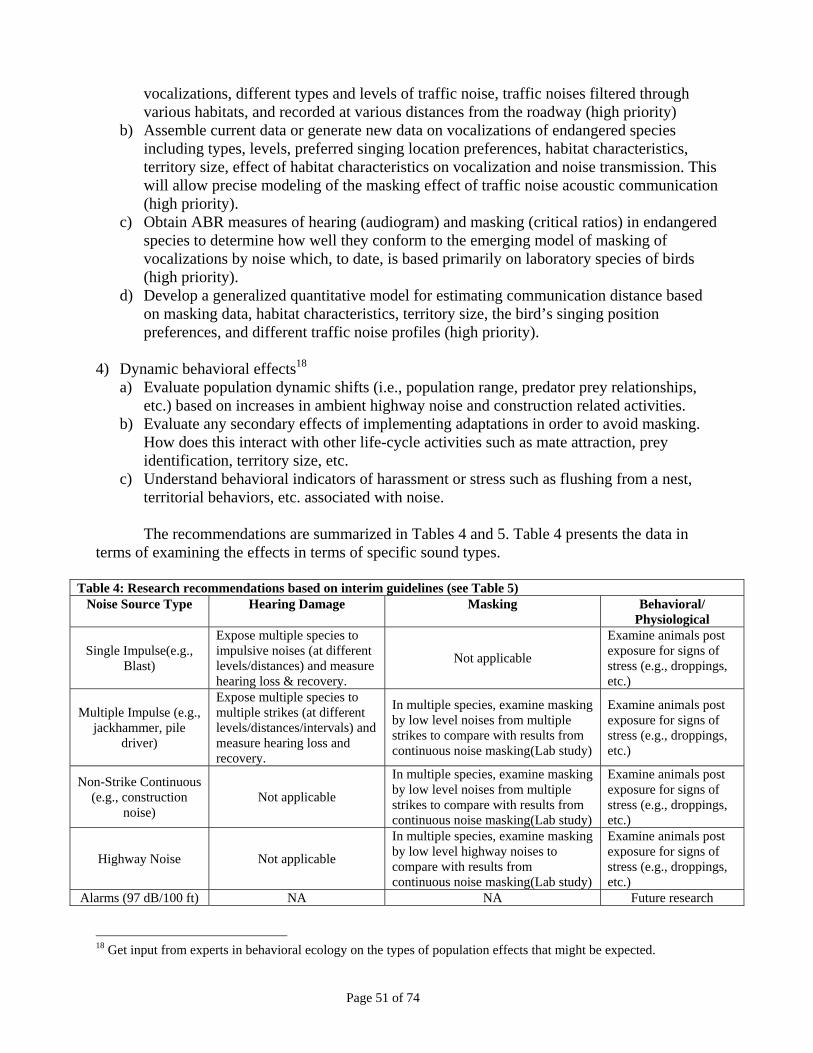
Page 51 of 74
vocalizations, different types and levels of traffic noise, traffic noises filtered through various habitats, and recorded at various distances from the roadway (high priority)
b) Assemble current data or generate new data on vocalizations of endangered species including types, levels, preferred singing location preferences, habitat characteristics, territory size, effect of habitat characteristics on vocalization and noise transmission. This will allow precise modeling of the masking effect of traffic noise acoustic communication (high priority).
c) Obtain ABR measures of hearing (audiogram) and masking (critical ratios) in endangered species to determine how well they conform to the emerging model of masking of vocalizations by noise which, to date, is based primarily on laboratory species of birds (high priority).
d) Develop a generalized quantitative model for estimating communication distance based on masking data, habitat characteristics, territory size, the bird’s singing position preferences, and different traffic noise profiles (high priority).
4) Dynamic behavioral effects18
a) Evaluate population dynamic shifts (i.e., population range, predator prey relationships, etc.) based on increases in ambient highway noise and construction related activities.
b) Evaluate any secondary effects of implementing adaptations in order to avoid masking. How does this interact with other life-cycle activities such as mate attraction, prey identification, territory size, etc.
c) Understand behavioral indicators of harassment or stress such as flushing from a nest, territorial behaviors, etc. associated with noise.
The recommendations are summarized in Tables 4 and 5. Table 4 presents the data in
terms of examining the effects in terms of specific sound types.
Table 4: Research recommendations based on interim guidelines (see Table 5) Noise Source Type Hearing Damage Masking Behavioral/
Physiological
Single Impulse(e.g., Blast)
Expose multiple species to impulsive noises (at different levels/distances) and measure hearing loss & recovery.
Not applicable
Examine animals post exposure for signs of stress (e.g., droppings, etc.)
Multiple Impulse (e.g., jackhammer, pile
driver)
Expose multiple species to multiple strikes (at different levels/distances/intervals) and measure hearing loss and recovery.
In multiple species, examine masking by low level noises from multiple strikes to compare with results from continuous noise masking(Lab study)
Examine animals post exposure for signs of stress (e.g., droppings, etc.)
Non-Strike Continuous (e.g., construction
noise) Not applicable
In multiple species, examine masking by low level noises from multiple strikes to compare with results from continuous noise masking(Lab study)
Examine animals post exposure for signs of stress (e.g., droppings, etc.)
Highway Noise Not applicable
In multiple species, examine masking by low level highway noises to compare with results from continuous noise masking(Lab study)
Examine animals post exposure for signs of stress (e.g., droppings, etc.)
Alarms (97 dB/100 ft) NA NA Future research
18 Get input from experts in behavioral ecology on the types of population effects that might be expected.

Page 52 of 74
Table 5: Additions to basic science data that could inform decisions on interim guidelines and future analyses.
Topic Method
Audiograms in Birds Measure hearing thresholds in a variety of species using the ABR(lab & field)
Masked Thresholds in Birds Measure masked thresholds and critical ratios in a variety of (endangered) species using the ABR(lab & field)
Vocalization & Communication Distance Review literature for description of vocalizations, territory size, and communication range, young learning songs, female choice in breeding
Acoustic Communication Model
Develop a model that combines habitat characteristics (e.g., sound transmission), vocalization characteristics (e.g., spectrum, intensity, etc.) and masked thresholds to refine estimates of the effects of masking by noise on communication.
Attenuation/Avoidance/Minimization/Mitigation Methods
Evaluate ways which may inform decisions regarding equipment use, attenuation methods, avoidance, minimization/mitigation methods.

Page 53 of 74
7. Estimating Effects of Traffic Noise on Birds, Rationale, and Interim Guidelines
We reviewed three classes of potential effects of traffic noise on birds. The basis for the guidelines emanating from each is different. Table 3 (page 25) and Figure 5 (page 24) provide specific interim criteria. 1. Behavioral and/or physiological effects: There are no definitive studies showing that traffic
noise exclusively (as opposed to correlated variables) has an adverse affect on birds. While a wealth of human data and experience suggest traffic noise could have a number of adverse effects, there are several studies (e.g., Awbry et al. 1995) showing that birds (as well as other animals) adapt quite well, and even appear sometimes to prefer, environments that include high levels of traffic noise. Given the lack of empirical data on this point, we recommend subjective human experience with the noise in question as an Interim Guideline for estimating acceptable noise levels for avoiding stress and physiological effects. Noise types and levels that cause appear to increase stress and adverse physiological reactions in humans may also have similar consequences in birds.
2. Damage to hearing from acoustic over-exposure: In contrast to the above, there are many definitive studies directly on point showing the effect of intense noise on bird hearing and auditory structures. These extensive data show that birds are much more resistant to hearing loss and auditory damage from acoustic over-exposure than are humans and other mammals. Highway noise, even at extreme levels, is unlikely to cause threshold shift, hearing loss, auditory damage, or damage to other organ systems in birds and therefore Interim Guidelines for hearing damage from highway noise are probably not needed. Construction noise, such as impulse noise from pile driving, do reach high levels and may be capable of causing damage to auditory structures in birds.
3. Masking of communication signals and other biologically relevant sounds: Many laboratory masking studies show precisely, the effect of continuous noise (including traffic noise) on sound detection in over a dozen species of birds. In one sense, these studies describe a sort of “worst case” scenario because the noise is continuous and the myriad of short term adaptive behavioral responses for mitigating the effects of noise are not available to the bird in a laboratory test situation. These masking studies led to a overall noise level guideline of around 60 dB(A)for continuous noise. Since this 60 dB(A) criterion was developed, however, highly controlled laboratory and field studies have extended the range of species differences in signal-to-noise ratios as well as the gain in signal-to-noise ratio that occurs with various short-term, adaptive behavioral responses that birds might use in natural environments. Critical ratios vary across species as much as 10 dB, strongly suggesting that acoustic communication in some species might be affected by an overall highway noise level even less than 60 dB(A), while others would not. For some other species, communication between individuals, especially if they can employ short term behavioral strategies for hearing in noise, might be unaffected at even higher levels of noise perhaps approaching 70 dB(A). These short term behavioral adaptations include scanning (head turning), raising vocal output, and changing singing location. Each of these strategies alone can result in a significant gain in signal level or signal-to-noise ratio (under masking conditions) of about 10 dB and birds can, and probably do, employ all three strategies simultaneously.

Page 54 of 74
4. Practical guidelines arising from masking studies: There is a common sense, extremely practical guideline that emerges from basic hearing knowledge of birds and humans. Specifically, the 6 dB difference in masking (critical ratio) functions between the typical bird and human listeners with normal hearing provide two common sense guidelines: 1) Humans can hear traffic noise, in a natural environment, at twice the distance from the roadway/highway than can birds. In other words, if in a natural environment, distant traffic noise is barely audible to humans, it is certainly inaudible to birds and will have no effect on any aspect of their acoustic behavior. 2) Humans can hear a bird singing against a background of noise at twice the distance than can the typical bird. This provides an informal estimate of maximum communication distance between two birds vocalizing against a background of continuous traffic noise. This works not only for the “typical” bird, but it is probably also valid for most species.
These recommended guidelines for estimating effects of masking by traffic noise on birds are Interim Guidelines for several reasons.
1. The Interim Guidelines are based on median data from masking studies. Thus they represent
the typical bird. However, it is important to recall that bird species vary considerably in how they hear in the presence of noise. This ranges from their having masked thresholds that approach those of humans to masked thresholds that are 3-4 dB worse than thresholds for the typical bird presented here. Species differences in masked thresholds directly affect maximum communication distance in noise (Figure 14, page 44 ). Final noise guidelines will require testing more species with appropriate experimental adjustment for the species in question.
. 2. Traffic noise characteristics are influenced by transmission through the environment as are the
spectral, temporal, and intensive aspects bird vocalizations through differences in excess attenuation. Final guidelines must accommodate these variables which are specific to the species and to the environment (Figure 14, page 44).
. 3. We expect that with new data, particularly as derived from experiments in Section 6 (page 50),
both the lower and upper bound highway noise guidelines may be adjusted upward for estimating the effects of noise on acoustic communication distances. For example, as the past 15 years of well controlled laboratory and field studies have shown, short term behavioral strategies available to birds can serve to increase the informal, acceptable level of highway noise causing masking. We can anticipate additional adjustments over the next several years.
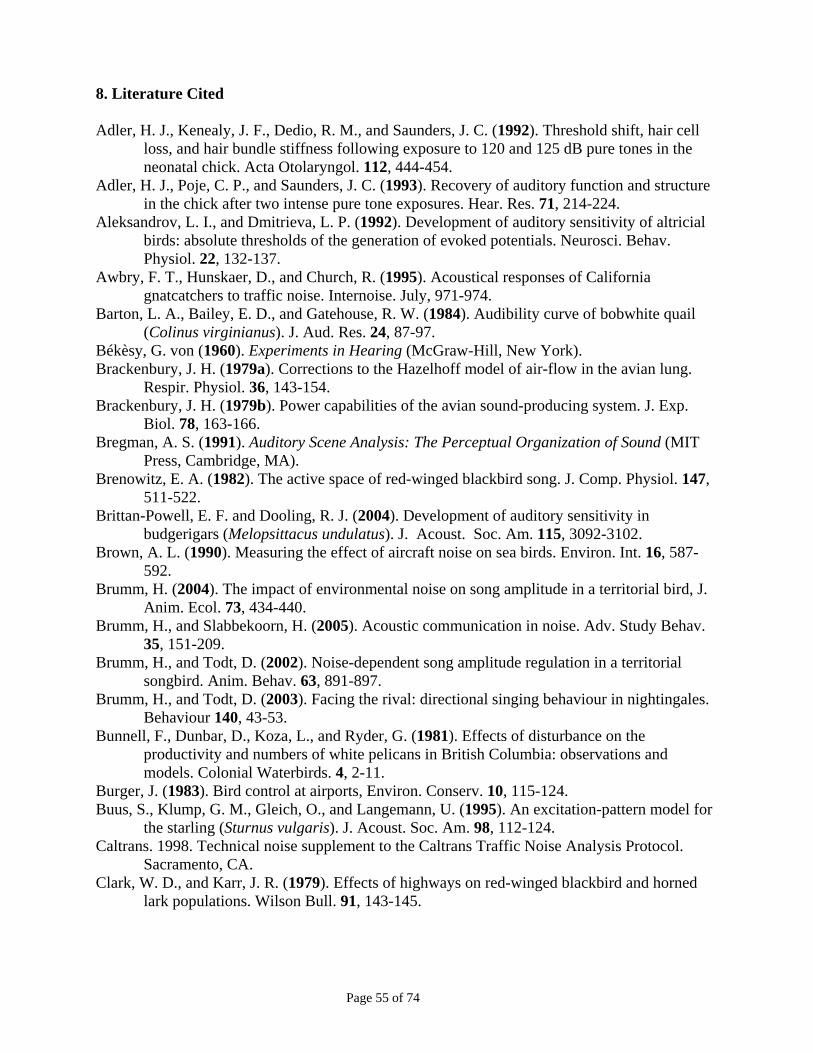
Page 55 of 74
8. Literature Cited Adler, H. J., Kenealy, J. F., Dedio, R. M., and Saunders, J. C. (1992). Threshold shift, hair cell
loss, and hair bundle stiffness following exposure to 120 and 125 dB pure tones in the neonatal chick. Acta Otolaryngol. 112, 444-454.
Adler, H. J., Poje, C. P., and Saunders, J. C. (1993). Recovery of auditory function and structure in the chick after two intense pure tone exposures. Hear. Res. 71, 214-224.
Aleksandrov, L. I., and Dmitrieva, L. P. (1992). Development of auditory sensitivity of altricial birds: absolute thresholds of the generation of evoked potentials. Neurosci. Behav. Physiol. 22, 132-137.
Awbry, F. T., Hunskaer, D., and Church, R. (1995). Acoustical responses of California gnatcatchers to traffic noise. Internoise. July, 971-974.
Barton, L. A., Bailey, E. D., and Gatehouse, R. W. (1984). Audibility curve of bobwhite quail (Colinus virginianus). J. Aud. Res. 24, 87-97.
Békèsy, G. von (1960). Experiments in Hearing (McGraw-Hill, New York). Brackenbury, J. H. (1979a). Corrections to the Hazelhoff model of air-flow in the avian lung.
Respir. Physiol. 36, 143-154. Brackenbury, J. H. (1979b). Power capabilities of the avian sound-producing system. J. Exp.
Biol. 78, 163-166. Bregman, A. S. (1991). Auditory Scene Analysis: The Perceptual Organization of Sound (MIT
Press, Cambridge, MA). Brenowitz, E. A. (1982). The active space of red-winged blackbird song. J. Comp. Physiol. 147,
511-522. Brittan-Powell, E. F. and Dooling, R. J. (2004). Development of auditory sensitivity in
budgerigars (Melopsittacus undulatus). J. Acoust. Soc. Am. 115, 3092-3102. Brown, A. L. (1990). Measuring the effect of aircraft noise on sea birds. Environ. Int. 16, 587-
592. Brumm, H. (2004). The impact of environmental noise on song amplitude in a territorial bird, J.
Anim. Ecol. 73, 434-440. Brumm, H., and Slabbekoorn, H. (2005). Acoustic communication in noise. Adv. Study Behav.
35, 151-209. Brumm, H., and Todt, D. (2002). Noise-dependent song amplitude regulation in a territorial
songbird. Anim. Behav. 63, 891-897. Brumm, H., and Todt, D. (2003). Facing the rival: directional singing behaviour in nightingales.
Behaviour 140, 43-53. Bunnell, F., Dunbar, D., Koza, L., and Ryder, G. (1981). Effects of disturbance on the
productivity and numbers of white pelicans in British Columbia: observations and models. Colonial Waterbirds. 4, 2-11.
Burger, J. (1983). Bird control at airports, Environ. Conserv. 10, 115-124. Buus, S., Klump, G. M., Gleich, O., and Langemann, U. (1995). An excitation-pattern model for
the starling (Sturnus vulgaris). J. Acoust. Soc. Am. 98, 112-124. Caltrans. 1998. Technical noise supplement to the Caltrans Traffic Noise Analysis Protocol.
Sacramento, CA. Clark, W. D., and Karr, J. R. (1979). Effects of highways on red-winged blackbird and horned
lark populations. Wilson Bull. 91, 143-145.

Page 56 of 74
Clench-Aas, J., Bartonova, A., Klaeboe, R., and Kolbenstvedt, M. (2000). Oslo traffic study. Part 2: quantifying effects of traffic measures using individual exposure modeling. Atmos. Environ. 34, 4737-4744.
Cody, M. L. (1974). Competition and the Structure of Bird Communities (Princeton University Press, Princeton, NJ).
Cody, M. L., and Brown, J. H. (1969). Song asynchrony in neighbouring bird species. Nature. 222, 778-780.
Cohen, S. M., Stebbins, W. C., and Moody, D. B. (1978). Audibility thresholds of the blue jay. Auk. 95, 563-568.
Coles, R. B., Konishi, M., and Pettigrew, J. D. (1987). Hearing and echolocation in the Australian grey swiftlet, Collocalia spodiopygia. J. Exp. Biol. 129, 365-371.
Cotanche, D. A. (1999). Structural recovery from sound and aminoglycoside damage in the avian cochlea. Audiol. Neurootol. 4, 271-285.
Cynx, J., Lewis, R., Tavel, B., and Tse, H. (1998). Amplitude regulation of vocalizations in noise by a songbird, Taeniopygia guttata. Anim. Behav. 56, 107-113.
Dabelsteen, T., Larsen, O. N., and Pedersen, S. B. (1993). Habitat-induced degradation of sound signals: quantifying the effects of communication sounds and bird location on blur ratio, excess attenuation, and signal-to-noise ratio in blackbird song, J. Acoust. Soc. Am. 93, 2206-2220.
Dent, M. L., Larsen, O. N., and Dooling, R. J. (1997). Free-field binaural unmasking in budgerigars (Melopsittacus undulatus). Behav. Neurosci. 111, 590-598.
Dooling, R. J. (1982). Auditory perception in birds. In: Acoustic Communication in Birds, Vol. 1, edited by D. E. Kroodsma and E. H. Miller, (Academic Press, New York), pp. 95-130.
Dooling, R. J. (1980). Behavior and psychophysics of hearing in birds. In: Comparative Studies of Hearing in Vertebrates, edited by A. N. Popper and R. R. Fay (Springer-Verlag, New York), pp. 261-288.
Dooling, R. J. (1992). Hearing in birds. In: The Evolutionary Biology of Hearing, edited by D. B. Webster, R. R. Fay, and A. N. Popper (Springer-Verlag, New York), pp. 545-559.
Dooling, R. J., Lohr, B., and Dent, M. L. (2000). Hearing in birds and reptiles, In: Comparative Hearing: Birds and Reptiles, edited by R.J. Dooling, A.N. Popper, and R.R. Fay (Springer-Verlag, New York eds), pp. 308-359.
Dooling, R. J., Okanoya, K., Downing, J., and Hulse, S. (1986). Hearing in the Starling (Sturnus vulgaris): absolute thresholds and critical ratios. Bull. Psychon. Soc. 24, 462-464.
Dooling, R. J., Peters, S. S., and Searcy, M. H. (1979). Auditory sensitivity and vocalizations of the field sparrow (Spizellapusilla). Bull. Psychon. Soc. 14, 106-108.
Dooling, R. J., and Saunders, J. C. (1975). Hearing in the parakeet (Melopsittacus undulatus): absolute thresholds, critical ratios, frequency difference limens, and vocalizations. J. Comp. Physiol. 88, 1-20.
Dooling, R. J., and Searcy, M. H. (1979). The relation among critical ratios, critical bands, and intensity difference limens in the parakeet (Melopsittacus undulatus). Bull. Psychon. Soc. 13, 300-302.
Dooling, R. J., Zoloth, S. R., and Baylis J. R. (1978). Auditory sensitivity, equal loudness, temporal resolving power and vocalizations in the house finch (Carpodacus mexicanus). J. Comp. Physiol. Psychol. 92, 867-876.
Douglas, H. D. III, and Conner, W. E. (1999). Is there a sound reception window in coastal environments? Evidence from shorebird communication systems. Naturwissenschaften. 86, 228-230.
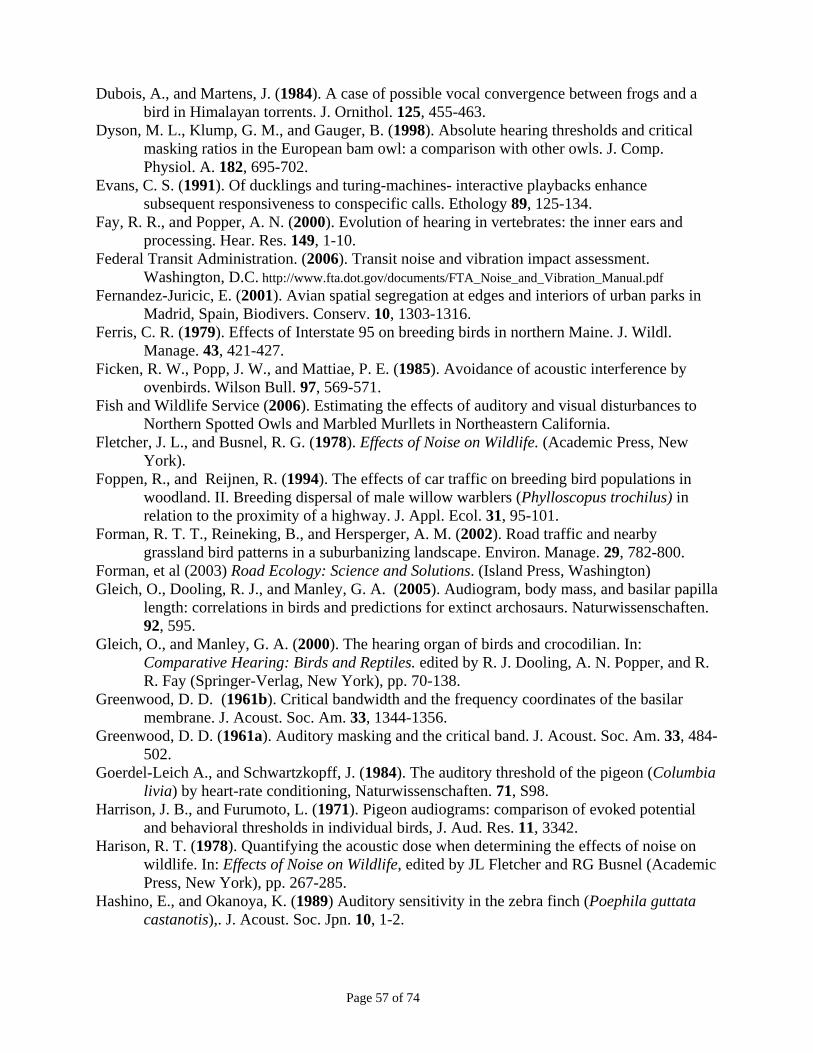
Page 57 of 74
Dubois, A., and Martens, J. (1984). A case of possible vocal convergence between frogs and a bird in Himalayan torrents. J. Ornithol. 125, 455-463.
Dyson, M. L., Klump, G. M., and Gauger, B. (1998). Absolute hearing thresholds and critical masking ratios in the European bam owl: a comparison with other owls. J. Comp. Physiol. A. 182, 695-702.
Evans, C. S. (1991). Of ducklings and turing-machines- interactive playbacks enhance subsequent responsiveness to conspecific calls. Ethology 89, 125-134.
Fay, R. R., and Popper, A. N. (2000). Evolution of hearing in vertebrates: the inner ears and processing. Hear. Res. 149, 1-10.
Federal Transit Administration. (2006). Transit noise and vibration impact assessment. Washington, D.C. http://www.fta.dot.gov/documents/FTA_Noise_and_Vibration_Manual.pdf
Fernandez-Juricic, E. (2001). Avian spatial segregation at edges and interiors of urban parks in Madrid, Spain, Biodivers. Conserv. 10, 1303-1316.
Ferris, C. R. (1979). Effects of Interstate 95 on breeding birds in northern Maine. J. Wildl. Manage. 43, 421-427.
Ficken, R. W., Popp, J. W., and Mattiae, P. E. (1985). Avoidance of acoustic interference by ovenbirds. Wilson Bull. 97, 569-571.
Fish and Wildlife Service (2006). Estimating the effects of auditory and visual disturbances to Northern Spotted Owls and Marbled Murllets in Northeastern California.
Fletcher, J. L., and Busnel, R. G. (1978). Effects of Noise on Wildlife. (Academic Press, New York).
Foppen, R., and Reijnen, R. (1994). The effects of car traffic on breeding bird populations in woodland. II. Breeding dispersal of male willow warblers (Phylloscopus trochilus) in relation to the proximity of a highway. J. Appl. Ecol. 31, 95-101.
Forman, R. T. T., Reineking, B., and Hersperger, A. M. (2002). Road traffic and nearby grassland bird patterns in a suburbanizing landscape. Environ. Manage. 29, 782-800.
Forman, et al (2003) Road Ecology: Science and Solutions. (Island Press, Washington) Gleich, O., Dooling, R. J., and Manley, G. A. (2005). Audiogram, body mass, and basilar papilla
length: correlations in birds and predictions for extinct archosaurs. Naturwissenschaften. 92, 595.
Gleich, O., and Manley, G. A. (2000). The hearing organ of birds and crocodilian. In: Comparative Hearing: Birds and Reptiles. edited by R. J. Dooling, A. N. Popper, and R. R. Fay (Springer-Verlag, New York), pp. 70-138.
Greenwood, D. D. (1961b). Critical bandwidth and the frequency coordinates of the basilar membrane. J. Acoust. Soc. Am. 33, 1344-1356.
Greenwood, D. D. (1961a). Auditory masking and the critical band. J. Acoust. Soc. Am. 33, 484-502.
Goerdel-Leich A., and Schwartzkopff, J. (1984). The auditory threshold of the pigeon (Columbia livia) by heart-rate conditioning, Naturwissenschaften. 71, S98.
Harrison, J. B., and Furumoto, L. (1971). Pigeon audiograms: comparison of evoked potential and behavioral thresholds in individual birds, J. Aud. Res. 11, 3342.
Harison, R. T. (1978). Quantifying the acoustic dose when determining the effects of noise on wildlife. In: Effects of Noise on Wildlife, edited by JL Fletcher and RG Busnel (Academic Press, New York), pp. 267-285.
Hashino, E., and Okanoya, K. (1989) Auditory sensitivity in the zebra finch (Poephila guttata castanotis),. J. Acoust. Soc. Jpn. 10, 1-2.

Page 58 of 74
Hashino, E., Sokabe, M., and Miyamoto, K. (1988). Frequency specific susceptibility to acoustic trauma in the budgerigar. J. Acoust. Soc. Am. 83, 2450-2452.
Hashino, E., and Sokabe, M. (1989). Hearing loss in the budgerigar (Melopsittacus undulatus). J. Acoust. Soc. Am. 85, 289-294.
Hassal, J. R., and Zaveri, K. (1979). Acoustic Noise Measurements. 2nd ed. (Naerum: Bruel & Kjoer Publication, City).
Hastings, M. C., and Popper, A. N. (2005). Effects of Sound on Fish. California Department of Transportation Contract 43A0139 Task Order 1.
Heise, G. A. (1953). Auditory thresholds in the pigeon. Am. J. Psychol. 66, 1-19. Henderson, D., and Hamernik, R. P. (1986). Impulse noise: critical review, J. Acoust. Soc. Am.
80, 569-84. Hienz, R. D., and Sachs, M. B. (1987). Effects of noise on pure-tone thresholds in blackbirds
(Agelaius phoeniceus and Molothrus ater) and pigeon (Columbia livid). J. Comp. Psychol. 101, 16-24.
Hienz, R. D., Sinnott, J. M., and Sachs, M. B. (1977). Auditory sensitivity of the redwing blackbird and the brown-headed cowbird. J. Comp. Physiol. Psychol. 91, 1365-1376.
Holland, J., Dabelsteen, T., and Pedersen, S. B. (1998). Degradation of wren troglodytes troglodytes song: Implications for information transfer and ranging. J. Acoust. Soc. Am. 103, 2154-2166.
Hultsch, H., and Todt, D. (1996). Rules of parameter variation in homotype series of birdsong can indicate a ‘sollwert’ significance. Behav. Process. 38, 175-182.
Kaseloo, P. (2004). Synthesis of Noise Effects on Wildlife Populations. U.S. Department of Transportation FHWA-HEP-06-016.
Katti, M., and Warren, P. S. (2004) Research Focus: Tits, noise, and urban bioacoustics, Trends Ecol. Evol. 19, 109-110.
Kuitunen, M., Rossi, E., and Stenroos, A. (1998). Do highways influence density of land birds? Environ. Manage. 22, 297–302.
Klump, G. M., Kretzschmar, E., and Curio, E. (1986). The hearing of an avian predator and its avian prey. Behav. Ecol. Sociobiol. 18, 317-323.
Konishi, M. (1969). Time resolution by single auditory neurones in birds. Nature. 222, 566-567. Konishi, M. (1970). Comparative neurophysiological studies of hearing and vocalizations on
song birds. Z. Vgl. Physiol. 66, 257-272. Konishi, M., and Knudsen, E. I. (1979). The oilbird: hearing and echolocation. Science. 204,
425-427. Kuhn, A., Muller, C. M., Leppelsack, H.-J., and Schwartzkopff, J. (1982). Heart rate
conditioning used for determination of auditory thresholds in the starling, Naturwissenschaften. 69, 245-256.
Kuitunen, M., Rossi, E., and Stenroos, A. (1998). Do highways influence density of land birds? Environ. Manage. 22, 297-302.
Langemann, U., Gauger, B., and Klump, G. M. (1998). Auditory sensitivity in the great tit: perception of signals in the presence and absence of noise. Anim. Behav. 56, 763-769.
Lee, C. S. Y., and Fleming, G. G. (1996). Measurement of Highway-Related Noise. Federal Highway Administration, FHWA-PD-96-046, U. S. Department of Transportation, DOT-VNTSC-FHWA-96-5. http://www.volpe.dot.gov/acoustics/docs/1990-1999/1996-2.pdf.
Lengagne, T., Aubin, T., Lauga, J., and Jouventin, P. (1999). How do king penguins (Aptenodytes patagonicus) apply the mathematical theory of information to communicate in windy conditions? Proc. R. Soc. Lond. Ser. B Biol. Sci. 266, 1623-1628.
Page 59 of 74
Linzenbold, A., Dooling, R. J., and Ryals, B. M. (1993). A behavioral audibility curve for the japanese quail (Coturnix cotumixjaponica). Paper presented at midwinter meeting of the Association for Research in Otolaryngology, St. Petersburg, FL.
Llacuna, S., Gorriz, A., Riera M., and Nadal J. (1996). Effects of air pollution on hematological parameters in passerine birds. Arch. Environ. Contam. Toxicol. 31, 148-152.
Lohr, B., Lauer, A., Newman, M. and Dooling, R. J. (2004). Hearing in the red-billed firefinch and the spanish Timbrado canary: implications of vocal production for auditory perception. Bioacous. 14, 83-98.
Lohr, B., Wright, T.F., and Dooling, R.J. (2003). Detection and discrimination of natural calls in masking noise by birds: estimating the active space signal. Anim. Behav. 65, 763-777.
Luz, G. A., and Hodge, D. C. (1971). Recovery from impulse-noise induced TTS in monkeys and men: a descriptive model. J. Acoust. Soc. Am. 49, 1770-1777.
Maiorana, V. A., and Schleidt, W. M. (1972). The auditory sensitivity of the turkey. J. Aud. Res. 12, 203-207.
Manabe, K. (1997). Vocal plasticity in budgerigars: various modifications of vocalization by operant condition. Biomed. Res. 18, 125-132.
Manabe, K., Sadr, E. I., and Dooling, R. J. (1998). Control of vocal intensity in budgerigars (Melopsittacus undulatus): differential reinforcement of vocal intensity and the Lombard effect. J. Acoust. Soc. Am. 103, 1190-1198.
Manley, G. A., Koppi, C., and Yates, G. K. (1997). Activity of primary auditory neurons in the cochlear ganglion of the emu Dromaius novaehollandiae: spontaneous discharge, frequency tuning, and phase locking. J. Acoust. Soc. Am. 101, 1560-1573.
Marten, K., and Marler, P. (1977). Sound transmission and its significance for animal vocalization. 1. Temperate habitats. Behav. Ecol. Sociobiol. 2, 271-290.
Mathevon, M., Aubin, T., and Dabelsteen, T. (1996). Song degradation during propagation: importance of song post for the wren Troglodytes troglodytes. Ethology 102, 397-412.
McFadden, E. A., and Saunders, J. C. (1989). Recovery of auditory function following intense sound exposure in the neonatal chick. Hear. Res. 41, 205-215.
Miller, J. D. (1974). Effects of noise on people. J. Acoust. Soc. Am. 56, 729-763. Morton, E. S. (1975). Ecological sources of selection on avian sounds. Am. Nat. 109, 17-34. National Institutes of Health (NIH). (1990). Noise and Hearing Loss. NIH Consensus Statement
January 22-24, 1990, 8, 1-24 (available at: http://consensus.nih.gov/cons/076/076_statement.htm).
Nieboer, E., and Van der Paardt, M. (1977). Hearing of the African wood owl Strix woodfordii. Neth. J. Zool. 27, 227-229.
Niemiec, A. J., Raphael, Y., and Moody, D. B. (1994). Return of auditory function following structural regeneration after acoustic trauma: behavioral measures from quail. Hear Res. 79, 1-16.
Noirot, I., Brittan-Powell, E. F., Dooling, R. J., and Montgomery, L. (2006). A comparison of behavioral and auditory brainstem response measurements of absolute and masked auditory thresholds in three species of birds. Paper presented at the June meeting of the Acoustical Society of America, Providence, RI.
Ohrstrom, E., and Bjorkman, M. (1983) Sleep disturbance before and after traffic noise attenuation in an apartment building. J. Acoust. Soc. Am. 73, 877-879.
Ohrstrom, E., and Rylander, R. (1982). Sleep disturbance effects on traffic noise-a laboratory study on after effects. J. Sound Vib. 84, 87.

Page 60 of 74
Okanoya, K., and Dooling, R. J. (1985). Colony differences in auditory thresholds in the canary. J. Acoust. Soc. Am. 7, 170-176.
Okanoya, K., and Dooling, R. J. (1987). Hearing in passerine and psittacine birds: a comparative study of masked and absolute auditory thresholds. J. Comp. Psychol. 101, 7-15.
Okanoya, K., and Dooling, R. J. (1988). Hearing in the swamp sparrow (Melospiza georgiana) and the song sparrow (Melospiza melodia). Anim. Behav. 36, 726-732.
Osada, Y. (1991). Comparison of community reactions to traffic noise. J. Sound Vib. 151, 479-486.
Osmanski, M. S., and Dooling, R. J. (2006). Auditory feedback of vocal production in budgerigars using earphones. Paper presented at the June meeting of the Acoustical Society of America, Providence, RI.
Ouis, D. (2001). Annoyance from road traffic noise: a review. J. Environ. Psychol. 21, 101-120. Pearsons, K. S., Barber, D. S., Tabachnik, B. D., and Fidell, S. (1995). Predicting noise-induced
sleep disturbance. J. Acoust. Soc. Am. 97, 331-338. Peris, S. J., and Pescador, M. (2004). Effects of traffic noise on passerine populations in the
Mediterranean wood pastures. Appl. Acoust. 65, 357-366. Pettigrew, J. D., and Larsen, O. N. (1990). Directional hearing in the plains-wanderer,
Pedionomus torquatus. In Information Processing in Mammlaim Auditory and Tactile Systems edited by M. Rowe and L. Aitkin(Wiley-Liss, New York), pp179-190.
Popp, J. W., and Ficken, R. W. (1987). Effects of non-specific singing on the song of the ovenbird. Bird Behav. 7, 22-26.
Popp, J. W., Ficken, R. W., and Reinartz, J. A. (1985). Short-term temporal avoidance of interspecific acoustic interference among forest birds. Auk. 102, 744-748.
Popper, A. N., and Fay, R. R. (1999). The auditory periphery in fishes. In: Comparative Hearing: Fish and Amphibians, edited by R. R. Fay and A. N. Popper (Springer-Verlag, New York), pp. 43-100.
Potash, L. M. (1972). Noise-induced changes in calls of the Japanese quail. Psychon. Sci. 26, 252-254.
Price, G. R. (1979). Loss of auditory sensitivity following exposure to spectrally narrow impulses. J. Acoust. Soc. Am. 66, 456-465.
Pugliano, F. A., Pribitikin, E., Adler, H. J., and Saunders, J. C. (1993) Growth of evoked potential amplitude in neonatal chicks exposed to intense sound. Acta Otolaryngol. 113, 18-25.
Reijnen, M. J. S. M., Veenbaas, G., and Foppen, R. P. B. (1995). Predicting the Effects of Motorway Traffic on Breeding Bird Populations. Ministry of Transport and Public Works, Delft, The Netherlands.
Reijnen, R., and Foppen, R. (1994). The effects of car traffic on breeding bird populations in woodland I. Evidence of reduced habitat quality for willow warblers (Phylloacopus trochilus) breeding close to a highway. J. Appl. Ecol. 31, 85-94.
Reijnen, R., and Foppen, R. (1995). The effects of car traffic on breeding bird populations in woodland. IV. Influence of population size on the reduction of density close to the highway. J. Appl. Ecol. 32, 481-491.
Reijnen, R., Foppen, R., ter Braak, C., and Thissen, J. (1995). The effects of car traffic on breeding bird populations in Woodland. III. Reduction of density in relation to the proximity of main roads. J. Appl. Ecol. 32, 187-202.

Page 61 of 74
Ryals, B. M., Dooling, R. J., Westbrook, E., Dent, M. L., MacKenzie, A., and Larsen, O. N. (1999). Avian species differences in susceptibility to noise exposure. Hear. Res. 131, 71-88.
Ryan, M. J., and Brenowitz, E. A. (1985). The role of body size, phylogeny, and ambient noise in the evolution of bird song. Am. Nat. 126, 87-100.
Saunders, J. C., Cohen, Y. E., and Szymko, Y. M. (1991). The structural and functional consequences of acoustic injury in the cochlea and peripheral auditory system: a five year update. J. Acoust. Soc. Am. 90, 136-146.
Saunders, J. C., Duncan, R. K., Doan, D. E., and Werner, Y. L. (2000). The middle ear of reptiles and birds. In: Comparative Hearing: Birds and Reptiles, edited by R. J. Dooling, A. N. Popper, and R. R. Fay (Springer-Verlag, New York), pp. 13-69.
Saunders, J.C., and Dooling, R. J. (1974). Noise-induced threshold shift in the parakeet (Melopsittacus undulatus). Proc. Nat. Acad. Sci. USA 71, 1962-1965.
Saunders, J. C., and Pallone, R. L. (1980). Frequency selectivity in the parakeet studied by isointensity masking contours. J. Exp. Biol. 87, 331-342.
Saunders, J. C., Rintelmann, W. F., and Bock, G. (1979). Frequency selectivity in bird and man: a comparison among critical ratios, critical bands, and psychophysical tuning curves. Hear. Res. 1, 303-323.
Saunders, J. C., and Salvi, R. J. (1993). Psychoacoustics of Normal adult chickens: thresholds and temporal integration. J. Acoust. Soc. Am. 94, 83-90.
Saunders, J. C., Torsiglieri, A. J., and DeDio, R. M. (1993). The growth of hearing loss in neonatal chicks exposed to intense pure tones. Hear. Res. 69, 25-34.
Schwartzkopff, J. (1949). Uber Sitz und Leistung von Gehor und Vibrationssinn bei Vogeln. Z Vgl. Physiol. 31, 527-603.
Schultz, T.J. (1978). Synthesis of social surveys on noise annoyance. J. Acoust. Soc. Am. 64(2), 377-405.
Slabbekoorn, H. (2004). Habitat-dependent ambient noise: consistent spectral profiles in two African forest types. J. Acoust. Soc. Am. 116, 3727-3733.
Slabbekoorn, H., and Peet, M. (2003). Birds sing at a higher pitch in urban noise. Nature. 424, 267.
Slabbekoorn, H., and Smith, T. B. (2002). Habitat-depended song divergence in the little greenbul: an analysis of environmental selection pressures on acoustic signals. Evolution. 56, 1849-1858.
Smith, C. A. (1985). Inner ear. In: Form and Function in Birds. Vol. 3, edited by A. S. King and J. McLelan (Academic Press, London), pp. 273-310.
Stebbins, W. C. (1970). Studies of hearing and hearing loss in the monkey. In: Animal Psychophysics: The Design and Conduct of Sensory Experiments, edited by W. C. Stebbins (Appleton, New York), pp. 41-66.
Stone, E. (2000). Separating the noise from the noise: a finding in support of the Niche Hypothesis, that birds are influenced by human-induced noise in natural habitats. Anthrozoos. 13, 225-231.
Tanaka, K., and Smith, C. A. (1978). Structure of the chicken's inner ear: SEM and TEM study. Am. J. Anat. 153, 251-271.
Transportation Noise Control Center (TNCC), Caltrans Environmental Engineering (1997). Environmental Effects of Transportation Noise. A Case Study: Noise Criteria for the Protection of Endangered Passerine Birds. TNCC Technical Report 97001.
Page 62 of 74
Trainer, J. E. (1946). The Auditory Acuity of Certain Birds. PhD thesis, Cornell University, Ithaca, NY.
Van der Zande, A. N., ter Keurs, W. J., and Van Der Weijden, W. J. (1980). The impact of roads on the densitives of four bird species in an open field habitat: evidence of a long distance effect. Biol. Conserv. 18, 299-312.
Van Dijk, T. (1973). A comparative study of hearing in owls of the family Strigidae. Neth. J. Zool. 23, 131-167.
von Gierke, H. E., and Eldred, K. M. (1993). Effects of noise on people. Noise/News Int. 1, 67-89.
Warren, P. S., Katti, M. K., Ermann, M., and Brazel, A. (2006). Urban bioacoustics: it’s not just noise. Anim. Behav. 71, 491-502.
Wasserman, F. E. (1977). Intraspecific acoustical interference in the white-throated sparrow Zonotrichia albicollis. Anim. Behav. 25, 949-952.
Watts, G. R. (1996). Perception of exterior noise from traffic running on concrete and bituminous road surfacings. J. Sound Vib. 191, 415-430.
Wiley, R. H., and Richards, D. G. (1982). Adaptations for acoustic communications in birds: sound transmission and signal detection. In: Acoustic Communication in Birds, Vol. I, edited by D. E. Kroodsma and E. H. Miller (Academic Press, New York), pp. 131-181.
Wright, T. F., Dooling, R. J., Cortopassi, K. A., and Bradbury, J. (2000). Hearing and vocalizations in the orange-fronted conure (Aratinga Canicularis), a small parrot. Paper presented at the 139th meeting of the Acoustical Society of America, Atlanta, GA.

Page 63 of 74
Appendix A: Glossary of Terms Used
Audiogram – A measure of hearing sensitivity, or threshold, at each frequency in the hearing
range of an animal or human. Auditory Brainstem Response (ABR) – A physiological method to determine hearing
bandwidth and sensitivity of animals without training. Electrodes (wires) are placed on the head of the animal just outside of the base of the brain (brainstem) to record electrical signals (emitted by the brain) in response to sounds that are detected by the ear. These signals are averaged and used to determine if the animal has detected the sound. It is possible to determine auditory thresholds for fishes using this method. The same method is used for numerous other species, including measurement of hearing capabilities of newborn human babies.
Auditory Threshold – The lowest detectable sound, generally at a specific frequency. Most
often, thresholds are the level at which a signal is detected some per cent of the time – often 50% or 70%. Absolute thresholds are the lowest level of signal that is detectable when there is no background (masking) noise.
Bandwidth – The range of frequencies over which a sound is produced or received. Basilar papilla – The auditory region of the inner ear of birds. Often referred to as the avian
cochlea since it may be evolutionarily related to the mammalian hearing organ, the cochlea.
Broadband - Defined as noise that covers a wide range of frequencies relative to which the ear
is sensitive. In contrast, narrowband noise covers only a limited number of (contiguous) frequencies. In relation to bird or human hearing, for instance, a broadband noise might contain sound energy from 100 to 10,000 Hz, whereas a narrowband noise may contain sound energy from 500 to 550 Hz.
Critical Ratio – Defined as the ratio of the intensity of a pure tone to the intensity per hertz of a
noise (i.e., the spectrum level) at a listener’s threshold. For example, if a listener can just hear a 60 dB pure tone against a background of noise whose spectrum level is 40 dB, the listener’s critical ratio is said to be 20 dB. In fact, the human critical ratio at 2 kHz is approximately 20 dB.
Conspecific – Members of the same species. Decibel (dB) – A customary scale most commonly used (in various ways) for reporting levels of
sound. A difference of 10 dB corresponds to a factor of 10 in sound power. The actual sound measurement is compared to a fixed reference level and the "decibel" value is defined to be 10 log10,(actual/reference), where (actual/reference) is a power ratio. Because sound power is usually proportional to sound pressure squared, the decibel value for sound pressure is 20log10 (actual pressure/reference pressure). As noted above, the standard reference for underwater sound pressure is 1 micro-Pascal (µPa). The dB
Page 64 of 74
symbol is followed by a second symbol identifying the specific reference value (i.e., re 1 µPa).
Effects - In this document, we have defined “effect” to mean any response by birds to highway
noise. Our definition does not invoke or imply regulatory definitions of “effect,” as found in any law or regulation affecting birds.
Frequency spectrum – See Spectrum. Hertz – The units of frequency where 1 hertz = 1 cycle per second. The abbreviation for hertz is
“Hz.” Impulse sound – Transient sound produced by a rapid release of energy, usually electrical or
chemical such as circuit breakers or explosives. Impulse sound has extremely short duration and extremely high peak sound pressure.
Noise – Generally an unwanted sound. Noise is often in the “ear of the beholder” in that a signal
may be an important sound to one listener and unwanted “noise” to another. Noise Level -- The noise power, usually relative to a reference level . Noise level is usually
measured in decibels (dB) for relative power or picowatts for absolute power. Levels are represented in dB to denote specific aspects of the measurement and to also indicate the reference base or specific aspects of the measurement. Most frequently, sound levels for birds are referenced in terms of dB or weighed as dBa.
Octave –An octave is any band where the highest included frequency is exactly two times the
lowest included frequency. For example, the frequency band that covers all frequencies between 707 Hz and 1,414 Hz is an octave band.
Otolithic organs – The end organs in the vertebrate ear (saccule, utricle, lagena) that are
associated with determination of head position relative to gravity. Along with the semicircular canals, these make up the vertebrate vestibular system.
Passeriformes – Song birds. Permanent threshold shift (PTS) – A permanent loss of hearing caused by some kind of
acoustic or drug trauma. PTS results in irreversible damage to the sensory hair cells of the ear, and thus a permanent loss of hearing.
Power Spectrum – “For a given signal, the power spectrum gives a plot of the portion of a
signal's power (energy per unit time) falling within given frequency bins. The most common way of generating a power spectrum is by using a discrete Fourier transform, but other techniques such as the maximum entropy method can also be used.”19
19 From: http://mathworld.wolfram.com/PowerSpectrum.html

Page 65 of 74
Semicircular canals – Three canals in the vertebrate ear that are mutually perpendicular to one another. They are involved in the detection of angular acceleration of the head, and provide the brain with information about movement of the head (and body). They care critically important to help maintain fixed gaze of the eyes on an object, even as the head moves. The semicircular canals and the otolithic organs make up the vestibular part of the ear.
Sensory hair cells – The cells in the basilar papilla and other end organs of the ear that are
responsible for converting (transducing) mechanical energy of sound to signals that can stimulate the nerve from the ear to the brain (eighth cranial nerve).
Sound pressure level (SPL) – The sound pressure level or SPL is an expression of the sound
pressure using the decibel (dB) scale and the standard reference pressures 20 µPa for air and other gases.
Spectrum level – The intensity level of a sound within a 1 Hz band. Spectrum (Spectra) – A graphical display of the contribution of each frequency component
contained in a sound. Temporary threshold shift (TTS) – Temporary loss of hearing as a result of exposure to sound
over time. Exposure to high levels of sound over relatively short time periods will cause the same amount of TTS as exposure to lower levels of sound over longer time periods. The mechanisms underlying TTS are not well understood, but there may be some temporary damage to the sensory hair cells. The duration of TTS varies depending on the nature of the stimulus, but there is generally recovery of full hearing over time.
Threshold - The threshold generally represents the lowest signal level an animal will detect in
some statistically predetermined percent of presentations of a signal. Most often, the threshold is the level at which an animal will indicate detection 50% of the time. Auditory thresholds are the lowest sound levels detected by an animal at the 50% level.
Weighting -- An electronic filter which has a frequency response corresponding approximately
to that of human hearing. Human hearing is most sensitive to sounds from about 500 Hz to 4000 Hz, and less sensitive at lower and higher frequencies. The overall level of a sound is usually expressed in terms of dBA and this is generally measured using a sound level meter with an “A-weighting” filter. The level of a sound in dBA is a good measure of the loudness of that sound. Different sources having the same dBA level generally sound about equally loud.

Page 66 of 74
Appendix B: Complete Table of all Behavioral Studies of Hearing in Birds
Order Common Name Genus and Species References Anseriformes Mallard Duck Anas platyrhynchos Trainer 1946 Apodiformes Australian Grey Swiftlet Collocalia Spodiopygia Coles et al. 1987 Caprimulgiformes Oilbird Steatornis caripensis Konishi and Knudsen 1979 Casuariiformes Emu Dromaius novaehollandiae Manley et al. 1997 Charadriiformes Plains Wanderer Pedionomus torquatus Pettigrew and Larsen 1990
Columbiformes Pigeon Columbia livia
Trainer 1946; Heise 1953; Stebbins 1970; Harrison and Furumoto 1971; Hienz et al. 1977; Goerdel-Leich and Schwartzkopff 1984
Falconiformes American Kestrel Falco sparverius Trainer 1946 Falconiformes European Sparrowhawk Accipiter nisus Trainer 1946; Klump et al. 1986 Galliformes Bobwhite Quail Colinus virgianus Barton et al. 1984
Galliformes Chicken Gallus gallus Saunders and Salvi 1993; Gray and Rubel 1985
Galliformes Japanese Quail Coturnix coturnix japonica Linzenbold et al. 1993; Niemiec et al. 1994
Galliformes Turkey Meleagris gallopavo Maiorana and Schleidt 1972 Passeriformes American Robin Turdus migratorius Konishi 1970 Blue Jay Cyanocitta cristata Cohen et al. 1978 Brown-headed Cowbird Molothrus ater Hienz et al. 1977 Bullfinch Pyrrhula pyrrhula Schwartzkopff 1949 Chipping Sparrow Spizella passerina Konishi 1970 Common Canary Serinus canarius Okanoya and Dooling 1985; 1987 Common Crow Corvus brachyrhynchos Trainer 1946
European Starling Sturnus vulgaris Kuhn et al. 1982; Dooling et al. 1986; Trainer 1946; Konishi 1970
Field Sparrow Spizella pusilla Dooling et al. 1979 Fire Finch Lagonosticta senegala Lohr and Dooling 1999
Great Tit Parus major Langemann et al. 1998; Klump et al. 1986
House Finch Carpodacus mexicanus Dooling et al. 1978 House Sparrow Passer domesticus Konishi 1970 Pied Flycatcher Ficedula hypolueca Aleksandrov and Dmitrieva 1992 Red-winged Blackbird Agelaius phoeniceus Hienz et al. 1977 Slate-colored Junco Junco hyemalis Konishi 1970 Song Sparrow Melospiza melodia Okanoya and Dooling 1987; 1988 Swamp Sparrow Melospiza georgiana Okanoya and Dooling 1987; 1988 Western Meadowlark Sturnella neglecta Konishi 1970
Zebra Finch Taeniopygia guttata Okanoya and Dooling 1987; Hashino and Okanoya 1989
Psittaciformes Bourke's Parrot Neophema bourkii Dooling et al. Unpublished Data
Budgerigar Melopsittacus undulatus
Saunders and Dooling 1974; Dooling and Saunders 1975a; Saunders et al. 1979; Saunders and Pallone 1980; Okanoya and Dooling 1987; Hashino et al. 1988; Hashino and Sokabe 1989
Cockatiel Nymphicus hollandicus Okanoya and Dooling 1987 Orange-Fronted conureq Aratinga canicularis Wright et al. 2000 Strigiformes African Wood Owl Strix woodfordii Nieboer and Van der Paardt 1977 Barn Owl Tyto alba Konishi 1973; Dyson et al. 1998
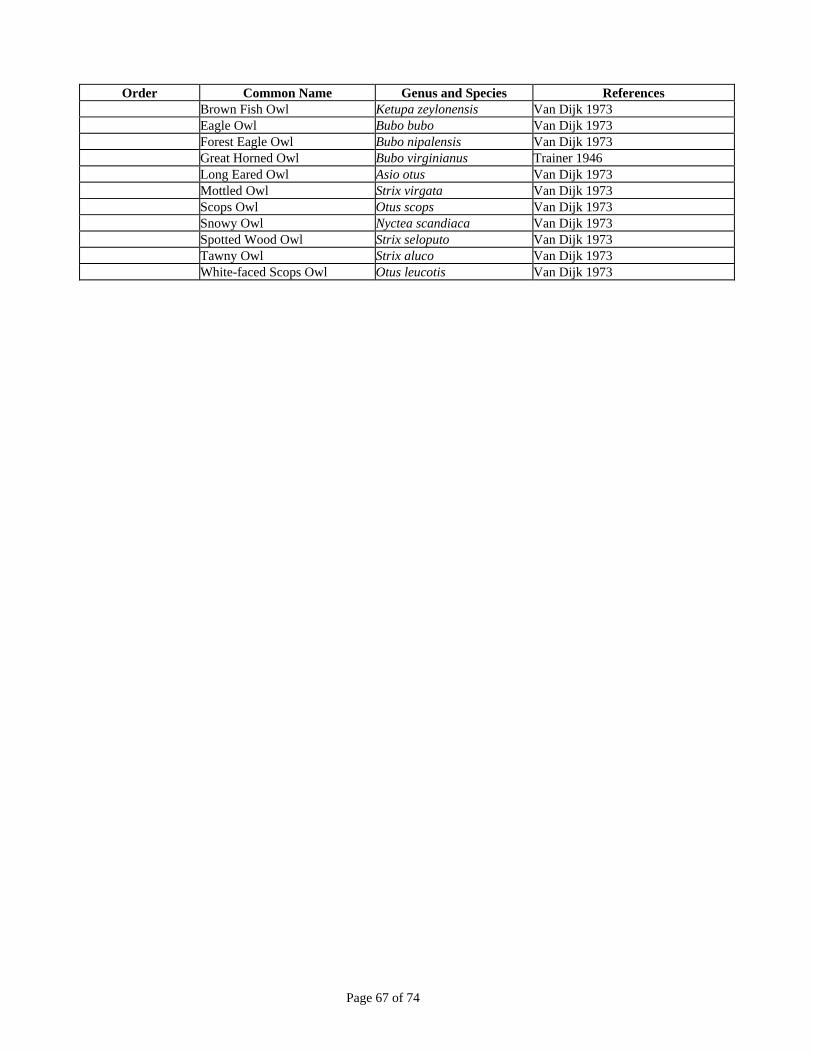
Page 67 of 74
Order Common Name Genus and Species References Brown Fish Owl Ketupa zeylonensis Van Dijk 1973 Eagle Owl Bubo bubo Van Dijk 1973 Forest Eagle Owl Bubo nipalensis Van Dijk 1973 Great Horned Owl Bubo virginianus Trainer 1946 Long Eared Owl Asio otus Van Dijk 1973 Mottled Owl Strix virgata Van Dijk 1973 Scops Owl Otus scops Van Dijk 1973 Snowy Owl Nyctea scandiaca Van Dijk 1973 Spotted Wood Owl Strix seloputo Van Dijk 1973 Tawny Owl Strix aluco Van Dijk 1973 White-faced Scops Owl Otus leucotis Van Dijk 1973
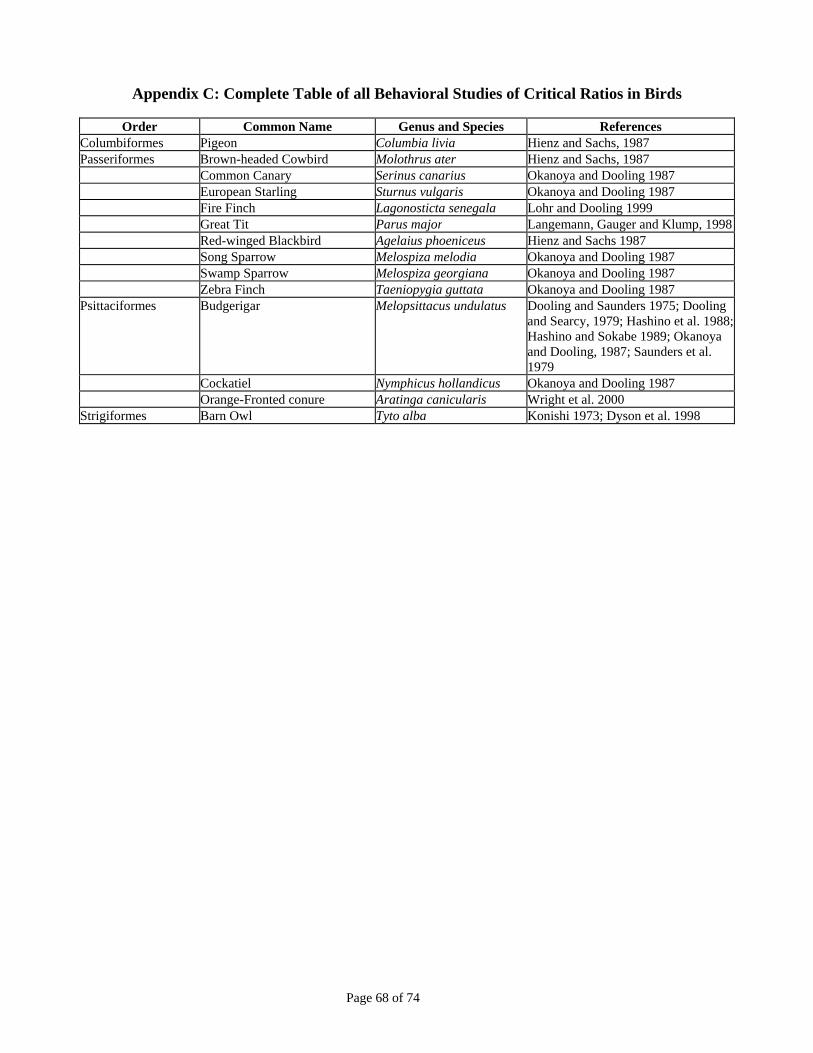
Page 68 of 74
Appendix C: Complete Table of all Behavioral Studies of Critical Ratios in Birds
Order Common Name Genus and Species References Columbiformes Pigeon Columbia livia Hienz and Sachs, 1987 Passeriformes Brown-headed Cowbird Molothrus ater Hienz and Sachs, 1987 Common Canary Serinus canarius Okanoya and Dooling 1987 European Starling Sturnus vulgaris Okanoya and Dooling 1987 Fire Finch Lagonosticta senegala Lohr and Dooling 1999 Great Tit Parus major Langemann, Gauger and Klump, 1998 Red-winged Blackbird Agelaius phoeniceus Hienz and Sachs 1987 Song Sparrow Melospiza melodia Okanoya and Dooling 1987 Swamp Sparrow Melospiza georgiana Okanoya and Dooling 1987 Zebra Finch Taeniopygia guttata Okanoya and Dooling 1987 Psittaciformes Budgerigar Melopsittacus undulatus Dooling and Saunders 1975; Dooling
and Searcy, 1979; Hashino et al. 1988; Hashino and Sokabe 1989; Okanoya and Dooling, 1987; Saunders et al. 1979
Cockatiel Nymphicus hollandicus Okanoya and Dooling 1987 Orange-Fronted conure Aratinga canicularis Wright et al. 2000 Strigiformes Barn Owl Tyto alba Konishi 1973; Dyson et al. 1998

Page 69 of 74
Appendix D: Fundamentals of Highway Traffic Noise
(Provided by Jones and Stokes)
Fundamentals of Traffic Noise The following is a brief discussion of fundamental traffic-noise concepts. For a detailed discussion, please refer to the Technical Noise Supplement (Caltrans 1998b) available on the Caltrans Web site (http://www.dot.ca.gov/hq/env/).20
Sound, Noise, and Acoustics Sound is a disturbance that is created by a moving or vibrating source in a gaseous or liquid medium or the elastic stage of a solid and that is capable of being detected by the hearing organs. Sound can be described as the mechanical energy of a vibrating object transmitted by pressure waves through a medium to a hearing organ, such as a human ear. For traffic sound, the medium of concern is air. Noise is defined as loud, unpleasant, unexpected, or undesired sound. Sound is actually a process that consists of three components: the sound source, the sound path, and the sound receiver. All three components must be present for sound to exist. Without a source to produce sound or a medium to transmit sound-pressure waves, there is no sound. Sound must also be received; a hearing organ, sensor, or object must be present to perceive, register, or be affected by sound or noise. In most situations, there are many different sound sources, paths, and receivers, not only one of each. Acoustics is the field of science that deals with the production, propagation, reception, effects, and control of sound.
Frequency and Hertz A continuous sound can be described by its frequency (pitch) and its amplitude (loudness). Frequency relates to the number of pressure oscillations per second. Low-frequency sounds are low in pitch, like the low notes on a piano, whereas high-frequency sounds are high in pitch, like the high notes on a piano. Frequency is expressed in terms of oscillations, or cycles, per second. Cycles per second are commonly referred to as Hertz (Hz) (e.g., a frequency of 250 cycles per second is referred to as 250 Hz). High frequencies are sometimes more conveniently expressed in kilo-Hertz (kHz), or thousands of Hertz. The extreme range of frequencies that can be heard by the healthiest human ears spans from 16–20 Hz on the low end to about 20,000 Hz (20 kHz) on the high end.
Sound-Pressure Levels and Decibels
The amplitude of a sound determines its loudness. Loudness of sound increases and decreases with increasing and decreasing amplitude. Sound-pressure amplitude is measured in units of micro-Newtons per square meter (N/m2) , also called micro-Pascals (µPa). One µPa is approximately one-hundred billionth (0.00000000001) of normal atmospheric pressure. The pressure of a very loud sound may be 200 million ΦPa, or 10 million times the pressure of the weakest audible sound (20 µPa). Because expressing sound levels in terms of ΦPa would be cumbersome, sound-pressure level (SPL) is used to describe in logarithmic units the ratio of actual sound pressures to a reference pressure squared. These units are called bels, named after Alexander Graham Bell. To provide finer resolution, a bel is divided into 10 decibels (dB).
20 http://www.dot.ca.gov/hq/env/noise/pub/Technical%20Noise%20Supplement.pdf

Page 70 of 74
Addition of Decibels Because decibels are logarithmic units, SPL cannot be added or subtracted by ordinary arithmetic means. For example, if 1 automobile produces an SPL of 70 dB when it passes an observer, 2 cars passing simultaneously would not produce 140 dB; rather, they would combine to produce 73 dB. When two sounds of equal SPL are combined, they produce a combined SPL 3 dB greater than the original individual SPL. In other words, sound energy must be doubled to produce a 3-dB increase. If two sound levels differ by 10 dB or more, the combined SPL is equal to the higher SPL; the lower sound level would not increase the higher sound level.
A-Weighted Decibels SPL alone is not a reliable indicator of loudness. The frequency of a sound also has a substantial effect on how humans respond. Although the intensity (energy per unit area) of the sound is a purely physical quantity, the loudness or human response is determined by the characteristics of the human ear. Human hearing is limited in the range of audible frequencies as well as in the way it perceives the SPL in that range. In general, the healthy human ear is most sensitive to sounds from 1,000–5,000 Hz and perceives a sound within that range as being more intense than a sound of higher or lower frequency with the same magnitude. To approximate the frequency response of the human ear, a series of SPL adjustments is usually applied to the sound measured by a sound level meter. The adjustments, referred to as a weighting network, are frequency-dependent. The A-scale weighting network approximates the frequency response of the average young ear when listening to most ordinary sounds. When people make judgments of the relative loudness or annoyance of a sound, their judgments correlate well with the A-scale sound levels of those sounds. Other weighting networks have been devised to address high noise levels or other special problems (e.g., B-, C-, and D-scales), but these scales are rarely used in conjunction with highway-traffic noise. Noise levels for traffic-noise reports are typically reported in terms of A-weighted decibels (dBA) . In environmental noise studies, A-weighted SPLs are commonly referred to as noise levels. Table 1 shows typical A-weighted noise levels.
Human Response to Changes in Noise Levels Under controlled conditions in an acoustics laboratory, the trained, healthy human ear is able to discern 1-dB changes in sound levels when exposed to steady, single-frequency (“pure-tone”) signals in the mid-frequency range. Outside such controlled conditions, the trained ear can detect 2-dB changes in normal environmental noise. However, it is widely accepted that the average healthy ear can barely perceive 3-dB noise level changes A 5-dB change is readily perceptible, and a 10-dB change is perceived as being twice or half as loud. As discussed above, doubling sound energy results in a 3-dB increase in sound; therefore, doubling sound energy (e.g., doubling the volume of traffic on a highway) would result in a barely perceptible change in sound level.
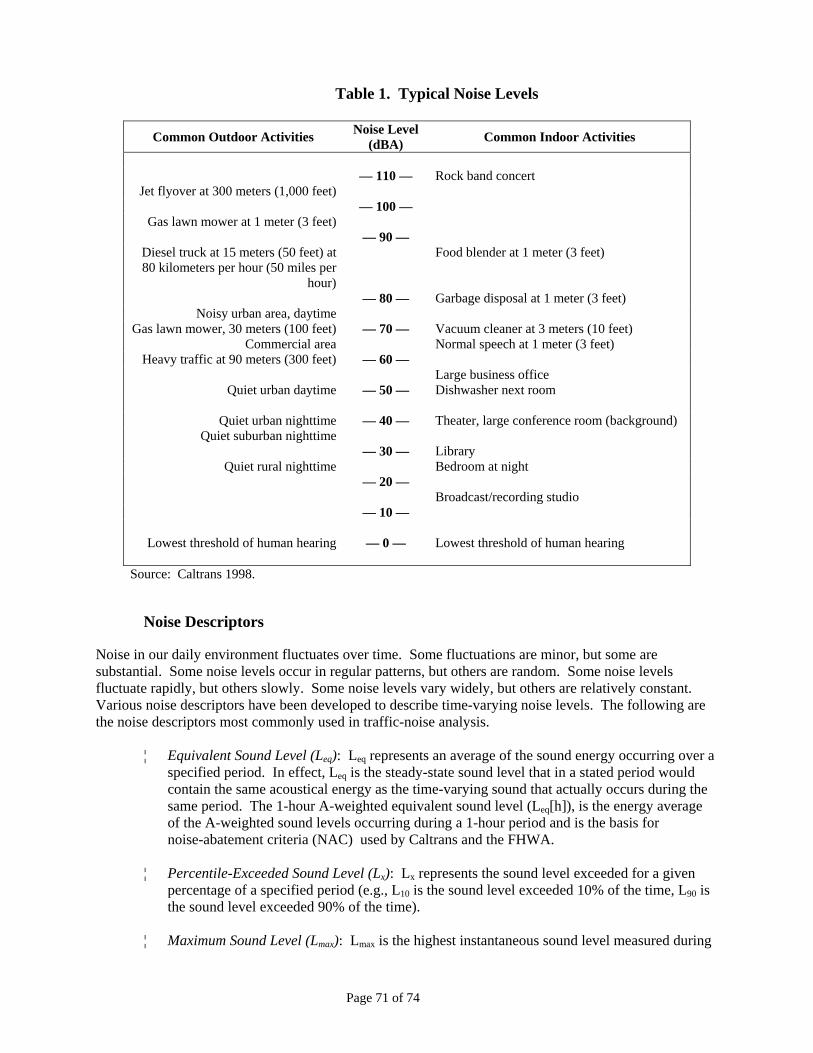
Page 71 of 74
Table 1. Typical Noise Levels
Common Outdoor Activities Noise Level (dBA) Common Indoor Activities
— 110 — Rock band concert
Jet flyover at 300 meters (1,000 feet) — 100 —
Gas lawn mower at 1 meter (3 feet) — 90 —
Diesel truck at 15 meters (50 feet) at 80 kilometers per hour (50 miles per
hour)
Food blender at 1 meter (3 feet)
— 80 — Garbage disposal at 1 meter (3 feet) Noisy urban area, daytime
Gas lawn mower, 30 meters (100 feet) — 70 — Vacuum cleaner at 3 meters (10 feet) Commercial area Normal speech at 1 meter (3 feet)
Heavy traffic at 90 meters (300 feet) — 60 — Large business office
Quiet urban daytime — 50 — Dishwasher next room
Quiet urban nighttime — 40 — Theater, large conference room (background) Quiet suburban nighttime
— 30 — Library Quiet rural nighttime Bedroom at night
— 20 — Broadcast/recording studio
— 10 —
Lowest threshold of human hearing — 0 — Lowest threshold of human hearing Source: Caltrans 1998.
Noise Descriptors Noise in our daily environment fluctuates over time. Some fluctuations are minor, but some are substantial. Some noise levels occur in regular patterns, but others are random. Some noise levels fluctuate rapidly, but others slowly. Some noise levels vary widely, but others are relatively constant. Various noise descriptors have been developed to describe time-varying noise levels. The following are the noise descriptors most commonly used in traffic-noise analysis.
¦ Equivalent Sound Level (Leq): Leq represents an average of the sound energy occurring over a
specified period. In effect, Leq is the steady-state sound level that in a stated period would contain the same acoustical energy as the time-varying sound that actually occurs during the same period. The 1-hour A-weighted equivalent sound level (Leq[h]), is the energy average of the A-weighted sound levels occurring during a 1-hour period and is the basis for noise-abatement criteria (NAC) used by Caltrans and the FHWA.
¦ Percentile-Exceeded Sound Level (Lx): Lx represents the sound level exceeded for a given
percentage of a specified period (e.g., L10 is the sound level exceeded 10% of the time, L90 is the sound level exceeded 90% of the time).
¦ Maximum Sound Level (Lmax): Lmax is the highest instantaneous sound level measured during
Page 72 of 74
a specified period. ¦ Day-Night Level (Ldn): Ldn is the energy average of the A-weighted sound levels occurring
during a 24-hour period with 10 dB added to the A-weighted sound levels occurring between 10 p.m. and 7 a.m.
¦ Community Noise Equivalent Level (CNEL): CNEL is the energy average of the A-weighted
sound levels occurring during a 24-hour period with 10 dB added to the A-weighted sound levels occurring between 10 p.m. and 7 a.m. and 5 dB added to the A-weighted sound levels occurring between 7 p.m. and 10 p.m.
Sound Propagation
When sound propagates over a distance, it changes in level and frequency content. The manner in which noise reduces with distance depends on the following factors.
¦ Geometric spreading: Sound from a small, localized source (i.e., a point source) radiates uniformly outward as it travels away from the source in a spherical pattern. The sound level attenuates (or drops off) at a rate of 6 dBA for each doubling of distance. Highway noise is not a single, stationary point source of sound. The movement of the vehicles on a highway makes the source of the sound appear to emanate from a line (i.e., a line source) rather than a point. This line source results in cylindrical spreading rather than the spherical spreading that results from a point source. The change in sound level from a line source is 3 dBA per doubling of distance.
¦ Ground absorption: The noise path between the highway and the observer is usually very
close to the ground. Noise attenuation from ground absorption and reflective-wave canceling adds to the attenuation associated with geometric spreading. Traditionally, the excess attenuation has also been expressed in terms of attenuation per doubling of distance. This approximation is done for simplification only because prediction results based on this scheme are sufficiently accurate for distances of less than 60 meters (200 feet). For acoustically hard sites (i.e., those sites with a reflective surface, such as a parking lot or a smooth body of water, between the source and the receiver), no excess ground attenuation is assumed. For acoustically absorptive or soft sites (i.e., those sites with an absorptive ground surface, such as soft dirt, grass, or scattered bushes and trees, between the source and the receiver), an excess ground-attenuation value of 1.5 dBA per doubling of distance is normally assumed. When added to the geometric spreading, the excess ground attenuation results in an overall drop-off rate of 4.5 dBA per doubling of distance for a line source and 7.5 dBA per doubling of distance for a point source.
¦ Atmospheric effects: Research by Caltrans and others has shown that atmospheric conditions
can have a significant effect on noise levels within 60 meters (200 feet) of a highway. Wind has been shown to be the most important meteorological factor within approximately 150 meters (500 feet) of the source, whereas vertical air-temperature gradients are more important for greater distances. Other factors such as air temperature, humidity, and turbulence also have significant effects. Receptors located downwind from a source can be exposed to increased noise levels relative to calm conditions, whereas locations upwind can have lower noise levels. Increased sound levels can also occur as a result of temperature inversion conditions (i.e., increasing temperature with elevation).
Page 73 of 74
¦ Shielding by natural or human-made features: A large object or barrier in the path between a noise source and a receiver can substantially attenuate noise levels at the receiver. The amount of attenuation provided by this shielding depends on the size of the object and the frequency content of the noise source. Natural terrain features (e.g., hills and dense woods) and human-made features (e.g., buildings and walls) can substantially reduce noise levels. Walls are often constructed between a source and a receiver specifically to reduce noise. A barrier that breaks the line of sight between a source and a receiver will typically result in at least 5 dB of noise reduction. A taller barrier may provide as much as 20 dB of noise reduction.
D. Federal and State Regulations, Standards, and Policies Federal and state regulations, standards, and policies relating to traffic noise are discussed in detail in the Protocol. A transportation project affected by the Protocol is referred to as type 1 project, which is defined in 23 CFR 772 as a proposed federal or federal-aid highway project for construction of a highway on a new location or the physical alteration of an existing highway that significantly changes the horizontal or vertical alignment or increases the number of through traffic lanes. The FHWA has clarified its interpretation of type 1 projects by stating that a type 1 project is any project that has the potential to increase noise levels at adjacent receivers. This includes projects to add interchange, ramp, auxiliary, or truck-climbing lanes to an existing highway. A project to widen an existing ramp by a full lane width is also considered to be a type 1 project. Caltrans extends this definition to include state-funded highway projects. The project alternatives evaluated in this report are considered to be a Type 1 project because they involve federal funding and adding lanes to the existing mainline highway. Applicable federal and state regulations, standards, and policies are discussed below.
National Environmental Policy Act
NEPA is a federal law that establishes environmental policy for the nation, provides an interdisciplinary framework for federal agencies to prevent environmental damage, and contains action-forcing procedures to ensure that federal agency decision-makers take environmental factors into account. Under NEPA, impacts and measures to mitigate adverse impacts must be identified, including impacts for which no mitigation or only partial mitigation is available. The FHWA regulations discussed below constitute the federal noise standard. Projects complying with this standard are also in compliance with the requirements stemming from NEPA.
Federal Highway Administration Regulations 23 CFR 772 provides procedures for conducting highway-project noise studies and implementing noise-abatement measures to help protect the public health and welfare, supply NAC, and establish requirements for information to be given to local officials for use in planning and designing highways. Under this regulation, noise abatement must be considered for a type 1 project if the project is predicted to result in a traffic-noise impact. A traffic-noise impact is considered to occur when the project results in a substantial noise increase or when the predicted noise levels approach or exceed NAC specified in the regulation. 23 CFR 772 does not specifically define what constitutes a substantial increase or the term approach; rather, it leaves interpretation of these terms to the states. Noise-abatement measures that are reasonable and feasible and likely to be incorporated into the project, as well as noise impacts for which no apparent solution is available, must be identified before adoption of the final environmental document for the project. Table 2 summarizes the FHWA’s NAC.

Page 74 of 74
Table 2. Activity Categories and Noise Abatement Criteria
Activity Category
NAC, Hourly A-Weighted Noise Level, dBA-Leq(h)
Description of Activities
A 57 Exterior
Lands on which serenity and quiet are of extraordinary significance and serve an important public need and where the preservation of those qualities is essential if the area is to continue to serve its intended purpose
B 67 Exterior
Picnic areas, recreation areas, playgrounds, active sport areas, parks, residences, motels, hotels, schools, churches, libraries, and hospitals
C 72 Exterior
Developed lands, properties, or activities not included in categories A or B above
D — Undeveloped lands
E 52 Interior
Residences, motels, hotels, public meeting rooms, schools, churches, libraries, hospitals, and auditoriums
Primary consideration is given to exterior areas. In situations where no exterior activities are affected by traffic noise the interior criterion (activity category E) is used as the basis for noise abatement consideration.
California Environmental Quality Act
CEQA is the foundation of environmental law and policy in California. The main objectives of CEQA are to disclose to decision-makers and the public the significant environmental effects of proposed activities and to identify ways to avoid or reduce those effects by requiring implementation of feasible alternatives or mitigation measures. Under CEQA, a substantial noise increase may result in a significant adverse environmental effect; if so, the noise increase must be mitigated or identified as a noise impact for which it is likely that only partial (or no) mitigation measures are available. Specific economic, social, environmental, legal, and technological conditions can make mitigation measures for noise infeasible.
Traffic-Noise Analysis Protocol for New Highway Construction and Reconstruction Projects
The Protocol specifies the policies, procedures, and practices to be used by agencies that sponsor new construction or reconstruction projects. NAC specified in the Protocol are the same as those specified in 23 CFR 772. This report defines a noise increase as substantial when the predicted noise levels with project implementation exceed existing noise levels by 12 dBA -Leq(h). The Protocol also states that a sound level is considered to approach an NAC level when the sound level is within 1 dB of the NAC identified in 23 CFR 772. For example, a sound level of 66 dBA is considered to approach the NAC of 67 dBA, but 65 dBA is not.