Embed Size (px)
Citation preview
University of Tennessee, KnoxvilleTrace: Tennessee Research and CreativeExchange
Masters Theses Graduate School
12-2001
The Effects of Dissolved Oxygen Concentrationand Biological Solids Retention Time on ActivatedSludge Treatment PerformanceJack Joseph ParkerUniversity of Tennessee - Knoxville
This Thesis is brought to you for free and open access by the Graduate School at Trace: Tennessee Research and Creative Exchange. It has beenaccepted for inclusion in Masters Theses by an authorized administrator of Trace: Tennessee Research and Creative Exchange. For more information,please contact [email protected].
Recommended CitationParker, Jack Joseph, "The Effects of Dissolved Oxygen Concentration and Biological Solids Retention Time on Activated SludgeTreatment Performance. " Master's Thesis, University of Tennessee, 2001.http://trace.tennessee.edu/utk_gradthes/1982

To the Graduate Council:
I am submitting herewith a thesis written by Jack Joseph Parker entitled "The Effects of DissolvedOxygen Concentration and Biological Solids Retention Time on Activated Sludge TreatmentPerformance." I have examined the final electronic copy of this thesis for form and content andrecommend that it be accepted in partial fulfillment of the requirements for the degree of Master ofScience, with a major in Environmental Engineering.
Dr. Kevin G. Robinson, Major Professor
We have read this thesis and recommend its acceptance:
Dr. Gregory Reed, Dr. Gary Sayler
Accepted for the Council:Carolyn R. Hodges
Vice Provost and Dean of the Graduate School
(Original signatures are on file with official student records.)
To the Graduate Council:
I am submitting herewith a thesis written by Jack Joseph Parker entitled “The Effects of
Dissolved Oxygen Concentration and Biological Solids Retention Time on Activated
Sludge Treatment Performance.” I have examined the final copy of this thesis for form
and content and recommend that it be accepted in partial fulfillment of the requirements
for the degree of Master of Science, with a major in Environmental Engineering.
Dr. Kevin G. Robinson, Major Professor
We have read this thesis and recommend its acceptance:
Dr. Gregory Reed
Dr. Gary Sayler
Accepted for the Council:
Dr. Anne Mayhew
Interim Vice Provost and Dean of The Graduate School
(Original signatures are on file in the Graduate Student Services offices)
The Effects of Dissolved Oxygen Concentration and Biological
Solids Retention Time on Activated Sludge Treatment
Performance
A Thesis
Presented for the
Master of Science Degree
The University of Tennessee, Knoxville
Jack Joseph Parker
December 2001

ii
Acknowledgements
I would like to begin by thanking Dr. Kevin G. Robinson for the opportunity to further
my education and for the help he provided in editing several drafts of this document. I
would also like to thank the other two members of my committee, Dr. Gregory D. Reed
and Dr. Gary S. Sayler, for their time and patience in review of this work.
Special thanks goes to the graduate students who helped collect the data used in this
document: Mr. Shawn Hawkins, Mr. Brent Wood, and Mrs. Merve Oguz. I would like to
specifically acknowledge the help and guidance provided by Shawn Hawkins. His hard
work and devotion provided a great example for me to follow.
My mother, Diana Chamness, deserves special recognition for her constant support and
encouragement. Without her guidance, earning my Master’s degree would not have been
possible.

iii
Abstract
A bench scale treatment system with dissolved oxygen (DO) control was used to
determine the effects of DO concentration and biological solids retention time (BSRT) on
treatment performance using the activated sludge process. The four reactors, operating at
BSRTs of 20, 10, 5, and 2 days, were fed settled municipal wastewater collected from the
Kuwahee wastewater treatment plant in Knoxville, TN. The DO was maintained at
different set points in each reactor ranging from 4.0 to 0.2 mg/L.
Experimental results indicate that carbon treatment performance improved, on
average, with increasing BSRT but DO had little effect on carbon oxidation. Sludge
volume index (SVI) and effluent suspended solids (ESS) values also indicated that BSRT
not DO concentration, affected sludge settling. Complete nitrification occurred in the 20,
10, and 5 day BSRT reactors under excess DO conditions (≥2.0 mg/L). Nitrification was
unaffected at a DO as low as 0.5 mg/L for the two longest BSRTs; however, nitrite build-
up occurred in the 5 day BSRT during operation at 0.5 mg/L DO suggesting that nitrite
oxidation can limit nitrification when insufficient DO is present. A 2 day BSRT was
found to be insufficient for complete nitrification at all DO levels.
Kinetic coefficients for the nitrifiers were determined for Knoxville’s municipal
wastewater. The yield, decay coefficient, maximum substrate utilization rate, maximum
growth rate, substrate half saturation coefficient, and oxygen half saturation coefficient
were found to be 0.33 mg VSS/mg N, 0.17 day-1, 2.2 mg N/mg VSS-day, 0.75 day-1, 0.25
mg/L NH4+, and 0.92 mg/L O2 respectively. These values are within a published range
identified in the literature.
iv
Table of Contents
Chapter 1.0 Introduction................................................................................................. 1 Chapter 2.0 Literature Review........................................................................................ 5
2.1 Introduction to the Activated Sludge Process ..................................................... 5 2.2 BSRT Effects On Organic Carbon Treatment Performance ............................... 8
2.2.1 Carbon Treatment ....................................................................................... 8 2.2.2 Total Microbial Population....................................................................... 11 2.2.3 Settling ...................................................................................................... 13
2.3 Fundamentals of Nitrification........................................................................... 14 2.3.1 Stoichiometric equations of nitrification .................................................. 14 2.3.2 Alkalinity .................................................................................................. 15
2.4 Impacts of BSRT on Nitrification..................................................................... 16 2.5 Dissolved Oxygen Effects on Treatment Performance..................................... 18
2.5.1 Carbon Treatment ..................................................................................... 18 2.5.2 Nitrification............................................................................................... 21
Ammonia Oxidation.............................................................................................. 21 Nitrite Oxidation................................................................................................... 23
2.5.3 Simultaneous Nitrification/Denitrification ............................................... 25 2.5.4 Total Microbial Population....................................................................... 27 2.5.5 Settling Characteristics ............................................................................. 28
Sludge Settling ...................................................................................................... 28 Floc Structure ........................................................................................................ 29 Filamentous Bulking ............................................................................................. 30
2.6 Determination of Kinetic Coefficients .............................................................. 32 2.6.1 Nitrification Kinetics................................................................................. 32 2.6.2 Determination of YA and Kd ..................................................................... 33 2.6.3 Estimation of umax, Ks, and k..................................................................... 36 2.6.4 Estimation of KO ....................................................................................... 37
2.7 Nitrification Kinetic Coefficients...................................................................... 38 Chapter 3.0 Materials and Methods .............................................................................. 41
3.1 Collection and Storage of Influent Wastewater ................................................ 41 3.2 Experimental Treatment System....................................................................... 41 3.3 Description of DO Control System................................................................... 47 3.4 Verification of DO Control Capability ............................................................. 49 3.5 Operating Procedures ........................................................................................ 51
3.5.1 Choice of reactor BSRTs .......................................................................... 51 3.5.2 Solids sampling and sludge wastage procedure ........................................ 51 3.5.3 Treatment Performance Sampling Procedure ........................................... 54
3.6 Sampling and Analysis Procedures................................................................... 55 3.6.1 Solids Sampling and Analysis Procedure ................................................. 55
MLSS and ESS ..................................................................................................... 55 MLVSS ................................................................................................................. 55 SVI ........................................................................................................................ 56
v
3.6.2 Chemical analyses to document wastewater treatment performance........ 57 Ammonium sampling and analysis procedures .................................................... 57 Alkalinity sampling and analysis procedures ....................................................... 57 Anions sampling and analysis procedure.............................................................. 58 COD sampling and analysis procedures ............................................................... 58
Chapter 4.0 Results and Discussion.............................................................................. 60 4.1 COD Treatment Performance ........................................................................... 60 4.2 Solids Analysis Data ......................................................................................... 67 4.3 Sludge Settling and Effluent Suspended Solids ................................................ 74 4.4 Nitrification Performance Data ......................................................................... 82
4.4.1 Reactor Ammonia Removal Performance ................................................ 82 4.4.2 Nitrogen Mass Balances............................................................................ 88 4.4.3 Alkalinity .................................................................................................. 97
4.5 Kinetic Analysis of Nitrification Data ............................................................ 101 4.5.1 Estimating Y and Kd ............................................................................... 101 4.5.2 Estimating Ks, µmax, and k for the overall nitrifiers ................................ 103 4.5.3 Estimating KO for the nitrifiers ............................................................... 105
Chapter 5.0 Conclusions ............................................................................................. 110 5.1 Evaluation of Carbon Treatment Performance ............................................... 110 5.2 Evaluation of Sludge Settling Performance .................................................... 110 5.3 Evaluation of Nitrification Performance......................................................... 111
References ....................................................................................................................... 114 Appendices...................................................................................................................... 123
Appendix A. Calculation Showing Complete Mixing.......................................... 124 Appendix B. Average DO Concentrations ........................................................... 126
Vita.................................................................................................................................. 128

vi
List of Figures
Figure 1 A typical design layout of an activated sludge system with recycle (reproduced from Benefield and Randall, 1985). ....................................................... 7
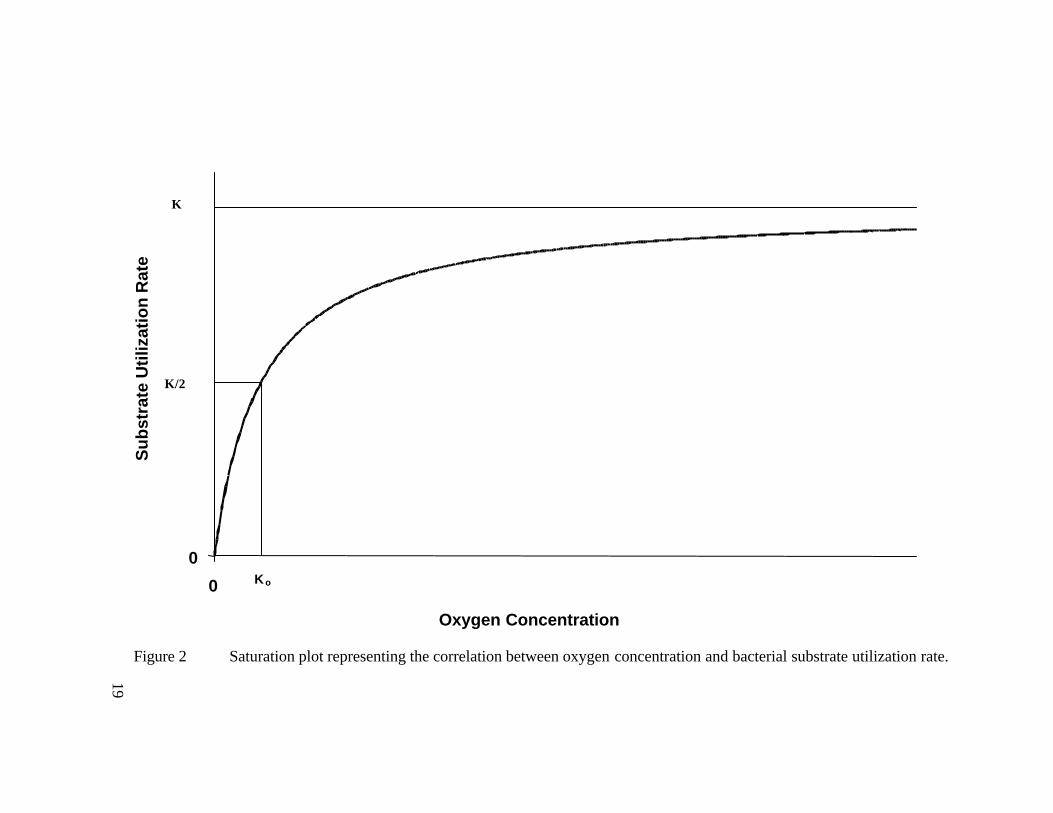
Figure 2 Saturation plot representing the correlation between oxygen concentration and bacterial substrate utilization rate....................................................................... 19
Figure 3 A diagram of one of the treatment units, which consisted of a complete mix reactor and secondary clarifier. ................................................................................. 42
Figure 4 A picture of the treatment system consisting of the reactors and clarifiers. . 44 Figure 5 Effect of DO concentration (ranging from 4.0-0.2 mg/L) on COD treatment
performance. ............................................................................................................. 63 Figure 6 Effect of an unknown surfactant on KUB’s BOD treatment performance. .. 64 Figure 7 Fluctuations in MLSS concentration due to changing DO and influent COD
concentrations throughout the treatability study. ...................................................... 68 Figure 8 Fluctuations in MLVSS concentration due to changing influent COD
concentrations during the treatability study. ............................................................. 73 Figure 9 Effect of DO concentration (ranging from 4.0-0.2 mg/L) on settling
performance. ............................................................................................................. 75 Figure 10 Effect of organic removal rate and DO concentration on sludge settling. .... 78 Figure 11 Effect of DO concentration (ranging from 4.0-0.2 mg/L) on effluent
suspended solids........................................................................................................ 80 Figure 12 Ammonia removal as a function of DO concentration over the course of the
treatability study. ....................................................................................................... 84 Figure 13 A nitrogen balance used to establish the occurrence of complete nitrification
in the 20 day BSRT reactor....................................................................................... 89 Figure 14 A nitrogen balance for the 10 day BSRT reactor indicating the occurrence of
complete nitrification. ............................................................................................... 91 Figure 15 A balance of influent ammonia, effluent ammonia, effluent nitrite, effluent
nitrate, and reactor biomass nitrogen used to confirm the occurrence of complete nitrification in the 5 day BSRT reactor. .................................................................... 93
Figure 16 A balance of the 2 day BSRT nitrogen data used to determine the occurrence of nitrification during the course of the treatment study. .......................................... 95
Figure 17 Fluctuations in effluent alkalinity as a result of decreasing DO concentration during the study. ........................................................................................................ 98
Figure 18 Change in alkalinity consumption ratio due to the inconsistency of nitrification at low DO. ........................................................................................... 100
Figure 19 Steady state plot of nitrification substrate utilization rate versus specific growth rate that was used to determine the autotrophic yield and decay rate for excess DO conditions.............................................................................................. 102
Figure 20 Steady state plot of nitrification data used to determine the maximum specific growth rate and half saturation constant for excess DO conditions. ......... 104

vii
Figure 21 Steady state plot of nitrification substrate utilization rate versus specific growth rate that was used to determine the autotrophic yield for low DO conditions. 106
Figure 22 Steady state plot of nitrification data used to determine the maximum specific growth rate for low DO conditions............................................................ 108
viii
List of Tables
Table 1 Kinetic parameters for nitrifying bacteria in municipal wastewater treatment systems ...................................................................................................................... 39
Table 2 Sample volumes collected for each type of analysis ..................................... 54 Table 3 DO operation date ranges for the course of the treatability study. ............... 60 Table 4 Average COD treatment performance during steady state operation. .......... 65 Table 5 Average MLSS concentrations during steady state operation. ..................... 70 Table 6 Steady state SVI values during the two DO time periods............................. 74 Table 7 Average steady state ESS values during the two DO operational periods. .. 81 Table 8 Average alkalinity (mg/L as CaCO3) during excess and low DO operation. 99 Table 9 Comparison of nitrification coefficients obtained during the treatability study
and coefficients taken from the literature. .............................................................. 112 Table B.1 Average DO concentrations during the treatability study. .......................... 127
ix
Nomenclature and Abbreviations
Nomenclature
Ccr Critical Dissolved Oxygen Concentration fA Active Biomass Fraction of MLVSS fb Biodegradable Fraction of Active Biomass fb,a Active Autotrophic Biomass Fraction k Maximum Specific Substrate Utilization Rate Kd Decay Rate Coefficient KO Half-Saturation Constant for Oxygen Ks Half-Saturation Constant PYobs Observed Growth Yield Index Q Flow Rate q Specific Substrate Utilization Rate qnit Nitrifier Specific Substrate Utilization Rate So Influent Substrate Concentration Se Effluent Substrate Concentration V Volume of Sample Wff Final Filter Weight from MLSS Analysis Wfv Final Filter Weight After MLVSS Analysis WI Initial Filter Weight XB,A Active Autotrophic Biomass Concentration XT Total Active Biomass Concentration Y Yield Coefficient YA Yield Coefficient for Autotrophs γ γ1/γ2 γ1 Percentage of Maximum Growth Rate for Ammonia Oxidizers Under
Different Dissolved Oxygen Conditions γ2 Percentage of Maximum Growth Rate for Nitrite Oxidizers Under
Different Dissolved Oxygen Conditions θc Biological Solids Retention Time µ Specific Growth Rate µmax Maximum Specific Growth Rate
Abbreviations
BOD Biological Oxygen Demand BOD5 Five Day Biological Oxygen Demand BSRT Biological Solids Retention Time COD Chemical Oxygen Demand CODt Total Chemical Oxygen Demand
x
CODs Soluble Chemical Oxygen Demand DDE Dynamic data Exchange DO Dissolved Oxygen ESS Effluent Suspended Solids FA Free Ammonia HDPE High Density Polyethylene HART Highway Addressable Remote Transducer HRT Hydraulic Retention Time KHP Potassium Hydrogen Phthalate KUB Knoxville Utilities Board MET Mass Estimation Technique MLSS Mixed Liquor Suspended Solids MLVSS Mixed Liquor Volatile Suspended Solids NOD Nitrogenous Oxygen Demand SBR Sequencing Batch Reactor SSV Settled Sludge Volume SVI Sludge Volume Index TKN Total Kjeldahl Nitrogen WWTP Wastewater Treatment Plant
1
Chapter 1.0
Introduction
Municipal wastewater treatment plants (WWTP) often use biological treatment
processes to convert dissolved organic matter into settleable biological solids and carbon
dioxide. Several biological treatment methods exist that are either suspended or attached
growth processes. Activated sludge, the most widely used biological process for treating
wastewater (Tchobanoglous and Burton, 1991), is an aerobic suspended growth process
in which microorganisms biooxidize organic or carbonaceous compounds in the influent
waste stream. The microorganisms, mainly composed of bacteria, form a flocculent
slurry that settles under quiescent conditions. Due to the flocculation of biomass, organic
solids can be reduced to low levels and a clear effluent can be produced (Grady et al.,
1999). Organic compounds can impose a large oxygen demand on a receiving body of
water if untreated. The goal of the activated sludge process is to reduce oxygen demand
when bacteria utilize the organic compounds to yield energy for growth.
Activated sludge can also be used to oxidize inorganic compounds such as
ammonia. The presence of reduced forms of nitrogen, specifically ammonia and organic
nitrogen, is typical in municipal wastewater. Untreated, these compounds impose a large
nitrogenous oxygen demand (NOD) on receiving waters, which can drastically lower the
dissolved oxygen (DO) concentration. Additionally, ammonia is toxic to fish and other
aquatic organisms at relatively low concentrations (Tchobanoglous and Burton, 1991).
Biological oxidation of the ammonium ion (nitrification) is typically used to eliminate the
2
NOD by conversion of ammonium to nitrate via nitrite. Nitrifying bacteria are very
sensitive to operational factors such as BSRT and DO concentration (Benefield and
Randall, 1985). Since nitrifying bacteria have a maximum growth rate nearly an order of
magnitude lower than bacteria responsible for COD removal, they can be hydraulically
washed-out of a bioreactor under conditions suitable for COD reduction (Grady et al.,
1999). Consequently, the BSRT must be chosen carefully in systems incorporating
nitrification because it cannot be assumed that conditions suitable for soluble organics
removal are suitable for removal of ammonium. This problem is magnified by the fact
that nitrifiers are more sensitive to DO concentration than other bacteria. Aeration is
especially important in combined carbon removal/nitrification systems since
approximately 4.33 mg of O2 are consumed per mg of NH4+ oxidized to nitrate
(Benefield and Randall, 1985).
Oxygen concentration is also important in determining the efficiency of activated
sludge settling. In a non-DO limited system, bacteria agglomerate into flocs which
rapidly settle in the clarifier. Capturing biomass in the clarifier and recycling the bacteria
back to the aeration tank are key steps in the activated sludge treatment. Since poor floc
formation is the most common cause of failure in activated sludge treatment systems, the
DO must be kept at an acceptable level to assure good settling biomass (Rittmann and
McCarty, 2001). Low DO concentrations enhance the growth of filamentous bacteria.
These organisms are typically present even at excess DO conditions and form the
backbone of floc particles. However, low DO conditions allow these bacteria to
proliferate and thereby decrease the amount of biomass compaction. The excess of
3
filaments causes the formation of bulking sludge, which does not settle well and typically
increases the amount of solids lost in the effluent.
The overall goal of this study was to examine how biological solids retention time
and dissolved oxygen concentration influenced the processes that occur in a combined
carbon removal/nitrification activa ted sludge system. Past studies have tended to focus
on one particular area of treatment i.e. COD removal, settling, etc. rather than the whole
picture. This study was intended to help determine the operational conditions (i.e. BSRT
and DO concentration) necessary for effective carbon removal and nitrification to occur
in an activated sludge system.
Biological solids retention time is important in activated sludge systems because
it is functionally related to the specific growth rate of the biomass and because it is an
operational parameter that can be physically controlled to maintain treatment
performance. DO concentration is important because nitrifying bacteria are sensitive to
low DO (≤2.0 mg/L) and because aeration is a major associated with aerobic wastewater
treatment (Grady et al., 1999). One primary objective of this study was to assess the
minimum DO concentration and BSRT necessary to provide effective treatment
performance. This was accomplished by operating reactors at BSRTs of 20, 10, 5, and 2
days and varying the DO concentration in a range from 4-0.2 mg/L while evaluating
COD treatment, nitrification, and sludge settling.
The second objective was to determine the nitrification kinetic coefficients to
make it possible to design an activated sludge system treating a similar waste stream.
The yield coefficient, substrate half-saturation coefficient, decay coefficient, maximum
4
specific substrate utilization rate, and maximum specific growth rate for the nitrifier
population at steady state were determined. The oxygen half saturation coefficient was
also calculated to evaluate the sensitivity of nitrifying bacteria to DO concentration. The
coefficients for the nitrifiers were determined because they are typically the limiting
factor in a combined carbon removal/nitrification system.
5
Chapter 2.0
Literature Review
2.1 Introduction to the Activated Sludge Process
The activated sludge process is utilized to convert most organic wastes to more
stable inorganic forms or to cellular mass. In this process much of the organic matter
remaining after primary sedimentation of wastewater is converted to carbon dioxide and
water by a diverse group of microorganisms (Benefield and Randall, 1985) while the
remainder of the organics are used for conve rsion to a cellular mass that can be separated
from the waste flow by gravity settling.
Activated sludge is a heterogeneous microbial culture composed mainly of
bacteria, protozoa, rotifers, and fungi. However, it is the bacteria that are mainly
responsib le for degradation of organic and nitrogenous compounds in the activated
sludge treatment process (Benefield and Randall, 1985). Bacteria derive their energy and
reducing power from oxidation reactions, which involves the removal of electrons.
Heterotrophic bacteria use organic compounds as their electron donor and carbon source
to synthesize new biomass in the presence of oxygen (Grady et al., 1999). Since the
removal of organic compounds is the most important use of activated sludge, it follows
that heterotrophic bacteria predominate in the system. Microorganisms that use inorganic
compounds as their electron donor and carbon dioxide as their carbon source are typically
autotrophic bacteria. Nitrifiers are the most important autotrophic bacteria in
6
biochemical operations because they use ammonia and nitrite as an electron donor (Grady
et al., 1999).
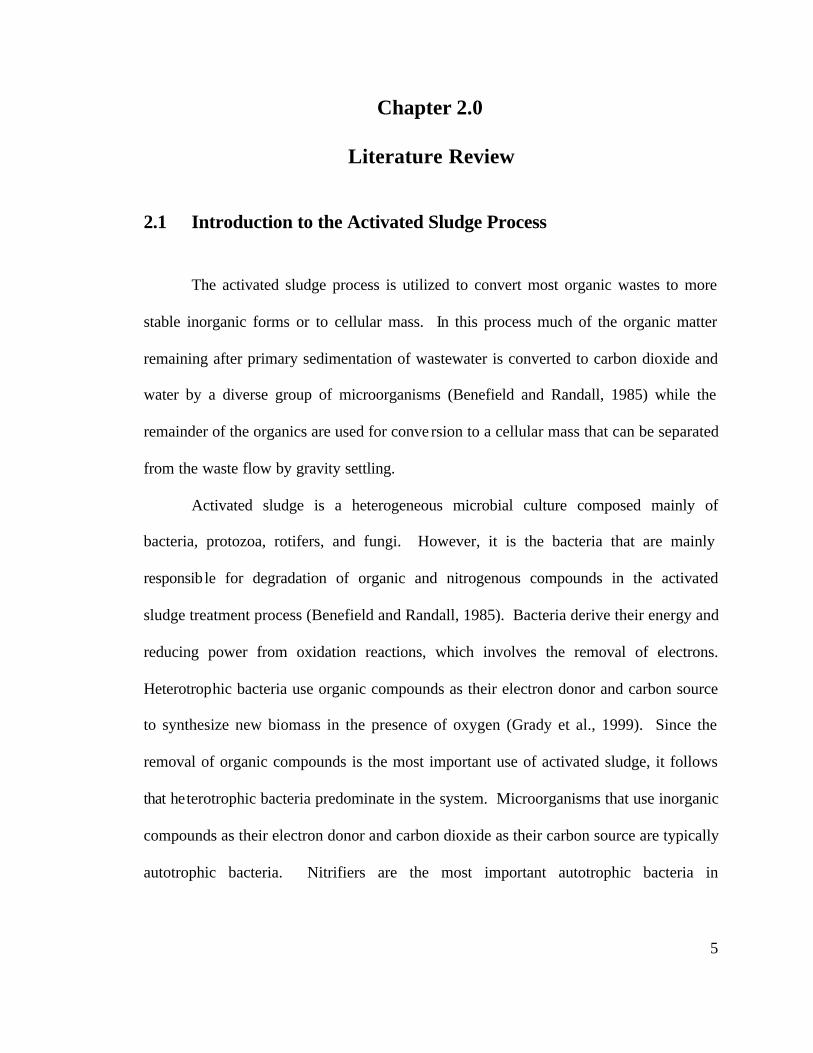
There are four factors common to all activated sludge processes: 1) a slurry of
microorganisms (mixed liquor suspended solids [MLSS]) is used to treat soluble and
particulate matter present in an influent waste stream, 2) quiescent settling is used to
remove the MLSS and produce an effluent low in suspended solids, 3) settled solids are
recycled from the clarifier back to the aeration basin, and 4) excess solids are wasted to
maintain a particular biological solids retention time (BSRT) (Grady et al., 1999). Figure
1 shows the layout of a conventional activated sludge system. The reactor containing the
MLSS (aeration basin) is aerobic throughout to provide the necessary oxygen for the
microorganisms. Sufficient mixing energy must be provided in the bioreactor to keep the
solids in suspension. The stream of solids being recycled from the settling tank, (return
activated sludge (RAS)), is used to increase the biomass concentration in the reactor.
Figure 1 shows the conventional method of solids removal for maintaining BSRT, from
the clarifier, but solids can also be removed directly from the aeration basin.
Aeration basins are typically open tanks containing equipment to provide aeration
and to provide sufficient mixing energy to keep the MLSS in suspension. The depth is
mainly determined by oxygen transfer/mixing characteristics and usually ranges from 3
to 7.5 m (Grady et al., 1999). A single piece of equipment such as a diffused air,
mechanical surface aerator, or jet aerator is used in many cases to provide aeration and
keep the solids in suspension. Auxiliary mechanical mixers are used when the aeration
does not provide sufficient mixing energy.
7
Figure 1 A typical design layout of an activated sludge system with recycle
(reproduced from Benefield and Randall, 1985).
8
The secondary clarifier performs two functions in the activated sludge process.
The first function, clarification, is the separation of MLSS from the treated wastewater to
produce a clarified effluent that meets the effluent suspended solids goal. The other is the
thickening of sludge for return to the bioreactor. Since both functions are affected by
clarifier depth, the design depth must be selected to provide an adequate volume for both
functions (Tchobanoglous & Burton, 1991). For instance, the volume must be sufficient
to store the solids during periods of high flow.
2.2 BSRT Effects On Organic Carbon Treatment Performance
2.2.1 Carbon Treatment
Biological solids retention time has a principal effect on the performance and
capabilities of an activated sludge system. Lawrence and McCarty’s (1970) landmark
paper linked BSRT and treatment efficiency thereby providing a means of maintaining
treatment performance by manipulating physical attributes such as wastage rate. BSRT,
shown in Equation 1, is defined as the average time a unit of biomass remains in the
bioreactor.
∆
∆=
tX
X
T
Tcθ (1)
where:
θc = BSRT (time) XT = reactor biomass concentration (mass/volume) (∆XT/∆t) = biomass removed from the treatment system (mass/(volume*time)) Although a significant amount of biomass enters a municipal wastewater
treatment system, the population of aerobic bacteria present is likely insignificant due to
9
anaerobic conditions in the collection system. Therefore, it is typically assumed that no
influent biomass is present for design purposes so that a materials balance for the net
biomass rate of change in the system can be written as follows (Lawrence and McCarty,
1970):
Accumulation = Inflow – Outflow + Net Growth
−
++−=
dsN
KSK
YkSQX
dtdX
V 0 (2)
where:
(dX/dt)N = net bacterial growth rate (mass/(volume*time)) Q = flow rate of wastewater into the aeration basin (volume/time) V = reactor volume Y = biomass yield coefficient (mass/mass)
S = wastewater substrate concentration, e.g. BOD5 or COD (mass/volume) k = maximum specific substrate utilization rate (time-1) Ks = half-saturation constant (mass/time) Kd = microbial decay coefficient (time-1) If the system is at steady state, the rate of biomass accumulation is equal to zero
by definition (Benefield and Randall, 1985). The mass balance can then be rearranged to
provide an equation in terms of BSRT when S is set to the effluent substrate
concentration (Se). Inspection of Equation 3 reveals the relationship between treatment
performance and BSRT.
des
e
c
KSK
YkS−
+=
θ1
(3)
Minimum BSRT is the value below which a group of microorganisms is unable to
grow in an activated sludge reactor. The minimum value is a function of the influent
10
substrate concentration and the kinetic parameters describing bacterial growth on that
substrate. For a given set of kinetic parameters, the minimum BSRT for a particular
waste stream can be calculated by replacing the effluent substrate concentration with the
influent substrate concentration in Equation 3. The resulting value would be the BSRT at
which no degradation occurred or the minimum BSRT.
A relationship between the microbial yield, maximum specific substrate
utilization rate and maximum growth rate can be seen in Equation 4. Substitution of
Equation 4 into Equation 3 reveals an important correlation between specific growth rate
and BSRT. BSRT is inversely proportional to specific growth rate as seen in Equation 5.
Yk=maxµ (4)
des
e
c
KSKS
−+
= max1 µθ
(5)
The kinetic parameter that has the most prominent effect on BSRT is the
maximum specific growth rate (µmax). Heterotrophic bacteria have a low minimum
BSRT because of a high maximum specific growth rate. The typical range of BSRTs
necessary for removal of soluble organic matter is between 0.5-1.5 days for municipal
wastewater (Grady et al., 1999). However, a safety factor is typically employed to
protect against process failure. Tchobanoglous & Burton (1991) propose that a design
11
BSRT of 4-10 days should be used for a conventional activated sludge system treating
domestic wastewater.
Several studies have been conducted to assess the effects of BSRT on carbon
treatment performance. Palm et al. (1980) found that complete mix activated sludge
reactors operating at a BSRT of 1.9 days removed 85% of the influent COD. While the
longer BSRTs removed a slightly higher percentage (90%) of COD, it was clear that
effective carbon treatment could be accomplished at short BSRTs. Chuang et al. (1997)
found that carbon treatment performance was similar for BSRTs of 5, 10, and 15 days
treating an influent COD of 300 mg/L. The average effluent COD values for these three
BSRTs were 13, 11, and 11 mg/L respectively. A full-scale municipal WWTP in
Phoenix, AZ was forced to set the BSRT between 0.8 and 1.3 days because of foaming
problems and limited cla rification capacity (Albertson and Hendricks, 1992). However,
this plant consistently reduced the BOD from 200 to 11.2 mg/L under low BSRT
conditions.
2.2.2 Total Microbial Population
BSRT has been defined as the average length of time a particulate constituent (i.e.
biomass) remains in a bioreactor. Therefore, it must be maintained at a sufficient level to
provide the concentration of microorganisms necessary to effectively treat a waste
stream. A minimum MLSS concentration is also necessary to allow the development of a
flocculent biomass. Lawrence and McCarty (1970) found that the steady state mixed
liquor microbial mass concentration could be obtained by a substrate mass balance on the
reactor.
12
Accumulation = Inflow – Outflow + Net Growth
eU
eoN
QSRVdtdS
RQSQSdtdS
V )1( +−
−+=
where:
(dS/dt)N = net substrate utilization rate (mass/(volume*time)) (dS/dt)U = overall substrate utilization rate (mass/(volume*time))
R = ratio of recycle flow rate to influent flow rate
The mass balance can be simplified for steady state conditions ((dS/dt)N = 0) and
divided through by X to develop an equation for specific substrate utilization rate (q):
( )VX
SSQXdt
dSq eoU )( −
== (6)
The specific substrate utilization rate can also be defined by the following
equation (Benefield and Randall, 1985):
( )es
eU
SKkS
Xdt
dS
+= (7)
Substitution of Equation 7 into Equation 3 yields Equation 8:
( )YK
Xdt
dS
c
dU
θ+
=1
(8)
Substituting Equation 8 in to Equation 6 results in an expression which links the
MLSS concentration (X) to BSRT (θc) for a completely mixed activated sludge system
with recycle.
13
θθ
θc
cd
O
kSSY
X)1()(
+−
= (9)
It is evident from Equation 9 that MLSS is a function of the system BSRT. Once
the BSRT for a process has been chosen, the steady state biomass level can be
determined. Typical MLSS concentrations for the conventional activated sludge system
range between 500-5000 mg/L (Grady et al., 1999).
Several studies have experimentally demonstrated that MLSS concentration
increases with BSRT for a given waste stream. Grady and Williams (1974) conducted a
set of experiments on chemostats treating synthetic wastewater at BSRTs of 0.17, 0.22,
0.3, and 0.46 days. It was discovered that the MLSS concentrations for an influent COD
of 1000 mg/L were 317, 343, 353, and 369 respectively. Although the difference is
moderate because no sludge recycle was involved, an upward trend in MLSS can be seen
in the data. Chuang et al. (1997) produced similar results when operating a set of reactors
at BSRTs of 5, 10, and 15 days. The MLSS concentrations were 920, 1690, and 2700
respectively for these reactors each treating an influent COD of 300 mg/L.
2.2.3 Settling
Successful operation of an activated sludge system requires the formation of a
flocculent biomass that settles rapidly and compacts well. The presence of exocellular
polymers (ECP), formed during microbial metabolism, is key in establishing flocculation
(Surucu & Cetin, 1989). ECPs cause the aggregation of particles by acting as a bridge
between cells. Several types of ECPs are involved in flocculation but polysaccharides
and proteins are generally considered the most important (Grady et al., 1999).

14
Empirical observations suggest that a minimum BSRT must be maintained to
successfully achieve flocculation. This observation is consistent with the role of ECP
production by bacteria. Although ECP is produced continuously, its formation has been
found to increase with increasing BSRT (Grady et al., 1999). Therefore, flocculation
could be incomplete at short BSRTs because the generation of bacteria exceeds the rate
of ECP production. By reducing the growth rate of bacteria to coincide with ECP
production, effective flocculation can be achieved.
Bisogni and Lawrence (1971) conducted a study on the impacts of BSRT on
settling performance for BSRTs ranging from approximately 0.5-12 days. The major
finding was that a high percentage (10-30%) of the activated sludge solids did not settle
when the BSRT was less than 1 day. Microscopic analysis of biomass showed well
formed flocs for BSRTs greater than 2 days. Echeverria et al. (1993) obtained similar
results when conducting a pilot plant study on municipal wastewater. Effective sludge
settling (i.e. SVI values lower than 100) was found for a BSRT as low as 3 days for a
conventional activated sludge reactor. Grady et al. (1999) recommend a minimum BSRT
of 3 days for good flocculation but also state that several activated sludge plants have
been successfully designed and operated at BSRTs as low as 1 day.
2.3 Fundamentals of Nitrification
2.3.1 Stoichiometric equations of nitrification
Nitrification is a two-step treatment process, performed by chemoautotrophs, that
converts ammonia to nitrate in the presence of oxygen (Benefield & Randall, 1985). The
initial step of nitrification (NH4+→NO2
-) has long been thought to be carried out by the

15
bacterial genera Nitrosomonas. However, Nitrosococcus, Nitrosospira, Nitrosovibrio,
and Nitrosolobus can also sustain themselves by converting ammonia to nitrate (Rittmann
and McCarty, 2001). The ammonia-oxidizers are all genetically diverse yet are related to
each other, which suggests that the Nitrosomonas species is not necessarily dominant in a
given system (Rittmann and McCarty, 2001). The second step, conversion of nitrite to
nitrate, can be performed by Nitrospira, Nitrospina, Nitrococcus, Nitrocystis, and
Nitrobacter. Although the latter organism is the most commonly referenced genus for this
process, recent findings using molecular probes indicate that Nitrospira is the dominant
nitrite-oxidizer in wastewater treatment processes (Rittmann and McCarty, 2001).
Nitrification is desirable in wastewater treatment plants because ammonia consumes
oxygen in receiving streams, is toxic to fish, and reacts with chlorine to form chloramines
making drinking water treatment difficult. Since nitrifiers use inorganic carbon for cell
synthesis, they are not in direct competition with heterotrophs for a carbon source.
Although nitrification is a two-step process, conversion of ammonia to nitrite is
usually the rate- limiting step since nitrite does not typically accumulate in biological
treatment systems under steady-state conditions (EPA, 1993). The lack of nitrite build-up
can be attributed to the maximum growth rate for nitrite oxidizing population being
considerably higher than the maximum growth rate for the ammonia oxidizing population
(EPA, 1993).
2.3.2 Alkalinity
Alkalinity in wastewater results from the presence of hydroxides, carbonates, and
bicarbonates of elements such as calcium and magnesium. Acting as a buffer, alkalinity
16
helps to resist changes in pH caused by the addition of acids. While pH should be
maintained in the range of 7.0 to 8.5 for efficient nitrification, Grunditz and Dalhammar
(2001) found that pH values of 8.1 and 7.9 provided optimum activities for Nitrosomonas
and Nitrobacter respectively. Since 7.14 mg of alkalinity as CaCO3 is consumed per mg
of ammonia oxidized to nitrate (based on stoichiometry), the pH will rapidly drop if the
concentration of alkalinity is insufficient (Grady et al., 1999). However, this is usually
not a problem because domestic wastewater contains approximately 100-200 mg/L of
alkalinity (Benefield & Randall, 1985).
2.4 Impacts of BSRT on Nitrification
When nitrification is to be incorporated into a wastewater treatment system,
determination of the necessary BSRT becomes crucial. A BSRT of approximately 2-3
days has been established as the minimum for nitrification to occur (Benefield and
Randall, 1985). A minimum BSRT for a particular waste stream can also be
approximated by substituting typical nitrifier kinetic coefficients and the influent
ammonia concentration into Equation 3. Since this value would not be sufficient for
design purposes due to the dynamic nature of ammonia loadings in activated sludge
WWTPs, Tchobanoglous and Burton (1991) recommend a BSRT between 8-20 days for
combined carbon removal/nitrification systems.
BSRT becomes important because comparison of typical maximum growth rate
values for heterotrophs and autotrophs reveals that the value for autotrophs is nearly an
order of magnitude lower than for heterotrophs (Grady et al., 1999). This finding
suggests that the minimum BSRT required for nitrification is nearly an order of
17
magnitude larger than the minimum BSRT for heterotrophs. The situation is exacerbated
by the fact that the nitrifier maximum specific growth rate can vary by a factor of two for
a given temperature (Daigger and Parker, 2000). Since the variance can be attributed to
several factors, it has been suggested that the maximum specific growth rate should be
determined for each wastewater.
Because of the importance of nitrification in wastewater treatment, several studies
have been conducted to determine the necessary BSRT for effective nitrification.
Randall et al. (1992) conducted a study to compare nitrification kinetics in a conventional
activated sludge system and a system accomplishing biological nutrient removal. The
activated sludge system was operated at BSRTs of 1.5, 2.7, 5, and 15 days at a
temperature of 20°C. It was found that complete nitrification could be achieved for
BSRTs of 2.7 days or greater when treating an influent ammonia concentration of
approximately 25 mg/L. It should be noted that 79% of the incoming ammonia was
converted to nitrate in the 1.5 day BSRT reactor. Dincer and Kargi (2000) obtained
similar results when treating a synthetic influent stream composed of 100 mg/L ammonia.
The reactors for this experiment were operated at 20, 17, 15, 10, 8, 5, and 3 day BSRTs.
Nitrification efficiency was found to increase up to a BSRT of 12 days. Any further
increases in BSRT did not result in improved treatment performance. It was also
discovered that almost 60% nitrification could be accomplished at a 3 day BSRT. Hanaki
et al. (1990) also found that nitrification could be achieved at low BSRTs when
conducting a study on the effects of DO on nitrification in a completely mixed activated
sludge system. For the excess DO portion of their experiment, reactors were operated at
18
BSRTs of 6.5, 5, 3.8, and 2 days for a synthetic influent feed containing 80 mg/L of
ammonia. Complete nitrification was measured for all BSRTs greater than 3.8 days
while approximately 50% of the influent ammonia was converted to nitrate in the 2 day
BSRT reactor. This finding indicated that it was possible to nitrify nearly 40 mg/L of
influent ammonia at a BSRT of only 2 days.
2.5 Dissolved Oxygen Effects on Treatment Performance
2.5.1 Carbon Treatment
In the presence of an easily degradable substrate, heterotrophic bacteria are able
to grow at low DO concentrations. Although it is undesirable for oxygen to be rate
limiting in the removal of organic compounds, only limited research has been done to
establish the oxygen half saturation coefficient for mixed cultures of heterotrophs (KO,H).
A probable reason for the lack of work in this area is that population shifts in the
microbial community, due to changes in DO concentration, make estimation of the value
difficult (Grady et al., 1999).
The oxygen half saturation coefficient (KO) has been defined as the oxygen
concentration where nitrification takes place at one half of the maximum rate. Figure 2
shows the relationship between KO and the maximum substrate utilization rate (k). The
half saturation coefficient is an indicator of a microorganism’s affinity for oxygen.
Therefore, a low value of KO indicates a high affinity for oxygen and the ability of a
microorganism to effectively utilize substrate even at low DO conditions. Because of the
disparity in value for heterotrophs and autotrophs, KO becomes especially important in
combined carbon removal/nitrification activated sludge systems.
19
Figure 2 Saturation plot representing the correlation between oxygen concentration and bacterial substrate utilization rate.
0
0
Oxygen Concentration
Su
bst
rate
Uti
lizat
ion
Rat
e
K
K/2
K o

20
Limited pure culture experimental data suggests that the heterotrophic oxygen half
saturation coefficient is very low. Sinclair & Ryder (1975) conducted a study on the
effects of DO on the behavior of Candida utilis grown in a chemostat. Using a glycerol
medium, the KO,H for C. utilis was found to be approximately 0.08 mg/L. Similar results
were obtained by Lau et al. (1984) when describing the growth kinetics of a floc former
(Citrobacter sp.) and a filament (Sphaerotilis natans) obtained from activated sludge.
The KO,H values for the floc former and filament were calculated to be 0.15 and 0.01
mg/L respectively. These low values indicate that a very low DO concentration would be
required to affect carbon treatment performance, although it might influence competition
between filamentous and floc forming bacteria. Henze et al. (1987) have adopted a
standardized KO,H value of 0.2 mg/L for use in Activated Sludge Model No. 1.
Due the low KO value for heterotrophs, it is not surprising that several researchers
have found that DO has little effect on carbon treatment performance. Chuang et al.
(1997) conducted a study to determine the effects of DO on nutrient removal for
concentrations ranging from 2.0-0.1 mg/L. A synthetic feed was introduced into the
reactors at a COD concentration of 300 mg/L. The effluent CODs were 10, 11, and 11
mg/L for a 10 day BSRT reactor operating at 2.0, 0.5, and 0.1 mg/L DO, respectively.
Similar treatment efficiencies for the other BSRTs showed that DO had no impact on
carbon treatment for any of the BSRTs studied (5, 10 and 15 days). Munch et al. (2000)
conducted a pilot plant study to establish the feasibility of upgrading a municipal WWTP
to incorporate nitrification into a carbon treatment system. It was determined that
effective carbon treatment could be accomplished when the reactor was set at a DO

21
concentration of 0.5 mg/L. Lau et al. (1984) also found that effective carbon treatment
could be accomplished at low DO in a chemostat treating synthetic wastewater. The
reactor was operated at a 0.3 day BSRT for DO concentrations of 6.1, 0.35, and 0.09
mg/L. Operation at these DO concentrations produced effluent COD concentrations of
21, 40, and 30 mg/L. These findings indicated that DO concentration had no effect on
carbon treatment efficiency.
2.5.2 Nitrification
Ammonia Oxidation
The dissolved oxygen concentration necessary for non-DO limited nitrification
has been established at 2 mg/L (Benefield and Randall, 1985; Tchobanoglous and Burton,
1991), however, this value can vary with BSRT and organic loading. Recent findings
have shown that oxygen requirements for nitrification are not the same for different
BSRTs. The DO concentration required for high BSRTs is as little as 1 mg/L (Fillos et
al., 1996; Stenstrom and Song, 1991). Dangcong et al. (2000) conducted a study on a
sequencing batch reactor treating a high concentration of influent ammonia. When the
DO was not controlled, it was discovered that a significant portion of the incoming
ammonia was converted to nitrite even though DO levels in the rector were close to zero.
The results indicate that the ammonia oxidizers adapted to the low DO.
The conditions change when organic shock loading is introduced into the system.
Hanaki et al. (1990) found that ammonia oxidation could efficiently occur in a pure
nitrification reactor even at a DO level of 0.5 mg/L and a BSRT of 3.8 days. However, it
was found that ammonia oxidation was not as successful once a significant organic
22
loading was introduced in the influent. Results showed that ammonia oxidation was
inhibited at low DO levels for all BSRTs when 500 and 1000 mg/L COD was added.
However, efficient ammonia removal was measured at a BSRT greater than 4 days when
the organic loading was 160 mg/L. Hanaki et al. (1990) attributed the decrease in
ammonia removal at high organic loadings to an increase in Ks. This meant a higher
ammonia concentration was required at high organic loadings to maintain the growth rate
at low DO (Hanaki et al., 1990).
Hanaki et al. (1990) studied the observed growth yield index (PYobs) of ammonia
and nitrite oxidizing bacteria to determine the effects of DO on growth. The proportional
biomass determination factor (P) represented the specific substrate utilization rate of
ammonia oxidizers from a batch test, in which harvested cells from mixed liquor
consumed the substrate. The observed growth yield (Yobs) was calculated by the
following equation:
cdobs K
YY
θ+=
1 (10)
The first part of this study was conducted in a pure nitrification environment,
which limited the amount of heterotrophs by restricting organic carbon. The results
showed that PYobs for ammonia oxidizers significantly increased at low DO levels while
PYobs for nitrite oxidizers did not change. Since the growth yield index increased, either
P or Yobs must have caused the increase. P can be influenced by heterotrophs, however,
only a negligible amount were present so P was considered to be constant. This suggests

23
that an elevated Yobs caused the increase in the observed growth yield index. However,
the substrate utilization rate decreased because of a decrease in the maximum substrate
utilization rate when low DO conditions occur (Hanaki et al., 1990). Consequently, the
high growth yield increased the amount of ammonia oxidizing biomass and compensated
for the reduced ammonia oxidation rate per unit biomass.
Nitrite Oxidation
As previously mentioned, ammonia oxidation has historically been considered the
rate- limiting step in nitrification. However, more recent findings seem to indicate that in
the presence of low dissolved oxygen concentrations, the nitrite oxidizing bacteria are
inhibited while the ammonia oxidizers are relatively unaffected (Hanaki et al., 1990;
Fillos et al., 1996, Dangcong et al., 2000). Nitrite oxidation is inhibited in a low DO
environment due to a specific affinity for oxygen that is lower than that of the ammonia
oxidizers (Laanbroek et al., 1994). For this reason, nitrite oxidizers have difficulty
competing for the available oxygen and adapting to the environment.
Bernet et al. (2001) have proposed using DO to limit the amount of nitrate
produced in nitrogen removal processes because nitrite is cheaper to convert to N2 gas via
denitrification. To determine the effects of DO on nitrifiers the researchers introduced
two parameters, γ1 and γ2, to describe the percentage of maximum growth rate for
ammonia and nitrite oxidizers. These two parameters can be defined by the following
equations:
DOKDO
ONH+
==+
24 ,
11'
1 / µµγ (11)
24
DOKDO
ONO+
==−
22 ,
22'
2 / µµγ (12)
where:
µ1 = maximum ammonia oxidizer growth rate at excess DO (time-1) µ’1 = maximum ammonia oxidizer growth rate at low DO (time-1) µ2 = maximum nitrite oxidizer growth rate at excess DO (time-1) µ’
2 = maximum nitrite oxidizer growth rate at low DO (time-1)
Equation 11 can be divided by Equation 12 to yield the variation of growth ratios
between ammonia and nitrite oxidizers under different DO concentrations (Bernet et al.,
2001):
DOK
DOK
ONH
ONO
+
+==
+
−
24
22
,
,21 γγγ (13)
The researchers operated a nitrifying biofilm at 0.5 mg/L DO to determine
whether or not nitrite accumulation could be sustained. The experiment was conducted
over a 110-day period and nitrite accumulation occurred throughout. The results were
that γ for the ammonia oxidizers was close to 1 (0.976) while the nitrite oxidation γ had
decreased to 0.120. The findings indicated that nitrite oxidizers were only growing at
12% of their normal rate and consequently could not remove all of the nitrite. It was
noted that once the DO was restored to 50% saturation, complete conversion of nitrite to
nitrate once again occurred. This result clearly shows that nitrite oxidizers were always
present in the biofilm (Bernet et al., 2001).
25
A significant buildup of nitrite in the effluent is problematic because nitrite is
toxic to aquatic life at concentrations as low as 0.5 mg/L (Balmelle et al., 1992). High
nitrite concentrations can also inhibit growth of floc forming organisms, which could
cause settling problems (Kappeler et al., 1994). Another side effect of excess nitrite is
the production of N2O gas. Zheng et al. (1994) used a 10-day BSRT and DO
concentrations of 0.1, 0.2, 0.5, 1.7, and 6.8 to examine the effect of dissolved oxygen on
nitrous oxide formation. At a DO of 0.1 mg/L, approximately 5.4% of the nitrified
nitrogen was converted to N2O gas. The conversion rate increased to 7.0% at the 0.2
mg/L DO concentration and then declined back to 5.4% at 0.5 mg/L DO. The actual
amount of N2O produced at 0.5 mg/L DO was higher than at 0.2 mg/L but more
ammonification occurred so the percentage dropped. It appears that N2O will be
produced to some extent no matter what the DO level. However, conversion rates are
highest at low DO levels. This condition correlates to the DO concentration where nitrite
oxidation is inhibited suggesting a close relationship between N2O production and nitrite
buildup in wastewater (Zheng et al., 1994).
2.5.3 Simultaneous Nitrification/Denitrification
In a reactor attempting to nitrify at low DO concentrations, it is possible for
nitrification and denitrification to occur simultaneously. Denitrification is performed by
facultative heterotrophic bacteria, which are able to use nitrate as a terminal electron
acceptor for the oxidation of carbon substrates (Benefield & Randall, 1985). The
conditions in the reactor must be anoxic for denitrification to occur. The term anoxic
26
refers to the use of nitrate as an electron acceptor instead of oxygen and is used rather
than anaerobic because it is a modification of aerobic pathways (Tchobanoglous &
Burton, 1991). Denitrification is a two-step process in which nitrate is converted to
nitrite then to nitrogen gas. Because nitrate is used as an electron acceptor, denitrifiers
must have an easily degradable carbon and energy source available. Methanol typically
has served as a carbon and energy source after BOD removal and nitrification have
occurred (Benefield & Randall, 1985; Tchobanoglous & Burton, 1991). Stoichiometry of
the denitrification process with methanol as the substrate is given by the following:
OHCONOOHCHNOStep 22233 2331 ++→+ −− (14)
−− ++→+ OHCONOHCHNOStep 222 2232 (15)
−− +++→+ OHOHCONOHCHNOOverall 65356 22233 (16)
The typical DO limit for denitrification has been reported to be between 0.1 and
0.2 mg/L (Fillos et al., 1996; Lie & Welander, 1994). However, denitrification has been
found to occur at DO concentrations up to 3 mg/L, although the rate was less than 25% of
the maximum rate (Oh & Silverstein, 1999).
A series of SBR experiments on denitrification were conducted by Oh &
Silverstein (1999) at DO concentrations of 0.09, 0.4, 0.8, 1.2 and 2.0 mg/L. At a DO
concentration of 0.4 mg/L, the average rate of denitrification was 0.0108 mg NOx-N/mg-
MLVSS/h. This was a 50% reduction in rate from the anoxic value of 0.0214 mg NOx-
27
N/mg-MLVSS/h. Even at values of 0.09 mg/L DO, a significant (35%) inhibition of
denitrification rates occurred during the experiment. Small anoxic microzones form in
the floc allowing denitrification to proceed at low DO concentrations (Fillos et al., 1996).
One method of determining whether simultaneous nitrification/denitrification
occurs is to monitor the ratio of alkalinity consumed per ammonia converted to nitrate.
Nitrate concentration, not ammonia, should be used in this ratio because it is not subject
to any further reactions other than denitrification (Marsili-Libelli & Giovanni, 1997).
The theoretical rate of alkalinity production is 3.57 mg alkalinity per mg NO3- reduced
(Fillos et al., 1996). Thus, the effect of both reactions occurring at the same time would
be a linear decrease in the theoretical alkalinity consumption ratio (7.14) until it reached
3.57 at 100% concurrent denitrification.
2.5.4 Total Microbial Population
When treating a waste stream, it is important to maintain a sufficient microbial
population for degradation of organic and inorganic compounds. Heterotrophic bacteria
comprise the majority of the mixed liquor in activated sludge systems (Grady et al.,
1999). As discussed previously, it has been found heterotrophic bacteria are capable of
effective carbon treatment even at very low DO levels. Therefore, major changes in the
mixed liquor concentration would not be expected to occur at low DO unless the influent
COD concentration varied.
A number of studies have determined that mixed liquor was more a function of
influent organic carbon than DO. The study of DO and carbon removal by Lau et al.
(1984) revealed that no significant changes in MLSS occurred for a chemostat treating a
28
consistent synthetic waste stream at 6.1, 0.35, and 0.9 mg/L DO. The MLSS values were
502, 525, and 490 respectively for this experiment. These findings indicated that DO had
no effect on MLSS. Chuang et al. (1997) obtained similar results when treating a
synthetic influent feed comprised of 300 mg/L COD at 2, 0.5, and 0.1 mg/L DO.
Operating the system at a 5 day BSRT, MLSS concentrations of 920, 1010, and 1030
were obtained for the three DO levels respectively. The findings also reinforce the notion
that organic carbon levels rather than DO exert the most influence on MLSS
concentration. Ng et al. (1989) conducted a study on biological treatment of a
pharmaceutical wastewater using activated sludge. The reactor was operated at BSRTs
of 20, 6.67, 4, and 2.86 days with a DO concentration of approximately 0.3 mg/L. It was
discovered that an increase in COD loading produced a corresponding rise in mixed
liquor concentration. Therefore, the increase in biomass was attributed to the change in
influent COD.
2.5.5 Settling Characteristics
Sludge Settling
Sludge bulking, foaming, floc formation, and turbidity are all parameters that
affect settleability. These parameters are negatively impacted by low dissolved oxygen
concentrations and therefore settling characteristics are affected as well (Akca et al.,
1993; Surucu & Cetin, 1990; Foot, 1992; Wilen & Balmer, 1998; Wilen & Balmer, 1999;
Surucu & Cetin, 1989). However, it has been reported that DO concentration alone may
not be the cause of poor settling. Palm et al. (1980) noted that the DO concentration that
would hinder settling was a function of the organic loading rate.
29
Surucu and Cetin (1990) conducted a study in which the DO concentration varied
from set points 0.5, 1.0, 1.5, 2.0, and 5.0 mg/L. Their findings were that DO levels less
than 2.0 mg/L significantly and adversely affect settling characteristics of the activated
sludge. Suspended solids concentrations increased from 67 mg/L to 410 mg/L at DO
concentrations of 5 and 0.5 mg/L respectively. Surucu and Cetin (1990) proposed that
the eucaryote population was inhibited below 2 mg/L DO, which in turn hindered
settling. However, the high organic loading rate used in this experiment could have been
responsible for the settling problems. Palm et al. (1980) reported that the COD/biomass
ratio played a larger role than DO in causing poor sludge settling.
Floc Structure
A useful property of activated sludge is its adsorption ability (Wilen & Balmer,
1998). Guellil et al. (2001) have found that biosorption is a fast process in which a large
portion (45% on average) of the non-settleable fraction of wastewater can be transferred
to activated sludge flocs within a few minutes. However, when DO concentration is low
(<1 mg/L), the sludge flocs tend to lose much of their adsorption capacity. This results in
a much more turbid effluent. The study by Wilen and Balmer (1998) involved decreasing
the DO to zero and monitoring the turbidity over a 1-4 hour time period. It is believed
that the increase in turbidity was not caused by inhibition of eucaryotes for these
experiments because the anaerobic periods were too short. Rather, it was speculated that
the anaerobic period either affected adsorption of contaminants in the wastewater or
caused floc dispersion.
30
Surucu and Cetin (1989) discovered that low DO concentrations affected
compressibility and filterability of activated sludge. Reactors were run at five different
DO levels: 0.5, 1.0, 1.5, 2.0, and 5.0 mg/L. The poor filterability at low DO can be
attributed to a reduction in particle size and the formation of dispersed solids. It has been
found that a well- formed floc contains water, which is easily removed by filtration
(Surucu and Cetin, 1989). Poor settling or pin flocs do not filter well because of their
smaller floc size. The particles are not only small but the water is also in the form of
capillary water, which is much more difficult to remove and causes a high resistance to
compressibility (Surucu and Cetin, 1989). A low DO concentration also produces
smaller floc populations (Wilen and Balmer, 1999). Low DO levels can also cause the
floc to become irregular in shape and porous. Wilen and Balmer (1999) found that these
poorly shaped flocs caused an increase in SVI values for reactors operating at a 5-day
BSRT.
Filamentous Bulking
Bulking sludge can also be a problem in activated sludge treatment plants.
Bulking occurs when aggregates do not compact and form a loose, low-density floc
(Clauss et al., 1998). Higher recycle rates are required because the sludge concentration
becomes low. Bulking sludge can cause huge losses of biomass and thereby reduce
effluent BOD quality. Filamentous organisms have been identified as a major cause of
sludge bulking. The filaments form bridges between flocs and prevent them from
compacting in the clarifier (Foot, 1992). Bridging prevents the flocs from compacting
and traps water between the flocs. Recent studies have found that Microthrix parvicella
31
is the filament most responsible for bulking and foaming (Madoni et al., 2000; Wanner et
al., 2000). The presence of these microorganisms has been attributed to low DO, organic
loading rate, and sludge age.
A DO concentration of 2.0 mg/L has long been established as the level necessary
to prevent excessive growth of filamentous bacteria in activated sludge (Grady et al.,
1999). Several studies have found that settling efficiency can be severely inhibited at low
DO concentrations. However, data by Echeverria et al. (1992) has shown that SVI values
of <100 could be achieved at DO levels lower than 1 mg/L. The landmark study by
Palm et al. (1980) demonstrated that the major factor controlling low DO bulking is the
organic loading rate. The experiment involved controlling the DO at different set points
and increasing the substrate removal rate until the SVI increased. The substrate removal
rate needed to cause settling problems at DO concentrations between 0.1 to 0.5 mg/L was
0.30 mg COD/mg VSS-day. It appears that even at DO concentrations below 0.5 mg/L,
filamentous organisms do not dominate the system provided the organic removal rate is
low enough.
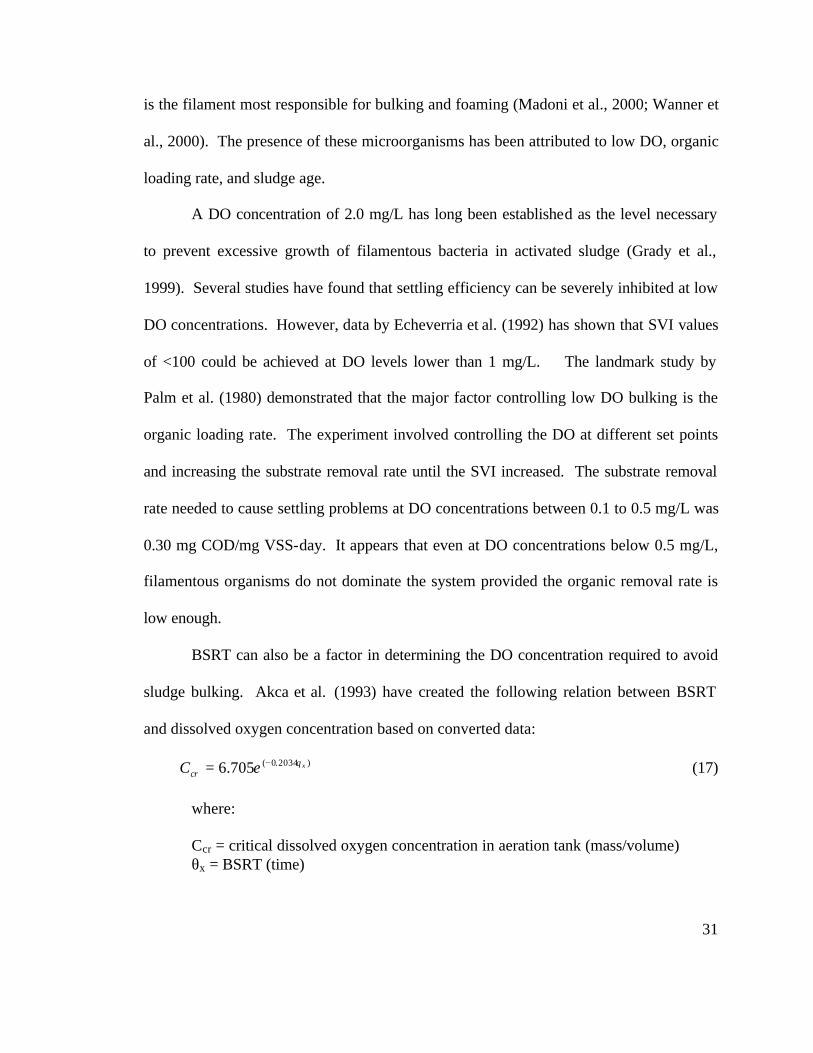
BSRT can also be a factor in determining the DO concentration required to avoid
sludge bulking. Akca et al. (1993) have created the following relation between BSRT
and dissolved oxygen concentration based on converted data:
)2034.0(705.6 xeCcrθ−= (17)
where:
Ccr = critical dissolved oxygen concentration in aeration tank (mass/volume) θx = BSRT (time)

32
This equation shows that a particular BSRT has a critical DO concentration. If
that concentration is not maintained, sludge bulking can occur. This equation also
suggests that the DO must be higher at short BSRTs and lower at long BSRTs in order to
avoid bulking sludge (Akca et al., 1993). However, it should also be noted that filaments
have a minimum BSRT of approximately 1.5-3.0 days so bulking might not occur at the
lower biological solids retention times (Wanner, 1998).
2.6 Determination of Kinetic Coefficients
2.6.1 Nitrification Kinetics
The growth rate of nitrifiers has been found to follow Monod type kinetics. The
rate of this process can be expressed by the following double-substrate limiting equation
(Bae and Rittman, 1996):
+
+
=22
2
11
1max SK
SSK
Sµµ (18)
where:
µ = specific growth rate (time-1) µmax = maximum specific growth rate (time-1)
S1 and S2 = limiting concentrations of each parameter (mass/volume) K1 and K2 = half-saturation constants for parameters S1 and S2 (mass/volume)
This is an interactive model because it assumes that both parameters, oxygen and
ammonia substrate, can influence the rate of nitrification at the same time (Grady et al.,
1999). This equation could also be modeled non- interactively. In that case, it is assumed
that the substrate utilization rate can only be affected by one parameter at a time. For
33
example, the nitrification process is not limited by oxygen at concentrations greater than
2 mg/L, so the second term would drop out of the equation. The interactive model is
more conservative for the type of situation likely to be encountered in wastewater
treatment. It is also more appropriate when one parameter is the electron donor
(substrate) and the other is the electron acceptor (oxygen) (Bae and Rittmann, 1996).
Although the interactive model can be used for describing the effects of dual-
limitation on cell growth, research conducted in the past has used the non- interactive
model for determining kinetic coefficients (Ryder and Sinclair, 1975;Hanaki et al.,
1990;Beccari et al., 1992). Ryder and Sinclair (1975) obtained their kinetic coefficients
by providing one substrate in excess so one term in the Monod model could be neglected.
Therefore, the kinetic analysis for determination of µmax, k, Kd, YA, and KS for the
nitrifiers was conducted at excess DO conditions. The KO value was evaluated last using
data from excess and low DO concentrations.
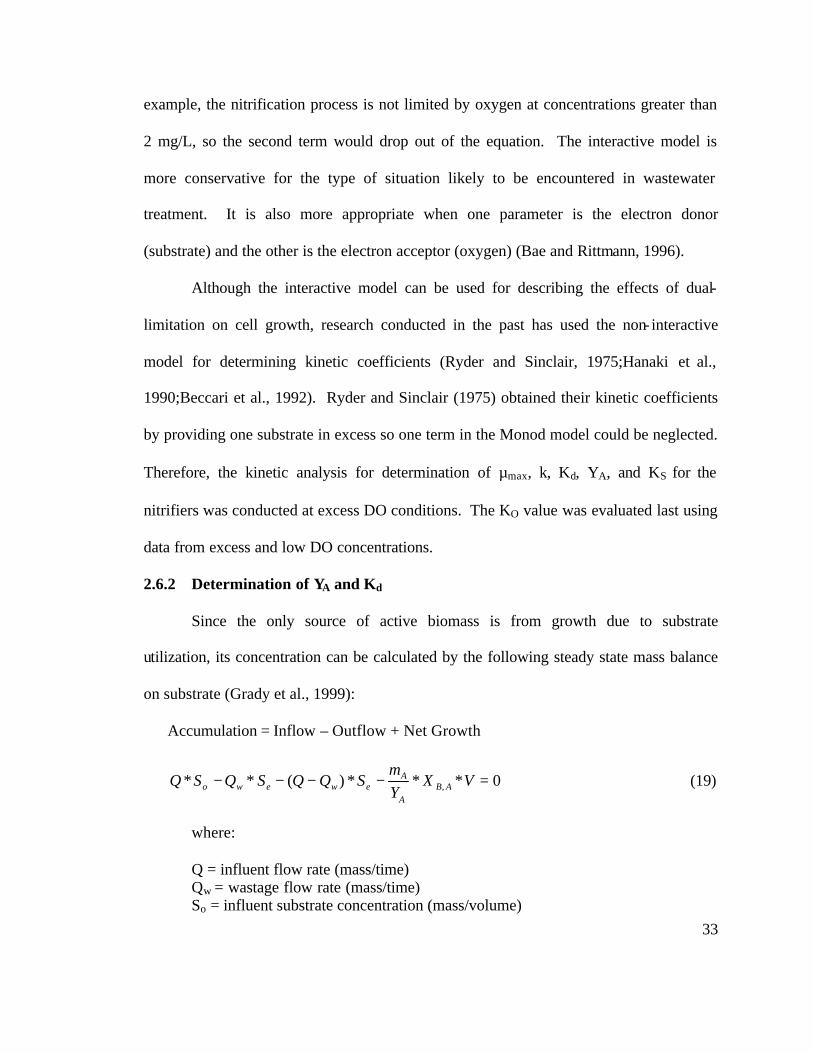
2.6.2 Determination of YA and Kd
Since the only source of active biomass is from growth due to substrate
utilization, its concentration can be calculated by the following steady state mass balance
on substrate (Grady et al., 1999):
Accumulation = Inflow – Outflow + Net Growth
0***)(** , =−−−− VXY
SQQSQSQ ABA
Aewewo
µ (19)
where:
Q = influent flow rate (mass/time) Qw = wastage flow rate (mass/time) So = influent substrate concentration (mass/volume)
34
Se = effluent substrate concentration (mass/volume) XB,A = active autotrophic biomass concentration (mass/volume) V = volume of reactor
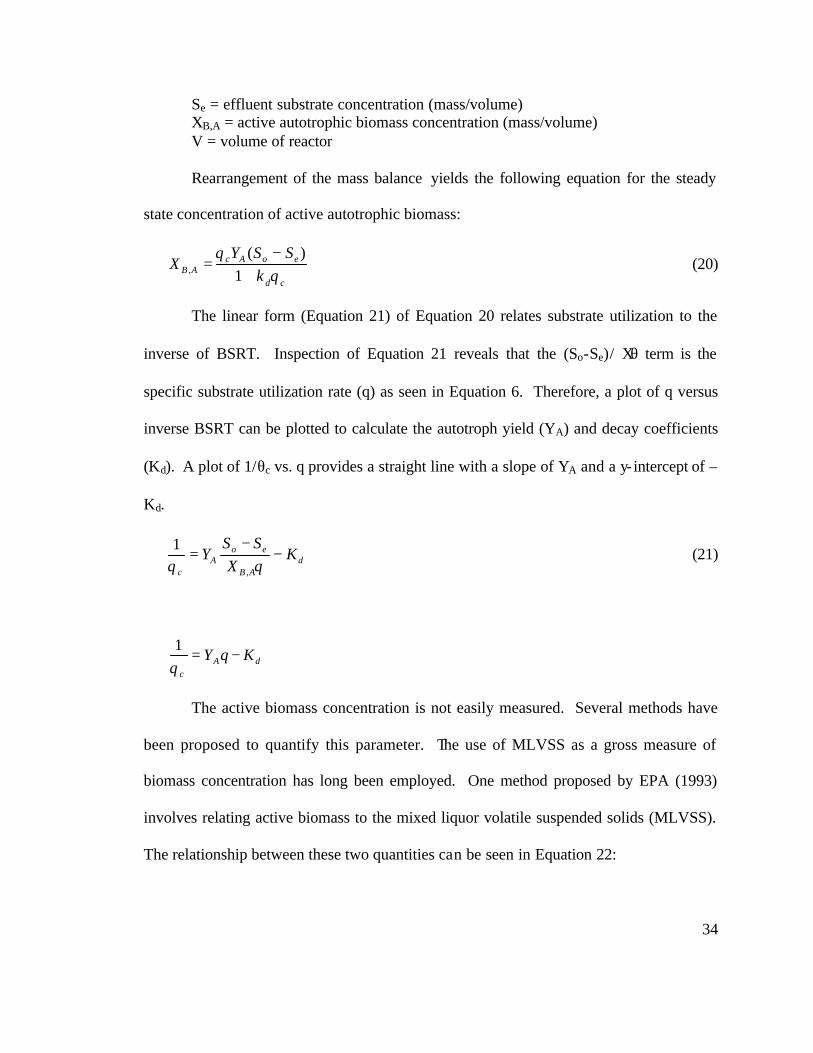
Rearrangement of the mass balance yields the following equation for the steady
state concentration of active autotrophic biomass:
cd
eoAcAB k
SSYX
θθ
+−
=1
)(, (20)
The linear form (Equation 21) of Equation 20 relates substrate utilization to the
inverse of BSRT. Inspection of Equation 21 reveals that the (So-Se)/ Xθ term is the
specific substrate utilization rate (q) as seen in Equation 6. Therefore, a plot of q versus
inverse BSRT can be plotted to calculate the autotroph yield (YA) and decay coefficients
(Kd). A plot of 1/θc vs. q provides a straight line with a slope of YA and a y- intercept of –
Kd.
dAB
eoA
c
KX
SSY −
−=
θθ ,
1 (21)
dAc
KqY −=θ1
The active biomass concentration is not easily measured. Several methods have
been proposed to quantify this parameter. The use of MLVSS as a gross measure of
biomass concentration has long been employed. One method proposed by EPA (1993)
involves relating active biomass to the mixed liquor volatile suspended solids (MLVSS).
The relationship between these two quantities can be seen in Equation 22:

35
cbA f
fθ)1(1
1−+
= (22)
where:
fA = active biomass fraction of MLVSS fb = biodegradable fraction of active biomass (typically = 0.8)
b = decay coefficient (typically = 0.25 d-1 for heterotrophic bacteria treating municipal wastewater)
The active fraction shown in Equation 22 is for all microorganisms and should be
multiplied by the MLVSS to obtain the total active biomass concentration (XT).
Identification of the fraction of nitrifiers to the total population is also difficult. Rittman
et al. (1999) determined the ratio of ammonia oxidizers to heterotrophs using 16S rRNA
probes and found that ammonia oxidizers accounted for approximately 6% of the total
active population. The ratio was very stable for the five municipal WWTPs used in the
study although they were operated at different BSRTs. This finding suggests that if XT
could be calculated then the active ammonia oxidizer population could be estimated using
the aforementioned ratio.
The Rittman et al. (1999) data was insufficient to determine the total nitrifier
active biomass because no information on the nitrite oxidizer population was given.
However, Copp and Murphy (1995) employed a mass estimation technique (MET) to
determine the mass of ammonia and nitrite oxidizers in activated sludge treating
municipal wastewater. Results showed that the Nitrosomonas and Nitrobacter
populations had average concentrations of 16.6 and 6.0 mg VSS/L respectively. This
indicates that ammonia oxidizing bacteria account for approximately 74% of the nitrifier
population. Therefore, the amount of total active nitrifiers can be calculated by dividing
36
the ratio of ammonia oxidizers to the total population (0.06) by the ratio of ammonia
oxidizers to total nitrifiers (0.74). The result is an active autotrophic biomass fraction
(fB,A) of 0.08. This value can be multiplied by XT to obtain XB,A for use in the
determination of YA and Kd.
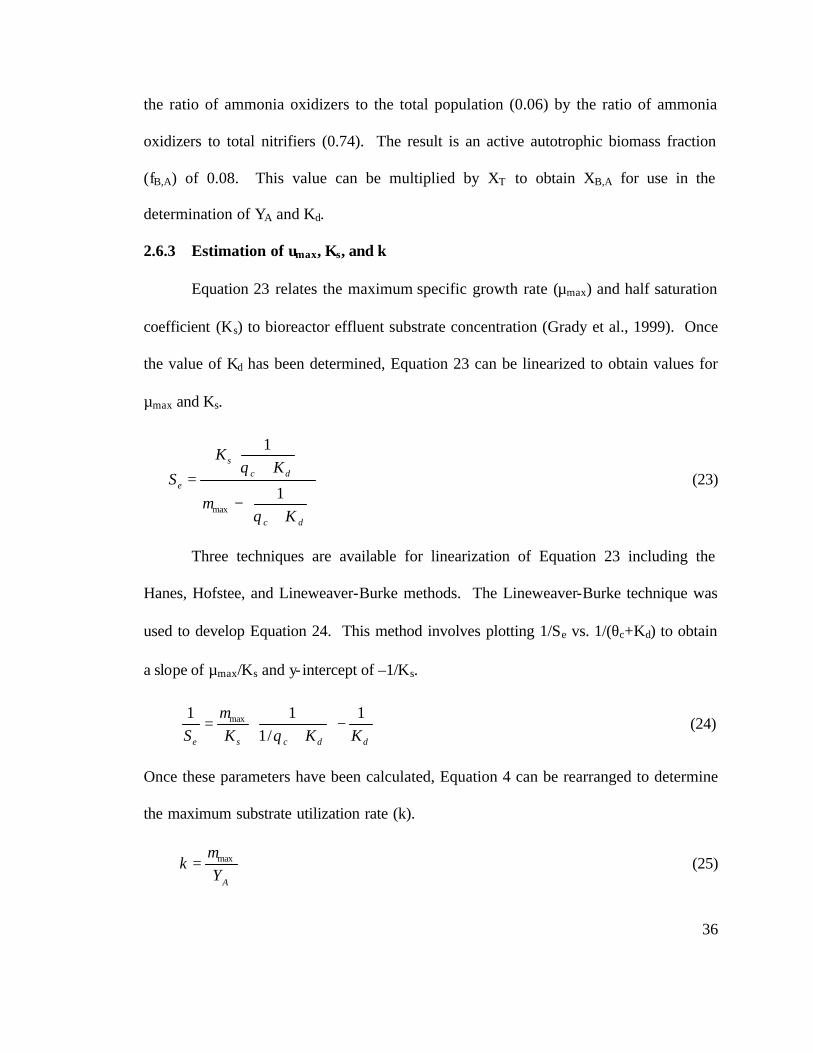
2.6.3 Estimation of umax, Ks, and k
Equation 23 relates the maximum specific growth rate (µmax) and half saturation
coefficient (Ks) to bioreactor effluent substrate concentration (Grady et al., 1999). Once
the value of Kd has been determined, Equation 23 can be linearized to obtain values for
µmax and Ks.
+
−
+
=
dc
dcs
e
K
KK
S
θµ
θ
1
1
max
(23)
Three techniques are available for linearization of Equation 23 including the
Hanes, Hofstee, and Lineweaver-Burke methods. The Lineweaver-Burke technique was
used to develop Equation 24. This method involves plotting 1/Se vs. 1/(θc+Kd) to obtain
a slope of µmax/Ks and y- intercept of –1/Ks.
ddcse KKKS1
/111 max −
+
=θ
µ (24)
Once these parameters have been calculated, Equation 4 can be rearranged to determine
the maximum substrate utilization rate (k).
AY
k maxµ= (25)
37
2.6.4 Estimation of KO
A value for KO can be calculated using data from respirometric batch tests or by
conducting a traditional kinetic analysis. When using the respirometry method, a
respirogram is taken by adding a sample of wastewater to a vessel containing a volume of
endogenous respiring activated sludge (Brouwer et al., 1998). The respiration rate is then
monitored over time and used in the determination of KO. Since respirometry equipment
was unavailable for this study, KO was estimated using kinetic data.
Kinetic analysis has been used by researchers to estimate KO in activated sludge
systems. Sinclair and Ryder (1975) studied the effects of DO limited conditions on
bacteria treating organic carbon. Kinetic data was used to calculate a KO for
heterotrophic bacteria growing in a CSTR. Similarly, Hanaki et al. (1990) used this
technique while evaluating KO for ammonia oxidizers. The method employed by Hanaki
et al. (1990) involved monitoring treatment performance at excess and low DO levels. A
kinetic analysis was then conducted on data from the excess and low DO data separately,
as outlined in Sections 2.6.1 and 2.6.2, to determine the kinetic coefficients µmax and Y.
The purpose of the analysis was to obtain a value of k using Equation 25.
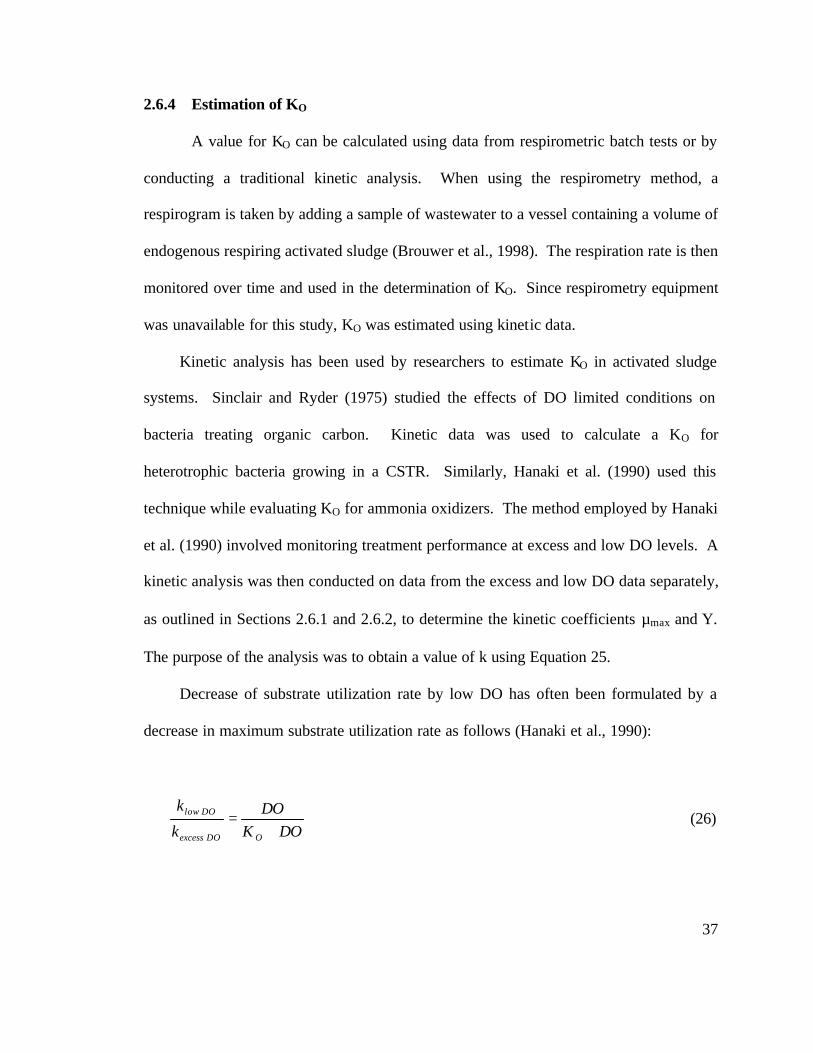
Decrease of substrate utilization rate by low DO has often been formulated by a
decrease in maximum substrate utilization rate as follows (Hanaki et al., 1990):
DOKDO
k
k
ODOexcess
DOlow
+= (26)
38
Hanaki et al. (1990) used Equation 26 to calculate a KO of 0.32 mg/L value by
substituting the k values for low and excess DO conditions and inserting a value of 0.5
mg/L for the DO concentration.
2.7 Nitrification Kinetic Coefficients
Investigations of nitrification in lab experiments and wastewater treatment
systems have produced a variety of coefficient values due to different methods of
estimation. Table 1 is a list of the nitrifier kinetic parameters gathered from a review of
the literature that was used as a basis for comparison with the coefficients obtained in this
treatability study. The effect of method on coefficient value can be seen by the difference
in k values provided by Massone et al. (1998) and Dincer and Kargi (2000). The work of
Massone et al. (1998) involved the use of a titrimetric technique for coefficient
determination while Dincer and Kargi (2000) employed the traditional parameter
estimation technique, outlined in the previous section, to calculate a value for k.
Conversely, Gee et al. (1990) used the same method of coefficient determination as
Dincer and Kargi (2000) resulting in very comparable yields. Another difference relating
to these findings was that most values were for activated sludge while values provided by
Tchobanoglous & Burton (1991) were for pure cultures. Since temperature affects the
rate of nitrification, the values were also different due to a temperature range of 20-25°C
for the different experiments.
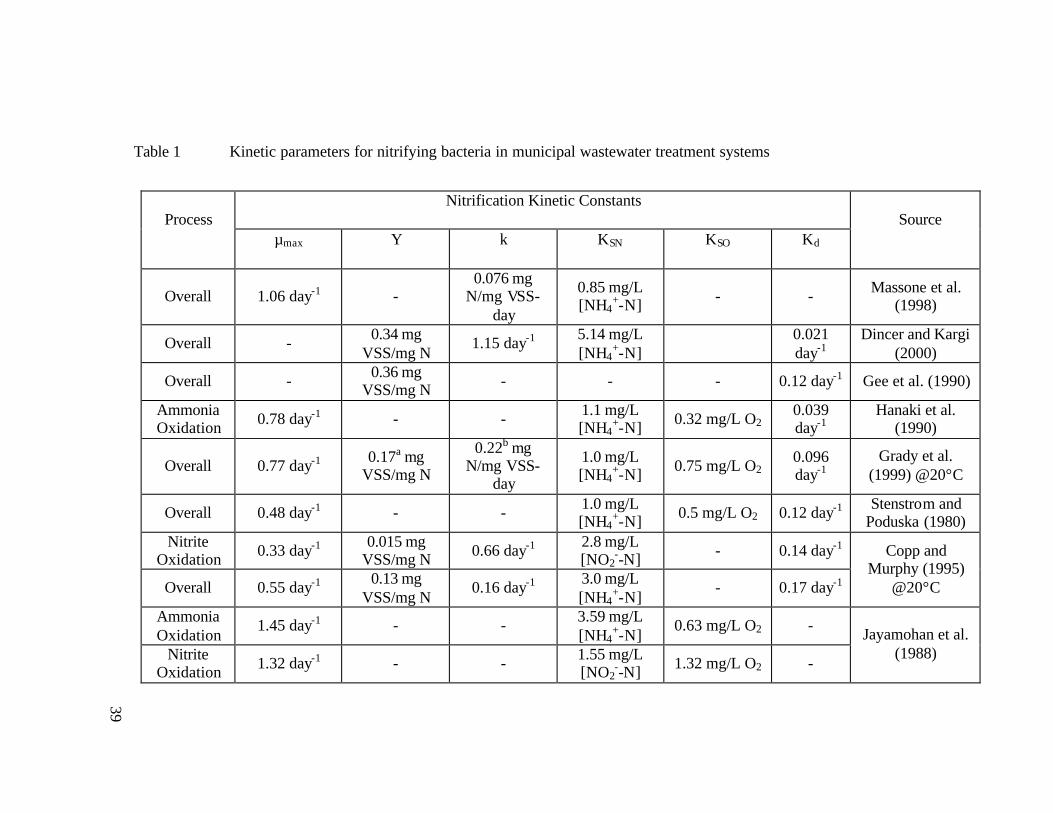
39
Table 1 Kinetic parameters for nitrifying bacteria in municipal wastewater treatment systems
Nitrification Kinetic Constants Process
µmax Y k KSN KSO Kd Source
Overall 1.06 day-1 - 0.076 mg
N/mg VSS-day
0.85 mg/L [NH4
+-N] - - Massone et al. (1998)
Overall - 0.34 mg VSS/mg N
1.15 day-1 5.14 mg/L [NH4
+-N] 0.021
day-1 Dincer and Kargi
(2000)
Overall - 0.36 mg VSS/mg N - - - 0.12 day-1 Gee et al. (1990)
Ammonia Oxidation 0.78 day-1 - - 1.1 mg/L
[NH4+-N] 0.32 mg/L O2 0.039
day-1 Hanaki et al.
(1990)
Overall 0.77 day-1 0.17a mg VSS/mg N
0.22b mg N/mg VSS-
day
1.0 mg/L [NH4
+-N] 0.75 mg/L O2 0.096 day-1
Grady et al. (1999) @20°C
Overall 0.48 day-1 - - 1.0 mg/L [NH4
+-N] 0.5 mg/L O2 0.12 day-1 Stenstrom and Poduska (1980)
Nitrite Oxidation 0.33 day-1 0.015 mg
VSS/mg N 0.66 day-1 2.8 mg/L [NO2
--N] - 0.14 day-1
Overall 0.55 day-1 0.13 mg VSS/mg N
0.16 day-1 3.0 mg/L [NH4
+-N] - 0.17 day-1
Copp and Murphy (1995)
@20°C
Ammonia Oxidation
1.45 day-1 - - 3.59 mg/L [NH4
+-N] 0.63 mg/L O2 -
Nitrite Oxidation 1.32 day-1 - - 1.55 mg/L
[NO2--N] 1.32 mg/L O2 -
Jayamohan et al. (1988)
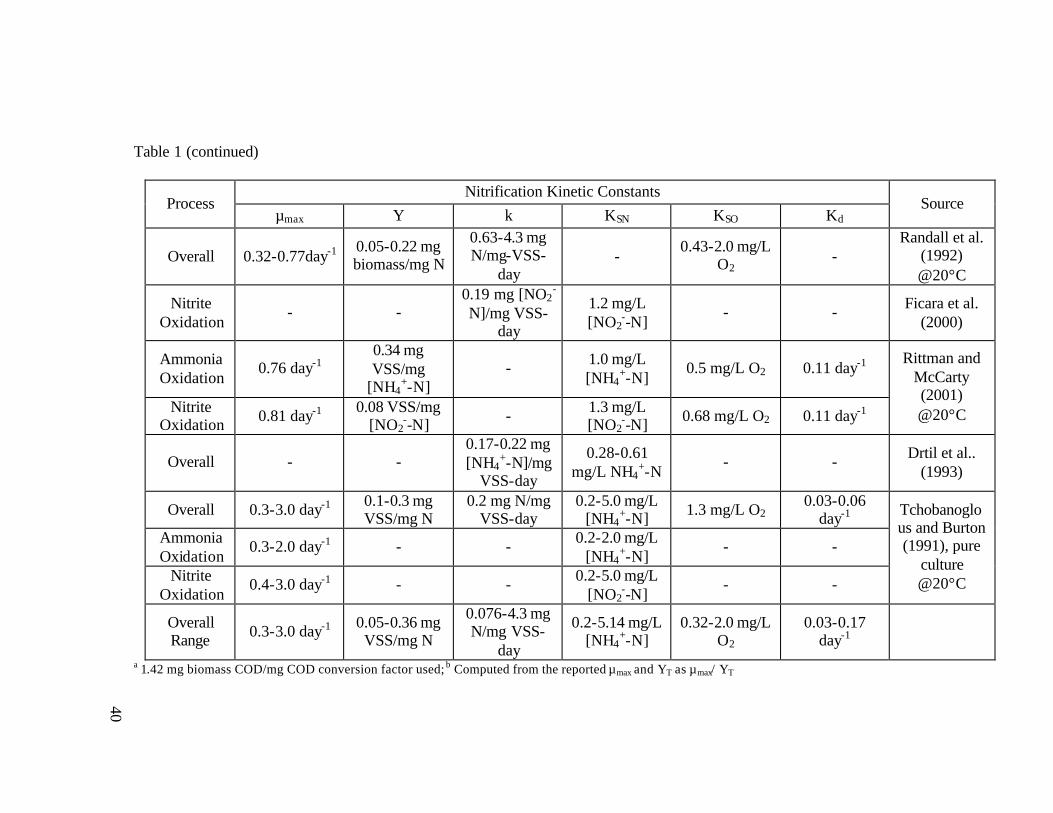
40
Table 1 (continued)
Nitrification Kinetic Constants Process
µmax Y k KSN KSO Kd Source
Overall 0.32-0.77day-1 0.05-0.22 mg biomass/mg N
0.63-4.3 mg N/mg-VSS-
day -
0.43-2.0 mg/L O2 -
Randall et al. (1992) @20°C
Nitrite Oxidation
- - 0.19 mg [NO2
-
N]/mg VSS-day
1.2 mg/L [NO2
--N] - - Ficara et al.
(2000)
Ammonia Oxidation
0.76 day-1 0.34 mg VSS/mg
[NH4+-N]
- 1.0 mg/L [NH4
+-N] 0.5 mg/L O2 0.11 day-1
Nitrite Oxidation 0.81 day-1 0.08 VSS/mg
[NO2--N] - 1.3 mg/L
[NO2--N] 0.68 mg/L O2 0.11 day-1
Rittman and McCarty (2001) @20°C
Overall - - 0.17-0.22 mg [NH4
+-N]/mg VSS-day
0.28-0.61 mg/L NH4
+-N - - Drtil et al..
(1993)
Overall 0.3-3.0 day-1 0.1-0.3 mg VSS/mg N
0.2 mg N/mg VSS-day
0.2-5.0 mg/L [NH4
+-N] 1.3 mg/L O2 0.03-0.06 day-1
Ammonia Oxidation
0.3-2.0 day-1 - - 0.2-2.0 mg/L [NH4
+-N] - -
Nitrite Oxidation
0.4-3.0 day-1 - - 0.2-5.0 mg/L [NO2
--N] - -
Tchobanoglous and Burton (1991), pure
culture @20°C
Overall Range 0.3-3.0 day-1 0.05-0.36 mg
VSS/mg N
0.076-4.3 mg N/mg VSS-
day
0.2-5.14 mg/L [NH4
+-N] 0.32-2.0 mg/L
O2 0.03-0.17
day-1
a 1.42 mg biomass COD/mg COD conversion factor used; b Computed from the reported µmax and YT as µmax/ YT
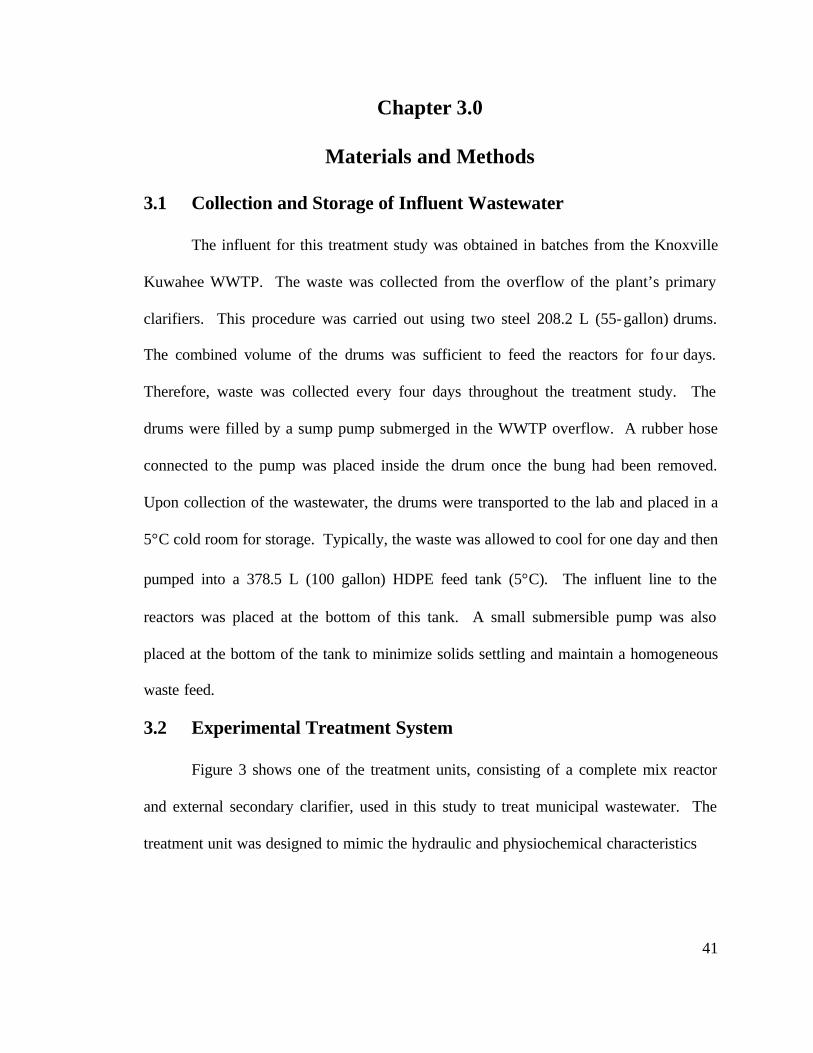
41
Chapter 3.0
Materials and Methods
3.1 Collection and Storage of Influent Wastewater
The influent for this treatment study was obtained in batches from the Knoxville
Kuwahee WWTP. The waste was collected from the overflow of the plant’s primary
clarifiers. This procedure was carried out using two steel 208.2 L (55-gallon) drums.
The combined volume of the drums was sufficient to feed the reactors for four days.
Therefore, waste was collected every four days throughout the treatment study. The
drums were filled by a sump pump submerged in the WWTP overflow. A rubber hose
connected to the pump was placed inside the drum once the bung had been removed.
Upon collection of the wastewater, the drums were transported to the lab and placed in a
5°C cold room for storage. Typically, the waste was allowed to cool for one day and then
pumped into a 378.5 L (100 gallon) HDPE feed tank (5°C). The influent line to the
reactors was placed at the bottom of this tank. A small submersible pump was also
placed at the bottom of the tank to minimize solids settling and maintain a homogeneous
waste feed.
3.2 Experimental Treatment System
Figure 3 shows one of the treatment units, consisting of a complete mix reactor
and external secondary clarifier, used in this study to treat municipal wastewater. The
treatment unit was designed to mimic the hydraulic and physiochemical characteristics
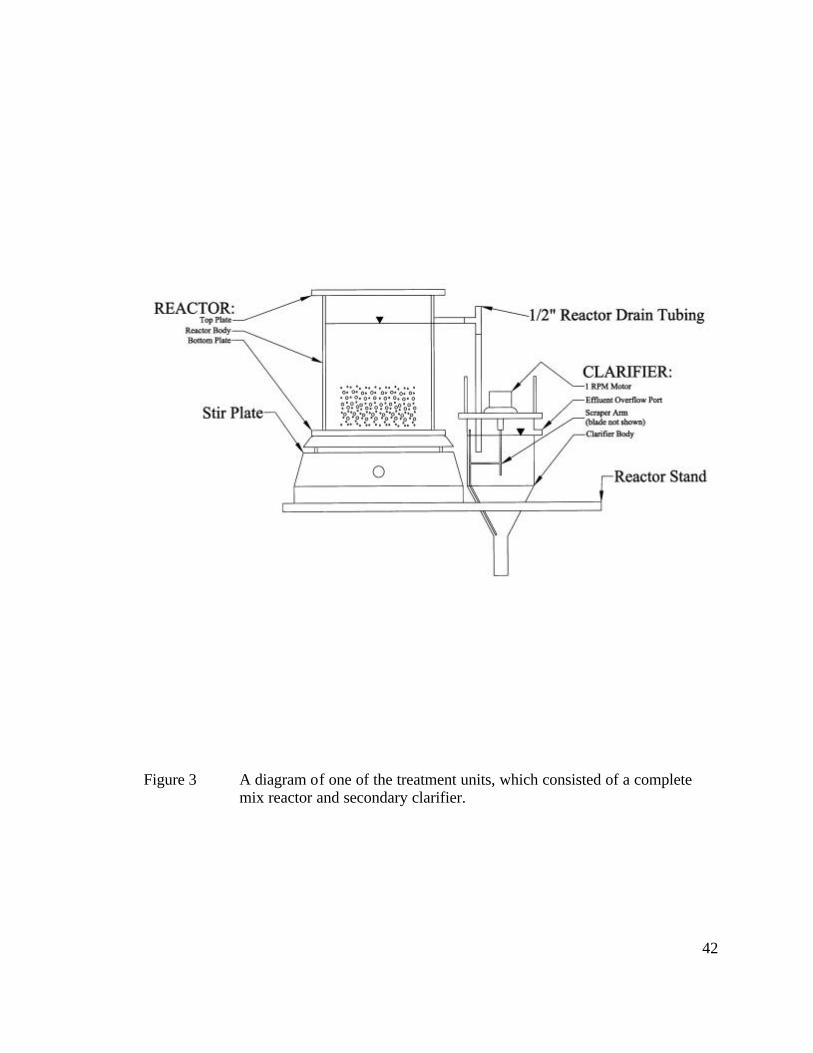
42
Figure 3 A diagram of one of the treatment units, which consisted of a complete mix reactor and secondary clarifier.
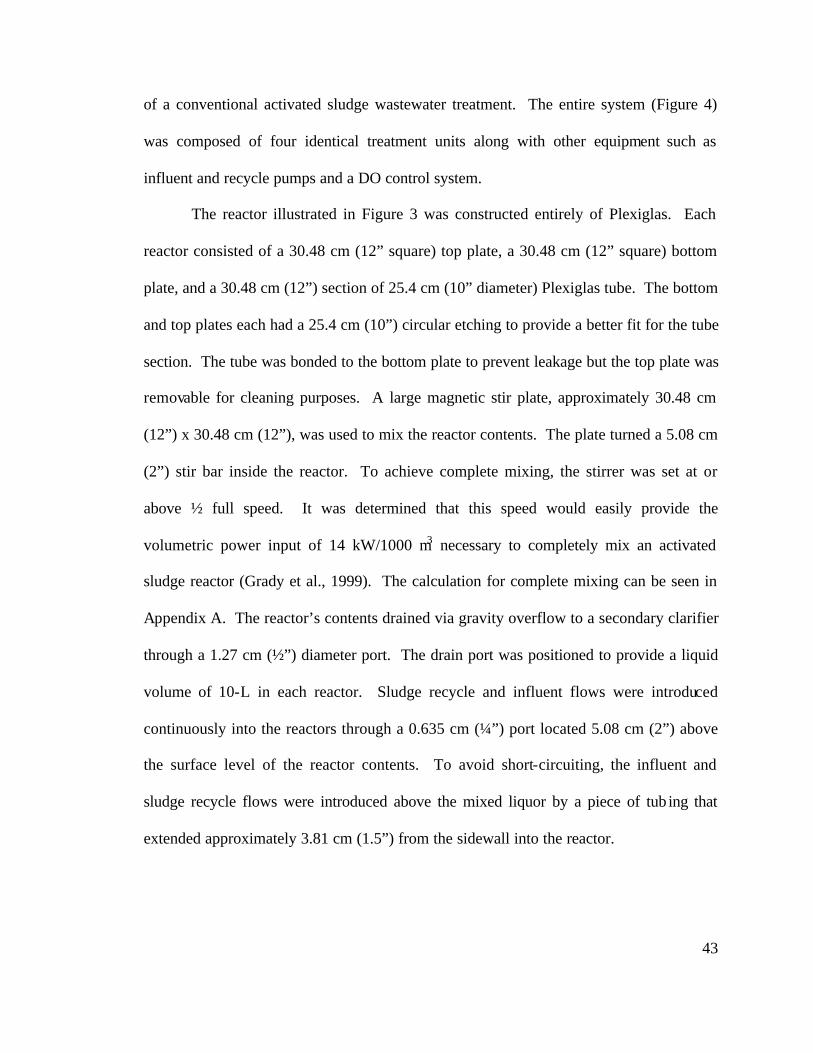
43
of a conventional activated sludge wastewater treatment. The entire system (Figure 4)
was composed of four identical treatment units along with other equipment such as
influent and recycle pumps and a DO control system.
The reactor illustrated in Figure 3 was constructed entirely of Plexiglas. Each
reactor consisted of a 30.48 cm (12” square) top plate, a 30.48 cm (12” square) bottom
plate, and a 30.48 cm (12”) section of 25.4 cm (10” diameter) Plexiglas tube. The bottom
and top plates each had a 25.4 cm (10”) circular etching to provide a better fit for the tube
section. The tube was bonded to the bottom plate to prevent leakage but the top plate was
removable for cleaning purposes. A large magnetic stir plate, approximately 30.48 cm
(12”) x 30.48 cm (12”), was used to mix the reactor contents. The plate turned a 5.08 cm
(2”) stir bar inside the reactor. To achieve complete mixing, the stirrer was set at or
above ½ full speed. It was determined that this speed would easily provide the
volumetric power input of 14 kW/1000 m3 necessary to completely mix an activated
sludge reactor (Grady et al., 1999). The calculation for complete mixing can be seen in
Appendix A. The reactor’s contents drained via gravity overflow to a secondary clarifier
through a 1.27 cm (½”) diameter port. The drain port was positioned to provide a liquid
volume of 10-L in each reactor. Sludge recycle and influent flows were introduced
continuously into the reactors through a 0.635 cm (¼”) port located 5.08 cm (2”) above
the surface level of the reactor contents. To avoid short-circuiting, the influent and
sludge recycle flows were introduced above the mixed liquor by a piece of tub ing that
extended approximately 3.81 cm (1.5”) from the sidewall into the reactor.
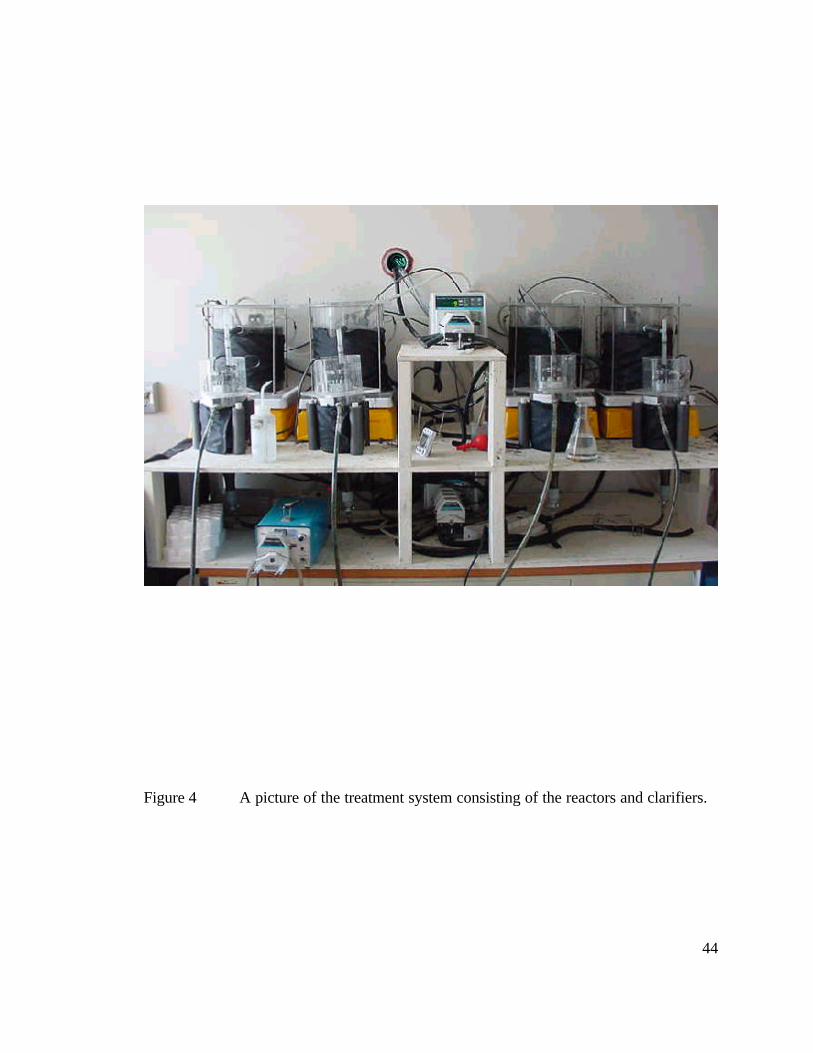
44
Figure 4 A picture of the treatment system consisting of the reactors and clarifiers.
45
The clarifier was composed of two components, a main body and a scraper arm
assembly. The main body was constructed from a 15.24 cm (6”) diameter glass tube by a
commercial glass blowing shop. One end was heated and drawn down from the original
15.24 cm (6”) diameter to a 3.18 cm (1 ¼”) diameter, forming a conical bottom section.
A 7.62 cm (3”) section of 3.18 cm (1 ¼”) glass tube was then welded onto the main body
to serve as a reservoir for sludge scrapings. The conical section sloped approximately
70° from horizontal. The overflow line from the reactor was submerged inside the
clarifier to minimize mixing and disruption of settling. The effluent drain consisted of a
0.953 cm (3/8”) diameter 2.54 cm (1”) long glass tube welded over a precut hole in the
side of the clarifier. The drain was located to provide a liquid volume of 2.90 ± 0.05
liters within the clarifier’s main body.
The second clarifier component was the scraper arm assembly, which was
mounted on top of the clarifier’s main body via a grooved circular trough cut into a 17.78
cm (7”) square, 1.27 cm (½”) thick Plexiglas base plate. A 10.16 cm (4”) long section of
15.24 cm (6”) diameter Plexiglas tube was bonded to this base plate and enclosed the
scraper arm motor. This 1-rpm motor was bolted to the base plate with the motor shaft
penetrating into the clarifier’s main body through a hole drilled in the base plate. The
sludge scraper arm consisted of a 0.318 cm (1/8”) diameter stainless steel wire, which
was shaped to conform to the side of the clarifier wall and mounted to the motor shaft
with setscrews. An automobile wiper blade was placed on the scraper arm to provide a
snug fit against the clarifier wall. The scraper motor was controlled with a timer and
46
every five minutes the motor would engage long enough to rotate the scraper arm
approximately ½ turn.
To discourage photosynthetic growth in the reactors and clarifiers, each was fitted
with a black nylon shroud. In addition, exposed influent and effluent tubes were jacketed
with an opaque cover. Influent and sludge recycle tubing within the pump heads could
not be covered. However, this tubing was replaced periodically due to wear. Air was
provided to each treatment unit through two 15.24 cm (6”) long non-clogging porous
aquarium aerator tubes mounted to the bottom of the reactors by a suction cup. A
laboratory compressed air valve provided the air supply for the reactors. Air from this
valve passed into a pressure regulator, a filter assembly, and into a 20-L carboy fitted
with an airtight cap. Airflow was directed to the bottom of the carboy where it bubbled
up through a water column. This process served to both humidify the air and equalize the
air temperature, preventing excessive evaporation from the reactors during aeration.
From the carboy, air flowed through a condensate trap to a four-way airflow control
metering assembly. This manifold allowed the airflow rate in each reactor to be adjusted
independently. The dissolved oxygen content was maintained using a control system,
which will be discussed in Section 3.3.
The influent and recycle flows were conveyed to the reactor by two identical
peristaltic pumps. One pump was dedicated to each of the flows. The pump rotors were
fitted with four pump heads so that each reactor would receive influent and recycle flows
at exactly the same rate. The influent flow rate was set to 19 mL/min, which provided an
HRT of 8.8 hours in the reactor and 2.5 hours in the clarifier (excluding the recycle flow).
47
The pumps were continuous duty Standard Drive (Cole Parmer, Inc.) designed for
precise control of liquid flow rates, which are electronically adjusted based on tubing
size.
An important feature of the flow system was the influent and effluent sampling
ports, which allowed collection of grab samples of the influent flow to all reactors and the
effluent flow from each clarifier. Grab samples were used because a composite sampler
was not available. The sample ports were placed to yield the most representative grab
samples possible. For example, the influent sample port was located immediately prior to
the influent waste entering the 5-day BSRT reactor. This placement effectively
eliminated concerns about degradation in the storage tank and in the influent lines. The
effluent grab sample ports were located immediately following clarifier overflow. This
placement avoided collection of the effluent after it had passed several feet through
effluent tubing prone to photosynthetic growth.
3.3 Description of DO Control System
To better maintain DO levels in each reactor, a control system (Great Lakes
Instruments), consisting of four (Model 5500-series) DO probes, two (Model D53) DO
analyzers, four solenoid valves and four air blast units was installed. The analyzers, air
blast boxes, and solenoid valves were all mounted on a 1.91 cm (¾”) piece of birch
plywood. The airflow was derived from the in-house compressed air system in the
laboratory and was regulated to approximately 104.4 kPa (15 psi) using a constant
pressure valve.
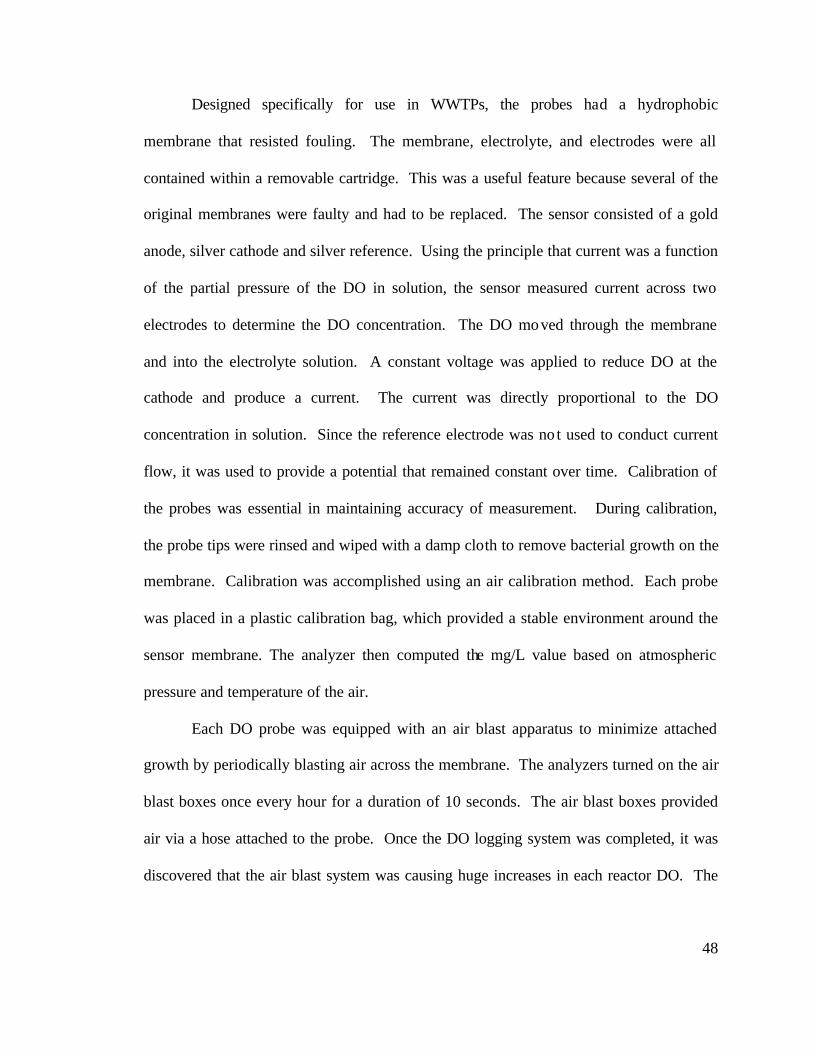
48
Designed specifically for use in WWTPs, the probes had a hydrophobic
membrane that resisted fouling. The membrane, electrolyte, and electrodes were all
contained within a removable cartridge. This was a useful feature because several of the
original membranes were faulty and had to be replaced. The sensor consisted of a gold
anode, silver cathode and silver reference. Using the principle that current was a function
of the partial pressure of the DO in solution, the sensor measured current across two
electrodes to determine the DO concentration. The DO moved through the membrane
and into the electrolyte solution. A constant voltage was applied to reduce DO at the
cathode and produce a current. The current was directly proportional to the DO
concentration in solution. Since the reference electrode was no t used to conduct current
flow, it was used to provide a potential that remained constant over time. Calibration of
the probes was essential in maintaining accuracy of measurement. During calibration,
the probe tips were rinsed and wiped with a damp cloth to remove bacterial growth on the
membrane. Calibration was accomplished using an air calibration method. Each probe
was placed in a plastic calibration bag, which provided a stable environment around the
sensor membrane. The analyzer then computed the mg/L value based on atmospheric
pressure and temperature of the air.
Each DO probe was equipped with an air blast apparatus to minimize attached
growth by periodically blasting air across the membrane. The analyzers turned on the air
blast boxes once every hour for a duration of 10 seconds. The air blast boxes provided
air via a hose attached to the probe. Once the DO logging system was completed, it was
discovered that the air blast system was causing huge increases in each reactor DO. The
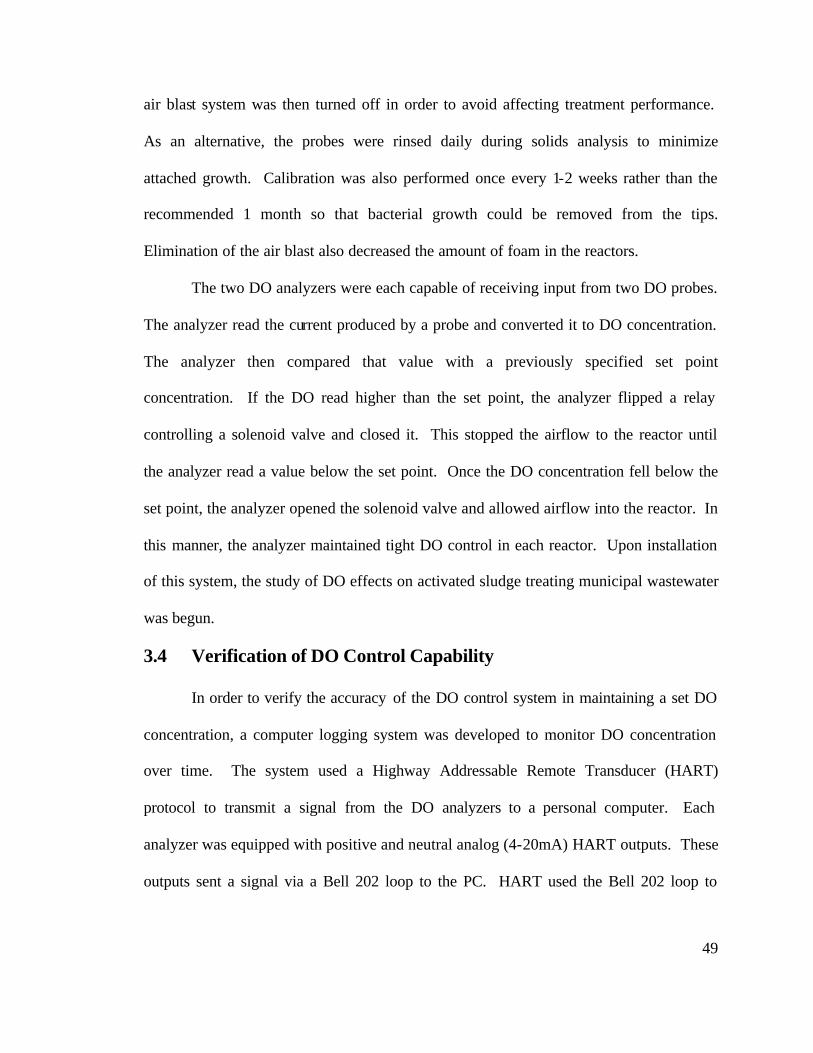
49
air blast system was then turned off in order to avoid affecting treatment performance.
As an alternative, the probes were rinsed daily during solids analysis to minimize
attached growth. Calibration was also performed once every 1-2 weeks rather than the
recommended 1 month so that bacterial growth could be removed from the tips.
Elimination of the air blast also decreased the amount of foam in the reactors.
The two DO analyzers were each capable of receiving input from two DO probes.
The analyzer read the current produced by a probe and converted it to DO concentration.
The analyzer then compared that value with a previously specified set point
concentration. If the DO read higher than the set point, the analyzer flipped a relay
controlling a solenoid valve and closed it. This stopped the airflow to the reactor until
the analyzer read a value below the set point. Once the DO concentration fell below the
set point, the analyzer opened the solenoid valve and allowed airflow into the reactor. In
this manner, the analyzer maintained tight DO control in each reactor. Upon installation
of this system, the study of DO effects on activated sludge treating municipal wastewater
was begun.
3.4 Verification of DO Control Capability
In order to verify the accuracy of the DO control system in maintaining a set DO
concentration, a computer logging system was developed to monitor DO concentration
over time. The system used a Highway Addressable Remote Transducer (HART)
protocol to transmit a signal from the DO analyzers to a personal computer. Each
analyzer was equipped with positive and neutral analog (4-20mA) HART outputs. These
outputs sent a signal via a Bell 202 loop to the PC. HART used the Bell 202 loop to
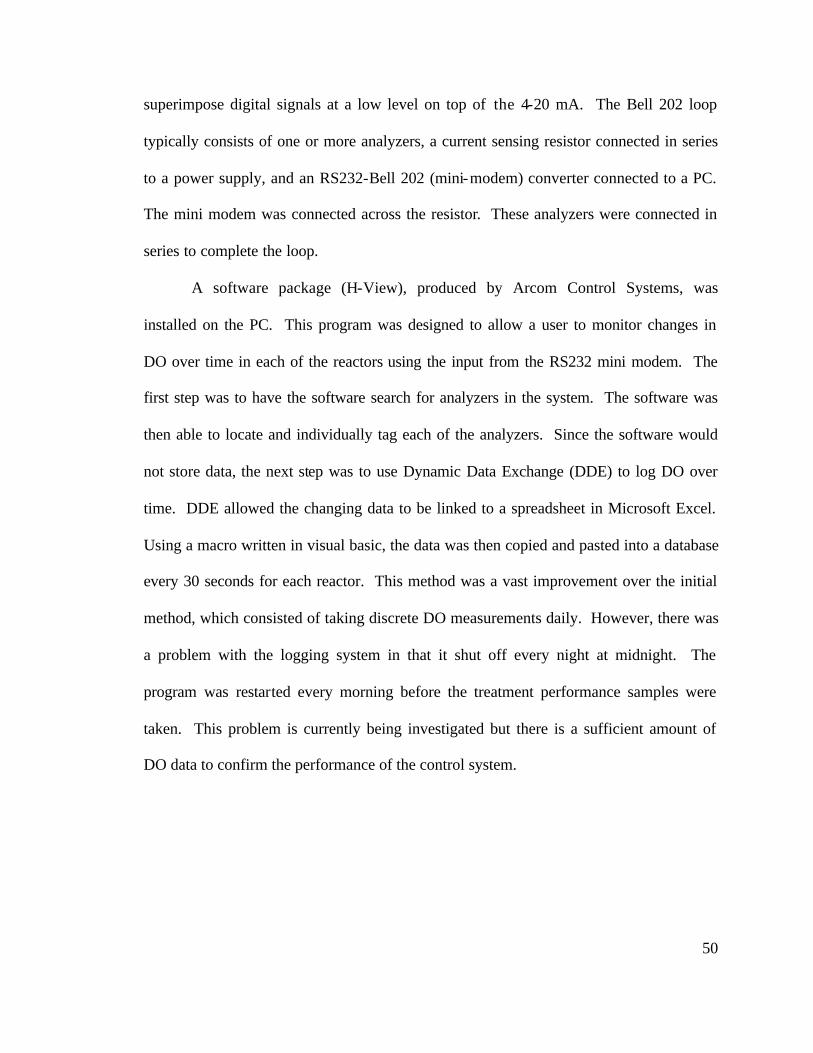
50
superimpose digital signals at a low level on top of the 4-20 mA. The Bell 202 loop
typically consists of one or more analyzers, a current sensing resistor connected in series
to a power supply, and an RS232-Bell 202 (mini-modem) converter connected to a PC.
The mini modem was connected across the resistor. These analyzers were connected in
series to complete the loop.
A software package (H-View), produced by Arcom Control Systems, was
installed on the PC. This program was designed to allow a user to monitor changes in
DO over time in each of the reactors using the input from the RS232 mini modem. The
first step was to have the software search for analyzers in the system. The software was
then able to locate and individually tag each of the analyzers. Since the software would
not store data, the next step was to use Dynamic Data Exchange (DDE) to log DO over
time. DDE allowed the changing data to be linked to a spreadsheet in Microsoft Excel.
Using a macro written in visual basic, the data was then copied and pasted into a database
every 30 seconds for each reactor. This method was a vast improvement over the initial
method, which consisted of taking discrete DO measurements daily. However, there was
a problem with the logging system in that it shut off every night at midnight. The
program was restarted every morning before the treatment performance samples were
taken. This problem is currently being investigated but there is a sufficient amount of
DO data to confirm the performance of the control system.
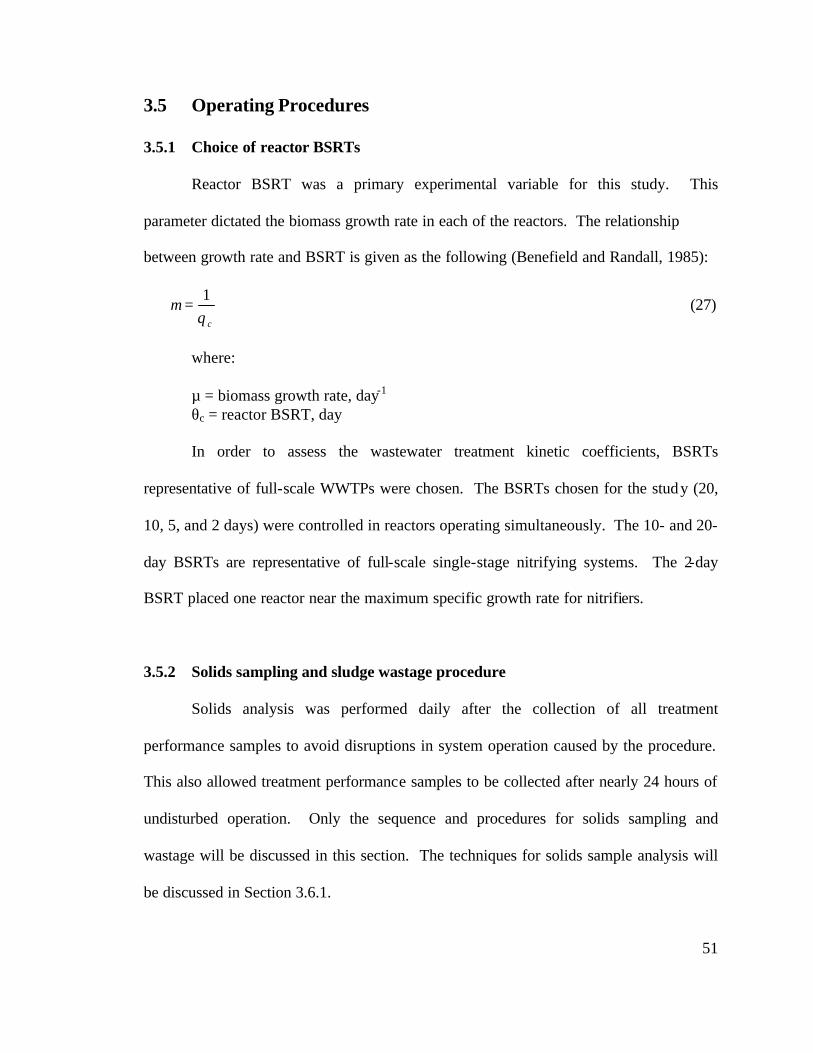
51
3.5 Operating Procedures
3.5.1 Choice of reactor BSRTs
Reactor BSRT was a primary experimental variable for this study. This
parameter dictated the biomass growth rate in each of the reactors. The relationship
between growth rate and BSRT is given as the following (Benefield and Randall, 1985):
cθµ
1= (27)
where:
µ = biomass growth rate, day-1 θc = reactor BSRT, day
In order to assess the wastewater treatment kinetic coefficients, BSRTs
representative of full-scale WWTPs were chosen. The BSRTs chosen for the study (20,
10, 5, and 2 days) were controlled in reactors operating simultaneously. The 10- and 20-
day BSRTs are representative of full-scale single-stage nitrifying systems. The 2-day
BSRT placed one reactor near the maximum specific growth rate for nitrifiers.
3.5.2 Solids sampling and sludge wastage procedure
Solids analysis was performed daily after the collection of all treatment
performance samples to avoid disruptions in system operation caused by the procedure.
This also allowed treatment performance samples to be collected after nearly 24 hours of
undisturbed operation. Only the sequence and procedures for solids sampling and
wastage will be discussed in this section. The techniques for solids sample analysis will
be discussed in Section 3.6.1.
52
Following collection of treatment performance samples, the influent and solids
recycle pumps were shut off. The effluent port of each reactor was then stoppered with a
thick wire brush and the recycle pump was turned on at full capacity to return all sludge
in the clarifier to the reactor. After all solids were returned to the respective reactors, the
recycle pump was again shut off along with the aerator and stirrer. The aeration and
magnetic stirrer were only turned off for a few minutes to allow the sludge to settle below
the effluent port. The reactors were then unstopped and clear reactor effluent was then
allowed to flow into the clarifier. This process allowed for the retention of all biomass in
the reactor.
Samples were taken from the 40-L carboys for 24-hr averaged effluent suspended
solids (ESS) determination. The contents were stirred to obtain a representative sample
for ESS analysis. The samples were withdrawn with a pump into volumetric flasks at
sample volumes ranging from 100 to 400 mL. Note that photosynthetic growth was
discouraged by occasionally cleaning the carboys with a dilute bleach solution. The
carboys were carefully rinsed afterward to remove the bleach solution. This measure was
taken to minimize the amount of wall attached growth that could slough off and affect
ESS measurements.
Once the reactors were unstopped, the aeration and mixing units were turned back
on to resuspend the biomass. After a couple minutes of mixing, 10 or 20 mL samples of
mixed liquor were taken from each reactor using wide-mouth serological pipettes.
During sampling, the pipettes were placed near the center of each reactor. The samples
were withdrawn with a battery-powered auto-pipette and sample volumes were noted on
53
a daily solids analysis/sludge wastage procedure log. Following MLSS sampling, mixed
liquor was collected and stored in an -80°C freezer for molecular analysis at a later time.
At this point, sludge volume index (SVI) analysis was performed on each of the reactors.
A 1 L sample of mixed liquor was pumped into a graduated cylinder and allowed to settle
for 30 minutes. Upon completion of the SVI tests, the samples were mixed and placed
back in each corresponding reactor.
Influent and recycle pumps were then restarted after which daily cleaning and
maintenance of the reactors was performed. After analysis of MLSS and ESS samples
was complete, the wastage volume was determined using the following equation:
MLSSESSQVMLSS
umeWastageVolc
R ***
−=
θ (28)
where:
MLSS = mixed liquor suspended solids (mg/L)
VR = volume of reactor (L)
θc = desired BSRT (day)
ESS = effluent suspended solids concentration (mg/L)
Q = influent flow rate (L/day)
The calculated volumes were then removed from each reactor and immediately
replaced with the same volume of effluent from the respective carboys. Wastage
volumes were replaced by reactor effluent to eliminate any effects that adding tap or
deionized water might have on the activated sludge. The procedure was modified for the
2-day BSRT reactor due to its relatively low MLSS concentration and high wastage
volume. The wastage volume was split into two equal parts that were removed

54
approximately eight to twelve hours apart. One wastage event was thought to present too
much of a disturbance for proper steady–state operation of the reactor.
3.5.3 Treatment Performance Sampling Procedure
The types of samples collected to assess reactor treatment performance are listed
in Table 2. Influent samples were collected as grab samples by unclamping a tube that
was connected, by a tee, to the 5-day BSRT reactor influent line. The tube was placed in
a container and the influent pump provided the necessary volume of sample. Effluent
samples (except ESS) were collected by removing the tubing that ran from the clarifier to
the carboy. The samples were then collected by gravity flow from the clarifier to a
sample container. This procedure was followed on a daily basis, with the exception of a
few days, from the start of the treatment study in June until its conclusion in January. It
should be noted that only 50 mLs of sample were required to conduct the alkalinity
analysis. Therefore, volumes obtained for anion and COD analysis were taken from the
sample volume collected for alkalinity analysis.
Table 2 Sample volumes collected for each type of analysis
Analysis Volume Collected Ammonium 100 mL Alkalinity 75-100 mL
Chemical Oxygen Demand (COD) 5-7 mL Anions (NO3
- and NO2-) 3-5 mL
55
3.6 Sampling and Analysis Procedures
3.6.1 Solids Sampling and Analysis Procedure
MLSS and ESS
Daily samples of the reactor MLSS and ESS were taken as described in Section 3.5.2.
The mixed liquor was carefully removed from each reactor using a 10 mL pipette and
then discharged and rinsed onto a 1.5 µm x 47 mm glass fiber filter (Proweigh by
Environmental Express). The samples were analyzed to determine the MLSS and ESS
according to standard Method 2450 D, Total Suspended Solids Dried at 103-105°C
(APHA, 1998). MLSS and ESS concentrations were then calculated using the following
equation:
1000*/V
WWLsolidssuspendedmg IFF −
= (29)
where:
mg suspended solids/L = MLSS or ESS (mg/L) WFF = final weight of filter (mg) WI = initial weight of filter (mg) V = volume of sample (L)
MLVSS
MLVSS values were determined to obtain a closer approximation of the
biological component in each reactor. This analysis was conducted daily according to
Standard Method 2540 e, Fixed and Volatile Solids Ignited at 550°C (APHA, 1998). The
filter containing dried solids used for MLSS analysis was placed in a muffle furnace and

56
combusted for a minimum of 15 minutes at 550°C. MLVSS was calculated using the
following equation:
1000*/V
WWLsolidssuspendedvolatilemg FVFF −
= (30)
where:
mg volatile suspended solids/L = MLVSS (mg/L) WFF = final filter weight from the MLSS analysis (mg) WFV = final filter weight after MLVSS analysis (mg) V = volume of sample (L) SVI
The settling characteristics of the each reactor were monitored daily using a
modification of Standard Method 2710 D, Sludge Volume Index, (APHA, 1998). The
term SVI relates the volume in milliliters occupied by 1 gram of a biological suspension
after 30 minutes of settling. Modification of Standard Method 2710 D was necessary
because a settling column was not available with the stirring mechanism specified in the
Standard Method. The modified procedure involved pumping completely mixed
activated sludge from each reactor into 1-L volumetric graduated cylinders. The settled
volume was recorded after 30 minutes of quiescent settling. The following equation was
used to determine SVI:
1000*MLSSSSV
SVI = (31)
where:
57
SVI = sludge volume index (mL/g) SSV = settled sludge volume (mL/L) MLSS = mixed liquor suspended solids (mg/L)
3.6.2 Chemical analyses to document wastewater treatment performance
Ammonium sampling and analysis procedures
Samples were collected on a daily basis throughout the treatability study to
document the ammonia oxidizer performance for the various DO concentrations. An
effluent grab sample from each of the four reactors and one influent grab sample were
collected in 150 mL Erlenmeyer flasks from the sample locations discussed in Section
3.5.3. Immediately following sample collection, 100 mLs were withdrawn with a
volumetric pipette and placed in another flask. The samples were allowed to reach room
temperature prior to analysis. The purpose of this procedure was to assure that the
sample quantities and temperatures were the same as the ammonium standards. On days
when ammonium analysis was not performed, samples were preserved by addition of 200
µL of concentrated H2SO4, stoppered, and refrigerated at 4°C. Four standards, 0.1, 0.5, 5
and 50 mg/L, and a quality control were always analyzed with the samples collected from
the reactors. Analysis of ammonium concentration was conducted in accordance with
Standard Method 4500 D, Ammonia-Selective Electrode Method (APHA, 1998). An
Orion Model 95-12 probe was used for the analysis as suggested by the method.
Alkalinity sampling and analysis procedures
Since nitrification consumes alkalinity at a high rate, alkalinity analyses of
influent and reactor effluent samples were used to verify that the wastewater was

58
sufficiently buffered to prevent depression of pH. This analysis was also used to verify
the theoretical alkalinity consumption ratio of 7.14 mg alkalinity as CaCO3/ mg of NH4+
oxidized to nitrate. Alkalinity samples were collected as grab samples in 150 mL
Erlenmeyer flasks. Using a volumetric pipette, 50 mLs were then taken from the flask
and used for analysis according to Standard Method 2320 B, Titration Method (APHA,
1998).
Anions sampling and analysis procedure
Anions samples were collected to confirm the removal of ammonia and assess the
performance of nitrite oxidizers at the various BSRTs and DO concentrations. The
influent and effluent grab samples used for this analysis were taken from the same 150
mL Erlenmeyer flasks used for alkalinity analysis. Three to five mLs of sample were
taken from the flask with a syringe and filtered (0.45 µm Gelman filter) into auto-sample
vials. The samples were analyzed on a Dionex DX 100 and a Dionex DX 500 Ion
Chromatograph (IC) fitted with an Ionpac AS9HC 4mm anion column according to
Standard Method 4110 B, Ion Chromatography with Chemical Suppression of Eluent
Conductivity (APHA, 1998). For each batch of samples, the IC was first calibrated with
four standards. Each standard contained a different concentration of all anions of
interest. One QC sample was also analyzed during each analytical run. Samples not
analyzed immediately were stored at 4°C for a maximum of 48 hours.
COD sampling and analysis procedures
Carbon treatment efficiency was documented with analysis of influent Total
Chemical Oxygen Demand (CODt) and effluent Soluble Chemical Oxygen Demand
59
(CODs). The reasoning behind using CODs for the effluent rather than CODt was that
filtration of effluent samples would remove the variability in the test caused by daily
fluctuations in ESS. Due to cost and labor considerations, this analysis could not be
performed on a daily basis. The samples were preserved as they were collected with
concentrated H2SO4. The acid was added at a rate of 2 mL per liter of sample collected.
These samples also came from the flasks used to obtain alkalinity samples. The effluent
samples were filtered at the same time as the samples used for anion analysis. Samples
were ultimately placed in sterile 15 mL centrifuge tubes. The preservative was then added
(30 µL) and the tube was vigorously hand shaken. Samples were stored for a maximum
of 28 days at 4°C. This sample preservation method follows the recommendations given
by Standard Methods (APHA, 1998).
Analysis of CODt and CODs was conducted using Standard Method 5220 D,
Closed reflux Colorimetric Method (APHA, 1998). Specifically, micro-COD test vials
from Hach, Inc. were used to minimize disposal waste and testing time. For each set of
COD samples analyzed, five COD standards were simultaneously analyzed to establish a
standard absorption curve. COD standards were prepared using dried potassium
hydrogen phthalate (KHP) in accordance with the Standard Method.
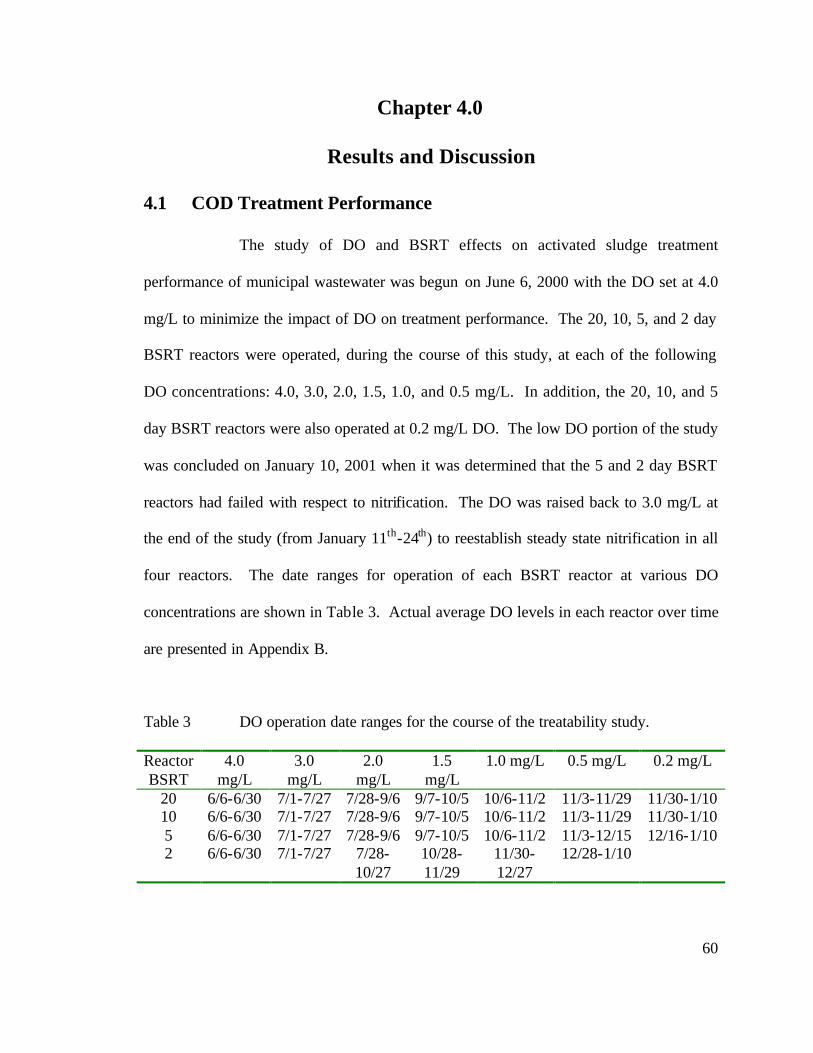
60
Chapter 4.0
Results and Discussion
4.1 COD Treatment Performance
The study of DO and BSRT effects on activated sludge treatment
performance of municipal wastewater was begun on June 6, 2000 with the DO set at 4.0
mg/L to minimize the impact of DO on treatment performance. The 20, 10, 5, and 2 day
BSRT reactors were operated, during the course of this study, at each of the following
DO concentrations: 4.0, 3.0, 2.0, 1.5, 1.0, and 0.5 mg/L. In addition, the 20, 10, and 5
day BSRT reactors were also operated at 0.2 mg/L DO. The low DO portion of the study
was concluded on January 10, 2001 when it was determined that the 5 and 2 day BSRT
reactors had failed with respect to nitrification. The DO was raised back to 3.0 mg/L at
the end of the study (from January 11th-24th) to reestablish steady state nitrification in all
four reactors. The date ranges for operation of each BSRT reactor at various DO
concentrations are shown in Table 3. Actual average DO levels in each reactor over time
are presented in Appendix B.
Table 3 DO operation date ranges for the course of the treatability study. Reactor BSRT
4.0 mg/L
3.0 mg/L
2.0 mg/L
1.5 mg/L
1.0 mg/L 0.5 mg/L 0.2 mg/L
20 6/6-6/30 7/1-7/27 7/28-9/6 9/7-10/5 10/6-11/2 11/3-11/29 11/30-1/10 10 6/6-6/30 7/1-7/27 7/28-9/6 9/7-10/5 10/6-11/2 11/3-11/29 11/30-1/10 5 6/6-6/30 7/1-7/27 7/28-9/6 9/7-10/5 10/6-11/2 11/3-12/15 12/16-1/10 2 6/6-6/30 7/1-7/27 7/28-
10/27 10/28-11/29
11/30-12/27
12/28-1/10

61
To ensure that the control system actually maintained the DO levels shown in
Table 3, a logging system was installed to monitor DO control performance. Logging of
DO data began on December 12, 2000. It was discovered that DO control of the 20-day
BSRT reactor was inefficient at the 0.2 mg/L set point. This problem has been attributed
to the high solids content interfering with the probe. The probe in this reactor could
regularly be found reading 0.05 mg/L. This condition would have kept air running to the
reactor at all times. Upon shaking the probe, the DO would quickly increase to well over
2 mg/L. For this reason, 0.2 mg/L data for the 20-day BSRT reactor was excluded from
analysis.
Conversely, the 10- and 5-day BSRT DO control systems provided tight control
throughout the period of logging. The average DO concentration and standard deviation
for the 10-day BSRT reactor were 0.19 mg/L and 0.04 mg/L respectively. An average
DO level of 0.23 mg/L was found in the 5-day BSRT reactor with a standard deviation of
0.08 mg/L. The 2-day BSRT reactor was switched from 1.0 to 0.5 mg/L DO
concentration about two weeks after logging began. The average DO concentrations
were 0.99 and 0.57 mg/L respectively with standard deviations of 0.10 and 0.15. It
should be noted that the 2-day BSRT reactor DO probe became very dirty and
malfunctioned during the period of December 24th-January 1st. All data on these days has
been excluded from consideration. Upon cleaning and calibration of the probe, DO
control was restored in the 2-day BSRT reactor.
Once the low DO study was concluded and the probes were returned to 3.0 mg/L,
the 20-day BSRT control system began to function correctly again. The 20-day BSRT
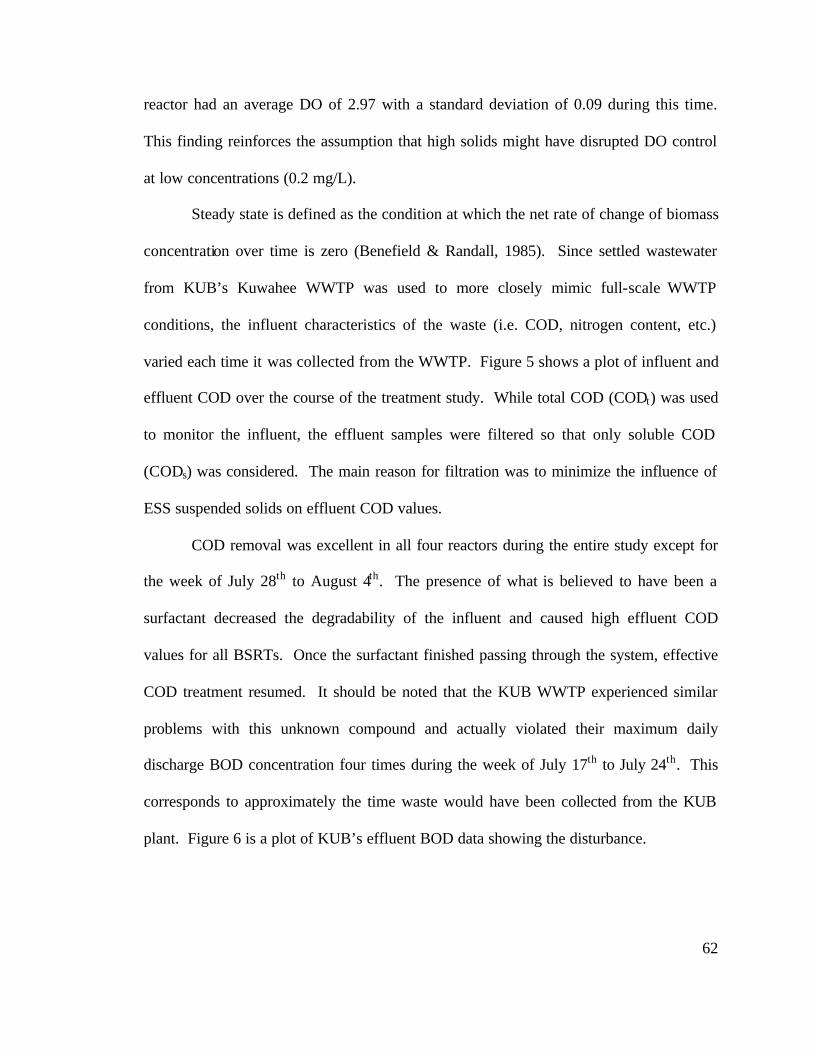
62
reactor had an average DO of 2.97 with a standard deviation of 0.09 during this time.
This finding reinforces the assumption that high solids might have disrupted DO control
at low concentrations (0.2 mg/L).
Steady state is defined as the condition at which the net rate of change of biomass
concentration over time is zero (Benefield & Randall, 1985). Since settled wastewater
from KUB’s Kuwahee WWTP was used to more closely mimic full-scale WWTP
conditions, the influent characteristics of the waste (i.e. COD, nitrogen content, etc.)
varied each time it was collected from the WWTP. Figure 5 shows a plot of influent and
effluent COD over the course of the treatment study. While total COD (CODt) was used
to monitor the influent, the effluent samples were filtered so that only soluble COD
(CODs) was considered. The main reason for filtration was to minimize the influence of
ESS suspended solids on effluent COD values.
COD removal was excellent in all four reactors during the entire study except for
the week of July 28th to August 4th. The presence of what is believed to have been a
surfactant decreased the degradability of the influent and caused high effluent COD
values for all BSRTs. Once the surfactant finished passing through the system, effective
COD treatment resumed. It should be noted that the KUB WWTP experienced similar
problems with this unknown compound and actually violated their maximum daily
discharge BOD concentration four times during the week of July 17th to July 24th. This
corresponds to approximately the time waste would have been collected from the KUB
plant. Figure 6 is a plot of KUB’s effluent BOD data showing the disturbance.
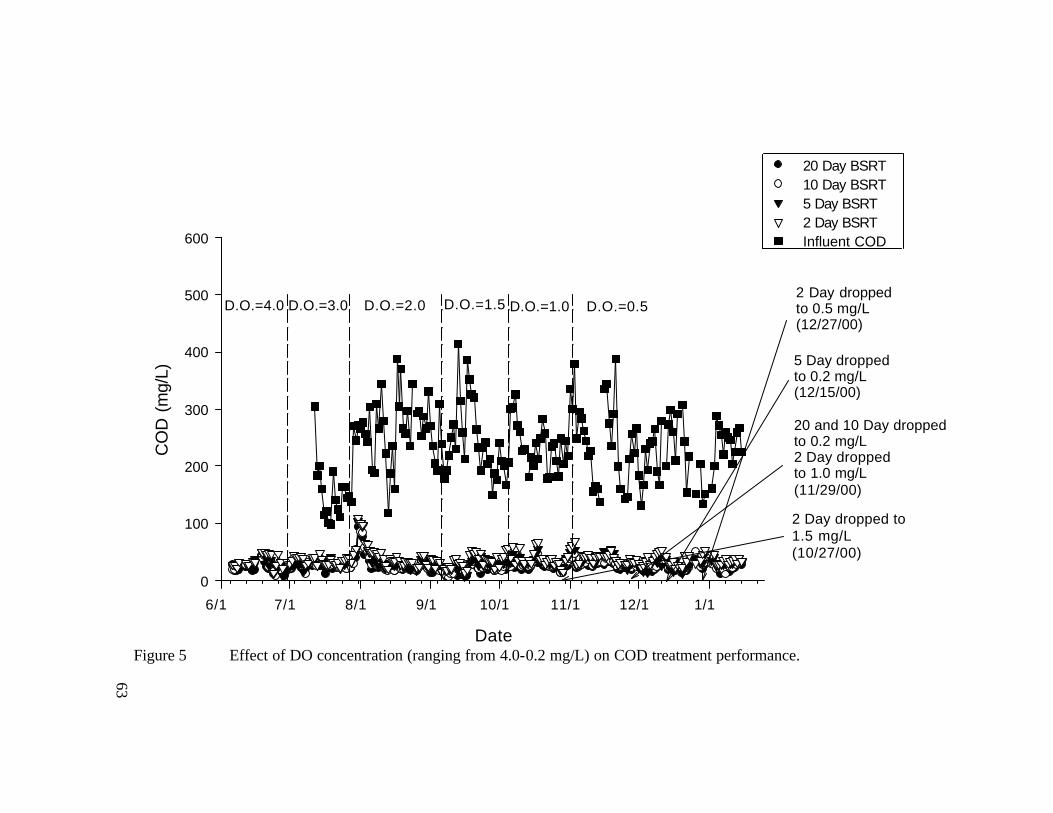
63
Figure 5 Effect of DO concentration (ranging from 4.0-0.2 mg/L) on COD treatment performance.Date
6/1 7/1 8/1 9/1 10/1 11/1 12/1 1/1
CO
D (
mg/
L)
0
100
200
300
400
500
600
20 Day BSRT10 Day BSRT5 Day BSRT2 Day BSRTInfluent COD
D.O.=4.0 D.O.=3.0 D.O.=2.0 D.O.=1.5 D.O.=1.0
2 Day dropped to1.5 mg/L(10/27/00)
D.O.=0.5
20 and 10 Day droppedto 0.2 mg/L2 Day droppedto 1.0 mg/L(11/29/00)
5 Day droppedto 0.2 mg/L(12/15/00)
2 Day droppedto 0.5 mg/L(12/27/00)
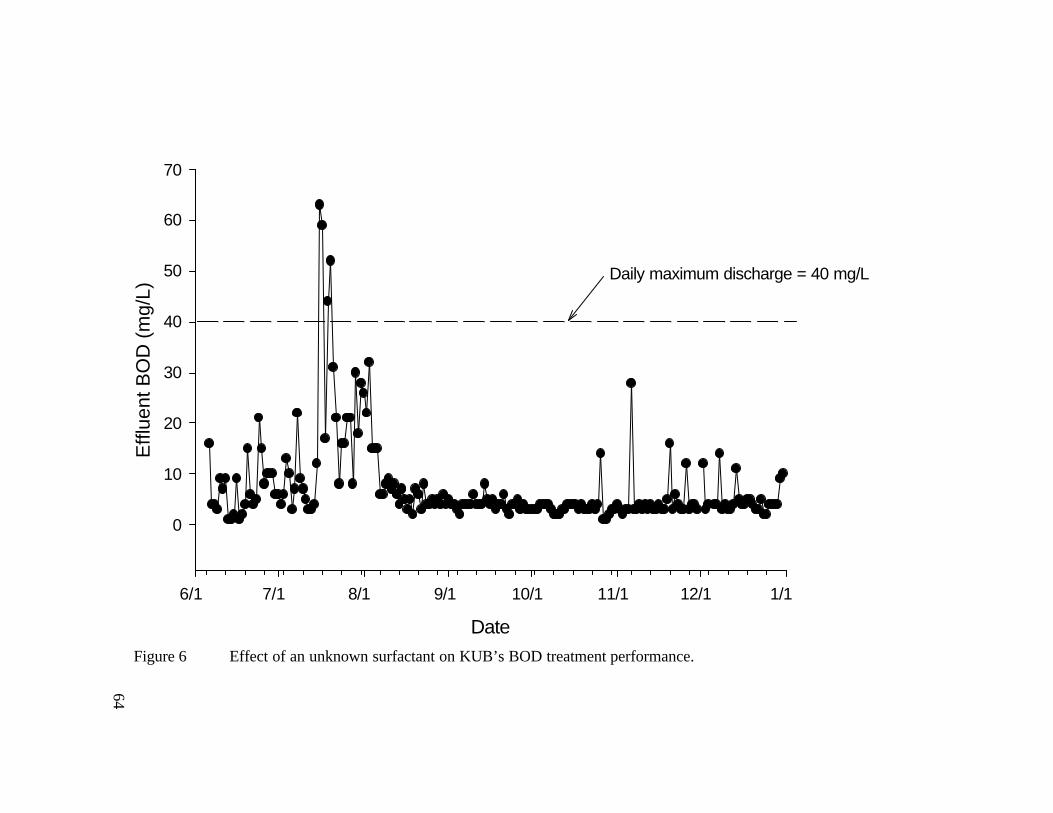
64
Figure 6 Effect of an unknown surfactant on KUB’s BOD treatment performance.
Date
6/1 7/1 8/1 9/1 10/1 11/1 12/1 1/1
Effl
uent
BO
D (
mg/
L)
0
10
20
30
40
50
60
70
Daily maximum discharge = 40 mg/L
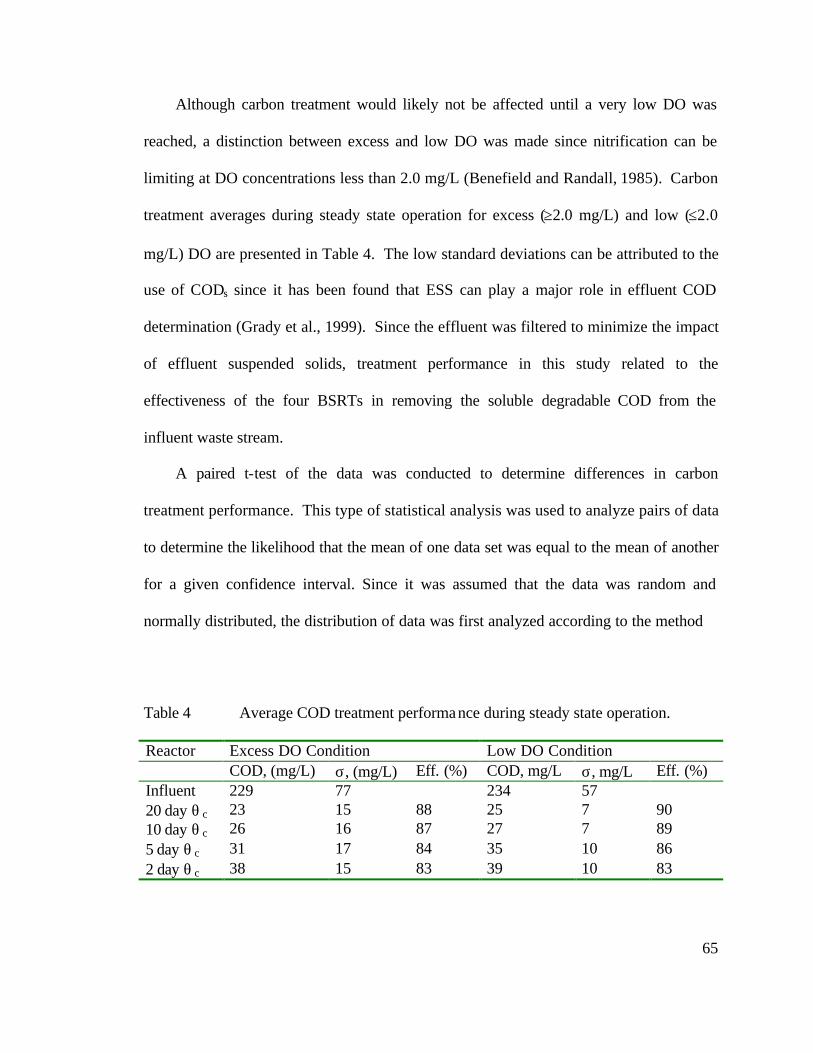
65
Although carbon treatment would likely not be affected until a very low DO was
reached, a distinction between excess and low DO was made since nitrification can be
limiting at DO concentrations less than 2.0 mg/L (Benefield and Randall, 1985). Carbon
treatment averages during steady state operation for excess (≥2.0 mg/L) and low (≤2.0
mg/L) DO are presented in Table 4. The low standard deviations can be attributed to the
use of CODs since it has been found that ESS can play a major role in effluent COD
determination (Grady et al., 1999). Since the effluent was filtered to minimize the impact
of effluent suspended solids, treatment performance in this study related to the
effectiveness of the four BSRTs in removing the soluble degradable COD from the
influent waste stream.
A paired t-test of the data was conducted to determine differences in carbon
treatment performance. This type of statistical analysis was used to analyze pairs of data
to determine the likelihood that the mean of one data set was equal to the mean of another
for a given confidence interval. Since it was assumed that the data was random and
normally distributed, the distribution of data was first analyzed according to the method
Table 4 Average COD treatment performance during steady state operation. Reactor Excess DO Condition Low DO Condition COD, (mg/L) σ, (mg/L) Eff. (%) COD, mg/L σ, mg/L Eff. (%) Influent 229 77 234 57 20 day θ c 23 15 88 25 7 90 10 day θ c 26 16 87 27 7 89 5 day θ c 31 17 84 35 10 86 2 day θ c 38 15 83 39 10 83
66
described by D’Agostino et al. (1990). The data for all BSRTs was found to be normally
distributed at a 99% confidence interval when excess and low DO treatment efficiencies
were compared. The results of the paired t-test showed that there was no statistical
difference in COD treatment efficiency at a 99% confidence interval between high and
low DO concentrations at each BSRT. These findings indicate that effective carbon
treatment can be accomplished low DO levels (0.2 mg/L).
Chuang et al. (1997) also found that effective COD treatment could be achieved
in a system operating at DO levels as low as 0.1 mg/L. Reactors operated at BSRTs of 5,
10, and 15 days each treated an influent COD concentration of approximately 300 mg/L,
which is comparable to the average influent COD values in Table 4. Similar results were
obtained by Munch et al. (2000) when conducting a pilot plant study at the Oxley Creek
WWTP. Effective carbon treatment was achieved at a BSRT of 4-5 days when the
bioreactor was aerated at 0.5 mg/L DO.
The 20-day BSRT reactor consistently provided the highest average treatment
efficiency under both excess and low DO conditions, whereas the 2-day BSRT reactor
provided the poorest treatment efficiency. Using the paired t-test, average treatment
efficiencies of the 20 and 10 day BSRT reactors were found to be statistically the same
for a 99% confidence interval. However, a paired t-test analysis between the 20 and 2
day BSRT data and 20 and 5 day BSRT data under excess and low DO conditions
revealed that the average values were statistically different at a 99% confidence interval.
All compared data in this analysis were found to be normally distributed for a 99%
confidence interval. These results indicate that carbon treatment is a function of BSRT
67
and therefore a BSRT of 10 days or greater should be maintained to achieve the highest
treatment efficiency.
Bernal-Martinez et al. (2000) also found that COD treatment efficiency increased
with BSRT for a reactor treating domestic wastewater. COD treatment efficiencies of 81,
91 and 99% were obtained when the reactor was operated at BSRTs of 3, 6, and 23 days,
respectively. Similar findings were reported by Palm et al. (1980) for bioreactors
operating at BSRTs of 1.9 and 11 days. The treatment efficiencies were found to be 85%
and 90% respectively for the reactors treating settled municipal wastewater.
4.2 Solids Analysis Data
Daily solids analysis was conducted starting March 20th to ensure that the reactors
were at steady state with respect to solids concentration before beginning a complete
analysis of performance. Reactor suspended solids data are shown in Figure 7. As
demonstrated in Equation 9, biomass concentration is a direct function of BSRT and
influent substrate concentration. Since the bacterial population is mainly comprised of
heterotrophic bacteria, changes in influent COD can cause large variations in biomass
concentration for any BSRT. Using typical values for Y and kd of 0.42 and 0.24 in
Equation 9 for a BSRT of 2 days, it can be seen that an increase in influent COD of only
100 mg/L could change the biomass concentration by almost 130 mg/L (Grady et al.,
1999). Therefore, it was not possible to maintain a strict steady state condition due to
variable influent wastewater characteristics.
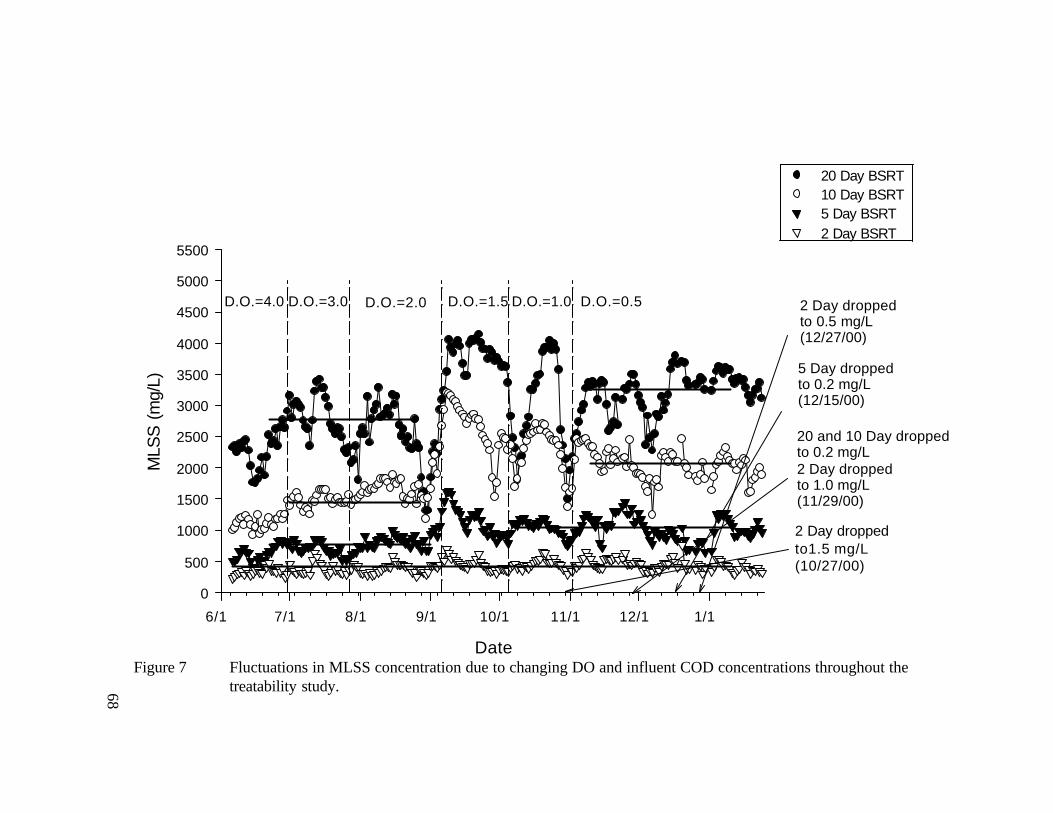
68
Figure 7 Fluctuations in MLSS concentration due to changing DO and influent COD concentrations throughout the treatability study.
Date
6/1 7/1 8/1 9/1 10/1 11/1 12/1 1/1
MLS
S (
mg/
L)
0
500
1000
1500
2000
2500
3000
3500
4000
4500
5000
5500
20 Day BSRT10 Day BSRT5 Day BSRT2 Day BSRT
D.O.=4.0 D.O.=3.0 D.O.=2.0 D.O.=1.5 D.O.=1.0
2 Day droppedto1.5 mg/L(10/27/00)
D.O.=0.5
20 and 10 Day droppedto 0.2 mg/L2 Day droppedto 1.0 mg/L(11/29/00)
5 Day droppedto 0.2 mg/L(12/15/00)
2 Day droppedto 0.5 mg/L(12/27/00)
69
As seen in Figure 7, changes in MLSS concentration were noted over time. The
first major change in solids concentration began to occur on August 27th. The reason for
this abrupt drop in solids concentration was the changing of tubing in the influent pump.
In order to prolong the life of the tubing used in the peristaltic pumps, a thick walled type
of tubing was used to replace the worn tubing. However, the tubing was too thick and
did not allow the full flow to pass into the reactors. The 20-day BSRT reactor was the
most affected dropping from a concentration of 2310 mg/L to 1310 mg/L in a matter of
three days. The 10-day BSRT reactor also saw a significant solids decrease from 1460
mg/L to 1040 mg/L. The 2- and 5-day BSRT reactors were not as affected since their
smaller microorganism populations required a lower substrate concentration for survival.
Installation of the proper tubing increased the substrate feed rate, which resulted in an
explosion of growth in all four reactors.
During the period from October 5th to November 2nd solids concentrations,
particularly in the 20- and 10-day BSRT reactors, underwent major changes. These
changes can be attributed to a consistent foaming problem that occurred over this time.
The foaming did not cause settling problems but often caused the reactor effluent port to
clog. Solids would remain in the reactor until the foam dissipated at which point a
significant amount of mixed liquor would flood into the clarifier. This overloading of the
clarifier caused high amounts of solids to be lost in the effluent on several occasions and
affected the MLSS concentrations. It was later discovered, after turning off the air blast
units, that this equipment might have caused some of the foaming.
70
Considering the two previously mentioned time periods, steady state conditions
for each reactor were determined using Figure 7. The 20-day BSRT reactor was
estimated to have two steady state time periods during this study. The first ranged from
June 22nd to August 24th, which corresponded to the period of excess DO operation; the
second ranged from November 11th to January 10th, which is in the low DO operational
period. A similar situation was found for the 10-day BSRT reactor with steady state date
ranges for excess and low DO operation of July 1st to August 27th and November 10th to
January 10th, respectively. For the 5-day BSRT reactor, the MLSS concentration was at
steady state from June 22nd to September 1st and October 8th to January 10th. Because
MLSS concentration did not significantly vary at any time during the study in the 2 day
BSRT reactor, steady state occurred from June 6th to January 10th. Averages and standard
deviations for the steady state MLSS concentrations are shown in Table 5.
The data in Table 5 indicate that a decrease in DO resulted in an increase in
MLSS concentration. A paired t-test was conducted on the two data sets for the 20 day
BSRT reactor to determine whether or not the mean values were different. It was
discovered that the means for the two steady state operational ranges for a 99%
Table 5 Average MLSS concentrations during steady state operation. Reactor Excess DO Condition Low DO Condition MLSS,
mg/L Std. Deviation, mg/L MLSS,
mg/L Std. Deviation, mg/L
20 day θ c 2762 349 (13%) 3265 368 (12%) 10 day θ c 1440 149 (10%) 2061 230 (11%) 5 day θ c 768 105 (14%) 1047 184 (18%) 2 day θ c 420 96 (23%) 420 96 (23%)
71
confidence interval were not the same. A similar result was obtained when the respective
steady state averages of the 10 and 5 day BSRT reactors were analyzed.
A synthetic influent waste feed is often used in treatability studies to help
maintain a stable MLSS concentration. Lau et al. (1984) found that MLSS concentration
remained fairly constant for a BSRT of 8 days when the DO was varied from 6.1 to 0.8
mg/L when a synthetic feed was used. The same finding was observed when a 3.25 day
BSRT reactor was operated in a range of 6.1 to 0.09 mg/L DO. The MLSS variation in
this study for the 20, 10, and 5 day BSRT reactors was initially thought to be a result of
changes in influent COD. However, a paired t-test conducted on the influent COD
averages for excess and DO steady state operation revealed that the values were not
statistically different for a 99% confidence interval.
An increase in bacterial yield could contribute to an increase in MLSS
concentration. Hanaki et al. (1990) found that the nitrifier observed yield coefficient
increased when the conditions were varied from excess to low DO conditions. The
observed yield was found to increase from approximately 0.3 to 0.6 when DO in the
reactor was dropped from 6.0 to 0.5 mg/L. Although an increase in nitrifier population
would not significantly impact MLSS, a larger population of heterotrophs would increase
MLSS. Lishman et al. (2000) conducted a study of wastewater treatment under aerobic
and anoxic conditions. The researchers found that heterotrophic yield increased from
0.25 to 0.35 for the two conditions respectively. The increased yield resulted in an
increase in MLVSS concentration.

72
A kinetic analysis was conducted on COD treatment data to determine the effects
of DO on heterotrophic yield using a method similar to the one outlined in Section 2.6.1.
The major difference was that the residual oxygen demand had to be considered when
conducting an analysis of carbon treatment kinetics (Grady et al., 1999). Benefield and
Randall (1985) suggest that the residual COD can be estimated by plotting effluent
substrate concentration versus specific substrate utilization rate. A residual of
approximately 20 mg/L was found. The yield coefficients were then calculated for the
previously defined excess and low DO conditions using a plot of specific growth rate
versus specific substrate utilization rate. Values of 0.42 and 0.43 mg VSS/ mg COD
were calculated for the excess and low DO operational periods respectively. Although a
slight increase occurred, it was not found to be significant. Therefore, it is unclear
exactly why MLSS apparently increased with decreasing DO.
The MLVSS concentrations, shown in Figure 8, were monitored throughout the
treatment study. MLVSS is typically used as a more accurate measure of biomass
because it only accounts for the organic portion of the MLSS. The MLVSS/MLSS ratio
varied slightly in the 20-, 10-, and 5-day BSRT reactors from the excess DO steady state
period to the low DO period. The volatile portion of the MLSS in the 20-day BSRT
reactor ranged from an average of 83% (Std. Dev. = +/-2%) to an average of 79%(Std.
Dev.=+/-2%). For the 10-day BSRT reactor, MLVSS accounted for averages of
86%(Std. Dev.=+/-5%) and 81%(Std. Dev.=+/-3%) of the MLSS during the excess DO
and low DO time periods. The volatile portion of MLSS for the 5-day BSRT reactor
ranged from an average of 89%(Std. Dev. =+/-3%) to an average of 84%(Std. Dev.=+/-
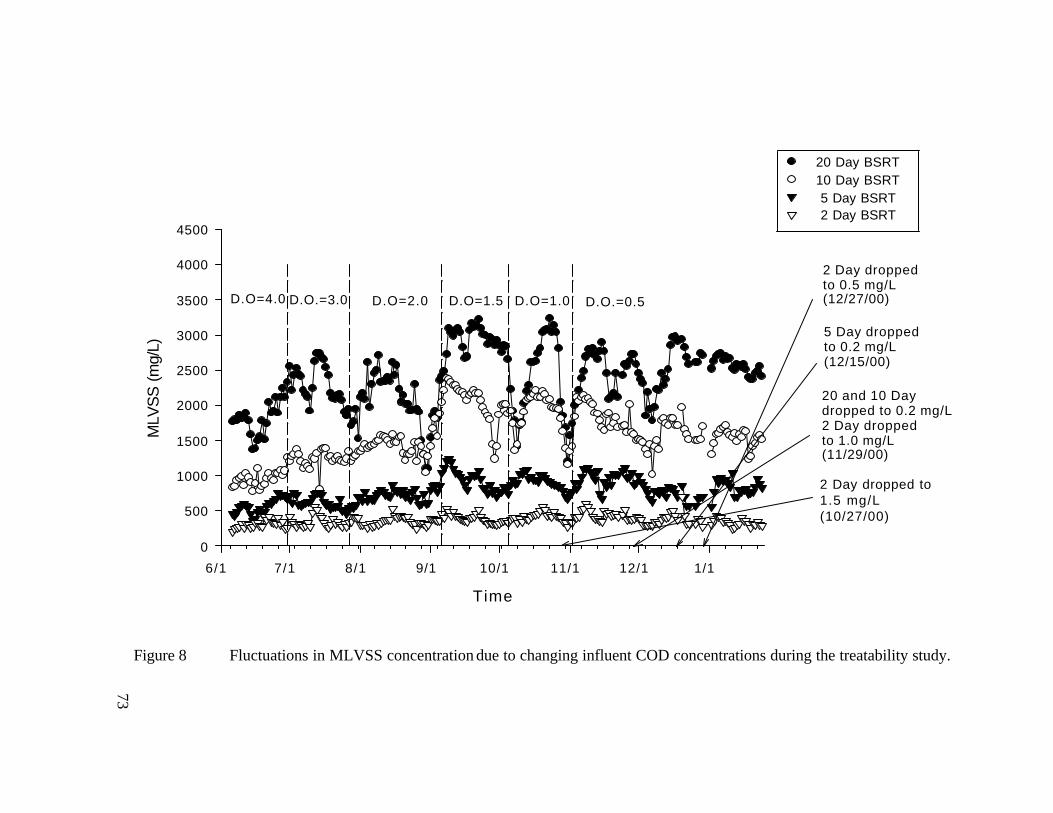
73
Figure 8 Fluctuations in MLVSS concentration due to changing influent COD concentrations during the treatability study.
Time
6/1 7/1 8/1 9/1 10/1 11/1 12/1 1/1
MLV
SS
(m
g/L)
0
500
1000
1500
2000
2500
3000
3500
4000
4500
20 Day BSRT10 Day BSRT 5 Day BSRT 2 Day BSRT
D.O=4.0 D.O.=3.0 D.O=2.0 D.O=1.5 D.O=1.0
2 Day dropped to1.5 mg/L(10/27/00)
D.O.=0.5
20 and 10 Daydropped to 0.2 mg/L2 Day droppedto 1.0 mg/L(11/29/00)
5 Day droppedto 0.2 mg/L(12/15/00)
2 Day droppedto 0.5 mg/L(12/27/00)
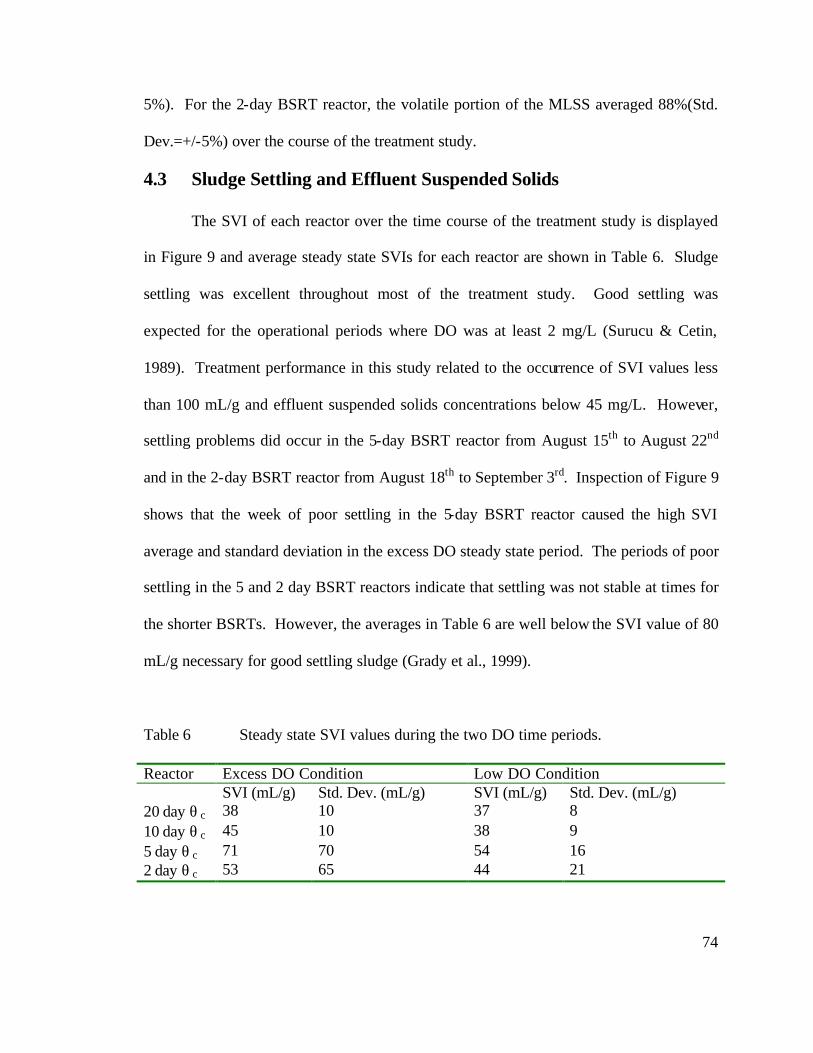
74
5%). For the 2-day BSRT reactor, the volatile portion of the MLSS averaged 88%(Std.
Dev.=+/-5%) over the course of the treatment study.
4.3 Sludge Settling and Effluent Suspended Solids
The SVI of each reactor over the time course of the treatment study is displayed
in Figure 9 and average steady state SVIs for each reactor are shown in Table 6. Sludge
settling was excellent throughout most of the treatment study. Good settling was
expected for the operational periods where DO was at least 2 mg/L (Surucu & Cetin,
1989). Treatment performance in this study related to the occurrence of SVI values less
than 100 mL/g and effluent suspended solids concentrations below 45 mg/L. However,
settling problems did occur in the 5-day BSRT reactor from August 15th to August 22nd
and in the 2-day BSRT reactor from August 18th to September 3rd. Inspection of Figure 9
shows that the week of poor settling in the 5-day BSRT reactor caused the high SVI
average and standard deviation in the excess DO steady state period. The periods of poor
settling in the 5 and 2 day BSRT reactors indicate that settling was not stable at times for
the shorter BSRTs. However, the averages in Table 6 are well below the SVI value of 80
mL/g necessary for good settling sludge (Grady et al., 1999).
Table 6 Steady state SVI values during the two DO time periods. Reactor Excess DO Condition Low DO Condition SVI (mL/g) Std. Dev. (mL/g) SVI (mL/g) Std. Dev. (mL/g) 20 day θ c 38 10 37 8 10 day θ c 45 10 38 9 5 day θ c 71 70 54 16 2 day θ c 53 65 44 21

75
Figure 9 Effect of DO concentration (ranging from 4.0-0.2 mg/L) on settling performance. Date
6/1 7/1 8/1 9/1 10/1 11/1 12/1 1/1
SVI
0102030405060708090
100
200
300
400
500
600
700
20 Day BSRT10 Day BSRT5 Day BSRT2 Day BSRT
D.O.=4.0 D.O.=3.0 D.O.=2.0 D.O.=1.5 D.O.=1.0
2 Day dropped to 1.5 mg/L(10/27/00)
D.O.=0.5
20 and 10 Day droppedto 0.2 mg/L2 Day droppedto 1.0 mg/L(11/29/00)
5 Day droppedto 0.2 mg/L(12/15/00)
2 Day droppedto 0.5 mg/L(12/27/00)

76
Since settling efficiency has been found to vary with BSRT, a paired t-test
analysis was conducted to assess the impact of BSRT on sludge settling. Average SVI
values in the 20 and 10 day BSRT reactors for the two steady state time periods were
found to be statistically the same for a confidence interval of 99%. However, a
significant difference was found when comparing steady state data for the 20 and 5 day
and the 20 and 2 day BSRT reactors. These findings indicate that solids settled more
efficiently at longer BSRTs. Similar results were obtained by Echeverria et al. (1993)
when conducting a pilot plant study on municipal wastewater. It was found that SVI
values were the lowest (approximately 50 mL/g) when operating at BSRTs greater than 8
days. Bisogni and Lawrence (1971) also found that settling velocity increased with
BSRT and therefore settling became more efficient for longer BSRTs.
A paired t-test analysis was also conducted on data from each reactor at excess
and low DO conditions to determine whether or not DO affected sludge settling. It was
found that the average steady state SVI values were statistically equivalent at a 99%
confidence interval for the 20 day BSRT data. The same results were found when the
analysis was performed on the 10 and 2 day BSRT data. Conversely, a t-test analysis on
the 5 day BSRT reactor revealed that the values were statistically different for a 99%
confidence interval.
Although DO might be expected to have a negative impact on sludge settling, it
has been found that the main factors which affect sludge settling are BSRT and organic
loading (Surucu and Cetin, 1990). Therefore, the DO itself might not cause poor SVI
values unless a sufficient organic loading occurred. It was discovered in the classic study
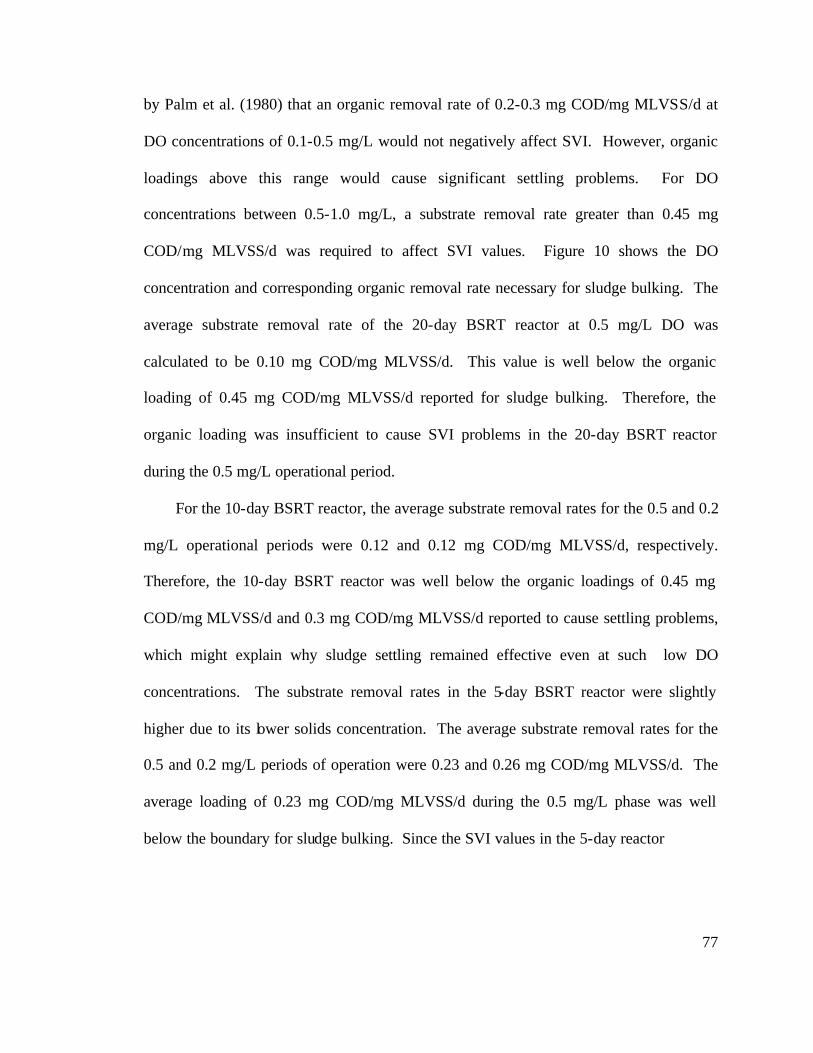
77
by Palm et al. (1980) that an organic removal rate of 0.2-0.3 mg COD/mg MLVSS/d at
DO concentrations of 0.1-0.5 mg/L would not negatively affect SVI. However, organic
loadings above this range would cause significant settling problems. For DO
concentrations between 0.5-1.0 mg/L, a substrate removal rate greater than 0.45 mg
COD/mg MLVSS/d was required to affect SVI values. Figure 10 shows the DO
concentration and corresponding organic removal rate necessary for sludge bulking. The
average substrate removal rate of the 20-day BSRT reactor at 0.5 mg/L DO was
calculated to be 0.10 mg COD/mg MLVSS/d. This value is well below the organic
loading of 0.45 mg COD/mg MLVSS/d reported for sludge bulking. Therefore, the
organic loading was insufficient to cause SVI problems in the 20-day BSRT reactor
during the 0.5 mg/L operational period.
For the 10-day BSRT reactor, the average substrate removal rates for the 0.5 and 0.2
mg/L operational periods were 0.12 and 0.12 mg COD/mg MLVSS/d, respectively.
Therefore, the 10-day BSRT reactor was well below the organic loadings of 0.45 mg
COD/mg MLVSS/d and 0.3 mg COD/mg MLVSS/d reported to cause settling problems,
which might explain why sludge settling remained effective even at such low DO
concentrations. The substrate removal rates in the 5-day BSRT reactor were slightly
higher due to its lower solids concentration. The average substrate removal rates for the
0.5 and 0.2 mg/L periods of operation were 0.23 and 0.26 mg COD/mg MLVSS/d. The
average loading of 0.23 mg COD/mg MLVSS/d during the 0.5 mg/L phase was well
below the boundary for sludge bulking. Since the SVI values in the 5-day reactor
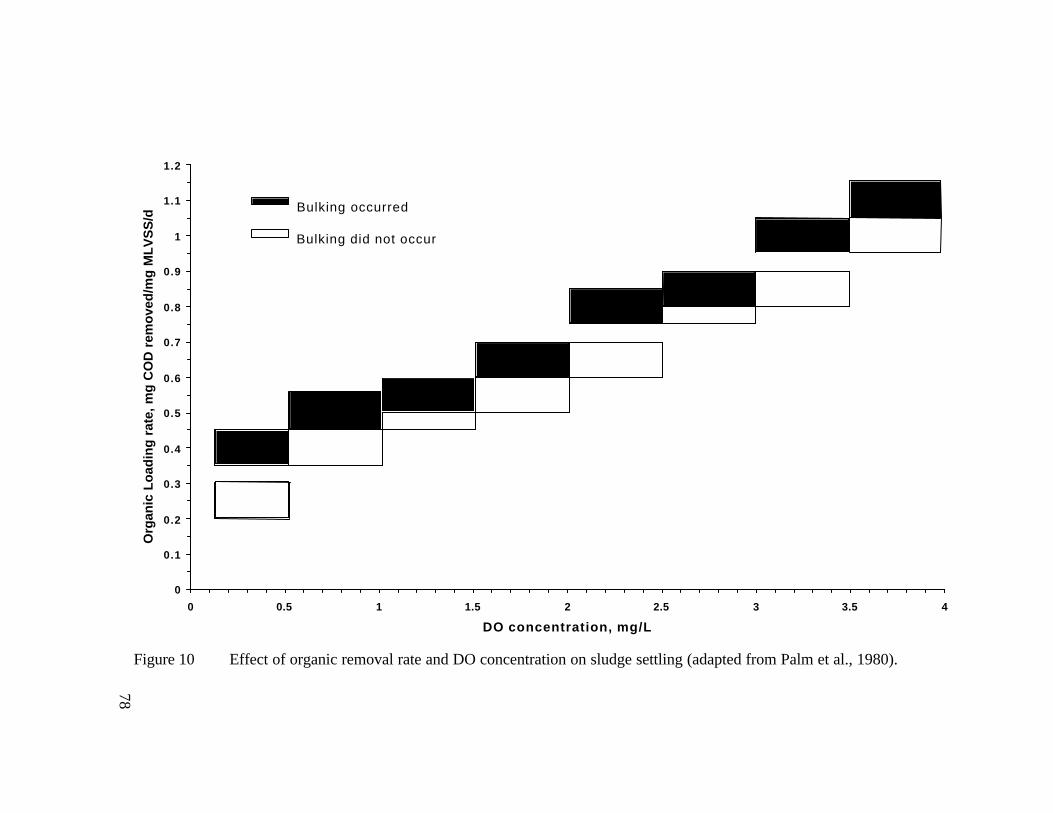
78
Figure 10 Effect of organic removal rate and DO concentration on sludge settling (adapted from Palm et al., 1980).
0
0.1
0.2
0.3
0.4
0.5
0.6
0.7
0.8
0.9
1
1.1
1.2
0 0.5 1 1.5 2 2.5 3 3.5 4
DO concentration, mg/L
Org
anic
Lo
adin
g r
ate,
mg
CO
D r
emo
ved
/mg
ML
VS
S/d
Bulking occurred
Bulking did not occur
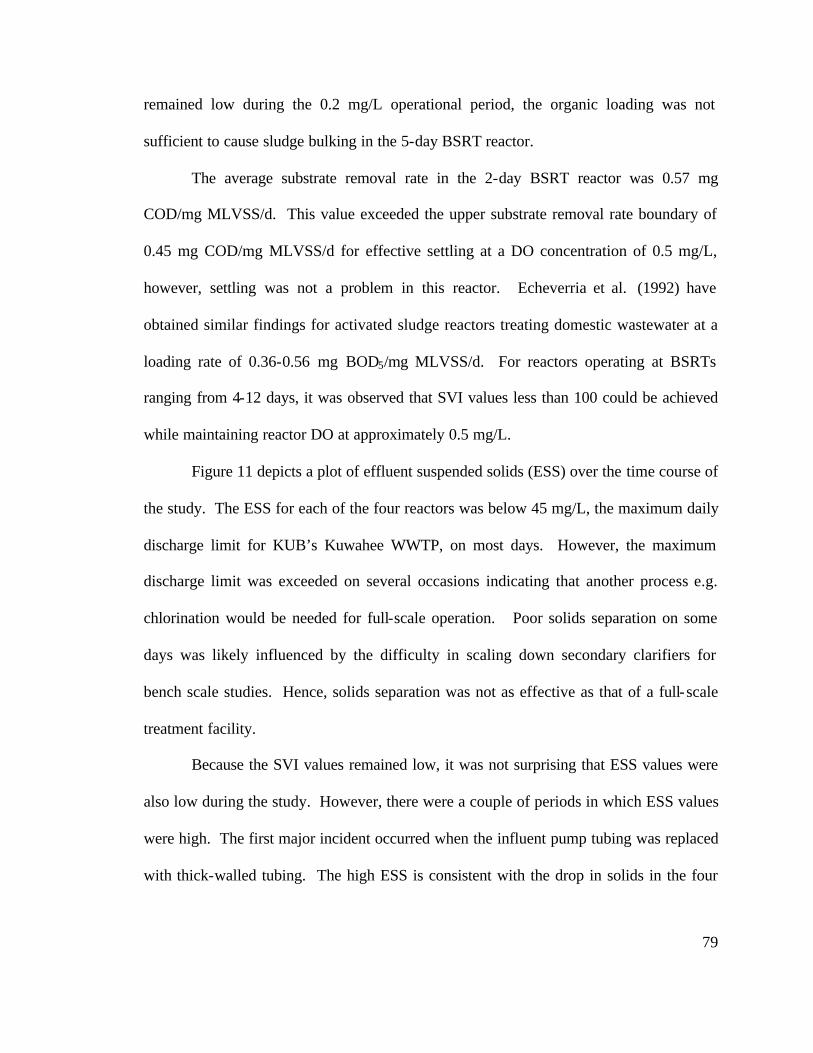
79
remained low during the 0.2 mg/L operational period, the organic loading was not
sufficient to cause sludge bulking in the 5-day BSRT reactor.
The average substrate removal rate in the 2-day BSRT reactor was 0.57 mg
COD/mg MLVSS/d. This value exceeded the upper substrate removal rate boundary of
0.45 mg COD/mg MLVSS/d for effective settling at a DO concentration of 0.5 mg/L,
however, settling was not a problem in this reactor. Echeverria et al. (1992) have
obtained similar findings for activated sludge reactors treating domestic wastewater at a
loading rate of 0.36-0.56 mg BOD5/mg MLVSS/d. For reactors operating at BSRTs
ranging from 4-12 days, it was observed that SVI values less than 100 could be achieved
while maintaining reactor DO at approximately 0.5 mg/L.
Figure 11 depicts a plot of effluent suspended solids (ESS) over the time course of
the study. The ESS for each of the four reactors was below 45 mg/L, the maximum daily
discharge limit for KUB’s Kuwahee WWTP, on most days. However, the maximum
discharge limit was exceeded on several occasions indicating that another process e.g.
chlorination would be needed for full-scale operation. Poor solids separation on some
days was likely influenced by the difficulty in scaling down secondary clarifiers for
bench scale studies. Hence, solids separation was not as effective as that of a full-scale
treatment facility.
Because the SVI values remained low, it was not surprising that ESS values were
also low during the study. However, there were a couple of periods in which ESS values
were high. The first major incident occurred when the influent pump tubing was replaced
with thick-walled tubing. The high ESS is consistent with the drop in solids in the four
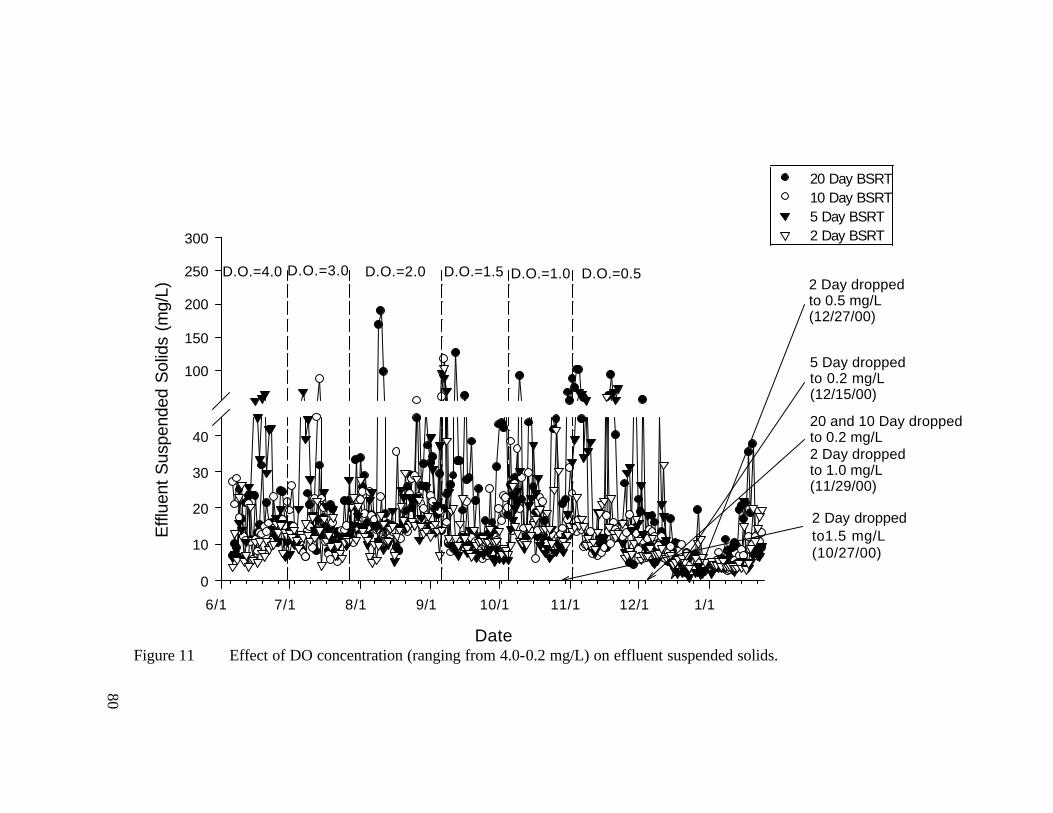
80
Figure 11 Effect of DO concentration (ranging from 4.0-0.2 mg/L) on effluent suspended solids.Date
6/1 7/1 8/1 9/1 10/1 11/1 12/1 1/1
Effl
uent
Sus
pend
ed S
olid
s (m
g/L)
0
10
20
30
40
100
150
200
250
300
20 Day BSRT10 Day BSRT5 Day BSRT2 Day BSRT
D.O.=4.0 D.O.=3.0 D.O.=2.0 D.O.=1.5 D.O.=1.0
2 Day droppedto1.5 mg/L(10/27/00)
D.O.=0.5
20 and 10 Day droppedto 0.2 mg/L2 Day droppedto 1.0 mg/L(11/29/00)
5 Day droppedto 0.2 mg/L(12/15/00)
2 Day droppedto 0.5 mg/L(12/27/00)

81
BSRT reactors. MLSS concentrations dropped the most in the 20- and 10-day BSRT
reactors. Consequently, the ESS was also high once the proper tubing was installed due
to the explosion of growth in the reactors. This growth likely overloaded the clarifiers
and caused excess solids to be lost in the effluent. The second period of poor settling
occurred from November 1st to November 21st primarily in the 20- and 5-day BSRT
reactors. Once again these high ESS values corresponded to drastic changes in the MLSS
concentration. As stated earlier, foaming during significant portions of October and into
November likely influenced results. Average ESS values for the two steady state periods
are reported in Table 7.
A paired t-test was conducted to determine if the differences in average ESS
values were significant for the four BSRT reactors. A paired t-test between 20 and 2 day
BSRT values revealed that the averages were statistically the same at a 99% confidence
interval. Similar results were obtained when the 20 day BSRT data was analyzed with
the 10 and 5 day BSRT average values respectively. Palm et al. (1980) also found that
ESS values were similar despite varying BSRTs in a complete mix activated sludge
system. The researchers operated reactors at BSRTs of 11, 9, 5.5, and 1.9 days and
measured average ESS values of 20, 18, 23, and 13, respectively.
Table 7 Average steady state ESS values during the two DO operational periods. Reactor Excess DO Condition Low DO Condition ESS, mg/L Std. Deviation, mg/L ESS, mg/L Std. Deviation, mg/L 20 day θ c 19 13 15 16 10 day θ c 18 13 19 5 5 day θ c 19 11 20 19 2 day θ c 14 10 13 9
82
The average excess and low DO effluent suspended solids values in Table 7 were
also analyzed to determine whether DO had any impact on settling performance. A
paired t-test for the 20 day BSRT data revealed that the averages were statistically the
same for a 99% confidence interval. The same result was found for the 10, 5, and 2 day
BSRT averages respectively when they were subjected to a paired t-test. Palm et al.
(1980) produced similar findings when operating an 11 day BSRT reactor at DO
concentrations ranging from 0.1-0.5 mg/L. Nowak et al. (1986) also found that low ESS
values could occur in low DO environments. The study was conducted at the Gold Bar
WWTP by maintaining a BSRT of 6 days in the aeration basin. It was found that ESS
concentrations were maintained at less than 25 mg/L during the study even at a DO
concentration of 0.8 mg/L.
4.4 Nitrification Performance Data
4.4.1 Reactor Ammonia Removal Performance
A narrower range of dates had to be chosen in order to evaluate nitrification
treatment performance in the four reactors. Treatment performance related to the
complete removal of ammonia from the waste stream. The excess DO date ranges for the
20-, 10-, 5-, and 2-day BSRT reactors remained the same. Since dissolved oxygen can
become a limiting factor for nitrification at concentrations below 2.0 mg/L (Fillos et al.,
1996), any data collected below that concentration could be considered low DO
operation. For the 20-day BSRT reactor, the low DO date range was during 0.5 mg/L
operation (November 2nd-November 29th). The low DO date range for the 10-day BSRT
reactor was November 2nd to January 10th, which corresponded to 0.5-0.2 mg/L

83
operation. November 2nd to December 15th was used for the 5-day BSRT reactor because
virtually no ammonia removal occurred once DO was dropped to 0.2 mg/L. The lack of
ammonia removal at 0.5 mg/L in the 2-day BSRT reactor precluded the use of that data
for analysis so the 1.0 mg/L (November 29th-December 27th) operational period was used.
Upon completion of the low DO study on January 10th, the DO in all four reactors was
increased to 3.0 mg/L to reestablish steady state treatment performance. Figure 12 shows
the influent and reactor effluent ammonia concentrations during the course of this study.
It was readily apparent that complete ammonia removal occurred in the 20-day
BSRT reactor at all DO concentrations ranging from 4.0-0.5 mg/L (June 6th-November
29th). There are only a few days in which effluent ammonia was present. The first
occurred on July 1st as a result of a spike in ammonia concentration from 17.4 to 25.1
mg/L, which temporarily affected ammonia removal in all reactors. The second incident
(July 31st) was believed to be caused by the unknown surfactant passing through the
system. Ammonia removal was once again affected in all reactors during this time. The
20-day BSRT reactor also discharged ammonia on August 29th, 30th, and 31st due to the
improper tubing which resulted in a lowering of the solids concentration. Complete
ammonia removal also occurred in the 10-day BSRT reactor throughout 4.0-0.5 mg/L DO
operation. However, operation at 0.2 mg/L DO resulted in ammonia discharge from the
10 day BSRT reactor. Complete ammonia removal once again took place upon elevation
of the DO back to 3.0 mg/L.
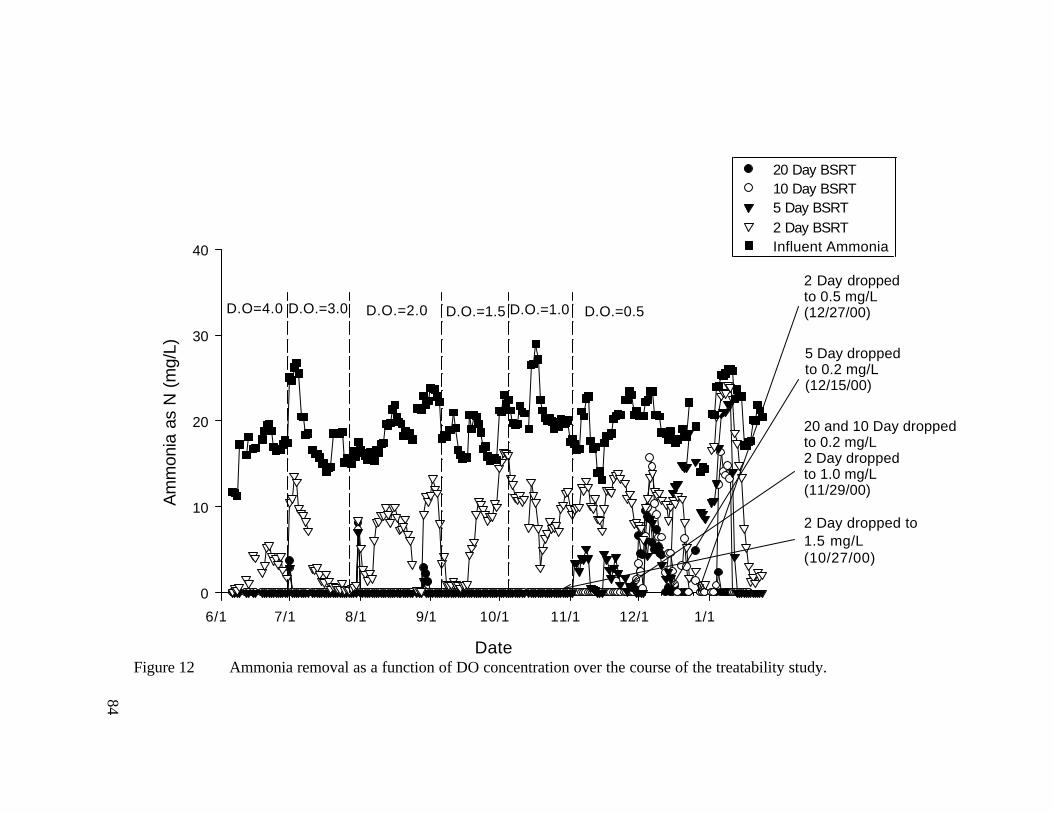
84
Figure 12 Ammonia removal as a function of DO concentration over the course of the treatability study. Date
6/1 7/1 8/1 9/1 10/1 11/1 12/1 1/1
Am
mon
ia a
s N
(m
g/L)
0
10
20
30
40
20 Day BSRT10 Day BSRT5 Day BSRT2 Day BSRTInfluent Ammonia
D.O=4.0 D.O.=3.0 D.O.=2.0 D.O.=1.5 D.O.=1.0
2 Day dropped to1.5 mg/L(10/27/00)
D.O.=0.5
20 and 10 Day droppedto 0.2 mg/L2 Day droppedto 1.0 mg/L(11/29/00)
5 Day droppedto 0.2 mg/L(12/15/00)
2 Day droppedto 0.5 mg/L(12/27/00)
85
Figure 12 shows that complete ammonia removal occurred in the 5-day BSRT
reactor during the 4.0-1.0 mg/L operational periods (June 6th-November 2nd). However,
ammonia was regularly discharged from the 5-day BSRT reactor during 0.5 mg/L
operation. An average of 87% of influent ammonia was removed during this DO period.
At 0.2 mg/L, ammonia removal was greatly impaired in the 5 day BSRT reactor. During
the time period of January 6th to January 10th, an average of 4.3 mg/L of the influent
ammonia was being removed in the 5-day BSRT reactor. Most of the ammonia removed
was likely uptaken by bacteria for synthesis. In order to verify this assumption, the
bacterial uptake (biomass-N) was computed assuming that the only cell loss was in the
wastage volume and ESS. The following equation was used to calculate biomass-N:
)(**)(
.)(*)(*)(
ntentNitrogenCoMLSS
MLVSSESS
RateFlowWastageVolContentNitrogenMLVSS
NBiomass
+=−
(32)
In December, MLSS samples were taken to Eastman WWTP for analysis of
nitrogen content. TKN and TSS analysis were then used to compute the %N present in
each reactor. The samples were run in duplicate and the average nitrogen content for the
20-, 10-, 5-, and 2-day BSRT reactors were found to be 3.65%, 4.03%, 4.25%, and 4.63%
respectively. Using Equation 32, an average bacterial nitrogen uptake of 2.8 mg/L was
calculated in the 5 day BSRT reactor for the period of January 6th-January 10th. After
January 10th, DO was restored to 3.0 mg/L and complete ammonia removal occurred in
the 5 day BSRT reactor after three days.

86
Complete ammonia removal rarely occurred in the 2-day BSRT reactor during the
entire course of the treatment study. A downward trend toward complete removal can be
seen in Figure 12 near the end of the 4.0 mg/L DO period. Although it might appear that
dropping the DO to 3.0 mg/L caused the disruption in ammonia removal, it has been
concluded that the spike in influent ammonia concentration caused the high concentration
of ammonia to be discharge in the effluent. Near complete ammonia removal occurred
during the last two weeks of 3.0 mg/L operation with an average effluent ammonia
concentration of 1 mg/L. From the time the DO was changed to 2.0 mg/L until the end of
the study, near complete ammonia removal took place in the 2 day BSRT reactor. This
inconsistency is very characteristic of such a low BSRT reactor (Grady et al., 1999).
Although near complete ammonia removal occurred on August 26th-28th, this
phenomenon was due to the thick walled tubing which allowed less influent to flow into
the reactor. During the period from December 23rd to January 1st, almost complete
ammonia removal took place in the 2-day BSRT reactor as well. This can be attributed to
a malfunction in the DO control system. The probe became very dirty and read a low
concentration almost constantly. Since the reading was below the DO set point, the
control system fed air into the reactor almost constantly on those days allowing ammonia
removal to be possible. Figure 12 clearly shows that once the aeration problem was
solved on Jan 1st, ammonia removal ceased at 0.5 mg/L DO concentration. After failing
to remove any appreciable amount of ammonia from January 2nd to January 10th, DO in
the 2-day BSRT reactor was increased to 3.0 mg/L. Nearly two weeks were required for
ammonia removal to occur at a level comparable to the previous 3.0 mg/L period.
87
Although BSRT is an important consideration when incorporating nitrification
into an activated sludge system, BSRTs of 8-20 days have been found to be sufficient for
effective removal of ammonia nitrogen (Tchobanoglous and Burton, 1991; Randall et al.,
1992). Therefore, it was not surprising that complete ammonia removal occurred in the
10 and 20 day BSRT reactors at excess DO. On the other hand, ammonia oxidation
might not have been expected to take place in the 5 and 2 day BSRT reactor because
these low BSRTs can approach the minimum solids retention time for ammonia removal
to occur (Benefield and Randall, 1985).
It has been found in several investigations that at least partial ammonia removal
can occur at low BSRTs. Randall et al. (1992) investigated the impact of BSRT on
nitrification in activated sludge by operating reactors at BSRTs of 1.5, 2.7, 5, and 15
days. Complete ammonia removal was observed at a BSRT as low as 2.7 days while
79% ammonia removal occurred at a 1.5 day BSRT. Hanaki et al. (1990) also found that
nitrification could be achieved at low BSRTs when conducting a study on the effects of
DO on nitrification in a completely mixed activated sludge system. For the excess DO
portion of the experiment, reactors were operated at BSRTs of 6.5, 5, 3.8, and 2 days for
a synthetic influent feed containing 80 mg/L of ammonia. Complete nitrification was
observed for all BSRTs greater than 3.8 days while approximately 50% of the influent
ammonia was converted to nitrate in the 2 day BSRT reactor. Dincer and Kargi (2000)
also found that ammonia removal occurred at low BSRTs. The researchers operated
reactors at 20, 17, 15, 10, 8, 5, and 3 day BSRTs. Although more effective ammonia
88
removal took place at longer BSRTs, it was discovered that almost 60% of the 100 mg/L
influent ammonia could be removed at a 3 day BSRT.
Dissolved oxygen concentration can also have a major impact on ammonia
removal in activated sludge. Since a DO concentration at or above 2 mg/L has been
established as the minimum necessary to prevent inhibition (Benefield and Randall, 1985,
Tchobanoglous and Burton, 1991), it was somewhat unanticipated that effective ammonia
removal would occur at DO levels as low as 0.5 mg/L. However, previous studies
indicate that low DO ammonia removal is possible even at relatively short BSRTs.
Hanaki et al. (1990) conducted research to determine the effects of DO on nitrification
and discovered that only a 3.8 day BSRT was required to efficiently remove
approximately 80 mg/L of influent ammonia at a DO of 0.5 mg/L. Similar results were
obtained by Chuang et al. (1997) when operating reactors at BSRTs of 5, 10, and 15 days.
Those researchers discovered that ammonia removal occurred to some degree for all
BSRTs at a DO of 0.5 mg/L. A 15 day BSRT was also found to be sufficient to remove
ammonia at a DO of approximately 0.1 mg/L. Jayamohan et al. (1988) conducted a study
on the effects of DO on ammonia removal by operating a 1.5 day BSRT reactor at DO
concentrations of 8.8, 1.3 and 0.76 mg/L. The researchers discovered that near complete
ammonia removal took place at even at 0.76 mg/L DO.
4.4.2 Nitrogen Mass Balances
Figure 13 shows a mass balance for the 20-day BSRT reactor using
influent and effluent ammonia, nitrate, nitrite, and nitrogen lost as cell mass (biomass-N).
Although the absence of TKN precludes this from being a true mass balance, the main
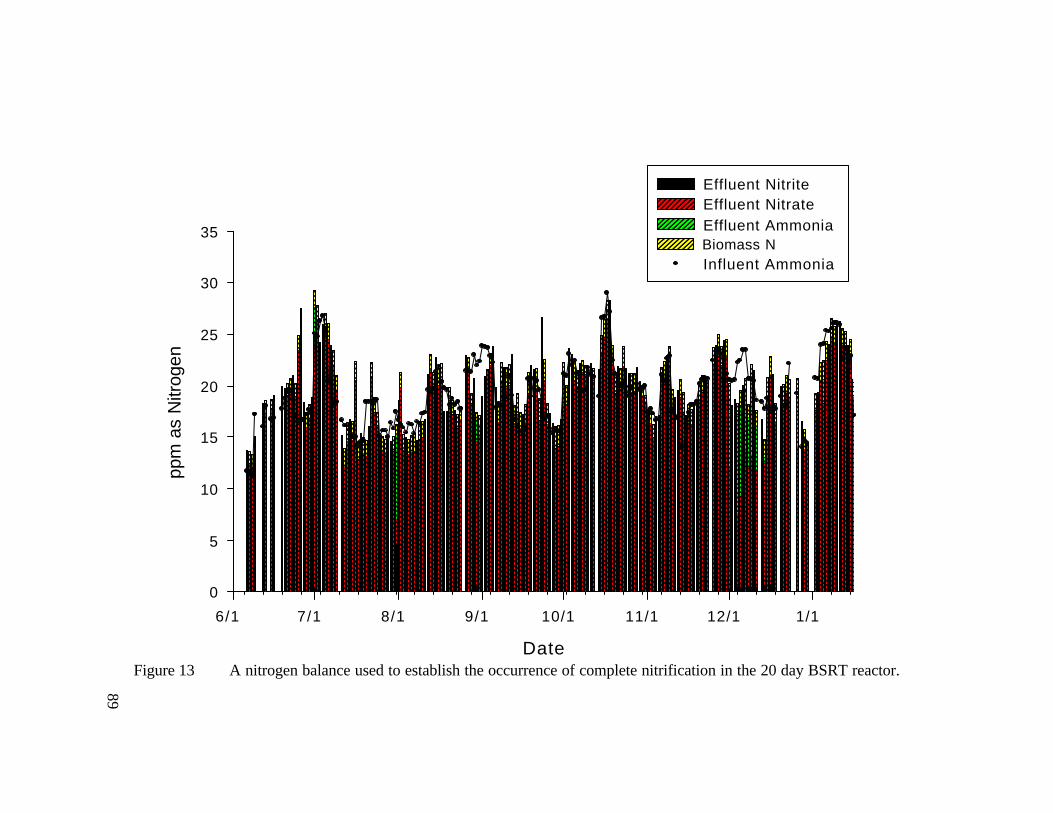
89
Figure 13 A nitrogen balance used to establish the occurrence of complete nitrification in the 20 day BSRT reactor. Date
6/1 7/1 8/1 9/1 10/1 11/1 12/1 1/1
ppm
as
Nitr
ogen
0
5
10
15
20
25
30
35
Effluent Nitrite Effluent Nitrate Effluent Ammonia Biomass NInfluent Ammonia
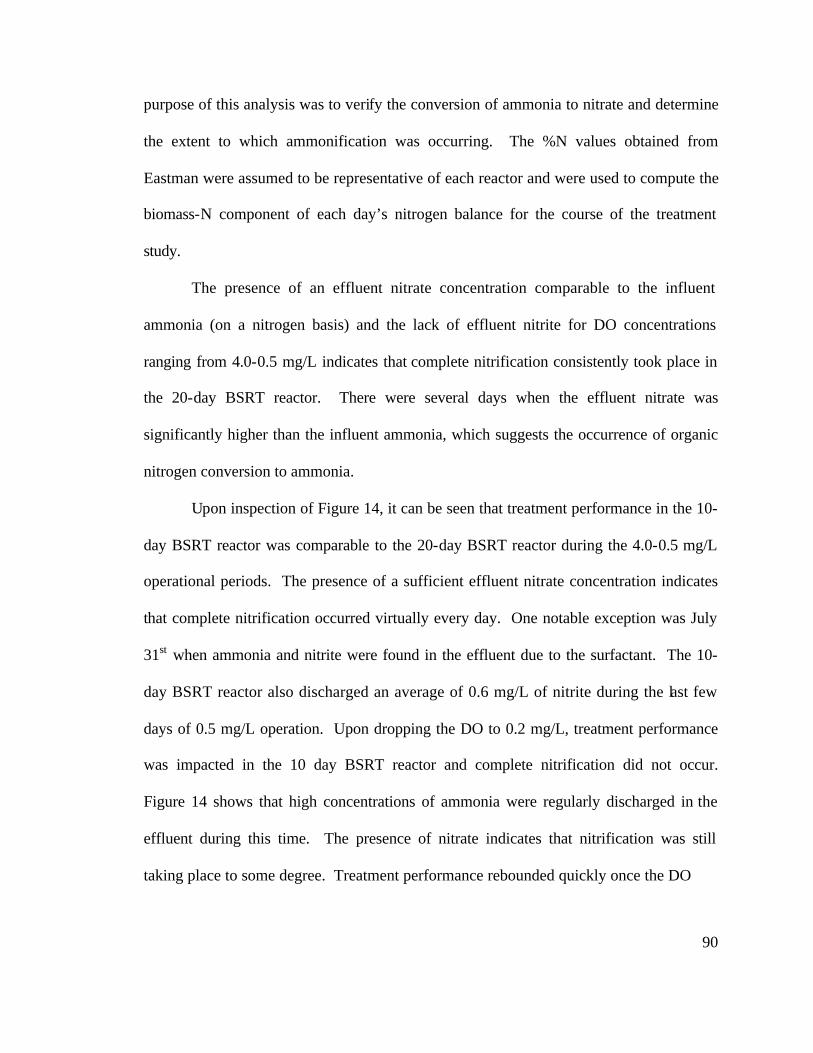
90
purpose of this analysis was to verify the conversion of ammonia to nitrate and determine
the extent to which ammonification was occurring. The %N values obtained from
Eastman were assumed to be representative of each reactor and were used to compute the
biomass-N component of each day’s nitrogen balance for the course of the treatment
study.
The presence of an effluent nitrate concentration comparable to the influent
ammonia (on a nitrogen basis) and the lack of effluent nitrite for DO concentrations
ranging from 4.0-0.5 mg/L indicates that complete nitrification consistently took place in
the 20-day BSRT reactor. There were several days when the effluent nitrate was
significantly higher than the influent ammonia, which suggests the occurrence of organic
nitrogen conversion to ammonia.
Upon inspection of Figure 14, it can be seen that treatment performance in the 10-
day BSRT reactor was comparable to the 20-day BSRT reactor during the 4.0-0.5 mg/L
operational periods. The presence of a sufficient effluent nitrate concentration indicates
that complete nitrification occurred virtually every day. One notable exception was July
31st when ammonia and nitrite were found in the effluent due to the surfactant. The 10-
day BSRT reactor also discharged an average of 0.6 mg/L of nitrite during the last few
days of 0.5 mg/L operation. Upon dropping the DO to 0.2 mg/L, treatment performance
was impacted in the 10 day BSRT reactor and complete nitrification did not occur.
Figure 14 shows that high concentrations of ammonia were regularly discharged in the
effluent during this time. The presence of nitrate indicates that nitrification was still
taking place to some degree. Treatment performance rebounded quickly once the DO
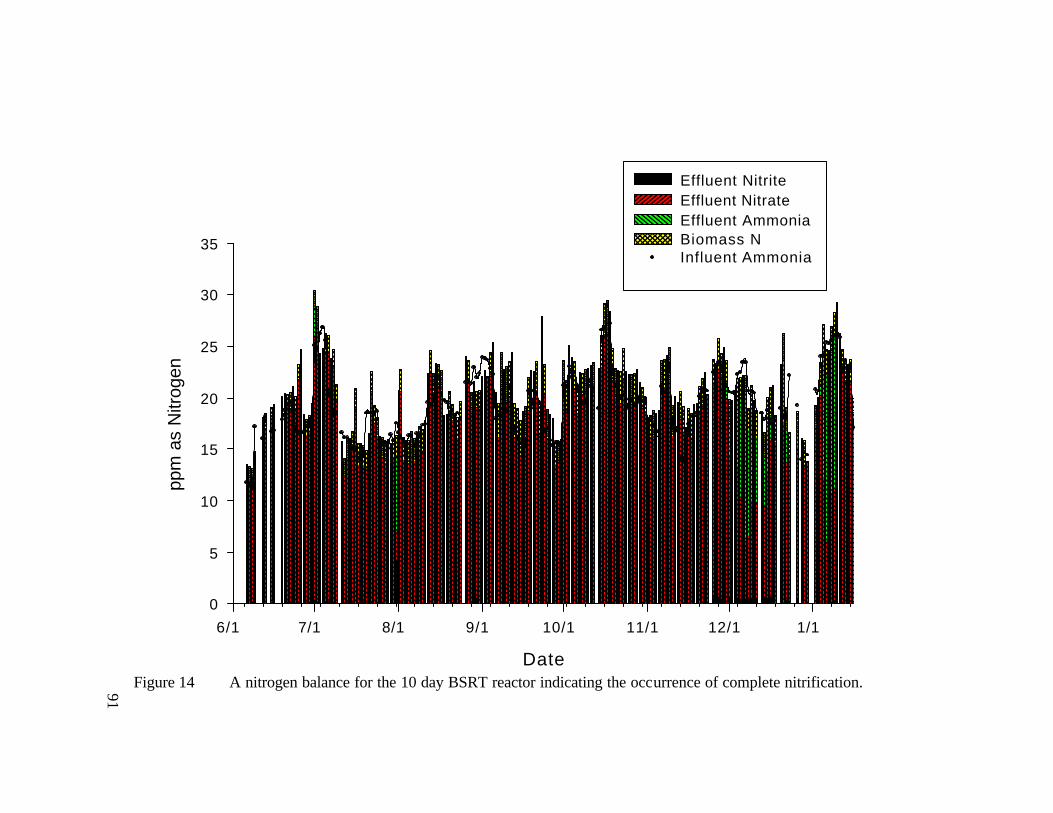
91
Figure 14 A nitrogen balance for the 10 day BSRT reactor indicating the occurrence of complete nitrification.
Date
6/1 7/1 8/1 9/1 10/1 11/1 12/1 1/1
ppm
as
Nitr
ogen
0
5
10
15
20
25
30
35
Effluent Nitrite Effluent Nitrate Effluent Ammonia Biomass N Influent Ammonia
92
was restored to 3.0 mg/L and complete nitrification once again occurred in the 10-day
BSRT reactor after two days.
The nitrogen balance for the 5-day BSRT reactor is shown in Figure 15.
Although effluent nitrite averaged 0.3 mg/L during the 4.0-1.0 mg/L periods of operation,
near complete nitrification did occur because the effluent nitrate levels were comparable
to the influent ammonia. A loss of treatment performance took place in the 5-day BSRT
reactor once the DO was dropped to 0.5 mg/L. This DO concentration impacted
ammonia and nitrite oxidation. Although ammonia oxidation is supposed to be the rate-
limiting step for nitrification, Figure 13 indicates that a build up of nitrite in the effluent
occurred during 0.5 mg/L operation. It was discovered by Laanbroek et al. (1994) that
ammonia oxidizers had a higher affinity for oxygen (i.e. a lower half-saturation constant)
than nitrite oxidizers. The nitrite oxidizers apparently had difficulty competing for the
available oxygen. A downward trend in effluent nitrite suggests that the nitrite oxidizers
began to acclimate to the low DO conditions.
Nitrification was severely inhibited once the DO in the 5 day BSRT reactor was
lowered to 0.2 mg/L. No more than 50% of the influent ammonia was ever removed
during this period and an average of only 4.3 mg/L was removed during the January 6th-
10th portion of the study. The average effluent nitrate and nitrite concentrations on those
five days were 0.8 and 0.4 mg/L respectively. Upon raising the DO back to 3.0 mg/L,
complete nitrification occurred in the 5 day BSRT reactor after only a few days. At this
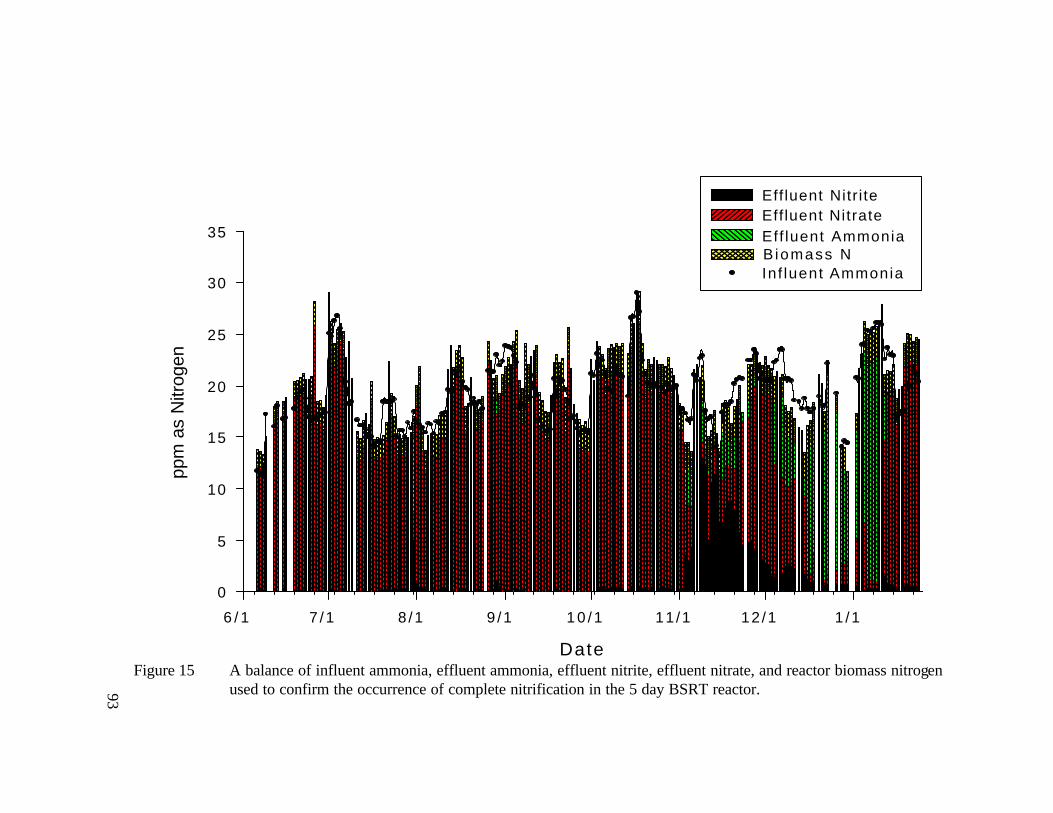
93
Figure 15 A balance of influent ammonia, effluent ammonia, effluent nitrite, effluent nitrate, and reactor biomass nitrogen used to confirm the occurrence of complete nitrification in the 5 day BSRT reactor.
Date
6 / 1 7 /1 8 /1 9 /1 1 0 / 1 11 /1 12 /1 1 /1
ppm
as
Nitr
ogen
0
5
10
15
20
25
30
35
Eff luent Nitr i te Eff luent Nitrate Eff luent Ammonia B iomass N Inf luent Ammonia
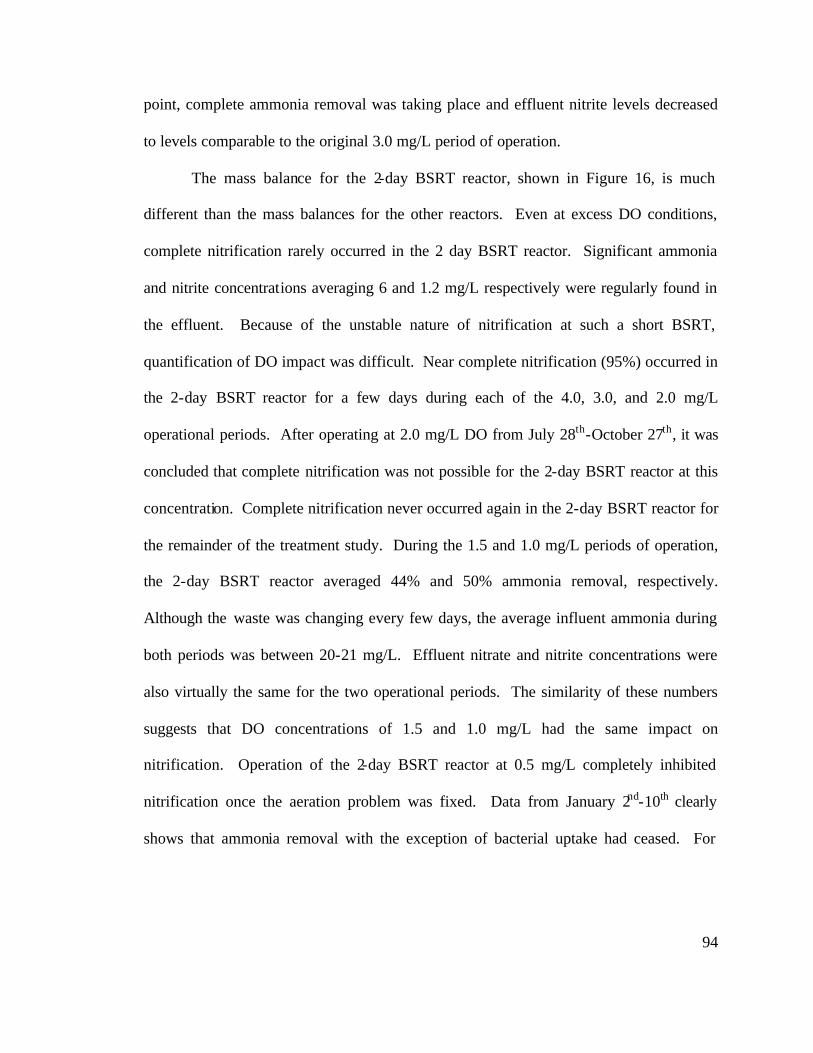
94
point, complete ammonia removal was taking place and effluent nitrite levels decreased
to levels comparable to the original 3.0 mg/L period of operation.
The mass balance for the 2-day BSRT reactor, shown in Figure 16, is much
different than the mass balances for the other reactors. Even at excess DO conditions,
complete nitrification rarely occurred in the 2 day BSRT reactor. Significant ammonia
and nitrite concentrations averaging 6 and 1.2 mg/L respectively were regularly found in
the effluent. Because of the unstable nature of nitrification at such a short BSRT,
quantification of DO impact was difficult. Near complete nitrification (95%) occurred in
the 2-day BSRT reactor for a few days during each of the 4.0, 3.0, and 2.0 mg/L
operational periods. After operating at 2.0 mg/L DO from July 28th-October 27th, it was
concluded that complete nitrification was not possible for the 2-day BSRT reactor at this
concentration. Complete nitrification never occurred again in the 2-day BSRT reactor for
the remainder of the treatment study. During the 1.5 and 1.0 mg/L periods of operation,
the 2-day BSRT reactor averaged 44% and 50% ammonia removal, respectively.
Although the waste was changing every few days, the average influent ammonia during
both periods was between 20-21 mg/L. Effluent nitrate and nitrite concentrations were
also virtually the same for the two operational periods. The similarity of these numbers
suggests that DO concentrations of 1.5 and 1.0 mg/L had the same impact on
nitrification. Operation of the 2-day BSRT reactor at 0.5 mg/L completely inhibited
nitrification once the aeration problem was fixed. Data from January 2nd-10th clearly
shows that ammonia removal with the exception of bacterial uptake had ceased. For
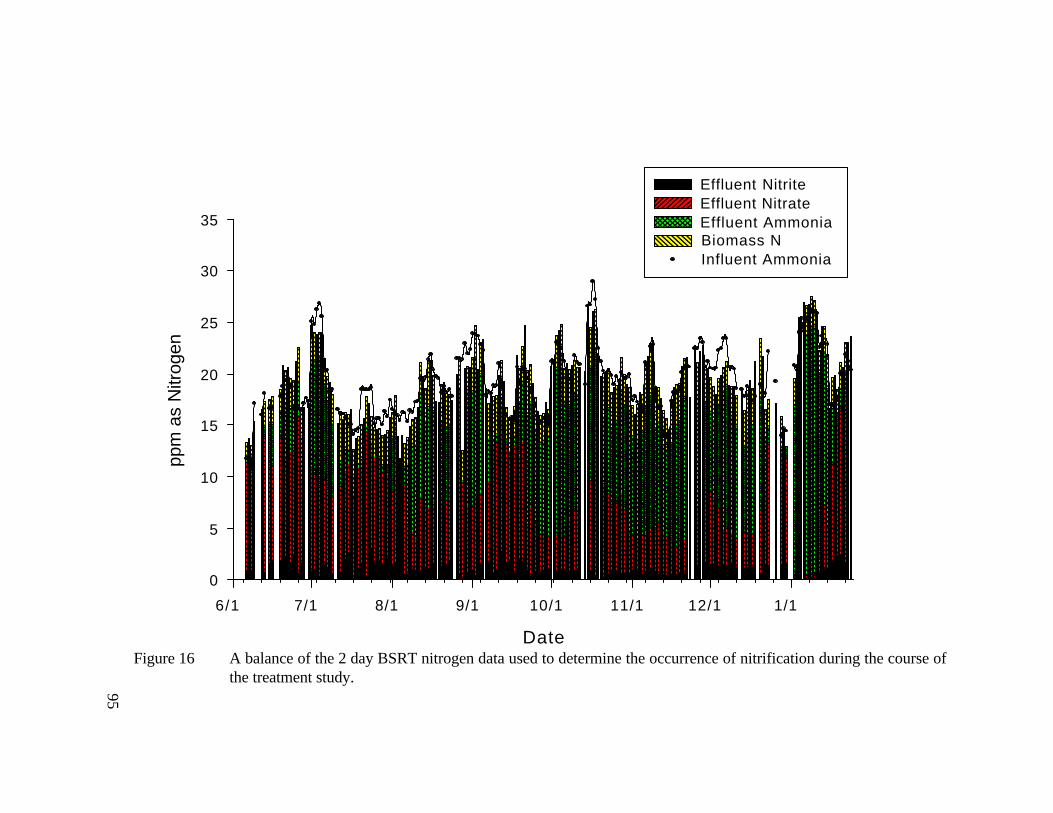
95
Figure 16 A balance of the 2 day BSRT nitrogen data used to determine the occurrence of nitrification during the course of the treatment study.
Date
6/1 7/1 8/1 9/1 10/1 11/1 12/1 1/1
ppm
as
Nitr
ogen
0
5
10
15
20
25
30
35
Effluent Nitrite Effluent Nitrate Effluent Ammonia Biomass N Influent Ammonia
96
these dates only traces amounts of nitrate and nitrite averaging 0.4 and 0.4 mg/L
respectively could be found in the effluent. Once nitrification had almost ceased, the DO
in the 2-day BSRT reactor was restored to 3.0 mg/L. The 2-day BSRT reactor required a
longer period of adjustment than the other reactors but a treatment level comparable to
previous excess DO conditions did occur after approximately two weeks.
The impact of BSRT on ammonia removal was discussed in the previous section.
Figure 12 clearly showed that complete ammonia removal occurred in the 20, 10 and 5
day BSRT reactors for excess DO conditions. Since the first step of nitrification,
conversion of ammonia to nitrite, is typically considered to be limiting (Benefield and
Randall, 1985), it was not surprising that complete nitrification took place in the 20, 10
and 5 day BSRT reactors at excess DO. The difficulty in achieving complete nitrification
at a BSRT as low as 2 days has been well documented (Grady et al., 1999; Benefield and
Randall, 1985; Randall et al., 1992). Therefore, the remainder of the analysis will focus
on the impact of DO on nitrification.
It has been argued that DO can be the limiting factor for nitrification at
concentrations below 2.0 mg/L. However, previous work has indicated that nitrification
can occur at DO levels at or below 1 mg/L (Fillos et al., 1996). Chuang et al. (1997)
conducted a study on the impacts of DO on nutrient removal using BSRTs of 5, 10, and
15 days. They found that complete nitrification took place at 0.5 mg/L DO for a 15 day
BSRT, which is comparable to the 20 and 10 day BSRTs used in this study. The study
also revealed that partial nitrification took place at that DO concentration for a BSRT of 5
days. Hanaki et al. (1990) also found that nitrification was possible at a DO
97
concentration of 0.5 mg/L for BSRTs ranging from 3.8 to 6.5 days. However, the
researchers also discovered that the conversion of nitrite to nitrate became the limiting
step at low DO. This phenomenon caused a build up of nitrite in the effluent similar to
the one seen in the 5 day BSRT reactor. Jayahoman et al. (1988) obtained the same result
when operating a CSTR at a 1.5 day BSRT and 0.76 mg/L DO. Nitrate levels in the
effluent were very low and an effluent nitrite concentration close to influent ammonia
level was observed. Balmelle et al. (1992) have also found that insufficient DO levels
can result in a build up of nitrite in the effluent. It was discovered that the rate of nitrite
conversion decreased by approximately 50% when the DO was dropped from 4.0 to 0.5
mg/L. These findings indicate that a sufficient mass of nitrite oxidizers must be present
for effective conversion. As the DO is decreased, an increased biomass is needed in
order to compensate for the decrease in nitrite conversion rate. Therefore, longer BSRTs
would be required for effective nitrification to occur. This would explain why nitrite
buildup occurred in the 5 day BSRT reactor but did not take place in the longer BSRTs.
4.4.3 Alkalinity
Influent and effluent alkalinity values are presented in Figure 17. These
measurements were taken to ensure that enough buffering capacity existed to avoid major
pH depression. Reactor pH must remain in the range of 7.0-8.5 to keep from affecting
nitrification (Tchobanoglous & Burton, 1991). Figure 17 shows that the 2-day BSRT
reactor regularly discharged a higher concentration of alkalinity than the other reactors.
This finding reinforces the fact that complete nitrification did not regularly take place in
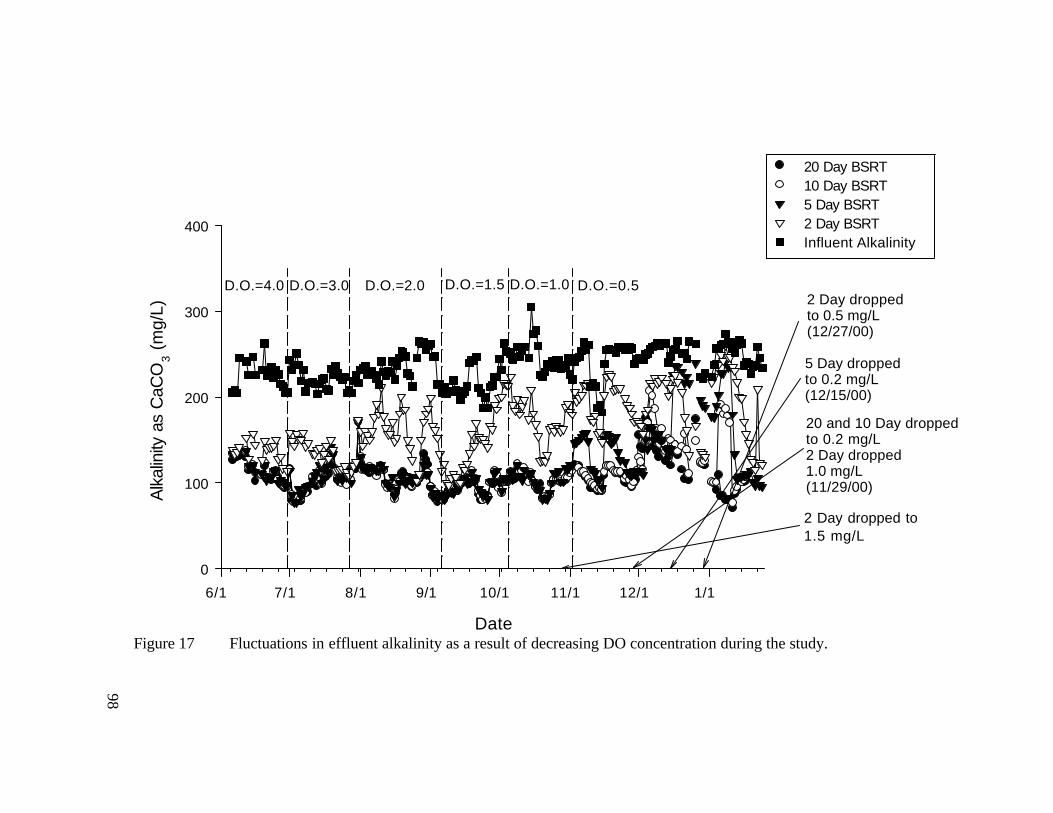
98
Figure 17 Fluctuations in effluent alkalinity as a result of decreasing DO concentration during the study. Date
6/1 7/1 8/1 9/1 10/1 11/1 12/1 1/1
Alk
alin
ity a
s C
aCO
3 (
mg/
L)
0
100
200
300
400
20 Day BSRT10 Day BSRT5 Day BSRT2 Day BSRTInfluent Alkalinity
D.O.=4.0 D.O.=3.0 D.O.=2.0 D.O.=1.5 D.O.=1.0
2 Day dropped to1.5 mg/L
D.O.=0.5
20 and 10 Day droppedto 0.2 mg/L2 Day dropped1.0 mg/L(11/29/00)
5 Day droppedto 0.2 mg/L(12/15/00)
2 Day droppedto 0.5 mg/L(12/27/00)
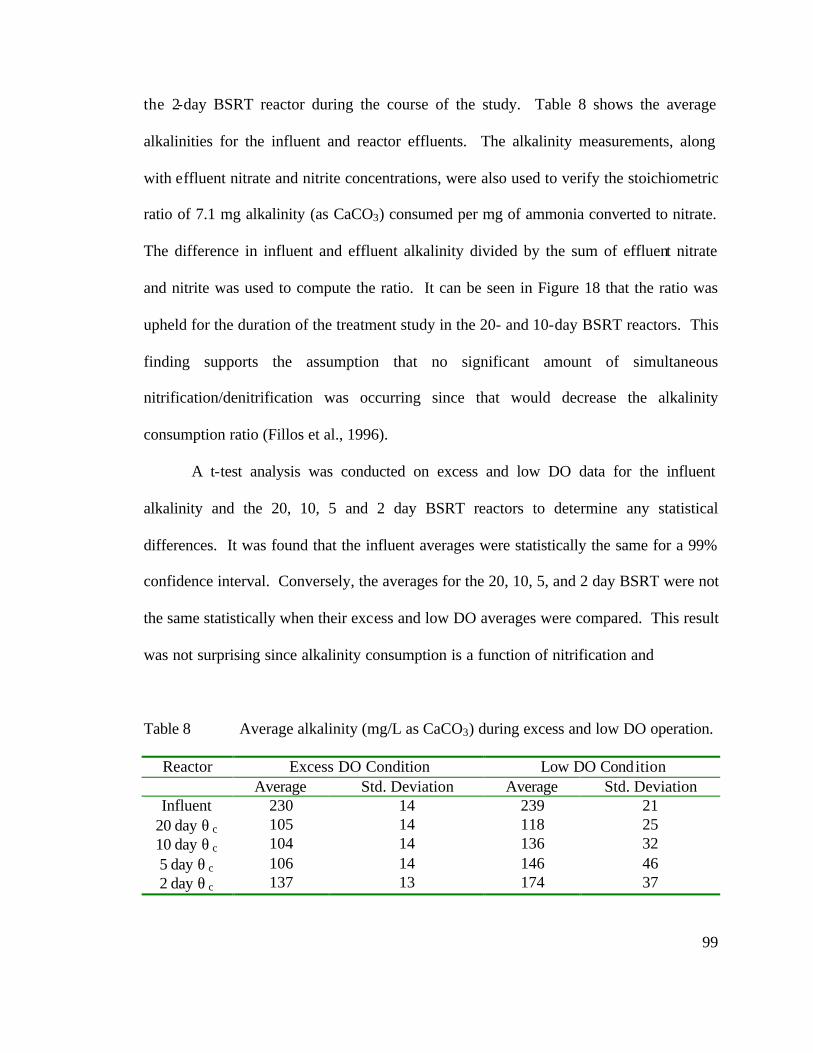
99
the 2-day BSRT reactor during the course of the study. Table 8 shows the average
alkalinities for the influent and reactor effluents. The alkalinity measurements, along
with effluent nitrate and nitrite concentrations, were also used to verify the stoichiometric
ratio of 7.1 mg alkalinity (as CaCO3) consumed per mg of ammonia converted to nitrate.
The difference in influent and effluent alkalinity divided by the sum of effluent nitrate
and nitrite was used to compute the ratio. It can be seen in Figure 18 that the ratio was
upheld for the duration of the treatment study in the 20- and 10-day BSRT reactors. This
finding supports the assumption that no significant amount of simultaneous
nitrification/denitrification was occurring since that would decrease the alkalinity
consumption ratio (Fillos et al., 1996).
A t-test analysis was conducted on excess and low DO data for the influent
alkalinity and the 20, 10, 5 and 2 day BSRT reactors to determine any statistical
differences. It was found that the influent averages were statistically the same for a 99%
confidence interval. Conversely, the averages for the 20, 10, 5, and 2 day BSRT were not
the same statistically when their excess and low DO averages were compared. This result
was not surprising since alkalinity consumption is a function of nitrification and
Table 8 Average alkalinity (mg/L as CaCO3) during excess and low DO operation.
Reactor Excess DO Condition Low DO Condition Average Std. Deviation Average Std. Deviation
Influent 230 14 239 21 20 day θ c 105 14 118 25 10 day θ c 104 14 136 32 5 day θ c 106 14 146 46 2 day θ c 137 13 174 37
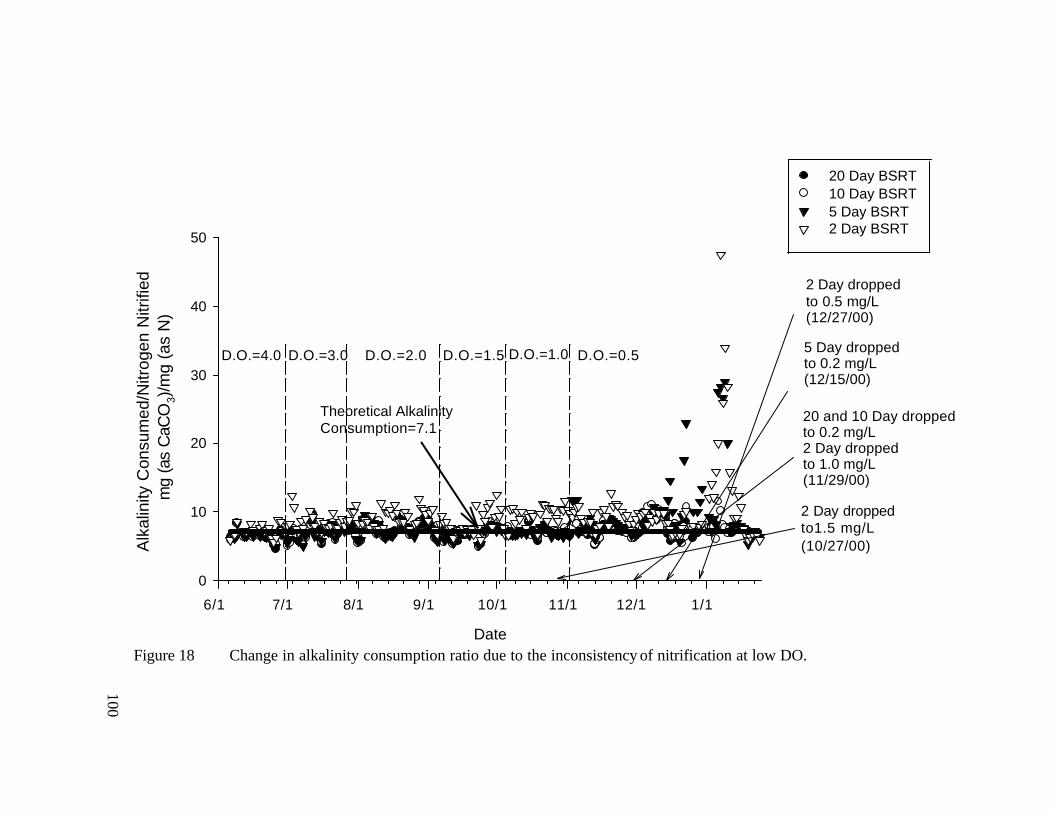
100
Figure 18 Change in alkalinity consumption ratio due to the inconsistency of nitrification at low DO. Date
6/1 7/1 8/1 9/1 10/1 11/1 12/1 1/1
Alk
alin
ity C
onsu
med
/Nitr
ogen
Nitr
ified
mg
(as
CaC
O3)
/mg
(as
N)
0
10
20
30
40
50
20 Day BSRT10 Day BSRT5 Day BSRT2 Day BSRT
Theoretical Alkalinity Consumption=7.1
2 Day droppedto1.5 mg/L(10/27/00)
20 and 10 Day droppedto 0.2 mg/L2 Day droppedto 1.0 mg/L(11/29/00)
5 Day droppedto 0.2 mg/L(12/15/00)
2 Day droppedto 0.5 mg/L(12/27/00)
D.O.=4.0 D.O.=3.0 D.O.=2.0 D.O.=1.5 D.O.=1.0 D.O.=0.5

101
nitrification was found to be affected by low DO concentrations. The 5 and 2 day BSRT
reactors have the highest low DO effluent alkalinity averages because they were impacted
the most by decreases in DO concentration.
The 5-day BSRT reactor maintained the ratio until it began to fail with respect to
nitrification at 0.2 mg/L. At this point, only trace amounts of nitrate and nitrite were
found in the effluent. The 2-day reactor showed similar results during the 0.5 mg/L
operational period. Once the DO was raised to 3.0 mg/L, nitrification resumed within a
few days in the 5-day BSRT reactor and the ratio returned to normal. The 2-day reactor
took longer to respond but the ratio eventually returned to stoichiometric levels after
approximately two weeks.
4.5 Kinetic Analysis of Nitrification Data
4.5.1 Estimating Y and Kd
The yield and decay coefficient for the overall nitrifier population was determined by
plotting the substrate utilization rate versus the inverse of BSRTs growth rates. The plot
can be seen in Figure 19. The specific substrate utilization rate for each BSRT was
determined using the following equation:
nitanit X
dtdS
q)(
= (33)
where:
dS = change in ammonia concentration (mg/L as N) dt = hydraulic retention time (0.366 day) (Xa)nit = active nitrifying biomass (8% of XT) qnit = specific substrate utilization rate (day-1)

102
Figure 19 Steady state plot of nitrification substrate utilization rate versus specific growth rate that was used to determine the autotrophic yield and decay rate for excess DO conditions.
y = 3.06x + 0.52R2 = 0.97
0
0.5
1
1.5
2
2.5
0 0.1 0.2 0.3 0.4 0.5 0.6
Growth Rate (1/θc), day-1
Spe
cific
Sub
stra
te U
tiliz
atio
n R
ate
(q),
day
-1
103
Confidence intervals (99%) are shown for the mean specific utilization rates. The
yield coefficient was determined to be 0.33 mg VSS/mg N, with a 99% confidence
interval ranging from 0.31-0.35 mg VSS/mg N. Although it is higher than some values in
the literature (Table 1), the yield is still within the overall range. The yield is particularly
similar to the value of 0.34 mg VSS/mg N calculated by Dincer and Kargi (2000) using
kinetic data. Hawkins (2000) obtained a yield coefficient value of 0.26 mg VSS/mg N
while using the same reactor setup and treating the same waste stream as this study. The
decay coefficient was then determined by multiplying the value obtained for Y and the y-
intercept of the best-fit line. The decay coefficient was estimated to be 0.17 day-1 with a
99% confidence interval ranging from 0.15-0.18 day-1. This value compares favorably
with the ones obtained in the literature (Table 1) and is identical to the value of 0.17 day-1
obtained by Hawkins (2000).
4.5.2 Estimating Ks, µmax, and k for the overall nitrifiers
The half saturation coefficient and maximum growth rate were calculated using
Equation 24 to plot the inverse of the effluent substrate concentration aga inst values of
(1/(θc+Kd). The decay coefficient determined in previous calculations (0.17 day-1) was
used in this analysis. The data provided a linear regression with an R2 value 0.98 as seen
in Figure 20. The linear regression analysis provided a half saturation coefficient value
of 0.25 mg/L NH4+ with a 99% confidence interval ranging from 0.24-0.27 mg/L NH4
+.
Although this value is quite small, it is still within the range reported in the literature
(Table 1). Hawkins (2000) obtained a value of 0.2 mg/L for Ks, which is very similar to
the value calculated in this study. The nitrifier maximum specific growth rate was found

104
Figure 20 Steady state plot of nitrification data used to determine the maximum specific growth rate and half saturation constant for excess DO conditions.
y = 2.97x - 3.97R2 = 0.98
0
2
4
6
8
10
12
0 0.5 1 1.5 2 2.5 3 3.5 4 4.5 5
1/(1/θc+ Kd)
1/S
e
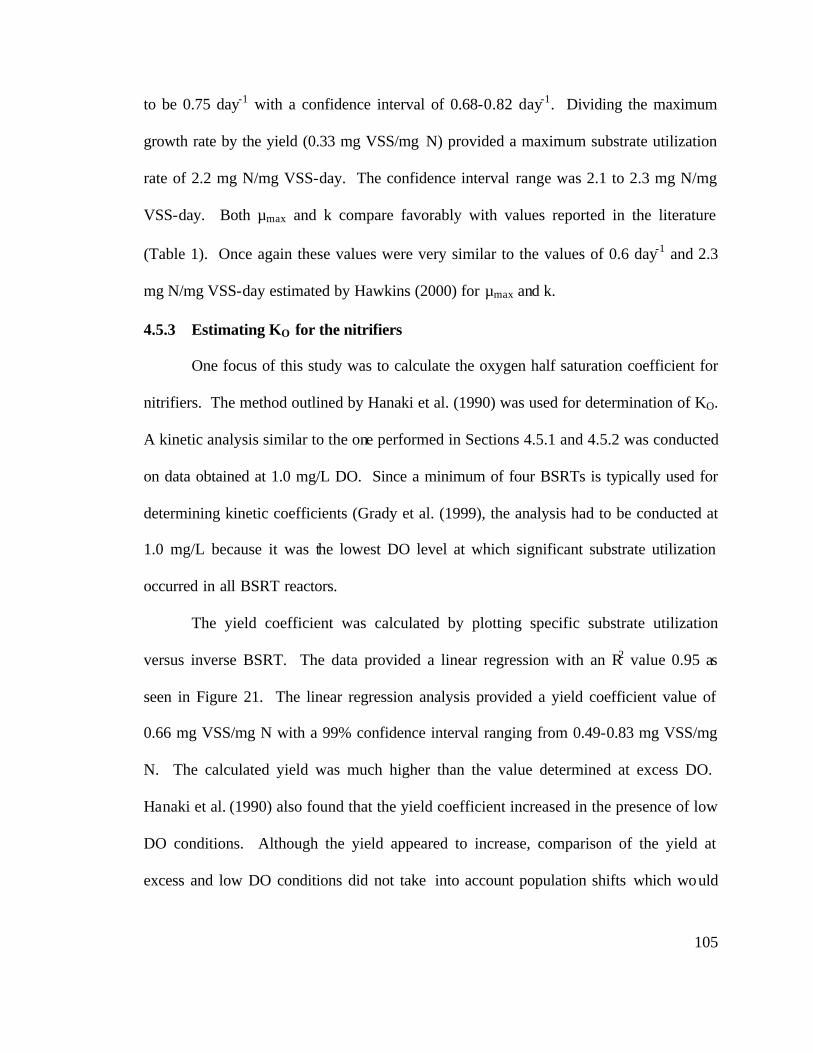
105
to be 0.75 day-1 with a confidence interval of 0.68-0.82 day-1. Dividing the maximum
growth rate by the yield (0.33 mg VSS/mg N) provided a maximum substrate utilization
rate of 2.2 mg N/mg VSS-day. The confidence interval range was 2.1 to 2.3 mg N/mg
VSS-day. Both µmax and k compare favorably with values reported in the literature
(Table 1). Once again these values were very similar to the values of 0.6 day-1 and 2.3
mg N/mg VSS-day estimated by Hawkins (2000) for µmax and k.
4.5.3 Estimating KO for the nitrifiers
One focus of this study was to calculate the oxygen half saturation coefficient for
nitrifiers. The method outlined by Hanaki et al. (1990) was used for determination of KO.
A kinetic analysis similar to the one performed in Sections 4.5.1 and 4.5.2 was conducted
on data obtained at 1.0 mg/L DO. Since a minimum of four BSRTs is typically used for
determining kinetic coefficients (Grady et al. (1999), the analysis had to be conducted at
1.0 mg/L because it was the lowest DO level at which significant substrate utilization
occurred in all BSRT reactors.
The yield coefficient was calculated by plotting specific substrate utilization
versus inverse BSRT. The data provided a linear regression with an R2 value 0.95 as
seen in Figure 21. The linear regression analysis provided a yield coefficient value of
0.66 mg VSS/mg N with a 99% confidence interval ranging from 0.49-0.83 mg VSS/mg
N. The calculated yield was much higher than the value determined at excess DO.
Hanaki et al. (1990) also found that the yield coefficient increased in the presence of low
DO conditions. Although the yield appeared to increase, comparison of the yield at
excess and low DO conditions did not take into account population shifts which would

106
Figure 21 Steady state plot of nitrification substrate utilization rate versus specific growth rate that was used to determine the autotrophic yield for low DO conditions.
y = 1.52x + 0.48R
2 = 0.95
0
0.2
0.4
0.6
0.8
1
1.2
1.4
1.6
0 0.1 0.2 0.3 0.4 0.5 0.6
Specific Growth Rate, day-1
Sp
ecif
ic S
ub
stra
te U
tiliz
atio
n R
ate,
(q
) D
ay-1
107
affect the concentration of nitrifiers in the system. For this study, the assumption was
made that the nitrifier population was a constant fraction of the MLVSS concentration. It
should be noted that there was no means of evaluating this assumption so care should be
taken when considering these results. New techniques, such as genetic probes, are being
developed to better quantify the amount of nitrifiers present in activated sludge systems.
Rittman et al. (1999) have used 16s RNA probes to determine the percentage of ammonia
oxidizers relative to the overall microbial population. These tools will provide a more
accurate means of determining a value for kinetic coefficients such as the yield.
The maximum specific growth rate was calculated by plotting the inverse of the
effluent substrate concentration against values of (1/(θc+Kd). Figure 22 contains a plot of
the average data fit with a simple linear regression. The poor linear fit produced by this
technique has been problematic in past bench scale studies due to low effluent substrate
concentrations (Grady et al., 1999). A similar fit was produced by Hawkins (2000) when
estimating a value for µmax. The nitrifier maximum specific growth rate was found to be
0.75 day-1 with a 99% confidence interval of 0.64 to 0.86 day-1. The maximum specific
growth rate did not vary from the value obtained at excess DO. Hanaki et al. (1990) also
found that µmax for nitrifiers did not significantly vary when DO conditions were altered.
Using the Y and µmax values, a maximum specific substrate utilization rate of 1.14 mg
N/mg VSS-day with a 99% confidence interval of 0.91 to 1.51 mg N/mg VSS-day was
obtained.
108
Figure 22 Steady state plot of nitrification data used to determine the maximum specific growth rate for low DO conditions.
y = 7.46x - 9.91R2 = 0.86
0
2
4
6
8
10
12
0 0.5 1 1.5 2 2.5 3 3.5 4
1/(1/θc+ Kd)
1/S
e

109
A value of KO was then calculated using Equation 26 by substituting 2.2 and 1.14
mg N/mg VSS-day for the excess and low DO maximum substrate utilization rates
respectively. A value of 1.0 mg/L was used for the DO term to yield a KO of 0.92 mg/L
with a 99% confidence interval of 0.46 to 1.3 mg/L. Although this value varies from the
one estimated by Hanaki et al. (1990), it is well within the range reported in the literature
(Table 1). The difference in values between this study and the study by Hanaki et al.
(1990) has been attributed to the fact that this study used a combined carbon/nitrification
system for estimation while a pure nitrification system was employed in the previous
work.
110
Chapter 5.0
Conclusions
5.1 Evaluation of Carbon Treatment Performance
One part of the first objective of this treatability study was to assess the impact of
BSRT and DO on carbon removal efficiency. Statistical analysis indicated that treatment
performance was a function of BSRT since the average effluent COD in the 20 day
BSRT reactor was significantly lower than the averages for the 5 and 2 day BSRT
reactors. Because treatment performance in the 10 and 20 day BSRT reactors did not
differ statistically, it appeared that COD removal was not enhanced by BSRTs longer
than 10 days.
Conversely, DO had no impact on carbon treatment performance. Statistical
analysis showed no significant variance in the average effluent COD values in the excess
and low DO periods of any BSRT. This occurrence has been attributed to the low KO
value associated with heterotrophic bacteria utilizing an easily degradable substrate.
Based on the data collected in this study, optimum COD removal took place at a DO of
only 0.2 mg/L when the BSRT is maintained at 10 days or longer.
5.2 Evaluation of Sludge Settling Performance
Another part of the first objective was to carry out bench scale treatment
experiments to examine the effect of low DO (0.2-0.5 mg/L) and BSRT on activated
sludge settling. Statistical analysis of SVI values showed that BSRT had no effect on
111
settling performance. With the exception of a short period during the 2.0 mg/L
operational period, low SVI values were found for all BSRTs during the course of the
study. DO concentration had no impact on sludge settling even when the 10-day BSRT
reactor was operated at 0.2 mg/L.
The consistency of ESS values during the treatability study is further evidence
that sludge settling was not impacted by DO concentration. Each reactor regularly
discharged an ESS concentration lower than the 45 mg/L discharge limit imposed on the
Kuwahee WWTP. However, all four reactors violated the discharge limit on several
occasions indicating that the bench-scale system was not as effective as a full-scale plant.
The incidents of high ESS were caused by operational problems. The first was the
installation of improper tubing. The second occurrence was the result of foaming in the
reactors. The foam was likely caused by the injection of air provided by the air blast
units and not low DO since foaming ceased once the units were turned off.
5.3 Evaluation of Nitrification Performance
The final part of the first objective was to determine the effects of DO and BSRT
on nitrification. Based on the data collected in this study, complete nitrification can
occur in systems with a BSRT of 10 days or longer at DO levels as low as 0.5 mg/L.
However, as evidenced by the presence of the surfactant (July 31st), treatment
performance is based on the composition of the influent. The build-up of nitrite in the 5-
day BSRT reactor at 0.5 mg/L DO suggests that the nitrite oxidizers can become the rate-
limiting factor for nitrification at low DO. However, the lack of nitrite build-up in the 20
and 10 day BSRTs at 0.5 mg/L DO also indicates that effective nitrite oxidation can

112
occur if a sufficient amount of biomass is present. The 2-day BSRT was insufficient to
consistently achieve complete nitrification at any DO level. Therefore, a minimum
BSRT of 5 days should be maintained to establish nitrification at excess DO but a 10 day
or greater BSRT is necessary for effective nitrification at low DO (≤1.0 mg/L).
The second objective of this study was to calculate nitrifier kinetic coefficients to make it
possible to design an activated sludge system treating a similar waste stream. The
estimated overall kinetic coefficients are within a range published in the literature for
municipal wastewaters (Table 9) and very similar to those obtained by Hawkins (2000)
while treating the same waste stream. These facts indicate that the values obtained from
the treatability study are reliable. Therefore, it is believed that these values could be used
in the design of an activated sludge treatment facility with a similar influent waste
stream. Since the stoichiometric ratio of alkalinity consumed per ammonia converted to
nitrate was upheld during the course of the study, it appears that denitrification did not
Table 9 Comparison of nitrification coefficients obtained during the treatability study and coefficients taken from the literature.
Activated Sludge Kinetic
Constant Current Study [99% Confidence Interval]
Range Reported in the Literature
Kd 0.17 [0.15-0/18] day-1 0.03-0.17 day-1 KSN 0.25 [0.24-0.27] mg/L
[NH4+-N]
0.2-5.0 mg/L [NH4+-N]
KO 0.92 [0.46-1.3] mg/L O2* 0.32-2.0 mg/L O2 Y 0.33 [0.31-0.35] mg
VSS/mg N 0.1-0.36 mg VSS/mg N
k 2.2 [2.1-2.3] mg N/mg VSS-day
0.076-4.3 mg N/mg VSS-day
µmax 0.75 [0.68-0.82] day-1 0.3-3.0 day-1
113
occur to any significant degree in any of the reactors. Analysis of the mass balances
indicates that the nitrifiers used primarily the influent ammonia as a substrate.
Conversion of organic-N to ammonia was negligible except for a few days when the
effluent nitrogen was well above the influent ammonia-N.
Based on the data, it appears that a 10 day BSRT and a DO concentration of 0.5
mg/L are necessary for effective COD treatment, sludge settling, and nitrification.
However, WWTPs cannot afford to violate their permits so a factor of safety should be
introduced to reduce the risk of operational failure. For this reason, WWTPs typically
operate their aeration basins at excess DO (≥2 mg/L) conditions when nitrification is part
of the treatment process. It is recommended that a treatability study be conducted for a
particular waste if lower levels of DO are to be employed in operation.

114
References
115
Akca, L., Kinaci C. and Karpuzco M. (1993) A model for optimum design of activated
sludge plants. Water Research. 27(9), 1461-1468.
Albertson, O.E. and Hendricks, P. (1992) Bulking and foaming organism control at
Phoenix, AZ WWTP. Water Science and Technology. 26 (3-4), 461-472.
American Public Health Association (1998) Standard Methods for the Examination of
Water and Wastewater, 20th Edition. American Public Health Association, New York,
NY.
Bae, W. and Rittmann B.E. (1996) A structured model of dual- limitation kinetics.
Biotechnology and Bioengineering. 49, 683-689.
Balmelle B., Nguyen K., Capdeville B., Cornier J. and Deguin A. (1992) Study of the
factors controlling nitrite build-up in biological processes for water nitrification. Water
Science and Technology. 26(5/6), 1017-1025.
Beccari M., DiPinto A., Ramadori R. and Tomei M. (1992) Effects of dissolved
oxygen and diffusion resistances on nitrification kinetics. Water Research. 26(8), 1099-
1104.
Benefield L. and Randall C. (1985) Biological Process Design for Wastewater
Treatment. Larry D. Benefield and Clifford W. Randall, Charlottesville, VA.
Bernal-Martinez, A., Gonzalez-Barcelo, O. and Gonzalez-Martinez, S. (2000)
Nutrient removal and sludge age in a sequencing batch reactor. Bioprocess Engineering.
23(1), 41-45.

116
Bernet, N., Dangcong, P., Delgenes, J.-P., and Moletta R. (2001) Nitrification at low
oxygen concentration in biofilm reactor. Journal of Environmental Engineering. 127(3),
266-271.
Bisogni, J.J., and Lawrence, A.W. (1971) Relationships between biological solids
retention time and settling characteristics of activated sludge. Water Research. 5, 753-
763.
Chuang, S.H., Ouyang, C.F., Yuang, H.C., and You, S.J. (1997) Effects of SRT and
DO on nutrient removal in a combined as-biofilm process. Water Science and
Technology. 36(12), 19-27.
Clauss, F., Helaine, D., Balavoine, C., and Bidault, A. (1998) Improving activated
sludge floc structure and aggregation for enhanced settling and thickening performances.
Water Science and Technology. 38(8-9), 1998.
Copp, J.B. and Murphy, K.L. (1995) Estimation of the active nitrifying biomass in
activated sludge. Water Research. 29(8), 1855-1862.
D’Agostino, R.B., Belanger, A., and D’Agostino Jr., R.B. (1990) A suggestion for
using powerful and informative tests of normality. The American Statistician. 44, 316-
321.
Daigger, G.T. and Parker, D.S. (2000) Enhancing nitrification in North American
activated sludge plants. Water Science and Technology. 41(9), 97-105.
Dangcong, P., Bernet, N., Delgenes, J.-P., and Moletta R. (2000) Effects of oxygen
supply methods on the performance of a sequencing batch reactor for high ammonium
nitrification. Water Environment Research. 72, 195-200.
117
Dincer, A.R. and Kargi F. (2000) Effects of operating parameters on performances of
nitrification and denitrification processes. Bioprocess Engineering. 23, 75-80.
Dincer, A.R. and Kargi F. (2000) Kinetics of nitrification and denitrification processes.
Enzyme and Microbial Technology. 27, 37-42.
Drtil, M., Nemeth, P., and Bodik, I. (1993) Kinetic constants of nitrification. Water
Research. 27(1), 35-39.
Echeverria, E., Seco, A., and Ferer, J. (1992) Study of the factors affecting activated
sludge settling in domestic wastewater treatment plants. Water Science and Technology.
25(4-5), 273-279.
Echeverria, E., Seco, A., and Ferer, J. (1993) Control of activated sludge settleability
using preaeration and preprecipitation. Water Research. 27 (2), 293-296.
Fillos J., Diyamandoglu V., Carrio L. and Robinson L. (1996) Full-scale evaluation of
biological nitrogen removal in the step feed activated sludge process. Water
Environment Research. 68(2), 132-142.
Foot R. (1992) The effects of process control parameters on the composition and stability
of activated sludge. Journal of the Institution of Water and Environment Management.
6(2), 215-228.
Gee, C.S., Pfeffer, J.T., and Suidan, M.T. (1990) Nitrosomonas and Nitrobacter
interactions in biological nitrification. Journal of Environmental Engineering. 116(1), 4-
17.
Grady, C.P.L, Daigger, G.T., and Lim, H.C. (1999) Biological Wastewater Treatment,
2nd Edition. Marcel Dekker, Inc., New York, NY.
118
Grady, C.P.L., and Williams, D.R. (1974) Effects of influent substrate concentration on
the kinetics of natural microbial populations in continuous culture. Water Research. 9,
171-180.
Grunditz, C. and Dalhammar, G. (2001) Development of nitrification inhibition assays
using pure cultures of Nitrosomonas and Nitrobacter. Water Research. 35(2), 433-440.
Guellil, A., Thomas, F., Block, J.-C., Bersillon, J-L., and Ginestet, P. (2001) Transfer
of organic matter between wastewater and activated sludge flocs. Water Research. 35(1),
143-150.
Hanaki K., Wantawin C. and Ohgaki S. (1990) Nitrification at low levels of dissolved
oxygen with and without organic loading in a suspended-growth reactor. Water
Research. 24(3), 297-302.
Hawkins (2000) A bench scale activated sludge study of nitrification and carbon
treatment using municipal wastewater. Master’s Thesis, Department of Environmental
Engineering, The University of Tennessee-Knoxville.
Henze, M., Grady, C.P.L. Jr., Gujer, W., Marais, G.V.R., and Matsuo, T. (1987) A
general model for single-sludge wastewater treatment systems. Water Research. 21(5),
505-515.
Jayamohan, S., Ohgaki, S., and Hanaki, K. (1988) Effect of DO on kinetics of
nitrification. Water Supply. 6, 141-150.
Kappeler, J. and Gujer, J. (1994) Influences of wastewater composition and operating
conditions on activated sludge bulking and scum formation. Water Science and
Technology. 30(11), 181-189.
119
Laanbroek, H.J., Bodelier, P.L.E., and Gerards, S. (1994) Oxygen consumption
kinetics of Nitrosomonas europaea and Nitrobacter hamburgensis grown in mixed
cultures at different oxygen concentrations. Archives of Microbiology. 161, 156-162.
Lau, A.O., Strom, P.F., and Jenkins, D. (1984) Growth kinetics of Sphaerotilus natans
and a floc former in pure and dual continuous culture. Journal of the Water Pollution
Control Federation. 56(1), 41-51.
Lawrence A. and McCarty P. (1970) Unified basis for biological treatment design and
operation. Journal of the Proceedings of the American Society of Civil Engineers. 96,
757-778.
Lishman, L.A., Legge, R.L. and Farquhar, G.J. (2000) Temperature effects on
wastewater treatment under aerobic and anoxic conditions. Water Research. 34(8),
2263-2276.
Madoni, P., Davoli, D., and Gibin, G. (2000) Survey of filamentous microorganisms
from bulking and foaming activated-sludge plants in Italy. Water Research. 34(6), 1767-
1772.
Marsili-Libelli, S. and Giovanni, F. (1997) On-line estimation of the nitrification
process. Water Research. 31(1), 179-185.
Massone, A., Gernaey, K., Rozzi, A., and Verstraete, W. (1998) Measurement of
ammonium concentration and nitrification rate by a new titrimetric biosensor. Water
Environment Research. 70(3), 343-350.
120
Munch, E.V., Barr, K. Watts, S. and Keller, J. (2000) Suspended carrier technology
allows ugrading high-rate activated sludge plants for nitrogen removal via process
intensification. Water Science and Technology. 41(4-5), 5-12.
Ng, W.J., Yap, M.G.S., and Sivadas, M. (1989) Biological treatment of a
pharmaceutical wastewater. Biological Wastes. 29, 299-311.
Nowak, G., Brown, G. and Yee, A. (1986) Effects of feed pattern and dissolved oxygen
on growth of filamentous bacteria. Journal of the Water Pollution Control Federation.
58(10), 978-984.
Oh J. and Silverstein J. (1999) Oxygen inhibition of activated sludge denitrification.
Water Research. 33(8), 1925-1937.
Palm, J.C., Jenkins, D., and Parker D.S. (1980) Relationship between organic loading,
dissolved oxygen concentration, and sludge settleability in the completely mixed
activated sludge process. Journal of the Water Pollution Control Federation. 52(10),
2484-2506.
Randall, C.W., Barnard, J.L., and Stensel, H.D. (1992) Design and Retrofit of
Wastewater Treatment Plants for Biological Nutrient Removal. Technomic Publishing
Company, Inc., Lancaster, PA.
Randall, C.W., Pattarkine, V.M. and McClintock, S.A. (1992) Nitrification kinetics
in single-sludge biological nutrient removal activated sludge systems. Water Science and
Technology. 25(6), 195-214.
Rittmann, B.E., Laspidou, C.S., Flax, J., Stahl, D.A., Urbain, V., Harduin, H., van
der Waarde, J.J., Geurkink, B., Henssen, J.C., Brouwer, H., Klapwijk, A., and
121
Wetterauw, M. (1999) Molecular and modeling analyses of the structure and function of
nitrifying activated sludge. Water Science and Technology. 39(1), 51-59.
Rittmann, B.E. and McCarty, P.L. (2001) Environmental Biotechnology: Principles
and Applications. McGraw-Hill, New York, NY.
Sinclair, C.G. and Ryder D.N. (1975) Models for the continuous culture of
microorganisms under both oxygen and carbon limiting conditions. Biotechnology and
Bioengineering. 17,375-398.
Stenstrom, M.K. and Poduska, R.A. (1980) The effect of dissolved oxygen
concentration on nitrification. Water Research. 14, 643-649.
Stenstrom M. and Song S. (1991) Effects of oxygen transport limitation on nitrification
in the activated sludge process. Journal of the Water Pollution Control Federation.
63(3), 208-219.
Surucu, S. and Cetin, F.D. (1989) Effect of temperature, pH and DO concentration on
filterability and compressibility of activated sludge. Water Research. 23(11), 1389-1395.
Surucu G. and Cetin F. (1990) Effects of temperature, pH and DO concentration on
settleability of activated sludge. Environmental Technology. 11, 205-212.
Tchobanoglous, G. and Burton F.L. (1991) Wastewater Engineering: Treatment,
Disposal, and Reuse, 3rd Edition. Irwin McGraw-Hill.
United States Environmental Protection Agency (1993) Process Design Manual for
Nitrogen Control. Office of Technology Transfer, Washington, D.C.
122
Wanner, J. (1998) Stable foams and sludge bulking: the largest remaining problems
(abridged). Journal of the Institute of Water and Environment Management. 12(5), 368-
374.
Wanner, J., Ruzickova, I., Krhutkova, O., and Pribyl, M. (2000) Activated sludge
population dynamics and wastewater treatment plant design and operation. Water
Science and Technology. 41(9), 217-225.
Wilen B.-M. and Balmer P. (1998) Short term effects of dissolved oxygen concentration
on the turbidity of the supernatant of activated sludge. Water Science and Technology.
38(3), 25-33.
Wilen B.-M. and Balmer P. (1999) The effect of dissolved oxygen concentration on the
structure, size and size distribution of activated sludge flocs. Water Research. 33(2),
391-400.
Zheng H., Hanaki K. and Matsuo T. (1994) Production of nitrous oxide gas during
nitrification of wastewater. Water Science and Technology. 30(6), 91-100.

123
Appendices

124
Appendix A. Calculation Showing Complete Mixing

125
The stir plates were typically set to approximately one-half their maximum setting of 1000rpm, which corresponds to a power output of 15 watts.
333 1000/1500/5.1
01.0015.0
mkWmkWmkW
VP
PVol ====
126
Appendix B. Average DO Concentrations
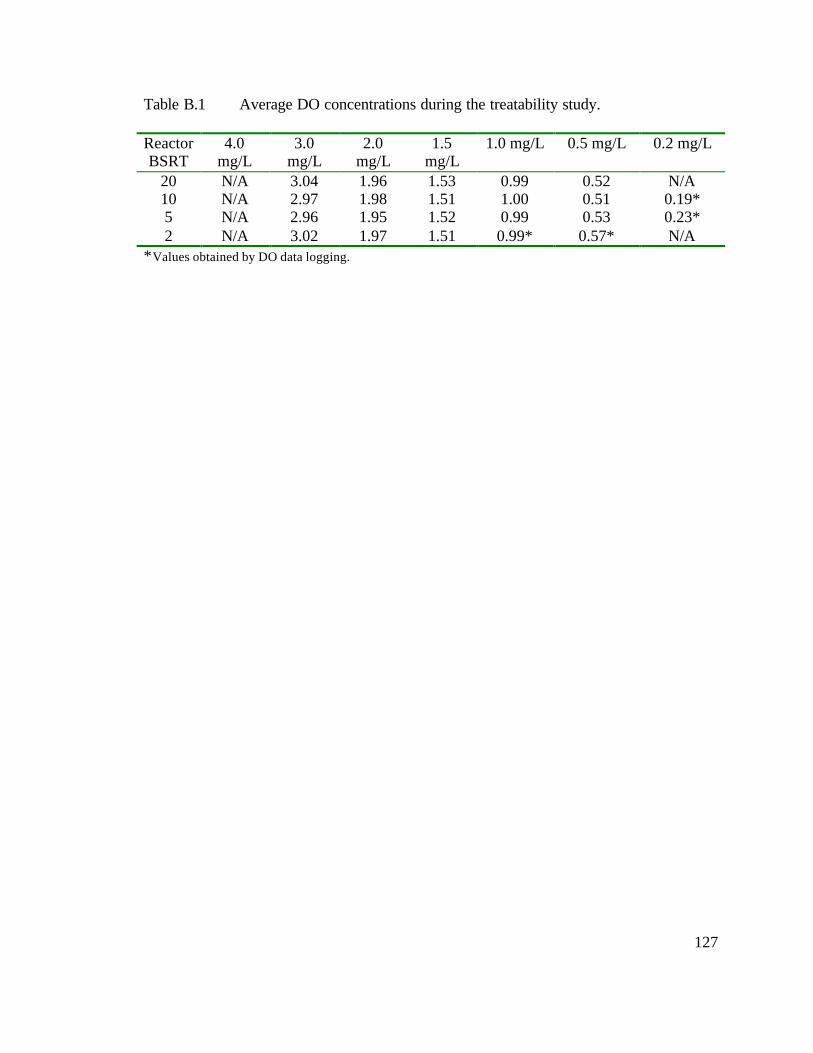
127
Table B.1 Average DO concentrations during the treatability study. Reactor BSRT
4.0 mg/L
3.0 mg/L
2.0 mg/L
1.5 mg/L
1.0 mg/L 0.5 mg/L 0.2 mg/L
20 N/A 3.04 1.96 1.53 0.99 0.52 N/A 10 N/A 2.97 1.98 1.51 1.00 0.51 0.19* 5 N/A 2.96 1.95 1.52 0.99 0.53 0.23* 2 N/A 3.02 1.97 1.51 0.99* 0.57* N/A
*Values obtained by DO data logging.

128
Vita
Jack Parker was born in Smyrna, Tennessee on January 8, 1976. He attended the public
system of schools in Rutherford County, where he graduated from Smyrna High School
in May 1994. He entered The University of Tennessee-Knoxville in August 1994,
receiving a Bachelor of Science in Civil Engineering in May 1999. Mr. Parker entered
the Master’s program in Environmental Engineering as a full time student in August of
1999. Working as a graduate research assistant, he officially received his Master of
Science Degree in Environmental Engineering in December 2001.


![Dissolved Oxygen [DO]](https://img.dokumen.tips/doc/110x75/5a6721977f8b9ab12b8b464b/dissolved-oxygen-do.jpg)