Embed Size (px)
Citation preview

lable at ScienceDirect
Brain Stimulation 13 (2020) 1183e1195
Contents lists avai
Brain Stimulation
journal homepage: http : / /www.journals .elsevier .com/brain-st imulat ion
The effects of direct brain stimulation in humans depend onfrequency, amplitude, and white-matter proximity
Uma R. Mohan a, Andrew J. Watrous b, Jonathan F. Miller a, Bradley C. Lega c,Michael R. Sperling d, Gregory A. Worrell e, Robert E. Gross f, Kareem A. Zaghloul g,Barbara C. Jobst h, Kathryn A. Davis i, Sameer A. Sheth j, Joel M. Stein k, Sandhitsu R. Das k,Richard Gorniak l, Paul A. Wanda m, Daniel S. Rizzuto m, n, Michael J. Kahana m,Joshua Jacobs a, *
a Department of Biomedical Engineering, Columbia University, New York, 10027, USAb Department of Neurology, University of Texas at Austin, Austin, TX, 78712, USAc Department of Neurosurgery, University of Texas-Southwestern, Dallas, TX, 75390, USAd Department of Neurology, Thomas Jefferson University, Philadelphia, PA, 19107, USAe Department of Neurology, Mayo Clinic, Rochester, MN, 55905, USAf Department of Neurosurgery, Emory University, Atlanta, GA, 30322, USAg Surgical Neurology Branch, National Institutes of Health, Bethesda, MD, 20814, USAh Department of Neurology, Dartmouth College, Lebanon, NH, 03756, USAi Department of Neurology, Hospital of the University of Pennsylvania, Philadelphia, PA, 19104, USAj Department of Neurological Surgery, Baylor College of Medicine, Houston, TX, 77030, USAk Department of Radiology, Hospital of the University of Pennsylvania, Philadelphia, PA, 19104, USAl Department of Radiology, Thomas Jefferson University Hospital, Philadelphia, PA, 19107, USAm Department of Psychology, University of Pennsylvania, Philadelphia, PA, 19146, USAn Nia Therapeutics, Inc, Radnor, PA, 19087, USA
a r t i c l e i n f o
Article history:Received 2 December 2019Received in revised form5 May 2020Accepted 7 May 2020Available online 21 May 2020
Keywords:Stimulation frequencyStimulation currentWhite-matterStimulation protocol designStimulation parameter spaceIntracranial EEGDirect brain stimulation
* Corresponding author. 351 Engineering TerraAmsterdam Avenue, New York, NY, 10027, USA.
E-mail address: [email protected] (J. Jac
https://doi.org/10.1016/j.brs.2020.05.0091935-861X/© 2020 The Author(s). Published by Elsevie).
a b s t r a c t
Background: Researchers have used direct electrical brain stimulation to treat a range of neurological andpsychiatric disorders. However, for brain stimulation to be maximally effective, clinicians and researchersshould optimize stimulation parameters according to desired outcomes.Objective: The goal of our large-scale study was to comprehensively evaluate the effects of stimulation atdifferent parameters and locations on neuronal activity across the human brain.Methods: To examine how different kinds of stimulation affect human brain activity, we compared thechanges in neuronal activity that resulted from stimulation at a range of frequencies, amplitudes, andlocations with direct human brain recordings. We recorded human brain activity directly with electrodesthat were implanted in widespread regions across 106 neurosurgical epilepsy patients while systemat-ically stimulating across a range of parameters and locations.Results: Overall, stimulation most often had an inhibitory effect on neuronal activity, consistent withearlier work. When stimulation excited neuronal activity, it most often occurred from high-frequencystimulation. These effects were modulated by the location of the stimulating electrode, with stimula-tion sites near white matter more likely to cause excitation and sites near gray matter more likely toinhibit neuronal activity.Conclusion: By characterizing how different stimulation parameters produced specific neuronal activitypatterns on a large scale, our results provide an electrophysiological framework that clinicians and re-searchers may consider when designing stimulation protocols to cause precisely targeted changes inhuman brain activity.© 2020 The Author(s). Published by Elsevier Inc. This is an open access article under the CC BY-NC-ND
license (http://creativecommons.org/licenses/by-nc-nd/4.0/).
ce, Mail Code 8904, 1210
obs).
r Inc. This is an open access article
under the CC BY-NC-ND license (http://creativecommons.org/licenses/by-nc-nd/4.0/
Abbreviations
HFA High Frequency ActivityLME Linear Mixed EffectsDBS Deep Brain StimulationiEEG Intracranial ElectroencephalographyMTL Medial Temporal LobeLTL Lateral Temporal Lobe
U.R. Mohan et al. / Brain Stimulation 13 (2020) 1183e11951184
Introduction
Direct electrical stimulation shows potential as a treatment for avariety of neurological conditions and as a tool for studyingneuropsychiatric disorders and cognition. However, we do not yethave a detailed understanding of the widespread neuronal effectsthat result from different types of stimulation. The goal of our studywas to examine this issue by characterizing at a large scale howdifferent types of brain stimulation modulate directly recordedhuman neuronal activity.
For years, direct electrical stimulation has been used to effec-tively treat motor disorders, such as Parkinson’s Disease, essentialtremor, dystonia, and epileptic seizures[7,14,25,26,46,51,54,55,106]. In the past two decades, researchershave extended stimulation protocols frommotor disorders to betterunderstand and modulate brain circuits of neuropsychiatric andcognitive disorders, such as major depression [68], obsessivecompulsive disorder [80], addiction [48,57], anorexia nervosa [59],schizophrenia [4,49], and Alzheimer’s disease [50,63]. While directelectrical stimulation holds potential to treat patients with neuro-logical disorders who cannot be treated pharmacologically, un-derstanding how different stimulation parameters differentiallyaffect neuronal activity is important for optimizing such therapies.
Researchers and clinicians have found that stimulation producesa wide range of behavioral effects. Cortical stimulation was firstlinked to human memory in Wilder Penfield’s pioneering studieswhere stimulating an awake patient’s temporal lobe caused themto spontaneously recall old memories [82]. Penfield’s subsequentwork showed that the particular location that was stimulatedgreatly affected how patients re-experienced old memories.Following this, many studies applied direct electrical stimulation tothe temporal lobe using a variety of stimulation parameters. Theresults from these studies were wide-ranging, emphasizing thecomplexity of precisely modulating human neuronal activity withstimulation [10,20,88,94]. Early applications of stimulation in non-human primates showed impairment in working memory whenstimulating specific frontal cortex locations [100,101]. Subsequentstudies in humans showed that stimulation impaired recall ofcomplex scenes [31], subsequent item recognition [13], spatial, andverbal memory recall [40,53]. However, a number of studies havealso shown improvements to verbal, visual, and spatial memory[21,23,73,95]. Studies using brain stimulation to treat otherneurological diseases also found inconsistent cognitive effects[30,54,55,68]. The stimulation protocols used in these studies var-ied substantially in terms of locations, frequencies, durations, am-plitudes, pulse patterns (continuous or intermittent), and times atwhich stimulation was delivered. To explain why these studiesfound such diverse behavioral and cognitive effects from stimula-tion, it is helpful to understand the physiology of how differentkinds of stimulation alter underlying neuronal activity.
Earlier studies showed that stimulation can cause both excit-atory and inhibitory effects on local and connected regions. Yet,within the realm of treating Parkinson’s Disease with deep brain
stimulation (DBS) where clinical outcomes are well established, theelectrophysiology of stimulation is unclear. While some studiesdemonstrate that stimulation causes inhibition [9,18,58,102], otherstudies show excitation after stimulating at different frequenciesand locations [1,34,42,67,105]. There is evidence that the location ofa stimulation electrode has an important role in dictating theoutcome of stimulation, with white- and gray-matter stimulationsites causing different effects [36,37,78,79]. Further, an early studyin non-human primates describes motor and autonomic responsesto stimulation that depend on both stimulation frequency andduration [72]. Logothetis et al. [61] build upon this showing evi-dence of specific microstimulation frequencies and locationssimultaneously inducing both inhibitory and excitatory effects indifferent regions. These findings, which illustrate the diverse rangeof electrophysiological effects of brain stimulation, demonstrate thechallenge in designing brain stimulation protocols to modulatebrain activity in targeted ways that achieve desired behavioraloutcomes.
The goal of our study was to comprehensively evaluate the ef-fects of different types of stimulation on neuronal activity acrossthe human brain. To examine changes in neuronal activity due tostimulation, we collected and analyzed direct brain recordings from106 neurosurgical patients who underwent an extensive stimula-tion “parameter search” paradigm involving a range of stimulationfrequencies and amplitudes at different cortical surface and depthlocations. We thenmeasured how different stimulation parameterscorrelated with the directional changes in neuronal activity thatresulted from stimulation. Because we sought to understand theeffects of stimulation on the mean activity across neuronal pop-ulations, we measured high-frequency broadband power(30e100 Hz), which provides an estimate of the mean rate of localneuronal spiking activity [66,99]. Our results provide a morecomprehensive examination of the direct electrical stimulationparameter space than any prior human study. We find that theneuronal effects of stimulation are highly parameter dependent.Specifically, the prevalence of excitation and inhibition are modu-lated by the frequency and amplitude of stimulation and by regionand the distance of the stimulation site to white-matter tracts.These results provide a starting point for clinicians and researchersto more optimally design stimulation protocols according to thedesired types of changes to ongoing brain activity.
Methods
Participants
The 106 patients in our study were surgically implanted withdepth, surface grid, and/or surface strips of electrodes for thepurpose of identifying epileptic regions. The patients’ clinicalteams determined electrode placement to best monitor each pa-tient’s epilepsy. We conducted these procedures at eight hospi-tals: Thomas Jefferson University Hospital (Philadelphia, PA);University of Texas Southwestern Medical Center (Dallas, TX);Emory University Hospital (Atlanta, GA); DartmoutheHitchcockMedical Center (Lebanon, NH); Hospital of the University ofPennsylvania (Philadelphia, PA); Mayo Clinic (Rochester, MN);National Institutes of Health (Bethesda, MD); and Columbia Uni-versity Hospital (New York, NY). Following institutional reviewboard protocols at each hospital, all participating patients pro-vided informed consent.
Stimulation paradigm
This stimulation “parameter search” paradigm was part of alarger project aimed to enhance episodic and spatial memory

U.R. Mohan et al. / Brain Stimulation 13 (2020) 1183e1195 1185
using direct electrical stimulation [21,22,40]. Blackrock Micro-systems provided neural stimulation equipment for these pro-tocols. As part of this larger project, subjects participated in thisparadigm to characterize the brain-wide effects of applyingelectrical stimulation at different sites with varying frequenciesand amplitudes. During each session of this stimulation proced-ure, we instructed subjects to sit quietly and rest with eyes openas we applied various types of stimulation and measured neuronalactivity. The main goal in applying stimulation across frequencies,amplitudes, and sites was to identify specific stimulation locationsand parameters that would enhance performance in subsequentmemory tasks [21]. Therefore, we often applied stimulation inmedial temporal lobe (MTL) and lateral temporal lobe (LTL) lo-cations based on their functional relevance for memory [19,81](Table S2).
A clinical neurologist oversaw all stimulation sessions. We per-formed a separate amplitude screening procedure for each targetsite before stimulation. In the screening procedure, each site wasprogressively stimulated for 500 ms at each tested frequency,beginning at 0.5 mA, in steps of 0.5 mA, up to a maximum of 1.5 mAfor depth electrodes or 3 mA for surface electrodes. A neurologistmonitored visually for afterdischarges throughout this process. Wethen logged for each site the maximum current that could beapplied without causing afterdischarges.
In the main stimulation protocol, we applied bipolar stimula-tion across neighboring anode and cathode electrodes using 300ms charge-balanced biphasic rectangular pulses. For each site, westimulated at frequencies of 10, 25, 50, 100, or 200 Hz, with am-plitudes from 0.25 mA up to the site’s determined maximum insteps of 0.25 mA, as well as 0.125 mA. Each stimulation trial wasapplied for 500 ms, with a random delay of 2750e3500 ms(uniformly distributed) between the offset and onset of consec-utive stimulation trials. Within each ~25-min session that stim-ulated one location, we randomly ordered stimulation trials withdifferent frequencies and amplitudes to prevent confounds arisingfrom trial order. Each targeted stimulation site received 24 stim-ulation trials for each combination of frequency and amplitude.Some subjects participated in a version of this procedure that alsoincluded sham trials without stimulation. Individual subjectsparticipated in this stimulation protocol for between 1 and 9 in-dividual sites (mean ¼ 2.8 sites). Overall, we collected a total of354 sessions, stimulating at 319 distinct sites from 106 subjectswith between 54 and 173 bipolar recording pairs (mean ¼ 108,total 10,266 electrodes). Following artifact rejection (see below),we included in our data analyses 292 sessions over 264 stimula-tion sites from 94 subjects while recording simultaneous neuronalactivity from 9,775 bipolar electrode pairs, where each subjecthad between 22 and 170 bipolar recording pairs (mean ¼ 102electrodes).
Electrocorticographic recordings and referencing
To measure the electrophysiological effects of stimulation,throughout a stimulation session we recorded neuronal activity at500, 1000, or 1600 Hz using a clinical intracranial electroenceph-alographic (iEEG) recording system at each hospital (Nihon KohdenEEG-1200, Natus XLTek EMU 128, Natus Quantum EEG, or GrassAura-LTM64 systems). We referenced each electrode’s signal to acommon contact placed intracranially, on the scalp, or mastoidprocess. To reduce non-physiological artifacts, we used bipolarreferencing, computed as the voltage difference between pairs ofadjacent electrodes. The location of each bipolar pair was taken asthe midpoint between the two physical electrodes. We furtherfiltered electrical line noise using a 57e63-Hz Butterworth notchfilter.
Anatomical localization
We determined the location of each electrode by co-registeringa post-surgical CT scan to T1 and T2 weighted structural MRIs takenprior to implantation. We determined electrode localization incortical regions by co-registration of the post-implantation CT,corrected for post-operative brain shift, with Freesurfer’s auto-mated cortical parcellation based on the Desikan-Killiany brainatlas [17]. We based localization to medial temporal lobe structureson MTL segmentation using Automatic Segmentation of Hippo-campal Subfields (ASHS) [108].
Artifact rejection
Applying electrical stimulation can cause the appearance ofnon-physiological signals in iEEG recordings that manifest ascomplete amplifier saturation or overall shifts in signal amplitude,such as rise, decay, or deflection following stimulation beforereturning to baseline (Fig. S2). These non-physiological changescould impair our ability to accurately measure true physiologicalsignals related to stimulation.
Therefore, to minimize the impact of artifacts on our results, weexcluded from our analyses any recording electrodes and trials thatshowed post-stimulation artifacts. We implemented a detectionalgorithm to identify channels that are prone to complete signalsaturation as well as gradual post-stimulation artifact. Followingearlier methods [91], we compared the average voltage of the signalfrom �500 to �100 ms prior to stimulation onset and from 100 to500 ms after stimulation offset. To include data from as manyrecording electrodes as possible, we took a two-phase approach toexclude artifacts on the single-trial level as well as on an electrodelevel. To identify artifacts, we employed Grubb’s outlier test toclassify the trials that exhibited large non-physiological changes involtage. Specifically, we excluded the data of any trials that showeda change in voltage between the pre- and post-stimulation in-tervals that was greater than 2 standard deviations of the corre-sponding mean voltage changes for matching sham trials for thesame electrode (Fig. S2). We excluded any electrodes that showedartifacts on over half of all trials for a particular combination ofparameters. Some stimulation sites were especially conducive tospreading artifacts across recording electrodes, and thus weexcluded stimulation sites that caused artifacts on over half of allrecording electrodes. Overall, we excluded 56 stimulation sites, anaverage of 10% of bipolar recording electrodes, and 12% of stimu-lation trials on remaining contacts (see Table S3). In addition toexcluding trials, recording electrodes, and stimulation sites affectedby amplifier artifact following stimulation, we excluded trials withepileptiform activity if the kurtosis of the voltage signal exceeded athreshold of 3 [16]. Using this method, we excluded an average of3.2% ±3.8% of stimulation trials.
Spectral power analysis
To measure the effect of stimulation on mean neuronal firingrates, we extracted the high-frequency activity (HFA) signal fromeach iEEG recording, as prior studies found this signal to be areliable measure of mean neuronal activity [66,74,99]. Wemeasured HFA power in our data by calculating power spectra post-(100 to 600 ms after stimulation offset, defined as the last pulse ofthe stimulation trial) and pre- (�600 to�100ms before stimulationonset) stimulation at 12 log-spaced frequencies between 30 and100 Hz using multitapers, which provide better resolution at highfrequencies [76]. Consistent with prior iEEG studies, we used log-spaced frequencies to better represent broadband electrophysio-logical properties [66,85,87,90]. We allowed a buffer of 100 ms
U.R. Mohan et al. / Brain Stimulation 13 (2020) 1183e11951186
before and after stimulation and limited the cycles used to calculateeach frequency for finer temporal resolution and prevent anyimpact of stimulation artifacts on our measurements of pre- orpost-stimulation power (see Fig. S4).
Linear mixed-effects model
We used a linear mixed-effects (LME) model to analyze the ef-fects of stimulation on neuronal activity and identify how theprevalence of these effects varywith parameters. An LMEmodel is atype of regression model that models the variation of a dependentvariable as a function of both fixed and random effects. An LMEmodel may be implemented in a group-based way that can accountfor repeated measurements from one sample [3]. This feature isimportant for our study because our dataset included possiblycorrelated measurements, as we tested the effects of different pa-rameters at the same stimulation site. Additionally, the LME modelis useful for this dataset because it can account for uneven samplingacross groups and conditions, which also occurred when separatesites were stimulated with different sets of frequencies andamplitudes.
To apply the LME model to our data, we used fixed factors forvariables of frequency (up to 5 possible values per site), amplitude(typically 3 per site), and binned distance between recordingelectrodes and the stimulation site. We also defined categoricalvariables of stimulation electrode type and stimulation in white orgray matter as fixed factors.
We defined the dependent variable as the prevalence of HFAchanges measured by the percent of recording electrodes showingsignificant increases or decreases in HFA power. The equationbelow describes this model in which the outcome variable y in-dicates the prevalence of HFA changes, X1 and X2 represent stim-ulation frequency and amplitude, b1 and b2 are the fitted regressioncoefficients, and ε is a vector of residuals.
y ¼ b0 þ b1 X1 þ b2 X2 þ ε
We then combined across subjects to provide summary co-efficients for each factor that indicate its mean effect across thepopulation [6]. We calculated “z”-values as the parameter esti-mates divided by their standard errors and p-values with respect to95% confidence intervals of standard normal distributions.Following LME syntax for our main frequency and amplitude re-sults, the model has the following form (Fig. 2) where the inter-action of fixed factors was computed separately: DHFA ~frequency þ amplitude þ (frequency þ amplitude | stimulationsite). The last term indicates that for each stimulation site, themodel fits correlated random intercepts and slopes for frequencyand amplitude factors. To compare the effects of stimulatingdifferent regions and tissue in Fig. 3, where there were no repeatedmeasures between categories, we used a two-way ANOVA.
Seizure-onset zones
Clinical teams at each hospital provided information aboutelectrodes identified in seizure onset zones (SOZ). To verify that ourresults were not directly related to abnormal brain tissue, we per-formed the population analyses of the effects of stimulation fre-quency and amplitude separately for the sets of stimulation sitesand corresponding recording electrodes that were located inhealthy tissue and SOZs (Fig. S7). All main frequency- andamplitude-related effects continued to be significant for the sepa-rated analyses, confirming our main results (Fig. S4C).
White matter categorization
We categorized each stimulation site as either being in or nearwhite matter or in gray matter to determine the impact of whitematter on the effects of stimulation. We estimated the amount ofwhite matter near each stimulation site by counting the number ofwhite matter vertices within a spherical volume around themidpoint of the stimulation anode and cathode. This volume has aradius of 4 mm, which also includes the anode and cathode. Weused Freesurfer whitematter segmentation of patients’ T1MRI scanto determine white-matter vertex locations [91]. We then catego-rized stimulation sites as near white matter or in gray matter bysplitting the number of white-matter vertices surrounding stimu-lation sites along the median of the distribution.
Data availability
Raw electrophysiogical data used in this study are available athttp://memory.psych.upenn.edu/ElectrophysiologicalData.
Results
The goal of our study was to characterize the effects of differenttypes of direct electrical brain stimulation on ongoing neuronalactivity in humans. Here, we recorded iEEG activity from wide-spread electrodes while delivering electrical stimulation atdifferent locations, frequencies, and amplitudes as patients restedquietly. To assess the effect of stimulation on neuronal activity, wemeasured the amplitude of signals in the high-frequency-activity(HFA) range (30e100 Hz), which correlates with mean level ofspiking activity of a local neuronal population [29,66,74,99].
Effects of stimulation at low and high frequencies
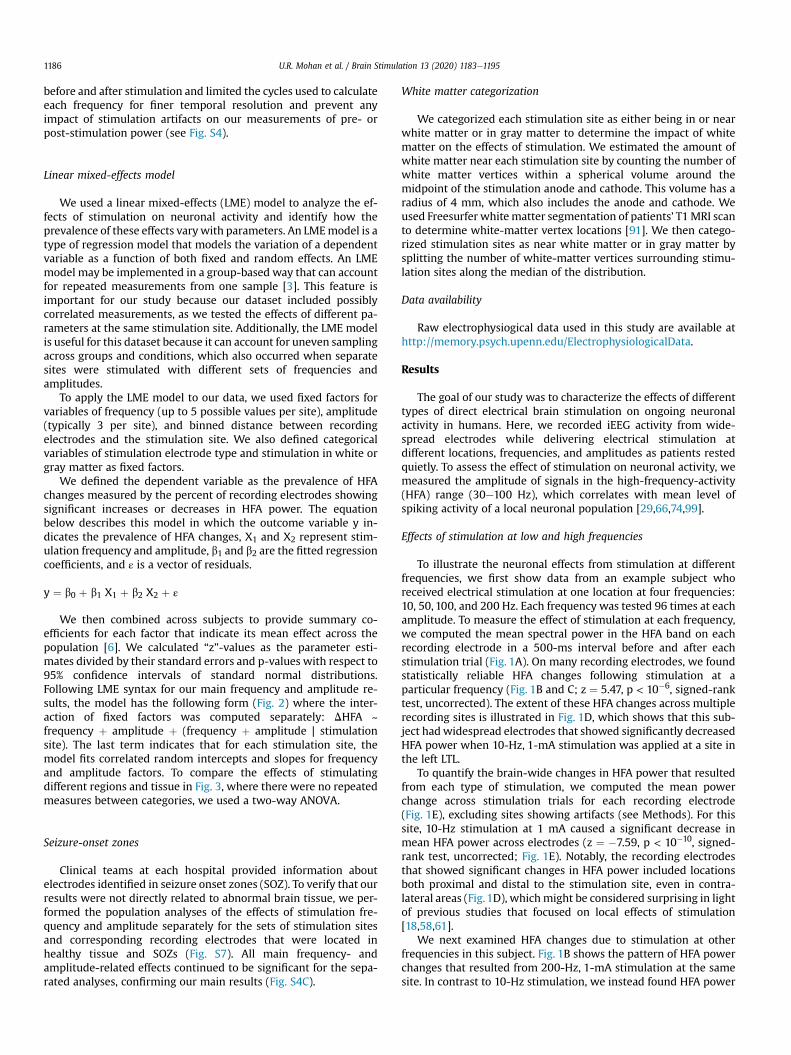
To illustrate the neuronal effects from stimulation at differentfrequencies, we first show data from an example subject whoreceived electrical stimulation at one location at four frequencies:10, 50, 100, and 200 Hz. Each frequency was tested 96 times at eachamplitude. To measure the effect of stimulation at each frequency,we computed the mean spectral power in the HFA band on eachrecording electrode in a 500-ms interval before and after eachstimulation trial (Fig. 1A). On many recording electrodes, we foundstatistically reliable HFA changes following stimulation at aparticular frequency (Fig. 1B and C; z ¼ 5.47, p < 10�6, signed-ranktest, uncorrected). The extent of these HFA changes across multiplerecording sites is illustrated in Fig. 1D, which shows that this sub-ject hadwidespread electrodes that showed significantly decreasedHFA power when 10-Hz, 1-mA stimulation was applied at a site inthe left LTL.
To quantify the brain-wide changes in HFA power that resultedfrom each type of stimulation, we computed the mean powerchange across stimulation trials for each recording electrode(Fig. 1E), excluding sites showing artifacts (see Methods). For thissite, 10-Hz stimulation at 1 mA caused a significant decrease inmean HFA power across electrodes (z ¼ �7.59, p < 10�10, signed-rank test, uncorrected; Fig. 1E). Notably, the recording electrodesthat showed significant changes in HFA power included locationsboth proximal and distal to the stimulation site, even in contra-lateral areas (Fig.1D), whichmight be considered surprising in lightof previous studies that focused on local effects of stimulation[18,58,61].
We next examined HFA changes due to stimulation at otherfrequencies in this subject. Fig. 1B shows the pattern of HFA powerchanges that resulted from 200-Hz, 1-mA stimulation at the samesite. In contrast to 10-Hz stimulation, we instead found HFA power
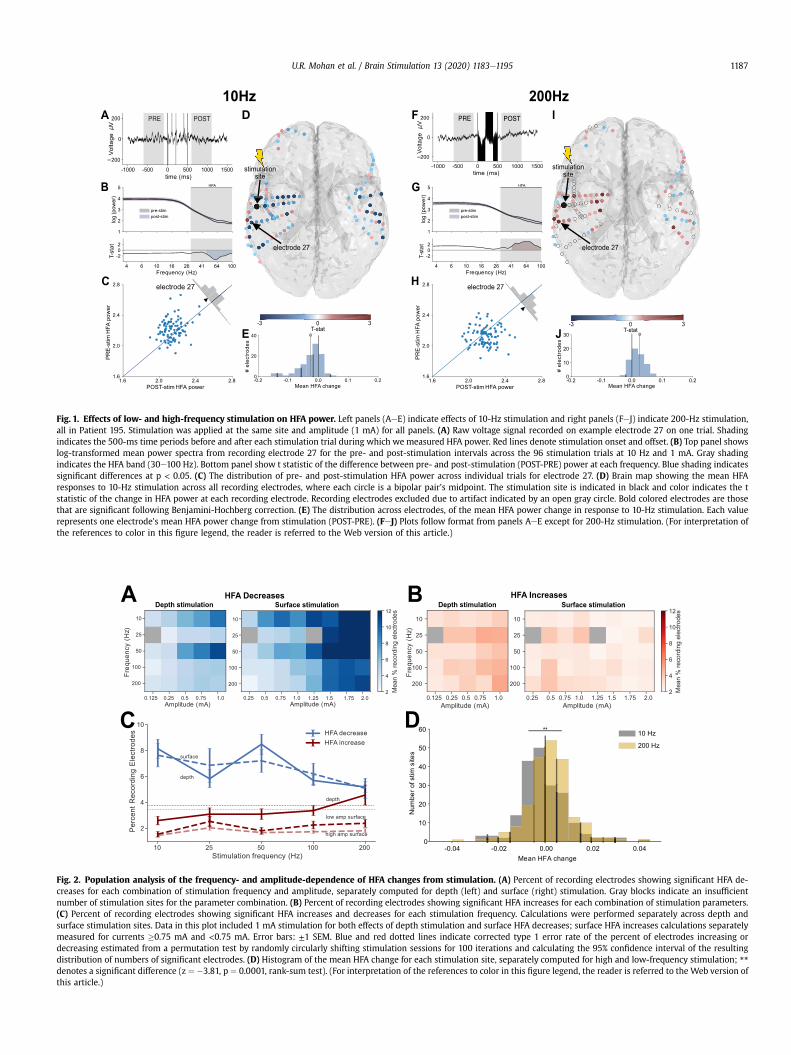
Fig. 1. Effects of low- and high-frequency stimulation on HFA power. Left panels (AeE) indicate effects of 10-Hz stimulation and right panels (FeJ) indicate 200-Hz stimulation,all in Patient 195. Stimulation was applied at the same site and amplitude (1 mA) for all panels. (A) Raw voltage signal recorded on example electrode 27 on one trial. Shadingindicates the 500-ms time periods before and after each stimulation trial during which we measured HFA power. Red lines denote stimulation onset and offset. (B) Top panel showslog-transformed mean power spectra from recording electrode 27 for the pre- and post-stimulation intervals across the 96 stimulation trials at 10 Hz and 1 mA. Gray shadingindicates the HFA band (30e100 Hz). Bottom panel show t statistic of the difference between pre- and post-stimulation (POST-PRE) power at each frequency. Blue shading indicatessignificant differences at p < 0.05. (C) The distribution of pre- and post-stimulation HFA power across individual trials for electrode 27. (D) Brain map showing the mean HFAresponses to 10-Hz stimulation across all recording electrodes, where each circle is a bipolar pair’s midpoint. The stimulation site is indicated in black and color indicates the tstatistic of the change in HFA power at each recording electrode. Recording electrodes excluded due to artifact indicated by an open gray circle. Bold colored electrodes are thosethat are significant following Benjamini-Hochberg correction. (E) The distribution across electrodes, of the mean HFA power change in response to 10-Hz stimulation. Each valuerepresents one electrode’s mean HFA power change from stimulation (POST-PRE). (FeJ) Plots follow format from panels AeE except for 200-Hz stimulation. (For interpretation ofthe references to color in this figure legend, the reader is referred to the Web version of this article.)
Fig. 2. Population analysis of the frequency- and amplitude-dependence of HFA changes from stimulation. (A) Percent of recording electrodes showing significant HFA de-creases for each combination of stimulation frequency and amplitude, separately computed for depth (left) and surface (right) stimulation. Gray blocks indicate an insufficientnumber of stimulation sites for the parameter combination. (B) Percent of recording electrodes showing significant HFA increases for each combination of stimulation parameters.(C) Percent of recording electrodes showing significant HFA increases and decreases for each stimulation frequency. Calculations were performed separately across depth andsurface stimulation sites. Data in this plot included 1 mA stimulation for both effects of depth stimulation and surface HFA decreases; surface HFA increases calculations separatelymeasured for currents �0.75 mA and <0.75 mA. Error bars: ±1 SEM. Blue and red dotted lines indicate corrected type 1 error rate of the percent of electrodes increasing ordecreasing estimated from a permutation test by randomly circularly shifting stimulation sessions for 100 iterations and calculating the 95% confidence interval of the resultingdistribution of numbers of significant electrodes. (D) Histogram of the mean HFA change for each stimulation site, separately computed for high and low-frequency stimulation; **denotes a significant difference (z ¼ �3.81, p ¼ 0.0001, rank-sum test). (For interpretation of the references to color in this figure legend, the reader is referred to the Web version ofthis article.)
U.R. Mohan et al. / Brain Stimulation 13 (2020) 1183e1195 1187
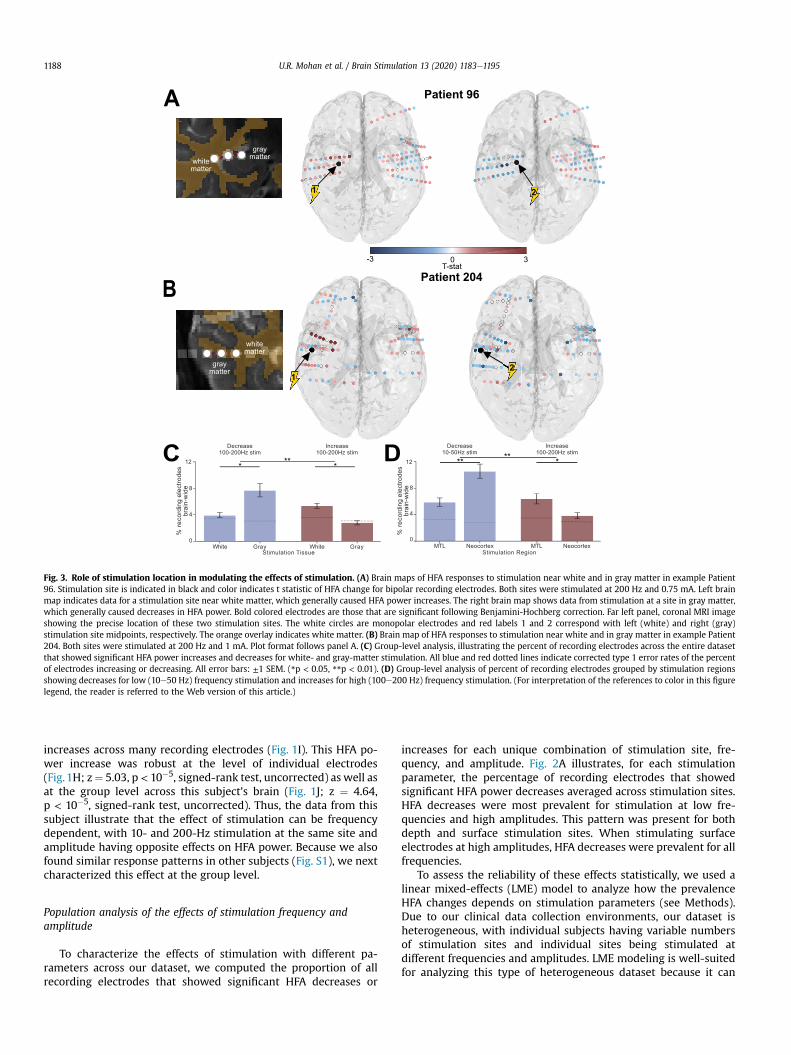
Fig. 3. Role of stimulation location in modulating the effects of stimulation. (A) Brain maps of HFA responses to stimulation near white and in gray matter in example Patient96. Stimulation site is indicated in black and color indicates t statistic of HFA change for bipolar recording electrodes. Both sites were stimulated at 200 Hz and 0.75 mA. Left brainmap indicates data for a stimulation site near white matter, which generally caused HFA power increases. The right brain map shows data from stimulation at a site in gray matter,which generally caused decreases in HFA power. Bold colored electrodes are those that are significant following Benjamini-Hochberg correction. Far left panel, coronal MRI imageshowing the precise location of these two stimulation sites. The white circles are monopolar electrodes and red labels 1 and 2 correspond with left (white) and right (gray)stimulation site midpoints, respectively. The orange overlay indicates white matter. (B) Brain map of HFA responses to stimulation near white and in gray matter in example Patient204. Both sites were stimulated at 200 Hz and 1 mA. Plot format follows panel A. (C) Group-level analysis, illustrating the percent of recording electrodes across the entire datasetthat showed significant HFA power increases and decreases for white- and gray-matter stimulation. All blue and red dotted lines indicate corrected type 1 error rates of the percentof electrodes increasing or decreasing. All error bars: ±1 SEM. (*p < 0.05, **p < 0.01). (D) Group-level analysis of percent of recording electrodes grouped by stimulation regionsshowing decreases for low (10e50 Hz) frequency stimulation and increases for high (100e200 Hz) frequency stimulation. (For interpretation of the references to color in this figurelegend, the reader is referred to the Web version of this article.)
U.R. Mohan et al. / Brain Stimulation 13 (2020) 1183e11951188
increases across many recording electrodes (Fig. 1I). This HFA po-wer increase was robust at the level of individual electrodes(Fig.1H; z¼ 5.03, p < 10�5, signed-rank test, uncorrected) as well asat the group level across this subject’s brain (Fig. 1J; z ¼ 4.64,p < 10�5, signed-rank test, uncorrected). Thus, the data from thissubject illustrate that the effect of stimulation can be frequencydependent, with 10- and 200-Hz stimulation at the same site andamplitude having opposite effects on HFA power. Because we alsofound similar response patterns in other subjects (Fig. S1), we nextcharacterized this effect at the group level.
Population analysis of the effects of stimulation frequency andamplitude
To characterize the effects of stimulation with different pa-rameters across our dataset, we computed the proportion of allrecording electrodes that showed significant HFA decreases or
increases for each unique combination of stimulation site, fre-quency, and amplitude. Fig. 2A illustrates, for each stimulationparameter, the percentage of recording electrodes that showedsignificant HFA power decreases averaged across stimulation sites.HFA decreases were most prevalent for stimulation at low fre-quencies and high amplitudes. This pattern was present for bothdepth and surface stimulation sites. When stimulating surfaceelectrodes at high amplitudes, HFA decreases were prevalent for allfrequencies.
To assess the reliability of these effects statistically, we used alinear mixed-effects (LME) model to analyze how the prevalenceHFA changes depends on stimulation parameters (see Methods).Due to our clinical data collection environments, our dataset isheterogeneous, with individual subjects having variable numbersof stimulation sites and individual sites being stimulated atdifferent frequencies and amplitudes. LME modeling is well-suitedfor analyzing this type of heterogeneous dataset because it can

U.R. Mohan et al. / Brain Stimulation 13 (2020) 1183e1195 1189
identify linear trends (including interactions) across multiple fac-tors and can accommodate both repeated and missing measure-ments [3]. We used the LME model to analyze the distributions ofHFA power changes across the dataset (Fig. 2A). The resultsconfirmed that the frequency and amplitude dependence of HFApower decreases mentioned above were statistically reliable forboth depth electrodes (magnitude of all z’s ¼ 3.38e5.09; allp’s < 10�3 for effects of frequency, amplitude, and their interaction)and surface electrodes (magnitude of z’s ¼ 2.34e2.5, all p’s < 0.05,see Table S4A).
We also used the LME model to examine the parameterdependence of stimulation-induced HFA power increases. Becausewe foundHFA changes to be diverse across recording electrodes, wemodeled HFA decreases and increases separately to capturesimultaneous positive and negative HFA changes on differentrecording electrodes that may otherwise be lost when averagingeffects. Fig. 2B shows the mean percentages of recording electrodesthat showed significant HFA power increases following stimulationat various parameters. Stimulation on depth electrodes at highfrequencies and high amplitudes was most closely linked to in-creases in HFA power. The LME model confirmed that this effectwas robust for depth electrodes, by showing significant effects ofstimulation frequency and amplitude on HFA power (bothp’s < 0.05, see Table S4A). This finding that higher stimulationcurrents are associated with broader HFA power increases isconsistent with the earlier findings that higher currents are asso-ciated with more widespread phosphenes in the visual cortex [104]and findings that the magnitude of cortical responses to stimula-tion depend on stimulation amplitude [15]. In contrast, for surfaceelectrodes, HFA increases were most prevalent for high-frequencystimulation at low amplitudes (Frequency � Amplitude interac-tion: z ¼ 2.01, p ¼ 0.04, see Table S4A).
Fig. 2C summarizes these results. Overall, HFA decreases weremore prevalent than increases, regardless of stimulation fre-quency and electrode type. Further, stimulation on depth elec-trodes at high and low frequencies, respectively, was associatedwith HFA increases and decreases (LME model for HFA changedirection and Frequency factors: magnitude of all z’s ¼ 3.77e4.06,all p’s < 10�3, see Table S4C). Notably, high-frequency surfacestimulation rarely caused HFA increases, whereas high-frequencydepth stimulation reliably caused HFA power increases (see aboveLME model results).
While these trends were robust statistically, we observed thatthe HFA power changes showed variability across individual stim-ulation sites (Fig. 2D). To measure this variability, we quantitativelycompared HFA response patterns across different stimulation sitesin the same subject. On average, only 16% of subjects showedsimilar (positively correlated) patterns of HFA power changes inresponse to stimulation at different sites (Fig. S3A), which supportsour approach of separately analyzing individual stimulation sites.Nonetheless, to confirm that our results were not affected bytreating stimulation sites independently, we also performed theabove analyses at the level of each subject, by averaging responsepatterns across the stimulation sites within each subject prior topopulation-level statistical analysis. This subject-level analysisconfirmed our primary results of frequency-dependent HFA powerchanges (Fig. S3B-E). More broadly, the variability between HFAchanges caused by different stimulation sites in a subject empha-sizes the importance of understanding the role of location inmodulating neuronal activity. Additionally, to confirm that HFAchanges for each trial do not depend on the effects from prior trials,we performed an analysis of the percent of recording electrodesshowing significant changes for each stimulation frequency as afunction of the frequency of the trials immediately preceding eachtrial. This confirmed that HFA power changes depend on the
current trial’s stimulation frequency and not on the prior trial’sfrequency for both HFA increases and decreases (Fig. S8, seeTable S4F).
Distance to white matter and region mediate the effects ofstimulation
Previous studies showed different neurobehavioral changesfrom applying stimulation in white versus gray matter [68,96].Modeling and animal studies demonstrated that bipolar stimula-tion creates an electrical potential field between and around theanode and cathode of the stimulation site that activates elementswithin a volume of tissue [12,36,65,71]. Based on these models, wehypothesized that stimulation applied in proximity towhite-mattertracts would have different neuronal effects compared to stimula-tion in gray matter.
To compare the physiology of white- versus gray-matter stim-ulation on a large scale, we investigated how the proximity ofstimulation sites to white matter correlates with the resultingchange in HFA power. We first classified each depth stimulation siteaccording to whether it was in white or gray matter, based on itsmean proximity to white matter tracts (see Methods), and sepa-rately compared the HFA changes for each group. The midpoint ofwhite-matter stimulation sites were on average 1.4 mm ± 0.8 mmaway from the closest white matter while gray-matter stimulationsites were on average 10.5 mm ± 22.6 mm away from the closestwhite matter. Fig. 3A and B show data from two patients who wereeach stimulated at two nearby sites, one near white matter (labeled#1) and near graymatter (#2). Both subjects showed HFA decreaseswhen stimulation was applied at the gray-matter site and,inversely, HFA increases for stimulation at the white-matter site.
We next performed a group-level analysis of the relation ofstimulated tissue on HFA changes. We focused this analysis onstimulation parameters in the range of 100e200 Hz and 0.5e1 mAon depth electrodes, which were chosen as the parameters mostlikely to cause HFA increases. We compared the prevalence of HFApower changes across sites in white (n ¼ 70) and gray matter(n ¼ 61). Stimulation at white-matter sites caused a greater rate ofHFA increases compared to sites in gray matter (Fig. 3C). Inversely,gray-matter stimulation caused more HFA power decreasescompared towhite-matter stimulation. Analyzing the prevalence ofeach type of HFA change with a two-way ANOVA, we confirmedthat there was a statistically significant interaction between stim-ulating near white- or gray-matter and the prevalence of HFA in-creases and decreases (Tissue � HFA change: F(1, 1) ¼ 6.55,p ¼ 0.01).
To compare the effects of stimulating different brain regions, wemeasured the percentages of recording electrodes that showed HFAdecreases and increases following stimulation. We focused onstimulation at 0.5e1mA on depth electrodes to compareMTL (MTL,hippocampus, and limbic areas) and neocortex (temporal, frontal,parietal, and occipital lobes) stimulation. Consistent with ourfindings in Fig. 2, the prevalence of HFA increases and decreasesdepended on frequency in all regions (LME Model: Frequency:magnitude of all z’s ¼ 2.2e3.94, all p’s < 0.05). We then specificallyanalyzed HFA decreases following 10e50 Hz stimulation and HFAincreases following 100e200 Hz stimulation because these stim-ulation frequencies are most likely to cause each effect. We found10e50 Hz stimulation in the neocortex caused a greater rate of HFAdecreases than it did in the MTL (Fig. 3D). Inversely, we found100e200 Hz stimulation in the MTL caused a greater rate of HFAincreases than it did in the neocortex. This regional difference in theeffect of stimulation on HFA power was statistically significant(Region � HFA change: F(1, 1) ¼ 18.42, p < 10�4).
U.R. Mohan et al. / Brain Stimulation 13 (2020) 1183e11951190
Spatial spread of neuronal activity changes from stimulation
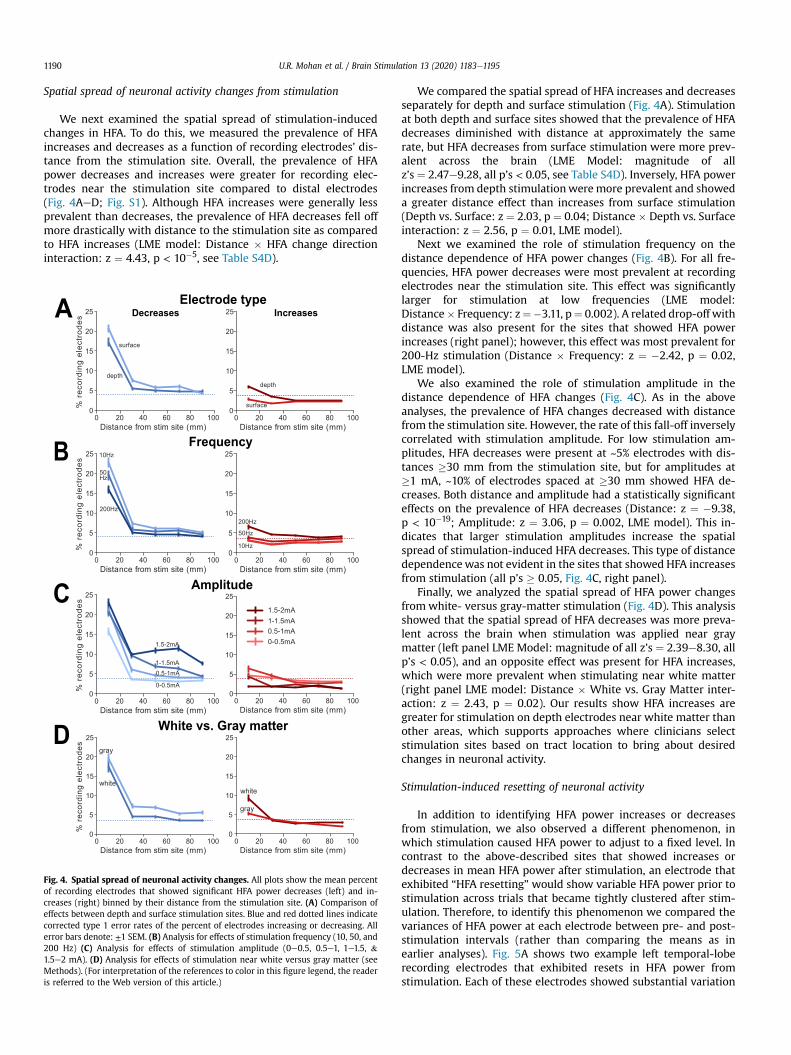
We next examined the spatial spread of stimulation-inducedchanges in HFA. To do this, we measured the prevalence of HFAincreases and decreases as a function of recording electrodes’ dis-tance from the stimulation site. Overall, the prevalence of HFApower decreases and increases were greater for recording elec-trodes near the stimulation site compared to distal electrodes(Fig. 4AeD; Fig. S1). Although HFA increases were generally lessprevalent than decreases, the prevalence of HFA decreases fell offmore drastically with distance to the stimulation site as comparedto HFA increases (LME model: Distance � HFA change directioninteraction: z ¼ 4.43, p < 10�5, see Table S4D).
Fig. 4. Spatial spread of neuronal activity changes. All plots show the mean percentof recording electrodes that showed significant HFA power decreases (left) and in-creases (right) binned by their distance from the stimulation site. (A) Comparison ofeffects between depth and surface stimulation sites. Blue and red dotted lines indicatecorrected type 1 error rates of the percent of electrodes increasing or decreasing. Allerror bars denote: ±1 SEM. (B) Analysis for effects of stimulation frequency (10, 50, and200 Hz) (C) Analysis for effects of stimulation amplitude (0e0.5, 0.5e1, 1e1.5, &1.5e2 mA). (D) Analysis for effects of stimulation near white versus gray matter (seeMethods). (For interpretation of the references to color in this figure legend, the readeris referred to the Web version of this article.)
We compared the spatial spread of HFA increases and decreasesseparately for depth and surface stimulation (Fig. 4A). Stimulationat both depth and surface sites showed that the prevalence of HFAdecreases diminished with distance at approximately the samerate, but HFA decreases from surface stimulation were more prev-alent across the brain (LME Model: magnitude of allz’s ¼ 2.47e9.28, all p’s < 0.05, see Table S4D). Inversely, HFA powerincreases from depth stimulationwere more prevalent and showeda greater distance effect than increases from surface stimulation(Depth vs. Surface: z ¼ 2.03, p ¼ 0.04; Distance � Depth vs. Surfaceinteraction: z ¼ 2.56, p ¼ 0.01, LME model).
Next we examined the role of stimulation frequency on thedistance dependence of HFA power changes (Fig. 4B). For all fre-quencies, HFA power decreases were most prevalent at recordingelectrodes near the stimulation site. This effect was significantlylarger for stimulation at low frequencies (LME model:Distance� Frequency: z¼�3.11, p¼ 0.002). A related drop-off withdistance was also present for the sites that showed HFA powerincreases (right panel); however, this effect was most prevalent for200-Hz stimulation (Distance � Frequency: z ¼ �2.42, p ¼ 0.02,LME model).
We also examined the role of stimulation amplitude in thedistance dependence of HFA changes (Fig. 4C). As in the aboveanalyses, the prevalence of HFA changes decreased with distancefrom the stimulation site. However, the rate of this fall-off inverselycorrelated with stimulation amplitude. For low stimulation am-plitudes, HFA decreases were present at ~5% electrodes with dis-tances �30 mm from the stimulation site, but for amplitudes at�1 mA, ~10% of electrodes spaced at �30 mm showed HFA de-creases. Both distance and amplitude had a statistically significanteffects on the prevalence of HFA decreases (Distance: z ¼ �9.38,p < 10�19; Amplitude: z ¼ 3.06, p ¼ 0.002, LME model). This in-dicates that larger stimulation amplitudes increase the spatialspread of stimulation-induced HFA decreases. This type of distancedependencewas not evident in the sites that showed HFA increasesfrom stimulation (all p’s � 0.05, Fig. 4C, right panel).
Finally, we analyzed the spatial spread of HFA power changesfrom white- versus gray-matter stimulation (Fig. 4D). This analysisshowed that the spatial spread of HFA decreases was more preva-lent across the brain when stimulation was applied near graymatter (left panel LME Model: magnitude of all z’s ¼ 2.39e8.30, allp’s < 0.05), and an opposite effect was present for HFA increases,which were more prevalent when stimulating near white matter(right panel LME model: Distance � White vs. Gray Matter inter-action: z ¼ 2.43, p ¼ 0.02). Our results show HFA increases aregreater for stimulation on depth electrodes near white matter thanother areas, which supports approaches where clinicians selectstimulation sites based on tract location to bring about desiredchanges in neuronal activity.
Stimulation-induced resetting of neuronal activity
In addition to identifying HFA power increases or decreasesfrom stimulation, we also observed a different phenomenon, inwhich stimulation caused HFA power to adjust to a fixed level. Incontrast to the above-described sites that showed increases ordecreases in mean HFA power after stimulation, an electrode thatexhibited “HFA resetting” would show variable HFA power prior tostimulation across trials that became tightly clustered after stim-ulation. Therefore, to identify this phenomenon we compared thevariances of HFA power at each electrode between pre- and post-stimulation intervals (rather than comparing the means as inearlier analyses). Fig. 5A shows two example left temporal-loberecording electrodes that exhibited resets in HFA power fromstimulation. Each of these electrodes showed substantial variation

Fig. 5. Stimulation induced HFA power resetting. (A) Brain map from Patient 200 illustrating the recording electrodes that showed significant power resetting (green) followingstimulation at the labeled site (black). (B) HFA power measured from two example recording electrodes in this patient before and after stimulation. Both sites show significantresetting, in which the variance of HFA power significantly decreases from pre-to post-stimulation without a significant change in the mean power (contact 1: p < 10�6; contact 2:p < 10�8, uncorrected F-test). (C) Group-level analysis showing the overall mean percent of recording electrodes that showed significant HFA resetting for each combination ofparameters. (D) Mean percent of recording electrodes that showed significant power resetting as a function of distance fromwhite- and gray-matter stimulation sites. Green dottedlines indicate corrected type 1 error rates of the percent of electrodes resetting. (For interpretation of the references to color in this figure legend, the reader is referred to the Webversion of this article.)
U.R. Mohan et al. / Brain Stimulation 13 (2020) 1183e1195 1191
in HFA power before stimulation, with this variation decreasingsignificantly afterward (both p’s < 10�6 , F-test, Fig. 5B). The data inthis figure illustrate two characteristics of resetting: First, that therecording electrodes that showHFA power resets are often spatiallyclustered. Second, that HFA resetting does not immediately sur-round the stimulation site, which could have been driven byartifact.
To statistically characterize HFA resetting, we identified therecording electrodes that showed a significant decrease in thevariance of HFA power from pre-to post-stimulation (F-test,p < 0.05) with no change in mean (t-test, p > 0.05). Analogous tothe above analyses, we computed the proportions of electrodes thatshowed significant resetting for each combination of stimulationfrequency and amplitude (Fig. 5C). This analysis suggested that HFAresetting from depth stimulation site is slightly dependent on theinteraction of frequency and amplitude (Frequency � Amplitudeinteraction: z ¼ �1.98, p < 0.05, see Table S4A). The LME model didnot show a significant dependence for the prevalence of HFAresetting according to the stimulation amplitude or frequencyalone (Depth and Surface: z’s ¼ 0.07e1.81, all p’s > 0.05).
We also examined the prevalence of HFA resetting as a functionof distance to depth stimulation sites. HFA resetting was greater atrecording electrodes near the stimulation site. For electrodes nearthe stimulation site, the prevalence of HFA resetting was signifi-cantly less than that of HFA decreases and greater than that of HFAincreases (Distance � Resetting vs. Increase vs. Decrease: z ¼ 2.4,p ¼ 0.007, LME model; Fig. 5D). Additionally, we found that theprevalence of HFA resetting was greater for stimulation in whiterather than gray matter (White vs. Gray Matter: z¼ 2.66, p¼ 0.008,see Table S4D). In light of its distinctive characteristics, these resultsindicate that stimulation-induced HFA resetting reflects a distinc-tive neuronal phenomenon compared to stimulation-induced HFApower increases and decreases. To assess whether stimulation inepileptic regions affects HFA resetting, we compared the rate of HFAresetting between stimulation in healthy and epileptic regions andfound no significant difference (z ¼ 0.86, p ¼ 0.39, rank-sum test).
Control analyses of stimulation artifact effects
While one cannot completely separate artifact from physiolog-ical signals in clinical iEEG recordings, we took a two-stageapproach to identify and mitigate their potential impact on ourresults. As described in the Methods, we ensured that electricalartifacts from the activation of the stimulator did not impact ourHFA power calculations by measuring HFA choosing temporallyprecise multitaper parameters to measure spectral power at aninterval that was separated in time from when the stimulator wasactive. As shown in Figure S4, this approach successfully identifiedreliable patterns of HFA power increases that had different time-courses compared to stimulation artifacts.
We also examined whether our results were affected by artifactsrelated to amplifier saturation. After stimulation concludes, manyrecording electrodes show transient low-frequency deflections,which could disrupt accurate power measurement. To minimizethe influence of voltage deflections on our results, as described inthe Methods, we removed both individual trials and recordingelectrodes that exhibited large post-stimulation voltage changes(Fig. S2). To further validate that our results were not correlatedwith this kind of artifact, we performed the above populationanalysis (Fig. 2A and B) using three different artifact-rejectionthresholds (Fig. S6). The relationship between HFA changes andstimulation parameters remained present for all thresholds(Table S4E), indicating that parameter-dependent HFA changes arenot a result of post-stimulation artifacts. We also measured theprevalence of artifacts for each combination of stimulation ampli-tude and frequency (Table. S3). Because artifact rates, did notsubstantially vary across stimulation parameters, it supports ourview that the frequency dependence of HFA changes we observedwas not a result of stimulation artifacts. We also have confidencethat our results reflect neural signals because our characterizationof HFA changes matches the frequency dependence seen in animals[61]. Additionally, the stimulation-induced HFA changes we foundinteract with neuroanatomydHFA increases were more prevalent

U.R. Mohan et al. / Brain Stimulation 13 (2020) 1183e11951192
when stimulating white rather than gray matterdwhich is apattern that is unlikely to appear as the result of electrical artifacts.
Discussion
Clinicians and researchers are increasingly interested in brainstimulation because it provides a way to directly modulate ongoingbrain activity which could be used in the treatment of neurologicaldisorders. However, for brain stimulation to be used optimally,stimulation should be targeted precisely according to the desiredoutcome. One goal of our project was to guide selection of stimu-lation parameters by characterizingdacross space, frequency, andamplitudedthe neuronal effects of direct cortical stimulation inhumans. Our work indicates that effects of stimulation significantlydiffer depending on the parameters used for stimulation despitesubstantial variations in the effects of stimulation across subjects.Together, our results indicate that we may achieve more effectiveoutcomes of stimulation by choosing parameters according to thedesired neuronal pattern.
A key result from our work is demonstrating that the neuronaleffects of direct brain stimulation in humans are frequencydependent. While the general effect of stimulation on HFA was adecrease in power, we demonstrated that high- and low-frequencystimulation inversely impact neuronal activity, preferentiallycausing HFA power increases and decreases, respectively (Fig. 2C).In this way, our work helps explain prior studies that demonstratedthat the frequency of stimulationwas an important factor in drivingspecific clinical outcomes from stimulation. For example, whenusing DBS for Parkinson’s disease, stimulation at frequencies over90 Hz alleviated tremor while frequencies below 60 Hz aggravatedtremor [27,52,98]. Further, the use of stimulation to treat epilepsydepends on frequency, such that stimulating at frequencies below2 Hz and above 70 Hz reduced epileptic activity, whereas inter-mediate frequencies had no effect [75,107]. Of particular relevanceto our work is the study by Logothetis et al. [61] who measured theresultant changes in neuronal activity in various brain regions ofmonkeys following microstimulation at a range of frequencies. Thisstudy found that low-frequency stimulation caused decreases inneuronal activity whereas high-frequency stimulation causedmixed increases and decreases in different downstream regions,which is consistent with our findings despite substantial method-ological differences. Whereas we applied stimulation at macro-electrodes in human epilepsy patients and measured HFA power,Logothetis et al. [61] used microstimulation in the visual cortex ofnormal monkeys and measured fMRI and single-neuron spiking.Although the majority of stimulation sites in our study were in thetemporal lobe, we found that frequency-dependent patterns wereconsistent across stimulation of different brain regions (SeeFig. 3D). Similarly, our amplitude-dependent HFA changes buildupon work from Crowther et al. [15], who measured gamma re-sponses to single pulse cortical stimulation in humans and foundthat the magnitude of positive responses depended on stimulationamplitude.
A question that arises from these results is why stimulation atlow frequencies suppresses and stimulation at high frequencies ismore likely to activate. Quantitative models suggest that high-frequency stimulation selectively activates fibers of passage andaxon terminals with low thresholds that would not normally beactivated by low-frequency stimulation [69]. This may occurbecause high-frequency stimulation delivers a higher rate of chargewith shorter time between pulses, which increases mean spikingrates because neurons have less time to hyperpolarize [8,41,70,84].Inversely, low-frequency stimulation has been shown to inducelong-lasting hyperpolarization, which reduces overall firing [97].
By incorporating neuroanatomy, models may also explain ourfinding of prevalent HFA decreases near the stimulation site, whileHFA increases were relatively more widespread (Fig. 4AeC). Thesespatial variations may be explained by the anatomical organizationof the stimulated neurons. When stimulation activates axons,which is more likely with high frequencies [69], models suggestthat excitatory effects can spread more broadly, following axonalprojections to other regions. Inversely, when stimulation impactscell bodies, the effects are likely to be inhibitory and spatiallylimited [35,69,70].
It is notable that we found variability in HFA power changes be-tween stimulation sites even within an individual. This result isconsistent with the idea that local and distal effects of stimulationdepend on the neuronal morphology surrounding the stimulationsite [10,56,83], specifically, the precise positioning of the implantedelectrode and its specific orientation relative to cortical layers or fi-bers of passage. At the broadest level, our findings support the ideathat the effective use of brain stimulation should consider neuronorganization, thresholds, and neurotransmitters of an area to betterpredict the downstream effects of stimulation [84]. This variationthat we found in the responses to stimulation at different sites mighthelp explain prior studies that showed diverse perceptual andbehavioral responses to stimulation between subjects and stimula-tion locations [10,83,88]. Additionally, glial responses to implantedelectrodes, structural abnormalities associated with patients’neurological conditions, and anti-seizure medications may alsocontribute to variability to between patients and stimulation sites[86]. Despite this variability, in 16% subjects, we found significantlycorrelated patterns of HFA power changes across different stimula-tion sites. This suggests that some individuals have distinctiveneuroanatomical patterns, perhaps involving connectivity or geneticdifferences [28], that cause them to show consistent HFA changeseven across widespread stimulation targets.
We found that inhibitory and excitatory effects were relativelymore likely from stimulation in gray and white matter, respectively.This result adds to a growing body of literature emphasizing thatbehavioral and electrophysiological outcomes depend on theproximity of stimulation to structural connections. In particular,studies showed that positive behavioral outcomes result fromstimulation in white rather than gray matter. In particular, studiesreported improvement of memory specificity and depressionsymptoms when applying stimulation specifically in white matter[30,68,95,96]. Similarly, one recent study showed that white-matter stimulation amplifies oscillatory theta coherence acrossmemory networks [91]. Additionally, studies in rodents showsimilar results, demonstrating that microstimulation in whitematter was more effective for exciting distal neuronal populations[78,79]. Our findings add to this body of work, by suggesting amechanism for white-matter stimulation to improve behavior, bypreferentially causing neuronal excitation. Recent modeling studiesdetermined patient-specific stimulation locations from predictionsof electrical-field generation based on patient tractography [65].Going forward, it may be beneficial for clinicians to integrateparameter selection procedures with patient-specific models toguide stimulation locations relative to structural connections.
Our findings also help extend closed-loop, or responsive, neu-rostimulation therapies currently used to treat intractable epilepsyand Parkinson’s Disease to the treatment of cognitive disorders[45,60,77,93]. Prior closed-loop stimulation studies aimed toimprovememory continuouslymonitored brain state and deliveredstimulation to increase or decrease a particular measure ofneuronal activitywhen it crossed a critical threshold [21,22,38]. Ourresults inform which stimulation parameters are most likely tochange a specific biomarker in a desired direction. Besides usingstimulation to excite and inhibit, we observed the novel
U.R. Mohan et al. / Brain Stimulation 13 (2020) 1183e1195 1193
phenomenon of stimulation-induced HFA resetting. In contrast tousing stimulation to shift neuronal activity in one direction, thestimulation-induced resetting indicates that targeted stimulationcan induce a specific state regardless of the level of neuronal ac-tivity prior to stimulation. By leveraging stimulation-inducedresetting, we hypothesize that targeted white-matter stimulationprotocols can transition brain activity into particular states [92],supplementing existing closed-loop methods that focus on shiftingongoing neuronal patterns in one direction.
Although we conducted our work with electrodes implanted insurgical patients, our results also have implications for non-invasive brain stimulation. Much like direct electrical stimulation,transcranial magnetic stimulation (TMS) and transcranial electricalstimulation (TES) have been shown to produce mixed excitatoryand inhibitory responses. The direction of the changes in neuronalactivity caused by TMS and TES have been shown to depend onparameters that were analogous to those we tested, such as thelocation, frequency, and amplitude of stimulation [2,5,24,32,33]. Infact, Sokhadze et al. [89] show the effects of TMS on gamma os-cillations depend on stimulation frequency such that 10e15 Hzstimulation often excites while 0.5e2 Hz frequencies inhibit. Thesefrequency-dependent responses suggest that TMS may produceanalogous excitatory and inhibitory responses to different stimu-lation frequency ranges when compared to our results. Further-more, non-invasive brain stimulation studies also found substantialinter-subject variability [62,103], which is also consistent with ourresults. Given these similarities, our results support the approach ofcustomizing non-invasive stimulation parameters for eachindividual.
A focus of many brain stimulation therapies is to recapitulate atarget neuronal pattern [21,43,44]. Because we show the stimulationparameters that cause different types electrophysiological signals,our work offers guidelines for clinicians to select stimulation fre-quencies and amplitudes that recreate particular target patterns. Inthis regard, the most important features of our results are (1) thathigh- and low-frequency stimulation are associated with HFA powerincreases and decreases, respectively, and (2) that high stimulationcurrents cause HFA power decreases across broader cortical regions.These patterns help explain key features of previous neuro-modulation work. For example, in one study we found that stimu-lation at a particular site caused a patient to spontaneously recall anold autobiographical memory, and, notably, this site showed HFAdecreases when the patient remembered thememory normally [39].Our findings help explain why this occurred, because they link the50-Hz stimulation that was used to HFA power decreases thatmatched the neuronal pattern associated with thatmemory. Further,our results help explain the recent finding that high-frequencystimulation in the LTL can help improve episodic memory encod-ing [21,47]. Normally, successful learning of episodic memories isassociated with elevated HFA power [11]. Therefore, our results helpexplain that high-frequency stimulation improved memory encod-ing because it recreated the elevated HFA power that was normallyassociated with successful encoding.
Conclusions
We systematically characterized brain-wide responses to stimu-lation on a large scale and found changes in neuronal activity dependon stimulation frequency, amplitude, region, and proximity to whitematter. Current standard functional stimulation mapping protocolsdo not select parameters based on specific responses in line with thedesired clinical outcome [10]. In many cases, the stimulation pa-rameters chosen for a given task are modeled after the ones used inother protocols or in other subjects [64]. Our findings do not elimi-nate the current clinical procedure of iteratively testing parameters
to select patient-specific optimal stimulation parameters. They do,however, contributed the first general guidelines from a large-scaledataset in humans for the types of electrophysiological effects thatmight be expected from stimulating at different parameters. Addi-tionally, this analysis framework provides a systematic method ofevaluating brain-wide neuronal responses to stimulation at differentparameters on an individual level as well as across subjects withvariable stimulation protocols. A future avenue building upon thiswork may combine our observations of electrophysiological effectsof stimulation with modeling and knowledge of behaviorally linkedneuronal patterns so that clinicians and researchers can design moretargeted therapeutic stimulation protocols to more effectively treatneurological and psychiatric disorders.
Funding
This work was supported by the DARPA Restoring ActiveMemory (RAM) program (Cooperative Agreement N66001-14-2-4032). The views, opinions and/or findings expressed are those ofthe author and should not be interpreted as representing the offi-cial views or policies of the Department of Defense or the U.S.Government. The work also received support from National In-stitutes of Health Grant R21-MH117682. K.Z. was supported by theIntramural Research Program of the National Institute of Neuro-logical Disorders and Stroke.
Author contributions statement
U.M. and J.J. designed and implemented the data analyses andwrote the manuscript. A.W. and J.M advised analysis framework.M.K., and D.R. designed the stimulation-mapping protocol, B.L.,M.R.S., G.W., R.E.G, K.Z., B.J., K.D., S.S. recruited subjects, collecteddata, and performed clinical duties associated with data collectionincluding neurosurgical procedures or patient monitoring. J.S., R.G.,and S.D. performed anatomical localization of electrodes. All au-thors participated in editing.
Declaration of competing interest
M.K. and D.R. have started a company, Nia Therapeutics, Inc.,intended to develop and commercialize brain stimulation therapiesfor memory restoration. Each of them holds >5% equity interest inNia. R.E.G. serves as a consultant to Medtronic, which was a sub-contractor on the RAM project. The terms of this arrangement havebeen reviewed and approved by Emory University in accordancewith its conflict of interest policies. B.J. receives research fundingfrom NeuroPace and Medtronic not relating to this research. G.W.has rights to receive future royalties from the licensing of brainstimulation technology. Mayo Clinic has a financial interest relatedto brain stimulation technology, and is co-owner of CadenceNeuroscience Inc, the development of which has been assisted byG.W. The remaining authors declare no competing interests.
Acknowledgements
We are indebted to all patients who volunteered their time toparticipate in our study. We thank Shachar Maidenbaum and Sal-man Qasim for providing helpful feedback on the manuscript. Wethank Blackrock Microsystems for providing neural recording andstimulation equipment.
Appendix A. Supplementary data
Supplementary data to this article can be found online athttps://doi.org/10.1016/j.brs.2020.05.009.
U.R. Mohan et al. / Brain Stimulation 13 (2020) 1183e11951194
References
[1] Anderson ME, Postupna N, Ruffo M. Effects of high-frequency stimulation inthe internal globus pallidus on the activity of thalamic neurons in the awakemonkey. J Neurophysiol 2003;89(2):1150e60.
[2] Antal A, Paulus W. Transcranial alternating current stimulation (tacs). FrontHum Neurosci 2013;7:317.
[3] Baayen RH, Davidson DJ, Bates DM. Mixed-effects modeling with crossedrandom effects for subjects and items. J Mem Lang 2008;59(4):390e412.
[4] Bakay RA. Deep brain stimulation for schizophrenia. Stereotact Funct Neu-rosurg 2009;87(4). 266e266.
[5] Barker AT, Shields K. Transcranial magnetic stimulation: basic principles andclinical applications in migraine. Headache J Head Face Pain 2017;57(3):517e24.
[6] Bates D, M€achler M, Bolker B, Walker S. Fitting linear mixed-effects modelsusing lme4. 2014. arXiv preprint arXiv:1406.5823.
[7] Benabid A, Pollack P, Loveau A, Henry S, de Rougemont J. Combined (thala-mototmy and stimulation) stereotactic surgery of the vm thalamic nucleusfor bilateral Parkinson disease. Stereotact Funct Neurosurg 1987;50(1e6).
[8] Benazzouz A, Hallett M. Mechanism of action of deep brain stimulation.Neurology 2000;55(12 Suppl 6):S13e6.
[9] Boraud T, Bezard E, Bioulac B, Gross C. High frequency stimulation of theinternal globus pallidus (gpi) simultaneously improves parkinsonian symp-toms and reduces the firing frequency of gpi neurons in the mptp-treatedmonkey. Neurosci Lett 1996;215(1):17e20.
[10] Borchers S, Himmelback M, Logothetis NK, Karanath H. Direct electricalstimula- tion of the human cortex - the gold standard for mapping brainfunctions? Nat Rev Neurosci 2012;13(1):63e70.
[11] Burke JF, Zaghloul KA, Jacobs J, Williams RB, Sperling MR, Sharan AD,Kahana MJ. Synchronous and asynchronous theta and gamma activity duringepisodic memory formation. J Neurosci 2013;33(1):292e304.
[12] Butson CR, Cooper SE, Henderson JM, McIntyre CC. Patient-specific analysisof the volume of tissue activated during deep brain stimulation. Neuroimage2007;34(2):661e70.
[13] Coleshill SG, Binnie CD, Morris RG, Alarcon G, van Emde Boas W, Velis DN,Sim- mons A, Polkey CE, van Veelen CWM, van Rijen PC. Material-specificrecognition memory deficits elicited by unilateral hippocampal electricalstimulation. J Neurosci 2004;24(7):1612e6.
[14] Coubes P, Roubertie A, Vayssiere N, Hemm S, Echenne B. Treatment of dyt1-generalised dystonia by stimulation of the internal globus pallidus. Lancet2000;355(9222):2220e1.
[15] Crowther LJ, Brunner P, Kapeller C, Guger C, Kamada K, Bunch ME,Frawley BK, Lynch TM, Ritaccio AL, Schalk G. A quantitative method forevaluating cortical responses to electrical stimulation. J Neurosci Methods2019;311:67e75.
[16] Delorme A, Makeig S, Sejnowski T. Automatic artifact rejection for EEG datausing high- order statistics and independent component analysis. In: Pro-ceedings of the third international ICA conference, san Diego; December2001.
[17] Desikan R, Segonne B, Fischl B, Quinn B, Dickerson B, Blacker D, Buckner RL,Dale A, Maguire A, Hyman B, Albert M, Killiany N. An automated labelingsystem for subdividing the human cerebral cortex on MRI scans into gyralbased regions of interest. Neuroimage 2006;31(3):968e80.
[18] Dostrovsky J, Levy R, Wu J, Hutchison W, Tasker R, Lozano A. Micro-stimulation- induced inhibition of neuronal firing in human globus pallidus.J Neurophysiol 2000;84(1):570.
[19] Eichenbaum H. A cortical-hippocampal system for declarative memory. NatRev Neurosci Oct 2000;1(1):41e50.
[20] Ezzyat Y, Rizzuto DS. Direct brain stimulation during episodic memory. CurrOpin Biomed Eng 2018;8:78e83.
[21] Ezzyat Y, Kragel JE, Burke JF, Levy DF, Lyalenko A, Wanda P, O’Sullivan L,Hurley K, Busygin S, Pedisich I, Sperling MR, Worrell GA, Kucewicz MT,Davis KA, Lucas TH, Inman CS, Lega BC, Jobst BC, Sheth S, Zaghloul K,Jutras M, Stein JM, Das S, Gorniak R, Rizzuto DS, Kahana MJ. Direct brainstimulation modulates encoding states and memory performance inhumans. Curr Biol 2017;27(9):1251e8.
[22] Ezzyat Y, Wanda P, Levy DF, Kadel A, Aka A, Pedisich I, Sperling MR,Sharan AD, Lega BC, Burks A, Gross R, Inman CS, Jobst BC, Gorenstein M,Davis KA, A WG, Kucewicz MT, Stein JM, Gorniak RJ, Das SR, Rizzuto DS,Kahana MJ. Closed-loop stimulation of temporal cortex rescues functionalnetworks and improves memory. Nat Commun 2018;9(1):365. https://doi.org/10.1038/s41467-017-02753-0.
[23] Fell J, Staresina BP, Do Lam AT, Widman G, Helmstaedter C, Elger CE, Ax-macher N. Memory modulation by weak synchronous deep brain stimula-tion: a pilot study. Brain Stimul 2013;6(3):270e3.
[24] Fertonani A, Miniussi C. Transcranial electrical stimulation: what we knowand do not know about mechanisms. Neuroscientist 2017;23(2):109e23.
[25] Fisher R, Salanova V, Witt T, Worth R, Henry T, Gross R, Oommen K, Osorio I,Nazzaro J, Labar D, et al. Electrical stimulation of the anterior nucleus ofthalamus for treatment of refractory epilepsy. Epilepsia 2010;51(5):899e908.
[26] Fisher RS, Velasco AL. Electrical brain stimulation for epilepsy. Nat RevNeurol 2014;10(5):261.
[27] Fogelson N, Kühn AA, Silberstein P, Limousin PD, Hariz M, Trottenberg T,Kupsch A, Brown P. Frequency dependent effects of subthalamic nucleusstimulation in Parkinson’s disease. Neurosci Lett 2005;382(1e2):5e9.
[28] Fox MD, Snyder AZ, Vincent JL, Corbetta M, Van Essen DC, Raichle ME. Thehuman brain is intrinsically organized into dynamic, anticorrelated func-tional networks. Proc Natl Acad Sci Unit States Am 2005;102(27):9673e8.
[29] Fries P, Nikoli�c D, Singer W. The gamma cycle. Trends Neurosci 2007;30(7):309e16.
[30] Gutman DA, Holtzheimer PE, Behrens TE, Johansen-Berg H, Mayberg HS.A tractography analysis of two deep brain stimulation white matter targetsfor depression. Biol Psychiatr 2009;65(4):276e82.
[31] Halgren E, Wilson CL, Stapleton JM. Human medial temporal-lobe stimula-tion disrupts both formation and retrieval of recent memories. Brain CognitJuly 1985;4(3):287e95.
[32] Hallett M. Transcranial magnetic stimulation and the human brain. Nature2000;406(6792):147.
[33] Hallett M. Transcranial magnetic stimulation: a primer. Neuron 2007;55(2):187e99.
[34] Hashimoto T, Elder CM, Okun MS, Patrick SK, Vitek JL. Stimulation of thesubthalamic nucleus changes the firing pattern of pallidal neurons.J Neurosci 2003;23(5):1916e23.
[35] Herrington TM, Cheng JJ, Eskandar EN. Mechanisms of deep brain stimula-tion. J Neurophysiol 2015;115(1):19e38.
[36] Histed M, Bonin V, Reid C. Direct activation of sparse, distributed populationsof cortical neurons by electrical microstimulation. Neuron 2009;63:508e22.
[37] Histed MH, Ni AM, Maunsell JH. Insights into cortical mechanisms ofbehavior from microstimulation experiments. Progr Neurobiol 2013;103:115e30.
[38] Iturrate I, Pereira M, Mill�an JdR. Closed-loop electrical neurostimulation:challenges and opportunities. Curr Opin Biomed Eng 2018;8:28e37.
[39] Jacobs J, Lega B, Anderson C. Explaining how brain stimulation can evokememories. J Cognit Neurosci 2012;24(3):553e63.
[40] Jacobs J, Miller J, Lee SA, Coffey T, Watrous AJ, Sperling MR, Sharan A,Worrell G, Berry B, Lega B, Jobst B, Davis K, Gross RE, Sheth SA, Ezzyat Y,Das SR, Stein J, Gorniak R, Kahana MJ, Rizzuto DS. Direct electrical stimula-tion of the human entorhinal region and hippocampus impairs memory.Neuron December 2016;92(5):1e8.
[41] Jensen M, De Meyts P. Molecular mechanisms of differential intracellularsignaling from the insulin receptor. Vitam Horm 2009;80:51e75.
[42] Johnson MD, Miocinovic S, McIntyre CC, Vitek JL. Mechanisms and targets ofdeep brain stimulation in movement disorders. Neurotherapeutics2008;5(2):294e308.
[43] Jun S, Lee SA, Kim JS, Jeong W, Chung CK. Task-dependent effects of intra-cranial hippocampal stimulation on human memory and hippocampal thetapower. Brain Stimul 2020;13(3):603e13.
[44] Kim K, Ekstrom AD, Tandon N. A network approach for modulating memoryprocesses via direct and indirect brain stimulation: toward a causal approachfor the neural basis of memory. Neurobiol Learn Mem 2016;134(Pt A):162e77.
[45] Kokkinos V, Sisterson ND, Wozny TA, Richardson RM. Association of closed-loop brain stimulation neurophysiological features with seizure controlamong patients with focal epilepsy. JAMA Neurol 2019;76(7):800e8.
[46] Koller W, Pahwa R, Busenbark K, Hubble J, Wilkinson S, Lang A, Tuite P,Sime E, Lazano A, Hauser R, Malapira T, Smith D, Tarsy D, Miyawaki E,Norregaard T, Ko- rmos T, Olanow CW. High-frequency unilateral thalamicstimulation in the treatment of essential and parkinsonian tremor. AnnNeurol 1997;42(3):292e9.
[47] Kucewicz MT, Berry BM, Kremen V, Brinkmann BH, Sperling MR, Sharan A,Jobst BC, Gross RE, Lega B, Sheth S, Stein JM, Das SR, Stead SM, Rizzuto DS,Kahana MJ, Worrell GA. Dissecting gamma frequency activity during humanmemory processing. Brain 2017;140(5):1337e50.
[48] Kuhn J, Lenartz D, Huff W, Lee S, Koulousakis A, Klosterkoetter J, Sturm V.Remis- sion of alcohol dependency following deep brain stimulation of thenucleus accumbens: valuable therapeutic implications? J Neurol NeurosurgPsychiatr 2007;78(10):1152e3.
[49] Kuhn J, Bodatsch M, Sturm V, Lenartz D, Klosterkotter J, Uhlhaas P, Winter C,Gründler T. Deep brain stimulation in schizophrenia. Fortschr Neurol Psy-chiatr 2011;79(11):632e41.
[50] Kuhn J, Hardenacke K, Lenartz D, Gruendler T, Ullsperger M, Bartsch C, Mai J,Zilles K, Bauer A, Matusch A, et al. Deep brain stimulation of the nucleusbasalis of meynert in alzheimer?s dementia. Mol Psychiatr 2015;20(3):353.
[51] Kumar R, Dagher A, Hutchison W, Lang A, Lozano A. Globus pallidus deepbrain stimulation for generalized dystonia: clinical and pet investigation.Neurology 1999;53(4). https://doi.org/10.1212/WNL.53.4.871. 871e871.
[52] Kuncel AM, Cooper SE, Wolgamuth BR, Clyde MA, Snyder SA,Montgomery Jr EB, Rezai AR, Grill WM. Clinical response to varying thestimulus parameters in deep brain stimulation for essential tremor. MovDisord 2006;21(11):1920e8. official journal of the Movement DisorderSociety.
[53] Lacruz ME, Valentín A, Seoane JJG, Morris RG, Selway RP, Alarcon G. Singlepulse electrical stimulation of the hippocampus is sufficient to impair humanepisodic memory. Neuroscience Oct. 2010;170(2):623e32.
[54] Lang AE, Lozano AM. Parkinson’s disease. N Engl J Med 1998;339(15):1044e53.

U.R. Mohan et al. / Brain Stimulation 13 (2020) 1183e1195 1195
[55] Lang AE, Lozano AM. Parkinson’s disease. N Engl J Med 1998;339(16):1130e43.
[56] Lesser RP, Lee HW, Webber W, Prince B, Crone NE, Miglioretti DL. Short-termvariations in response distribution to cortical stimulation. Brain2008;131(6):1528e39.
[57] Levy D, Shabat-Simon M, Shalev U, Barnea-Ygael N, Cooper A, Zangen A.Repeated electrical stimulation of reward-related brain regions affectscocaine but not natural reinforcement. J Neurosci 2007;27(51):14179e89.
[58] Limousin P, Pollack P, Benazzouz A, Hoffman D, Broussolle E, Perret E,Benabid A. Bilateraly subthalamic nucleus stimulation for sever Parkinson’sdisease. Mov Disord 1995;10:672e4.
[59] Lipsman N, Lam E, Volpini M, Sutandar K, Twose R, Giacobbe P, Sodums DJ,Smith GS, Woodside DB, Lozano AM. Deep brain stimulation of the sub-callosal cingulate for treatment-refractory anorexia nervosa: 1 year follow-up of an open-label trial. Lancet Psychiatr 2017;4(4):285e94.
[60] Little S, Pogosyan A, Neal S, Zavala B, Zrinzo L, Hariz M, Foltynie T,Limousin P, Ashkan K, FitzGerald J, et al. Adaptive deep brain stimulation inadvanced Parkinson disease. Ann Neurol 2013;74(3):449e57.
[61] Logothetis N, Augath M, Murayama Y, Rauch A, Sultan F, Goense J,Oeltermann A, Merkle H. The effects of electrical microstimulation oncortical signal propagation. Nat Neurosci 2010;13(10):1283e91. ISSN 1097-6256.
[62] Lopez-Alonso V, Cheeran B, Río-Rodríguez D, Fern�andez-del-Olmo M. Inter-individual variability in response to non-invasive brain stimulation para-digms. Brain Stimul 2014;7(3):372e80.
[63] Lozano AM, Fosdick L, Chakravarty MM, Leoutsakos J-M, Munro C, Oh E,Drake KE, Lyman CH, Rosenberg PB, Anderson WS, et al. A phase ii study offornix deep brain stimulation in mild alzheimer?s disease. J Alzheim Dis2016;54(2):777e87.
[64] Lozano AM, Lipsman N, Bergman H, Brown P, Chabardes S, Chang JW,Matthews K, McIntyre CC, Schlaepfer TE, Schulder M, et al. Deep brainstimulation: current challenges and future directions. Nat Rev Neurol 2019:1.
[65] Lujan JL, Chaturvedi A, Choi KS, Holtzheimer PE, Gross RE, Mayberg HS,McIntyre CC. Tractography-activation models applied to subcallosal cingu-late deep brain stimulation. Brain Stimul 2013;6(5):737e9.
[66] Manning JR, Jacobs J, Fried I, Kahana MJ. Broadband shifts in local field po-tential power spectra are correlated with single-neuron spiking in humans.J Neurosci 2009;29(43):13613e20.
[67] Maurice N, Thierry A-M, Glowinski J, Deniau J-M. Spontaneous and evokedactivity of substantia nigra pars reticulata neurons during high-frequencystimulation of the subthalamic nucleus. J Neurosci 2003;23(30):9929e36.
[68] Mayberg H, Lozano A, Voon V, McNeely H, Seminowicz D, Hamani C,Schwalb J, Kennedy S. Deep brain stimulation surgery for treatment resistantdepression. Neuron 2005;45:651e60.
[69] McIntyre CC, Grill WM. Extracellular stimulation of central neurons: influ-ence of stimulus waveform and frequency on neuronal output.J Neurophysiol 2002;88(4):1592e604.
[70] McIntyre CC, Grill WM, Sherman DL, Thakor NV. Cellular effects of deep brainstimulation: model-based analysis of activation and inhibition.J Neurophysiol 2004;91(4):1457e69.
[71] McIntyre CC, Savasta M, Kerkerian-Le Goff L, Vitek JL. Uncovering themechanism(s) of action of deep brain stimulation: activation, inhibition, orboth. Clin Neurophysiol 2004;115(6):1239e48.
[72] Mihailovic L, Delgado JM. Electrical stimulation of monkey brain with variousfrequencies and pulse durations. J Neurophysiol 1956;19(1):21e36.
[73] Miller JP, Sweet JA, Bailey CM, Munyon CN, Luders HO, Fastenau PS. Visual-spatial memory may be enhanced with theta burst deep brain stimulation ofthe fornix: a preliminary investigation with four cases. Brain 2015;138(7):1833e42.
[74] Miller KJ, Sorensen LB, Ojemann JG, den Nijs M, Sporns O. Power-law scalingin the brain surface electric potential. PLoS Comput Biol 2009;5(12).
[75] Mina F, Benquet P, Pasnicu A, Biraben A, Wendling F. Modulation of epilepticactivity by deep brain stimulation: a model-based study of frequency-dependent effects. Front Comput Neurosci 2013;7:94.
[76] Mitra PP, Pesaran B. Analysis of dynamic brain imaging data. Biophys J1999;76:691e708.
[77] Morrell MJ. Responsive cortical stimulation for the treatment of medicallyintractable partial epilepsy. Neurology 2011;77(13):1295e304.
[78] Nowak L, Bullier J. Axons, but not cell bodies, are activated by electricalstimulation in cortical gray matter i. evidence from chronaxie measure-ments. Exp Brain Res 1998;118(4):477e88.
[79] Nowak L, Bullier J. Axons, but not cell bodies, are activated by electricalstimulation in cortical gray matter ii. evidence from selective inactivation ofcell bodies and axon initial segments. Exp Brain Res 1998;118(4):489e500.
[80] Nuttin BJ, Gabrïels LA, Cosyns PR, Meyerson BA, Andr�eewitch S, Sunaert SG,Maes AF, Dupont PJ, Gybels JM, Gielen F, et al. Long-term electrical capsularstimulation in patients with obsessive-compulsive disorder. Neurosurgery2003;52(6):1263e74.
[81] Ojemann G, Ojemann J, L E, Berger M. Cortical language localization in left,dominant hemisphere: an electrical stimulation mapping investigation in117 patients. J Neurosurg 1989;71:316e26.
[82] Penfield W, Perot P. The brain’s record of auditory and visual experience.Brain 1963;86(4):595e696.
[83] Pouratian N, Cannestra AF, Bookheimer SY, Martin NA, Toga AW. Variabilityof intraoperative electrocortical stimulation mapping parameters across andwithin individuals. J Neurosurg 2004;101(3):458e66.
[84] Ranck Jr JB. Which elements are excited in electrical stimulation ofmammalian central nervous system: a review. Brain Res 1975;98(3):417e40.
[85] Salahuddin S, Porter E, Meaney PM, Halloran MO. Effect of logarithmic andlinear frequency scales on parametric modelling of tissue dielectric data.Biomed Phys Eng Expr 2017;3(1):015020.
[86] Salatino JW, Ludwig KA, Kozai TD, Purcell EK. Glial responses to implantedelectrodes in the brain. Nat Biomed Eng 2017;1(11):862e77.
[87] Sederberg PB, Schulze-Bonhage A, Madsen JR, Bromfield EB, McCarthy DC,Brandt A, Tully MS, Kahana MJ. Hippocampal and neocortical gamma oscil-lations predict memory formation in humans. Cerebr Cortex 2007;17(5):1190e6.
[88] Selimbeyoglu A, Parvizi J. Electrical stimulation of the human brain:perceptual and behavioral phenomena reported in the old and new litera-ture. Front Hum Neurosci 2010;4(46).
[89] Sokhadze EM, El-Baz A, Baruth J, Mathai G, Sears L, Casanova MF. Effects oflow frequency repetitive transcranial magnetic stimulation (rtms) on gammafrequency oscillations and event-related potentials during processing ofillusory figures in autism. J Autism Dev Disord 2009;39(4):619e34.
[90] Solomon E, Kragel J, Sperling M, Sharan A, Worrell G, Kucewicz M, Inman C,Lega B, Davis K, Stein J, Jobst B, Zaghloul K, Sheth S, Rizzuto D, Kahana M.Widespread theta synchrony and high-frequency desynchronization un-derlies enhanced cognition. Nat Commun 2017;8(1):1704.
[91] Solomon EA, Kragel JE, Gross RE, Lega B, Sperling MR, Worrell G, Sheth SA,Zaghloul KA, Jobst BC, Stein JM, Das S, Gorniak R, Inman CS, Seger S,Rizzuto DS, Kahana MJ. Medial temporal lobe functional connectivity pre-dicts stimulation-induced theta power. Nat Commun 2018;9(1):4437.
[92] Stiso J, Khambhati AN, Menara T, Kahn AE, Stein JM, Das SR, Gorniak R,Tracy J, Litt B, Davis KA, et al. White matter network architecture guidesdirect electrical stimulation through optimal state transitions. 2018. arXivpreprint arXiv:1805.01260.
[93] Sun FT, Morrell MJ. Closed-loop neurostimulation: the clinical experience.Neurotherapeutics 2014;11(3):553e63.
[94] Suthana N, Fried I. Deep brain stimulation for enhancement of learning andmemory. Neuroimage 2014;85:996e1002.
[95] Suthana N, Haneef Z, Stern J, Mukamel R, Behnke E, Knowlton B, Fried I.Memory enhancement and deep-brain stimulation of the entorhinal area.N Engl J Med 2012;366:502e10.
[96] Titiz AS, Hill MR, Mankin EA, Aghajan ZM, Eliashiv D, Tchemodanov N,Maoz U, Stern J, Tran ME, Schuette P, et al. Theta-burst microstimulation inthe human entorhinal area improves memory specificity. eLife 2017;6.
[97] Toprani S, Durand DM. Long-lasting hyperpolarization underlies seizurereduction by low frequency deep brain electrical stimulation. J Physiol2013;591(22):5765e90.
[98] Ushe M, Mink JW, Revilla FJ, Wernle A, Schneider Gibson P, McGee-Minnich L, Hong M, Rich KM, Lyons KE, Pahwa R, et al. Effect of stimulationfrequency on tremor suppression in essential tremor. Mov Disord2004;19(10):1163e8. official journal of the Movement Disorder Society.
[99] Watson BO, Ding M, Buzs�aki G. Temporal coupling of field potentials andaction potentials in the neocortex. Eur J Neurosci 2018;48(7):2482e97.
[100] Weiskrantz L, Mihailovi�c L, Gross CG. Stimulation of frontal cortex anddelayed alter- nation performance in the monkey. Science 1960;131(3411):1443e4.
[101] Weiskrantz L, Mihailovic L, Gross C. Effects of stimulation of frontal cortexand hip- pocampus on behaviour in the monkey. Brain 1962;85(3):487e504.
[102] Welter M-L, Houeto J-L, Bonnet A-M, Bejjani P-B, Mesnage V, Dormont D,Navarro S, Cornu P, Agid Y, Pidoux B. Effects of high-frequency stimulationon subthalamic neuronal activity in parkinsonian patients. Arch Neurol2004;61(1):89e96.
[103] Wiethoff S, Hamada M, Rothwell JC. Variability in response to transcranialdirect current stimulation of the motor cortex. Brain Stimul 2014;7(3):468e75.
[104] Winawer J, Parvizi J. Linking electrical stimulation of human primary visualcortex, size of affected cortical area, neuronal responses, and subjectiveexperience. Neuron 2016;92(6):1213e9.
[105] Windels F, Bruet N, Poupard A, Urbain N, Chouvet G, Feuerstein C, Savasta M.Effects of high frequency stimulation of subthalamic nucleus on extracellularglutamate and gaba in substantia nigra and globus pallidus in the normal rat.Eur J Neurosci 2000;12(11):4141e6.
[106] Yianni J, Bain P, Giladi N, Auca M, Gregory R, Joint C, Nandi D, Stein J, Scott R,Aziz T. Globus pallidus internus deep brain stimulation for dystonic condi-tions: a prospective audit. Mov Disord 2003;18(4):436e42. official journal ofthe Movement Disorder Society.
[107] Yu T, Wang X, Li Y, Zhang G, Worrell G, Chauvel P, Ni D, Qiao L, Liu C, Li L,et al. High-frequency stimulation of anterior nucleus of thalamus desynch-ronizes epileptic network in humans. Brain 2018;141(9):2631e43.
[108] Yushkevich PA, Pluta JB, Wang H, Xie L, Ding S-L, Gertje EC, Mancuso L,Kliot D, Das SR, Wolk DA. Automated volumetry and regional thicknessanalysis of hippocampal subfields and medial temporal cortical structures inmild cognitive impairment. Hum Brain Mapp 2015;36(1):258e87.