Embed Size (px)
Citation preview
Report
on
THE EFFECTS OF CORROSION ON TRACER WIRE WITH A COPPER-CLAD STEEL CENTER CONDUCTOR
Submitted to
Copperhead Industries, LLC Monticello, MN 55362
by
Dustin Fox and
Chris Belado Fushi Copperweld, Inc.
254 Cotton Mill Rd. Fayetteville, TN 37334
And
Sean Brossia, Ph.D. Formerly:
Environmental Performance of Materials Southwest Research Institute
6220 Culebra Rd San Antonio, TX 78238
Present:
Director of Research CC Technologies 5777 Frantz Road Dublin, OH 43017
September 23, 2009 The report examines the corrosion effects of various soils and soil conditions on tracer wire, which utilizes copper-clad steel wire as a center conductor.
1
TABLE OF CONTENTS
ABSTRACT ....................................................................................................................................... 3 I. INTRODUCTION ......................................................................................................................... 4 II. CORROSION STUDY SET-UP ................................................................................................. 5
MATERIALS ................................................................................................................................................. 5 SOIL PREPARATION AND SET-UP .......................................................................................................... 5 WIRE SAMPLING ........................................................................................................................................ 6 SAMPLE PLACEMENT AND TOTE-SET-UP ............................................................................................ 7
III. SOIL DATA ................................................................................................................................ 8 SAMPLING ................................................................................................................................................... 8 ANALYSIS .................................................................................................................................................... 9
IV. WIRE SAMPLE ANYLSIS ..................................................................................................... 10 REMOVAL .................................................................................................................................................. 10 PREPARATION AND TESTING ............................................................................................................... 10 TEST RESULTS .......................................................................................................................................... 10
VISUAL EXAMINATION ...................................................................................................................... 11 BREAKING LOAD ................................................................................................................................. 12 DC RESISTANCE ................................................................................................................................... 14
V. SUMMARY ................................................................................................................................ 16 TRACER WIRE ........................................................................................................................................... 16 UNINSULATED CCS ................................................................................................................................. 16
VI. CONCLUSIONS ....................................................................................................................... 19
2

ABSTRACT The introduction of a new type of tracer wire into the utility market, over 5 year ago, had also introduced new questions concerning corrosion. This advanced wire used a high strength composite conductor to address industry problems, particularly strength issues, associated with common tracer wire or locating wire, which at that time was almost exclusively using an insulated solid copper conductor. The strength of copper was not ideal for the severe applications tracer wire experiences. To address these problems, without compromising the signal carrying ability or adding cost, a new generation of tracer wire using a CCS (copper-clad steel) conductor was developed. But, utilizing a product with a steel core for an underground application has prompted questions regarding corrosion. This report presents a 5-year study and is intended to give an analysis of the corrosion characteristics of the tracer wire containing CCS for that period of time and a provide an estimation to the product’s long-term performance. The copper-clad steel conductor used in this tracer wire was produced at Fushi Copperweld, Inc. in Fayetteville, Tennessee. Due to the proprietary process used to produce the conductor, this study and report are only applicable to tracer wire that utilizes the Trademarked Copperweld® Conductor.
3

Report on
THE EFFECTS OF CORROSION ON TRACER WIRE WITH A COPPER-CLAD STEEL CENTER CONDUCTOR
I. INTRODUCTION A new generation of tracer wire was introduced in the early 2000’s, which utilized a high strength composite conductor to address industry problems associated with the current products. Common tracer wire, buried alongside plastic pipes for locating purposes, was utilizing an insulated solid copper conductor, to transmit an RF signal that is detected with locating equipment. Industry problems, such as wire breakages during directional drilling when crews pull multiple wires in hopes that one survives or wires being easily cut by errant shovels, have shown that improvements were needed to enhance the effectiveness of tracer wires. The strength of copper was simply insufficient when used in severe applications and in some cases was and still is employed using insulating materials that are not rated for underground usage. To address these problems, without compromising the signal carrying ability or adding cost, a new generation of tracer wire using a CCS (copper-clad steel) conductor insulated with underground rated HDPE (high density polyethylene) was developed. This CCS conductor is a composite in which a concentric copper cladding is metallurgically bonded to a steel core and thus provides the signal transmission of copper and the strength of steel. Tracer wire made with CCS provides superior breaking load, impact resistance, and fatigue strength when compared to copper and at the same time, maintains formability characteristics comparable to copper. CCS wire is an established product in telecommunication and grounding applications due to its unique characteristics. The benefits of being a low cost, high-strength replacement for solid copper are now being utilized in tracer wire. CCS was first manufactured by Copperweld in Rankin, PA, in 1915. Through the years, it has been used in various markets. Telecommunications, CATV, telephone, and utility grounding applications are a few of the industrial applications. Commercially this product is used in various goods such as antenna wire, chain link fencing, trolley cable, catanery wire, ground rods and mats, vacuum cleaner hoses, electronic pins and connectors, guy strand, detonation wire (TNT), and it is even used in revetment mats to stop erosion on riverbanks. Due to the use of the CCS in the new generation tracer wire product and having an underground application, concerns of possible galvanic corrosion due to its steel core were raised as a potential life-limiting failure mode. Various independent tests have been done and are in the process for studying the corrosion performance of this product. One test conducted by a gas company, which intentionally nicked the CCS to expose bare steel and placed the wire into a salt bath for over four months, yielded positive results for corrosion resistance. Another gas company buried the material on the West Coast for over one year and monitored the material closely also with positive results. As previously stated, bare un-insulated CCS wire is sold globally in applications such as pole ground, ground rods, substation grounding, and messenger cable and is continually tested in service in a wide variety of environments. Although the long history of this product in severe climates has been commercially verified, an updated in-depth study was initiated to explore the corrosion performance of CCS, specifically for the tracer wire application. The study was performed at Fushi Copperweld, Incorporated’s operation in Fayetteville, Tennessee and was developed in association with Southwest Research Institute in San Antonio, Texas and reviewed by CC Technologies in Dublin, OH. The 5-year study consisted of various soil conditions and samples. At predetermined time periods, samples were removed and thoroughly examined to analyze the rates and effects of corrosion on the samples. The tests included both destructive and non-destructive examinations and utilized microscopic and macroscopic analysis. The conclusions drawn are based on the findings and expert interpretations of the results.
4
II. CORROSION STUDY SET-UP
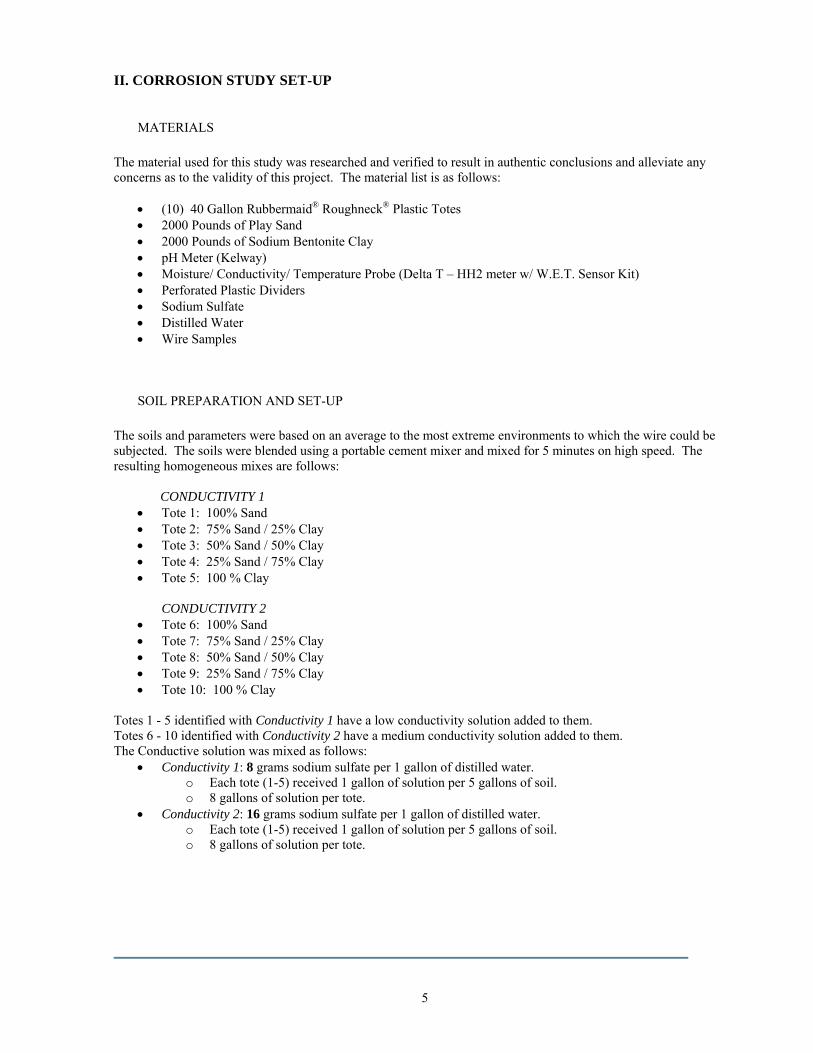
MATERIALS The material used for this study was researched and verified to result in authentic conclusions and alleviate any concerns as to the validity of this project. The material list is as follows:
• (10) 40 Gallon Rubbermaid® Roughneck® Plastic Totes • 2000 Pounds of Play Sand • 2000 Pounds of Sodium Bentonite Clay • pH Meter (Kelway) • Moisture/ Conductivity/ Temperature Probe (Delta T – HH2 meter w/ W.E.T. Sensor Kit) • Perforated Plastic Dividers • Sodium Sulfate • Distilled Water • Wire Samples
SOIL PREPARATION AND SET-UP The soils and parameters were based on an average to the most extreme environments to which the wire could be subjected. The soils were blended using a portable cement mixer and mixed for 5 minutes on high speed. The resulting homogeneous mixes are follows: CONDUCTIVITY 1
• Tote 1: 100% Sand • Tote 2: 75% Sand / 25% Clay • Tote 3: 50% Sand / 50% Clay • Tote 4: 25% Sand / 75% Clay • Tote 5: 100 % Clay
CONDUCTIVITY 2 • Tote 6: 100% Sand • Tote 7: 75% Sand / 25% Clay • Tote 8: 50% Sand / 50% Clay • Tote 9: 25% Sand / 75% Clay • Tote 10: 100 % Clay
Totes 1 - 5 identified with Conductivity 1 have a low conductivity solution added to them. Totes 6 - 10 identified with Conductivity 2 have a medium conductivity solution added to them. The Conductive solution was mixed as follows:
• Conductivity 1: 8 grams sodium sulfate per 1 gallon of distilled water. o Each tote (1-5) received 1 gallon of solution per 5 gallons of soil. o 8 gallons of solution per tote.
• Conductivity 2: 16 grams sodium sulfate per 1 gallon of distilled water. o Each tote (1-5) received 1 gallon of solution per 5 gallons of soil. o 8 gallons of solution per tote.
5

WIRE SAMPLING This study was developed to test the corrosion resistance of CCS (copper-clad steel) wire. This is the center conductor used in the new generation of tracer wire. The samples used were cut from standard stock finished products. These samples included Reinforced Tracer Wire from Copperhead Industries LLC, which contains a CCS center conductor; and bare (uninsulated) CCS wire from Fushi Copperweld, Inc. The CCS in both sets of samples was a 12 gage (0.0808”) extra high strength 21 % conductivity wire. The samples were cut into 48-inch length segments and prepared as follows:
• (50) Tracer Wire Samples (CCS) - Standard • (50) Tracer Wire Samples (CCS) - Impacted • (50) Bare CCS Wire Samples - Standard • (50) Bare CCS Wire Samples - Nicked • (10) Tracer Wire Samples (CCS) - Ends Stripped and Nicked • (10) Tracer Wire Samples (Solid Copper) - Ends Stripped and Nicked
The Impacted samples were prepared using an impact tester designed and fabricated at Copperweld. One impact was made at approximately 5 inches from the end and the other at 30 inches. The tester was developed to simulate a shovel strike and modeled from the Gardner Impact Tester (ASTM D5420). The force is measured by dropping a pointed anvil of the same dimensions as a shovel edge with a known weight and distance onto the sample to be impacted. The impact force used for this study was 37.77 in-lbs. This is the same impact force that completely severs common tracer wire with a solid copper conductor. (See Figures 1a – 1e)
The Nicked samples were prepared using a precision drill jig that was designed and fabricated at Copperweld. One nick was made at approximately 5 inches from the end and the other at 30 inches. The jig was designed to ensure that all the nicked wire samples would have a comparable severity of damage. The dimensions of the nick were determined based on removing a considerable amount of the copper cladding and even some steel to ensure exposure of the steel core. The wire was placed in the jig and a drill was used to nick the wire. The resulting nick removed approximately 20% of the overall mass of the wire at that cross section. (See Figures 2a & 2b) Figures 1a; 1b; 1c; 1d; 1e: Impacted Tracer Wire containing CCS Conductor
Figure 1a: Side View Figure 1b: Top View Figure 1c: Bottom View
Figure 1d: Side View Figure 1e: Top View with insulation removed with insulation removed Figures 2a; 2b: Nicked Uninsulated Copper-Clad Steel Wire
Figure 2a: Side View Figure 2b: Top View
6

SAMPLE PLACEMENT AND TOTE-SET-UP Each tote was filled with the soil described in the SOIL PREPARATION AND SET-UP section. The totes were set-up as follows: Each tote had four perforated plastic dividers longitudely inserted and evenly spaced. (See Figures 3a & 3b) Each of the resultant five sections represented a batch of samples to be pulled per the predetermined time intervals (3 months, 6 months, 1 year, 2 years, and 5 years). Each section was filled with a 1-inch layer of the respective soil for the tote. The samples were then placed on top of this thin soil layer and evenly spaced and not allowed to touch. The samples were labeled on one end and this end stuck up out of the top of the soil. The other cut end was buried. Four samples were buried in each section except the last section (5 years), which contained six samples. The totes were then filled to the top with the remaining soil (eight 40 lbs bags per tote). This resulted in the samples being buried at a depth of 1-½ feet. After all samples were placed and all totes filled with soil, the conductive solution was added per the SOIL PREPARATION AND SET-UP section. Upon adding this solution, the study was begun. The start date was April 22, 2004.
Figure 3a: Totes 1-10 Figure 3b: Tote with Dividers
7

III. SOIL DATA
SAMPLING During exposure testing, the soil pH, moisture, conductivity, and temperature were periodically monitored. The equipment being used to measure the aforementioned variables includes a Kelway soil pH meter, and a Delta T – HH2 meter w/ W.E.T. Sensor Kit. These reading are being taken approximately on a monthly basis. During the first 3 months no adjustments were made to the soil conditions. During the subsequent months, small amounts of water were added to maintain a moisture level of approximately 8% by volume or higher. The measurements were recorded and downloaded into a database. The statistical summary of the soil data over the 5 year period is as follows:
Minimum Maximum Average Std. Dev.
pH 100% Sand - Conductivity 1 5.2 6.6 6.09 0.53 75% Sand / 25% Clay - Conductivity 1 4.8 6.8 5.78 0.68 50% Sand / 50% Clay - Conductivity 1 5 7 6.00 0.73 25% Sand / 75% Clay - Conductivity 1 4 7 5.74 1.05 100% Clay - Conductivity 1 4.8 6.8 5.70 0.77 100% Sand - Conductivity 2 4.4 6.2 5.38 0.59 75% Sand / 25% Clay - Conductivity 2 3.2 6.4 5.50 0.90 50% Sand / 50% Clay - Conductivity 2 4.5 6.8 5.78 0.72 25% Sand / 75% Clay - Conductivity 2 4.4 6.8 5.56 0.85 100% Clay - Conductivity 2 3.8 6.6 5.65 0.78
VWC -%Vol. 100% Sand - Conductivity 1 2.4 20.6 9.72 5.55 75% Sand / 25% Clay - Conductivity 1 9 50.2 22.39 13.96 50% Sand / 50% Clay - Conductivity 1 6.4 46.2 21.61 13.11 25% Sand / 75% Clay - Conductivity 1 8.3 52.6 20.78 14.53 100% Clay - Conductivity 1 12.7 43.6 23.30 12.52 100% Sand - Conductivity 2 2.5 14.9 9.90 4.19 75% Sand / 25% Clay - Conductivity 2 5.9 42.1 20.57 14.40 50% Sand / 50% Clay - Conductivity 2 9.7 41.1 24.42 10.15 25% Sand / 75% Clay - Conductivity 2 8.4 41.3 20.58 9.84 100% Clay - Conductivity 2 12.2 43.4 27.54 11.70
Conductivity - mS.cm-1 100% Sand - Conductivity 1 0.5 0.93 0.77 0.24 75% Sand / 25% Clay - Conductivity 1 0.47 7.56 2.68 2.37 50% Sand / 50% Clay - Conductivity 1 0.69 5.62 2.98 2.03 25% Sand / 75% Clay - Conductivity 1 0.61 5.31 3.10 1.82 100% Clay - Conductivity 1 0.59 7.7 2.62 2.75 100% Sand - Conductivity 2 0 0 #DIV/0! #DIV/0! 75% Sand / 25% Clay - Conductivity 2 0.59 8.13 3.26 2.41 50% Sand / 50% Clay - Conductivity 2 0.45 8.14 3.84 2.58 25% Sand / 75% Clay - Conductivity 2 1.25 4.6 2.75 1.23 100% Clay - Conductivity 2 0.58 8.56 3.34 2.92
Temperature - oC 100% Sand - Conductivity 1 20.8 26.7 23.93 1.87 75% Sand / 25% Clay - Conductivity 1 20.9 26.1 23.13 1.70 50% Sand / 50% Clay - Conductivity 1 17.7 25.8 22.68 2.64 25% Sand / 75% Clay - Conductivity 1 17.6 26.5 22.88 2.85 100% Clay - Conductivity 1 17.4 26.3 22.76 2.93 100% Sand - Conductivity 2 17.4 26.4 22.52 3.04 75% Sand / 25% Clay - Conductivity 2 17.6 26.2 22.46 2.61 50% Sand / 50% Clay - Conductivity 2 17.7 26.5 23.02 2.71 25% Sand / 75% Clay - Conductivity 2 17.3 26.4 22.86 2.89 100% Clay - Conductivity 2 17.9 26.2 22.84 2.78
8
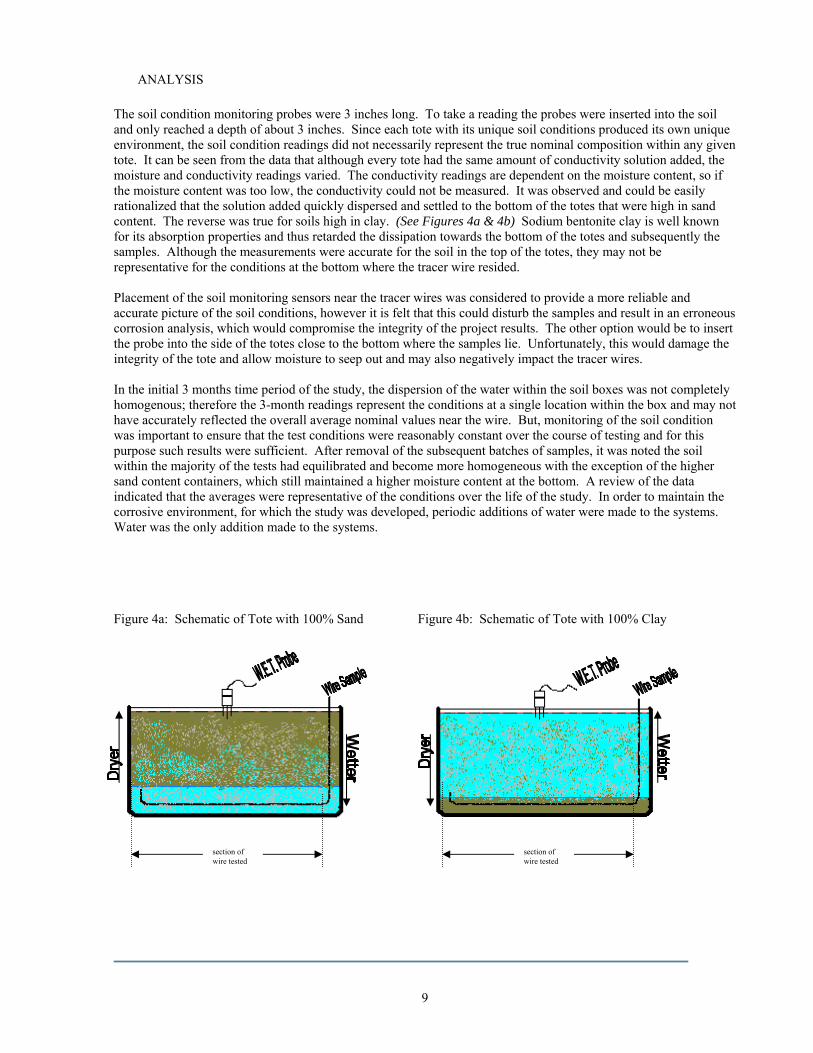
ANALYSIS The soil condition monitoring probes were 3 inches long. To take a reading the probes were inserted into the soil and only reached a depth of about 3 inches. Since each tote with its unique soil conditions produced its own unique environment, the soil condition readings did not necessarily represent the true nominal composition within any given tote. It can be seen from the data that although every tote had the same amount of conductivity solution added, the moisture and conductivity readings varied. The conductivity readings are dependent on the moisture content, so if the moisture content was too low, the conductivity could not be measured. It was observed and could be easily rationalized that the solution added quickly dispersed and settled to the bottom of the totes that were high in sand content. The reverse was true for soils high in clay. (See Figures 4a & 4b) Sodium bentonite clay is well known for its absorption properties and thus retarded the dissipation towards the bottom of the totes and subsequently the samples. Although the measurements were accurate for the soil in the top of the totes, they may not be representative for the conditions at the bottom where the tracer wire resided. Placement of the soil monitoring sensors near the tracer wires was considered to provide a more reliable and accurate picture of the soil conditions, however it is felt that this could disturb the samples and result in an erroneous corrosion analysis, which would compromise the integrity of the project results. The other option would be to insert the probe into the side of the totes close to the bottom where the samples lie. Unfortunately, this would damage the integrity of the tote and allow moisture to seep out and may also negatively impact the tracer wires. In the initial 3 months time period of the study, the dispersion of the water within the soil boxes was not completely homogenous; therefore the 3-month readings represent the conditions at a single location within the box and may not have accurately reflected the overall average nominal values near the wire. But, monitoring of the soil condition was important to ensure that the test conditions were reasonably constant over the course of testing and for this purpose such results were sufficient. After removal of the subsequent batches of samples, it was noted the soil within the majority of the tests had equilibrated and become more homogeneous with the exception of the higher sand content containers, which still maintained a higher moisture content at the bottom. A review of the data indicated that the averages were representative of the conditions over the life of the study. In order to maintain the corrosive environment, for which the study was developed, periodic additions of water were made to the systems. Water was the only addition made to the systems. Figure 4a: Schematic of Tote with 100% Sand Figure 4b: Schematic of Tote with 100% Clay
section of wire tested
section of wire tested
9

IV. WIRE SAMPLE ANYLSIS
REMOVAL The first 3-months wire samples were extracted on July 24, 2004, the 6-month samples on October 22, 2004; the 1-year samples on April 29, 2005; and the 2-year samples on April 28, 2006. The final set of samples was removed after 5-years of burial on April 27, 2009. The sections containing the samples were dug out by hand and slight force was used to pull them out of the soil boxes. During the first three extractions, extra care had to be taken in an effort not to disturb the samples predetermined for the subsequent extraction periods. The samples removed from the soil boxes with higher clay content were the most difficult to remove, due to the clay’s water absorption and clumping characteristics. Instances of wire breaks during extraction were experienced, but unavoidable. In these cases, the steel core had deteriorated at the “machined nick”, as expected and the strength of the copper cladding was exceeded when force was applied to remove the sample. The broken samples were marked accordingly. Verification, of the break occurring during extraction, was done by microscopic examination. The examination verified that the traverse section of the copper break was shiny and unoxidized, which indicated that the break had just occurred. These observations were considered in the evaluation of the samples’ performance. These evaluations lead to some subjective interpolations, which were necessary to provide an accurate assessment for the study.
PREPARATION AND TESTING Upon removal of the samples, each was given a unique identification. The samples were cut into two pieces. One was cut to a length of 30 inches and the other to a length of 2 to10 inches and was representative of the cut end buried in the soil. The samples were subjected to a visual macroscopic and microscopic examinations, resistance tests, and tensile tests. Careful handling of the samples was critical, due to the un-insulated samples with steel core exposed, in which the some of the steel cores had deteriorated over 90% in the affected area, creating a weak point in the wire. Several samples, in which the steel had deteriorated at the nicked area, broke in testing due to the copper cladding exceeding its yield point. These samples held together during the resistance testing, but broke before completion of the tensile testing, which was due to the handling conditions involved in the tensile machine loading process. Therefore, tensile results were not obtained on those samples or the ones that broke during extraction. As previously stated and based on the physical evidence, every sample remained intact as a single, un-broken, wire during the period it remained in the soil.
TEST RESULTS To give the results a baseline comparison, a control sample of the standard finished product not exposed to the corrosive environments was subjected to the same preparation in the WIRE SAMPLING section and then evaluated for resistance and tensile measurements. A visual microscopic and macroscopic evaluation was also conducted. Representative images of the samples are included in the summary.
10

VISUAL EXAMINATION All references to percentages in Table 1 were approximations and not actual measurements. The same individual performed the visual examinations over the 5-year study to remove as much human error as possible. Each “extraction” period had the same set of samples evaluated. The 5-year set of samples had an additional set of samples, which had a nicked tracer wire, which exposed the steel core within the CCS conductor. The following table provides an overview of the visual observations. These observation statements are recorded as an average of all the samples of the time period referenced.
Table #1: Visual Evaluation over Time for all Samples 3-month 6-month 1-year 2-year 5-year
Tracer Wire (CCS) - Standard
No oxidation or corrosion, except on
cut ends buried in soil.
No oxidation or corrosion, except on
cut end buried in soil.
No oxidation or corrosion except on
cut end buried in soil.
No oxidation or corrosion except on
cut end buried in soil.
No oxidation or corrosion except on
cut end buried in soil.
Tracer Wire (CCS) - Indented
Oxidation of Cu on impacted area and on average 1/16
inch on each side of impact under jacket. Copper cladding not
breached. Slight Corrosion on cut end
buried in soil
Oxidation of Cu on impacted area and
on average1/4 in. on each side under jacket. Copper
cladding not breached. Slight
Corrosion on cut end buried in soil
Oxidation of Cu on impacted area and on average 1/2 in. on each side under
jacket. Copper cladding not
breached. Slight Corrosion on cut end
buried in soil
Oxidation of Cu on impacted area and on average 3/4 in. on each side under
jacket. Copper cladding not
breached. Slight Corrosion on cut end
buried in soil
Oxidation of Cu on impacted area and on average 3/4 in. on each side under
jacket. Copper cladding not
breached. Slight Corrosion on cut end
buried in soil *one sample showed
signs of steel exposure and
corrosion at indent point
Tracer Wire (CCS) - Nicked / Exposed Steel
N/A
N/A N/A N/A
Oxidation of Cu on average 3/4 in. on
each side of nicked area under jacket.
10% deterioration of exposed steel at
nick; 0% corrosion of copper at nick; some corrosion on cut end
buried in soil.
Bare (un-insulated) CCS - Standard
25% oxidation coverage on copper; some corrosion on cut end buried in
soil.
90% oxidation coverage on copper; some corrosion on cut end buried in
soil.
95% oxidation coverage on copper; some corrosion on cut end buried in
soil.
100% oxidation coverage on copper; some corrosion on cut end buried in
soil.
100% oxidation coverage on copper; some corrosion on cut end buried in
soil.
Bare (un-insulated) CCS - Nicked / Exposed Steel
25% oxidation coverage on copper ; 10% deterioration of exposed steel at
nick; 0% corrosion of copper at nick;
some corrosion on cut end buried in
soil.
90% oxidation coverage on copper ; 25% deterioration of exposed steel at
nick; 0% corrosion of copper at nick;
some corrosion on cut end buried in
soil.
95% oxidation coverage on copper ; 50% deterioration of exposed steel at
nick; 0% corrosion of copper at nick;
some corrosion on cut end buried in
soil.
100% oxidation coverage on copper ; 75% deterioration of exposed steel at
nick; 5% corrosion of copper at nick;
some corrosion on cut end buried in
soil.
100% oxidation coverage on copper ; 100% deterioration of exposed steel at nick; 10% corrosion
of copper at nick; some corrosion on cut end buried in
soil.
11

BREAKING LOAD The test results for the breaking load of the samples can be seen in the following graphs:
Graph #1: Breaking load over time for standard insulated tracer wire
Breakload (Standard Sample)
600
610
620
630
640
650
660
670
680
690
700
3-month 6-month 1-year 2-year 5-year
Sample Period
Brea
k Lo
ad (l
bs)
100% Sand - Conductivity 1
75% Sand / 25% Clay - Conductivity 1
50% Sand / 50% Clay - Conductivity 1
25% Sand / 75% Clay - Conductivity 1
100% Clay - Conductivity 1
Not Buried - Control Sample
100% Sand - Conductivity 2
75% Sand / 25% Clay - Conductivity 2
50% Sand / 50% Clay - Conductivity 2
25% Sand / 75% Clay - Conductivity 2
100% Clay - Conductivity 2
Note: The dotted line indicates the control samples
Graph #2: Breaking load over time for indented insulated tracer wire
Break Load Changes (Indented Samples)
550
560
570
580
590
600
610
620
630
3-month 6-month 1-year 2-year 5-year
Sample Period
Brea
k Lo
ad (l
bs)
100% Sand - Conductivity 1
75% Sand / 25% Clay - Conductivity 1
50% Sand / 50% Clay - Conductivity 1
25% Sand / 75% Clay - Conductivity 1
100% Clay - Conductivity 1
Not Buried - Control Sample
100% Sand - Conductivity 2
75% Sand / 25% Clay - Conductivity 2
50% Sand / 50% Clay - Conductivity 2
25% Sand / 75% Clay - Conductivity 2
100% Clay - Conductivity 2
Note: The dotted line indicates the control samples
12

Graph #3: Breaking load for nicked insulated tracer wire with exposed steel (5-year samples)
Break Load Comparison (nicked samples)
500
510
520
530
540
550
560
570
Not Buried -ControlSample
100% Sand -Conductivity 1
75% Sand /25% Clay -
Conductivity 1
50% Sand /50% Clay -
Conductivity 1
25% Sand /75% Clay -
Conductivity 1
100% Clay -Conductivity 1
100% Sand -Conductivity 2
75% Sand /25% Clay -
Conductivity 2
50% Sand /50% Clay -
Conductivity 2
25% Sand /75% Clay -
Conductivity 2
100% Clay -Conductivity 2
Sample
Brea
k Lo
ad (l
bs)
Note: The dotted line indicates the control samples
Table #2: 5-year Sample Breaking Load Statistical Comparison Standard Indented Nicked (Exposed Steel)
Breaking Load (lbs)
% change from
Baseline Sample
Breaking Load (lbs)
% change from
Standard undamaged
5-year Samples
% change from
Baseline Indented Sample
% Change from
Baseline Undamaged
Sample
Breaking Load (lbs)
% change from
Standard undamaged
5-year Samples
% change from
Baseline Nicked Sample
% change from
Baseline Undamaged
Sample
Minimum 592 -0.29% 586 -7.85% -0.49% -9.73% 532 -18.73% -0.18% 19.17%
Average 657 -1.11% 596 -11.12% -3.11% -12.11% 540 -19.83% -0.28% -20.43%
Maximum 682 -2.65% 612 -12.67% -4.72% -13.57% 548 -21.30% 1.29% -21.53%
Note 1: The baseline samples were never buried in soil. Note 2: A positive % change indicates an increase in Break Load; a negative % change indicates a decrease in Break Load.
13
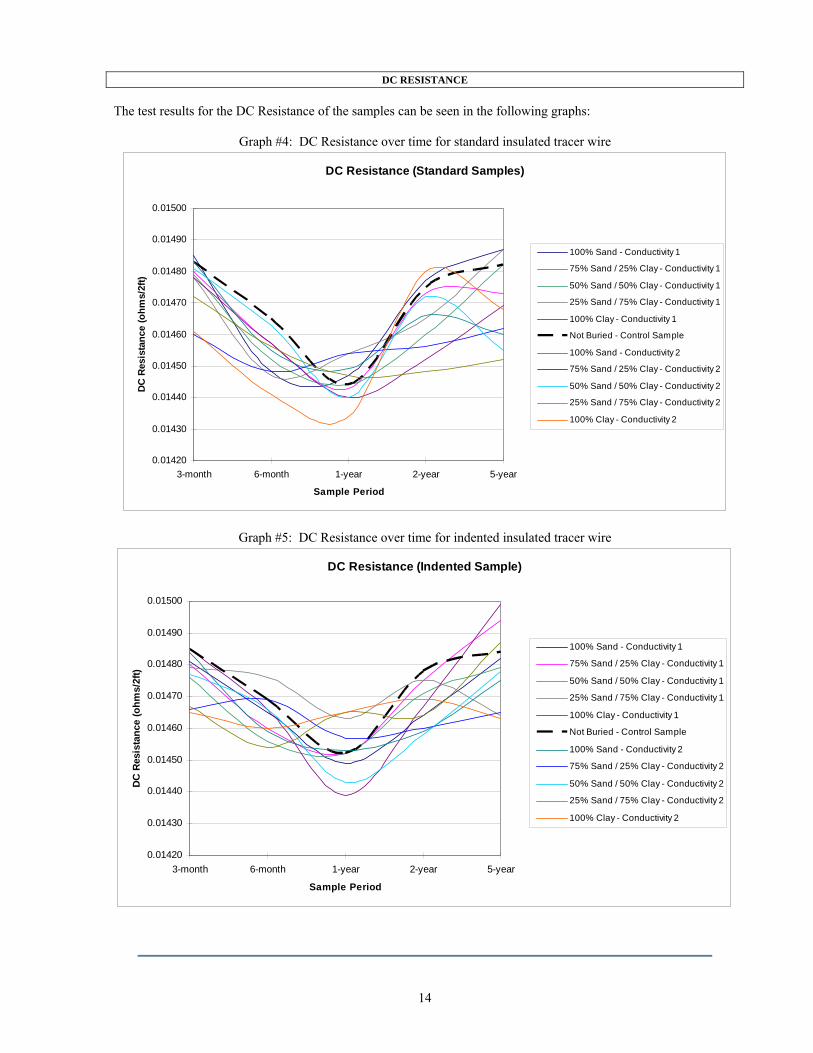
DC RESISTANCE The test results for the DC Resistance of the samples can be seen in the following graphs:
Graph #4: DC Resistance over time for standard insulated tracer wire
DC Resistance (Standard Samples)
0.01420
0.01430
0.01440
0.01450
0.01460
0.01470
0.01480
0.01490
0.01500
3-month 6-month 1-year 2-year 5-year
Sample Period
DC R
esis
tanc
e (o
hms/
2ft)
100% Sand - Conductivity 1
75% Sand / 25% Clay - Conductivity 1
50% Sand / 50% Clay - Conductivity 1
25% Sand / 75% Clay - Conductivity 1
100% Clay - Conductivity 1
Not Buried - Control Sample
100% Sand - Conductivity 2
75% Sand / 25% Clay - Conductivity 2
50% Sand / 50% Clay - Conductivity 2
25% Sand / 75% Clay - Conductivity 2
100% Clay - Conductivity 2
Graph #5: DC Resistance over time for indented insulated tracer wire
DC Resistance (Indented Sample)
0.01420
0.01430
0.01440
0.01450
0.01460
0.01470
0.01480
0.01490
0.01500
3-month 6-month 1-year 2-year 5-year
Sample Period
DC
Res
ista
nce
(ohm
s/2f
t)
100% Sand - Conductivity 1
75% Sand / 25% Clay - Conductivity 1
50% Sand / 50% Clay - Conductivity 1
25% Sand / 75% Clay - Conductivity 1
100% Clay - Conductivity 1
Not Buried - Control Sample
100% Sand - Conductivity 2
75% Sand / 25% Clay - Conductivity 2
50% Sand / 50% Clay - Conductivity 2
25% Sand / 75% Clay - Conductivity 2
100% Clay - Conductivity 2
14

Graph #6: DC Resistance nicked insulated tracer wire with exposed steel (5-year samples)
DC Resistance Comparison (Nicked Samples)
0.014
0.0142
0.0144
0.0146
0.0148
0.015
0.0152
0.0154
0.0156
0.0158
0.016
Not Buried -Control Sample
100% Sand -Conductivity 1
75% Sand /25% Clay -
Conductivity 1
50% Sand /50% Clay -
Conductivity 1
25% Sand /75% Clay -
Conductivity 1
100% Clay -Conductivity 1
100% Sand -Conductivity 2
75% Sand /25% Clay -
Conductivity 2
50% Sand /50% Clay -
Conductivity 2
25% Sand /75% Clay -
Conductivity 2
100% Clay -Conductivity 2
Sample
DC
Res
ista
nce
(ohm
s/2f
t)
Table #3: 5-year Sample DC Resistance Statistical Comparison Standard Indented Nicked (Exposed Steel)
DC Resistance
(Ω/2ft)
% change from
Baseline Sample
DC Resistance
(Ω/2ft)
% change from
Standard undamaged
5-year Samples
% change from
Baseline Indented Sample
% Change from
Baseline Undamaged
Sample
DC Resistance
(Ω/2ft)
% change from
Standard undamaged
5-year Samples
% change from
Baseline Nicked Sample
% change from
Baseline Undamaged
Sample
Minimum 0.01452 0.0% 0.01463 -0.20% -0.13% 0.00% 0.01463 -0.34% 0.00% -0.13% Average 0.01470 -0.84% 0.01479 0.63% -0.36% -0.23% 0.01484 1.01% -1.25% 0.15% Maximum 0.01487 -2.02% 0.01499 2.41% -1.42% -1.28% 0.01504 2.95% -2.66% 1.48% Note 1: The baseline samples were never buried in soil. Note 2: A positive % change indicates an increase in resistance; a negative % change indicates a decrease in resistance.
15

V. SUMMARY
TRACER WIRE After being buried in various soils with different conductivities for 5 years, the standard tracer wire samples with the CCS conductor sustained no corrosion along the length of the wire except on the cut end where exposed steel was present. On the cut end, the corrosion process of the steel core formed a “scab” of rust over the end of the wire (see figure 1). When the “scab” was removed, it was observed that the wire underneath in 90% of the samples showed very little signs of deterioration (see figure 2) The only measurable corrosion was on the steel core, which resulted in a worst-case steel deterioration depth equal to 70% of the wire diameter, which can be seen in figures 3a & 3b. The oxidation of the copper on the cut end propagated back about 3-6 inches under the insulation, but had no detrimental effects, except for discoloration. The tests showed no detrimental effects on strength or electrical properties resulting from the wire being exposed to the corrosive environments. The 5-year samples showed no statistically quantitative differences, when compared to the baseline samples.
The samples of the impacted tracer wire showed approximately the same characteristics, except some extra oxidation coinciding with the impact zone where the insulation was missing and the copper was exposed. The severe impact, made by the impact tester, broke open the insulation, but the steel was not exposed, except on one sample (see figures 4a & 4b). One out of the 50 samples placed in the soil for this study showed minimal signed of steel exposure and corrosion after 5 years, but the corrosion did not affect the properties of the conductor. It should be noted that the force used to impact the copper-clad steel wire in this study, far exceeds the force required to completely sever solid copper wire. The copper oxidized around the impact zone and propagated back under the insulation about 2 inches in the worst-case, but deterioration was negligible. A representative photo of the worst case, which is the one with minimal steel corrosion, can be seen in figures 4a & 4b. Although the impact slightly decreased the strength of the CCS by approximately 10%, the samples exposed to the corrosive soils for 5 years were consistent with the baseline control samples and the change was negligible. The tests showed that neither strength nor electrical properties were significantly affected by the prolonged exposure in a corrosive environment.
The samples of the nicked tracer wire, in which the steel core in the conductor was exposed, showed similar oxidation characteristics on the copper around the exposed area as the indented wire. The severe nick, which was made by a drill, removed some of the insulation; removed the copper cladding and exposed a substantial amount of steel surface area to the corrosive soil. The copper oxidized around the exposed area and propagated back under the insulation about 2 inches in the worst-case. Deterioration of the steel core was experienced, but was not severe. A representative photo of the worst case can be seen in figures 5. The drilling process during the sample preparation removed about 20% of the steel area and the corrosion of the steel in the worst case scenario only experienced another 5% loss in cross sectional area. This finding is significant as it shows does not correspond to corrosion characteristics of an un-insulated bare CCS wire, which experienced complete corrosion of the exposed steel after 5 years of exposure. This is discussed in more detail later within the report. Although the removal of the copper and steel during the drilling process decreased the strength of the CCS by approximately 20%, the samples exposed to the corrosive soils for 5 years were consistent with the baseline control samples and the change was negligible. The tests showed that neither strength nor electrical properties were significantly affected by the prolonged exposure in a corrosive environment.
UNINSULATED CCS All the standard “non-nicked” un-insulated CCS had reached 100% surface oxidation after 2 years and was the same at 5 years. But, the only signs of measurable corrosion were evident on the steel core of the cut end that was buried in the soil, which resulted in various degrees of deterioration of the steel core, which is an expected and verified corrosion characteristic of copper-clad steel wire. Although the oxidation was heavy, the samples showed no signs of pits or holes in the cladding. The copper thickness of a severely oxidized 2-year sample showed no discernable difference when compared to an un-oxidized sample not subjected to the corrosive environment. The mechanical and resistance testing resulted in negligible differences between 5-year samples and the control samples. Thus the oxidation had no discernable impact on the strength or electrical performance of the wire.
The samples of the “nicked” un-insulated CCS wire had also reached 100% surface oxidation after 2 years, which was still evident after 5 years. Again, some corrosion was evident on the steel core of the cut end that was buried in the soil, which resulted in various degrees of deterioration of the steel core. The nicked portion, which exposed a large area of steel to the corrosive soils, had varying results, but the majority was severe with results showing as much as 100% deterioration of the steel within the nicked area. (See figure 6)
16
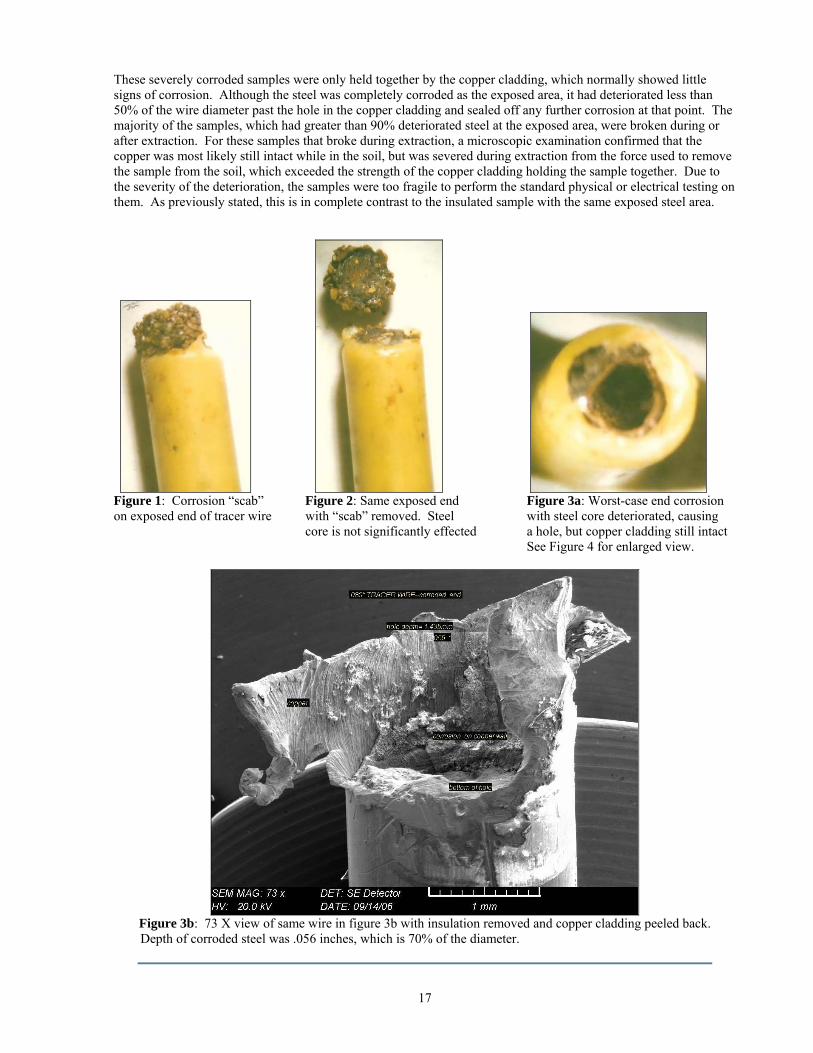
These severely corroded samples were only held together by the copper cladding, which normally showed little signs of corrosion. Although the steel was completely corroded as the exposed area, it had deteriorated less than 50% of the wire diameter past the hole in the copper cladding and sealed off any further corrosion at that point. The majority of the samples, which had greater than 90% deteriorated steel at the exposed area, were broken during or after extraction. For these samples that broke during extraction, a microscopic examination confirmed that the copper was most likely still intact while in the soil, but was severed during extraction from the force used to remove the sample from the soil, which exceeded the strength of the copper cladding holding the sample together. Due to the severity of the deterioration, the samples were too fragile to perform the standard physical or electrical testing on them. As previously stated, this is in complete contrast to the insulated sample with the same exposed steel area.
Figure 1: Corrosion “scab” Figure 2: Same exposed end Figure 3a: Worst-case end corrosion on exposed end of tracer wire with “scab” removed. Steel with steel core deteriorated, causing core is not significantly effected a hole, but copper cladding still intact See Figure 4 for enlarged view.
Figure 3b: 73 X view of same wire in figure 3b with insulation removed and copper cladding peeled back.
Depth of corroded steel was .056 inches, which is 70% of the diameter.
17

Figure 4a: Indented tracer wire with damaged insulation removed to show oxidation of copper. Steel core is still protected and showing no signs of deterioration.
Figure 4b: Side view of the same wire in Figure 4a
Figure 5: Un-insulated “nicked” sample. Worst-case corrosion of steel core, which is completely deteriorated within the opening of the copper cladding, but only propagates back into the wire to a distance of approximately 50% of the wire diameter. This particular sample broke after the resistance test was completed, but before a tensile test was done.
18
VI. CONCLUSIONS After 5 years of burial in the soil, the results have been predominately as expected and the findings and conclusions are almost identical to all the previous interim reports. All the solid copper samples showed insignificant signs of degradation or corrosion. It was concluded that the solid copper conductors will maintain their current carrying capacity to perform the function to transmit a signal for a standard in-service lifespan. Although the inherent low strength of a solid copper conductor will continue to be an issue as not effective for this application. The undamaged tracer wire containing copper-clad steel as the conductor with the insulation fully intact experienced no appreciable corrosion, except at any cut ends that were not properly protected. If the ends are not protected and the steel core is exposed, the resulting corrosion is minimal and does not negatively impact the product’s performance. Furthermore, when CCS is hit with a semi-sharp instrument, comparable to a shovel, no detrimental effects of corrosion have been noted at the impact site. The slight oxidation that has taken place at the impact site has had no significant effect on performance. To re-state the significance of this impact, the force used to hit the CCS wire in this study, which did not expose the steel core, was much greater than the minimal amount of force required to completely sever solid copper wire. But, the most significant finding in this study was the result of the tracer wire samples with the “nick” or exposed steel. First, the findings of an un-insulated sample are reviewed. If an un-insulated CCS conductor is severely damaged and the steel core is exposed to a corrosive environment, then deterioration of the steel core will occur. After 5 years of exposure, it was observed that the steel core had completely deteriorated at the “nicked” area on the majority of the samples and left a copper shell at that point. But, again it was seen that the corrosion had not propagated into the wire past the exposed steel region and the copper cladding had not experienced any deteriorating corrosion and had maintained a high level of its signal carrying ability and strength. The 5-year CCS samples did have 100% surface oxidation of the copper but, this oxidation, aside from aesthetics, did not have any detrimental effects on product performance. When correlated with the 2-year un-insulated samples, the corrosion of the exposed steel stopped once the steel in the exposed area disintegrated. The rust “seals-off” the un-oxidized steel from the corrosive medium not allowing any further propagation past the nicked area into the CCS conductor. Based on the 5-year testing results, the exposed steel on un-insulated CCS wire will completely corrode away in a highly corrosive environment, but it will only corrode in the area directly beneath the missing copper cladding. These results are acceptable, but not ideal. But, an analysis of the same damaged CCS conductor with insulation reveals a contrasting result. The samples of tracer wire (insulated) with a “nicked” area showed very little deterioration of the steel and all the electrical and physical properties showed insignificant degradation. The tracer wire insulation provided a shield over the copper and thus limited the copper surface area being exposed; therefore, the galvanic corrosive action was almost eliminated. The exposed steel corrosion was mild, instead of the more severe deterioration experienced with galvanic corrosion, in which the steel will sacrifice itself to the copper. This slow corrosion process on the insulated versions, provided a more effective solid barrier from the corrosive medium and the “scabbing” process was more stable. The integrity of oxidized steel sealed off the exposed area quicker and with more consistency, thus reducing the effects of the corrosion of the exposed steel to almost nothing. The 5-year tracer wire samples have not shown any discernible differences from the 3-month, 6-month samples, 1-year, 2-year or the control samples. Based on this 5 year corrosion study, it can be concluded that a damaged tracer wire, with the copper cladding breached and the steel core corroded, will maintain its current carrying capacity and strength to perform its function to transmit a signal for a standard in-service lifespan.
Disclaimer: The results and conclusions obtained within this report are only applicable to the Copperhead brand tracer wire that utilizes a trademarked Copperweld® (Copper-Clad Steel) Conductor. Due to the proprietary processes used to produce this tracer wire, the findings cannot be superimposed on any other tracer wire or copper-clad steel conductor.
19