Embed Size (px)
Citation preview
THE EFFECTS OF CLIMATE CHANGE IN THE NETHERLANDS: 2012
This policy study is a publication by
PBL Netherlands Environmental Assessment Agency
Mailing addressPO Box 303142500 GH The HagueThe Netherlands
Visiting addressOranjebuitensingel 62511VE The HagueT +31 (0)70 3288700
www.pbl.nl/en
March 2013 POLICY STUDIES
The climate is changing; average temperatures in the Netherlands have increased by 1.7 °C over the past century and extreme precipitation events occur more often than before. According to current insights, climate change is set to continue in the centuries to come. Not only are global temperatures and extreme precipitation events projected to increase, but so are river discharges, sea level rise and the likelihood of droughts. However, the possible climatic changes are subject to large uncertainty. In the Netherlands, for example, average annual precipitation could either decline by 5% or increase by 6%, between the present day and the year 2100. This makes it more difficult to anticipate possible consequences of climate change. The impacts of climate change are expected to vary widely in the Netherlands. Some effects will be positive, such as those of increased agricultural production and more fine days for recreation. Other effects, however, will be negative; there is an increase in the likelihood of water drainage flooding as a result of extreme precipitation events, and of heat stress within cities due to rising temperatures.In theory, the consequences of further climate change for the Netherlands at the current rate of change would be manageable. This is partly due to the fact that impacts appear to be limited and changes gradual, thus providing enough time to anticipate them. The fact that climate risks have been incorporated in the various policy portfolios is another reason for the manageability of such risks. For example, the Delta Programme pays attention to climate-proofing the built environment and to environmental developments that could threaten water safety and freshwater availability. There also are policy areas that award less attention to climate impacts - an important one of which is nature policy.


The effects of Climate Change in the Netherlands: 2012
PBL Netherlands Environmental Assessment Agency
In collaboratrion with:
Royal Netherlands Metherological Institute (KNMI)Copernicus Institute, Utrecht UniversityWageningen University and Research Centre (WUR)Deltares Research InstituteInternational Centre for Integrated Assessment and Sustainable Development (ICIS), Maastricht UniversityNational Institute for Public Health and the Environment (RIVM)

The effects of Climate Change in the Netherlands: 2012This publication is a summary of the Dutch report ‘Effecten van Klimaatverandering in Nederland: 2012’, published in 2012.© PBL Netherlands Environmental Assessment AgencyThe Hague, 2013
ISBN: 978-94-91506-30-7PBL publication number: 957
Corresponding [email protected] [email protected] [email protected]
AuthorsSummary: J.G. van Minnen, W. Ligtvoet, R. Franken and L. van Bree (PBL)Chapter 1: J.G. van Minnen and W. Ligtvoet (PBL)Chapter 2: J.G. van Minnen and H. Visser (PBL), with contributions by: G. van der Schrier, J. Bessembinder, G.J. van Oldenborgh, T. Prozny, R. Sluijter, R. Sluiter, A.M.G. Klein Tank (KNMI), J.P. van der Sluis and J.A. Wardekker (UU);Chapter 3: J.M. Knoop, W. Ligtvoet and J.G. van Minnen (PBL), with contributions by A. ter Linde, J. Kwadijk, F. Klijn (Deltares) and C. Katsman (KNMI); review by A. ter Linde (Deltares), H. van Buiteveld (RWS) and J.A. Wardekker (UU);Chapter 4: D.C. J. van der Hoek, J.G. van Minnen, M. Vonk and R. Wortelboer (PBL)
Chapter 5: G.J. van den Born and J.G. van Minnen (PBL), with contributions by J. Verhagen (WUR);Chapter 6: L. van Bree and J.G. van Minnen (PBL), with contributions by M. Huynen (ICIS), M. Braks, C. Schets, A.M. de Roda Husman (RIVM) and J.A. Wardekker (UU); review by A.E.M. de Hollander (PBL) and M. Huynen (ICIS);Chapter 7: J.G. van Minnen (PBL), with contributions by B. Amelung (WUR);Chapter 8: W. Ligtvoet, J.G. van Minnen and A.E.M. de Hollander (PBL), review by V.W.J. van den Bergen, R. Schoonman (Ministery of van Infrastructure and the Environment), H. van Buiteveld (RWS) and O.J. van Gerwen (PBL).
SupervisorGuus de Hollander
TranslationDerek Middleton
English-language editingAnnemieke Righart
GraphicsPBL Beeldredactie
Production coordinationPBL Publishers
LayoutMartin Middelburg, VijfKeerBlauw
You can download a copy of this publication from the website: www.pbl.nl/en.
Parts of this publication may be reproduced provided that the source is stated as follows: Ligtvoet, W. et al. (2013), The effects of Climate
Change in the Netherlands: 2012, The Hague: PBL Netherlands Environmental Assessment Agency.
PBL Netherlands Environmental Assessment Agency is the national institute for strategic policy analyses in the fields of the
environment, nature and spatial planning. We contribute to improving the quality of political and administrative decision-making, by
conducting outlook studies, analyses and evaluations in which an integrated approach is considered paramount. Policy relevance is the
prime concern in all our studies. We conduct solicited and unsolicited research that is both independent and always scientifically sound.

4
Contents
Findings 7
The effects of Climate Change in the Netherlands: 2012 8Summary 8Introduction 9Main conclusions 9
Full Results 18
1 Introduction 181.1 Background 181.2 Update: effects of climate change in the Netherlands and the policy response 181.3 Structure of the report 18
2 How is the Dutch climate changing? 202.1 Introduction 202.2 The climate system 202.3 Climate change over the past 150 years: global 202.4 Observed climate change in the Netherlands 212.5 Projected climate changes in the 21st century: introduction 272.6 Projected climate changes in the 21st century in the Netherlands 28
3 Effects on flood safety, water availability and water quality 383.1 Introduction 383.2 Flood safety 383.3 Water drainage flooding and drought 443.4 Water quality: salinisation and eutrophication of groundwater and surface waters 47
4 Effects of climate change on ecosystems and biodiversity 504.1 Introduction 504.2 Observed changes 504.3 Possible future effects of climate change on ecosystems and biodiversity 53
5 Effects of climate change on agriculture in the Netherlands 585.1 Introduction 585.2 How will climate change affect agriculture? 58
6 Effects on public health 64
7 Effects of climate change on recreation and tourism 68
8 Policy responses to the effects of climate change 728.1 Introduction 728.2 Policy response in the Netherlands 728.3 Adaptation in international climate change policy 76
References 80

6 | The effects of Climate Change in the Netherlands: 2012

7 |
FIN
DIN
GS
FINDINGS

8 | The effects of Climate Change in the Netherlands: 2012
The effects of Climate Change in the Netherlands: 2012
Summary
• The Dutch climate is changing: over the past century the average temperature has risen, the amount and intensity of precipitation have increased and extremely hot days have become more common.
• Various effects of climate change can already be observed in the Netherlands. Some of these effects are positive, such as increases in agricultural productivity and the number of good weather days for recreation. Others are negative, such as more frequent river and water drainage flooding (as a result of intense precipitation) and reductions in the quality of surface waters (water temperature, algal growth) and biodiversity. A more rapid rise in sea level and an increase in peak river discharges as a consequence of climate change have not yet been observed in the Netherlands.
• Climate change and its effects are expected to continue over the next few centuries. The negative effects of climate change are strongly related to changes in the occurrence of extreme weather conditions (e.g. droughts, storms, heat waves). Moreover, the risk of new or repeated outbreaks of human or agricultural pests and diseases may also increase. But the changes also present opportunities to the Netherlands, including benefits to agriculture and tourism.
• At the current rate of change, the effects of climate change in the Netherlands are, in principle, manageable.
• Moreover, several physical factors may help to moderate the future effects of climate change in the Netherlands. Water buffering in areas further upstream in the Rhine river basin, for example, will reduce the
size of extreme peak discharges reaching the Netherlands.
• Addressing climate risks is now embedded in most of the relevant policies, although the nature and extent of this policy response varies between policy areas:
− The climate risks and uncertainties associated with flood safety, freshwater availability and urban development are adequately addressed in the Delta Programme. This programme will allow the Netherlands to equip itself to respond in time to water risks.
− An infrastructure of global and regional monitoring networks and action plans has been established to detect human and agricultural pests and diseases. This infrastructure is made increasingly necessary by the huge numbers of global and European transport movements. Attention is also being given, at both the global and European levels, to the consequences of climate change for the spread of infectious diseases.
In recent years there has been little policy interest at national government level in the effects of climate change on ecosystems and biodiversity. The Dutch National Ecological Network (EHS) and the Natura 2000 network provide a solid platform for more climate-resilient nature. However, this will require a change in government thinking on the EHS, with an emphasis on enlarging, connecting and improving certain valuable conservation areas (wetlands, dunes and coast, forests and heathland) so that species populations are able to keep up with the shift in climate zones. In addition, climate-proofing nature conservation policy may require a revision of the conservation objectives, because these are defined in static terms.
9Findings |
|
Introduction
In 2005, PBL Netherlands Environmental Assessment Agency published a study summarising the knowledge available at that time about climate change and its consequences for the Netherlands. That study noted that the climate was changing and that this has certain consequences. Although the observable effects were limited in scale, it was expected that the trends would speed up in future. Since then our understanding of climate change and its effects has increased. Moreover, policymakers in various policy areas have become aware of climate change and the effects it will have, both positive and negative. This is reflected in the establishment of the interdepartmental programme on Spatial Adaptation to Climate Change (2006–2010) and the Delta Programme (from 2010).
The present PBL study for the Ministry of Infrastructure and the Environment provides an update of the 2005 study: What is the current situation regarding climate change in the Netherlands; what effects are now more or in fact less observable; are there new insights into the risks and opportunities of climate change; and to what extent are these risks and opportunities embedded in relevant policies? In addition to this national update, updates on climate change and its effects at the global and European scales have been published by the IPCC (Intergovernmental Panel on Climate Change) and EEA (European Environment Agency) respectively.
Main conclusions
The picture sketched by earlier reports is confirmed: The climate is changing, globally as well as in the Netherlands. At the current rate of change, the consequences for the Netherlands, in principle, are manageable• Many aspects of the Dutch climate have changed
measurably over the past 100 years (Figure 1). The average temperature in the Netherlands has risen by 1.7 °C and the annual number of summer days – defined as days with a maximum temperature of above 25.0 °C – has risen by almost 20, while the number of frost days has fallen by about the same number. Total annual precipitation has increased by more than 20% and the frequency of heavy showers has also risen sharply. The measured temperature rise in the Netherlands is about twice as large as the global average, and over the past 20 years there has been no visible weakening of this upward trend.
• Several changes associated with climate change are visible in the Netherlands (Table 1). Positive effects include rising agricultural productivity, lower average
winter mortality and an increase in the number of good weather days for recreation. Examples of negative effects are more frequent drainage flooding (as a result of intense precipitation), increased risks of allergies among sufferers and an increased risk of heat stress in urban areas. Changes can also been seen in nature, such as shifts in the ranges and life cycles of plants and animals. Climate change can also aggravate existing problems affecting biodiversity, such as habitat fragmentation.
• Current understanding indicates that in the Netherlands climate change will continue and its effects will increase (Figure 1). Because the climate system responds slowly to stimuli and the knock-on environmental impacts are equally slow to manifest, the changes will persist for some time to come – even if global greenhouse gas emissions decline. These changes also present opportunities, including benefits to agriculture and tourism. The unfavourable effects of climate change have much to do with changes in the occurrence of extreme weather conditions (droughts, high and low river discharges, intense precipitation events, unusually cold periods and extreme heat). Moreover, there may be an increased risk of new or repeated outbreaks of human and agricultural pests and diseases.
• At the current rate of climate change, the effects are in principle manageable in the Netherlands. The effects of future climate change here are expected to be more limited than in many other regions, both within and outside Europe. Our ability to cope with the effects of climate change is also a consequence of the current widespread policy interest in climate change, although this does differ between policy areas.
Maximum and minimum river discharges also affected by water management in countries upstream• Average winter discharges in the main rivers in the
Netherlands have increased, while average summer discharges have declined. The extreme high and low discharges determine the risks to the Netherlands. Peak discharges can lead to flooding and extreme low discharges to water shortages. Over the past 100 years there has been no significant trend in such extreme events, neither in peak discharges nor in the minimum discharges.
• During peak discharges, the amount of water entering the Netherlands in the rivers is determined to a large extent by the flood protection policies operating in the upstream areas. For example, if Germany continues with its current water management policies and does not take any measures in addition to the current improvement programme (dyke situation in 2020), the maximum Rhine discharge entering the Netherlands

10 | The effects of Climate Change in the Netherlands: 2012
Figure 1
Possible climatic changes, 1990 – 2100, according to KNMI'06 scenarios
Observed climatic changes, 1900 – 2010
Observed and projected future climate change
Dry periodsPotential evaporationNo trend (1906 – 2007)
Wet periodsTen-day precipitation total that was exceeded once every 10 years: Winter: +29% (1906 – 2007)
Sea level at the Dutch coastCirca +20 cm (1900 – 2010)
Annual precipitation+21% (1906 – 2007)
Annual average temperature+1.7oC (1906 – 2007)
River discharges River Rhine average in winter: +9%River Rhine average in summer: -9%River Rhine extreme discharges:No trend (1901 – 2005)
-+
Dry periods+7 to +30%Potential evaporation
Sea level at Dutch coast+35 to +85 cm
Annual precipitationFrom -5% to +6%
Average annual temperature+1.8 to +5.1 oC
River dischargesRiver Rhine average in winter: +12% to +27%River Rhine average in summer: -41% to +1% River Rhine extremely high discharges: 4 to 40 times more o�en
-+
Wet periodsTen-day precipitation total that will be exceeded once every 10 years: Winter: +8% to +24%
Source: KNMI (2006, 2009a); Kwadijk et al. (2008)
11Findings |
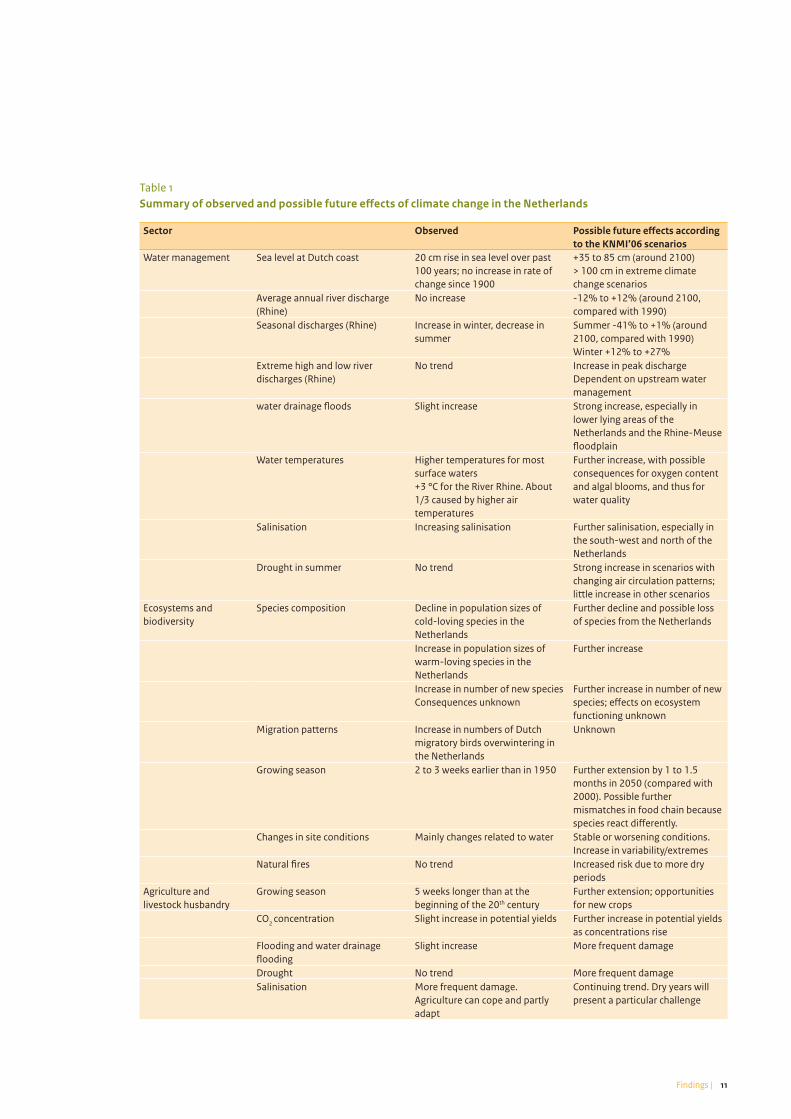
Table 1Summary of observed and possible future effects of climate change in the Netherlands
Sector Observed Possible future effects according to the KNMI’06 scenarios
Water management Sea level at Dutch coast 20 cm rise in sea level over past 100 years; no increase in rate of change since 1900
+35 to 85 cm (around 2100) > 100 cm in extreme climate change scenarios
Average annual river discharge (Rhine)
No increase -12% to +12% (around 2100, compared with 1990)
Seasonal discharges (Rhine) Increase in winter, decrease in summer
Summer -41% to +1% (around 2100, compared with 1990)Winter +12% to +27%
Extreme high and low river discharges (Rhine)
No trend Increase in peak dischargeDependent on upstream water management
water drainage floods Slight increase Strong increase, especially in lower lying areas of the Netherlands and the Rhine-Meuse floodplain
Water temperatures Higher temperatures for most surface waters+3 °C for the River Rhine. About 1/3 caused by higher air temperatures
Further increase, with possible consequences for oxygen content and algal blooms, and thus for water quality
Salinisation Increasing salinisation Further salinisation, especially in the south-west and north of the Netherlands
Drought in summer No trend Strong increase in scenarios with changing air circulation patterns; little increase in other scenarios
Ecosystems and biodiversity
Species composition Decline in population sizes of cold-loving species in the Netherlands
Further decline and possible loss of species from the Netherlands
Increase in population sizes of warm-loving species in the Netherlands
Further increase
Increase in number of new species Consequences unknown
Further increase in number of new species; effects on ecosystem functioning unknown
Migration patterns Increase in numbers of Dutch migratory birds overwintering in the Netherlands
Unknown
Growing season 2 to 3 weeks earlier than in 1950 Further extension by 1 to 1.5 months in 2050 (compared with 2000). Possible further mismatches in food chain because species react differently.
Changes in site conditions Mainly changes related to water Stable or worsening conditions. Increase in variability/extremes
Natural fires No trend Increased risk due to more dry periods
Agriculture and livestock husbandry
Growing season 5 weeks longer than at the beginning of the 20th century
Further extension; opportunities for new crops
CO2 concentration Slight increase in potential yields Further increase in potential yields as concentrations rise
Flooding and water drainage flooding
Slight increase More frequent damage
Drought No trend More frequent damageSalinisation More frequent damage.
Agriculture can cope and partly adapt
Continuing trend. Dry years will present a particular challenge

12 | The effects of Climate Change in the Netherlands: 2012
Sector Observed Possible future effects according to the KNMI’06 scenarios
Pests and diseases No trend, relations still uncertain Possible further increase in frequency, mainly due to higher humidity and higher temperatures; still much uncertainty
Human health Heat stress and summer smog Increase in premature deaths due to more warm and tropical days (compared with normal summers). Moderate effect (with proper adaptation) compared with other stress factors and probably also smaller than the reduction in winter mortality
Further increase due to more frequent heat waves, also in combination with more frequent summer smog. In principle manageable by making changes in behaviour and healthcare and adaptations to the built environment
Winter mortality Less illness and a reduction in winter mortality
Further reduction
Allergies and hay fever (pollen, oak processionary caterpillar)
Number of ‘allergy days’ has increased by more than 20; oak processionary caterpillar present in large parts of the Netherlands
Further increase in the number of ‘allergy days’ due to extension of the growing and flowering season, and the possible appearance of new allergenic species; in 2020 oak processionary caterpillar present across the whole Netherlands
Vector-borne infectious diseases Climate change leads to changes in the distribution, density and activity of insects and ticks (potential vector organisms for infectious diseases). The influence of climate on the transmission of pathogens is complex and as yet unknown. Tick numbers have risen in the Netherlands and cases of infection with the Lyme bacterium have increased; other factors also play a role (e.g. recreational behaviour).
Great uncertainty about vector transmission of pathogens (viruses, bacteria) and possible outbreaks of infectious diseases.
Waterborne infectious diseases The influence of the climate is diverse. Some waterborne pathogens (bacteria, amoebae, algae) are sensitive to climate change; an increase in temperature, humidity, UV radiation, precipitation and water availability will lead directly to an increase in the burden of infectious diseases. The occurrence of other pathogens, such as intestinal bacteria, viruses and parasites, may in fact decline under the influence of climate change.
Projections of the future influence of climate factors on the development and transmission of waterborne pathogens are uncertain. Without adaptation measures both positive and negative effects are possible, depending on the type of pathogen.
Food-borne infectious diseases There is a direct causal relation between climate change, especially higher temperatures, and the increase in food-borne illnesses. The relatively good level of food hygiene in the Netherlands limits this effect.
Limited further increase in food-related infections is possible.
Recreation and tourism Recreation days Doubling of the probability of 5 consecutive good weather days with suitable conditions for outdoor recreation (between 1950 and 2001)
Further increase in the probability of attractive recreation days

13Findings |
will continue to be buffered, even if climate change should lead to higher peak discharges in the upper reaches of the Rhine (Figure 2). In such cases water may enter the Netherlands outside the rivers, for example via flooding just over the German border. But should Germany increase its flood safety standards, reducing the likelihood of flooding, higher river discharges would be able to enter the Netherlands.
• Even non-extreme conditions can lead to dangerous situations. In January 2012, a storm coinciding with high river discharges caused high water levels in the Haringvliet and flooding around the Drecht cities, among other places. If climate change leads to more frequent high river discharges, the probability of such events occurring will increase, especially in combination with rising sea levels (Klijn et al., 2010).
• The Rhine is by far the most important river for supplying fresh water to the Netherlands during the summer. Ultimately, the amount of water entering the Netherlands during a period of drought depends in part on the water use further upstream. The Meuse discharge treaty between the Netherlands and Belgium contains agreements on the distribution of Meuse water during periods of low discharge.
• There are currently no firm international agreements on the distribution of Rhine water during periods of drought. If climate change leads to a substantially lower water discharge via the Rhine, an increase in the use of water upstream could reduce the amount of fresh water available to the Netherlands. How much this shortfall could be is still unclear.
Future sea level rise along the Dutch coast will probably be tempered by the changing gravitational pull of melting land ice masses• Over the past 100 years the sea level along the Dutch
coast has risen by about 20 cm. Although an increase in the rate of sea level rise has been observed at the global level, this does not apply to the Netherlands. This is because natural variability is a significant factor at the local scale, but averages out at the global scale. The precise contribution made by climate change to sea level rise is still uncertain; other, natural factors also play a role, such as variations in wind set-up and the geological processes operating along the Dutch coast.
• The observed sea level rise in the Netherlands is still at the lower end of the various projections for this century. Projections of future sea level rise along the Dutch coast as a consequence of climate change vary widely. The KNMI’06 scenarios give a range of 35 to 85 cm for 2100; the Delta Commission (2008) estimates a rise in sea level up to 1.2 m in 2100 (1.3 m including land subsidence) in its ‘most unfavourable scenario’.
• The rise in sea level is the outcome of several factors, including the melting of land ice masses. The possible future sea level rise along the Dutch coast – particularly beyond 2100 – will also be influenced by changes in the gravitational pull of land ice masses as they melt. This is a physical process that has an immediate effect on the sea level. When (some of) the land ice masses of Greenland, Antarctica and other ice sheets melt, their gravitational pull on the surrounding ocean reduces. The meltwater causes the average sea level in the world to rise, but the lower gravitational pull of the ice
Figure 2
10 15 20 25
Peak discharge without upstream flooding (thousand m3/s)
10
15
20
25Peak discharge at Lobith (thousand m3/s)
Upstream flooding
Along the entire River Rhine(Lammersen, 2004)
Only in the lower part of the River Rhine,just before the Dutch boarder(Gudden, unpublished)
Situation without upstream flooding
Impacts of upstream flooding in Germany on peak discharges at Lobith (the Netherlands)
Source: Vellinga et al. (2008)

14 | The effects of Climate Change in the Netherlands: 2012
Table 2Summary of policy responses to climate change in the sectors considered
Sector Responsibility Included in Flood safety – inside the dykes Ministry of Infrastructure and
the EnvironmentProvincesRegional water authorities
Delta Programme (2010–2014)EU Floods Directive
– outside the dykes Municipalities Participation in the Delta Programme (2010–2014)
Water supply / major water bodies
Ministry of Infrastructure and the Environment
Delta Programme (2010–2014River basin management plans, Water Framework Directive
Regional water availability Province / Regional water authorities
Delta Programme (2010-2014River basin management plans, Water Framework Directive
Flooding and water drainage flooding in urban areas
Municipalities National Administrative Agreement on Water (IBW)Participation in Delta Programme (2010–2014)
Flooding and water drainage flooding in rural areas
Province / Regional water authorities
National Administrative Agreement on Water
Water quality Ministry of Infrastructure and the EnvironmentProvincesWater authorities
River basin management plans, Water Framework Directive
Ecosystems and biodiversity Ministry of Economic Affairs, Agriculture and Innovation / Provinces
EU Natura 2000: status of conservation objectivesNo specific NL implementation planProvinces: relation to climate buffers
Natural fires Ministry of Security and Justice Inter-authority cooperation on natural firesAgriculture – water availability Province / Regional water
authoritiesParticipation in the Delta Programme (2010–2014)
– pests & diseases Ministry of Economic Affairs, Agriculture and Innovation
Surveillance (Plant Protection Service of the Netherlands)
Public health – extreme heat Ministry of Health, Welfare and Sport
National hot weather planHeat stress plans by the Public Health Services (GGDs)
Ministry of Infrastructure and the Environment
Delta Programme, New Urban Development and Restructuring
– infectious diseases Ministry of Health, Welfare and Sport
National Institute for Public Health and the Environment (RIVM): monitoring of infectious diseases and advice on control measures; international coordination via EU (ECDC) and WHO (GOARN)
International WHO: Global Outbreak Alert and Response Network (GOARN)EU/WHO: Ministerial Conferences on Environment and HealthWHO: Protecting health from climate changeEU: European Centre for Disease Prevention and Control (ECDC)EU (2009) White Paper on Human, Animal and Plant Health Impacts of Climate ChangeDG Climate, mainstreaming climate adaptation and health.
Tourism & recreation Provinces and municipalities -Climate adaptation, international
Ministry of Infrastructure and the Environment
EU White Paper on Climate Change Adaptation (2009)EU Climate Change Adaptation Strategy (2013)EU/WHO Parma CommitmentNational web pages on European Climate Adaptation PlatformUNFCCCGreen Climate Fund

15Findings |
sheets leads to a reduction in the angle of tilt of the ocean. As the ice sheet on Greenland shrinks, the sea level off the Dutch coast will rise, but the change in the gravity effect will limit this rise to about 20% (-80%) of the global average sea level rise. The contribution made by meltwater from the glaciers and smaller ice sheets to the rise in sea level is also expected to be lower (by about 20%) off the Dutch coast than the global average rise. The melting of the Antarctic ice sheet, on the other hand, will lead to a higher sea level rise off the Dutch coast (+10%) than the global average. Based on current knowledge and scenarios, the melting of the ice sheets will result in a net sea level rise off the Dutch coast lower than the global average. In an extreme scenario, the possible sea level rise around 2200 will therefore not be in the range of 2 to 4 m, but 40 to 60 cm lower than this (Katsman et al., 2011).
• Until 2100 the effect of all this on sea level rise along the Dutch coast will remain limited (the moderating effect in the KNMI’06 scenarios is a maximum of 5 cm and for a more extreme scenario it is 15 cm (Katsman et al., 2011)). The reason for this is that the contribution to global sea level rise made by the melting ice sheets will remain limited during this century (compared with other factors leading to sea level rise).
Climate change risks are embedded in most policies, except for policies on nature conservation• In recent years consideration has been given to the
possible risks of climate change in many policy fields (Table 2). Much of this has been set in motion by the inter-authority programme on Spatial Adaptation to Climate Change (ARK, 2006–2010), which was coordinated by the Ministry of Housing, Spatial Planning and the Environment. The Delta Programme, which began in 2010, introduced new government priorities on climate risks and climate adaptation.
• Climate risks are closely associated with changes in the occurrence of extreme weather conditions and the possible increase in the probability of new or returning outbreaks of human or agricultural pests and diseases. Policy measures have already been taken to manage some of these risks associated with climate change, but additional measures are needed to provide a more integrated and comprehensive policy response.
• The climate-related risks of flooding from the sea and/or the rivers are of considerable relevance to the Netherlands. The Delta Programme addresses the possible, but still uncertain, effects of climate change. Based on long-term socioeconomic scenarios and climate scenarios, this programme assesses in greater depth the risks of flooding and water shortages and the measures that need to be taken to deal with them. In 2014 this should result in a proposal for several strategic decisions to the House of Representatives
(the ‘Delta decisions’). The Delta Programme also addresses the implications for urban areas (new urban development and urban restructuring) not only of flooding and water drainage flooding as a result of extreme precipitation, but also of drought and extreme heat. The National Policy Strategy for Infrastructure and Spatial Planning identifies the reservation of zones for flood control measures, sustainable freshwater supplies and frameworks for urban development/redevelopment as issues of national importance; these issues are included in the Delta Programme.
• A European and global monitoring infrastructure has been set up to ensure the earliest possible detection of new human and agricultural pests and diseases. This infrastructure is made increasingly necessary by the world wide high volumes of freight and passenger transport. The WHO (World Health Organization) coordinates the rapid detection of potential global epidemics as well as control measures via the Global Outbreak and Response Network (GOARN). At the European level, the European Centre for Disease Prevention and Control (ECDC) coordinates the monitoring and control of infectious diseases. The centre is supported by the European Commission, which has made proposals for a European monitoring system. The ECDC is a strategic partner of the WHO and works within the EU with the national health institutes of the Member States. The Netherlands is constantly alert to possible outbreaks of communicable infectious diseases and RIVM, Wageningen University and Research Centre (WUR) and the GGDs operate a monitoring programme. Because the weather and climate change can also influence the spread of infectious diseases (although much still remains unknown), increasing attention is being given to the possible effects of climate change on the spread of diseases and any consequences these may have for a monitoring system. Such a monitoring system may be proposed.
• Following the extreme heat waves of 2003 in the Netherlands, action plans were drawn up on protecting vulnerable groups in the population. Growing numbers of municipalities are taking climate change into account in their urban restructuring and expansion plans.
• Higher air temperatures lead to higher water temperatures and higher risks of (blue-green) algal blooms. The EU Water Framework Directive (WFD) requires the Member States to integrate the possible negative effects of climate change into their implementation of the WFD at national level. The current river basin management plans under the WFD (2009) contain a separate chapter on climate change and its expected effects on water quality and the ecology of water systems. Based on the available knowledge, incorporation of the effects of climate

16 | The effects of Climate Change in the Netherlands: 2012
change into the baseline scenarios will widen the gap between the desired and expected ecological status in 2027. The next set of river basin management plans (2015) should integrate the consequences of climate change more explicitly into the implementation of policy.
• In recent years there has been little policy interest in the effects of climate change on ecosystems and biodiversity in the Netherlands. The Dutch National Ecological Network (EHS) and the European Natura 2000 network provide a solid basis to make Dutch ecosystems and biodiversity more climate-resilient. As climate zones gradually shift, an adapted EHS with good ecological corridors and improved site conditions would enable species to migrate to more favourable areas and climate zones. However, this will require a change in government thinking on the EHS, with a shift in emphasis towards enlarging, connecting and enhancing certain valuable conservation areas. These areas, such as large existing wetlands, form the ecological strongholds of biodiversity and they are also connected to similar areas elsewhere (via ‘climate adaptation zones for wetlands, and dunes and coastal ecosystems), as well as areas within clusters with a high density of nature sites (heathland, forests). The climate resilience of these areas can be increased further by linking them to the European Natura 2000 network in neighbouring countries. In addition, climate-proofing nature conservation policy will require a revision of the conservation objectives. Because the current conservation objectives are defined in static terms, the chances of achieving these objectives under increasing climate change will recede, as will the likelihood that the Netherlands will meet its international obligations.
• The geographical location of the Netherlands also confers some opportunities:
− The main opportunities are for certain sectors like agriculture and recreation. The sectors themselves will have to exploit these opportunities in the decades to come. Acquiring further knowledge about the consequences of climate change can help them to exploit these opportunities and become more climate-resilient.
− At local and regional scales, too, there are many opportunities for making cost-effective improvements to climate resilience while at the same time raising environmental quality. These include interventions in both urban areas (new development and urban restructuring) and rural areas (area development). Such measures will have to be identified early in the planning and design process and will require innovative and flexible financing mechanisms (PBL, 2011).

17
FULL
RES
ULT
S
FULL RESULTS

18
ON
E
| The effects of Climate Change in the Netherlands: 2012
Introduction
1.1 Background
The climate is changing all around the world. This has numerous potential consequences for people and the environment: some negative, some positive. The effects of climate change are caused by gradual changes in climatic conditions as well as changes in climatic and weather extremes, such as droughts, heavy precipitation and heat waves. In a recent report the IPCC (Intergovernmental Panel on Climate Change) pays special attention to these extreme events and their potential consequences for different regions of the world (IPCC, 2012). Studies have also been conducted into the changes in the climate of Europe, what the consequences of these changes might be and how we can adapt to these consequences (EEA, 2008, 2010; Ciscara et al., 2010, Climate-Adapt1). Changes in the climate can also be observed in the Netherlands, and these will have a range of consequences for the environment and for society.
1.2 Update: effects of climate change in the Netherlands and the policy response
In 2005, PBL Netherlands Environmental Assessment Agency published a study summarising the knowledge available at that time about climate change and its consequences for the Netherlands (MNP, 2005). Since then the scientific understanding of climate change and
its effects has increased. Moreover, various policy communities have become aware of climate change and the effects it will have, both positive and negative. This is reflected in the interdepartmental programme on Spatial Adaptation to Climate Change (2006–2010) and the Delta Programme (from 2010). The 2012 study by PBL, prepared in collaboration with various research institutes in the Netherlands, updates the previous PBL study: what do we know now that we did not know in 2005 about climate change in the Netherlands, what effects are now more or less observable, and are there new insights into the risks and opportunities of climate change?
The present report is an extended summary of the Dutch report.2
1.3 Structure of the report
In this report, PBL describes the latest insights into the effects of climate change in the Netherlands. When describing the projected changes in climate for the coming decades it differentiates between those based on the KNMI’06 scenarios and on other, more extreme, worst-case scenarios. The KNMI’06 scenarios describe the range of most likely climate changes in future. The other, worst-case, scenarios such as the one prepared by the Delta Commission, are used to explore the upper and lower limits of possible changes, because these conditions are the ones that often have major impacts (e.g. peak river discharges).

19Introduction |
ON
E
ONE
|
Chapter 2 provides an update on the observed and projected climate change in the Netherlands based on the latest scientific understanding. It pays special attention to climate and weather extremes, because these determine many of the risks involved.
The subsequent chapters examine these effects, positive as well as negative. In all chapters we consider the observed trends as well as possible future changes. Chapter 3 looks at flood safety and freshwater supplies, an issue of particular relevance to the lower lying parts of the Netherlands and the Rhine-Meuse floodplain. This chapter also examines flood and drainage risks, the probability of droughts and the question of water quality – topics of relevance for the whole country. Chapters 4 to 7 cover the effects of climate change on ecosystems and biodiversity, agriculture, human health, and tourism and recreation. Finally, Chapter 8 assesses the degree to which the risks and opportunities of climate change are embedded in the relevant government policies.
Notes1 Climate-adapt.eea.europe.eu.
2 See http://www.pbl.nl/publicaties/2012/
effecten-van-klimaatverandering-in-nederland-2012.

20
TWO
| The effects of Climate Change in the Netherlands: 2012
How is the Dutch climate changing?
2.1 Introduction
In this chapter we describe how the climate system works, what is known about the observed changes in the climate, how these recent observations relate to those in the past, and the possible future trends. The emphasis is on the Netherlands as a whole and, where possible, on regional changes in the Netherlands.
2.2 The climate system
The earth’s climate is determined by various processes operating in the atmosphere and the ocean and on the ice masses and the land. Although in recent years considerable progress has been made in understanding how the climate system works (see also KNMI, 2011; IPCC, 2011), we may never fully understand it. This adds to the uncertainties surrounding climate change and its consequences.
By far the biggest factor determining the earth’s climate is shortwave solar radiation, which itself is influenced by cloud cover, dust particles and greenhouse gases in the atmosphere. Of the remaining 70% of the solar radiation, about a third is absorbed by the atmosphere and two-thirds by the earth’s surface, warming both the atmosphere and the earth’s surface. The longwave radiation this generates at the earth’s surface is partly absorbed by ‘gases’ in the atmosphere. As a
consequence, the surface temperature of the earth is higher than if these gases were not present. This is the natural greenhouse effect. Without the greenhouse effect the surface temperature of the earth would be -18 °C. The naturally occurring greenhouse gases increase the temperature to about 15 °C, making them crucial for the existence of life on earth as we know it (KNMI, 2011). These ‘gases’ are water vapour, carbon dioxide (CO2), methane, nitrous oxide, ozone, CFCs (chlorofluorocarbons), several sulphur compounds and dust particles.
2.3 Climate change over the past 150 years: global
It is now getting warmer almost everywhere on earth (IPCC, 2007; WMO, 2012). At the end of 2011 the average temperature of the earth’s surface was 0.8 °C higher than around the beginning of the previous century (Figure 2.1), and eleven of the twelve hottest years recorded during the past 150 years were in the last twelve years. A trend analysis of the global temperature shows that, on average, the temperature is still rising. This trend has continued since 2000, although the annual increase is less than it was around 1995 (CBS et al., 2012a). In addition, the warming effect is not the same all around the globe; the greatest warming above land masses has taken place in the northern hemisphere, and there is considerable variability in warming around the world (WMO, 2012).

21How is the Dutch climate changing? |
TWO
TWO
|
There are also indications that climate extremes around the world have been changing since 1950 (IPCC, 2011). Cold periods have become less frequent, and heat waves, droughts and heavy rainfall have become more frequent. No trends have been detected in the frequency and severity of heavy storms and tornados, or of climate-related floods (IPCC, 2011).
Like the temperature, the CO2 concentration in the atmosphere has risen sharply over the past 150 years. Whereas over the past 800,000 years the concentration has varied between about 180 and 280 ppm1 (Lüthi et al., 2008), in the last 150 years it has risen to 389 ppm at the end of 2010 and 391 ppm at the end of 2011 (NOAA/ESRL, 2011). This rise is mainly the result of CO2 emissions from industrial development and deforestation.
The causes of recent climate changeA considerable amount of research is being undertaken into the causes of climate change. It has been shown that the fluctuations in climate observed in the 20th century can be explained by a combination of natural and anthropogenic causes (KNMI, 2011). In general, there are three main natural causes underlying the year-to-year fluctuations and the variability over a period of decades1: violent volcanic eruptions, variations in solar activity and El Niño phenomena (IPCC, 2007; PCCC, 2010; KNMI, 2011). These three natural causes explain much of the upward
trend in temperatures at the beginning of the 20th century (Van Ulden and Van Dorland, 2000; Van Dorland, 2006). They also contribute to the trend of climate change as observed in recent decades, although this trend is primarily caused by human activity (IPCC, 2007; PCCC, 2010; Foster and Rahmstorf, 2011). The precise size of this anthropogenic contribution is still being investigated.
2.4 Observed climate change in the Netherlands
Temperature rising faster in the Netherlands than globallyThe temperature in the Netherlands is determined by a combination of heat from the sun and the temperature of the North Sea. The average annual temperature across the Netherlands is now about 10 °C (KNMI, 2011).
Even though 2010 was the coldest year in the Netherlands since 1996 (PCCC, 2011), the multi-year average temperature in the Netherlands is still rising (Van der Schrier et al., 2011). The Netherlands is now on average 1.7 °C, plus or minus 0.5 °C, warmer than a century ago (PCCC, 2009; Van der Schrier et al., 2011; CBS et al., 2012a) (Figure 2.1). Most of the top ten hottest years since
Figure 2.1
1900 1920 1940 1960 1980 2000 2020
-2
-1
0
1
2Deviations from the 1961 – 1990 average (°C)
Annual average
Trend
Trend uncertainty
Globe
Average annual temperature
1900 1920 1940 1960 1980 2000 2020
-2
-1
0
1
2Deviations from the 1961 – 1990 average (°C)
Netherlands
Source: CBS et al. (2012a)

22 | The effects of Climate Change in the Netherlands: 2012
TWO
records began in the Netherlands in 1901 are recent years, 2006 and 2007 being the hottest years on record (average 11.2 °C) (KNMI, 2008a, 2011).
The temperature in the Netherlands is continuing to rise (Figure 2.1). Many natural factors that influence the global temperature, such as El Niño and La Niña, have a limited effect on the temperature in the Netherlands, which is determined much more by changes in air circulation patterns in the region and by the temperature of the North Sea. Since 1950, the temperature in the Netherlands, as in other parts of Western Europe, has risen by twice as much as the global average (KNMI, 2008a; Van Oldenborgh et al., 2009) (Figure 2.1). The more rapid warming in this part of the world can be explained by the fact that land masses in general warm up more quickly than the global average (because oceans warm up more slowly). The Netherlands, like other parts of Western Europe, is also experiencing more westerly and south-westerly winds in late winter and early spring, less cloud cover, rising temperatures in the North Sea and an increase in the amount of sunshine (due to cleaner air) in spring and summer (KNMI, 2008a).
The warming in the Netherlands is noticeable in all seasons, but differs in degree and timing across the seasons due to the natural vagaries of the Dutch climate.
Neither is each season equally average or extreme. For example, the summer of 2006 was very hot (with heat waves in June and July), whereas the winter of 2006 was cold. This volatility is a natural variability that has little to do with long-term climate change. Nevertheless, the differences in temperature rise between the seasons appear to follow a trend. The increase is highest in the spring, at 1.8 °C plus or minus 0.7 °C over the past 60 years and more than 2 °C over the past 100 years (CBS et al., 2012a). Moreover, every spring since 1988 – with the exception of 1996 – has been hotter than average (KNMI, 2008a), with consequences for nature in the Netherlands.
The increase in temperature in the Netherlands means that warm and hot days now occur earlier in the year (KNMI, 2011). The first warm day (with a maximum temperature of 20 °C or more) occurs five to ten days earlier in the year than fifty years ago (see Figure 2.2). This shift is bigger along the coast than further inland, probably because of the rise in the temperature of the seawater. It should be noted here that the timing of the first warm day is subject to considerable variability across the country: on average it occurs fifteen days earlier in the south-east of the country than in the north-west.
Figure 2.2First warm day per year
DagnummerDagnummer
1951 – 1980 1981 – 2010
10 April20 April
30 April10 May
First day with maximum temparatures of 20 °C or higher
Source: KNMI (2011)
23How is the Dutch climate changing? |
TWO
TWO
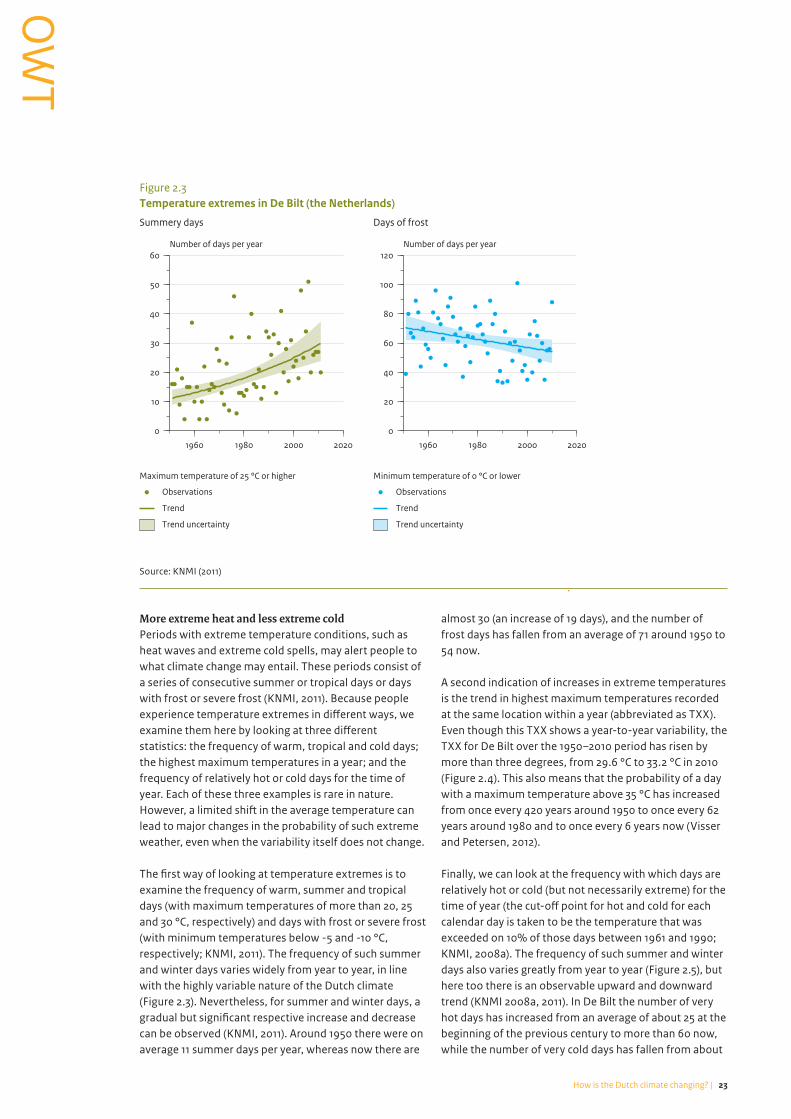
More extreme heat and less extreme coldPeriods with extreme temperature conditions, such as heat waves and extreme cold spells, may alert people to what climate change may entail. These periods consist of a series of consecutive summer or tropical days or days with frost or severe frost (KNMI, 2011). Because people experience temperature extremes in different ways, we examine them here by looking at three different statistics: the frequency of warm, tropical and cold days; the highest maximum temperatures in a year; and the frequency of relatively hot or cold days for the time of year. Each of these three examples is rare in nature. However, a limited shift in the average temperature can lead to major changes in the probability of such extreme weather, even when the variability itself does not change.
The first way of looking at temperature extremes is to examine the frequency of warm, summer and tropical days (with maximum temperatures of more than 20, 25 and 30 °C, respectively) and days with frost or severe frost (with minimum temperatures below -5 and -10 °C, respectively; KNMI, 2011). The frequency of such summer and winter days varies widely from year to year, in line with the highly variable nature of the Dutch climate (Figure 2.3). Nevertheless, for summer and winter days, a gradual but significant respective increase and decrease can be observed (KNMI, 2011). Around 1950 there were on average 11 summer days per year, whereas now there are
almost 30 (an increase of 19 days), and the number of frost days has fallen from an average of 71 around 1950 to 54 now.
A second indication of increases in extreme temperatures is the trend in highest maximum temperatures recorded at the same location within a year (abbreviated as TXX). Even though this TXX shows a year-to-year variability, the TXX for De Bilt over the 1950–2010 period has risen by more than three degrees, from 29.6 °C to 33.2 °C in 2010 (Figure 2.4). This also means that the probability of a day with a maximum temperature above 35 °C has increased from once every 420 years around 1950 to once every 62 years around 1980 and to once every 6 years now (Visser and Petersen, 2012).
Finally, we can look at the frequency with which days are relatively hot or cold (but not necessarily extreme) for the time of year (the cut-off point for hot and cold for each calendar day is taken to be the temperature that was exceeded on 10% of those days between 1961 and 1990; KNMI, 2008a). The frequency of such summer and winter days also varies greatly from year to year (Figure 2.5), but here too there is an observable upward and downward trend (KNMI 2008a, 2011). In De Bilt the number of very hot days has increased from an average of about 25 at the beginning of the previous century to more than 60 now, while the number of very cold days has fallen from about
Figure 2.3
1960 1980 2000 2020
0
10
20
30
40
50
60Number of days per year
Maximum temperature of 25 °C or higher
Observations
Trend
Trend uncertainty
Summery days
Temperature extremes in De Bilt (the Netherlands)
1960 1980 2000 2020
0
20
40
60
80
100
120Number of days per year
Minimum temperature of 0 °C or lower
Observations
Trend
Trend uncertainty
Days of frost
Source: KNMI (2011)

24 | The effects of Climate Change in the Netherlands: 2012
TWO
45 to 15 (Figure 2.5). Temperature extremes are more common inland than on the coast due to the moderating influence of the sea. Over the past 30 years there has been a similar, but more pronounced trend for summer days (Van der Schrier et al., 2009).
Increase in precipitation, particularly on the coast, and in the intensity of precipitationIn the Netherlands it rains on average 8% of the time, in winter slightly more than in summer (KNMI, 2011). This average varies greatly from year to year and from place to place. For example, the extreme precipitation amount in parts of the province of Zuid-Holland is 14% higher than
Figure 2.4
1950 1960 1970 1980 1990 2000 2010 2020
25
30
35
40ºC
Observations
Trend
Trend uncertainty
Maximum day temperatures in a single year in De Bilt (the Netherlands)
Source: Visser and Petersen (2011)
Figure 2.5
1900 1920 1940 1960 1980 2000 2020
0
20
40
60
80
100
120Number of days per year
Number of days on which the average daily temperature (per calendar year) was among the 10% of warmest or coldest years
Observations
Trend
Warm days
Relatively warm and cold days in De Bilt (the Netherlands)
1900 1920 1940 1960 1980 2000 2020
0
20
40
60
80
100
120Number of days per year
Cold days
Source: KNMI (2008, 2011)

25How is the Dutch climate changing? |
TWO
TWO
in De Bilt (Buishand et al., 2009; KNMI, 2009a). Moreover, in some years there is relatively little precipitation (e.g. just 483 mm in Kornwederzand in 2003) and other years are extremely wet (the highest ever total precipitation recorded so far was 1,374 mm in Schellingwoude in 1998) (KNMI, 2011). Within-year variability can also be large. This variability in precipitation is caused by a series of factors, such as wind direction, temperature and humidity. Wet years are often accompanied by more westerly winds from the sea in combination with warming seawater (Lenderink and Van Meijgaard, 2008).
The changes in precipitation also follow a trend in the Netherlands. Annual precipitation is now about 850 mm. This is more than 20% higher than a century ago, when annual precipitation levels were around 700 mm (Figure 2.6) (KNMI, 2011; CBS et al., 2012b). This increase has occurred mainly in the winter (+26%), while the amount of precipitation in the summer has changed by just 5% (KNMI, 2006, 2011). Moreover, precipitation amounts have increased more in the coastal zone (by 30% to 35%) than further inland (10% to 25%) (KNMI, 2011; Buishand et al., 2009). This is probably due to the warmer North Sea water, which leads to the formation of more clouds above the sea, which in turn can cause heavier showers, particularly along the coast.
Although more precipitation falls in winter, the number of days with snowfall has decreased since the 1980s. The only winter with the highest number of days with snowfall (42) since the winter of 1978–1979 was the winter of 2009–2010 (KNMI, 2011). The rising temperatures mean
that precipitation falls more often as rain and less as snow.
Heavy showers (with more than 50 mm precipitation) can cause local flooding, restricted visibility and damage to buildings, agriculture and horticulture. The frequency of these types of rainfall events has increased since the last century (Figure 2.7; Van der Schrier et al., 2009; KNMI, 2011), mainly in winter (KNMI, 2008) and mainly in the western part of the country (Figure 2.8; Van der Schrier et al., 2009; KNMI, 2011). The highest 10-day precipitation total per winter has risen by 29% since 1906 (KNMI, 2006). The observed rise in extreme (winter) precipitation can be explained mainly by an increase in the amount of precipitation on already rainy days. In recent summers there have also been more days with heavy rain than a century ago. The highest number – 11 days with heavy rainfall – was recorded in the summer of 2006. But averaged over the country the observed rise is small in relation to the differences between years and is statistically not significant.
Drought: no visible trendDrought occurs when evapotranspiration exceeds the amount of water available in the soil. Drought can occur in periods with high levels of evapotranspiration and/or little precipitation over an extended period. A commonly used indicator of drought is the (maximum) precipitation deficit: precipitation minus potential evapotranspiration over a period from 1 April to 30 September (KNMI, 2010). An absence of precipitation in spring may lead to a precipitation deficit early in the year, as was the case in the spring of 2011. If the precipitation deficit persists, it
Figure 2.6
1900 1920 1940 1960 1980 2000 2020
0
200
400
600
800
1000
1200mm per year
Observations
Trend
Trend uncertainty
Precipitation in the Netherlands
Source: KNMI (2011); CBS et al. (2012b)

26 | The effects of Climate Change in the Netherlands: 2012
TWO
Figure 2.7
1950 1960 1970 1980 1990 2000 2010
0
4
8
12
16Number of days per year
Days with 50 mm of precipitation or more in the Netherlands
Source: KNMI (2011)
Figure 2.8Number of days per year with 10 mm of precipitation or more
DagnummerDagnummer
1951 – 1980 1981 – 2010
Number of days
18 22 26 3016 20 24 28
Source: KNMI (2011); Van der Schrier et al. (2009)
27How is the Dutch climate changing? |
TWO
TWO
may also contribute to the occurrence of a drought period in the following summer. This happened in the record years of 1976 and 2003 (KNMI, 2010 and 2011).
The maximum precipitation deficit in the Netherlands varies per region. In the coastal zone the precipitation deficit in spring and early summer is usually larger than in the rest of the country, whereas the situation is reversed in late summer and autumn (KNMI, 2008b, 2010). These regional differences arise because in spring there is often less cloud cover in the coastal areas than further inland. As a result there is less rainfall along the coast, the sun shines more often and more water evaporates. In the autumn the warming seawater generates more cloud cover and showers near the coast.
Despite the rising temperatures, there has as yet (between 1906 and 2011) been no perceptible trend in the average maximum precipitation deficit in the Netherlands, and therefore also in the occurrence of drought (KNMI, 2010, 2011; PCCC, 2011). This because such periods are uncommon. The year 2011 had the driest spring on record, with a precipitation deficit in April and May of 135 mm (the normal deficit at the end of May is about 50 mm) (PCCC, 2011), but the previous big precipitation deficit was in 1976 – and in 2011 the dry spring was more than compensated by a wet summer.
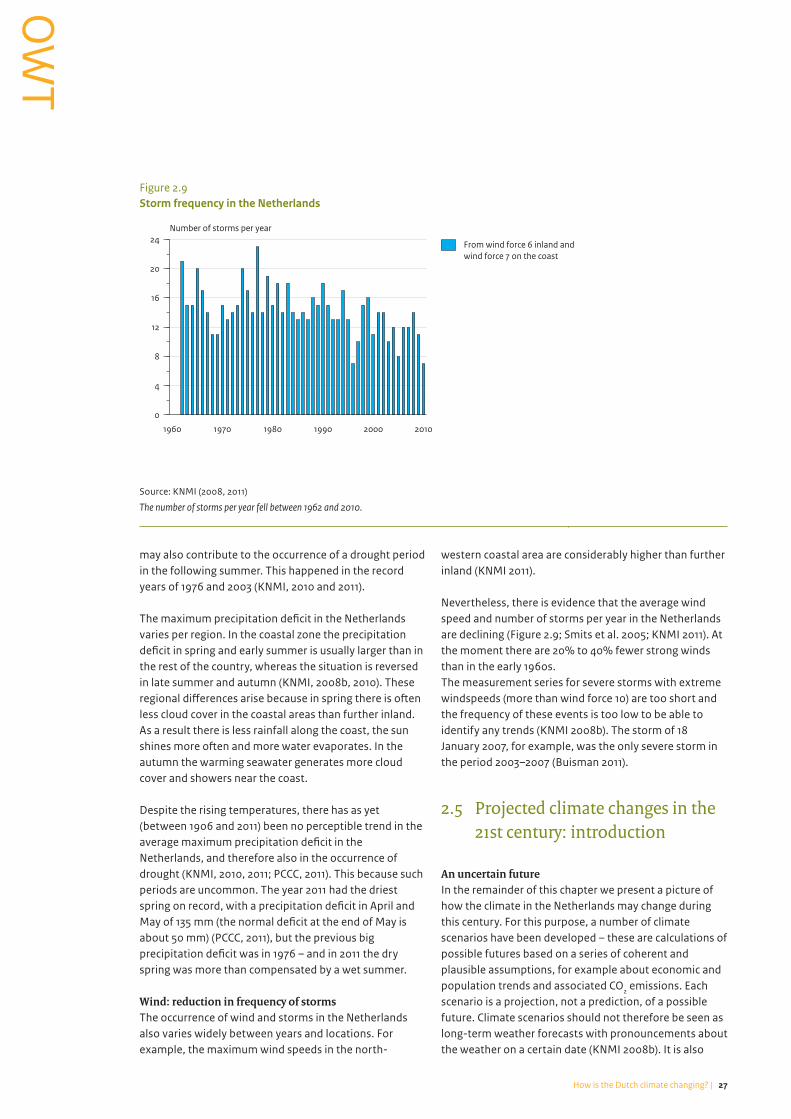
Wind: reduction in frequency of stormsThe occurrence of wind and storms in the Netherlands also varies widely between years and locations. For example, the maximum wind speeds in the north-
western coastal area are considerably higher than further inland (KNMI 2011).
Nevertheless, there is evidence that the average wind speed and number of storms per year in the Netherlands are declining (Figure 2.9; Smits et al. 2005; KNMI 2011). At the moment there are 20% to 40% fewer strong winds than in the early 1960s.The measurement series for severe storms with extreme windspeeds (more than wind force 10) are too short and the frequency of these events is too low to be able to identify any trends (KNMI 2008b). The storm of 18 January 2007, for example, was the only severe storm in the period 2003–2007 (Buisman 2011).
2.5 Projected climate changes in the 21st century: introduction
An uncertain futureIn the remainder of this chapter we present a picture of how the climate in the Netherlands may change during this century. For this purpose, a number of climate scenarios have been developed – these are calculations of possible futures based on a series of coherent and plausible assumptions, for example about economic and population trends and associated CO2 emissions. Each scenario is a projection, not a prediction, of a possible future. Climate scenarios should not therefore be seen as long-term weather forecasts with pronouncements about the weather on a certain date (KNMI 2008b). It is also
Figure 2.9
1960 1970 1980 1990 2000 2010
0
4
8
12
16
20
24Number of storms per year
From wind force 6 inland andwind force 7 on the coast
Storm frequency in the Netherlands
Source: KNMI (2008, 2011)
The number of storms per year fell between 1962 and 2010.

28 | The effects of Climate Change in the Netherlands: 2012
TWO
important to realise that any changes in the future are uncertain. Moreover, there are limits to the predictability of complex systems like the climate. Climate projections for small regions, such as the Netherlands, or even Western Europe, are more uncertain than projections for the world as a whole because in such small regions factors like air circulation play an important role.
2.6 Projected climate changes in the 21st century in the Netherlands
In this section we summarise current understanding about possible future changes in the climate in the Netherlands (see Figure 2.10).
In 2007 the IPCC presented a number of global climate scenarios. These do not provide sufficiently detailed information to describe the potential change in climate in a small area like the Netherlands. To fill this gap, in 2006 the Royal Netherlands Meteorological Institute (KNMI) developed four regional climate scenarios for the Netherlands and surrounding areas. These four scenarios
(the KNMI’06 scenarios) give information about changes in average and extreme temperatures, precipitation, evapotranspiration, winds and sea level around 2050 and 2100 (Figure 2.10). The KNMI’06 scenarios are based on different assumptions regarding global temperature rise (moderate: G; warm: W) and changes in air circulation patterns in the region (Western Europe) and the associated prevailing wind direction (Figure 2.11). The scenarios are based on a large number of climate models, several socioeconomic scenarios and historical measurement records. The KNMI’06 scenarios are consistent with the global climate scenarios developed by the IPCC (KNMI 2006; Van den Hurk et al. 2006; Figure 2.12). In 2009 the KNMI’06 scenarios were updated with more detailed information (KNMI 2009a).
Because the KNMI’06 scenarios draw on several climate models and emission scenarios, they are able to cover many of the uncertainties; they draw on current knowledge to describe the range of most likely future changes in the climate (KNMI 2009a). Nevertheless, there is a chance that the actual future climate change will lie outside this range, which means that the changes could be either more extreme or less pronounced. The need to
Figure 2.10Possible climate changes for the 1990 – 2100 period, according to KNMI’06 scenarios
Dry periods+7 to +30%Potential evaporation
Wet periodsTen-day precipitation total that will be exceeded once every 10 years: Winter: +8% to +24%
Sea level at Dutch coast+35 to +85 cm
Average annual temperature+1.8 to +5.1 oC
River dischargesRiver Rhine average in winter: +12% to +27%River Rhine average in summer: -41% to +1% River Rhine extremely high discharges: 4 to 40 times more o�en
Annual precipitationFrom -5% to +6%
-+
Source: KNMI (2008, 2009a); Kwadijk et al. (2008)

29How is the Dutch climate changing? |
TWO
TWO
take such extreme climate scenarios into account depends on the type of analysis. For example, studies on climate-proofing the Netherlands may need to consider such extreme scenarios because the resulting damage can be serious, even though the probability of such extreme scenarios actually occurring is small. For these reasons, other organisations have developed more extreme projections of possible climate change and sea level rise to supplement, but not replace, the KNMI’06 scenarios.
Average temperature in the Netherlands continues to riseThe KNMI’06 scenarios indicate that the average annual temperature in the Netherlands will have risen by between 0.9 and 2.6 °C by around 2050 (Table 2.1) and by between 1.8 and 5.1 °C by around 2100 (Table 2.2) compared with the climate around 1900. In the scenarios in which the air circulation patterns change (G+/W+), the warming effect will be stronger in the summer months than in the winter months; this is reversed in the scenarios without any changes in air circulation patterns (Table 2.1, Table 2.2, Figure 2.13). At the moment it is not
Figure 2.11Overview of KNMI'06 scenarios
Atmospheric circulation pa�erns
Unchanged
Changed
Global temperature in 2050 compared to 1990
+10C +20C
G+scenario
W+scenario
Gscenario
Wscenario
Source: KNMI (2011)
Figure 2.12
2000 2020 2040 2060 2080 2100
0
2
4
6
8Change compared to 1850 (°C)
Per scenario
Uncertainty across all scenarios
Range of KNMI'06 scenarios
Delta Commission scenario (2008)
Global temperature change
2 °C target
Source: PBL (2009)

30 | The effects of Climate Change in the Netherlands: 2012
TWO
Figure 2.13
1900 1940 1980 2020 2060 2100
-4
-2
0
2
4
6
8°C
Obervations
Moving average (30 years)
G scenario
G+ scenario
W scenario
W+ scenario
Winter
Temperatures in De Bilt (the Netherlands)
1900 1940 1980 2020 2060 2100
12
14
16
18
20
22
24°C
Summer
Source: KNMI (2006)
In the G and W scenarios, temperatures increases more than in winter than in summer, while in the G+ and W+ scenarios this is the other way round
Table 2.1Climate change in the Netherlands around 2050 relative to the climate around 1990 according to the four KNMI’06 scenarios
2050 G G+ W W+
Global temperature rise +1 °C +1 °C +2 °C +2 °C
Change in air circulation patterns No Yes No Yes
Average annual Average temperature +0.9 °C +1.2 °C +1.8 °C +2.6 °C
Average precipitation amount +3% -1% +6% -2%
Reference evapotranspiration +2% +5% +5% +9%
Winter Highest daily average windspeed occurring 1x per year
0% +2% -1% +4%
Average temperature +0.9 °C +1.1 °C +1.8 °C +2.3 °C
Coldest winter day per year +1.0 °C +1.5 °C +2.1 °C +2.9 °C
Average precipitation amount +4% +7% +7% +14%
Number of wet days (≥0.1 mm) +0% +1% +0% +2%
10-day precipitation total exceeded once every 10 years
+4% +6% +8% +12%
Summer Average temperature +0.9 °C +1.4 °C +1.7 °C +2.8 °C
Hottest summer day per year +1.0 °C +1.9 °C +2.1 °C +3.8 °C
Average precipitation amount +3% -10% +6% -19%
Number of wet days (≥0.1 mm) -2% -10% -3% -19%
Daily precipitation total exceeded once every 10 years
+13% +5% +27% +10%
Reference evapotranspiration +3% +8% +7% +15%
Source: KNMI (2006, 2009a); calculation of annual statistics by PBL

31How is the Dutch climate changing? |
TWO
TWO
possible to indicate whether the temperature change will vary across the Netherlands. Differences in warming can already be seen across the country and these are expected to persist (KNMI 2009a).
Temperature extremes: more extreme heat, less extreme cold The four KNMI’06 scenarios indicate that the expected hot extremes may increase (Figure 2.14), whereas the expected cold extremes may decrease; this is especially the case in the G+ and W+ scenarios. Around De Bilt, for example, it is expected that the number of tropical days (days with a maximum temperature of 30 °C or higher) will rise from 4 per year around 1990 to 7–15 per year around 2050, and to 10–33 per year around 2100 (depending on the scenario). One of the causes of more periods of extreme high temperatures in the summer is a reduction in precipitation. This increases the chances of the soil drying out, which in turn reduces the cooling effect of evapotranspiration (KNMI 2011). The rise in summer temperatures is greatest in the G+ and W+ scenarios because easterly winds are more frequent in these scenarios, and these winds are usually warm. In the W+ scenarios in particular, a summer like that of 2003 could almost be normal around 2050 (KNMI 2008b, 2009b).
At the same time, in all the scenarios the number of ice days around De Bilt declines from 9 per year around 1990 to between 3 and 6 around 2050 to between 1 and 4 per year by the end of this century. Even in a warming climate, consecutive years with cold winters will remain possible, although this will occur less often. In the Netherlands, cold winters are caused mainly by (extended) periods with north-easterly winds, which bring cold air to the Netherlands, whereas in most winters the prevailing winds come from the south-west, bringing mild air from the Atlantic Ocean. The decline in the occurrence of extremely cold winters is smallest in the G scenario and largest in the W+ scenario (in the G+ and W+ scenarios winter winds come mainly from the south-west). All in all, this means that, according to the KNMI’06 scenarios, heat waves will be more frequent and the probability of a winter cold enough for an Eleven Cities ice skating race (Elfstedentocht) to be held will decline, but will still remain a possibility (Visser and Strengers 2010).
Precipitation in winter expected to rise; the situation in summer is unclearClimate change may also result in large changes in precipitation and extreme precipitation around the world. How precipitation in the Netherlands may change during this century depends heavily on changes that may or may not occur in the air circulation patterns (see Table
Table 2.2Climate change in the Netherlands around 2100 relative to the climate around 1990 according to the four KNMI’06 scenarios
2100 G G+ W W+
Global temperature rise +2 °C +2 °C +4 °C +4 °C
Change in air circulation patterns No Yes No Yes
Average annual Average temperature +1.8 °C +2.5 °C +3.5 °C +5.1 °C
Average precipitation amount +6% -2% +13% -4%
Reference evapotranspiration +6% +12% +12% +24%
Winter Highest daily average windspeed occurring 1x per year
-1% +4% -2% +8%
Average temperature +1.8 °C +2.3 °C +3.6 °C +4.6 °C
Coldest winter day per year +2.1 °C +2.9 °C +4.2 °C +5.8 °C
Average precipitation amount +7% +14% +14% +28%
Number of wet days (≥0.1 mm) +0% +2% +0% +4%
10-day precipitation total exceeded once every 10 years
+8% +12% +16% +24%
Summer Average temperature +1.7 °C +2.8 °C +3.4 °C +5.6 °C
Hottest summer day per year +2.1 °C +3.8 °C +4.2 °C +7.6 °C
Average precipitation amount +6% -19% +12% -38%
Number of wet days (≥0.1 mm) -3% -19% -6% -38%
Daily precipitation total exceeded once every 10 years
+27% +10% +54% +20%
Reference evapotranspiration +7% +15% +14% +30%
Source: KNMI (www.knmi.nl/klimaatscenarios/knmi06/samenvatting), calculation of annual statistics by PBL

32 | The effects of Climate Change in the Netherlands: 2012
TWO
Figure 2.14Number of summery days per year
Number of days with a maximum temperature of25 °C or higher
W+ scenario 2100W+ scenario 2050
G scenario 2100G scenario 2050
1981 – 2010
100
92
84
76
68
60
52
44
36
28
20
12
4
Source: KNMI (2009b)Average number of summery days per year (maximum temperature ≥ 25 °C) in the period 1981–2010 and around 2050 (left) and 2100 (right) in the G scenario (middle) and the W scenario (bottom). These two scenarios illustrate the full range of changes across the KNMI’06 scenarios.

33How is the Dutch climate changing? |
TWO
TWO
2.1 and 2.2; Lenderink and Van Meijgaard 2008). If the air circulation patterns remain the same, the average annual precipitation in the Netherlands is projected to rise by between 3% and 6% by 2050 and by between 6% and 13% by 2100. If the air circulation patterns do change, this could lead to a reduction in annual precipitation of between 1% and 2% by around 2050, and to a reduction of between 2% and 4% by around 2100 (KNMI 2009b).
This uncertainty is due mainly to the uncertainty surrounding the changes in summer precipitation. The Netherlands lies in a transitional zone. Climate models indicate that summer precipitation in the areas to the north of the Netherlands may rise and in the areas to the south of the Netherlands may fall. A change in air circulation in which more air flows to the Netherlands from the east or south-east during the summer can lead to a decrease in summer precipitation. If the air circulation patterns do not change, a (slight) increase is possible (Table 2.1 and 2.2). All four KNMI’06 scenarios give an increase in precipitation in winter (Table 2.1 and 2.2). In addition, in all the scenarios there is a likelihood of fewer precipitation days in the summer. This is also the case in the scenarios in which the total summer precipitation rises (G and W scenarios).
Again, it is not possible to identify any spatial variation in the possible changes in precipitation, except for extreme precipitation events in the summer. This is because of the spatial resolution of climate models and our limited understanding of the climate system.
The severity of rainfall is expected to increase, particularly in coastal regionsIn all four KNMI’06 climate scenarios the severity of heavy rainfall events increases in all seasons, including the summer (Figure 2.15; KNMI 2009b, 2011). For example, the daily summer precipitation that occurs once every ten years will increase by between 10% (G+) and 54% (W) by 2100 (Table 2.1; Table 2.2). Increasing severity of summer
precipitation is therefore also possible in the scenarios in which the average summer precipitation and the number of days with rain are expected to decrease (G+ and W+ scenarios) (KNMI 2009b). This increase in extreme precipitation is possible because as air warms up it holds more water vapour (KNMI 2009a) and so when it rains, the rainfall can be heavier, which may in turn lead to an increas in water drainage floods (see Chapter 3).
The scenarios show different possible changes in extreme precipitation in each of the seasons. The scenarios in which the air circulation patterns do not change (G and W scenarios) show the greatest increase in rainfall intensity in summer (Table 2.3). This increase is larger than the changes in average precipitation. The possible increase in winter is largest in the scenarios in which the air circulation patterns change (G+ and W+ scenarios) (Table 2.1 and 2.2). The severity of heavy showers over extended periods (e.g. the 10-day winter precipitation total) may then increase by more or less as much as the average winter precipitation (KNMI 2009a). This can have an important effect on river discharges, for example in the Rhine.
Protected extreme precipitation in summer is one of the few climate variables for which a spatial differentiation can be given for the possible changes in future (KNMI 2009b). This is because of the influence of the North Sea. The higher temperatures will cause more evaporation from the North Sea and this moisture will be carried westwards with the air circulation and fall as rain in the Netherlands. The extreme precipitation in summer is therefore projected to increase more in the coastal regions of the country than further inland (KNMI 2009b). For the other seasons it is as yet unclear whether the changes will differ between regions.
Table 2.3Precipitation extremes (in mm) in De Bilt, today and projected for 2050, according to the four KNMI’06 scenarios
Precipitation period
1 hour 1 day 10 days
Recurrence interval
Present G G+ W W+ Present G G+ W W+ Present G G+ W W+
1 year 14 15 - 17 - 33 36 35 39 36 80 85 81 89 82
10 year 27 30 - 33 - 54 60 57 66 60 114 122 116 130 119
100 year 43 48 - 53 - 79 88 84 98 88 143 154 146 164 150
Source: KNMI (2009a)
The table must be read as in the following example: in the present climatic regime 43 mm of precipitation falls in one hour once every 100 years, and in 2050 in the W scenario 53 mm (+23%) falls in one hour once every 100 years.

34 | The effects of Climate Change in the Netherlands: 2012
TWO
Figure 2.15Number of days per year with 15 mm of precipitation or more
Number of days
W scenario 2100W scenario 2050
G+ scenario 2100G+ scenario 2050
1981 – 2010 20
1614
10
68
12
18
Source: KNMI (2009b)The number of days per year with 15 mm or more precipitation in the 1981–2010 period (top left) and around 2050 (left) and 2100 (right) in the moderate G+ scenario (middle) and the warm W scenario (bottom). The two scenarios illustrate the full range of changes across the KNMI’06 scenarios.
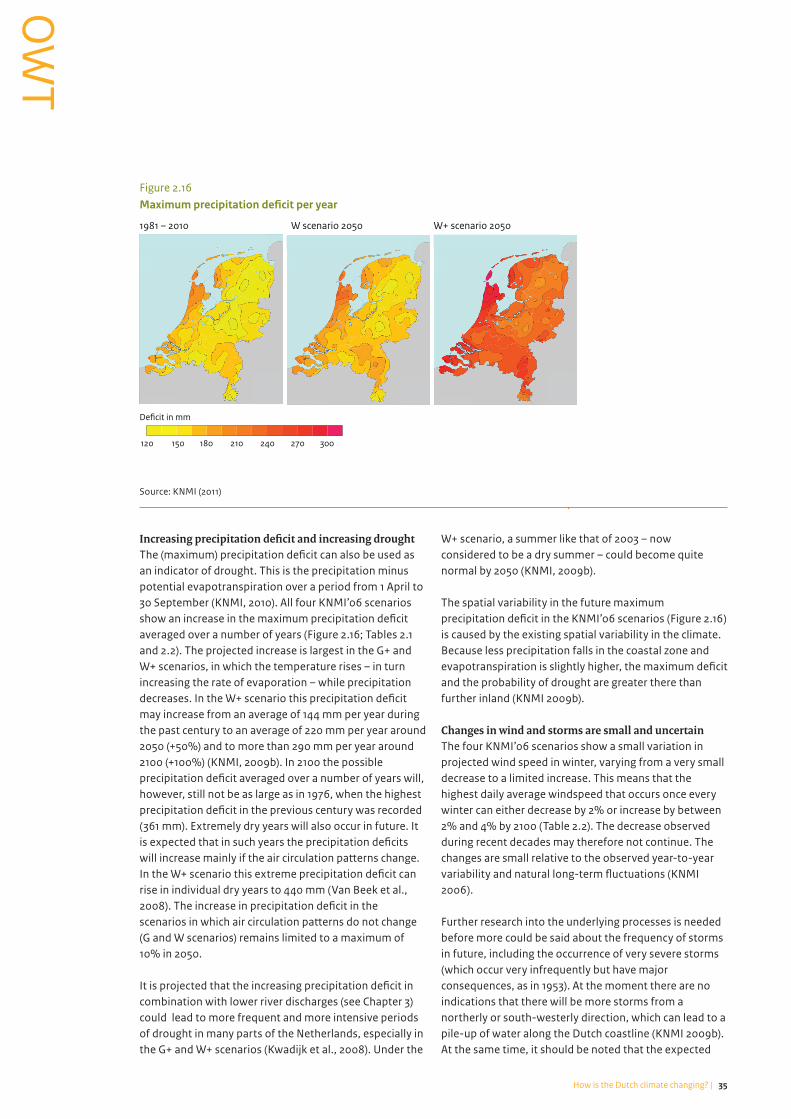
35How is the Dutch climate changing? |
TWO
TWO
Increasing precipitation deficit and increasing droughtThe (maximum) precipitation deficit can also be used as an indicator of drought. This is the precipitation minus potential evapotranspiration over a period from 1 April to 30 September (KNMI, 2010). All four KNMI’06 scenarios show an increase in the maximum precipitation deficit averaged over a number of years (Figure 2.16; Tables 2.1 and 2.2). The projected increase is largest in the G+ and W+ scenarios, in which the temperature rises – in turn increasing the rate of evaporation – while precipitation decreases. In the W+ scenario this precipitation deficit may increase from an average of 144 mm per year during the past century to an average of 220 mm per year around 2050 (+50%) and to more than 290 mm per year around 2100 (+100%) (KNMI, 2009b). In 2100 the possible precipitation deficit averaged over a number of years will, however, still not be as large as in 1976, when the highest precipitation deficit in the previous century was recorded (361 mm). Extremely dry years will also occur in future. It is expected that in such years the precipitation deficits will increase mainly if the air circulation patterns change. In the W+ scenario this extreme precipitation deficit can rise in individual dry years to 440 mm (Van Beek et al., 2008). The increase in precipitation deficit in the scenarios in which air circulation patterns do not change (G and W scenarios) remains limited to a maximum of 10% in 2050.
It is projected that the increasing precipitation deficit in combination with lower river discharges (see Chapter 3) could lead to more frequent and more intensive periods of drought in many parts of the Netherlands, especially in the G+ and W+ scenarios (Kwadijk et al., 2008). Under the
W+ scenario, a summer like that of 2003 – now considered to be a dry summer – could become quite normal by 2050 (KNMI, 2009b).
The spatial variability in the future maximum precipitation deficit in the KNMI’06 scenarios (Figure 2.16) is caused by the existing spatial variability in the climate. Because less precipitation falls in the coastal zone and evapotranspiration is slightly higher, the maximum deficit and the probability of drought are greater there than further inland (KNMI 2009b).
Changes in wind and storms are small and uncertainThe four KNMI’06 scenarios show a small variation in projected wind speed in winter, varying from a very small decrease to a limited increase. This means that the highest daily average windspeed that occurs once every winter can either decrease by 2% or increase by between 2% and 4% by 2100 (Table 2.2). The decrease observed during recent decades may therefore not continue. The changes are small relative to the observed year-to-year variability and natural long-term fluctuations (KNMI 2006).
Further research into the underlying processes is needed before more could be said about the frequency of storms in future, including the occurrence of very severe storms (which occur very infrequently but have major consequences, as in 1953). At the moment there are no indications that there will be more storms from a northerly or south-westerly direction, which can lead to a pile-up of water along the Dutch coastline (KNMI 2009b). At the same time, it should be noted that the expected
Figure 2.16Maximum precipitation de�cit per year
1981 – 2010 W scenario 2050 W+ scenario 2050
De�cit in mm
240210180150120 300270
Source: KNMI (2011)

36 | The effects of Climate Change in the Netherlands: 2012
TWO
water levels during storm surges will rise as a consequence of the projected rise in sea level (see Chapter 3).
Note1 In addition, the distance from and relative position to the
sun determine the cyclical changes in concentration over
centuries, millennia and longer.

37How is the Dutch climate changing? |
TWO

38
THRE
E
| The effects of Climate Change in the Netherlands: 2012
Effects on flood safety, water availability and water quality
3.1 Introduction
The Netherlands is a delta where four navigable rivers flow into the North Sea: the Rhine, Meuse, Scheldt and Ems. Water is ubiquitous in the Netherlands and water management has been a key factor in the country’s development. We have surrounded ourselves with dykes to protect the land from excess water and we have designed an extensive network of waterways, canals and ditches to manage the water and prevent flooding, watterlogging and drought. In the summer season we depend to a large extent on the Rhine for our supplies of fresh water.
The water management tasks are different in the higher and lower lying parts of the country. Many of these tasks come together in the lower lying parts of the country: protection against coastal, river and drainage flooding, drought, salinisation and water quality. In the higher lying parts of the country the main problems relating to climate change are water drainage flooding and drought. In this chapter we analyse problems relating to water in the light of climate change. We examine flood safety, water availability and water quality. We look back (what changes have already been observed?) and forward (what changes are projected for the future?). The outlook is based on the KNMI’06 scenarios (Chapter 2) and – where relevant – a few more extreme scenarios.
3.2 Flood safety
Almost 60% of the Netherlands is vulnerable to flooding (Figure 3.1; PBL, 2009). Fifty-five per cent of the country lies below sea level or along rivers, protected by dunes, coastal and river dykes; and 4% of the country lies outside the dykes and is not protected by any flood defences. Climate change can affect flood safety in these areas of the country in various ways. Important factors that can increase the risk and scale of flooding are sea level rise, either on its own or in combination with possible changes in the intensity of storms at sea, and a possible increase in peak river discharges. Extreme weather events are not necessary for these effects to occur. For example, in January 2012, a storm coinciding with high river discharges caused high water levels in, for instance, the Haringvliet and some flooding around the Drecht cities. If climate change leads to more frequent high river discharges, the probability of such events will increase, especially in combination with a rising sea level (Klijn et al., 2010).Additional flood protection measures will also be needed, because the size of the resident population and the value of the economic infrastructure in the flood-prone areas have increased considerably since the 1950s. It is expected that in the coming decades this problem will increase by two to three times, depending on the growth of the population and the economy (PBL, 2007, 2011; Te Linde et al., 2011). In the Delta Programme, calculations are being made to determine whether, and to what extent, flood safety policy should be amended to take

39Effects on flood safety, water availability and water quality |
THRE
E
THREE
|
account of the increasing potential economic damage and risk of casualties (Deltaprogramma, 2010, 2011).
Sea level riseDuring the past century, the sea level along the Dutch coast has risen by about 20 centimetres; so far, the rate of rise has not been observed to increase During the 20th century, sea levels around the world rose by about 17 cm, or on average by 1.7 mm per year (IPCC, 2007, 2011). Along the Dutch North Sea coast the rise was about 20 cm (Katsman et al., 2008; Dillingh et al., 2010; CBS et al., 2011a; Figure 3.2). Important causes of sea level rise are the expansion of sea water (due to the higher temperature of the water) and the melting of the Greenland and Antarctic ice sheets and the glaciers. The melting of the Greenland and Antarctic ice sheets currently accounts for a rise in sea level of about 0.5 mm per year (Katsman et al., 2008).
Since 1993, the global average sea level has risen more quickly than before, currently by about 3 mm per year (Katsman et al., 2008). Because the series of satellite measurements of sea level rise is short, it is still unclear whether this represents a trend break or whether it is a temporary phenomenon.
So far, no increase in the rate of sea level rise has been observed at the Dutch coast (Katsman et al., 2008; Dillingh et al., 2010). However, the rise in sea level does vary considerably along the relatively short Dutch
coastline; in the 20th century the increase varied from 13 centimetres at Harlingen in the north to 24 centimetres at the Hook of Holland (CBS et al., 2011a). This geographical variation is partly the result of human interventions – in particular, changes in the Wadden Sea area following the closure of the Zuiderzee and dredging operations. In addition, the year-to-year variability in sea level is considerable and is caused by differences in wind speed, air pressure, water temperature and salt content under the influence of the inflow of river water. Finally, fluctuations in the distance to the moon also lead to differences in sea level of a few centimetres (cycle of just over 18 years).
Future sea level rise is highly uncertain Future changes in sea level are uncertain. This is because there are gaps in our understanding of the climate system and the melting of the Greenland and West Antarctica ice sheets and uncertainties about future emissions of greenhouse gases (IPCC, 2007; IPCC, 2011; Dilling et al., 2010; EEA, 2012). All scenarios project an increase in the rate of sea level rise relative to the current rate (KNMI, 2006; PBL, 2007; Deltacommissie, 2008), but the extent of possible sea level rise differs between scenarios (Figure 3.3). All scenarios also indicate that the rate of sea level rise may continue to increase for many decades or even centuries. For one thing, many factors that influence sea level – such as the melting of the ice sheets and the warming of the oceans – react slowly to changes in the climate. Even if emissions reductions lead to a slowdown
Figure 3.1Flood-prone areas, 2005
Within dyke rings
Below sea level (NAP): 26%
Above sea level (NAP): 29%
Unprotected area outsidethe dykes: 3%Undyked part of the RiverMeuse: 1% *)
*) Floodable stretch of the undyked part of the River Meuse within the 1/250 contour.
Source: PBL (2009)
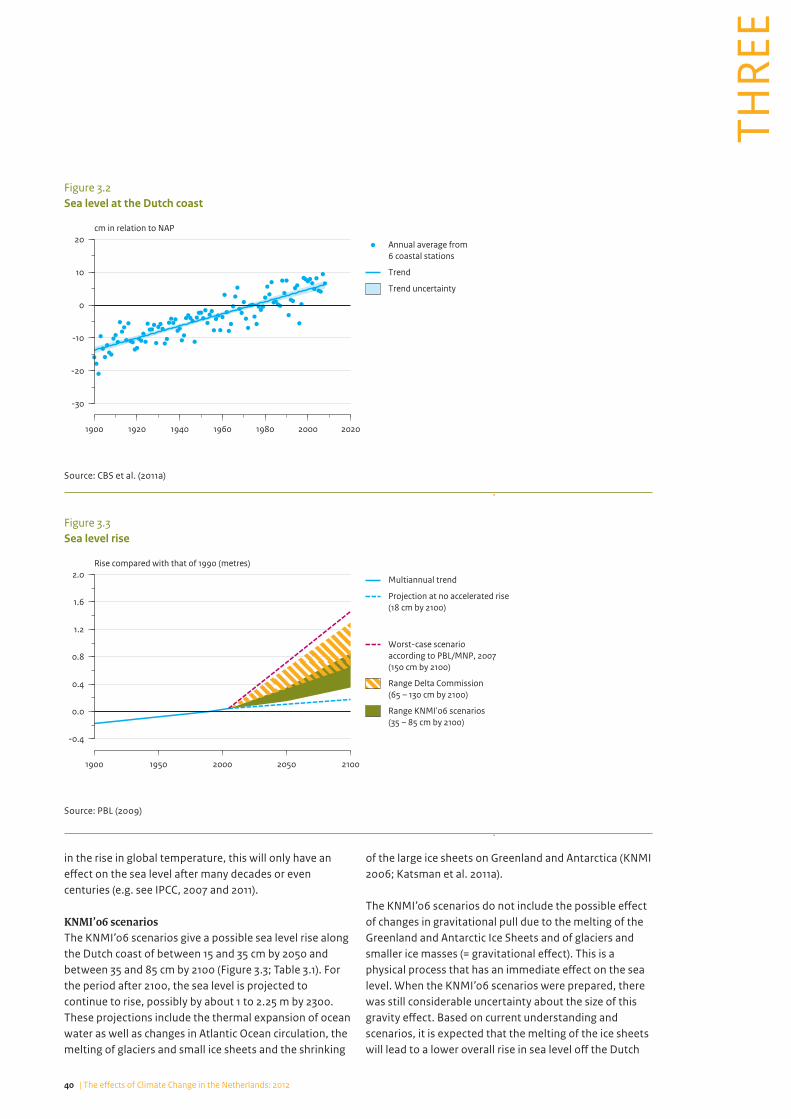
40 | The effects of Climate Change in the Netherlands: 2012
THRE
E
in the rise in global temperature, this will only have an effect on the sea level after many decades or even centuries (e.g. see IPCC, 2007 and 2011).
KNMI’06 scenariosThe KNMI’06 scenarios give a possible sea level rise along the Dutch coast of between 15 and 35 cm by 2050 and between 35 and 85 cm by 2100 (Figure 3.3; Table 3.1). For the period after 2100, the sea level is projected to continue to rise, possibly by about 1 to 2.25 m by 2300. These projections include the thermal expansion of ocean water as well as changes in Atlantic Ocean circulation, the melting of glaciers and small ice sheets and the shrinking
of the large ice sheets on Greenland and Antarctica (KNMI 2006; Katsman et al. 2011a).
The KNMI’06 scenarios do not include the possible effect of changes in gravitational pull due to the melting of the Greenland and Antarctic Ice Sheets and of glaciers and smaller ice masses (= gravitational effect). This is a physical process that has an immediate effect on the sea level. When the KNMI’06 scenarios were prepared, there was still considerable uncertainty about the size of this gravity effect. Based on current understanding and scenarios, it is expected that the melting of the ice sheets will lead to a lower overall rise in sea level off the Dutch
Figure 3.2
1900 1920 1940 1960 1980 2000 2020
-30
-20
-10
0
10
20cm in relation to NAP
Annual average from6 coastal stations
Trend
Trend uncertainty
Sea level at the Dutch coast
Source: CBS et al. (2011a)
Figure 3.3
1900 1950 2000 2050 2100
-0.4
0.0
0.4
0.8
1.2
1.6
2.0Rise compared with that of 1990 (metres)
Multiannual trend
Projection at no accelerated rise(18 cm by 2100)
Worst-case scenarioaccording to PBL/MNP, 2007(150 cm by 2100)
Range Delta Commission(65 – 130 cm by 2100)
Range KNMI'06 scenarios(35 – 85 cm by 2100)
Sea level rise
Source: PBL (2009)

41Effects on flood safety, water availability and water quality |
THRE
E
THREE
coast than the global average. This is because the Netherlands lies relatively close to Greenland. The effect of all this on sea level rise, however, will remain limited until 2100 (between 5 and 15 cm for KNMI’06 scenarios (Katsman et al., 2011b)), as the melting ice sheets will only make a limited contribution to global sea level rise this century, compared with other factors of sea level rise. The possible sea level rise around 2200 may not be in the range of 2 to 4 metres, but could be 40 to 60 cm lower than this (Katsman et al., 2011b).
River dischargesHigher river discharges observed especially in winter; no trend in extreme dischargesThe discharges of the Rhine and Meuse rivers are a relevant factor in the risks of flooding and drought in the Netherlands. Over the past century, the average annual discharge has hardly changed. However, changes have been observed in the average monthly river discharges.
Discharges from the Rhine have increased by 9% during the winter months and decreased by 9% in summer (Figure 3.4).
So far, extreme low and extreme high discharges have also not been observed in either the Rhine or the Meuse (Figure 3.5). The extreme high peak discharges are indicative of flood risk; extreme low discharges are important for freshwater availability in the Netherlands. The lack of any observable trend in these data series is due to the large natural variability in river discharges (Deltares, 2010). This lack of any observable upward trend in discharges also applies to many other European rivers (EEA, 2008 and 2011).
River discharges are projected to increase further in winter and decrease further in summerThe four KNMI’06 scenarios show that increasing warming and changing precipitation patterns can lead to
Table 3.1KNMI’06 scenarios for sea level rise in 2050 and 2100 (in cm)
G/G+ W/W+
2050 2050 2100 2100
Global temperature rise 2100 +1 °C +2 °C +2 °C +4 °C
Sea level Rise off Dutch coast without land subsidence (= absolute rise)
15–25 cm 35–60 cm 20–35 cm 40–85 cm
Rise off Dutch coast, corrected for gravity effect (based on Katsman et al. 2008)
15–25 cm 30–55 cm 20–35 cm 40–85 cm
Source: KNMI (2006), Katsman et al. (2008, 2011a,b)
Figure 3.4
Jan. Feb. Mar. Apr. May Jun. Jul. Aug. Sept. Oct. Nov. Dec.
0.6
0.8
1.0
1.2
1.4Monthly discharge divided by the annual discharge of the River Rhine
1901 – 1925
1926 – 1950
1951 – 1975
1976 – 2011
River discharge River Rhine at Lobith (the Netherlands)
Source: Buiteveld (2005)
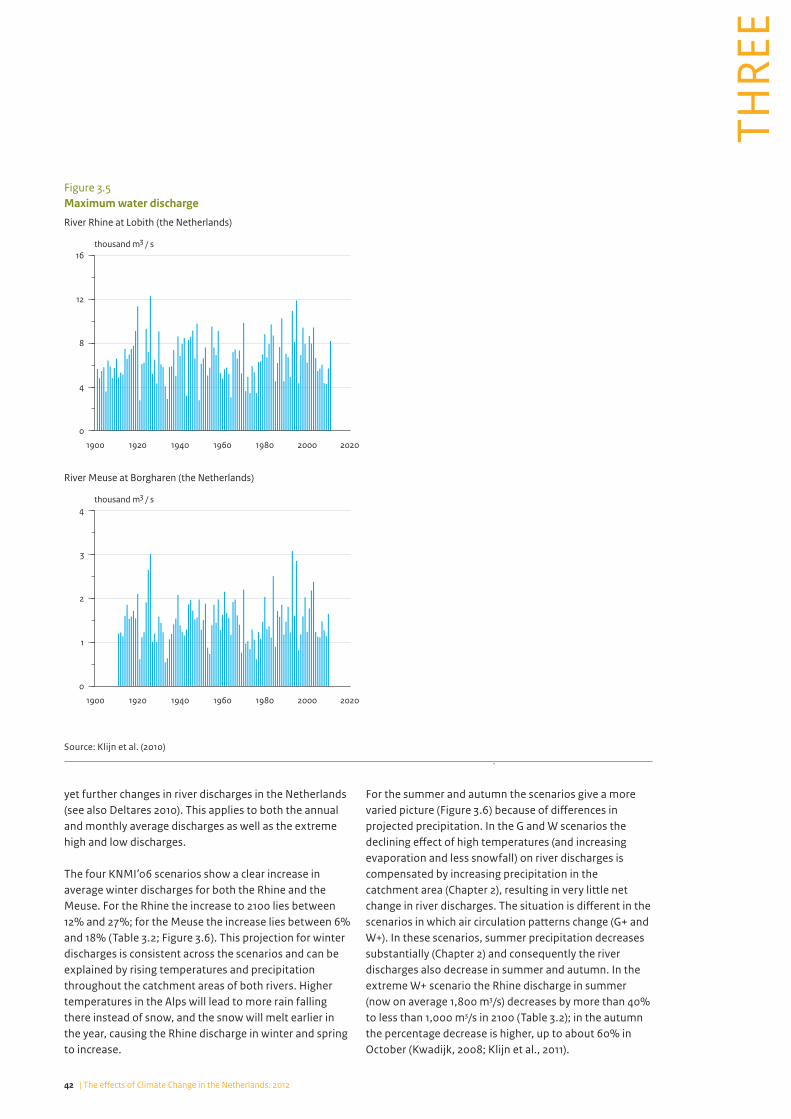
42 | The effects of Climate Change in the Netherlands: 2012
THRE
Eyet further changes in river discharges in the Netherlands (see also Deltares 2010). This applies to both the annual and monthly average discharges as well as the extreme high and low discharges.
The four KNMI’06 scenarios show a clear increase in average winter discharges for both the Rhine and the Meuse. For the Rhine the increase to 2100 lies between 12% and 27%; for the Meuse the increase lies between 6% and 18% (Table 3.2; Figure 3.6). This projection for winter discharges is consistent across the scenarios and can be explained by rising temperatures and precipitation throughout the catchment areas of both rivers. Higher temperatures in the Alps will lead to more rain falling there instead of snow, and the snow will melt earlier in the year, causing the Rhine discharge in winter and spring to increase.
For the summer and autumn the scenarios give a more varied picture (Figure 3.6) because of differences in projected precipitation. In the G and W scenarios the declining effect of high temperatures (and increasing evaporation and less snowfall) on river discharges is compensated by increasing precipitation in the catchment area (Chapter 2), resulting in very little net change in river discharges. The situation is different in the scenarios in which air circulation patterns change (G+ and W+). In these scenarios, summer precipitation decreases substantially (Chapter 2) and consequently the river discharges also decrease in summer and autumn. In the extreme W+ scenario the Rhine discharge in summer (now on average 1,800 m3/s) decreases by more than 40% to less than 1,000 m3/s in 2100 (Table 3.2); in the autumn the percentage decrease is higher, up to about 60% in October (Kwadijk, 2008; Klijn et al., 2011).
Figure 3.5
1900 1920 1940 1960 1980 2000 2020
0
4
8
12
16thousand m3 / s
River Rhine at Lobith (the Netherlands)
Maximum water discharge
1900 1920 1940 1960 1980 2000 2020
0
1
2
3
4thousand m3 / s
River Meuse at Borgharen (the Netherlands)
Source: Klijn et al. (2010)

43Effects on flood safety, water availability and water quality |
THRE
E
THREE
In the summer the Meuse already discharges little water, but even this limited flow decreases substantially in the G+ and W+ scenarios. The W+ gives a decrease in river discharge in 2100 of roughly 25% during the summer months (Table 3.2) and as much as 50% during the autumn (Kwadijk, 2008; Klijn et al., 2011). Such low river discharges in summer can have major consequences, especially in combination with higher temperatures. Low river levels can hamper inland shipping and have an adverse effect on water quality and the availability of fresh water and cooling water in large parts of the country. The possible changes in river discharges are greater for the Rhine than for the Meuse, which is a rain-fed river and is therefore less dependent on snowmelt.
Peak discharges are expected to increase, depending on upstream measuresFor effective flood risk management in the Netherlands it is important to assess how climate change may affect the extreme high or peak discharges of the Rhine and Meuse. At the moment the safety standard for the Rhine-Meuse floodplain is 1/1,250 years; in other words, the dykes should be able to withstand a high water event that can be expected to occur once every 1,250 years. The water levels that the dykes must be able to withstand are calculated using ‘design discharges’, defined as the discharges that will occur on average once every 1,250
years. At the moment, this design discharge for the Rhine (at Lobith) is 16,000 m3/s and for the Meuse (at Borgharen) it is 3,800 m3/s (Kwadijk, 2008). Given the planned flood protection measures and areas reserved for water retention and river bypasses – for example, under the ‘Room for the River’ programme – this design discharge, in time, could be raised for the River Rhine to 18,000 m3/s.
Although no clear trend has yet been observed in the peak discharges of the Rhine and Meuse (see above), it is projected that further climate change will lead to an increase in peak discharges, especially in the winter and spring. This projection is based on the possible rise in precipitation amounts in the catchments areas of both these rivers, particularly in these two seasons. In addition, less water will be retained because the higher temperatures will cause more precipitation to fall as rain and less to fall as snow. This situation occurs in all the KNMI’06 scenarios.
Under a moderate G scenario, the maximum Rhine discharge in the period to 2100 could increase from 16,000 to 18,500 m3/s, and under the most extreme W+ scenario to as much as 21,500 m3/s (Table 3.2) (Kwadijk 2008; Klijn et al. 2011). In all scenarios, therefore, the maximum discharge of 18,000 m3/s will be exceeded before around 2100. Also, the current design discharge of
Figure 3.6
Jan.Feb.
Mar.Apr.
MayJun.
Jul.Aug.
Sept.Oct.
Nov.Dec.
0
1000
2000
3000
4000m3 / s
Reference G scenario
G+ scenario
W scenario
W+ scenario
River Rhine at Lobith (the Netherlands)
River discharges of Rhine and Meuse, 2100
Jan.Feb.
Mar.Apr.
MayJun.
Jul.Aug.
Sept.Oct.
Nov.Dec.
0
200
400
600
800m3 / s
River Meuse at Monsin (Belgium)
Source: Kwadijk (2008); Klijn et al. (2011)

44 | The effects of Climate Change in the Netherlands: 2012
THRE
E
16,000 m3/s, which occurs once every 1,250 years now, could occur between once every 250 years (G scenario) or once every 50 years or less (W+ scenario) in 2100. Peak discharges now considered to be high or extremely high, could therefore occur much more frequently in 2100.
For the Meuse, the projected changes in peak discharges are smaller. The Meuse discharge that occurs once every 1,250 years is now 4,100 m3/s. This can increase to 4,250 m3/s in 2100 in the G+ scenario and to 4,850 m3/s in 2100 in the W scenario. The current standard of 3,800 m3/s will therefore in all probability be exceeded increasingly often (Kwadijk 2008).
The amount of water entering the Netherlands via the Rhine is determined largely by the water management measures taken in the upstream areas. It is therefore not only climate change that influences the river discharges at Lobith, but also what happens further upstream in the catchment areas of the Rhine and the Meuse. The extreme high peak discharges, as presented above, are based on the assumption that all the river water can reach the Netherlands. In reality, for the Rhine this also depends on any flood protection measures taken in Germany. Even after completion of the current improvement programme, the protection level in Germany will still be lower than that in the Netherlands. This means that in Germany it will be difficult to contain discharge waves of more than 15,000 m3/s and flooding will occur, which will attenuate the discharge wave before it reaches the Netherlands. If Germany makes no changes to its flood protection regime and does not further increase its flood safety standards, the maximum discharge in the Rhine at Lobith will be lower than the estimates given in Table 3.2. For a potential discharge wave of 22,000 m3/s, the discharge entering the Netherlands would lie within a range of 15,000 to 17,500 m3/s (Deltacomissie 2008; Te Linde 2009; Figure 3.7). In this case, the probability of a future design discharge of 18,000 m3/s (following implementation of the ‘Room for the River’ programme) being exceeded would then be
minimal. Even the current design discharge of 16,000 m3/s would be exceeded just once every 178 years instead of once every 53 years.
However, the water could reach the Netherlands in other ways than via the rivers; for example, if flooding occurs in areas next to the Dutch border or if more water is retained in such areas. And should Germany increase its flood safety standards in future, reducing the possibilities for flooding, higher peak discharges will also reach the Netherlands.
For the Meuse the situation is different because this river flows through a relatively narrow valley upstream of the Netherlands, which reduces the possibilities for reducing the discharge wave.
Because sea level rise is a slow process, controlling peak discharges will be the greatest challenge for flood safety in the Netherlands (see also PBL 2007, 2009), although the changes will also depend on the water management regime further upstream. It is expected that larger areas in the floodplain will be needed to manage any higher peak discharges. In the decades to come the future scope for effective flood protection in this area will be affected by decisions on land use in the Rhine-Meuse floodplain, particularly those on urban development (PBL 2011).
3.3 Water drainage flooding and drought
Climate change also has an influence on the availability of fresh water in the Netherlands, resulting in both too much water (causing water drainage flooding) and a shortage of water (causing drought). In urban and rural areas, water drainage flooding occurs when the water cannot be removed quickly enough, causing damage to buildings or crops and disruption to traffic (RIZA 2007).
Table 3.2Range of maximum Rhine discharges (in m3/s) in 2100 in the KNMI’06 scenarios for different return periods*
Rhine Return period (years)
50 100 250 500 1250
Control (1901–2004) 11,500 12,500 14,000 15,000 16,000
Minimum projection 2100 (G)
13,000 14,500 16,000 17,000 18,500
Maximum projection 2100 (W+)
15,500 17,000 18,500 20,000 21,500
Source: Kwadijk (2008), Klijn et al. (2011)
*These take no account of possible flooding upstream of the Netherlands.

45Effects on flood safety, water availability and water quality |
THRE
E
THREE
Observed trend and possible future changes; increase in water drainage flooding, not in drought In recent years, various places in the Netherlands have been repeatedly affected by water drainage floods (Klijn et al., 2010); for example, in the province of North Holland in the summer of 2006 and the autumn of 2007. This increase is related to the very heavy rainfall which has become more frequent in late summer in recent years, particularly along the Dutch coast (Chapter 2). One of the reasons for these heavy showers is the higher water temperature of the North Sea (KNMI 2009b). The increasing occurrence of both intense precipitation events, and water drainage flooding means that there is already a need to counter the changes in both urban and rural areas. In 2003, working standards were set for the acceptable risk of damage caused by flooding from surface water. These working standards depend on the type of land use and vary from once every 10 years for grassland to once every 100 years for built-up areas. The National Administrative Agreement on Water states that the water systems in the lower lying and higher areas of the Netherlands and in the urban areas must comply with these standards by 2015, also with a view to climate change (VenW 2003).
In rural areas, regional water authorities have already taken measures under the Water Management for the 21st Century programme. In the coming years in urban areas, maintenance and replacement works (sewers), urban restructuring and new developments will have to incorporate the principles of climate-resilient layout, design and construction (PBL, 2011).
Although temperatures are rising, there has been no observable trend in the occurrence of extreme drought within a year between 1906 and 2007, averaged across the Netherlands. However, the average water availability in the summer period has decreased due to an increase in excess evapotranspiration and a decrease in the average discharge of the Rhine. There are regional differences: the coastal zone is relatively drier than the rest of the country in spring and early summer, but this situation is reversed in late summer and autumn (KNMI 2008). These regional differences are due mainly to the regional differences in precipitation and evaporation patterns (Chapter 2).
Increasing risk of water drainage flooding and periods of droughtBased on the observed relationships between temperature and precipitation, it is projected that the probability of extreme precipitation will increase further during the 21st century. In all the KNMI’06 scenarios the temperature continues to rise (Chapter 2), which means that the air can hold more water vapour and so when it rains, more rain can fall during each shower. More extreme precipitation events will in turn increase the risk of water drainage flooding, both in urban and rural areas (PBL 2009). The largest increase is expected in the scenarios in which air circulation patterns remain the same (G and W scenarios), because the possible short and intense precipitation extremes (which are often the cause of flooding) are projected to increase the most in these scenarios (see Chapter 2). In the G+ and W+ scenarios the effects will be less severe.
Figure 3.7
10 15 20 25
Peak discharge without upstream flooding (thousand m3/s)
10
15
20
25Peak discharge at Lobith (thousand m3/s)
Upstream flooding
Along the entire River Rhine(Lammersen, 2004)
Only in the lower part of the River Rhine,just before the Dutch boarder(Gudden, unpublished)
Situation without upstream flooding
Impacts of upstream flooding in Germany on peak discharges at Lobith (the Netherlands)
Source: Vellinga et al. (2008)


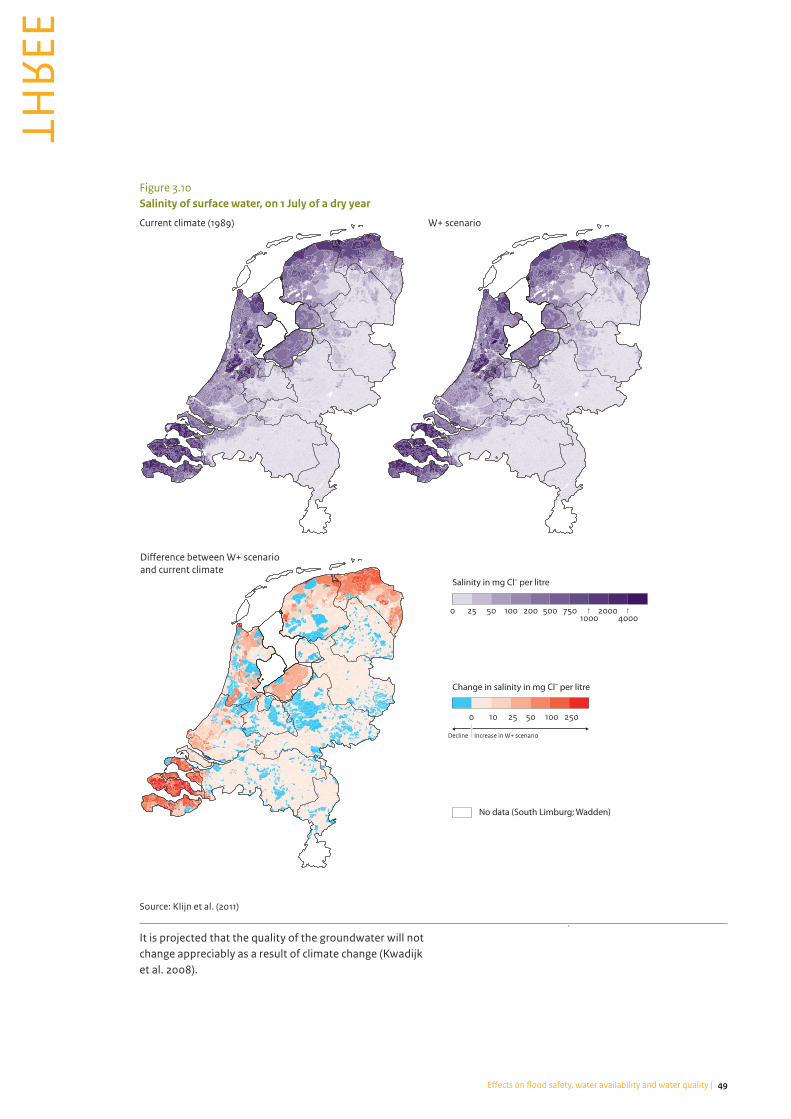

50
FOU
R
| The effects of Climate Change in the Netherlands: 2012
Effects of climate change on ecosystems and biodiversity
4.1 Introduction
Many Dutch ecosystems and habitats are characteristic of the Netherlands as a European delta and are of international importance (Figure 4.1). Past Dutch environmental and nature conservation policies have led to a reduction in environmental pressures on nature in the Netherlands, and protected areas have been enlarged and connected. Despite this improvement, falling water tables, eutrophication, acidification, climate change and habitat fragmentation remain problematic (PBL 2009, 2010) and are causing continuing loss of biodiversity in many ecosystems (PBL 2008).
Here we present an update on the observed and possible future effects of climate change on ecosystems and biodiversity. Climate change presents opportunities for some species and communities and threats to others, with some species being much more vulnerable to the effects of climate change than others (Blom et al. 2009). Climate change affects ecosystems and species in various ways (Figure 4.2).
4.2 Observed changes
Cold-loving species declining, new species increasingRising temperatures and changes in precipitation patterns may cause a decline in the population size of species for which the Netherlands forms the southern boarder of their range (these are so-called cold-loving
species). On the other hand, warm-loving species for which the climate in the Netherlands used to be too cold may expand their range northwards into the country.
Changes in range and population size have frequently been observed in the Netherlands (Nijhof et al., 2007; CBS et al., 2011b). Figure 4.3 shows that populations of cold-loving species declined rapidly in the 1990s – when the global temperature rose relatively sharply – whereas warm-loving species are benefiting from the rising temperature (PBL, 2010). A shift in population size has been observed in various different species groups, such as birds, insects and amphibians (Figure 4.3), lichens (CBS et al., 2010), fungi (Arnolds and Veerkamp, 2008) and plants (Tamis et al., 2005). During the past ten years effective conservation measures have halted the decline of some cold-loving species, such as a few frog species (CBS et al., 2011c).
The warming of the climate is making the Netherlands suitable for many species for which it was previously too cold. Known warm-loving newcomers are the wasp spider, the oak processionary caterpillar and several species of cricket. For example, until the 1980/90s the wasp spider was restricted to a few places in the south of the Netherlands, but can now be found in large areas of the country (Moraal et al. 2004; Van Oudenhoven 2008; CBS et al. 2011e).
Changes in species composition for which climate change is partly responsible have also been observed in the

51Effects of climate change on ecosystems and biodiversity |
FOU
R
FOUR
|
Figure 4.1
Salt marshes
Dunes
Heathland
Waters
Grassland / marshland
Forest
Agricultural
Netherlands
0 10 20 30
Share of the Netherlands (Europe = 100%)
Surface area Natura 2000 habitats
International importance of Dutch nature, 2000
Salt marshes
Dunes
Heathland
Waters
Grassland / marshland
Forest
Agricultural
Netherlands
0 10 20 30
Share of the Netherlands (Europe = 100%)
Population breeding birds
Source: PBL (2010)
Figure 4.2Impacts of climate change on nature
Climate change: • Temperature increase• Change in precipitation pattern• Increase in weather extremes• Sea level rise
Impacts on species by changes in:• Physiology: photosynthesis, respiration, evapotranspiration• Phenology: timing of processes, annual cycle• Genetics: microevolutionary adjustments• Geographical distribution• Number of fluctuations
Interaction with existing pressures:Habitat fragmentation, eutrophication, desiccation, industrial heating
surface water, fisheries, fixed coast and river courses
Impacts on site conditions:• Desiccation: moisture deficit/dryness stress• Rising groundwater level: oxygen stress• Increase in salt-water seepage• Change in water and soil quality• River and stream discharges• Increase in coastal erosion
Impacts on ecosystems
Source: PBL (2010)

52 | The effects of Climate Change in the Netherlands: 2012
FOU
R
North Sea (ICES, 2009; Brander, 2010; Teal, 2011; Van Hal et al., 2011). This applies to many species groups of zooplankton and some fish species, but not to marine mammals such as dolphins and seals (Van Hal et al., 2011). The number of plankton species of temperate zones has increased, whereas the number of subarctic species has declined (ICES, 2009; Brander, 2010). The changes in fish populations cannot be ascribed entirely to climate change because intensive fishing has put some species under threat and benefited others (Brander, 2010).
Changing bird migration patternsThe warmer winters in particular have led to a decline in the number of migratory birds from the north overwintering in the Netherlands, while an increasing number of breeding birds in the Netherlands remain in the country throughout the year and do not migrate further southwards (Visser et al., 2009; SOVON, 2011). For example, in response to the higher winter temperatures, the centre of the winter distribution of the grey plover has shifted 115 km in a north-easterly direction (Maclean et al., 2008; Devictor et al., 2008).
Growing seasons starts earlier One of the clearest effects of climate change on nature in the Netherlands is the shift in the growing season (see also www.natuurkalender.nl; CBS et al. 2010c). Spring plants like lesser celandine now flower two to three weeks earlier in the year than fifty years ago, and over the period from 1986 to 2009 many songbirds started to lay their eggs almost ten days earlier in the year (Figure 4.4). Higher temperatures in spring are most probably an important reason for this (SOVON 2011).
It is unclear what consequences this shift in growing season will have for biodiversity and the functioning of ecosystems. Food chains may be disrupted because plants and animals do not respond in the same way to a warmer spring (Both et al. 2009; Durant et al. 2007), causing an increasing mismatch between the timing of biological events that used to coincide. For example, young birds may hatch at a time when there is no peak supply of food (Schweiger 2008). This mismatch can already be seen for the pied flycatcher, but so far it has not led to a fall in numbers (PBL 2010; CBS et al. 2011d; SOVON 2011). The birds may have been able to adapt by finding other sources of food (SOVON 2011). However, it is not known whether they will be able to make further adaptations as climate change continues.
Climate change influences site conditionsClimate change can also influence site conditions. Depending on what the net effects of climate change will be, the outcome for the functioning of species and ecosystems may be either positive or negative.
So far climate change has had a limited effect on site conditions. Observed changes mainly concern water conditions, for example the higher temperature of the rivers and the North Sea (Puijenboek et al. 2009; Van Hal et al. 2011) and the salinisation in the south-west of the Netherlands in particular (Witte et al. 2009a; PBL 2010). Higher water temperatures can lead to an increase in the internal temperature of cold-blooded species such as fish, impairing their physiological functioning. Moreover, at higher temperatures water may contain less oxygen and low oxygen contents have been found along the
Figure 4.3
1990 1994 1998 2002 2006 2010 2014
0
50
100
150
200Index (2000 = 100)
Warmth-loving species
Species without a climate preference
Cold-loving species
Climate change impacts on species in the Netherlands
Source: Nijhof et al. (2007); CBS et al. (2011b)
Based on 60 species of birds, butterflies and amphibians.

53Effects of climate change on ecosystems and biodiversity |
FOU
R
FOUR
North Sea coast (Pörtner and Knust 2007) and in the Dutch rivers. As larger organisms generally need more oxygen, they will be affected more by declining oxygen availability. Less favourable conditions are more likely to occur in summer. All in all, these changes have not yet led to critical situations (Deltares 2008), which may be due to the general improvement in water quality (CBS et al. 2011f).
Climate change exacerbates existing pressure factorsClimate change is just one of the pressure factors on ecosystems and biodiversity. Until now factors such as falling water tables, eutrophication and fragmentation have been the dominant pressure factors (PBL 2009, 2010), but climate change can reinforce the effects of these pressure factors and vice versa (Piessens et al. 2008; PBL 2010). Creating larger areas of habitat, intended to combat fragmentation, can permit species populations to survive under the influence of (rapid) climate change (Ozinga et al. 2007; Schippers et al. 2011). Climate change can also exacerbate the effects of falling water tables. More frequent dry periods, for example, reduce the chances of restoring raised bogs (Bijlsma et al. 2011).
4.3 Possible future effects of climate change on ecosystems and biodiversity
It is expected that in future climate change will have greater effects on ecosystems and biodiversity in the Netherlands than have been observed so far, although
the uncertainties surrounding future climate change are high. The effects of these future changes will be beneficial for some plants and animals and disadvantageous for others, an important aspect being the adaptive capacity of species. The speed at which climate change occurs will also determine the nature and severity of these effects (Schippers et al. 2011).
Changes in geographical distribution Depending on the degree and rate of further temperature rise and changes in precipitation patterns, the shift in suitable climate zones for many plant and animal species may be either large or small (Geertsema et al. 2009; Van der Veen et al. 2010). In an extreme climate scenario almost 40% of the species currently characteristic of the Netherlands could be ‘on the move’ by 2100 (PBL 2010).
Relatively large shifts are projected for species of wet heath and raised bog, and for some bird species (Figure 4.5) (Van der Veen et al., 2010). For these species the climate in the Netherlands could become less suitable. In contrast, the Netherlands could become potentially more suitable for amphibians, butterflies and reptiles. Not only may the populations of species already present in the Netherlands be able to expand, but the new climatic conditions may also suit new species for which the Netherlands used to be too cold, such as the Cetti’s warbler (PBL, 2010). However, whether these species will be able to establish themselves in the Netherlands also depends on the availability of suitable habitats, as well as the interactions between species and the presence of predators.
Figure 4.4
1986 1990 1994 1998 2002 2006 2010
120
124
128
132
136
140Day of the year
Observations
Trend
Trend uncertainty
Egg-laying date of songbirds in the Netherlands
Source: CBS et al. (2012)
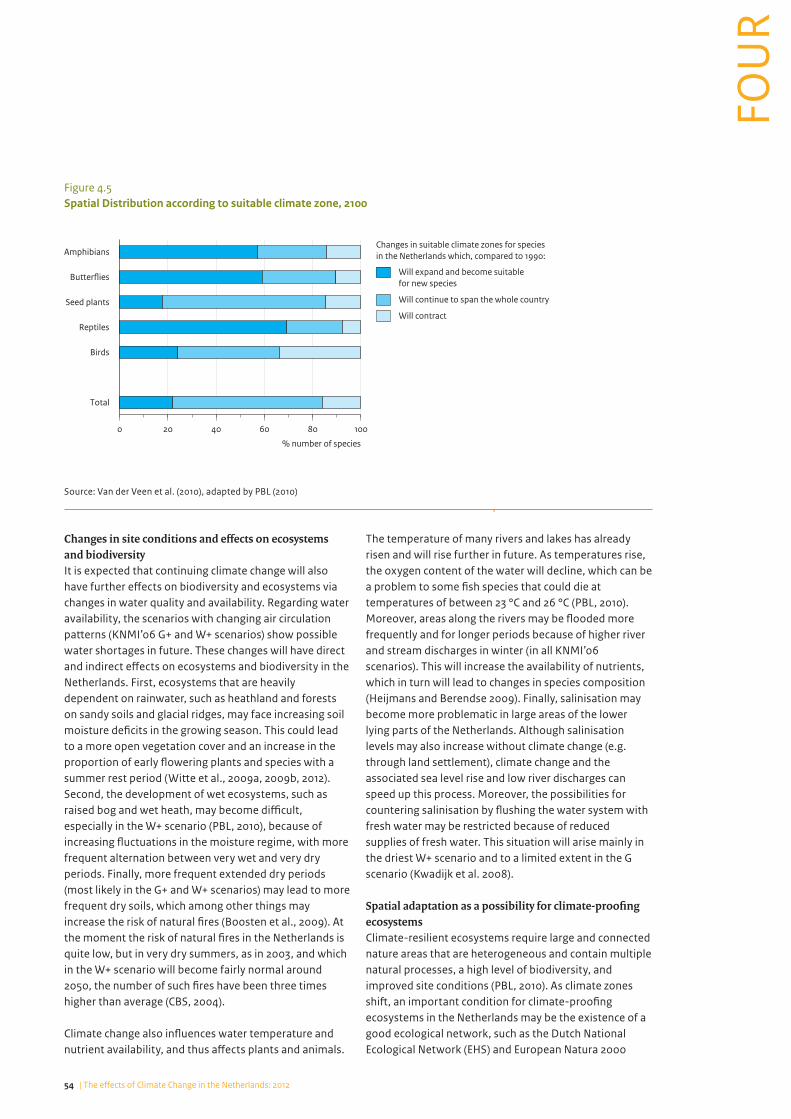
54 | The effects of Climate Change in the Netherlands: 2012
FOU
R
Changes in site conditions and effects on ecosystems and biodiversityIt is expected that continuing climate change will also have further effects on biodiversity and ecosystems via changes in water quality and availability. Regarding water availability, the scenarios with changing air circulation patterns (KNMI’06 G+ and W+ scenarios) show possible water shortages in future. These changes will have direct and indirect effects on ecosystems and biodiversity in the Netherlands. First, ecosystems that are heavily dependent on rainwater, such as heathland and forests on sandy soils and glacial ridges, may face increasing soil moisture deficits in the growing season. This could lead to a more open vegetation cover and an increase in the proportion of early flowering plants and species with a summer rest period (Witte et al., 2009a, 2009b, 2012). Second, the development of wet ecosystems, such as raised bog and wet heath, may become difficult, especially in the W+ scenario (PBL, 2010), because of increasing fluctuations in the moisture regime, with more frequent alternation between very wet and very dry periods. Finally, more frequent extended dry periods (most likely in the G+ and W+ scenarios) may lead to more frequent dry soils, which among other things may increase the risk of natural fires (Boosten et al., 2009). At the moment the risk of natural fires in the Netherlands is quite low, but in very dry summers, as in 2003, and which in the W+ scenario will become fairly normal around 2050, the number of such fires have been three times higher than average (CBS, 2004).
Climate change also influences water temperature and nutrient availability, and thus affects plants and animals.
The temperature of many rivers and lakes has already risen and will rise further in future. As temperatures rise, the oxygen content of the water will decline, which can be a problem to some fish species that could die at temperatures of between 23 °C and 26 °C (PBL, 2010). Moreover, areas along the rivers may be flooded more frequently and for longer periods because of higher river and stream discharges in winter (in all KNMI’06 scenarios). This will increase the availability of nutrients, which in turn will lead to changes in species composition (Heijmans and Berendse 2009). Finally, salinisation may become more problematic in large areas of the lower lying parts of the Netherlands. Although salinisation levels may also increase without climate change (e.g. through land settlement), climate change and the associated sea level rise and low river discharges can speed up this process. Moreover, the possibilities for countering salinisation by flushing the water system with fresh water may be restricted because of reduced supplies of fresh water. This situation will arise mainly in the driest W+ scenario and to a limited extent in the G scenario (Kwadijk et al. 2008).
Spatial adaptation as a possibility for climate-proofing ecosystemsClimate-resilient ecosystems require large and connected nature areas that are heterogeneous and contain multiple natural processes, a high level of biodiversity, and improved site conditions (PBL, 2010). As climate zones shift, an important condition for climate-proofing ecosystems in the Netherlands may be the existence of a good ecological network, such as the Dutch National Ecological Network (EHS) and European Natura 2000
Figure 4.5
Amphibians
Butterflies
Seed plants
Reptiles
Birds
Total
0 20 40 60 80 100
% number of species
Changes in suitable climate zones for speciesin the Netherlands which, compared to 1990:
Will expand and become suitablefor new species
Will continue to span the whole country
Will contract
Spatial Distribution according to suitable climate zone, 2100
Source: Van der Veen et al. (2010), adapted by PBL (2010)

55Effects of climate change on ecosystems and biodiversity |
FOU
R
FOUR
network, with good connecting nature corridors and good site conditions (PBL, 2010). However, this will require a change in government thinking on these networks, with an emphasis on enlarging, connecting and enhancing a number of priority areas. These areas, such as large existing wetlands, form the ecological strongholds of biodiversity. This rethinking may involve acquiring or laying out conservation areas within climate corridors of international importance (wetlands, dune
Figure 4.6The potential for international connection of the wetland climate adaptation zone
Climate corridor marshland
International connection
Peat bog
Other wetlands
Potential for ooding of wetlands
Potential for peat bogsLarge rivers
0 100 km
N E T H E R L A N D S
B E L G I U M
G E R M A N Y
Source: CBS et al. (2012)
and coast) as well as linking together, expanding and enhancing the quality of areas within clusters of wildlife sites (heathland, forest) (Vos et al. 2010). The climate resilience of these areas can be increased further by linking them to ecological networks in neighbouring countries. This is the case, for example, for the Dutch wetlands, which form a core area of these ecosystems within North-West Europe (PBL, 2010; Figure 4.6).
56 | The effects of Climate Change in the Netherlands: 2012
FOU
R
In addition, a climate-proof nature conservation policy may require a revision of current conservation objectives. Because these are defined in static terms, the likelihood of achieving these objectives under increasing climate change and of the Netherlands being able to adhere to its international obligations will be reduced. The new policy should focus more on the functioning of ecosystems and increasing their adaptive capacity and less on the presence of specific species in specific places.

57Effects of climate change on ecosystems and biodiversity |
FOU
R

58
FIVE
| The effects of Climate Change in the Netherlands: 2012
Effects of climate change on agriculture in the Netherlands
5.1 Introduction
Agriculture is an economic activity. Its most important function is to produce food, biomass, raw materials for further production, and ornamental plants and flowers. In addition, the agricultural sector contributes to the quality of rural areas in the Netherlands and the maintenance of the landscape, biodiversity and social cohesion. The main drivers of Dutch agriculture are the economy, European agricultural policy, consumer demand and environmental conditions.
In addition to changes in markets and agricultural support policies, weather and climate also affect decision-making within the agricultural sector. This is particularly the case for open field cultivation and land-based agriculture. In general the agriculture sector in the Netherlands can be expected to anticipate and adapt well to changing circumstances, such as climate change (PBL, 2011).
5.2 How will climate change affect agriculture?
Climate change can affect agriculture in several ways, both positive and negative (Table 5.1). Positive effects include higher productivity – a consequence of higher temperatures, a higher CO2 concentration and a longer growing season – opportunities to cultivate new crops,
and lower energy bills in the greenhouse horticulture sector. If the climate changes gradually, the positive effects for Dutch agriculture are expected to outweigh the negative, also because of the favourable location of the Netherlands in Europe (in the temperate zone) and its good competitive position (Agricola, 2010; Hermans et al., 2010). Whether these positive effects can be realised in practice will depend on developments on world markets. At the same time, the effects of climate change on agriculture vary per region, crop and farming system (IPO, 2009).
Higher temperatures and CO2 concentrations: many opportunities for Dutch agricultureThe CO2 concentration in the atmosphere and the surface temperature of the earth have both risen over the past century. Higher CO2 concentrations can lead to higher productivity (Lavalle et al., 2009), although this requires good growing conditions. Moreover, the increase in yield depends on the crops concerned. A doubling of the CO2 concentration combined with a temperature rise of 3 ºC can raise grain yields by 8%; for beets this is 35% and for grassland 50%. For maize, however, these conditions could actually reduce yields by 17% (Schapendonk et al., 1997).
Rising temperatures have a range of effects (Table 5.1). The positive effects include higher crop yields, mainly because higher temperatures extend the growing season of plants. During the past 15 years the growing season was on average more than three weeks longer than in the

59Effects of climate change on agriculture in the Netherlands |
FIVE
FIVE
|
period 1961–1990 and more than five weeks longer than at the beginning of the 20th century (KNMI, 2011; Figure 5.1). In the KNMI’06 G scenario, the average growing season in 2050 is projected to start another six days earlier; in the W+ scenario it could start 19 days earlier (Schaap et al., 2009).
Increasing variability in precipitation and freshwater availability will challenge agricultureLoss of yield and economic damage can result from too much water (flooding) or too little water (Table 5.1). In the Netherlands 30% of all the available fresh water is derived from precipitation; the majority (70%) of the freshwater supply comes from the Rhine and Meuse rivers (Klijn et al., 2010). This means that changes in river discharges and precipitation patterns can have a considerable effect on water availability.
Freshwater deficit and droughtDry conditions occur regularly during the growing season in the Netherlands. This inhibits crop growth and the soil can become more saline. In normal years the average precipitation deficit in the Netherlands is 144 mm. This is usually not a problem for farmers because these deficits occur frequently and farm management practices take them into account. In the present climate the economic damage is less than 2% of the economic value (Van Beek et al., 2008).
This could change if extremely dry years become more common and/or more severe (Figure 5.2). In such years the average precipitation deficit in the Netherlands is currently as much as 360 mm. In the W+ scenario this extreme precipitation deficit can rise to 440 mm (Van Beek et al., 2008). Such dry conditions can lead to a significant loss of yield (more than 10% of the economic
Table 5.1Possible effects of climate change on agriculture
Climate factor Effects Pos./Neg.
Change in temperature patterns Rising temperatures Increase in productivity +
Increase in pests and diseases -
Emergence of new species, including weeds ?
Mismatch between crop development and pollination by insects
-
Lower energy bills in greenhouse horticulture sectorHigher energy bills in livestock farming sector due to the need for cooling in livestock sheds
+
Storage more problematic -
Longer growing season, multiple harvests +
More frequent heat waves Crop damage or even crop death -
Late frost Buds and flowers killed by frost -
Changing precipitation patterns Wetter conditions Loss of yield due to more fungal and insect pests -
Sowing and harvesting problems -
Leaching/loss of nutrients (Water Framework Directive)
-
Loss of quality due to extended periods under water
-
More extreme precipitation and hail
Glass and crop damage (e.g. flattening of cereals) by extreme rainfall (also hail)
-
Drought Loss of yield due to (extreme) drought -
Loss of yield and change in quality caused by salinisation
-
Improvement in quality -
Other climate variables Humidity More fungal growth -
Changing wind patterns More insects -
Higher CO2 concentrations Increase in productivity +
Sea level rise and land subsidence Flooding See Wetter conditions -
Increasing salinisation Loss of yield in some crops and opportunities for other crops
-/+
Source: Blom et al. (2008)

60 | The effects of Climate Change in the Netherlands: 2012
FIVE
value of the crop) (Van Beek et al., 2008; Klijn et al., 2010). These levels of damage are theoretical losses that can be limited by taking certain measures (Klijn et al., 2010), such as irrigation. But such measures are not always feasible or cost-effective: they may be expensive, or there may be insufficient fresh water available for irrigation. Finding solutions to freshwater shortages during dry periods therefore presents a major challenge to the agricultural
sector. Areas that have little or no access to water from rivers or ditches and areas where the water table is low are the most vulnerable (Klijn et al., 2011; Figure 5.2). This challenge will only become greater as a result of climate change (PBL, 2011). Drought damage can increase sharply in the scenarios with falling precipitation levels in the summer (G+ and W+).
Figure 5.1
1900 1920 1940 1960 1980 2000 2020
0
100
200
300
400Number of days
Number of days per year over 5 °C
10-year moving average
Length of growing season in De Bilt (the Netherlands)
Source: KNMI (2011)
Figure 5.2Risk of drought in agriculture
1981 – 2010 W+ scenario 2050
Expected damages (million euros)0 – 56 – 10
11 – 20
21 – 50
51 – 100
101 – 200
Source: based on Klijn et al. (2011)

61Effects of climate change on agriculture in the Netherlands |
FIVE
FIVE
The vulnerability of the agricultural sector to drought differs between farm types and cultivation methods. In general, the more intensive the cultivation system, the greater the efforts taken to prevent damage. Greenhouse horticulture, for example, depends heavily on the availability of water of good quality, but is less vulnerable because for this very reason investments have already been made in facilities to collect and store water.
Agricultural sector apprehensive about the possibility of more extreme weatherExtreme weather conditions can cause damage to agriculture. The sector therefore sees the possibility of an increase in the intensity and frequency of extreme weather events as one of the biggest challenges posed by climate change (PBL, 2011). The regions most vulnerable to extreme weather events are the western fen peat areas (land subsidence as a result of drought), the horticulture areas along the main rivers (orchards) and in Flevoland (bulbs), Zeeland and northern Limburg (greenhouse horticulture) (Blom et al., 2008). This vulnerability is related to the type of farms and agricultural enterprises in these areas. In these areas too, the more intensive the cultivation system, the greater the efforts taken to prevent damage.
Table 5.2 shows how – in the KNMI’06 scenarios – the frequency of extreme weather events that cause damage to potatoes can change. Here we examine potato growing as an example because of its economic importance and
the susceptibility of potatoes to disease. Problems can be expected mainly in the summer months because, as temperatures rise, heat waves may become longer and more frequent and drought periods may occur more frequently (in the G+ and W+ scenarios). Moreover, such problems are most likely in the areas which are already susceptible to them (Van der Gaast et al., 2009). In contrast, problems arising from excess precipitation may become less frequent (Schaap et al., 2009 and 2011).
Increasing salinisation in coastal zonesSalinisation is an increase in the concentration of salts in soil or water, which can impede the uptake of water and nutrients by crops (Van Bakel and Stuyt, 2011). Moreover, saline conditions can lead to leaf damage and other growth deformations (a particular problem in ornamental plants). Such saline conditions also make it almost impossible to provide livestock with clean drinking water (Van Dam et al., 2007). Flushing with fresh water is the most commonly used technique for combating salinisation, but this method depends on ample supplies of water.
Many coastal areas in the south-west and the north of the Netherlands already have to contend with increasing salt concentrations in the groundwater and surface water (Klijn et al., 2011; Westerdijk and Visser, 2003). It is expected that climate change will lead to a further increase in the salinity of surface waters and shallow groundwater (Acacia Water et al., 2009). Based on the
Table 5.2Frequency of extreme weather events per month
Present climate J F M A M J J A S O N D
Heat waves 2 6 0
Warm winters 0 0 3 0
Warm and wet 0 1 0
Heavy rainfall 0 0 0 2 1 0
Extended wet periods 5 8 7 5
Wet fields 13 5 5 5 4 5 8 9
Around 2040scenario
J F M A M J J A S O N D
G+ W+ G+ W+ G+ W+ G+ W+ G+ W+ G+ W+ G+ W+ G+ W+ G+ W+ G+ W+ G+ W+ G+ W+
Heat waves +2 +12 +7 +12 +1 +3
Warm winter 0 +2 +1 +3 +3 +8 +1 +1
Warm and wet +4 +6 +5 +6 +1 +2
Heavy rainfall 0 -1 +1 +1
Extended wet periods -2 -2 -2 -4 -2 -5 -4 -3
Wet fields +1 +4 0 +1 -3 -3 0 -1 0 -1 +1 0 +2 +3Source: Schaap et al. (2009, 2011)
These extreme weather events cause damage to potatoes in the present (top) and possible future (bottom) climate in the north of the Netherlands (Eelde weather station, climate data 1976–2005). The bottom table gives the effects in the G+ (white) and W+ (grey) scenarios for the period around 2040.

62 | The effects of Climate Change in the Netherlands: 2012
FIVE
four KNMI’06 climate scenarios over the period to 2050, up to a quarter (in the W+ scenario) of existing farmland could face slight to serious soil salinisation (Verhagen et al., 2011).
So far, the financial damage caused by salinisation has been relatively small compared with the damage caused by drought (Van Beek et al., 2008). In many cases, therefore, the most cost-effective response would seem to be to simply accept the damage caused by salinisation (PBL, 2011). However, climate change could increase the severity and scale of freshwater shortages and in recent years this possibility has led to much discussion about how farmers and water managers should tackle the problem of saline water. Any approach should take into account the salt tolerance of crops, which varies considerably between crops (Van Dam et al., 2007; De Wit et al., 2009). Soil salinisation also presents opportunities to grow halophytic crops (such as common sea lavender, common glasswort and salt-tolerant varieties of potato). However, before assessing the prospects for such brackish or saline agriculture, it will be necessary to obtain a clear picture of what the economic potential of these crops is – and opinions differ widely about this potential.
Pests and diseases: much remains unknownAnother challenge facing Dutch agriculture is that climate change may lead to changes in the distribution, frequency and intensity of fungal diseases, insect pests and weeds (Van de Sant and Goosen, 2012). Weather and climate are important factors in the distribution and development of diseases, pests and weeds (Table 5.3).
For example, warmer winters and longer growing seasons may lead to an increase in the number of generations of existing insects, including many species of aphids, beetles and potato cyst nematodes (Blom et al., 2008; Verhagen et al., 2009). In addition, wetter conditions in combination with higher temperatures may favour the development of existing fungal and bacterial diseases. This is the case, for example, for Phytophthora infestans (potato blight), a deadly potato disease.
Furthermore, a longer growing season and warmer spring may bring new pests and diseases to the Netherlands, which will also have an impact on agriculture. An example is the western corn rootworm, which appeared in the Netherlands in 2004 and can cause considerable damage to maize production (PD, 2005). Another example is blue tongue, a virus disease that affects sheep and goats and is spread by a biting midge. Blue tongue first appeared in the Netherlands in 2006. It is possible that the extremely hot summer of that year had a part to play in this (Scholte et al., 2008).
This potential additional burden of pests, diseases and weeds also has a positive side: their natural enemies may also benefit from the temperature rise (Verhagen et al., 2011). For example, insect pests that overwinter as adults or larvae may be adversely affected by warmer and wetter Dutch winters because they will be more susceptible to fungal infections.
All these pests and diseases have so far been effectively controlled (Schaap et al., 2009). However, frequent use of plant protection products may eventually undermine the resistance of crops.
Table 5.3Effects of climate change on the incidence of pests and diseases
Climate factor Effect on pests and diseases
Rising temperatures (e.g. mild winters) New species
More generations of insect pests and diseases
Better growing conditions for fungi
Undermine resistance
More difficult storage of crops (especially potatoes, because nematodes no longer killed by frost)
Increasing humidity More fungal diseases
Wetter conditions (especially in combination with rising temperatures)
More fungal diseases and nematodes
More difficult pest control
Changing wind patterns Changing incidence of aphids
Source: Blom et al. (2008), Verhagen et al. (2011)

63Effects of climate change on agriculture in the Netherlands |
FIVE
FIVE
All these factors make it difficult to estimate the probability that the incidence of pests and diseases may develop under future climatic conditions as described in the KNMI’06 scenarios (Blom et al., 2008; Verhagen et al., 2011).

64 | The effects of Climate Change in the Netherlands: 2012
SIX
Effects on public health
Climate change is recognised around the world as having direct and indirect effects on human health (CASHh, 2006; Confalonieri and McMichael, 2007; Huynen et al., 2008; WHO, 2008; De Roda Husman and Schets, 2010; Ebi, 2011; see Figure 6.1). These effects mainly involve an increase, and in some cases a decrease, in the severity and frequency of existing health problems. At-risk groups are the aged, the chronically sick (including asthma patients), infants and socially isolated people.
It is still difficult to determine the actual scale of health problems caused by climate change. The question of which health effects will occur where depends, among other things, on the degree of change (‘burden’), the vulnerability of populations and individuals to changes, and the capacity to adapt. In a number of countries projects are being carried out to acquire more quantitative information on the health risks of climate change. In its Climate Environmental Health Action Plan and Information System (CEHAPS) risk assessment project, the World Health Organization has compiled a set of instruments and indicators to enable such estimates to be made and pilot studies were launched in 2012 in several countries. Progress with these studies will be reported at the sixth Ministerial Conference on Environment and Health in 2016.
The lack of understanding about the scale of health effects resulting from progressive climate change is still considerable (PBL, 2009). For one thing, it is not easy to unravel the degree to which climate change contributes
to health effects from the complex of other (global) developments that affect public health. Changes in people’s behaviour and economic developments often have a dominant influence on public health (Huynen et al., 2005).
In the Netherlands, as elsewhere, climate change will be accompanied by several health risks (Huynen et al., 2008; Gezondheidsraad, 2009; Kennis voor Klimaat/Klimaat voor Ruimte, 2008; Nationaal Kompas Volksgezondheid, 2012). Although it is not possible to compile an accurate assessment of present and future scales of health effects related to climate change in the Netherlands, the effects are expected to be less extensive and easier to manage than in less developed countries (Mackenbach, 2009). Huynen et al. (2008) made a first rough estimate of the scale of health risks related to climate change: according to their estimates, each year climate change could lead to several hundred cases to thousands of cases of illness and a few hundred premature deaths. These are small numbers compared with total annual morbidity and mortality in the Netherlands.
Many effects can be prevented or limited by taking prompt and adequate adaptation measures (PBL, 2009; Deltaprogramma, 2011), including both spatial and non-spatial measures. Spatial measures include adaptations in urban renewal and restructuring and new development to take account of climate change. Non-spatial measures may include such things as technical measures (such as more extensive monitoring), early identification and

65Effects on public health |
SIX
|
assessment of health risks, better public information, cultural and behavioural adaptations, regulatory changes, and making climate resilience an integral part of national and local environmental and planning policies. Such an approach was also agreed on at the fifth Ministerial Conference on Environment and Health in Parma, 2010 (the Parma commitment).
It should be noted that some climate adaptation measures can also have adverse effects on health. For example, spatial improvements to the National Ecological Network may facilitate the dispersal of vector organisms, but also their pest species and parasites. What this means for health risks is not yet known (Scholte et al., 2007), which makes an integrated approach to the climate problem an obvious choice (PBL, 2009).
Possible health effects of climate change in the Netherlands; increasing temperature, extreme heat and air pollutionIn recent decades the average global temperature has risen and extreme temperatures have become more common. It is expected that this trend will continue, resulting in health effects related to temperature, extreme heat and summer smog (Kovats and Ebi, 2006), mainly involving an increase in cases and/or severity of existing complaints and diseases, loss of labour productivity, and possibly premature deaths. Estimates of
the seriousness of these effects differ widely, partly because it is not yet known precisely which aspects of temperature have the greatest effects on health: absolute temperature or differences between day and night temperatures, possibly in combination with relative humidity (thermal comfort). For this reason a start has been made with developing models to estimate the risks of temperature and temperature extremes for health (EU INTARESE, 2010; PESATA, 2011; WHO CEHAPIS, 2011).
Increase in allergies and hay fever Climate change can influence the incidence of allergies and hay fever in the Netherlands in various ways. Higher temperatures can lead to a longer and more intensive growing and flowering season, possibly with a longer and more severe hay fever season as a consequence (Van Vliet, 2008). At the same time, higher CO
2 concentrations may induce plants to produce more pollen (Ziska et al., 2003; Epstein, 2008). Moreover, climate change may allow new allergenic plant species (‘hay fever plants’) to become established in the Netherlands, such as the highly allergenic ambrosia (Huynen and Menne, 2003). It can also influence the dispersal of organisms that affect human health. For example, the rise in temperature has facilitated the spread of the oak processionary caterpillar over large areas of the Netherlands (Van Oudenhoven, 2008; Figure 6.2). The hairs of this caterpillar can cause an allergic and toxic reaction. According to a provisional
Figure 6.1Impacts of Climate change on human health
Climate change
• Respiratory diseases (allergies, hay fever)• Water-, food- and vector- related infections• Air pollution (summer smog)• Water and food shortages
Land coverand land use
Aeroallergens
Invasive species Changes inecosystems and
biodiversity
Food productionsystems
Food supply andfood safety
Water systemmanagement
Urbanisation
Direct health impacts
Indirect health impacts
• Weather extremes (�oods, storms, droughts)• Temperature and heatwaves• Sea level rise
Source: Huynen et al. (2008); Martens (2009); Gezondheidsraad (2009)

66 | The effects of Climate Change in the Netherlands: 2012
SIX
estimate, six million people in the Netherlands now live in areas where the caterpillar is found and about 80,000 suffer health problems as a result (Jans and Franssen, 2008). The caterpillar is expected to be present across the whole country by around 2020, which may lead to increasing health problems and complaints (Van Oudenhoven, 2008). Various municipalities are taking measures to control the caterpillar and, in consultation with the Public Health Services, provide public information to reduce health problems.
Effects on vector-borne infectious diseases difficult to understand and predict; monitoring and surveillance neededVector-borne infectious diseases are transmitted by organisms such as mosquitoes, sand flies and ticks that are infected with bacteria and viruses. The vectors themselves do not themselves cause diseases. The influence of climate change on vector-borne infectious diseases has so far proved difficult to understand or project. Potentially, climate change can lead to wider dispersal and establishment and greater activity of these vectors. However, the system is complex and has not yet been unravelled and described. Moreover, several other developments are also influential, such as globalisation, trade and transport, and tourism and recreation (Takken et al., 2007).
A disease that is often associated with climate change in the Netherlands is Lyme disease (Wardekker et al., 2012). The incidence of this disease, which is transmitted by ticks, has increased in the Netherlands since the 1980s because the ticks are active for longer periods per year, have expanded their range in the Netherlands and carry
more of the bacteria (Den Boon and Van Pelt, 2006). In addition to changes in the Dutch climate, other factors also play a role in this increase in the number of cases, such as increased exposure because more people spend more time visiting heaths and woodlands. The incidence of Lyme disease is expected to increase further, one of the reasons being that the ticks are active for a longer period as a result of increasing temperatures (Takken et al., 2007). Because of the uncertain risk of infection, it is necessary to carry out monitoring and surveillance to remain appraised of new developments, to have action plans ready and to continue to participate in international studies to learn more about the health risks.
Considerable year-to-year variability in waterborne infectious diseases; link with climate change often hard to establish Climate and weather can also influence the quality of surface and recreational waters, and therefore the waterborne infections and diseases they may contain (Hunter 2003; McMichael et al. 2006; Huynen et al., 2008). In general, as water becomes warmer its quality decreases (Huynen et al., 2008; De Roda Husman and Schets, 2010). Recent studies show that the number of health problems resulting from the recreational use of water bodies increased between 1990 and 2009 (CBS et al., 2010b; De Roda Husman and Schets, 2010), although the year-to-year variability is larger than the trend. Moreover, little is known about the degree to which climate change contributes to such an increase compared with the contributions made by other factors (ECDC, 2007), for one thing because warmer weather also encourages more water-based recreation.
Figure 6.2Distribution Oak Processionary caterpillars
1991 2000 2010
Source: CBS et al. (2010)

67Effects on public health |
SIX
Climate change can also have a negative effect on the quality of drinking water production and distribution (WHO, 2010), for example through infection with Legionella bacteria and amoebae (Huynen et al., 2008). The number of reported cases of Legionnaires’ disease has increased in recent years; in 2007–2008 there were 296 reports. This increase is associated with relative humidity, temperature and precipitation intensity (Karagiannis et al., 2009).
Adequate monitoring is an effective instrument for identifying potential infections and informing the public in good time, allowing them to change their behaviour and thus reduce their exposure to infection and the risk of infection.
Climate change will probably reduce food-related infectious diseases Climate change may also lead to health effects related to food safety. For example, rising ambient temperatures lead to higher concentrations of certain pathogens (such as Salmonella and Campylobacter). The number of cases of salmonellosis could potentially increase by between 5% and 10% for each 1 °C rise in temperature (Kovats et al., 2004). Also, rising ambient temperatures and the associated reduction in the quality of drinking and irrigation water may have a negative effect on raw food. However, further research is needed into the causal connections leading to such effects.
Given the high standards of food hygiene in the Netherlands, it is unlikely that these effects will be increased much by climate change. Nevertheless, it is advisable to ensure that food hygiene and adequate monitoring are maintained.

68
SEVE
N
| The effects of Climate Change in the Netherlands: 2012
Effects of climate change on recreation and tourism
Weather and climate have an influence on recreation and tourism (Amelung et al., 2007; De Jonge, 2008). They often determine when and where we go. Recreation and tourism is often mentioned as an economic sector in the Netherlands that can benefit from climate change (e.g. De Jonge, 2008; Nicholls and Amelung, 2008). It is already evident that a warm summer leads to more bookings for holidays in the Netherlands for the following year (Giles and Perry, 1998).
It is expected that climate change will result in greater interest in the Netherlands (and surrounding countries) as a tourist destination. The Netherlands may become warmer and therefore more attractive as a holiday destination and for outdoor activities, while in southern Europe the weather may become less comfortable as the climate becomes hotter and drier (Amelung et al., 2007; PBL, 2009; Perch-Nielsen et al., 2010). Climate change can also affect people’s leisure experience because it will lead to changes in both the landscape (e.g. less snow) and environmental quality (e.g. reduction in the quality of bathing waters) (De Jonge, 2008). In the first place this refers to more Dutch people taking their holidays in their own country and going on more day trips. In addition, foreigners also may visit the Netherlands more often, even though the Dutch weather will remain unpredictable.
But tourism and recreation are not only influenced by the weather and climatic conditions; social, spatial and economic factors also have an influence on the
attractiveness of a destination to tourists, such as the relative price level and the quality of the infrastructure and facilities in the coastal regions and cities. Tourists from all over the world come to the Netherlands mainly to visit its historic cities (De Jonge, 2008). Moreover, not all forms of tourism and recreation are equally dependent on the weather and the climate, or sensitive to climate change. Beach tourism, for example, is highly sensitive to these factors (Moreno et al., 2008). This means that the influence of climate change can vary widely within the tourism and recreational industry.
A measure of the attractiveness of an area for tourism with respect to weather and climate is the Tourism Climatic Index (TCI) (Mieczkowski, 1985; Amelund and Viner, 2006), which is applicable to sightseeing and comparable light outdoor activities. The index takes account of factors like temperature, humidity, sunshine, rain and wind. A score above 70 is very good and above 90 is ideal. Various studies have used the TCI to quantify the effects of climate change on the attractiveness of tourist destinations (e.g. Amelung and Viner, 2006; Amelung et al., 2007; Nicholls and Amelung, 2008).
More periods with good conditions in summer and less favourable conditions in winterIn many parts of Europe the conditions for tourism are traditionally best around the summer months. This is true for Mediterranean destinations, for example, although heat waves and forest fires occur regularly during the summer, and water can become scarce. The best

69Effects of climate change on recreation and tourism |
SEVE
N
SEVEN
|
conditions in the Netherlands are also in the summer. Over the past fifty years the summer season has become longer and the probability of an extended period of good weather during the summer (TCI ≥ 70) has increased (Figure 7.1). TCI analyses indicate that conditions can vary considerably between regions in the Netherlands. In the 1970s only the south-west (Zeeland) had on average three
months with good weather for recreation and tourism. The rest of the country remained stuck on one to two months.
Under the influence of climate change, the observed trend towards longer and better summers is projected to continue (see Figure 7.2), especially the frequency of
Figure 7.1
1950 1960 1970 1980 1990 2000 2010 2020
0
2
4
6
8
10
12Number of periods per year with five consecutive fine days
Observations
Trend
Trend uncertainty
Fine days are days with a score of 70or more on the Tourist Climate Index
Number of fine weather periods in De Bilt (the Netherlands)
Source: PBL (2012)
Figure 7.2
Jan.Feb.
Mar.Apr.
MayJun.
Jul.Aug.
Sept.Oct.
Nov.Dec.
0
20
40
60
80
100Tourist Climate Index (TCI)
1970
2020
2050
2080
Balearic Islands (Spain)
Climatic conditions favourable for tourism
Jan.Feb.
Mar.Apr.
MayJun.
Jul.Aug.
Sept.Oct.
Nov.Dec.
0
20
40
60
80
100Tourist Climate Index (TCI)
De Bilt (the Netherlands)
Source: Amelung (2008)

70 | The effects of Climate Change in the Netherlands: 2012
SEVE
N
warm and sunny weather (beach weather). The probability of favourable weather conditions for summer recreation may also increase in the spring and autumn, extending the (climatological) high season beyond the months of July and August. In a scenario with rapid climate change, the number of good months in the Netherlands may increase quickly to three to four months around 2020, four to five months around 2050 and to five to six months around 2080 (Nicholls and Amelung, 2008). Because the season may become longer, the probability that people will undertake leisure activities at other times of the year will also increase. Nevertheless, the Netherlands is not expected to develop into a tourist honeypot as a result of climate change because the summer weather will probably remain too unpredictable. This makes it difficult to estimate the net effect of a more favourable summer season on the number of long holidays that foreign tourists will spend in the Netherlands. However, a longer and better summer season may well give a boost to outdoor recreational activities, such as swimming, sunbathing, cycling and water sports, and it is expected that the Dutch will spend their holidays in their own country more often.
The consequences of climate change for the recreation and tourism sector in the Netherlands also have a negative side, such as a deterioration in the quality of surface waters due to higher temperatures, and changes in water levels, precipitation and drought. In addition, as the winters become less cold the chances of periods with enough natural ice to support skating events such as the Eleven Cities race (Elfstedentocht) may eventually decline; a trend that has already been observed (Visser and Petersen 2008).

71Effects of climate change on recreation and tourism |
SEVE
N

72
EIG
HT
| The effects of Climate Change in the Netherlands: 2012
Policy responses to the effects of climate change
8.1 Introduction
In this report, the PBL Netherlands Environmental Assessment Agency reviews recent findings on climate change in the Netherlands, the observable – positive and negative – effects of climate change and the probability and risks of further climate change over the coming decades. In this chapter we ascertain the level of policy interest in these effects of climate change on national, European and global scales (Section 8.2) and the degree to which the potential risks have been recognised and appropriate adaptation plans and measures have been adopted (Section 8.3).
8.2 Policy response in the Netherlands
Policy interest in the effects of climate change in the Netherlands started to be articulated more clearly when the inter-authority programme Spatial Adaptation to Climate Change (ARK) was established in 2006. This programme brought together the former ministries of Housing, Spatial Planning and the Environment (VROM), Agriculture, Nature and Food Quality (LNV), Transport, Public Works and Water Management (VenW) and Economic Affairs (EZ) as well as the Association of Provincial Authorities (IPO), the Association of Netherlands Municipalities (VNG) and the Association of Regional Water Authorities (UvW). The programme was
coordinated by the Ministry of Housing, Spatial Planning and the Environment. The key principles underlying the adaptation options were resistance, resilience and flexibility. The programme also led to various local and regional initiatives, which are still continuing.
In 2007, the National Adaptation Strategy 2007–2014 was adopted (VROM et al., 2007). The National Adaptation Strategy and the implementation programme Spatial Adaptation to Climate Change (ARK) cover many policy fields, such as mobility, nature conservation, agriculture, water management, public health, energy, housing, industry and recreation (VROM, 2006; VROM et al., 2007). The ARK programme came to an end when the Delta Programme began in 2010. The Delta Programme contains new government priorities for climate risks and climate adaptation, with an emphasis on flood safety, freshwater supplies, spatial planning and urban restructuring and development measures to tackle the problems of heavy rainfall, drought and heat (Deltaprogramma, 2010). The Delta Programme has its legislative basis in the Delta Act, which came into force in January 2012.1 This Act sets out the financial arrangements and the responsibilities of the Delta Commissioner (a government commissioner tasked with drawing up a Delta Programme each year and reporting to the House of Representatives on progress made with its implementation). The Delta Act is also the legislative basis for a new Delta Plan, which describes how flood safety and freshwater supplies will be secured in future.
73Policy responses to the effects of climate change |
EIG
HT
EIGHT
|
The ARK programme and the Delta Programme, backed by the research programmes Climate changes Spatial Planning (2006–2011) and Knowledge for Climate (2008–2014), have initiated many developments. Both research programmes have generated much information and knowledge and inform the development of new expertise, creating awareness and shaping cost-effective action by central government, the provincial and municipal authorities, water authorities and other societal actors. In 2008 the ARK programme asked PBL Netherlands Environmental Assessment Agency to explore strategic options for a climate-proof development of the Netherlands. This led to the programming study ‘Roadmap to a climate-proof Netherlands’ (PBL, 2009) and – in close cooperation with the aforementioned research programmes – the study Climate Adaptation in the Dutch Delta: Strategic options for a climate-proof development of the Netherlands (PBL, 2011). The effects and risks of climate change have now been incorporated into many Dutch policies. Below we describe which policies these are and the extent to which they now respond to climate change.
Water risks associated with climate change embedded in the Delta ProgrammeThe climate-related risks of flooding from the sea and/or the rivers are particularly relevant to the Netherlands. The National Policy Strategy for Infrastructure and Spatial Planning identifies the reservation of areas for flood control, ensuring sustainable freshwater supplies and frameworks for urban development/redevelopment as issues of national interests. The possible but still uncertain effects of climate change on these national interests are embedded in the Delta Programme. Under this programme further studies are being carried out into the risks of flooding and disruption to freshwater supplies and the works needed to counter these risks; these studies are based on long-term socioeconomic scenarios and climate scenarios. In 2014 the Delta Programme will result in a proposal for several strategic decisions (the ‘Delta decisions’). It also pays particular attention to relevant aspects of spatial planning in general and urban planning in particular (new urban development and restructuring).
The increasing risk of flooding and water damage as a result of an increase in the frequency and intensity of extreme precipitation events has already been addressed in the National Administrative Agreement on Water (NBW) (VenW et al., 2003). This agreement contains working standards for acceptable risks of flooding or water damage for various land uses and agreements have been made on bringing the regional water systems up to the required standards in 2015, partly in relation to the expected climate change.
International coordination needed to control and manage extreme high and low river dischargesWater management upstream from the Netherlands can be crucial in determining both peak and low river discharges. The peak discharges that can reach the Netherlands are buffered by flooding further upstream in Germany, where the safety standards are lower than in the Netherlands. The effects of higher peak discharges as a consequence of climate change will be felt mainly in Germany. If the water management regime upstream remains the same, flooding in these areas will attenuate the peak discharges entering the Netherlands at Lobith, which as a result will be just a little higher than normal (see Figure 3.7). If Germany maintains its current water management regime and does not take any measures in addition to the current improvement programme (dyke situation in 2020), there is a very slight chance that the design discharge of 18,000 m3/s – the basis for the planned measures and reservation zones for flood control, as in the Room for the River programme – will be exceeded. However, water may enter the Netherlands other than via the rivers, for example if there is flooding just over the border with Germany.
The EU Floods Directive lays the foundations for international coordination on peak discharges and flood risk management. Member States are required to prepare flood risk management objectives and measures at river basin level. The directive formally came into force in 2007 and has yet to prove its value in practice. For the Netherlands there is a formal framework for considering options for managing the flood risks in the Netherlands and in the countries along the Rhine and Meuse in an integrated package.
In dry summers, when the river discharges are low, water use upstream could further reduce the available water flowing into the Netherlands. There is as yet no formal framework for the international distribution of Rhine water in extremely dry years and no international agreements on this have been made. However, it is extremely important that firm international agreements are made because in summer the Rhine is by far the largest source of fresh water for the Netherlands and because it is important to maintain a minimum water level in the Waal, the main distributary of the Rhine and a heavily trafficked shipping lane. For the Meuse catchment, the Netherlands and Belgium have made agreements in the Meuse discharge treaty on the distribution of Meuse water during periods of low discharge.

74 | The effects of Climate Change in the Netherlands: 2012
EIG
HT
Risks of declining water quality embedded in the Water Framework DirectiveClimate change may not only have effects on water volumes (too much or too little), but also on water quality (see also Chapter 3). In particular, higher water temperatures can increase the likelihood of blue-green algal blooms and reduced water quality. The Dutch policy developed in response to this threat is consistent with the requirements of the Water Framework Directive (WFD). The current Dutch river basin management plans under the WFD (2009) contain a separate chapter on climate change and its expected effects on water quality and the ecology of water systems. Based on available knowledge, this chapter notes that incorporation of the impacts of climate change into the baseline scenario will widen the gap between the desired and expected ecological status in 2017 (see also PBL, 2008). The next set of river basin management plans (2015) could include further provisions for integrating the consequences of climate change more fully into the implementation of policy.
Several health risks embedded in action plans and existing monitoring structuresClimate change may also have an influence on human and animal health. At the national level in the Netherlands little attention has been given to the risks of climate change in relation to public health. For example, the national climate change adaptation strategy has not been operationalised for public health aspects. Most of the attention to this aspect of climate change has been given to heat stress and water-, food- and vector-borne infectious diseases.
In addition, the authorities remain continually alert to the possible spread of both human and agricultural pests and infectious diseases, for which there is an infrastructure of national and global monitoring activities and surveillance programmes, as well as consultation on and coordination of control measures. This infrastructure is needed even without climate change because of several non-climate-related factors, such as global transport movements, trade and tourism.
In the Netherlands, the National Institute for Public Health and the Environment (RIVM) and the Public Health Services (GGDs) are involved in these programmes. In addition, the WHO coordinates global monitoring and surveillance activities through the Global Outbreak and Response Network (GOARN). This worldwide technical collaboration of existing institutions and networks pools human and technical resources for the rapid identification, confirmation and control of twenty infectious diseases that are known to pose risks to human health. At the European level this monitoring programme is coordinated by the European Centre for
Disease Prevention and Control (ECDC). The ECDC is a strategic partner of the WHO and GOARN and collaborates with the national public health institutes of the EU Member States; in the Netherlands this is the RIVM. It is now clear that a European system for monitoring the distribution of species needs to be strengthened, also because as climate zones shift the distribution of species can change, including the distribution of vector-borne diseases. This recognition of the need for such a European monitoring system may be included in the forthcoming European Adaptation Strategy.
Following the extreme heat wave of 2003 a Dutch National Heat Stress Plan was drawn up to protect vulnerable groups in the population against the consequences of heat stress, mainly through the provision of extra care and practical advice on appropriate behaviour. However, these action plans have yet to prove their worth in practice. The New Urban Development and Restructuring sub-programme of the Delta Programme also addresses the problem of reducing the health effects of heat and maintaining good water quality during periods of extreme rainfall and drought in urban areas. It takes an integrated approach to improving the climate resilience of cities. Some municipalities are already developing and implementing action plans to this end, based partly on calculations made using the climate module in the Atlas for the Living Environment (Atlas Leefomgeving: www.atlasleefomgeving.nl). These action plans can be most effective if they are implemented through urban restructuring and new development projects (PBL, 2011).
In addition, in the Parma Commitment to Act (adopted by the fifth Ministerial Conference in Parma, 2010) the Netherlands has agreed to develop specific policies to prevent or reduce the effects of climate change on health. Implementation of this Parma agreement in Dutch policy is currently the subject of interdepartmental consultations.
To restrict the additional health effects of climate change in the Netherlands, further policy responses are needed to improve the effectiveness of adaptation measures, the implementation of recommendations on healthcare and changes in behaviour, and the early detection (monitoring) and assessment of risks and diseases. Further, it is important that urban renewal and restructuring should take account of climate adaptation, as proposed in the New Urban Development and Restructuring sub-programme of the Delta Programme. This policy strategy will put into practice the proposals contained in the European Commission’s White Paper on adapting to climate change, endorsed by the EU, and the

75Policy responses to the effects of climate change |
EIG
HT
EIGHT
previously mentioned Parma Commitment, and enables a flexible and adaptive management strategy for climate change and health. This policy can be amended as more becomes known about the observed effects, future risks, the effectiveness of adaptation measures and the role of government and institutions in pursuing an effective and efficient adaptation policy (PBL, 2009; PBL, 2011; Ebi, 2011; Driessen and Van Rijswick, 2011; Runhaar et al., 2012). Several research programmes have been set up to improve our understanding of the relation between climate change and health. Dutch research institutes, including PBL, RIVM, Wageningen University and Research Centre (WUR) and Maastricht University, are participating in international risk assessment projects (e.g. EU INTARESE 2010; WHO CEHAPSIS 2011) and in projects for monitoring vectors and infections (Braks et al., 2011; ECDC, 2012; ECDC VBORNET; EU ENHanCE).
Little Dutch policy response to the risks of climate change to ecosystems and biodiversityAt the moment there has been little policy interest in the Netherlands to the possible effects of climate change on ecosystems and biodiversity. In 2008–2009, at the request of the Ministry of Agriculture, Nature and Food Quality (LNV), PBL carried out a study into the strategic options for climate-proofing biodiversity in the Netherlands (PBL, 2010). This study revealed that the National Ecological Network (EHS) and the European Natura 2000 network provide a solid platform for making Dutch ecosystems and biodiversity more climate-resilient (PBL, 2010).
As climate zones gradually shift, an adapted EHS with good ecological corridors and optimal site conditions can help species to migrate to more favourable areas and climate zones. However, this will require a change in the national government’s current thinking on the EHS with a shift in emphasis towards enlarging, connecting and improving certain valuable conservation areas. These areas, such as large existing wetlands, form the ecological strongholds of biodiversity that are also connected to similar areas elsewhere (via ‘climate adaptation zones for wetland and dunes and coastal ecosystems) as well as areas within clusters that contain a high densityof nature sites (heathland, forests). Possibilities for adapting the EHS include concentrating sites to be acquired or laid out for nature conservation within these areas. The climate resilience of these areas can be increased further by linking them to the European Natura 2000 network in neighbouring countries. This is the case, for example, for the Dutch wetlands, which form a core area of these ecosystems within North-West Europe. In addition, climate-proofing nature conservation policy will require a revision of the conservation objectives. Because the current conservation objectives are defined in static
terms, the chances of achieving these objectives under increasing climate change will recede, as will the probability that the Netherlands will meet its international obligations (PBL, 2010; PBL, 2011). The new policy should focus more on the functioning of ecosystems and increasing their adaptive capacity and less on conserving specific species in specific places.
The probability of natural fires breaking out may increase under climate change as dry periods with precipitation deficits in summer could become more frequent. The National Risk Assessment (BZK, 2009) contains a scenario for ‘uncontrollable natural fires and large-scale evacuation’, which is classified as ‘highly conceivable’. The Netherlands does not have a coherent policy for natural fires, certainly in comparison with other physical safety risks, and there is no clear division of responsibilities between the various tiers of government. To improve this situation a national project on Inter-authority Collaboration on Natural Fires was launched in December 2009. In addition, an online National Information Hub on Natural Fires was recently established (www.infopuntnatuurbranden.nl).
Climate-proofing spatial development in the Netherlands is a complex taskThere are many possible measures for making the Netherlands less vulnerable to climate change, including measures designed to change public behaviour and management practices, technical measures and spatial planning measures. To maintain a good living and working environment in the Netherlands, problems arising from flooding, drought and heat cannot be tackled by taking technical measures alone, but will also require changes in land-use planning and the design and layout of buildings and infrastructure. This is set out in the New Urban Development and Restructuring sub-programme of the Delta Programme.2
Over the coming decades particular attention will have to be given to spatial adaptation measures: the decisions to be made on spatial development will determine not only how resilient the Netherlands will be to climate change, but also the options that will be available to future generations for coping with and adapting to climate change (PBL, 2009, 2011). This was recognised early on, before the launch of the national adaptation policy and the interdepartmental programme Spatial Adaptation to Climate Change (ARK) (VROM et al., 2006).
The government’s National Policy Strategy for Infrastructure and Spatial Planning (IenM, 2011) is based on a further decentralisation of spatial planning responsibilities and refers to the Delta Programme for tasks relating to climate change, but does not mention

76 | The effects of Climate Change in the Netherlands: 2012
EIG
HT
the spatial requirements for and possible spatial consequences of the necessary climate-resilient development patterns (PBL, 2011). However, as the Climate Adaptation in the Dutch Delta study (PBL, 2011) shows, integrating climate resilience into spatial planning policy may have significant consequences. These will necessitate some strategic choices, for example about protecting the most vulnerable areas in the Netherlands against flooding (and the relevant safety standards), about steering the location and nature of future spatial development in the Rhine-Meuse floodplain and the development and restructuring of urban areas, about spatial adaptation for climate-resilient ecosystems and biodiversity, and about the distribution of fresh water in relation to its use in the regions. At the local and regional scales in particular, there are many opportunities for improving climate resilience in a cost-effective way while at the same time raising environmental quality, both in urban areas (new development and restructuring) and in rural areas (area development). These issues must be addressed early on in the planning and design process and also require more innovative and flexible financing mechanisms (PBL, 2011). Finally, an integrated approach is needed to properly address related problems, such as the link between the greening of urban areas (to reduce heat stress, among other objectives) and the spread of vector-borne diseases.
There is a close relation between long-term flood safety and freshwater supply in the various regions covered by the Delta Programme: the IJsselmeer region, the Rhine-Meuse floodplain, the south-west delta and the Rijnmond region (the greater Rotterdam region). To make balanced decisions, not only at the level of these individual regions but especially from a national perspective, proposals should be complementary and consistent. This is a complex task within the Delta Programme, with central government having overall responsibility for the major water bodies and the National Ecological Network, the provincial authorities having responsibility for spatial planning and nature conservation policies, and the market-driven agricultural sector having a major interest in regional water management. It is therefore difficult to anticipate how the national government responsibilities, decentralised spatial planning responsibilities and the various sector interests will resolve themselves into strategic decisions for the long term (see also the next section).
International competitive position: opportunities for the Netherlands in relation to climate change?The geographical location of the Netherlands also confers some opportunities arising from climate change, especially for the agricultural, recreation and tourism sectors. The competitive position in comparison to
southern Europe is expected to improve if climate change continues. For agriculture it is important that the Netherlands is able to maintain an adequate freshwater supply. The development of a national strategy to ensure a long-term freshwater supply in the Netherlands is included in the Delta Programme (2010, 2011) and strategic options have already been drawn up in the Climate Adaptation in the Dutch Delta study (PBL, 2011).
Although agriculture, biodiversity and recreation were given special consideration in the inter-authority programme Spatial Adaptation to Climate Change (VROM, 2006), more recent policy documents contain no clear indication that this dimension of climate change is being addressed at the national policy-making level. In principle, therefore, the sectors themselves will have to exploit the opportunities presented by climate change. The European Commission will also stimulate this as part of its aim of integrating climate change policy into policies for the various economic sectors (mainstreaming). However, the Dutch tourism sector is paying little attention to climate change, partly because it has a short-term focus and lacks the required knowledge, for example about the demands made by the different types of leisure activities on the climate (De Jong, 2008;. Acquiring in-depth knowledge about the consequences of climate change for recreation and tourism would enable the sector to become more climate-resilient and profit from the economic opportunities.
8.3 Adaptation in international climate change policy
Climate adaptation in EuropeThere is considerable policy interest in climate change adaptation at the European level. In April 2009 the European Commission announced its plans in a White Paper on adapting to climate change. These plans are based on four pillars of action: (i) building a solid knowledge base; (ii) integrating adaptation into other policy processes (mainstreaming); (iii) employing a combination of policy instruments and developing an effective financing system; (iv) stepping up cooperation between Member States and between the EU and other countries in the world (‘solidarity between Member States and regions’). The knowledge base is now taking shape because the Commission has initiated the necessary research projects and developed a digital platform/website to pull together all the available information.3 In addition to much international information on climate effects, measures and plans, the platform contains an overview of adaptation activities in the Member States.4 These country pages have been

77Policy responses to the effects of climate change |
EIG
HT
EIGHT
compiled and are maintained by the Member States themselves.
The other three pillars of action will be addressed in the EU Adaptation Strategy to be published in April 2013. To prevent overlaps with the approaches being taken in the Member States, the EU is working closely with the Member States on the preparation of the European strategy. Thought is being given to a reporting obligation on climate adaptation (to support the fourth pillar) and the Commission is consulting with the Member States to ensure these reports are as simple, meaningful and effective as possible.
Climate adaptation in EU sector policies The mainstreaming of climate adaptation in EU sector policies has begun. Under the European Commission’s current proposals, the next multi-year programme will reserve 20% of the total EU budget for climate mitigation and adaptation. This includes the sectors with large budgets, including the Common Agricultural Policy (CAP5), the regional cohesion and structural funds, research funds (Horizon 2020) and the energy and transport networks. The Commission is also working towards policy integration outside these budgetary commitments.6
The EU Floods Directive and the Water Scarcity and Drought Strategy also address problems of too much and too little water (see also above). In both these cases climate change plays a significant role. The EU Water Framework Directive (WFD) requires the Member States to consider the possible adverse effects of climate change on water quality when implementing the WFD into national legislation, and under the Marine Strategy Framework Directive and supporting documents, Member States are asked to indicate in their reports how they are responding to climate change.7 Developments are still in the early stages.
Climate adaptation, as well as mitigation, is being integrated into the various components of the CAP.8 For example, the Commission has drawn up various measures for more sustainable agricultural production, including sustainable water use during periods of drought and sustainable land use. In addition, funds may be made available to compensate farmers, and possibly regions, for adverse climate change effects, and subsidies may be available for services that are not linked to specific production processes or volumes.9
Furthermore, the EU recognises the risks of climate change to biodiversity and ecosystems, as well as the contribution that natural systems make to climate change (ecosystems contain large amounts of carbon and play a
role in the regulation of the climate). Limiting the effects of climate change on biodiversity and reducing the contribution made by natural systems to climate change are therefore pillars of the European Commission’s biodiversity action programme (European Commission, 2010). By further developing the European ecological network Natura 2000, it is expected that ecosystems will be better able to adapt to climate change and continue to provide ecosystem services, such as soil protection and water retention, over the long term.10
The European Commission plans to address the health effects of climate change in a new strategy document,11 for which guiding principles are currently being developed. The Commission has drawn up proposals for a European system for monitoring the distribution of vector-borne diseases, which will tie in closely with national networks. In addition, under the Parma Commitment to Act, adopted at the fifth Ministerial Conference in Parma, 2010, the EU Member States have agreed to develop policies on mitigating or adapting to climate-related health risks. This agreement contains six concrete actions:1. Integrate health issues into climate change mitigation
and adaptation policies in all sectors and at all levels.2. Strengthen healthcare and environmental services to
improve their capacity to prevent or cope with climate effects.
3. Strengthen (early) monitoring of weather extremes and possible outbreaks of diseases.
4. Implement information and awareness raising programmes on the health effects of climate change.
5. Strengthen the contribution made by the health sector to reducing greenhouse gas emissions.
6. Stimulate research and develop instruments for monitoring and estimating the present and future health risks of climate change, identifying at-risk groups and assessing the effectiveness of mitigation and adaptation measures.
Finally, the European Commission has indicated that climate change mitigation and adaptation should be considered in environmental assessments,12 and wants to include climate adaptation in the country reports on climate change. The Commission, the European Parliament and the Member States are currently discussing these proposals.13
Global funds for adaptation in developing countries At the global level, adaptation to climate effects is part of the climate negotiations under the UN climate convention (UNFCCC). In general terms, the adaptation issues of UNFCCC are about giving support to developing countries – especially the least developed countries and the small

78 | The effects of Climate Change in the Netherlands: 2012
EIG
HT
island states – so that they can adapt to the consequences of climate change.
During one of the Conferences of Parties (COP) – in Nairobi in December 2006 – this objective was defined in more specific terms in a call to improve their understanding of the effects and adaptation measures (Nairobi work programme, NWP). In December 2007 the Bali Action Plan was adopted. This identifies climate adaptation as one of the key building blocks for an effective, sustained and cooperative response to climate change.14 The Action Plan sets out possible activities and opportunities for financing, based around the key principles of international cooperation and a global climate fund. These ideas were developed further during the subsequent COPs, particularly during the Cancun COP in 2010, which decided to set up a Green Climate Fund to support climate actions in the developing countries, including climate adaptation measures.
Apart from these financial arrangements, the Cancun COP agreed to establish an Adaptation Committee to guide future adaptation activities, monitor progress with these activities and provide technical support to the parties. During the 2011 COP, held in Durban, South Africa, agreement was reached on:• the modalities, procedures and composition of the
Adaptation Committee;• developing a method for describing and quantifying
the impacts and damage associated with climate change in developing countries;
• modalities and guidelines for the national adaptation plans (NAPAs).
Many countries have picked up on this by explicitly including adaptation in their National Communications to the climate secretariat, and many developing countries have started drawing up their NAPAs.15
The Adaptation Committee has the following functions:• providing technical support and guidance to the
countries;• sharing relevant information;• promoting cooperation between international,
national and local organisations;• drawing up a list of recommendations – based on
experiences in countries that already have an adaptation strategy – to countries that still have to take appropriate actions, including finance, technology and capacity-building.16
The WHO stimulates and coordinates international cooperation on climate mitigation and adaptation related to public health. The WHO coordinates various projects to collect baseline health data, develop and implement risk assessment methods, compile climate adaptation
strategies and prepare and roll out adaptation plans in line with the Parma agreement mentioned above. Implementation strategies are now being prepared under the supervision of the WHO, focusing on heat stress, allergies, air pollution, and water-, food and vector-borne infectious diseases.
79Policy responses to the effects of climate change |
EIG
HT
EIGHT
Notes1 The Delta Act is a formal amendment of the Water Act.
2 Http://www.rijksoverheid.nl/onderwerpen/
deltaprogramma/deelprogrammas/
deelprogramma-nieuwbouw-en-herstructurering.
3 See http://climate-adapt.eea.europa.eu/.
4 See http://climate-adapt.eea.europa.eu/web/guest/
Countries.
5 Http://ec.europa.eu/agriculture/climate_change/
index_en.htm.
6 See also http://climate-adapt.eea.europa.eu/web/guest/
eu-sector-policy/general.
7 See climate-adapt.eea.europa.eu/web/guest/coastal-areas.
8 See climate-adapt.eea.europa.eu/web/guest/
agriculture-and-forestry.
9 See http://ec.europa.eu/agriculture/climate-change/
index_en.htm.
10 See http://climate-adapt.eea.europa.eu/web/guest/
biodiversity.
11 See ec.europa.eu/health/climate_change/policy/
index_en.htm.
12 See ec.europa.eu/environment/eia/home.htm.
13 See http://ec.europa.eu/clima/consultations/0008/
index_en.htm.
14 See http://unfccc.int/adaptation/items/4159.php.
15 Http://unfccc.int/cooperation_support/least_developed_
countries_portal/submitted_napas/items/4585.php.
16 Http://unfccc.int/adaptation/cancun_adaptation_
framework/adaptation_ committee/items/6053.php.

80 | The effects of Climate Change in the Netherlands: 2012
References
SummaryDelta Commissie (2008) Working together with water.
A living land builds for its future. Findings of the Deltacommissie 2008. http://www.deltacommissie.com/doc/deltareport_full.pdf
Delta Programme (2010) Working on the delta. Investing in a safe and attractive Netherlands, now and in the future. http://www.deltacommissaris.nl/english/Images/Deltaprogramma_ENG1_tcm310-286802.pdf
EU (2009) Adapting to climate change: Towards a European framework for action. White Paper on Climate Change Adaptation, 17pg, http://ec.europa.eu/clima/sites/change/what_is_eu_doing/index_en.htm
Katsman C.A., W. Hazeleger, S. S. Drijfhout, G. J. van Oldenborgh, & G. Burgers (2008), Climate scenarios of sea level rise for the northeast Atlantic Ocean: a study including the effects of ocean dynamics and gravity changes induced by ice melt. Climatic Change, 91:351-374. doi:10.1007/s10584-008-9442-9.
Katsman, C.A., A. Sterl, J.J. Beersma, H.W. van den Brink, J.A. Church, W. Hazeleger, R.E. Kopp, D. Kroon, J. Kwadijk, R. Lammersen, J. Lowe, M. Oppenheimer, H.-P. Plag, J. Ridley, H. von Storch, D.G. Vaughan, P. Vellinga, L.L.A. Vermeersen, R.S.W. van de Wal & R. Weisse (2011b), Exploring high-end scenarios for local sea level rise to develop flood protection strategies for a low-lying delta—the Netherlands as an example. Climatic Change 109: 617-645doi:10.1007/s10584-011-0037-5.
KNMI (2009b) Klimaatschetsboek Nederland het huidige en toekomstige klimaat. Bessembinder, J. (Ed). KNMI rapport 223, De Bilt, http://www.knmi.nl/publications/ showAbstract.php?id=7129.
Klijn F., J. Kwadijk, K. de Buijn & J. Hunink (red) (2010), Overstromingsrisico’s en droogterisico’s in een veranderend klimaat, Deltares rapport 1002565, Delft.
Lammersen R., (2004) Grensoverschrijdende effecten van extreem hoogwater op de Niederrhein, Eindrapport. Ministerie van Verkeer en Waterstaat and Bundesanstalt fur Gewasserkunde, Koblenz, Duitsland.
PBL (2011), Climate adaptation in the Dutch delta. Strategic options for a climate proof development of the Netherlands. PBL Netherlands Environmental
Assessment Agency, PBL publication number 500193002, Den Haag/Bilthoven.
Vellinga, P., C. Katsman, A. Sterl, & J. Beersma (2008), Onderzoek naar bovengrensscenario’s voor klimaatverandering voor overstromingsbescherming van Nederland. Achtergrondrapport Deltacommissie. www.deltacommissie.com/doc/Onderzoek%20 naar%20bovengrensscenario’s%20-%20KNMI.pdf.
Chapter 1: IntroductionCiscara, J.C., A. Iglesias, L. Feyen, L. Szabó, D. Van
Regemorter, B Amelung, R. Nicholls, P. Watkiss, O.B. Christensen, R.R Dankers, L. Garrote, C.M. Goodess, A.Hunt; A. Moreno, J. Richards, & A. Soria (2010), Physical and economic consequences of climate change in Europe, Proceedings Nat. Academy of Science 108(7):2678–2683, www.pnas.org/cgi/doi/10.1073/pnas.1011612108EEA
(2008), Impacts of Europe’s changing climate – 2008 indicator-based assessment. Rapport Europees Milieuagentschap no 2008/4, Copenhagen, http://www. eea.europa.eu/publications/eea_report_2008_4.
EEA (2010), Understanding climate change, Achtergrondrapport The European environment – state and outlook 2010 report, Rapport Europees Milieuagentschap, Copenhagen, http://www.eea. europa.eu/soer/europe/understanding-climate-change.
IPCC (2012), Managing the Risks of Extreme Events and Disasters to Advance Climate Change. Special Report of the Working Group I and II of the Intergovernmental Panel on Climate Change (IPCC), http://www.ipcc.ch/#.
MNP (2005), The effects of climate change in the Netherlands. Rapport Milieu- en Natuurplanbureau report number: 773001037, http://www.pbl.nl/sites/default/files/cms/publicaties/773001037.pdf
Chapter 2: How is the Dutch climate changing?Buishand, T.A., R. Jilderda, & J.B. Wijngaard (2009):
Regionale verschillen in extreme neerslag. KNMI, Wetenschappelijk rapport WR 2009-1.
CBS, PBL, Wageningen UR (2012a), Temperatuur mondiaal en in Nederland, 1850-2008 (indicator 0226). www. compendiumvoordeleefomgeving.nl. CBS, Den

81References | |
Haag; Planbureau voor de Leefomgeving, Den Haag/ Bilthoven en Wageningen UR, Wageningen.
CBS, PBL, Wageningen UR (2012b), Neerslagsom in Nederland, 1906-2011 (indicator 0508,). www.compendiumvoordeleefomgeving.nl. CBS, Den Haag; Planbureau voor de Leefomgeving, Den Haag/ Bilthoven en Wageningen UR, Wageningen.
Deltacommissie (2008), Samen werken met water. Een land dat leeft, bouwt aan zijn toekomst. Bevindingen van de Deltacommissie, http://www.deltacommissie. com/
Foster, G. & S. Rahmstorf (2011), Global temperature evolution 1979-2010. Env. Res. Letters 6, 044022.
IPCC (2007), Climate change 2007: the physical science basis. Cambridge University Press, Cambridge, UK. IPCC (2011), Managing the Risks of Extreme Events and
Disasters to Advance Climate Change. Special Reportof the Working Group I and II of the Intergovernmental
Panel on Climate Change (IPCC). Summary for policy makers, http://ipcc-wg2.gov/SREX/images/uploads/ SREX-SPM_ Approved-HiRes_opt.pdf.
KNMI (2006), Klimaat in de 21e eeuw – vier scenario’s voor Nederland. KNMI, De Bilt, http://www.knmi.nl/ cms/content/88238/knmi06_klimaatscenarios_voor_ de_21e_eeuw
KNMI (2008a), De toestand van het klimaat in Nederland 2008. KNMI, De Bilt, http://www.knmi.nl/cms/content/67080/de_toestand_van_het_klimaat_in_nederland_2008
KNMI (2008b), Extreme klimaatverandering en waterveiligheid in Nederland; Bessembinder (Ed.) KNMI publicatie 221, De Bilt, http://www.knmi.nl/ bibliotheek/.../knmipub221.pdf.
KNMI (2009a), Klimaatverandering in Nederland; Aanvullingen op de KNMI’06 scenario’s, Klein Tank, A.M.G. en G. Lenderink (eds.), KNMI rapport 233, De Bilt, http://www.knmi.nl/cms/content/67290/aanvullingen_op_de_knmi06_klimaatscenarios
2009. KNMI (2009b), Klimaatschetsboek Nederland het huidige en toekomstige klimaat. Bessembinder, J. (Ed). KNMI rapport 223, De Bilt, http://www.knmi.nl/publications/ showAbstract.php?id=7129.
KNMI (2010), Risicosignalering Droogte, factsheet KNMI, http://www.knmi.nl/klimatologie/ achtergrondinformatie/pnv_droogte_250309.pdf.
KNMI (2011), De Bosatlas van het klimaat, Noordhoff Uitgeverij, Groningen, www.klimaatatlas.nl.
Kwadijk, J., A. Jeuken, & H. van Waveren (2008), Deklimaatbestendigheid van Nederland Waterstand. Verkenning van knikpunten in beheer en beleid voor het hoofdwatersysteem. Deltares rapport T2447, Delft.
Lenderink, G. & E. van Meijgaard (2008), ‘Extreme zomerneerslag in Nederland’ in Bessembinder J (Ed) Extreme klimaatverandering en waterveiligheid
in Nederland; Bessembinder (Ed.) KNMI publicatie 221, De Bilt, http://www.knmi.nl/bibliotheek/.../knmipub221.pdf.
Lenderink, G. & E. van Meijgaard (2008), Increase in hourly precipitation extremes beyond expectations from temperature changes. Nature Geoscience 1(8): 511-514.
Lenderink, G., E. van Meijgaard & F. Selten (2009), Intense coastal rainfall in the Netherlands in response to high sea water temperatures: analysis of the event of august 2006 from the perspective of a changing climate. Climate Dynamics, 32:19-33.
Lüthi, D, M. Le Floch, B. Bereiter, Th. Blunier, J.M. Barnola, U. Siegenthaler, D. Raynaud, J. Jouzel, J, H. Fischer, H. Kawamura & T.F. Stocker (2008), High-resolution carbon dioxide concentration record 650,000–800,000 years before present. Nature 453, 379-382 (15 May 2008).
NOAA/ESRL (2011), http://www.esrl.noaa.gov/gmd/ccgg/trends/global.html.
Van Oldenborgh, G.J, S. Drijfhout, A. van Ulden, R. Haarsma, A. Sterl, C. Severijns, W. Hazeleger & H. Dijkstra (2009), Western Europe is warming much faster than expected. Climate of the Past 5, 1-12.
PBL (2009), News in Climate Science and Exploring Boundaries A Policy brief on developments since the IPCC AR4 report in 2007. PBL Netherlands Environmental Assessment Agency, rapport nr.500114013 den Haag/Bilthoven, http://www.pbl.nl/ sites/default/files/cms/publicaties/500114013.pdf.
PBL (2010), Assessing an IPCC assessment An analysis of statements on projected regional impacts in the 2007 report. Planbureau voor de Leefomgeving , rapport nr. 500216002 Den Haag/Bilthoven, http://www.pbl.nl/ en/publications/2010/Assessing-an-IPCC-assessment.- An-analysis-of-statements-on-projected-regional- impacts-in-the-2007-report.
PCCC (2009), Staat van het klimaat 2008. Actueel onderzoek en beleid nader verklaard. Uitgave Klimaatportaal PCCC, http://www.klimaatportaal.nl/ pro1/general/start.asp?i=5&j=1&k=8&p=5&itemid=651.
PCCC (2010), Staat van het klimaat 2009. Actueel onderzoek en beleid nader verklaard. Uitgave Klimaatportaal PCCC, http://www.klimaatportaal. nl/pro1/general/start.asp?i=1&j=3&k=0&p=0&item id=803.
PCCC (2011), Staat van het klimaat 2010. Actueel onderzoek en beleid nader verklaard. Uitgave Klimaatportaal PCCC, http://www.klimaatportaal. nl/pro1/general/start.asp?i=8&j=1&k=0&p=0&item id=1032.
Smits, A., AM.G. Klein Tank & G.P. Können (2005), Trends In Storminess Over The Netherlands, 1962–2002. Int. J. Climatol. 25: 1331–1344.

82 | The effects of Climate Change in the Netherlands: 2012
Van Beek, E., M. Haasnoot, K.M. Meijer, J.R. Delsman, J.J.J.C. Snepvangers, G. Baarse, R. van Ek, G.F. Prinsen, J.C.J. Kwadijk & J.W. van Zetten (2008), Verkenning kosteneffectiviteit van grootschalige maatregelen tegen droogteschade als gevolg van de G+ en W+ klimaatscenario’s. Deltaresrapport T2498, Delft.
Hurk, B.J.J.M. van den, A.K. Tank, G. Lenderink, A. van Ulden, G.J. van Oldenborgh, C. Katsman, H. van den Brink, F. Keller, J. Bessembinder, G. Burgers, G. Komen, W. Hazeleger & S. Drijfhout (2006), KNMI Climate Change Scenario’s 2006 for the Netherlands. Wetenschappelijk Achtergrondrapport KNMI WR 2006-01, de Bilt.
Van Dorland, R. (2006) (Ed), Scientific Assessment of Solar Induced Climate Change. WAB rapport 500102001, Bilthoven.
Van Oldenborgh, G.J, S. Drijfhout, A. van Ulden, R. Haarsma, A. Sterl, C. Severijns, W. Hazeleger & H. Dijkstra (2009), Western Europe is warming much faster than expected. Climate of the Past 5, 1-12.
Van der Schrier, G., T. Prozny & A.M.G. Klein Tank (2009), Assessment van regionale klimaatverschillen binnen Nederland onder klimaatverandering. KNMI bijdrage aan Klimaatbestendig Nederland, de Bilt.
Van der Schrier G., A. van Ulden & G.J. van Oldenborgh (2011): The construction of a Central Netherlands temperature. Climate in the Past 7:527-542.
Van Ulden, A.P. & R. van Dorland (2000), Natural variability of the global mean temperatures: contributions from solar irradiance changes, volcanic eruptions and El Nino, in Proc. 1st Solar and Space Weather Euroconference: The Solar Cycle and Terrestrial Climate, Santa Cruz de Tenerife, Spain, 25-29
September 2000 (ESA SP-463, December 2000). Visser, H. & A.C. Petersen (2008), The likelihood of
holding outdoor skating marathons in the Netherlands as a policy-relevant indicator of climate change. Climatic Change DOI 10.1007/s10584-008-9498-6.
Visser, H. & B. Strengers (2010), De Elfstedentocht in een opwarmend klimaat: het kan nog! Notitie Planbureau voor de Leefomgeving , rapport nr. 500216002 Den Haag/ Bilthoven, http://www.pbl.nl/publicaties/2010/ strenge-winters-blijven-mogelijk-in-opwarmend- klimaat.
Utrecht. bijdrage aan Klimaatbestendig Nederland. WMO (2012), Statement on the status of the global climate in 2011. World Meteorological Organization rapport nr. 1085, Genève, http://www.wmo.int/pages/ prog/wcp/wcdmp/documents/1085 _en.pdf.
Chapter 3: Effects on flood safety, water availability and water qualityAndersen, HE, B. Kronvang, S.E. Larsen, C.C. Hoffmann,
T.S. Jensen & E. Koch Rasmussen(2006), Climate- change impacts on hydrology and nutrients in a Danish lowland river basin. Science of The Total Environment. Vol 365 (1-3): 223-237.
Beersma, J.J., T.A. Buishand, S. de Goederen & P. Jacobs (2005), Zout, zouter, zoutst - Statistiek van de externe verzilting in Midden-West Nederland KNMI publicatie:199-III.
Buiteveld, H. (2005), Afvoerregime van de Rijn in de 20ste eeuw. RIZA rapport 2005-018.
CBS, PBL, Wageningen UR (2011a), Zeespiegelstand langs de Nederlandse kust en mondiaal, 1891-2008 (indicator 0229, versie 07, 23 februari 2011). www. compendiumvoordeleefomgeving.nl. CBS, Den Haag; Planbureau voor de Leefomgeving, Den Haag/ Bilthoven en Wageningen UR, Wageningen.
CBS, PBL, Wageningen UR (2011b), Algemene fysisch- chemische kwaliteit van het oppervlaktewater volgens de KRW, 2009 (indicator 0252, versie 08, 12 april 2011). www.compendiumvoordeleefomgeving.nl. CBS, Den Haag; Planbureau voor de Leefomgeving, Den Haag/ Bilthoven en Wageningen UR, Wageningen.
De Vries, D. (2011), Watersysteem rapportage 2010 Waterschap Reest & Wieden, www.reestenwieden.nl/aspx/download.aspx?File=/contents/pages/...pdf.
Deltacomissie (2008), “Samenwerken met water. Een land dat leeft, bouwt aan zijn toekomst” Bindingen van de Deltacommissie 2008.
Delta Programme (2010) Working on the delta. Investing in a safe and attractive Netherlands, now and in the future. http://www.deltacommissaris.nl/english/Images/Deltaprogramma_ENG1_tcm310-286802.pdf
Deltaprogramma (2011), Probleemanalyse Rijnmond- Drechtsteden, Impact van klimaatverandering en sociaal-economische ontwikkeling op waterveiligheid en zoetwatervoorziening,www.deltacommissaris.nl/Images/Probleemanalyse/20DPRD/20DEF_tcm309-307595.pdf
Deltares/HKV (2010), Klimaatbestendigheid en opties voor adaptatie in de regio Rijnmond-Drechtsteden: Analyse van recente resultaten uit Klimaatbestendig NL Waterland en Kennis voor klimaat.
Deltares (2011) Maatschappelijke kosten-batenanalyse Waterveiligheid 21e eeuw, Rapport 1204144-006, http://www.deltares.nl/nl/expertise/100417/veiligheid- en-risico-s/1402630.
Dillingh, D., F. Baart, & J. G. de Ronde (2010), Definitie zeespiegelstijging voor bepaling suppletiebehoefte. Rekenmodel t.b.v. handhaven kustfundament. Deltares.

83References |
EEA/JRC/ WHO (2008), Impacts of Europe’s changing climate - 2008 indicator-based assessment, Rapport Europees Milieuagentschap No 4/2008. Kopenhagen.
EEA (2010), The European Environment State And Outlook 2010 Understanding Climate Change. Rapport Europees Milieuagentschap. Kopenhagen.
Immerzeel, W.W., H. Goosen, M. de Groot & P. Droogers (2010), Klimaat Atlas: ontwikkeling wateroverlastkaarten. H2O 10: 33-36.
IPCC (2007), Climate change 2007: the physical science basis. Cambridge University Press, Cambridge, UK. IPCC (2011), Managing the Risks of Extreme Events and Disasters to Advance Climate Change. Special Report of the Working Group I and II of the Intergovernmental Panel on Climate Change (IPCC). Summary for policy makers, http://ipcc-wg2.gov/SREX/images/uploads/ SREX-SPM_ Approved-HiRes_opt.pdf.
Kastea, O, R.F. Wright, L.J. Barkved, B. Bjerkeng, T. Engen- Skaugen, J. Magnusson, & N.R. Sælthun (2007), Linked models to assess the impacts of climate change on nitrogen in a Norwegian river basin and fjord system. Science of The Total Environment. 365(1-3): 200-222.
Katsman, C.A., W. Hazeleger, S. S. Drijfhout, G. J. van Oldenborgh, & G. Burgers (2008), Climate scenarios of sea level rise for the northeast Atlantic Ocean: a study including the effects of ocean dynamics and gravity changes induced by ice melt. Climatic Change, 91:351-374. doi:10.1007/s10584-008-9442-9.
Katsman, C.A, S. Drijfhout & W. Hazeleger (2011a), Tijdsafhankelijke klimaatscenario’s voor zeespiegelstijging aan de Nederlandse kust. KNMI rapport TR-318, de Bilt.
Katsman, C.A., A. Sterl, J.J. Beersma, H.W. van den Brink, J.A. Church, W. Hazeleger, R.E. Kopp, D. Kroon, J. Kwadijk, R. Lammersen, J. Lowe, M. Oppenheimer, H.-P. Plag, J. Ridley, H. von Storch, D.G. Vaughan, P. Vellinga, L.L.A. Vermeersen, R.S.W. van de Wal & R. Weisse (2011b), Exploring high-end scenarios for local sea level rise to develop flood protection strategies for a low-lying delta—the Netherlands as an example. Climatic Change 109: 617-645doi:10.1007/s10584-011-0037-5.
Klijn, F., J. Kwadijk, K. de Buijn & J. Hunink (red) (2010), Overstromingsrisico’s en droogterisico’s in een veranderend klimaat, Deltares rapport 1002565, Delft.
Klijn, F. J. ter Maat & E. van Velzen (red.) (2011), Zoetwatervoorziening in Nederland landelijke analyse knelpunten in de 21e eeuw. Deltares rapport 1204358-002, Delft.
KNMI (2006), Klimaat in de 21e eeuw – vier scenario’s voor Nederland. KNMI, De Bilt.
KNMI (2008), De toestand van het klimaat in Nederland 2008. KNMI, De Bilt.
KNMI (2009a), Klimaatschetsboek Nederland, het huidige en toekomstige klimaat, KNMI rapport 233, KNMI, De Bilt, 2009.
KNMI (2009b), Klimaatverandering in Nederland; Aanvullingen op de KNMI’06 scenario’s, Klein Tank, A.M.G. en G. Lenderink (red.), KNMI, De Bilt.
Kwadijk, J., S. van Vuren, G. Verhoeven, G. Oude Essink, J. Snepvangers & E. Calle (2007), Gevolgen van grote zeespiegelstijging op de Nederlandse zoetwaterhuishouding. Rapport WL|Delft Hydraulics Q4394, Delft.
Kwadijk, J., A. Jeuken, & H. van Waveren (2008), De klimaatbestendigheid van Nederland Waterstand. Verkenning van knikpunten in beheer en beleid voor het hoofdwatersysteem. Deltares rapport T2447, Delft.
Malmaeus, JM, T. Blenckner, H. Markensten & I. Persson (2006), Lake phosphorus dynamics and climate warming: A mechanistic model approach. Ecological Modelling 190(1-2):1-14.
Ministerie van Verkeer en Waterstaat MVW (2008), Stroomgebiedbeheerplan Rijndelta: Hoofdrapport.
Mitrovica J.X., M.E. Tamisiea, J.L. Davis & G.A. Milne (2001), Recent mass balance of polar ice sheets inferred from patterns of global sea level change. Nature 409:1026–1029.
PBL (2009), Wegen naar een klimaatbestendig Nederland, PBL Planbureau voor de Leefomgeving 500078001, Den Haag/Bilthoven.
PBL (2011), Climate adaptation in the Dutch delta. Strategic options for a climate proof development of the Netherlands. PBL Netherlands Environmental Assessment Agency, PBL publication number 500193002, Den Haag/Bilthoven.
RIZA (2007), Toepassing klimaatscenario’s in het waterbeheer en –beleid. Rapport WL Delft Hydologics Q4437.
Te Linde, A.H. (2009), Aanvullende scenario’s tbv ‘Wegen naar een klimaatbestendig Nederland’. Bijdrage Deltares aan PBL-studie “Klimaateffecten In Nederland”.
Te Linde, A. H., J. C. J. H. Aerts, A. M. R. Bakker & J. C. J. Kwadijk (2010), Simulating low-probability peak discharges for the Rhine basin using resampled climate modeling data, Water Resour. Res., 46, W03512, doi:10.1029/2009WR007707.
Van Beek, E., M. Haasnoot, K.M. Meijer, J.R. Delsman, J.J.J.C. Snepvangers, G. Baarse, R. van Ek, G.F. Prinsen, J.C.J. Kwadijk & J.W. van Zetten (2008), Verkenning kosteneffectiviteit van grootschalige maatregelen tegen droogteschade als gevolg van de G+ en W+ klimaatscenario’s. Deltaresrapport T2498, Delft.

84 | The effects of Climate Change in the Netherlands: 2012
Van Vliet, M.T.H. & J.J.G. Zwolsman (2008), Impact of summer droughts on the water quality of the Meuse River. Journal of Hydrology. Vol. 353(1-2): 1-17.
Vellinga, P., C. Katsman, A. Sterl, & J. Beersma (2008), Onderzoek naar bovengrensscenario’s voor klimaatverandering voor overstromingsbescherming van Nederland. Achtergrondrapport Deltacommissie www.deltacommissie.com/doc/Onderzoek%20 naar%20bovengrensscenario’s%20-%20KNMI.pdf.
Wanningen, H., R. Torenbeek, & J.H. Wanink (2010), Wordt het Drentse water warmer? Onderzoek naar het effect van klimaatverandering op het Drenthe oppervlaktewater in de periode 1974 – 2009. Rapport 2010-031. Koeman en Bijkerk, ecologisch advies bureau.
Wardekker, J.A. & J.P. van der Sluijs (2010), Karakterisering van onzekerheid in effecten van klimaatverandering in Nederland. Copernicus Instituut, Utrecht Universiteit, rapport nr. NWS-E-2011-79 Utrecht. Bijdrage aan Klimaatbestendig Nederland.
Witte, J.P.M.; J. Runhaar & R. van Ek (2009) Ecohydrologische effecten van klimaatverandering op de vegetatie van Nederland; KWR rapport 2009.032.
Zwolsman, G. & M. van Vliet (2007) Effect van een hittegolf op de waterkwaliteit van de Rijn en de Maas, H2O 22, p. 41-44.
Chapter 4: Effects of climate change on ecosystems and biodiversityArnolds, E. & M. Veerkamp (2008), Basisrapport Rode
Lijst Paddenstoelen. Nederlandse Mycologische Vereniging, Utrecht.
Blom, G., M. Paulissen, W. Geertsema & H. Agricola (2009), Klimaatverandering in drie casestudiegebieden. Integratie van adaptatiestrategieën voor landbouw en natuur. Rapport Wageningen Universiteit no 255.
Boosten, M., C. de Groot & J. van den Briel (2009), Inventarisatie van de ontstaans- en escalatierisico’s van natuurbranden op de Veluwe, Rapport Stichting Probos Wageningen, www.probos.nl/home/pdf/ RapportNatuurbrandenNov2010.pdf.
Both, C., M. Van Asch, R.G. Bijlsma, B. Van Den Burg& M.E. Visser (2009), Climate change and unequal
phenological changes across four trophic levels: constraints or adaptations?. Journal of Animal Ecology, 78:73–83. doi: 10.1111/j.1365-2656.2008.01458.x. Brander, K.M. (2010), Cod Gadus morhua and climate change: processes, productivity and prediction. Journal of Fish Biology 77, 1899–1911.
Bijlsma, R.J., A.J.M. Jansen, J. Limpens, M.F. Wallis de Vries & J.P.M. Witte (2011), Hoogveen en klimaatverandering in Nederland. Wageningen, Alterra, Alterra-rapport 2225.
BZK (2009), Nationale Risicobeoordeling. Bevindingenrapportage 2008, Den Haag, Ministerie van Binnenlandse Zaken en Koninkrijksrelaties.
CBS (2004), Een kwart meer buitenbranden in 2003. http://www.cbs.nl/nl-NL/menu/themas/veiligheid-recht/publicaties/artikelen/archief/2004/2004-1541- wm.htm.
CBS, PBL, Wageningen UR (2010), Korstmossen en klimaatverandering, 1990-2006 (indicator 1111, versie 03, 25 juni 2010), www. compendiumvoordeleefomgeving.nl, CBS, Den Haag; Planbureau voor de Leefomgeving, Den Haag/ Bilthoven en Wageningen UR, Wageningen.
CBS, PBL, Wageningen UR (2010c), Vervroeging bloei voorjaarsplanten (indicator 1391, versie 02, 25 juni 2010). www.compendiumvoordeleefomgeving.nl. CBS, Den Haag; Planbureau voor de Leefomgeving, Den Haag/Bilthoven en Wageningen UR, Wageningen.
CBS, PBL, Wageningen UR (2011), Meteorologische gegevens, 1990-2010 (indicator 0004, versie 12, 5 april 2011), www.compendiumvoordeleefomgeving.
nl. CBS, Den Haag; Planbureau voor de Leefomgeving, Den Haag/Bilthoven en Wageningen UR, Wageningen. http://www.compendiumvoordeleefomgeving.nl/ indicatoren/nl0004-Meteorologische-gegevens-in-- Nederland.html?i=9-54.
CBS, PBL, Wageningen UR (2011b), Invloed klimaatverandering op koude- en warmteminnende soorten, 1990-2010 (indicator 1429, versie 05, 18 november 2011), www. compendiumvoordeleefomgeving.nl. CBS, Den Haag; Planbureau voor de Leefomgeving, Den Haag/ Bilthoven en Wageningen UR, Wageningen.
CBS, PBL, Wageningen UR (2011c), Aantalontwikkeling van amfibieën, 1997-2010 (indicator 1077, versie 11, 23 augustus 2011), www.compendiumvoordeleefomgeving.nl. CBS, Den Haag; Planbureau voor de Leefomgeving, Den Haag/ Bilthoven en Wageningen UR, Wageningen.
CBS, PBL, Wageningen UR (2011d), Bonte vliegenvanger en klimaatverandering, 1990-2009 (indicator 1116, versie 08, 25 januari 2011) www.compendiumvoordeleefomgeving.nl. CBS, Den Haag; Planbureau voor de Leefomgeving, Den Haag/ Bilthoven en Wageningen UR, Wageningen.
CBS, PBL, Wageningen UR (2011e), Wespenspin en klimaatverandering, 1979-2010 (indicator 1109, versie 10, 18 oktober 2011), www. compendiumvoordeleefomgeving.nl. CBS, Den Haag; Planbureau voor de Leefomgeving, Den Haag/ Bilthoven en Wageningen UR, Wageningen.
CBS, PBL, Wageningen UR (2011f ), Vermesting in regionaal water, 1991 - 2008 (indicator 0552, versie 03, 4 februari
85References |
2011), www.compendiumvoordeleefomgeving.nl. CBS, Den Haag; Planbureau voor de Leefomgeving, Den Haag/Bilthoven en Wageningen UR, Wageningen.
CBS, PBL, Wageningen UR (2012), Vervroeging eileg zangvogels, 1986-2011 (versie 05). www. compendiumvoordeleefomgeving.nl. CBS, Den
Haag; Planbureau voor de Leefomgeving, Den Haag/ Bilthoven en Wageningen UR, Wageningen.
Deltares (2008), Effecten van klimaatverandering op de Waterkwaliteit in de Rijn en Maas (M. van Vliet, G.J. Zwolsman, J. Joziasse (red.)) Deltares-Rapport
2008-U-R0629/A, Delft, http://www.delftcluster. nl/website/files/ Waterkwaliteit_ /2008-U-R0629_ Michelle_van_Vliet_definitieve_versie.pdf.
Devictor, V., R. Julliard, D. Couvet & F. Jiquet (2008), ‘Birds are tracking climate warming, but not fast enough’, Proceedings of the Royal Society B 275: 2743-2748.
Durant, J.M., D. Hjermann, G. Ottersen & N.C. Stenseth (2007), ‘Climate and the match or mismatch between predator requirements and resource availability’, Climate Research 33: 271-283.
Geertsema, W.,R.J.F. Bugter, R.J.F., M. van Eupen, S.A.M. van Rooij, T. van der Sluis, & M. van der Veen (2009), Robuuste verbindingen en klimaatverandering. Alterra rapport, Wageningen, http://edepot.wur.nl/14353.
Heijmans, M. & F. Berendse (2009), State of the art review on climate change impacts on natural ecosystems and adaptation, report KfC 009/09, Wageningen University.
Hiddink, J.G. & R. ter Hofstede (2008), Climate induced increases in species richness of marine fishes. Global Change Biology 14: 453-460.
ICES (2009), Report of the International Bottom Trawl Survey Working Group (IBTSWG), 30 March - 3 April 2009, Bergen, Norway, ICES CM 2009/ RMC:04.
I&M (2011), Structuurvisie Infrastructuur en Ruimte, Den Haag, Ministerie van Infrastructuur en Milieu.
Jentsch, A. & B. Beierkuhnlein (2008), ‘Research frontiers in climate change. Effects of extreme meteorological events on ecosystems’, C. R. Geoscience 340: 621-628.
KNMI (2009b), Klimaatverandering in Nederland; Aanvullingen op de KNMI’06 scenario’s, Klein Tank, A.M.G. en G. Lenderink (red.), KNMI, De Bilt.
MacLean, I.M.D, G.E. Austin, M.M. Rehfisch, J. Blew, O. Crowe, S. Delany, K. Devos, B. Deceunninck, K. Günther, K. Laursen, M. Van Roomen & J. Wahl (2008), ‘Climate change causes rapid changes in the distribution and site abundance of birds in winter’, Global Change Biology 14: 2489-2500.
Moraal, L. G., G. A. J. M. Jagers op Akkerhuis, H. Siepel, M. J. Schelhaas, & G. F. P. Martakis (2004), Verschuivingen van insectenplagen bij bomen sinds 1946 in relatie met klimaatverandering: met aandacht voor de effecten van stikstofdepositie, vochtstress,
bossamenstelling en bosbeheer. Alterra-rapport, Wageningen.
Nijhof, B.S.J., C.C. Vos & A.J. van Strien (2007), Indicators for ‘Convention on Biodiversity 2010’. Influence of climate change on biodiversity,: Wettelijke Onderzoekstaken Natuur & Milieu (WOT). Wageningen, 46 blz , http://library.wur.nl/way/bestanden/clc/1873627.pdf
Ozinga, W.A., M. Bakkenes & J.H.J. Schaminée (2007), Sensitivity of Dutch vascular plants to climate chance and habitat fragmentation. A first assessment based on plant traits in relation to past trends and future projections, Wageningen: Wettelijke Onderzoekstaken Natuur & Milieu(WOT).
PBL (2008), Halting biodiversity loss in the Netherlands. Evaluation of progress. PBL rapport, Bilthoven, http://www.pbl.nl/en/publications/2008/Halting- biodiversity-loss-in-the-Netherlands.
PBL (2009), Natuurbalans 2009 PBL rapport 500402017, Bilthoven, http://www.pbl.nl/publicaties/2009/ natuurbalans.
PBL (2010), Adaptation strategy for climate-proofing biodiversity. Planbureau voor de Leefomgeving, Vonk, M.; C.C. Vos, & D.C.J. van der Hoek (Ed), Bilthoven, http://www.pbl.nl/sites/default/files/cms/publicaties/500078005_adaptation_strategy_for_climate-proofing_biodiversity.pdf
Piessens, K., D. Adriaens, H. Jacquemyn & O. Honnay (2008), ‘Synergistic effects of an extreme weather event and habitat fragmentation on a specialized insect herbivore’, Oecologia 159: 117-126.
Pörtner, H.O. & R. Knust (2007), Climate change affects marine fishes through the oxygen limitation of thermal tolerance. Science 315:95-97.
Puijenbroek, P. van, M. de Lange & F. Ottburg (2009), ‘Exoten in het zoete water in de afgelopen eeuw’, H2O
KNMI (2011), De Bosatlas van het klimaat, Noordhoff Uitgeverij, Groningen, (www.klimaatatlas.nl). Kramer, K. & I. Geijzendorffer (2009), Ecologische veerkracht. Concept voor natuurbeheer en natuurbeleid, KNNV Uitgeverij, Zeist.
Kwadijk, J., A. Jeuken, & H. van Waveren (2008), De klimaatbestendigheid van Nederland Waterstand. Verkenning van knikpunten in beheer en beleid voor het hoofdwatersysteem. Deltares rapport T2447, Delft.
Schippers, P., J. Verboom, Vos, C.C. & R. Jochem (2011), Metapopulation shift and survival of woodland birds under climate change: will species be able to track?. Ecography, 34: 909–919. doi: 10.1111/j.1600-0587.2011.06712.x.
Schweiger, O., J. Settele, O. Kundra, S. Klotz & I. Kühn (2008), ‘Climate change can cause spatial mismatch of trophically interacting species’, Ecology 89: 3472-3479.

86 | The effects of Climate Change in the Netherlands: 2012
SOVON (2011), Populatietrends en broedsucces van Bonte Vliegenvanger in Nederland: Een update. Ch. van Turnhout, L. Ballering en Ch. Booth (eds). Limosa 84:38-45.
Tamis, W.L.M., M. van ’t Zelfde, R. van der Meijden & H.A.U. de Haes (2005), ‘Changes in vascular plant biodiversity in the Netherlands in the 20th century explained by their climatic and other environmental characteristics’, Climatic Change 72: 37-56.
Tasker, M.L. (Ed.) (2008), The effect of climate change on the distribution and abundance of marine species in the OSPAR Maritime Area. ICES Cooperative Research Report, 293(Spec. Issue). ICES: Copenhagen, www.vliz.be/imisdocs/publications/142708.pdf.
Teal, L.R. (2011), The North Sea fish community: past, present and future. Background document for the 2011 National Nature Outlook, Wettelijke OnderzoekstakenNatuur & Milieu (WOT), Wageningen.
Van der Veen, M., E. Wiesenekker, B.S.J. Nijhoff & C.C. Vos (2010), Klimaat Respons Database, versie 2.0. Ontwikkeld binnen het Klimaat voor Ruimte Programma, Project A2, Adaptatie EHS, http://www. klimaatonderzoeknederland.nl/resultaten/klimaat- response-database.
Van Hal, R., O.G. Bos & R.G. Jak (2011), Noordzee: systeemdynamiek, klimaatverandering, natuurtypen en benthos. Achtergronddocument bij Natuurverkenning 2011. Rapport IMARES Werkdocument 255.
Van Oudenhoven, A. P. E. (2008), The Oak processionary caterpillar marching on; Research into the climate and environmental variables determining the spatial distribution and population dynamics of Thaumetopoea processionea. Environmental Systems Analysis. Wageningen University, Wageningen. MSc. Visser et al, 2009.
Visser, M.E., A.C. Perdeck, J.H. van Balen & C. Both (2009), ‘Climate change leads to decreasing bird migration distances’, Global Change Biology 15: 1859-1865.
Vos, C.C., D.C.J. van der Hoek, M. Vonk (2010), ‘Spatial planning of a climate adaptation zone for wetland ecosystems’, Landscape Ecology 25: 1465-1477.
Witte, J.P.M., J. Runhaar & R. van Ek (2009a), Ecohydrologische effecten van klimaatverandering op de vegetatie van Nederland, KWR rapport 2009.032.
Witte, J.P.M., J. Runhaar, R. van Ek & D.C.J. van der Hoek (2009b), ‘Eerste landelijke schets van de ecohydrologische effecten van een warmer en grilliger klimaat’, H O 16/17.
Witte, J.P.M., J. Runhaar, R. van Ek, D.C.J. van der Hoek,R.P. Bartholomeus, O. Batelaan, P.M. van Bodegom,
M.J. Wassen & S.E.A.T.M. van der Zee (2012), An ecohydrological sketch of climate change impacts on water and natural ecosystems for the Netherlands:
bridging the gap between science and society. Hydrology and Earth System Sciences (in press).
Chapter 5: Effects of climate change on agriculture in the NetherlandsAcacia Water, Leven met Water & STOWA (2009), Leven
met Zout water: Overzicht huidige kennis omtrent interne verzilting. Rapport nr 2009/45.
AgriHolland (2011), Dossier Klimaatverandering en landbouw, http://www.agriholland.nl/dossiers/ klimaatverandering/home.html#introductie.
Agricola, H.J., H. Goosen, P.F.M. Opdam & R.A. Smidt (2010), Kansrijke gebieden voor groenblauwe mantels in de provincie Noord-Brabant, Wageningen: Alterra.
Blom, G., M. Paulissen, C. Vos & H. Agricola (2008), Effecten van klimaatverandering op landbouw en natuur: Nationale knelpuntenkaart en adaptatiestrategieën, Rapport Wageningen Universiteit, no 182.
De Wit, J. D. Swart, & E. Luijendijk (2009), Klimaat en landbouw Noord-Nederland: ‘effecten van extremen’ Rapport Grontmij 245375, http://promise. klimaatvoorruimte.nl/pro1/publications/show_ publication.asp?documentid=3320&GUID=4f4bacc3- f37c-4521-8510-e7677f7030c6.
Haskoning (2008) Herijking Zoetwaterverkenning. Rapport voor de provincie Zuid-Holland.
Hermans, C.M. .L, I. R. Geijzendorffer, F. Ewert, M. J. Metzger, P. H. Vereijken, G. B. Woltjer, & A. Verhagen (2010), “Exploring the future of European crop production in a liberalised market, with specific consideration of climate change and the regional competitiveness.” Ecological Modelling 221 (18) 2177–2187. doi:10.1016/j.ecolmodel.2010.03.021.
Kempenaar, C. & W. van der Zweerde (2003), Vernatting van landbouwgewassen: Hoe zullen ziekten, plagen en onkruiden reageren?, Nota/Plant Research International 278, http://library.wur.nl/ WebQuery/ wurpubs/324698.
Klijn, F., J. Kwadijk, K. de Buijn & J. Hunink (red) (2010), Overstromingsrisico’s en droogterisico’s in een veranderend klimaat, Deltares rapport 1002565, Delft.
Klijn, F. J. ter Maat & E. van Velzen (red.) (2011), Zoetwatervoorziening in Nederland landelijke analyse knelpunten in de 21e eeuw. Deltares rapport 1204358-002, Delft.
KNMI (2011), De Bosatlas van het klimaat, Noordhoff Uitgeverij, Groningen, 112 (www.klimaatatlas.nl).
Lavalle, C., F. Micale, T. Durrant Houston, A. Camia, R. Hiederer, C. Lazar, C. Conte, G. Amatulli, & G.Genovese (2009), Climate change in Europe. 3. Impact on agriculture and forestry. A review. Agronomy for Sustainable Development 29(3) 433-446, DOI: 10.1051/ agro/2008068.

87References |
PBL (2011), Climate adaptation in the Dutch delta. Strategic options for a climate proof development of the Netherlands. PBL Netherlands Environmental Assessment Agency, PBL publication number 500193002, Den Haag/Bilthoven.
PD (2005), Situatie Maïswortelkever 2005- Diabrotica virgifera virgifera. Plantenziektenkundige Dienst, Wageningen, http://edepot.wur.nl/118467.
Schaap, B.F., M. Blom-Zandstra, I.R. Geijzendorffer, C.M.L. Hermans, R.A. Smidt, R.A.& A. Verhagen (2009), Klimaat en landbouw Noord-Nederland : rapportage van fase 2 Wageningen: Plant Research International, Nota / Plant Research International 629.
Schaap, B.F., M. Blom-Zandstra, C.M.L. Hermans, B.G. Meerburg, & A. Verhagen (2011), “Impact changes of climatic extremes on arable farming in the north of the Netherlands.” Regional Environmental Change 9: 1–11. doi:10.1007/s10113-011-0205-1.
Schapendonk, A.H.C.M., W. Stol, J.H.M. Wijnands, F. Bunte, M.W. Hoogeveen, en S.C. van de Geijn (1997), Effecten van klimaatverandering op fysieke en economische opbrengst van een aantal landbouwgewassen in Nederland, AB-DLO en LEI- DLO, rapport no. 410200016, www.plant-dynamics.nl/ UserFiles/File/pdf/klimaat-economie.pdf
Scholte E.J., C.B.E.M. Reusken, W. Takken, F. Jongejan, & J.W.B. van der Giessen (2008), Het toenemend belang van infectieziekten die worden overgebracht door vectoren. Infectieziekten bulletin. 19(10): 311-315 (DOI:9717).
Van Bakel, P.J.T. & L.C.P.M. Stuyt (2011), Actualisering van de kennis van de zouttolerantie van landbouwgewassen. Op basis van literatuuronderzoek, expertkennis en praktijkonderzoek. WUR-Alterra, rapportnr 2201, Wageningen.
Van Beek, E., M. Haasnoot, K.M. Meijer, J.R. Delsman, J.J.J.C. Snepvangers, G. Baarse, R. van Ek, G.F. Prinsen, J.C.J. Kwadijk & J.W. van Zetten (2008), Verkenning kosteneffectiviteit van grootschalige maatregelen tegen droogteschade als gevolg van de G+ en W+ klimaatscenario’s. Deltaresrapport T2498, Delft.
Van Dam, A.M. O.A. Clevering, W. Voogt, Th.G.L. Aendekerk & M.P. van der Maas (2007), Zouttolerantie van landbouwgewassen. Deelrapport Leven met zout water; Wageningen Universiteit; PPO nr. 32 340194 00; pp 38. http://edepot.wur.nl/27637.
Van de Sandt, K. en H. Goosen (2012), Klimaatadaptatie in het landelijk gebied. Een verkenning naar wegen voor een klimaatbestendig Nederland. Wageningen UR- Alterra, Wageningen.
Van der Gaast, J. W. J., H. T. L. Massop & H. R. J. Vroon (2009), Effecten van klimaatverandering op de watervraag in de Nederlandse groene ruimte. Analyse
van de waterbeschikbaarheid rekeninghoudend met de freatische grondwaterstand en bodem.
Verhagen, A., M. Blom-Zandstra, P.J. Kuikman, E den Belder, W.A. Brandenburg, J. Elderson, C.M.L. Hermans, B.F. Schaap, J.J.H. van den Akker, P. Vellinga, C. Waalwijk (2011), Effecten van klimaatverandering op de landbouw in Nederland. Bijdrage aan Klimaatbestendig Nederland.
Wardekker, J.A. & J.P. van der Sluijs (2010), Karakterisering van onzekerheid in effecten van klimaatverandering in Nederland. Copernicus Instituut, Utrecht Universiteit, rapport nr. NWS-E-2011-79
Utrecht, bijdrage aan Klimaatbestendig Nederland. Westerdijk, C.E. & A.J. Visser (2003), Voorstudie Zoute Landbouw. Gevolgen verzouting oppervlaktewater op aangrenzende landbouw. PPO. rapport nr 530068, Wageningen.
Chapter 6: Effects on public healthBraks, M, & A-M De Rode Husman (2012). Sense and
nonsense of effects of climate change on water transmitted infectious diseases (in voorbereiding).
CBS, PBL, Wageningen UR (2002), Gezondheidsklachten in verband met recreatie in oppervlaktewater, 1990-
1999 (indicator 0347, versie 03, 3 oktober 2002). www.compendiumvoordeleefomgeving.nl. CBS, Den Haag; Planbureau voor de Leefomgeving, Den Haag/ Bilthoven en Wageningen UR, Wageningen.
CBS, PBL, Wageningen UR (2010), Eikenprocessierups en klimaatverandering, 1990-2008 (indicator 1110, versie 04, 5 februari 2010). www. compendiumvoordeleefomgeving.nl. CBS, Den Haag; Planbureau voor de Leefomgeving, Den Haag/ Bilthoven en Wageningen UR, Wageningen.
CBS, PBL, Wageningen UR (2010b), Kwaliteit zwemwater, 1998-2009 (indicator 0248, versie 07, 17 december 2010), www.compendiumvoordeleefomgeving.nl. CBS, Den Haag; Planbureau voor de Leefomgeving, Den Haag/Bilthoven en Wageningen UR, Wageningen.
CASHh (2006), Climate change and adaptation strategies for human health (Editors Menne and Ebi), Steinkopff Verlag, Darmstadt.
ClimateCost (2011), The impact and economic costs of climate change in Europe and the costs and benefits of adaptation, http://www.climatecost.cc/ reportsandpublications.html.
Confalonieri, U. & A. McMichael (2007), Global environmental change and human health: science plan and implementation strategy. ESSP report number 4. ESSP Joint Project on GEC and Human Health, www. essp.org.
Deltaprogramma (2011), Probleemanalyse Rijnmond- Drechtsteden, Impact van klimaatverandering en sociaal-economische ontwikkeling op waterveiligheid

88 | The effects of Climate Change in the Netherlands: 2012
en zoetwatervoorziening, www.deltacommissaris.nl/ Images/Probleemanalyse%20DPRD%20DEF_tcm309-307595.pdf.
De Roda Husman AM & F.M. Schets (2010), Climate change and recreational water-related infectious diseases. RIVM report 330400002. National Institute for Public Health and the Environment, Bilthoven.
Den Boon, S., & W. van Pelt (2006), De ziekte van Lyme in Nederland tussen 1994 en 2005: drievoudige toename van het aantal huisartsconsulten en verdubbeling van het aantal ziekenhuisopnames. Infectieziekten Bulletin, 17(7), 238-240.
Ebi, K.L (2011), Climate change and health risks: assessing and responding to them through ‘adaptive management’. Health Affairs 30(5): 924-930.
ECDC (2012), Assessing the potential impacts of climate change on food- and waterborne diseases in Europe. Technical report.
EU INTARESE (2010), Integrated Assessment of Health Risks of Environmental Stressors in Europe (www. intarese.org).
Epstein, P.R. (2008), Fossil fuels, allergies, and a host of other ills. Journal of Allergy and Clinical Immunology122: 471-472.
Gezondheidsraad (2009), Mondiale milieu-invloed op onze gezondheid. Den Haag: Gezondheidsraad, 2009; publicatienummer 2009/15. ISBN 978-90-5549-773-7.
Hunter, P. (2003), Climate change and waterborne and vector-borne disease. Journal of Applied Microbiology,94 Suppl, 37S-46S.
Huynen, M.M.T.E & B. Menne et al. (2003), Phenology and human health: allergic disorders. Health and global environmental change, http://library.wur.nl/ WebQuery/ wurpubs/327616.
Huynen, M. M. T. E., A. E. M. de Hollander, M. Martens & J. P. Mackenbach (2008). Mondiale milieuveranderingen en volksgezondheid: stand van de kennis. RIVM, Bilthoven, http://www.icis.unimaas.nl/publ/ Downs/080318_Mondiale.Definitief.pdf.
Jans, H. & E. Franssen (2008), De brandharen van de eikenprocessierups, een reëel probleem voor de huisarts. Huisarts & Wetenschap 51: 1-4.
Karagiannis, I., P. Brandsema, & M. van der Sande (2009), Warm, wet weather associated with increased Legionnaires’ disease incidence in The Netherlands. Epidemiology and Infection 137(2), 181-187.
Kennis voor Klimaat/Klimaat voor Ruimte. (2008), Verslag Oploopdebat Klimaat en Gezondheid, Amsterdam, September 18, 2008.
Kovats, R.S., & K.L. Ebi (2006), Heatwaves and public health in Europe. Eur J Public Health 16(6): 592-599.
Mackenbach, J.P. (2009), Klimaatverandering: Ook een probleem voor de volksgezondheid. Ned Tijdschr Geneeskd 153(50): 2413.
Martens, P. (2009), Klimaatverandering en gezondheid. Ned Tijdschr Geneeskd, 153, A1420.
McMichael, A.J., R. Woodruff, & S. Hales (2006), Climate change and human health: present and future risks. The Lancet, 367, 859-869.
MNP (2005), The effects of climate change in the Netherlands. Rapport Milieu- en Natuurplanbureau report number: 773001037, http://www.pbl.nl/sites/default/files/cms/publicaties/773001037.pdf
Nationaal Kompas Volksgezondheid (2012), http://www.nationaalkompas.nl/gezondheidsdeterminanten/omgeving/milieu/klimaatverandering.
Schets, F.M., H.H.L. van den Berg, A.A. Demeulmeester, E. van Dijk, S.A. Rutjes, H.J.P. van Hooijdonk & A.M. De Roda Husman (2006), Vibrio alginolyticus infections in the Netherlands after swimming in the North Sea, “Euro Sur veill. 2006;11(45):pii=3077, http://www. eurosurveillance.org/ ViewArticle.aspx?ArticleId=3077.
Scholte, E.J., C.B.E.M. Reusken, W. Takken, F. Jongejan en J.W.B. van der Giessen (2007) Het toenemend belang van infectieziekten die worden overgebracht door vectoren; Infectieziekten Bulletin 2008; 19: 311-5.
Schouls, L.M., & W. van Pelt (2003), Tekenbeten. In de ban van de ring. RIVM.nl 3(3): 5-6.
Semenza, J.C., J.E. Suk, V. Estevez, K.L. Ebi, & E.L. Lindgren (2012), Mapping climate change vulnerabilities to infectious diseases in Europe. Environ. Health Perspec.120: 385-392.
Semenza, J.C. & B. Menne (2009), Climate change and infectious diseases in Europe. Lancet Infect. Dis. 9: 365-375.
Shea, K.M., R.T. Truckner, R.W. Weber, & D.B. Peden (2008), Climate change and allergic disease. Journal of Allergy and Clinical Immunology 122: 443-453.
Smithuis, L.O.M.J., G.J.H. Haan, L.R. van der Laan, J.M. Pekelharing, S.A.J.J. Rikken & W.P.F. Rutten (2000), Wetenschappelijke verantwoording van het landelijk model van een probleemgeoriënteerd aanvraagformulier voor laboratoriumonderzoek door huisartsen. Ned Tijdschr Klin. Chem, December: 14-19.
Takken, W. & B.G.J. Knols (Eds) (2007), Emerging pests and Vector Borne Diseases in Europe. Wageningen Academic Publishers, The Netherlands.
UK (2012), Climate change risk assessment. Summary of key findings and evidence report.
Van Asperen, I., C. de Rover, J. Schijven, S. Oetomo, J. Schellekens, N. van Leeuwen, et al. (1995), Risk of otitis externa after swimming in recreational fresh water lakes containing Pseudomonas aeruginosa, The British Medical Journal 311(7017), 1407-1410.
Van Oudenhoven, A.P.E. (2008), The Oak processionary caterpillar marching on; Research into the climate and environmental variables determining the spatial distribution and population dynamics of

89References |
Thaumetopoea processionea. Environmental Systems Analysis. Wageningen University, Wageningen. Van Vliet, A.J.H. (2008), Monitoring, analysing,forecasting and communicating phenological changes. Proefschrift Wageningen Universiteit, Wageningen.
Wardekker, J.A. & J.P. van der Sluijs (2010), Karakterisering van onzekerheid in effecten van klimaatverandering in Nederland. Rapport Copernicus Instituut, Universiteit Utrecht, Rapport nr NWS-E-2010-70.
Wardekker, J.A., A. de Jong, L. van Bree, W.C. Turkenburg & J.P. van der Sluijs (2012), Health risks of climate change: an assessment of uncertainties and its implications for adaptation policies (in review).
WHO (2010), Health and Environment in Europe: Progress Assessment, Progress report of the World Health Organization Europe, Rapportnr. EUR/55934/BD/1.
WHO CEHAPIS (2011), Tools for the monitoring of Parma Conference commitments, http://www.euro.who.int/__data/assets/pdf_file/0019/134380/e94788.pdf
Ziska, L.H., D.E. Gebhard, D.A. Frenz, S. Faulkner, B.D. Singer, & J.G. Straka (2003), Cities as harbingers of climate change: Common ragweed, urbanization, and public health. Journal of Allergy and Clinical Immunology 111:290-295.
Chapter 7: Effects of climate change on recreation and tourismAmelung, B., S. Nicholls & D. Viner (2007), Implications
of Global Climate Change for Tourism Flows and Seasonality. Journal of Travel Research 45: 285-296.
De Jonge, Ch., H. Gijsbertse & C.M. Goossen (2008), De gevolgen van klimaatverandering voor recreatie en toerisme. Kansen voor de recreatiesector. Rapport Stichtring Recreatie, Den Haag, http://library.wur.nl/ WebQuery/wurpubs/373306.
Giles, A.R. & A.H. Perry (1998), The use of a temporal analogue to investigate the possible impact of projected global warming on the UK tourist industry. Tourism Management 19(1): 75-80.
Mieczkowski, Z. (1985), The Tourism Climatic Index: A Method of Evaluating World Climates for Tourism. The Canadian Geographer, 29(3), 220-233.
Moreno, A., B. Amelung & L. Santamarta (2008), Linking beach recreation to weather conditions. A case study in Zandvoort, Netherlands. Tourism in Marine Environments 5 (2-3):111-119.
Nicholls, S. & B. Amelung (2008), Climate Change and Tourism in Northwestern Europe: Impacts and Adaptation. Tourism analysis, 13(1), 21-31.
PBL (2009), Wegen naar een klimaatbestendig Nederland, PBL Planbureau voor de Leefomgeving 500078001, Den Haag/Bilthoven.
Peeters, P. & F. Schouten (2006), Reducing the ecological footprint of inbound tourism and transport to
Amsterdam. Journal of Sustainable Tourism, 14(2), 157-171.
Perch-Nielsen, S., B. Amelung & R. Knutti (2010), ‘Future climate resources for tourism in Europe based on the daily Tourism Climatic Index’. Climatic Change, 103, 363–381, doi:10.1007/s10584-009-9772-2.
Visser, H. & A.C. Petersen (2008), Future chances of the Elfstedentocht. Addendum bij het artikel in Climatic Change ‘The likelihood of holding outdoor skating marathons in the Netherlands as a policy-relevant indicator of climate change‘.
Chapter 8: Policy responses to the effects of climate changeBraks, M., J. van der Giessen, M. Kretzschmar, W. van
Pelt, E-J Scholte, C. Reusken, H. Zeller, W. van Bortel, & H. Sprong (2011), Towards an integrated approach in surveillance of vector-borne diseases in Europe. Parasites & Vectors 4:192-202.
BZK (2009), Nationale Risicobeoordeling. Bevindingenrapportage 2008, Den Haag, Ministerie van Binnenlandse Zaken en Koninkrijksrelaties. CBS (2004) Een kwart meer buitenbranden in 2003, http:// www.cbs.nl/nl-NL/menu/themas/veiligheid-recht/ publicaties/artikelen/archief/2004/2004-1541-wm.htm.
Delta Programme (2010) Working on the delta. Investing in a safe and attractive Netherlands, now and in the future. http://www.deltacommissaris.nl/english/Images/Deltaprogramma_ENG1_tcm310-286802.pdf
Deltaprogramma (2011), Probleemanalyse Rijnmond- Drechtsteden, Impact van klimaatverandering en sociaal-economische ontwikkeling op waterveiligheid en zoetwatervoorziening, www.deltacommissaris.nl/ Images/Probleemanalyse%20DPRD%20DEF_tcm309-307595.pdf.
De Jonge, Ch., H. Gijsbertse, & C.M. Goossen (2008), De gevolgen van klimaatverandering voor recreatie en toerisme. Kansen voor de recreatiesector. Rapport Stichtring Recreatie, Den Haag, http://library.wur.nl/ WebQuery/wurpubs/373306.
Driessens. P.P.J. & H.F.M.W. van Rijswick (2011)., Normative aspects of climate adaptation policies. Climate Law 2(4): 559-581. http://igitur-archive.library.uu.nl/milieu/2012-0216-2000244/UUindex.html.
Ebi, K.L (2011), Climate change and health risks: assessing and responding to them through ‘adaptive management’. Health Affairs 30(5): 924-930.
ECDC VBORNET, Network of medical entomologists and public health experts (http://ecdc.europa.eu/en/ activities/diseaseprogrammes/emerging _and_vector_ borne_diseases/Pages/ VBORNET.aspx).
ECDC (2012), Assessing the potential impacts of climate change on food- and waterborne diseases in Europe. Technical report.

90 | The effects of Climate Change in the Netherlands: 2012
EHS (2010), A human perspective of climate change. A report outlining the research needs on the human health effects of climate change. Environmental Health Perspectives interagency working group report.
EU ENHanCE, ERA Net Health and Climate in Europe, http://www.liv.ac.uk/enhance.
EU INTARESE (2010), Integrated Assessment of Health Risks of Environmental Stressors in Europe (www. intarese.org).
IenM (2011), Ontwerp Structuurvisie Infrastructuur en Ruimte. Nederland concurrerend, bereikbaar, leefbaar en veilig. Ministerie van Infrastructuur en Milieu. Den Haag, http://www.rijksoverheid.nl/ documenten-en-publicaties/rapporten/2011/06/14/ ontwerpstructuurvisie-infrastructuur-en-ruimte.html.
PBL (2009), Wegen naar een klimaatbestendig Nederland, PBL Planbureau voor de Leefomgeving, Den Haag/ Bilthoven.
PBL (2010), Adaptation strategy for climate-proofing biodiversity. Planbureau voor de Leefomgeving, Vonk, M.; C.C. Vos, & D.C.J. van der Hoek (Ed), Bilthoven, http://www.pbl.nl/sites/default/files/cms/publicaties/500078005_adaptation_strategy_for_climate-proofing_biodiversity.pdf
PBL (2011), Climate adaptation in the Dutch delta. Strategic options for a climate proof development of the Netherlands. PBL Netherlands Environmental Assessment Agency, PBL publication number 500193002, Den Haag/Bilthoven.
Runhaar, H., H. Mees, J.A. Wardekker, J.P. van der Sluijs & P.P.J. Driessen (2012), Adaptation to climate-related risks in Dutch urban areas: stimuli and barriers. Reg. Environ. Change (DOI: 10.1007/s10113-012-0292-7).
VROM (2006), Naar een klimaatbestendig Nederland. Het Nationaal Programma Adaptatie Ruimte en Klimaat 2006-2014. Ministerie Volkshuisvesting, Ruimtelijke Ordening en Milieu, Den Haag.
VROM et al. (2007), Nationale Adaptatiestrategie. Ministeries Volkshuisvesting, Ruimtelijke Ordening en Milieu, Ministerie Landbouw, Natuur en Voedselzekerheid, Ministerie Verkeer en Waterstaat, Ministerie Economische Zaken, Den Haag.
WHO CEHAPIS (2011), Tools for the monitoring of Parma Conference commitments, http://www.euro.who.int/__data/assets/pdf_file/0019/134380/e94788.pdf

91References |

THE EFFECTS OF CLIMATE CHANGE IN THE NETHERLANDS: 2012
This policy study is a publication by
PBL Netherlands Environmental Assessment Agency
Mailing addressPO Box 303142500 GH The HagueThe Netherlands
Visiting addressOranjebuitensingel 62511VE The HagueT +31 (0)70 3288700
www.pbl.nl/en
March 2013 POLICY STUDIES
The climate is changing; average temperatures in the Netherlands have increased by 1.7 °C over the past century and extreme precipitation events occur more often than before. According to current insights, climate change is set to continue in the centuries to come. Not only are global temperatures and extreme precipitation events projected to increase, but so are river discharges, sea level rise and the likelihood of droughts. However, the possible climatic changes are subject to large uncertainty. In the Netherlands, for example, average annual precipitation could either decline by 5% or increase by 6%, between the present day and the year 2100. This makes it more difficult to anticipate possible consequences of climate change. The impacts of climate change are expected to vary widely in the Netherlands. Some effects will be positive, such as those of increased agricultural production and more fine days for recreation. Other effects, however, will be negative; there is an increase in the likelihood of water drainage flooding as a result of extreme precipitation events, and of heat stress within cities due to rising temperatures.In theory, the consequences of further climate change for the Netherlands at the current rate of change would be manageable. This is partly due to the fact that impacts appear to be limited and changes gradual, thus providing enough time to anticipate them. The fact that climate risks have been incorporated in the various policy portfolios is another reason for the manageability of such risks. For example, the Delta Programme pays attention to climate-proofing the built environment and to environmental developments that could threaten water safety and freshwater availability. There also are policy areas that award less attention to climate impacts - an important one of which is nature policy.