Embed Size (px)
Citation preview
The effectiveness of African Growth and Opportunity Act (AGOA) in increasing trade from Least Developed Countries
A systematic review
by Niall Condon Matthew Stern
March 2011
Systematic review
i
The EPPI-Centre reference number for this report is 1902.
This report should be cited as: Condon N, Stern M (2010) The effectiveness of African Growth and Opportunity Act (AGOA) in increasing trade from Least Developed Countries: a systematic review. London: EPPI-Centre, Social Science Research Unit, Institute of Education, University of London.
ISBN: 978-1-907345-07-4
© Copyright
Authors of the systematic reviews on the EPPI-Centre website (http://eppi.ioe.ac.uk/) hold the copyright for the text of their reviews. The EPPI-Centre owns the copyright for all material on the website it has developed, including the contents of the databases, manuals, and keywording and data extraction systems. The centre and authors give permission for users of the site to display and print the contents of the site for their own non-commercial use, providing that the materials are not modified, copyright and other proprietary notices contained in the materials are retained, and the source of the material is cited clearly following the citation details provided. Otherwise users are not permitted to duplicate, reproduce, re-publish, distribute, or store material from this website without express written permission.

1
Contents List of abbreviations ....................................................................................... 2 Abstract ...................................................................................................... 3 Executive Summary ........................................................................................ 4 1 Background ............................................................................................. 7
1.1 Aims and rationale for current review ..................................................... 7 1.2 Policy and practice background ............................................................. 7 1.3 Conceptual Framework ........................................................................ 8 1.4 Research background ......................................................................... 10 1.5 Purpose and rationale for the review...................................................... 10
2 Methods used in the review ........................................................................ 12 2.1 Type of review ................................................................................. 12 2.2 User involvement .............................................................................. 12 2.3 Identifying and describing studies.......................................................... 12 2.4 Methods for synthesis ......................................................................... 14 2.5 Deriving conclusions and implications ..................................................... 15
3 Search results ......................................................................................... 17 3.1 Studies included from searching and screening.......................................... 17 3.2 Details of included studies .................................................................. 17
4 Synthesis results ..................................................................................... 19 4.1 Synthesis of evidence ......................................................................... 19 4.2 Further details of studies included in the synthesis .................................... 20 4.3 Summary of results of synthesis ............................................................ 21 4.4 Impact of AGOA on exports from eligible SSALDCs ...................................... 22 4.5 Explaining observed export trends under AGOA ......................................... 29 4.6 Extension of full DFQF access to US market for all LDCs ............................... 36
5 Implications ........................................................................................... 42 5.1 Strengths and limitations of the systematic review..................................... 42 5.2 Conclusions and Recommendations ........................................................ 42
6 References ............................................................................................ 45 6.1 Studies included in review ................................................................... 45 6.2 Studies excluded at final screening ........................................................ 46 6.3 Other references used in the text of the technical report ............................ 48
Appendix 1.1: Authorship of this report ............................................................... 49 Appendix 2.1: Inclusion and exclusion criteria ....................................................... 50 Appendix 2.2: Note on modelling methodologies .................................................... 51 Appendix 2.3: Search strategy for electronic databases ........................................... 52 Appendix 2.4: Journals handsearched (post 2000) .................................................. 53 Appendix 2.5: Coding/Keywording tool ............................................................... 54 Appendix 2.6: Critical Appraisal Tool .................................................................. 56 Appendix 3.1: Details of studies included in the review ........................................... 57

2
List of abbreviations
AGOA African Growth and Opportunity Act
AVE Ad Valorem Equivalent
CGE Computer Generated Equilibrium
DFID Department for International Development (UK)
DFQF Duty-Free Quota-Free
EBA Everything But Arms
EPZ Export Processing Zone
EU European Union
FDI Foreign Direct Investment
GATT General Agreement on Tariffs and Trade
GSP Generalised System of Preferences
GTZ Gesellschaft für Technische Zusammenarbeit (German Agency for International Cooperation)
HS Harmonised System
LDC Least Developed Country
MFA Multi-Fibre Arrangement
MFN Most Favoured Nation
ODI Overseas Development Institute
PTA Preferential Trade Agreement
SME Square Metre Equivalent
SSA Sub-Saharan Africa
UNCTAD United Nations Conference on Trade and Development
US United States
USAID United States Agency for International Development
USITC United States International Trade Commission
WTO World Trade Organisation

3
Abstract
What do we want to know? How effective has the African Growth Opportunity Act (AGOA) been at increasing trade from Least Developed Countries (LDCs)? What is the expected impact of extending full Duty-Free Quota-Free (DFQF) access to the US market to all LDCs? Who wants to know and why? The results of this systematic review will benefit parties involved in the trade policy-making process and the aid for trade agenda in the Sub-Saharan Africa region, including multilateral organisations such as the World Bank and World Trade Organisation (WTO), bilateral donors, research organisations, NGOs and trade ministries and other bodies directly involved in the trade policy formulation process in Sub-Saharan African countries themselves. What did we find? AGOA has had a positive impact on apparel exports from a small number of Sub-Saharan African LDCs. Outside of the apparel sector there is little or no evidence of AGOA induced gains in any other sectors for LDCs. The extension of full DFQF access to all LDCs is expected to result in marginal losses for apparel exporting LDCs. Most other Sub-Saharan African LDCs can be expected to enjoy net gains under full DFQF access to the US market as this will remove duties on products not covered by AGOA preferences, most importantly on agricultural commodities. What are the implications? It is important that AGOA preferences cover all products. Tariffs on products excluded from AGOA, especially on agricultural goods, remain high and AGOA’s broader economic impact could be improved if preferences were extended to all products. Equally, products which are currently subject to tariff rate quotas should be fully liberalised. Consideration also needs to be given to making AGOA preferences permanent. These measures need to be coupled with non-restrictive rules of origin which will allow exporters in LDCs the flexibility to freely source inputs and exploit their comparative advantage in labour intensive products. How did we get these results? Systematic review procedures and techniques were used to generate the results. The systematic review uncovered 178 reports, of which 21 were selected for the final in-depth review.

4
Executive Summary
Background The emergence of independent nation states in Africa and Asia in the post-colonial era was accompanied by the introduction of trade preferences. Preferential access to developed markets was seen as a way to quickly integrate these countries into the global economy. But most African LDCs have failed to reap the economic gains that come with international trade. The African Growth and Opportunity Act (AGOA) was signed into law by the US Congress on May 18th 2000, with the broad objective of boosting exports from Sub-Saharan Africa to the US by eliminating tariff barriers on a large number of their exports. AGOA was initially due to expire in 2008, however it was subsequently extended and it is now set to expire in 2015. Objectives This systematic review aims to rigorously assess the available evidence on the benefits of AGOA for Sub-Saharan African LDCs in order to arrive at a clear understanding of its effectiveness and impact. The review explains what it is about AGOA that works, for whom it works, in what circumstances and why. In addition the review explores the likely implications of extending full Duty-Free Quota-Free (DFQF) preferences to the US market to all LDCs. Specifically, the objective of this systematic review was to answer the following question formulated by DFID policy-makers: “How effective has the African Growth Opportunity Act (AGOA) been at increasing trade from Least Developed Countries (LDCs)? What is the expected impact (on participating countries and the US) of extending Duty Free Quota Free (DFQF) access to the US market to all products from all LDCs?” Methods The review was conducted between May and November 2010 in accordance with the general guidelines provided by the EPPI-Centre. The review process comprised five stages: literature searching and identification; selection of literature in accordance with inclusion criteria; mapping and quality evaluation of identified publications; data extraction; and final in-depth review or synthesis. The literature search identified 178 potentially relevant studies and, after eliminating duplicates and applying the exclusion criteria, 21 studies were left for inclusion in the final in-depth review or synthesis. The synthesis is presented in the form of a textual narrative structured around three thematic areas or sections. The first section of the synthesis assesses the extent to which eligible Sub-Saharan African countries, with particular focus on LDCs, responded to AGOA preferences. In the second section we explain the key reasons for the trends uncovered in the first section, with the aim of understanding and explaining the structure of exports under AGOA. The third section of the synthesis explores the potential impact on

5
AGOA beneficiaries of extending full duty and quota free access to the US market to all LDCs. Details of the included studies The final 21 studies selected for the in-depth review were varied in terms of their objectives, focus and methodologies. Many of the studies covered in the first section of the synthesis are quite narrow in terms of their approach, focusing solely on measuring the extent to which AGOA has increased exports from Sub-Saharan Africa, without any real analysis of these trends. Results from these studies are supplemented with information from other studies which examine in detail the factors explaining export trends under AGOA. Together these studies provide a strong evidence base on which the impact of AGOA can be assessed and evaluated. Synthesis results The following are the key results to emerge from the review:
Impact of AGOA on exports from Sub-Saharan African LDCs
Exports from Sub-Saharan Africa to the US have increased substantially since 2000, with an increasing share of these exports utilising AGOA preferences. All four studies which consider this outcome agree on this result.
At best a small share of these increased exports can be directly attributed to AGOA. This result is supported by evidence from four modelling studies, two of which find that AGOA has had no impact on exports and two which find that AGOA has had a marginal impact on exports.
Apparel is the only product grouping in which AGOA seems to have stimulated any significant increase in exports. Four studies empirically measure this effect and all find a strongly positive correlation between increased apparel exports and AGOA.
Exports from LDCs under AGOA are dominated by apparel, largely from Lesotho, Malawi and Madagascar. Outside of apparel there is no evidence of any other significant AGOA exports from LDCs. All eleven studies considered in the first section of the synthesis support this result.
Factors explaining observed export trends under AGOA
Product coverage under AGOA has been limited, particularly in the case of LDCs, for whom AGOA offered very limited additional coverage over and above what they already enjoyed under the Generalised System of Preference (GSP). Three studies agree on this result.
Preference margins under AGOA were also found to be minimal, especially when compared to tariffs on products excluded from AGOA. The exceptions to this were apparel products on which average preference margins are high. Three studies which assess AGOA preference margins agree on this result.
AGOA’s liberal rules of origin have been instrumental in driving apparel exports from LDCs. This result is supported by all four studies which analyse AGOA rules of origin.
Impact of full DFQF access to US market for all LDCs
The extension of full DFQF access to the US market to all LDCs will result in preference erosion, but this will be limited to a small number of countries, principally apparel exporters. Both modelling studies which address this issue
6
find that the potential losses from preference erosion in the apparel sector will be minimal.
The potential losses to apparel exporters will be mitigated by the fact that exporters from these countries capture a minor share of the preference rent on their exports under AGOA. This is supported by evidence from the one study in the review which empirically measures the distribution of AGOA rents.
The two studies which model the impact of full DFQF access find Sub-Saharan African countries will achieve net gains as a result of the extension of full DFQF access to the US market to all LDCs, as this will open the US market to African agricultural exports that are not covered by AGOA preferences.
Conclusions and recommendations This systematic review aimed to assess the impact AGOA has had on exports from Sub-Saharan African LDCs as well as the likely impact of the extension of full DFQF access to the US market for all LDCs. The review provides for consistent and reasonably definitive answers in both cases. Firstly, although AGOA has clearly played an important role in boosting apparel exports from a relatively small group of Sub-Saharan African (SSA) LDCs to the US market, its broader economic impact has been much more modest. In the apparel sector, linkages with the local economy are weak and there has been little transfer of capital or skills. Moreover, most of the rent from apparel preferences goes to Asian investors and importers in the US. Looking beyond the apparel sector, the marginal preferences are low and AGOA has consequently had little or no impact on exports. Secondly the evidence suggests that SSA apparel-exporting LDCs will be adversely impacted by the extension of DFQF access to the US market, though the scale of these losses will be reasonably small. On the other hand, many Sub-Saharan African countries might achieve net gains under full DFQF access to the US market as this will involve the removal of duties on products not covered by AGOA preferences, such as agricultural commodities. Looking forward, the body of evidence reviewed suggests that AGOA’s broader economic impact could be improved if preferences were extended to all products and fixed for a longer period of time. Equally, products which are currently subject to tariff rate quotas should be fully liberalised. Such measures should be accompanied with non-restrictive rules of origin that will give AGOA exporters the flexibility they need to source inputs globally and exploit their comparative advantage in labour intensive products. Most of the trade analysis in the review is based on data which is over five years old. Although it is unlikely that there have been major shifts in export patterns over the last few years, more up to date research and analysis is clearly required in order to confirm early work done on AGOA. Additional work on the role of rules of origin and market power in determining the scale and allocation of AGOA rents will also seem useful.

7
1 Background
This section of the report outlines the origins of the review, its rationale and objectives and also provides some contextual background information on AGOA and a conceptual framework against which it can be evaluated.
1.1 Aims and rationale for current review
This systematic review aims to rigorously assess the evidence base on the benefits of AGOA for LDCs in order to arrive at a clear understanding of its effectiveness and impact. The review explains what it is about AGOA that works, for whom it works, in what circumstances and why. In addition the review explores the likely implications of extending full US DFQF preferences to all LDCs, including those from outside of Africa. The results of this systematic review will benefit parties involved in the trade policy-making process in the Sub-Saharan Africa region, including multilateral organisations such as the World Bank and WTO, bilateral donors, research organisations, NGOs and trade ministries and other bodies directly involved in the trade policy formulation process in Sub-Saharan African countries themselves.
1.2 Policy and practice background
1.2.1 African Growth and Opportunity Act (AGOA)
AGOA was signed into law by the US Congress in May 2000. The principal objective of AGOA was to facilitate the integration of Sub-Saharan African countries into the global economy by providing preferential access to the US market for exporters from these countries. AGOA was initially due to expire in 2008, however it was extended and it is now set to expire in 2015 (Naumann 2009). AGOA builds on the US’s GSP programme, increasing the range of products for which preferential access is granted to include such products as petroleum, clothing, and a range of other agricultural and industrial products. Mattoo et al. (2003) estimate that whereas the US GSP regime covered about 17 percent of SSA exports to the US in 2000, AGOA preferences increased this fourfold to 72 percent. The initial and primary question explored in this review is whether this improvement in preferential access has translated into a real and tangible increase in exports from SSA to the US. The second and related question is whether any changes to US trade policy, which extend preferential access to all LDCs (not just those from SSA), would impact on trade between SSA and the US. To address both of these questions requires some understanding of the motivation for and evolution of trade preferences more broadly.
1.2.2 Trade Preferences
The Most Favoured Nation (MFN) clause in Article 1 of the General Agreement on Tariffs and Trade (GATT) is a key component of the modern multi-lateral trading system. The central premise of the MFN clause is the principle of non-discrimination, which prohibits countries from discriminating between trading partners. In effect this means that if a country grants a trading partner a special concession (e.g. lower duties on a particular product), the MFN clause compels them to offer the same to all WTO members. The GATT does however allow for exceptions to the MFN rule in the context of reciprocal preferential agreements (e.g. Regional Free Trade Agreements), and also allows for agreements which

8
provide developing countries and LDCs special or preferential access to developed markets (Hoekman et al. 2006). AGOA falls under the latter MFN exception, granting a select group of Sub-Saharan African countries preferential access to the US market. The rationale for granting preferential market access to developing countries emerged in the mid 20th century. Preferences were seen as a way of quickly boosting the industrial capacity of newly independent nations in Africa and Asia and integrating them into the global trading system. Against this background the general framework for the provision of such preferences, the GSP, was established by the United Nations Conference on Trade and Development (UNCTAD) in 1968. The US passed legislation formalising their GSP regime in 1974. Under the US system of preferences, eligible countries pay zero tariffs on 4,650 tariffs lines or products, with LDCs paying zero tariffs on a further 1,750 lines (Hoekman et al. 2006). In addition to these shallow preferences the US has over the years established additional non-reciprocal or deeper preferences, for a sub-set of what are perceived to be vulnerable countries or regions. Examples of such initiatives include the Caribbean Basin Trade Partnership Act in 1983, the Andean Trade Preference Act in 1991 and, of most relevance to this review, AGOA in 2000. The principal motivation behind AGOA was to stimulate exports from SSA by providing qualifying countries with preferential access to the US market, over and above that which is offered to most other LDCs. The theoretical framework below demonstrates the process through which trade preferences boost exports. It follows that if the US were to remove all remaining tariffs and quotas on exports from all LDCs, some of the preference given to SSA would be eroded, and this would likely impact adversely on exports from some SSA countries.
1.3 Conceptual Framework
The expected impact or outcome of a preferential trade agreement such as AGOA can be demonstrated using a simple three country, one good partial equilibrium framework1. The three countries in this framework will be labelled A, B, and C. Country A will be the US, country B will be any country in SSA (the example of Zambia is used in this case), and the label country C will be used to represent the rest of the world. For simplicity we assume that the three countries trade a homogenous good which is perfectly substitutable, and that production in each country occurs in perfectly competitive firms and returns to scale are non-increasing2. The partial equilibrium framework is illustrated graphically below in Figure 1.3. The figure contains three curves - DA is the import demand curve for the US, and XB and XC are the export supply curves of Zambia and the rest of the world respectively. Note that the supply curve, XC, of the rest of the world is perfectly flat and in line with the world price (P) - this is because the rest of the world is by definition too large to be influenced by changes in import volumes in the US and it can provide all that is demanded at the world price. Zambia, on the other hand, is a relatively small producer and its exports to the US are responsive to price changes. It therefore faces an upward sloping supply curve, XB. In this framework the US (A) imports the product in question from Zambia (B) and the rest of the world (C) and prior to AGOA levied a tariff of t on imports from both
1 The analysis in this section is adapted from Bora et al. (2002) 2 These are standard assumptions used in the economic analysis of trade which are used in this case to simplify and illustrate the different potential economic outcomes of preferences.

9
Zambia and the rest of the world. The pre-AGOA equilibrium (also the post-AGOA equilibrium, as will be seen below) is point d in Figure 1.3, with total imports of 0Q°, of which 0QB° comes from Zambia and the larger balance from the rest of the world. With the enactment of AGOA, Zambia receives preferential access to the US market. Because exports from Zambia are too small to impact on the world price – US importers continue to pay the tariff inclusive price (P + t) on all imports and Zambia’s supply curve shifts down from XtB to XB. In this case AGOA would not lead to any increase in US imports - there has been no trade creation3. Instead trade diversion has occurred as AGOA has caused a shift in import volumes away from the more efficient producer (the rest of the world), in favour of the less efficient producer, in this case Zambia. This is shown in Figure 1.3 below. After the implementation of AGOA, total US imports has remained constant at 0Q°, but Zambia’s share of this volume has increased from 0QB° to 0QB¹. Thus, in theory, the introduction of AGOA preferences should have contributed to a shift in import demand away from the US’s historical trade partners, and towards those from AGOA beneficiary countries. This in turn should translate into increased production and exports from these countries. But the preference-gaining countries only gain to the extent that they are able to respond to, and take advantage of, the opportunities provided by the preference. There are a number of factors which may impact on the ability of AGOA beneficiaries to respond fully to these preferences and continue to benefit from them in the future. These might include:
Supply side constraints - exporting nations may lack the skills, capital and other resources needed to raise production in the short-term
The conditions of the agreement - rules of origin, for example, might increase the cost of production for exporters from Zambia and limit the extent to which the supply curve shifts downwards in response to the preference margin
The scale and longevity of the preferences – the value of the preferences might be eroded by extending similar benefits to other exporters or reducing tariffs on world imports
The partial equilibrium model thus provides us with an indication of the expected outcome of AGOA against which its performance should be evaluated. This systematic review will empirically assess, on the basis of existing research and information (the existing body of evidence), how African exporters have actually responded to these preferences and the extent to which these outcomes have been realised. In doing so, this review also considers those factors which have constrained Africa’s ability to reap the full benefits of AGOA; and the likely impact of any change to the US preferential trading system on AGOA exports.
3 Trade creation occurs when domestic production in the preference-granting country is replaced by more efficient imports.

10
Figure 1.3: Partial Equilibrium Model of AGOA
1.4 Research background
To our knowledge no systematic reviews have been undertaken on the subject of AGOA or trade preferences in general4. AGOA has been the subject of considerable research and study by a variety of institutions - universities, multilateral institutions, bilateral donors, research bodies, government ministries etc – and these studies are the source material which has been used for this review.
1.5 Purpose and rationale for the review
The overall objective is to conduct a systematic review for the following question formulated by DFID policy makers: “How effective has the African Growth and Opportunity Act (AGOA) been at increasing trade from Least Developed Countries (LDCs)? What is the expected impact (on participating countries and the US) of extending Duty Free Quota Free (DFQF) access to the US market to all products from all LDCs?” More specifically, and drawing on theoretical framework outlined above, the systematic review explores and assesses the following three key issues which are critical to understanding the effectiveness and impact of AGOA:
4 On a related theme and as part of this round of systematic reviews DFID has commissioned the Institute for
Development Studies (IDS) to undertake a review of the evidence on the impact of tariff reductions on employment and fiscal revenues in developing countries
P
DA
XC t P + t
XB
Q Q°
P
XB t
XC
QB° QB¹
b a c d
e f g h
Increase in Zambia exports after AGOA
0

11
Firstly, we assess the work done on the overall impact of AGOA in stimulating and increasing exports from LDCs in Africa to the US (i.e. measuring the extent to which exports have increased from QB° to QB¹ in Figure 1.3. above). Secondly, evidence from the selected studies is used to explain why some countries and sectors have gained more from AGOA than others. This will serve to identify the main opportunities and constraints arising from the current arrangement; and will enable us to provide informed comment on the effectiveness of the agreement in explaining specific changes in export performance. Thirdly, the evidence on the likely or potential impact of the extension of full duty-free, quota-free access to the US market for all LDCs is reviewed. In summary, the final in-depth review is divided into three broad sections or thematic areas. The first section outlines the impact of AGOA, and will explain in detail the impact AGOA has had in stimulating exports from Sub-Saharan countries. The second section disaggregates this export impact; outlining which countries and sectors have gained most from AGOA and why, as well as exploring the barriers which have limited the effectiveness of AGOA in other countries and sectors. The first two sections give a good indication as to how effective or useful AGOA has been and informs the analysis in the third section, which explores the potential impact of the extension of full preferential access to the US market for all LDCs.

12
2 Methods used in the review
This chapter provides an overview of the procedures underpinning the review. It provides the reader with details on the rigour of the methodology and the impact of these on the search for appropriate literature. Details on the number and type of publications identified are also provided.
2.1 Type of review
This review was conducted between May and November 2010. The review was conducted in close collaboration with the EPPI-Centre and followed their general guidelines on conducting systematic reviews. The review process comprised five stages: literature searching and identification; selection of literature in accordance with inclusion criteria; mapping and quality evaluation of identified publications; data extraction; and final in-depth review or synthesis. The review addressed the question on the impact AGOA has had on stimulating exports from SSA. A variety of search techniques were employed to identify relevant literature. A selection of keywords or codes allocated to relevant publications provided a descriptive structure through which the review question was analysed. Finally, the evidence was combined in an in-depth synthesis to answer the review question and provide policy relevant insights and recommendations. The review also highlights gaps in the literature. The synthesis takes the form of a textual narrative organised around three thematic areas. This approach is described in detail in section 2.4.3 below.
2.2 User involvement
The involvement of potential users of the review users was limited during the process of designing and conducting the review. Experts in the field were contacted during the search stage of the review to request relevant research or studies on the subject matter under review. After the completion of the in-depth review, feedback was/will be requested from a selection of users on the results of the review. A draft of the final review will be circulated to a sample of these users - in this case three regional trade Ministries (Mozambique, Zambia, South Africa), the World Bank, one research organisation (ODI), and three donors (GTZ, USAID and DFID). Comments and feedback from these organisations were/will be incorporated into the final review. The final systematic review will be disseminated as widely as possible to policy makers in Africa, the US and the WTO, and DFID will assist in this process.
2.3 Identifying and describing studies
Studies identified through a range of search methods were subject to scrutiny, guided by comprehensive criteria relating directly to the research questions given above.
2.3.1 Defining relevant studies: inclusion and exclusion criteria
The research topic being addressed provides the principal guide as to which studies were included, and ultimately studies to be included in the review had to contribute towards answering the given research questions. The following are the criteria which were used to select studies:
- Studies had to present primary research and analysis; and - Studies had to have a robust methodology. Methodologies considered for
inclusion are modelling analysis (gravity models, partial equilibrium,

13
Computer Generated Equilibrium (CGE)), raw trade data analysis and ex post country specific case studies; and
- Studies had to focus specifically on AGOA, either exclusively or as a substantial chapter or component of a wider analysis of preferential trade agreements; and
- Studies had to include sufficient trade and/or economic analysis, i.e. the results from these studies had to be underpinned by a clear economic theory or framework and primary empirical analysis; and
- Studies had to be medium or high quality as measured by our quality appraisal tool.
2.3.2 Identification of potential studies: search strategy
The search strategy was comprehensive and aimed to uncover all relevant published and unpublished work relating to the research questions. The search encompassed bibliographic databases, search engines and gateways, specialist websites, and academic journals. Three distinct search terms were used to search the electronic databases and search engines - see Appendix 2.3 for details on search terms used. DNA Economics also used its network of contacts in the field to uncover other potentially relevant material. Finally the bibliographies of all studies recovered were scanned to identify useful studies. Appendix 2.3 contains full details on the search, including all sources covered and the results of the search. Titles and abstracts of all potentially relevant studies were imported into to the EPPI-Reviewer database to undergo the first round of screening.
2.3.3 Screening studies: applying inclusion and exclusion criteria
The search strategy generated 178 potentially relevant studies which were then screened to assess their eligibility for inclusion in the synthesis. Overall, the screening process comprised three distinct phases: ‘raw screening’ (as generated by electronic databases and search engines); title and abstract only; and finally full text screening. Screening at the raw stage consisted of analysing the results of the search and excluding studies already recovered and studies which were indisputably irrelevant. Two reviewers (Niall Condon and Matthew Stern) - using the inclusion and exclusion criteria described in section 2.3.1 - then assessed titles and abstracts for relevance to the review and made a recommendation as to their inclusion or exclusion. Any studies that a reviewer was unsure whether to mark as relevant were flagged and discussed between the reviewers in light of the inclusion and exclusion criteria. The reviewer recommendations were compared and discrepancies discussed. Where, following discussion, the relevance of a publication was still unclear, the full text was obtained. Relevant and potentially relevant (or unclear) publications were obtained and the status of all obtained publications was reviewed on the basis of the full text to confirm their relevance to the review before proceeding to the mapping phase of the process.
2.3.4 Characterising included studies
Studies identified as relevant to the review were examined and described using appropriate keywords through a combination of EPPI-Centre key-wording guidelines as well as additional review-specific keywords (see Appendix 2.5).

14
2.3.5 Identifying and describing studies: quality assurance process
The reviewers worked closely to ensure that the inclusion criteria and key-wording system were used consistently. The reviewers kept in close contact with both the EPPI-Centre and DFID link person with a view to ensuring that the methods were applied correctly and were in line with the recommended guidelines and frameworks.
2.3.6 Title and abstract screening: quality assurance
To ensure inclusion criteria were being applied consistently, two of the reviewers completed a comparison of 25 studies. Complete agreement on inclusion was achieved in the overwhelming majority of cases (there was just one study over which the reviewers disagreed and this study was eventually included).
2.3.7 Keywording quality assurance
To ensure that keywording was being applied consistently across studies, a selection of papers were scrutinised for keywording discrepancies in key fields of the ‘review specific’ keywording questions. This scrutiny revealed that there was an acceptable level of agreement.
2.4 Methods for synthesis
This section provides an overview of the approach which was taken to synthesising the evidence from the final 21 studies selected for the in-depth review, starting with the process of data extraction.
2.4.1 Data extraction
Full reports of studies were analysed at this stage using a set of data extraction questions devised by the review team. The data extraction questions were focused around the three thematic areas of the synthesis described earlier. The goal of the data extraction process was to build up a detailed body of knowledge or evidence on each of the three thematic areas. Key information from selected studies was extracted. In particular, key findings from each publication were recorded - details of keywords used to extract data and results from the selected studies can be found in Appendix 2.5. Findings were then incorporated in the synthesis according to their thematic area and placed in the conceptual framework.
2.4.2 Assessing quality of studies
An initial or preliminary stage of quality appraisal took place at the screening phase where methodological and topic specific appropriateness criteria were used to assess and exclude studies. The critical appraisal tool developed by Campbell et al (2003) was adapted and used to undertake the quality appraisal at this, the data extraction stage. This involved examining each study using the set of questions listed in Appendix 2.6, and rating each study accordingly, assigning a score of high (++), medium (+) or low (-). It was decided that studies which met less than half (four) of these critical appraisal criteria would be graded as low and excluded from the final synthesis. Again, after consultation amongst the authors, it was decided that to achieve a high rating studies had to respond positively to at least 8 of the nine sections and between 5 and 7 to achieve a medium score. Studies which underwent the critical appraisal at the data extraction stage were not excluded. Instead, as mentioned above, they were given a rating or a weighting. The principal reason for this is that studies with analytical flaws or

15
weaknesses may nevertheless provide important insights, and thus should enhance the synthesis. Overall, though, the issue of the quality of the included studies was not a major issue as the majority of the studies included in the in-depth review were of a high standard. Eighteen of the twenty one studies considered for, and included in the final in-depth review achieved a high critical appraisal score, with the other three achieving a medium score. The score for each individual study and the criterion they failed to meet is detailed in Appendix 3.1.
2.4.3 Overall approach to and process of synthesis
The synthesis was structured around the methodological framework introduced above and the three key thematic areas into which we divided the research question. The first section of the synthesis assesses the extent to which eligible Sub-Saharan African countries, with particular focus on LDCs, responded to AGOA preferences. In the second section we consider the reasons for the trends uncovered in the first section in order to understand and explain the structure of exports under AGOA. The third section of the synthesis then explores the potential impact on AGOA beneficiaries of extending full duty and quota free access to the US market to all LDCs. It is important to emphasise that in this review the aim was not to simply establish whether or not AGOA has led to an increase in African exports (although we do answer this question in the review). Instead, we try to take the review a step further and provide policy-makers with an explanatory analysis aimed at discerning not only what has happened to exports under AGOA but also the reasons why. In light of these goals and given the nature of the subject matter a realist approach was used to synthesise the evidence in this case. In line with the realist approach, the synthesis takes the form of textual narrative, organised around the three thematic areas identified above. Textual narrative synthesis is useful for collating and presenting different types of evidence - qualitative, quantitative, economic etc. and was therefore deemed the most appropriate approach for us to take when synthesising the evidence in this case.
2.4.4 Selection of outcome data for synthesis
The synthesis structure outlined above guided the outcome data we extracted from each study included in the final in-depth review. The coding framework developed to extract this information was designed around this structure. It is important to emphasise that the synthesis took place at the findings level. For example findings from studies utilising a gravity model are discussed in the first section of the synthesis. When synthesising these gravity modelling studies, we emphasise the results of these studies and do not assess the differing technicalities and approaches employed in specifying the gravity equation. The point is that we are more interested in review-specific results of these studies than in dwelling on the technicalities of the equations and variables they use in their models.
2.5 Deriving conclusions and implications
Deriving conclusions and results was a continuous collaborative process. The findings from the studies included in the in-depth synthesis provided a strong evidence base and clear identifiable trends emerged which were discussed in detail amongst the principal investigators, Matthew Stern and Niall Condon, throughout

16
the process of conducting the review. Key conclusions and implications emerged from this process.
17
3 Search results
This chapter describes how studies were identified and the process through which they were evaluated for inclusion.
3.1 Studies included from searching and screening
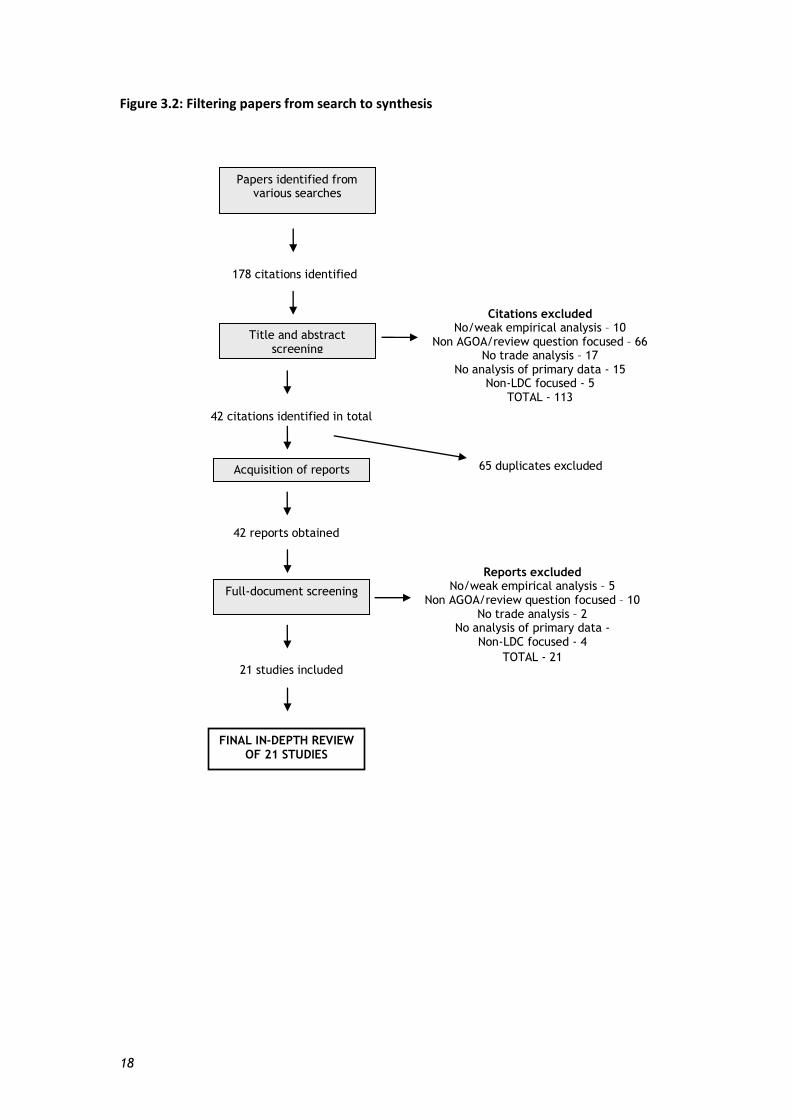
The process of searching for and screening studies was described in detail in the previous chapter. The results of this process are illustrated in the Figure 3.1 below. Unsurprisingly, given the specialised nature of the subject matter, the search did not generate a large number of results - in total 178 reports were uploaded into the EPPI-Reviewer database. Duplicates were then removed and the titles and abstracts of these reports were scanned using the exclusion criteria, leaving fifty potentially relevant reports. The full text documents of these reports were screened once again using the exclusion criteria, ultimately leaving 21 reports for the final in-depth review.
3.2 Details of included studies
The final 21 studies selected for the in-depth review were varied in terms of their objectives, focus and methodologies. Many of the studies covered in the first section of the synthesis are quite narrow in terms of their approach, focusing solely on the measuring the extent to which AGOA has increased exports from SSA, without any real analysis of these trends. Results from these studies are supplemented with information from other studies which examine in detail the factors explaining export trends under AGOA. As a whole and together, the studies therefore provide a good evidence base on which the impact of AGOA can assessed and evaluated. Table 4.2 provides a summary of the included studies; more detailed information can be found in Appendix 3.1. One noticeable trend to emerge during the search was the relative paucity of recent analysis on the impact of AGOA. The majority of the studies reviewed in the synthesis were conducted during the early years of AGOA and there is little evidence in the synthesis based on data beyond 2005. AGOA is still a relatively young initiative5 and supply responses from LDCs can take years to materialise thus it is important that the impact of AGOA continues to be analysed. 21 studies were excluded at the final screening stage. In just under half of these cases studies were excluded because there was insufficient focus on AGOA in the analysis (note also that our interpretation of this criteria was extended to exclude studies which did not contribute to answering the review question). Anderson et al (2005), Ianchovivhina (2003) and Inama (2002) are examples of studies excluded under this criterion. Five studies were excluded because of weaknesses in their analysis. Chatima (2007) is a good example of a study which was excluded under this criterion – although an interesting case study on an AGOA eligible LDC, the analysis of the trade data was not sufficiently detailed (for example the study uses aggregated GSP and AGOA export data when analysing Malawi’s AGOA exports). A further two studies were excluded because there was no analysis of trade data – for example McCormick (2006) which is primarily a legal analysis of AGOA. Finally, four studies were excluded because they focused on AGOA’s impact on non-LDCs, examples including Bede (2007) and Jauch (2007).
5 Although AGOA is due to expire in 2015, the expectation is that it will be extended further.
18
Figure 3.2: Filtering papers from search to synthesis
Papers identified from various searches
178 citations identified
Title and abstract screening
Citations excluded No/weak empirical analysis – 10
Non AGOA/review question focused – 66 No trade analysis – 17
No analysis of primary data - 15 Non-LDC focused - 5
TOTAL - 113 42 citations identified in total
Acquisition of reports
42 reports obtained
Full-document screening
21 studies included
FINAL IN-DEPTH REVIEW OF 21 STUDIES
65 duplicates excluded
Reports excluded No/weak empirical analysis – 5
Non AGOA/review question focused – 10 No trade analysis – 2
No analysis of primary data - Non-LDC focused - 4
TOTAL - 21

19
4 Synthesis results
This chapter presents the findings of the review. The variety of approaches, timing, foci and methodological designs of these studies precludes a meta-analytical approach to review. Instead the findings will be presented in the form of a structured narrative organised around the three thematic areas identified earlier.
4.1 Synthesis of evidence
The synthesis is divided into three principal sections. Firstly we examine the evidence on what has happened to exports from SSA to the US over the past 10 years or since the introduction of AGOA. According to the Office of the US Trade Representative, AGOA imports from eligible countries totalled USD$51.1bn in 2007, more than six times their level in 2001, the first full year of AGOA (Office of U.S Trade Representative, 2008). Clearly there has been a significant increase in exports under AGOA. However, the extent to which the preferences granted under AGOA have directly contributed to this export growth is questionable. The first section aims to address this question. A cursory review of the available trade data also reveals that the benefits of AGOA have accrued to a small number of countries exporting a limited product range, principally apparel products. The second section seeks to explain in detail why exports under AGOA have been concentrated amongst a particular set of countries and products and why a much wider number of LDCs in SSA have failed to take advantage of AGOA preferences. Finally the third section of the synthesis will explore the potential impact of the extension of full duty-free quota-free access to the US market to all LDCs. On the one hand, such a policy shift may pose a threat to the preferential access currently enjoyed by AGOA-eligible LDCs over other LDCs outside of SSA. However, at the same time, it may create new opportunities for African exports of products currently not covered by AGOA. The evidence in support of both of these possibilities is examined. The studies included in the synthesis cannot be classified neatly into the three sections outlined above and there is considerable overlap, especially between sections one and two. For example many of the studies which quantify the impact of AGOA also include detailed analysis of the provisions of AGOA and how this affects the impact of the program. The results of such studies will thus be discussed in both of these sections. Table 4.2 on the following page provides a summary of all studies included in the review and also highlights the sections of the synthesis under which their results are discussed.

20
4.2 Further details of studies included in the synthesis
Table 4.2 below provides an overview of the studies included in the synthesis. More detailed descriptions of these studies can be found in Appendix 3.1.
Table 4.2: Summary table of included studies in this section
Title/Author Quality Study focus Approach Section
Bouet et al. (2010) High Full DFQF access for all LDCs
CGE Model 3
Brenton & Hoppe (2006)
High Analysis of initial impact of AGOA, rules of origin
Analysis of raw trade data and AGOA provisions
1,2,3
Brenton & Ikezuki (2004)
High Analysis of initial impact of AGOA, rules of origin
Analysis of raw trade data and AGOA provisions
1,2,3
Collier & Venables (2007)
High AGOA apparel exports and rules of origin
Regression model 1,2
Dean & Wainio (2006) High Product coverage, AGOA preference margins
Analysis of AGOA provisions 2
Fayissa & Tadesse (2007)
Medium Measuring AGOA exports Gravity model 1
Frazer & Van Biesebroeck (2007)
High Measuring AGOA exports Triple difference regression
model 1
Laborde (2008) High Full DFQF access for all LDCs
Partial Equilibrium model 3
Lall (2003) High AGOA led FDI and apparel exports
Country case study 3
Mattoo et al. (2003) High Potential impact of AGOA, rules of origin
Partial equilibrium model 1
Mueller (2008) High Measuring AGOA exports Gravity model 1
Nouve & Staatz (2003) Medium Measuring AGOA agricultural exports
Gravity model 1
Nouve (2005) High Measuring AGOA exports Gravity model 1
Office of US Trade Representative (2008)
Medium Measuring AGOA exports Trade data analysis 1
Olareeaga and Ozden (2005)
High AGOA preference rent Analysis of export prices 3
Phelps et al. (2008) High AGOA clothing exports Country case study 3
Portugal Perez (2008) High AGOA rules of origin Tobit model 2
Rolfe and Woodward (2005)
High AGOA apparel exports Country case study 3
Seyoum (2007) High Measuring AGOA exports Gravity model 1
Shapouri & Trueblood (2003)
High Analysis of initial impact of AGOA
Partial equilibrium model 1,2
Van Grasstek (2003) High AGOA product coverage Analysis of AGOA provisions 2
21
4.3 Summary of results of synthesis
The following are the key results to emerge from the review:
Impact of AGOA on exports from SSA LDCs
Exports from SSA to the US have increased substantially since 2000, with an increasing share of these exports utilising AGOA preferences. All four studies which consider this outcome agree on this result.
At best a small share of these increased exports can be directly attributed to AGOA. This result is supported by evidence from four modelling studies, two of which find that AGOA has had no impact on exports and two which find that AGOA has had a marginal impact on exports.
Apparel is the only product grouping in which AGOA seems to have stimulated any significant increase in exports. Four studies empirically measure this effect and all find a strongly positive correlation between increased apparel exports and AGOA.
Exports from LDCs under AGOA are dominated by apparel, largely from Lesotho, Malawi and Madagascar. Outside of apparel there is no evidence of any other significant AGOA exports from LDCs. All eleven studies considered in the first section of the synthesis support this result.
Factors explaining observed export trends under AGOA
Product coverage under AGOA has been limited, particularly in the case of LDCs, for whom AGOA offered very limited additional coverage over and above what they already enjoyed under the GSP. Three studies agree on this result.
Preference margins under AGOA were also minimal, especially when compared to tariffs on products excluded from AGOA. The exceptions to this were apparel products on which average preference margins were high. Three studies agree on this result.
AGOA’s liberal rules of origin have been instrumental in driving apparel exports from LDCs. This result is supported by all four studies which analyse AGOA rules of origin.
Impact of full DFQF access to US market for all LDCs
The extension of full DFQF access to the US market to all LDCs will result in preference erosion, but this will be limited to a small number of countries, principally apparel exporters. Both modelling studies which address this issue find that the potential losses from preference erosion in the apparel sector will be minimal.
The potential losses to apparel exporters will be much less than the scale of the preference margin, because exporters from these countries capture a minor share of the preference rent on their exports under AGOA. This is supported by evidence from the one study in the review which empirically measures the distribution of AGOA rents.
The two studies which model the impact of full DFQF access find Sub-Saharan African countries will achieve net gains as a result of the extension of full DFQF access to the US market to all LDCs, as this will open the US market to African agricultural exports that are not covered by AGOA preferences.

22
4.4 Impact of AGOA on exports from eligible SSALDCs
This section reviews the evidence on the impact that AGOA has had on exports from SSA countries to the US over the past 10 years. Evidence from 11 studies is presented and the analysis is divided into two parts. The first part describes the main trends in SSA exports to the US over the AGOA period; and in the second part, the causes of these trends and the possible contribution of AGOA are assessed.
4.4.1 Evidence from the trade data
Four of the selected studies (three high and one medium quality) – Shapouri and Trueblood (2003), Brenton and Ikezuki (2004), Brenton and Hoppe (2006) and Office of the US Trade Representative (2008) - review the raw trade data on SSA exports to the US and all find evidence of significant and increasing exports under AGOA. Shapouri and Trueblood (2003) examine the initial or early impact of AGOA by analysing US-SSA trade data for 2001 and 2002. In their analysis they note the large and increasing levels of SSA exports to the US under AGOA in 2001 and 2002. The share of AGOA exports in total SSA exports to the US was 43 percent (USD$7.6bn) in 2001, increasing to 60 percent (USD$8.2bn) in 2002 - this despite the fact that the agreement was still in its infancy. However deeper analysis of these gains reveals a trend which consistently re-emerges throughout the review – that exports under AGOA are highly concentrated by country and product grouping. AGOA exports in 2001 and 2002 were overwhelmingly dominated by previously low-tariff petroleum products (which essentially switched from MFN to AGOA after 2000) – 89 percent (USD$6.8bn) and 85 percent (USD$6.9bn) of AGOA exports in 2001 and 2002 respectively consisted of oil exports from three countries (Nigeria, Angola and Gabon). The balance was explained principally by apparel exports, which grew rapidly after the introduction of AGOA – from USD$337m in 2001 to USD$800m in 2002. These early apparel exports were largely accounted for by a small group of countries - Kenya, Lesotho, Madagascar, Malawi, and Swaziland – all of whom were eligible for the special apparel rule of origin which allowed them to source fabric from anywhere in the world (the issue of rules of origin is explored in detail in section 4.6.4). Similarly, Brenton & Ikezuki (2004) analyse SSA US trade data from 2002 with the objective of assessing the extent of exports originating from LDCs and non-LDCs. They further disaggregate the data by looking at the level of exports originating from LDCs with6 and without AGOA apparel preferences. In 2002, the total value of LDC exports to the US amounted to USD$963m, of which about half of this value, USD$437m, consisted of AGOA exports. Almost all of these AGOA exports (93 percent) were apparel exports from the group of LDCs that qualified for the full apparel benefits. The group of LDCs without clothing benefits did not export any products under AGOA in 2002. In fact they find that exports from this group (14 countries in 20027) fell by 30 percent between 1999 and 2002. Over this same period, exports from the group of LDCs with AGOA apparel benefits - just 9 countries8 in 2002 - increased by 80 percent, with virtually all of this increase coming from apparel exports under AGOA. Lesotho was undoubtedly the single greatest beneficiary of the AGOA apparel regime, with its apparel exports to the US increasing by 200 percent from 1999 to USD$321m in 2002.
6 Meaning they are able to export apparel to US with the liberal rule of origin which allows for the global sourcing
of fabrics 7 Benin, Central African Republic, Chad, DRC, Djibouti, Gambia, Guinea, Guinea-Bissau, Mali, Mauritania, Niger,
Rwanda, Sao Tome & Principe and Sierra Leone 8 Cape Verde, Ethiopia, Lesotho, Madagascar, Malawi, Mozambique, Uganda, Tanzania and Zambia

23
The authors find that exports from non-LDCs are more diversified than those from LDCs. Again, in their analysis of non-LDCs, they distinguish between those with and without apparel benefits9. The value of total AGOA exports from non-LDCs to the US in 2002 was USD$7.9bn – of which 85 percent consisted of petroleum exports from non-LDCs without apparel benefits10, principally from Nigeria. The value of exports from the group of non-LDCs eligible for the special rule of origin11 was $342m in 2002 – of which 60 percent ($201m) consisted of apparel exports. In other words, a significant portion of this trade is explained by a wider range of products. Finally AGOA exports for Mauritius and South Africa amounted to USD$896m in 2002 – with apparel products accounting for just 21 percent of this value. This is a reflection of the much broader industrial base of these countries and thus their ability to exploit preferences on a wider range of products. However, deeper analysis of the export data from these two countries highlights the difficulties they have encountered in meeting the more stringent rules of origin imposed on more developed AGOA beneficiaries. For instance, in 2002, only 47 percent of South African apparel exports to the US qualified for AGOA preferences. Brenton & Hoppe (2006) extend the above analysis by looking at trade data up to 2005. They find that by 2004 AGOA exports from SSA to the US had increased to USD$22bn, with 90 percent of this figure made up by petroleum exports. The USD$2.2bn in non-oil exports was still a significant increase on the level of exports in 2002. However non-oil exports dropped in 2005 to USD$1.7bn – 40 percent of this decrease was due to AGOA apparel exporters losing market share in the US due to the lifting of MFA quotas on Asian producers (the third section of the synthesis will explore this issue in more detail). Most of these losses were incurred by non-LDCS - for LDCs apparel exports decreased from just over USD$800m in 2004 to USD$700m in 2005. The authors note that AGOA exports are concentrated in a small number of countries, principally ones with access to apparel benefits. In 2004, 96 percent of US AGOA imports of apparel products came from just seven countries and 75 percent from just four countries (Kenya, Lesotho, Madagascar, and Swaziland). Lesotho was still the largest exporter with exports of just over USD$400m in 2005. The Office of the US Trade Representative (2008) provides evidence of the further increase in overall AGOA exports in 2006 and 2007. By 2007 US imports under AGOA were USD$51.1bn – 93 percent of which were explained by petroleum products, and USD$3.4bn accounted for by non-oil exports. Of these non-oil exports, USD$1.3bn were apparel exports and USD$271.5m was accounted for by agricultural exports (a 25 percent drop on 2006). The balance was made up of minerals and metals, transportation equipment and chemical products.
9 South Africa and Mauritius were the only countries not entitled to the special rule of origin 10
DRC, Cote d’Ivoire, Gabon, Nigeria and Seychelles 11 Botswana, Cameroon, Ghana, Kenya, Namibia, Senegal and Swaziland

24
Table 4.4.1: Summary of included studies on extent of exports under AGOA
Study Overall quality
Data time series
Type of study/analysis
Extent of AGOA exports
Brenton and Ikezuki (2004)
High 2002 Analysis of raw trade data on LDC AGOA exports
Large exports from LDCs, almost entirely apparel
Shapouri & Trueblood (2003)
High 2001-2002 Analysis of initial impact of AGOA
Large AGOA exports, highly concentrated by country and product grouping
Brenton & Hoppe (2006)
High 2000-2005 Analysis of raw trade data on AGOA exports
Large AGOA exports, dominated by petroleum products and apparel
Office of US Trade Representative (2008)
Medium 2000-2007 Analysis of raw trade data on AGOA exports
Large AGOA exports, dominated by petroleum products
4.4.2 Evidence from modelling studies
The available evidence shows that SSA exports under AGOA have increased significantly since 2000, with apparel exports from LDCs performing exceptionally strongly. However the extent to which this growth can be attributed to AGOA is unclear. A range of other factors may explain this improved export performance: increased growth levels in SSA, better governance and fiscal management, the commodity boom over this period, peace and stability etc. Also it is reasonable to argue that SSA oil exports to the US have not been stimulated by AGOA and would have occurred whether AGOA was in place or not. On the other hand, the previous section suggests that the special apparel benefits provided by AGOA have contributed to a rapid rise in exports of these products from the region. A number of studies have tried to assess the extent to which AGOA can directly explain the notable increase in exports from SSA to US since 2000. The majority of these studies draw on longitudinal data12 and use a gravity model or equation to isolate the impact of AGOA (and all other potential factors). In their most basic form, gravity models describe and predict trade flows between countries or regions as a function of the size of the trade partners (usually GDP) and the distance between them. But a much wider range of explanatory variables can be included, such as population, exchange rates, language, membership in international organisations, and dummy variables for agreements such as AGOA. This makes direct comparisons between different models difficult. Nevertheless, a number of common themes do emerge from the following review13.
4.4.3 Impact of AGOA on overall exports
Two studies – Mueller (2008) and Seyoum (2007) – employ gravity models and find that AGOA has had no significant impact on overall exports from SSA to US.
12 The time series of the data differs in each gravity model, depending on the point in time the study was
conducted after AGOA was enacted in 2002. Thus the later the study is conducted the more years of data will be available. Frazer and Van Biesebroeck (2007) was the most recent study and was able to draw on a data series
from 2000 to 2006. Studies which are able to draw on a more extensive dataset would in general be better
equipped to highlight important trends in the data. 13 US trade data separates between exports under AGOA and exports under the GSP (or any other arrangement).
This enables researchers to easily distinguish between actual exports qualifying for AGOA, and those that do not.
Any references to AGOA exports in the studies included in this review refer to goods qualifying for and utilising AGOA preferences.

25
Mueller (2008) uses a Prais-Winston14 gravity model to assess the extent of the contribution of AGOA to exports from eligible countries from 2000 to 2004. The author uses two models to assess different aspects of AGOA – the first measures the general effect of AGOA on trade by testing the impact of AGOA on total US imports (excluding oil) from AGOA-eligible countries; and the second model tests the impact of AGOA on apparel imports. The first model results in a negative but non-significant coefficient (-.163) for AGOA, the implication being that AGOA eligibility is found to have no significant impact on non-oil trade for eligible countries. The effect of AGOA on apparel exports is also not statistically different from zero, though the coefficient in this case is positive (0.075). Seyoum (2007) uses a gravity type equation with a similar specification and he finds that AGOA has had a marginally positive (0.046) but statistically non-significant impact on total SSA exports to the US up to 2004. Three studies – Frazer and Van Biesebroeck (2007), Fayissa and Tadesse (2007), and Nouve (2005) - find that AGOA has had a more positive impact. Frazer and Van Biesebroeck (2007) find that AGOA has had a small, albeit positive impact on SSA exports to the US. They employ a variation of the traditional gravity model, using a triple difference estimation regression model to assess the impact of AGOA over the period 2000-2006. The differences in differences approach takes into account surges in demand for AGOA product categories and/or price changes in these product categories to ensure that the results are reasonably tied to AGOA. They find that the absolute export increase in the period 2000-2006 which can be attributed to AGOA amounts to USD$439m – eight percent of the total increase in non-oil exports from SSA during this period. Most (80 percent or USD $348m) of this increase is explained by apparel exports. Putting this figure in context, the authors estimate that the AGOA induced increase was worth approximately 0.15 percent of the 2000 GDP of all AGOA eligible countries. Fayissa & Tadesse (2007) use a gravity model to first estimate the overall impact of AGOA on imports from SSA across 99 different product categories. They find that the AGOA co-efficient is positive and significant for 14 of the 32 product categories presented; and negative and significant for just 3 products. The authors then decompose the marginal increase in imports into what they call the trade initiation (the extent to which AGOA has resulted in exports of new products) and trade intensification (the extent to which AGOA has increased existing levels of exports from SSA) effect of AGOA up until 2006. The authors state that AGOA had a statistically significant trade initiation effect across 24 of the 99 product categories (compared to negative and significant for just 2 product categories), with the effect on apparel exports being particularly large. The overall impact of AGOA in raising the volume of US imports (the trade intensification effect) from eligible SSA countries has however been minimal. The study provides no indication as to which products from which countries have gained most from AGOA and why this is so. The authors conclude that the success of AGOA in further increasing SSA exports to the US depends on the ability of African policy makers to build on the trade initiation impact of AGOA thus far.
14 Gravity models commonly use a fixed-effects (FE) approach to avoid auto-correlation commonly associated with
pool cross sectional time series data. Because of the nature of the data in this case (exports from one region to a
single country, over a ten year time span) the authors uses a Prais Winston estimation of least squares to treat the auto correlation in the data.

26
Nouve (2005) employs a different approach to the other studies in using a dynamic panel trade model15 to assess the impact AGOA has had on aggregate exports from SSA to the US up to 2004. This analysis is premised on the assumption that the export opportunities and benefits arising from a preferential access scheme such as AGOA have positive spill-over effects and thereby raise the overall exports of a given country. To measure this effect the author includes total AGOA exports and total AGOA apparel exports as additional endogenous variables in an augmented gravity equation, with the aim of understanding the impact AGOA has on total overall SSA exports to the US (i.e. AGOA and non-AGOA exports). The overall result is that AGOA has had a strong positive effect on aggregate SSA exports to the US. The estimated coefficients vary from 0.16 to 0.20. These estimates imply that each dollar increase in AGOA exports translates into a 16 to 20 cents spillover effect on aggregate exports to the US. The author does however emphasise that this positive spill-over effect could be reversed if these additional (non-AGOA) exports are highly substitutable in the US market.
Table 4.4.3: Summary of included studies on impact of AGOA on overall exports
Study Overall quality
Data time series
Type of study/analysis
Impact of AGOA on overall exports
AGOA coefficient16
Statistical significance
Mueller (2008)
High 2000-2004
Gravity model No impact -0.163
Non-significant (p value of 0.297)
Seyoum (2007)
High
2000-2004
Gravity model No impact
0.046 Non -significant (p- value of 0.807)
Frazer and Van Biesebroeck (2007)
High
2000-2006
Triple difference in differences gravity model
Positive, albeit marginal impact
0.08 Significant (t- statistic of 7.5)
Fayissa & Tadesse (2007)
Medium
2000-2006 Gravity model Inconclusive
0.019 to 3.45717
Mixed (z- statistic of 0.11 to 3.78)
-0.491 to -0.11118
Mixed (z- statistic of 0.15 to 3.34)
Nouve (2005)
High
2000-2004 Dynamic panel
gravity model
Positive, albeit marginal impact
0.16 to 0.2019 Mixed (p-value of 0.01 to 0.12)
15 The traditional gravity model is based on static panel data, only allowing for contemporaneous effects of
regressors on trade. The dynamic trade model views trade as a dynamic process and extends the static model by including lagged exports in the gravity model. 16 Note that the coefficients in this column are calculated using different approaches and are not directly
comparable. Please refer to the text for details on the meaning or implication of each coefficient. 17 This reflects the range of 26 positive coefficients calculated across a sample of 32 of the 99 different product
categories at the HS-2 digit level product sub-classification. Of these 26 coefficients, 14 were significant. 18 This reflects the range of 6 negative coefficients calculated across a sample of 32 of the 99 different product
categories at the HS-2 digit level product sub-classification. Of these 6 coefficients, 3 were significant. 19 The author uses different techniques (i.e. one-step and two-step; robust and not robust) in order to generate
different estimates, but the value of the AGOA co-efficient remains reasonably consistent.

27
4.4.4 Impact of AGOA on agricultural exports
In addition to the general studies reviewed above, some authors adopt a sector-specific approach. Nouve and Staatz (2003) is the only study which focuses exclusively on agricultural exports under AGOA. Again, using a gravity model, they use panel data from 2002 on US agricultural trade with 46 SSA countries to test the impact of AGOA on three dependant variables: firstly, on total overall agricultural exports from 46 SSA countries; secondly on exports from the 27 countries with quarterly agricultural exports greater than USD$100k in the post AGOA period; and finally, on exports from the top eight SSA agricultural exporters. In all three cases AGOA-induced gains in agricultural exports are found to be not statistically different from zero. The authors conclude that AGOA has had no observable impact on agricultural trade because it is a relatively young initiative. However, more recent data and analysis shows that SSA agricultural exports to the US remain low and for a number of different reasons. This is discussed further in section 4.6.2. Frazer and Van Biesebroeck (2007) employing their triple differences in differences20 approach find modest but positive relationship between AGOA and SSA agricultural exports to the US. Their analysis indicates that USD$13m or 15 percent of the USD$83m increase in agricultural exports from SSA to the US in the post AGOA period 2000-2006 can be attributed to AGOA. This gain represents just 0.2 percent of total non-oil exports (USD$5.4bn) in the pre AGOA period (1998-2000) and 0.5 percent of the total non-oil export growth from SSA (USD$2.5bn) in the post AGOA period up until 2006.
Table 4.4.4: Summary of included studies on impact of AGOA on agricultural exports
Study Overall quality
Data time series
Type of study/analysis
Impact of AGOA on agricultural exports
AGOA coefficient21
Statistical significance
Frazer and Van Biesebroeck (2007)
High
2000-2006
Triple difference in differences gravity model
Positive, albeit very marginal impact
0.083 Significant (t- statistic of 4.48)
Nouve and Staatz (2003)
Medium 2002
Gravity model No observable impact
376.1 Non-significant (p-value 0.765)
4.4.5 Impact of AGOA on manufactured/apparel exports
Four of modelling studies mentioned above – Frazer and Van Biesebroeck (2007), Collier and Venables (2007), Seyoum (2007), Fayissa and Tadesse (2007) – also measure AGOA’s impact on the apparel sector and they all find that AGOA has had a strongly positive impact on apparel exports from SSA.
20 In trade analysis the difference in differences approach involves comparing differences across countries as well
as differences over time. In this case the increase in SSA exports to the US of a specific eligible AGOA product
from an AGOA eligible country is measured relative to firstly the overall increase in exports from that country, secondly to the overall increase in exports of that product and thirdly against the base level of exports of AGOA
products from other AGOA countries, thereby isolating the specific impact of AGOA. 21 Note that the coefficients in this column are calculated using different approaches and are not directly
comparable. Please refer to the text for details on the meaning or implication of each coefficient.

28
Frazer and Van Biesebroeck (2007) find that 53.1 percent of the increase in apparel exports in the post AGOA 2000-2006 period can be directly attributed to AGOA. Similarly, Fayissa and Tadesse (2007) find that AGOA has been responsible for 43 percent of the increase in apparel exports in the post AGOA period. Using a triple difference in differences model, Collier and Venables (2007) compare apparel exports under AGOA with those under the EU preferential access program, Everything But Arms (EBA). They find that AGOA has had a positive and very significant effect on apparel exports, raising apparel exports to the US by a factor of almost seven. This number is much higher than that estimated by Frazer and Van Biesebroeck (2007) - due to the fact that Collier and Venables (2007) are able to control better for the effects of AGOA by comparing its impact to that of EU preferences. Finally, in addition his aggregate work on AGOA, Seyoum (2007) also uses his model to test the impact of AGOA on three sectors – energy, minerals and apparel – and his results show AGOA-induced statistically significant gains only in the case of apparel exports. Nouve (2005) provides a different perspective on AGOA apparel exports. In his model described above he finds that AGOA apparel exports were found to have a negative effect on overall SSA exports to the US. This challenges the preceding view that the rise in apparel exports has been the main benefit of AGOA. Instead, there may have been a reallocation of resources away from other exports in order to sustain AGOA induced increases in apparel exports. The author therefore suggests that it is misleading to assert a positive impact on a given SSA country by focusing exclusively on increased apparel exports, and that it is important to evaluate the impact of the agreement on the entire economy. Gains in some sectors could potentially come at the cost of others.
Table 4.4.5: Summary of included studies on impact of AGOA on apparel exports
Study Overall quality
Data time series
Type of study/analysis
Impact of AGOA on apparel exports
AGOA coefficient22
Statistical significance
Collier and Venables (2007)
High
2000-2005
Gravity model
Positive and very significant impact
2.21 to 2.4723 Significant – (nature of statistical test not given)
Seyoum (2007)
High
2000-2004
Gravity model
Positive and very significant impact
-11.92 Significant (p-value of 0.00)
Frazer and Van Biesebroeck (2007)
High
2000-2006
Triple difference in differences gravity model
Positive and very significant impact
0.531 Significant (t- statistic of 8.03)
Fayissa & Tadesse (2007)
Medium
2000-2006
Gravity model
Positive and very significant impact
2.774 Significant (z- statistic of 3.78)
22 Note that the coefficients in this column are calculated using different approaches and are not directly
comparable. Please refer to the text for details on the meaning or implication of each coefficient. 23 The author uses different model specifications and sample sizes in order to test the impact of AGOA under
different assumptions, but the value of the AGOA co-efficient remains reasonably consistent.

29
4.4.6 Summary
The findings from the studies reviewed above are strong and consistent. All four studies (one medium quality, three high quality) reviewed in the first sub-section above show that exports from SSA to the US have increased strongly since 2000, with an increasing share of these exports utilising AGOA preferences. However the studies reviewed in the subsequent sub-section show that AGOA has had little or no direct impact on the overall increase in exports from SSA to the USA. Of the five studies (three high quality, two medium quality) which model AGOA’s impact on total exports, two find that AGOA has had no impact whilst the other three find that AGOA has had a positive albeit small impact. There is conclusive evidence that AGOA has had a direct and substantial impact on apparel exports from SSA LDCs to the U.S, though this may be at some cost to other sectors. Four of the five studies (four high quality, one medium quality) which consider AGOA’s impact on apparel find a strongly positive correlation between AGOA and increased apparel exports from SSA to the US.
4.5 Explaining observed export trends under AGOA
This section seeks to explain some of the trends and results presented above through a more detailed review of the key provisions of AGOA. In particular, it is important to understand why the gains from AGOA are so heavily concentrated in a single sector and amongst a small group of LDCs. It is important to note at the outset that supply side constraints (poor infrastructure, complex business environments, unskilled labour markets, governance issues etc), which explain much of Africa’s poor export performance over the last few decades, will not be considered in this section. Undoubtedly LDCs have very limited productive capacity to respond to preferential schemes such as AGOA and there is an extensive literature which explores these constraints – examples include Yeats et al. (1996), Bougheas et al. (1998), and Bouet et al. (2008). But these constraints apply to all exports and agreements and it would be difficult to derive AGOA specific results and implications. Instead this section will focus on the provisions of AGOA itself and its rules of origin and product coverage in particular, to try to understand how these have impacted on its overall effectiveness.
4.5.1 AGOA product coverage
A number of studies highlight the limited product coverage of AGOA. The key point emerging from these studies is that AGOA offers very little additional market access for LDCs over and above that which they enjoyed under the GSP and that tariffs remain very high on a number of products of export interest to these countries, particularly in the case of agricultural products. Three studies (all high quality) examine in detail the coverage of AGOA - Brenton and Ikezuki (2004), Van Grasstek (2003), Dean and Wainio (2006) – and describe how this has impinged on its effectiveness. Brenton and Ikezuki (2004) examine in detail the product coverage of AGOA preferences. For manufacturing they find that AGOA liberalises an additional 1,249 tariff lines (on top of the 3,116 lines in the GSP), with these additional preferences amounting to 14 percent of the total number of manufacturing lines. Over half of these preferences (557 lines) are accounted for by apparel products. LDCs already

30
benefited from a more extensive GSP system prior to AGOA, thus achieved little in the way of additional manufacturing preferences through AGOA - the agreement extended preference coverage for LDCs by just 199 products, or two per cent of total manufacturing lines. The authors highlight key manufacturing products which are excluded from AGOA, including textile products, certain glass products and headwear. Overall more than 900 manufactured product lines have been excluded from AGOA with the average duty on these excluded products being around 9 percent. Similarly, in agriculture, they find that AGOA excludes a range of high-duty products and offers very limited additional market access over and above the GSP. For LDCs, AGOA extends preferences to just 26 additional agricultural tariff lines – less than two percent of the total number of agricultural lines (1723) and just 12 percent of the remaining dutiable lines. Liberalisation is much more extensive for non-LDCs, adding an additional 541 lines on top of the GSP. Importantly the authors emphasise that AGOA agricultural preferences are only available for in-quota quantities (i.e. once the available quota is exceeded then the full MFN duty is applicable), and that AGOA does not liberalise out of quota duties on a number of agricultural products24. Of the 541 agricultural products liberalized under AGOA, 120 were still subject to tariff quotas. Moreover, out of quota tariffs are exceptionally high for many of these products – 350 percent for tobacco, 164 percent for peanuts, 132 percent for Brazil nuts and 26 percent for beef. Regardless of whether these quotas have been fully utilised or not, their existence could be an important impediment to new investment in export industries. They conclude that AGOA’s broader economic impact could be improved if preferences were extended to all products. Dean and Wainio (2006) empirically test the coverage of AGOA by examining the extent to which AGOA preferences cover products (HS-8 digit level) exported from SSA to the US in 2003. Overall they find that AGOA (combined with the GSP) covers virtually all agricultural exports from the SSA to the US. Like Brenton and Ikezuki (2004), their analysis highlights the fact that for SSA LDCs, AGOA offered no additional coverage on agricultural exports - 100 percent of their agricultural exports (in 2003) were already exempted from duties under the GSP (the only exception being Tanzania, for which just 41 percent of its agricultural exports were covered by GSP, compared to 100 percent under AGOA). Similarly most agricultural exports from non-LDCs in 2003 were already covered under the GSP. However there were significant gains for two non-LDCs, Kenya and South Africa, whose coverage increased by 87 percent and 80 percent respectively under AGOA. This analysis however does not take into account products that AGOA eligible countries produce but do not export to the US (because of high tariffs). Dean and Wainio (2006) find a similar pattern in the case of non-manufactured products. The combined coverage of the both AGOA and the GSP covers almost all US manufactured imports from non-LDCs and LDCs, though non-LDCs gained much more as a result of the increased coverage under AGOA. It is also apparent that apparel exporting LDCs have gained most from the increased product coverage under AGOA. None of Lesotho, Madagascar and Malawi’s apparel exports in 2003 were eligible for GSP, but 100 percent of these exports were eligible for AGOA preferences.
24
Products which are subject to tariff rate quotas have different tariff lines and different tariff rates for imports
within the specified quantity and for imports in excess of this amount.

31
Van Grasstek (2003) conducts a similar analysis based on US import data from 2001. He identifies the top 25 products at HS-8 digit level (85 percent of total SSA exports to US in 2001) exported from eligible SSA countries to the US in 2001 and compares the tariff treatment for each of these products pre and post AGOA. He finds that fifteen of the 25 products (twenty percent of the total value of this product group) already encountered a zero percent MFN tariff rate in the US prior to AGOA. An additional six products (76 percent of the value of these exports), were already covered by GSP preferences for LDCs. Thus for LDCs, just 3.4 percent of the total value of these top 25 export products received improved coverage under AGOA, and all of these gains are in the apparel sector.
Table 4.5.1: Summary of included studies analysing AGOA product coverage
Study Overall quality
Type of study/analysis
AGOA product coverage
Brenton and Ikezuki (2004)
High Analysis of AGOA product coverage
Limited additional coverage (above the GSP), with exception of apparel products
Dean and Wainio (2006)
High Empirical assessment of AGOA product coverage
Limited additional coverage (above the GSP). Apparel exporting LDCs gain most from additional coverage
Van Grasstek (2003)
High Empirical assessment of AGOA product coverage
All gains in additional coverage accrue to apparel exports
4.5.2 Depth of AGOA preference - Preference margins
In evaluating the benefits provided by AGOA, it is important to look beyond the coverage of the agreement and consider also the magnitude of the preferences given to LDCs. This is considered by three studies (all high quality) - Van Grasstek (2003), Brenton and Ikezuki (2004) and Dean and Wainio (2006). These studies all confirm that AGOA preference margins on apparel products are relatively high, and this explains the strong import response in this sector. On the other hand, the average preference margins on agricultural products are small and there has been little increase in agricultural exports under AGOA. Brenton & Ikezuki (2004) compare the margins of preference of the products covered by AGOA to the margins of preference on those covered only by GSP. In general, they find that AGOA extends preferences to products with higher duties than those covered by the GSP. For LDCs, the average MFN duty (i.e. preference margin) on the additional agricultural products covered by AGOA is 7.7 percent, compared to 5.2 percent for agricultural products covered by the GSP. However, those products excluded from AGOA and GSP are high duty products which could potentially confer very high preference margins if they were included in AGOA. The average duty on excluded agricultural products is 31 percent for LDCs and 30.7 percent for non-LDCs, with peak rates being extremely high for some products of particular interest to SSA producers. For manufactured products, the average duty on products covered by the GSP is 3.8 percent, whilst products covered by the basic AGOA provisions are subject to an average duty of 6.1 percent. For clothing products, the average duty on

32
products included in AGOA is more than 12 percent. Thus AGOA does reduce the number of tariff peaks facing African exporters to the U.S, particularly amongst apparel products. However the average duty on manufactured products not eligible for preferences is also high (about 10 percent). Van Grasstek (2003) focuses more narrowly on the preference margins on the ten major export products (from the top 25 products exported from SSA to the US in 2001) which have gained from AGOA. Petroleum products faced an average tariff of less than one percent prior to AGOA, thus the preference margin is very low and does not yield significant benefits. Motor vehicle products were subject to a tariff of 2.5 percent, slightly above the average US tariff rate, and still a relatively low margin of preference. The preference margins are significantly higher for the remaining four products, all in the apparel sector, with MFN tariff rates on these products ranging between 16.8 percent and 17.3 percent. These products enjoyed the additional protection of MFA quotas which limited imports of these products from Asian producers up until 2004. Similarly Dean and Wainio (2006) measure the depth of AGOA preferences by focusing on the preference margin on actual US imports from eligible SSA countries in 2003. For non-agricultural imports, average AGOA preference margins were a very significant at 14 percent. For LDCs the preference margins are dominated by apparel exports and average country margins are in cases very high: Ethiopia (18.3 percent), Cape Verde (20.4 percent), Lesotho (18.4 percent), Madagascar (15.9 percent), Malawi (19.1 percent), and Uganda (22.3 percent). Removing apparel products and margins from the calculation presents a completely different picture with just a handful of countries (including one LDC) showing a preference margin of more than 10 percent. In their analysis of agricultural imports, Dean and Wainio (2006) find that products with low MFN tariffs tend to be the products accorded preferential access through AGOA. Thus preference margins on these products are much lower. Overall they find the average margin of preference on AGOA agricultural products exported by eligible countries in 2003 to be 9.6 percent - the average tariff on agricultural products excluded from AGOA is 30 percent. Furthermore, they find just four LDCs exporting agricultural products under AGOA - Ethiopia, Malawi, Tanzania and Uganda – and these countries tend to export products facing low MFN rates. Hence preference margins for these countries are below the average at 1.3, 9.2, 6.8, and 2.3 percent respectively.
Table 4.5.2: Summary of included studies analysing AGOA preference margins
Study Overall quality
Type of study/analysis
AGOA product coverage
Brenton and Ikezuki (2004)
High Analysis of AGOA product coverage
With exception of apparel, AGOA preferences margins are low.
Dean and Wainio (2006)
High
Empirical assessment of AGOA preference margins (based on 2003 exports)
LDC preference margins dominated by apparel exports.
Van Grasstek (2003)
High
Empirical assessment of AGOA preference margins (based on 2001 exports)
Apparel only sector offering significant preference margins

33
4.5.3 Rules of origin
Overly restrictive rules of origin deny producers in developing countries the freedom to choose the source of their inputs and instead require a high level of in-country or domestic processing. Collier and Venables (2007), amongst others, emphasise that in the modern globalised world, production is highly fragmented, with the different stages involved in the production of a particular good now taking place in many different countries. This fragmentation means that comparative advantage now resides in narrowly defined tasks (with each task adding value to a product that may cross borders at each small stage in the production process). They argue that for preferences to have value, countries must be able to participate in fragmentation and production networks, and this is facilitated amongst other factors by liberal rules of origin. AGOA imposes a general rule of origin that applies to all products, with the exception of apparel - at least 35 percent of the price paid for the product upon its export to the US must be due to activities in the country of final production that is seeking preferences. Brenton and Ikezuki (2004) emphasise that the AGOA apparel rule of origin is more complex and that in essence, AGOA preferences are granted to apparel products:
assembled in one or more AGOA country from fabrics formed in the US or from regional fabrics – the standard rule25
assembled in LDCs from any fabric or yarn – the third country fabric rule26 A number of different studies consider each of these rules and they are dealt with separately below.
4.5.4 Impact of special third party rule of origin relative to the standard rule
Three studies (all high quality) – Brenton and Hoppe (2006), Collier and Venables (2007) and Mattoo et al (2003) – demonstrate the effectiveness of the third party rule by comparing it with exports under the standard rule27. Brenton and Hoppe (2006) look at AGOA apparel exports from 2000 to 2004 and find that all of the growth during this time has been from countries utilising the third country fabric rule – SSA exports of apparel to the US under the third country fabric rule increased from 158.9 million square metre equivalents (SMEs) to 343.4 million SMEs between 2001 and 2004. The volume of SSA apparel exports accessing the US market under the more restrictive regional fabric rule has actually declined over the same period, from 28.9 million SMEs to 27.4 million SMEs. Their analysis shows that more than fifty percent of Mauritius’s apparel exports to the US in 2004 did not utilize available AGOA preferences, because complying with the standard rule would have been commercially infeasible. Instead, companies in Mauritius prefer to source fabric from the most competitive global source and pay the tariff rather than comply with the AGOA rule and supply an uncompetitive product.
25 In practice South African and Mauritius (up until 2005) are the only exporters under the standard rule 26 This special rule was initially only applicable to LDCs – however AGOA II in 2002 extended the provision to
countries with higher levels of GDP (Botswana and Namibia). Mauritius was later granted access in 2004. This
special rule was originally due to expire in 2007 - however this deadline was extended until 2015 in 2006. 27 This is an interesting and informative comparison and demonstrates the differing impacts of liberal rules of
origin for LDCs and the more stringent rule of origin for non-LDCs.

34
Similarly, Collier and Venables (2007 demonstrate that clothing exports to the US from AGOA eligible LDCs were USD$1.1bn in 2008 – three times their level in 2000 – and that all of these exports took advantage of the special third party country rule of origin. By contrast, exports from South Africa and Mauritius, the two largest clothing exporters to the US pre-AGOA, had declined to a third of their 2000 level by 2008, because they had to meet the more stringent rules of origin. Mattoo et al. (2003) empirically measure the impact of the general rule of origin for apparel relative to the special third party rule for LDCs. Using a partial equilibrium model they estimate that Mauritius’s apparel exports under AGOA would have been 36 percent higher over the 2001-2004 period had they not been subject to the restrictive rule of origin during this time.
4.5.5 Comparison of AGOA and EBA rules of origin
The EU preferential access program for LDCs, EBA, provides a similar preference margin on apparel products to that of AGOA, but under a more stringent rule of origin which does not allow for the use of third country fabrics. Again three studies (all high quality) – Brenton and Hoppe (2006), Collier and Venables (2007 and Portugal Perez (2008) - demonstrate the effectiveness of the third party rule by comparing AGOA and EBA exports28. Brenton and Hoppe (2006) compare SSA AGOA apparel exports to those under EBA for the period 2000-2005, showing that exports to the EU have stagnated despite generous preferences. Exports of apparel from Sub-Saharan Africa to the EU and US were almost equal in 2000 – but by 2005, the value of exports to the US was over four times greater than the value of exports to the EU. Similarly Collier and Venables (2007) compare SSA apparel exports to the EU and US from the mid-1990s up to 2005 and demonstrate that clothing exports to the US quadrupled under the special AGOA apparel provision whilst exports to the EU stagnated over this period29. Portugal Perez (2008) uses a Tobit econometric model30 to assess the differential impacts of the apparel rules of origin for AGOA and EBA. He finds that while apparel exports from LDCs to the EU declined between 2000 and 2004, the third country rule of origin increased AGOA apparel exports from the top seven beneficiaries – Kenya, Botswana, Madagascar, Malawi, Lesotho, Namibia and Swaziland - by about 300 percent over the same time period. In addition the analysis reveals that the less restrictive rule of origin results in export diversification with an expansion of the range of exported apparel products.
4.5.6 Impact of non-apparel rules of origin
Whereas the impact of the apparel rule of origin has been researched in some detail, just one of the selected studies deals with the restrictiveness or not of the 35 percent value added rule of origin. Brenton and Hoppe (2006) observe that the 35 percent value added rule penalises firms in LDCs as these firms will typically have lower labour costs and will thus find it more difficult to satisfy a 35 percent value added rule than a firm in a more advanced country. Also, the administrative costs of compliance with a value added rule can be excessive for firms in LDCs, requiring sophisticated accounting systems. Many small and new exporters in these
28 The comparison of the stringent EBA rule of origin with that of the more liberal AGOA rule provides a powerful
illustration of the profound impact rules of origin can have on the effectiveness of a preferential trade agreement. 29 Mauritius was, however, granted access to the special rule in December 2004 30 The Tobit model is an econometric model used to describe the relationship between a non-negative (censored)
dependant variable (yi) and an independent variable, xi.

35
countries are therefore unable to comply. They point to the fact that AGOA has had virtually no impact outside of the apparel sector as evidence that African producers have struggled to meet the 35 percent value added rule.
4.5.7 Security of Access
AGOA establishes a series of eligibility criteria that countries must meet for designation to the programme, and also provides for the removal of countries that are later found to be not in compliance with the requirements31. Currently 3832 of the 48 countries in SSA are eligible for AGOA, and 27 of these countries are eligible for the apparel benefits. To be granted and maintain eligibility, countries must show that they have established or are making continual progress towards the following: market-based economies; the rule of law and political pluralism; elimination of barriers to US trade and investment; protection of intellectual property; efforts to combat corruption; policies to reduce poverty, increasing availability of health care and educational opportunities; protection of human rights and worker rights; and elimination of certain child labour practices33. AGOA requires each country’s eligibility to be reviewed on an annual basis and directs the President to deny benefits to any country who fails to satisfy these conditions. For example, in December 2009, the US President removed Guinea, Madagascar (one of the largest initial beneficiaries of AGOA) and Niger from the list of AGOA-eligible countries because of political upheaval in these countries, while Mauritania was readmitted to the scheme34. Eligibility may also be reconsidered if AGOA threatens U.S industries - for example, domestic import competing sectors in the US may lobby the government to remove preferences from countries that have utilised them effectively to increase exports to the US (Mueller, 2008). Furthermore, AGOA is a temporary arrangement whose provisions have to be renewed at regular intervals. For instance, the third country fabric provision was originally due to expire in 2007 but was subsequently renewed until 2012, whilst AGOA itself is due to expire in 2015. The unilateral nature of the AGOA agreement, its timeframe and the overt political and commercial conditionality attached to it, undoubtedly creates uncertainty around the current and future eligibility status of all AGOA beneficiaries. In some of the papers reviewed, these issues are commented upon. Mueller (2008), for example, suggests that the inclusion of both economic and political conditions raises the risk and uncertainty confronted by producers and investors in these countries. Brenton & Ikezuki (2004) emphasise that the temporary and relatively short statutory period of AGOA constrains the investment response to the agreement. Yet no substantive and empirical evidence was found in the literature on how the limited duration and conditionality attached to eligibility have impacted on the effectiveness of AGOA.
4.5.8 Summary
The three studies (all high quality) which assess product coverage under AGOA all come to the conclusion AGOA offered limited additional coverage to LDCs over and above what they previously enjoyed under the GSP.
31 The GSP does not contain the same overt political conditionality of AGOA but does specify that beneficiaries
may lose some or all benefits if they fail to protect intellectual property rights, respect labour rights and resolve investment disputes. 32 Angola; Benin; Botswana; Burkina Faso; Burundi; Cameroon; Cape Verde; Chad; Comoros; Republic of Congo;
Democratic Republic of Congo; Djibouti; Ethiopia; Gabon; The Gambia; Ghana; Guinea-Bissau; Kenya; Lesotho; Liberia; Malawi; Mali; Mauritania; Mauritius; Mozambique; Namibia; Nigeria; Rwanda; Sao Tome and Principe;
Senegal; Seychelles; Sierra Leone; South Africa; Swaziland; Tanzania; Togo; Uganda; Zambia 33 www.agoa.gov/AGOAEligibility 34 http://www.america.gov/st/democracyhr-english/2009/December/20091224121856esnamfuak0.6293299.html

36
Similarly, the three studies (all high quality) which focus on preference margins find that preference margins under AGOA are modest, especially when compared to the average tariffs on products excluded from AGOA. The exception to this is apparel products on which average preference margins under AGOA are relatively high and the rule of origin is much more liberal than those previously afforded under GSP. All three studies agree that AGOA’s broader economic impact could be improved if preferences were extended, especially to incorporate excluded agricultural products. The evidence strongly indicates that the liberal rules of origin on apparel exports from LDCs have been instrumental in explaining the surge in apparel exports to the US under AGOA. Conversely, the evidence suggests that restrictive rules of origin on apparel exports from non-LDCs and the general rules of origin on non-apparel items have impeded the potential gains from AGOA. All four studies (all high quality) which assess rules of origin support this conclusion. No clear evidence emerged from the literature on how the limited duration of AGOA as well as the conditionality inherent in the agreement have impacted on its effectiveness.
4.6 Extension of full DFQF access to US market for all LDCs
This final section explores the implications of the extension of full DFQF access to the US market to all LDCs. Such a policy change will erode some of the preferences currently enjoyed by SSA LDCs under AGOA, but will also open up products that are excluded from AGOA to duty-free access in the US market. Evidence on the value of AGOA preferences and the extent and magnitude of these impacts is considered in this section.
4.6.1 How valuable are AGOA preferences?
Two studies (all high quality) - Brenton and Hoppe (2006) and Dean and Wainio (2006) - empirically measure the actual value of AGOA preferences to beneficiary countries. These studies provide some indication of the extent of preference erosion that might occur should DFQF access be extended to other LDCs, and which countries would likely be most affected. Brenton and Hoppe (2006) estimate the value of AGOA preferences on a country by country basis for the 37 AGOA eligible countries in 2005 based on their non-oil exports in that year. The value of preferences is calculated as the sum across exported products (for each country) receiving and using preferences under AGOA multiplied by the preference margin (i.e. the normal MFN rate) for that product. They express this preference value as a share of the total value of exports to the US for each country. Their results show that for the majority of AGOA beneficiaries the total value of preferences is negligible - for 26 of the 37 beneficiaries included in their analysis, the value of AGOA preferences is less than two percent of the value of their exports to the US in 2005. For the remaining 11 countries the value of the preferences are much higher – Swaziland (19 percent), Cape Verde (18.7 percent), Lesotho (18 percent), Madagascar (15.1 percent), Kenya (14.2 percent), Malawi (13.9 percent), Mauritius (12.4 percent) Mozambique (10.5 percent), Namibia (7.2 percent), Botswana (3.7 percent) and Uganda (3.5 percent) - and are largely determined by the share of apparel in their export basket, with the exception being Malawi, where apparel accounts for 30 percent of the value of

37
preferences, with the balance coming from tobacco exports. South Africa is the only other country where non-apparel exports account for a significant portion of the value of its preferences – but for South Africa, the overall value of the preferences are just 0.9 percent of its total exports to the US, of which 0.2 percent is accounted for by apparel exports. Dean and Wainio (2006) use a similar methodology to calculate the value of AGOA preferences. They use data from 2003 and find that the value of AGOA preferences represents a small share of the overall value of exports to the US. Where the value of preferences is high it is typically and almost entirely due to apparel. The authors identify nine countries in which the value of preferences exceeds three percent of the value of total exports to the US - Lesotho (17.9 percent), Swaziland (15.8 percent), Cape Verde (14.6 percent), Kenya (13.4 percent), Malawi (10.9 percent), Madagascar (8.2 percent), Mauritius (8 percent), Mozambique (7.7 percent) and Namibia (4.8 percent).
Table 4.6.1: Summary of included studies analysing value of AGOA preferences
Study Overall quality
Type of study/analysis AGOA product coverage
Brenton and Hoppe (2006)
High Empirical assessment of value of AGOA preferences (based on 2005 exports)
Value of AGOA preferences minimal, except for apparel exporters
Dean and Wainio (2006)
High Empirical assessment of value of AGOA preferences (based on 2003 exports)
Where the value of preferences is high it is typically and almost entirely due to apparel
4.6.2 Distribution of preferential tariff rents
Whereas it is possible that some AGOA beneficiaries may lose the full value of the preference, as presented above, there are a number of factors which may serve to overstate the value of the preference to the exporting country (and may therefore reduce the actual cost of preference erosion). This is because it is unlikely that the exporters receive the full value or rent provided by the preference, but instead this rent is shared between exporters, middlemen and/or the US importer. Olareeaga and Ozden (2004) decompose the increase in prices (what they call the tariff preference rent) on apparel exports to the US under AGOA and measure the proportion of this price increase that actually goes to the beneficiary country. Their analysis is based on the exports of the seven leading AGOA apparel exporters – South Africa, Mauritius, Kenya, Malawi, Swaziland, Madagascar and Lesotho - to the US in 2002. In theory, competition among competing firms should force the prices received by exporting firms to climb by the amount of the normal MFN tariff on the product receiving the preference. However their results show that the average export price increase for apparel products benefitting from AGOA preferences is around 6 percent, whereas the average MFN tariff on these products is 20 percent – i.e. exporters receive less than one third of the tariff preference rent. In addition their results indicate considerable variation in the share of the preference rent that accrues to exporters across countries, with poorer and smaller ones (LDCs) capturing a lower portion. For example, Malawi receives just less than one seventh of the potential preference rent available and Lesotho just under a quarter. The authors find that the primary reason for this phenomenon is the high

38
level of concentration and market power amongst importers in the US, which enables them to negotiate prices and capture most of the preference rents for themselves. The extent of the preference rent that is retained by the beneficiary country will depend on the negotiating skills and experience of the exporter from SSA and the extent to which they rely on the US market. Thus Mauritius and South Africa, which export to a diversified number of countries and have strong trade experience, are found to capture over fifty percent of the preference rent.
4.6.3 Local economic impact of AGOA apparel sectors
Preference erosion can often lead to broader economic losses outside the export sector concerned. In the case of AGOA, the actual scale of such economic losses may be less than expected, largely because exporters are not fully integrated into the local economies of many AGOA-qualifying countries. Three country case studies (all high quality) – Phelps et al. (2008), Rolfe and Woodward (2005) and Lall (2003) - provide evidence of the limited impact that AGOA has had on local economic development, especially in the apparel sector35. Phelps et al. (2008) examine the AGOA-orientated apparel sector in Kenya through a survey and interviews with 23 (of an estimated 35) of its apparel manufacturers. They find very limited evidence of wider local economic benefits. Although considerable direct employment has been created in the sector, this is mostly of an unskilled nature. The industry in Kenya is primarily foreign-owned, with the majority of the new post-AGOA investment in the sector coming from Asian multinational enterprises, mainly from Hong Kong, Singapore and Taiwan. Most of the skilled white collar workers in the sector were expatriates. Moreover, a negligible amount of textiles are sourced locally – again textiles and fabrics are imported from affiliates in their home countries. Rolfe and Woodward (2005) come to a similar conclusion in their analysis of the Kenyan apparel sector. Using data from the local Export Processing Zone (EPZ) authority in Kenya (data on imports, local components and local salaries) they empirically measure the local value added being generated by this industry. They too find weak linkages with the local economy – the value of local Kenyan components in apparel exports is just three percent of sales value and none of these companies use local textiles and fabrics. In addition, there is little evidence of skills transfer and upgrading in the sector, with most production requiring marginal skills and minimal value added. The story is little different in Lesotho, the largest beneficiary of AGOA apparel preferences. Lall (2003) finds that the sector is almost entirely owned by East Asian firms, primarily Taiwanese. The majority of these firms had been in place prior to AGOA36 and this strong base enabled Lesotho to move quickly to take advantage of AGOA apparel preferences. While the sector has created large scale employment, linkages with the local economy and skills transfer is minimal. The author notes that apparel firms make little effort to impart more advanced skills, with training limited to basic production requirements. Most supervisory, technical and managerial jobs remain with expatriates, even within firms that have been in Lesotho for a decade or more. The author also finds little evidence of backward linkages with the local economy, with almost no local firms competing with, supplying, or subcontracting with the foreign firms.
35
Note that these three case studies were selected not to establish a link between AGOA and levels of trade but
rather to explain the wider economic impact of AGOA in recipient countries. 36 Taiwanese apparel firms based in South Africa started moving to Lesotho in the early to mid-1980s as apartheid related sanctions imposed on South Africa constrained their operations there.

39
4.6.4 End of MFA quotas
It is also important to recognise that many of the initial benefits from AGOA have already been eroded significantly since the end of 2004 when MFA quotas were lifted on Asian producers. The MFA quotas coupled with the special AGOA rule of origin created strong incentives to specialise in the production of low value, fabric-intensive clothing products - i.e. precisely the kind of products which were subject to MFN quotas (Rolfe and Woodward, 2005). As we have seen, several SSA LDCs - notably Lesotho, Madagascar, and Malawi - took advantage of these market signals, resulting in a surge in US imports from these countries up until 2005 when exports started to decline. When MFA quotas were lifted Asian producers - in particular China - moved into the markets in which AGOA countries had specialised (Edwards and Lawrence, 2010). Since 2005 there has subsequently been a severe reduction in apparel exports from AGOA eligible countries:
In 2003 the Kenyan export orientated apparel sector had 40 operations and employed an estimated 37,000 people; by late 2005 this had fallen to 22 operations employing 25,000 people (Phelps et al., 2008)
Malawi’s AGOA apparel exports dropped from a high of $27.3m in 2004 to $6.7m by 2006 (Chatima, 2007)
Lesotho’s apparel exports to the US were valued at almost $500m in 2005; by 2008 this value had dropped to $338m (Edwards and Lawrence, 2010).
For these apparel-exporting SSA countries, the combination of a productivity disadvantage (compared to Asian producers) and virtually no domestic textile industry make the industries in these countries almost completely dependent on AGOA preferences. This places them in an extremely vulnerable position if preferences are further eroded. For example, Lesotho’s success in exporting to the US market has not resulted in increased exports to the EU or South Africa. Equally, competitiveness in garments has not translated into competitiveness in other labour intensive manufactured products (Edwards and Lawrence, 2010).
4.6.5 100 percent DFQF access – evidence from modelling studies
Although no studies were found that directly consider the effects of full DFQF liberalisation in the US on SSA exports under AGOA, two studies (high quality) were identified that model the impact of DFQF access across a wider number of markets for all LDCs. They both find that LDCs in SSA can expect to gain from such a scenario, with minimal losses for major apparel exporters from Lesotho and Madagascar. Bouet et al. (2010) use the MIRAGE CGE model to assess the impact of 100 percent DFQF access for all LDCs to major OECD markets, including the US. The explanatory power of the model is constrained by a lack of disaggregated data on African LDCs – the model contains disaggregated data on just four African LDCs (Malawi, Madagascar, Mozambique and Ethiopia) and the other LDCs are grouped in the category Rest of Africa in the model. Nevertheless the model does provide some interesting insights. The results show that Asian LDCs, particularly apparel exporters such as Bangladesh that currently receive only GSP access in the US market, would gain most from DFQF access into the US market. This study does not suggest that SSA LDCs will systematically lose out, with the model showing modest reductions in African apparel exports to the U.S, generally in a range of one to one-and-a-half percent of current exports.

40
On the other hand, African LDCs would likely achieve some gains from 100 percent DFQF access as a result of the elimination of tariffs on important agricultural commodities. For example, the model shows increased exports of over 12 percent for Malawi due to the elimination of US tariffs on tobacco. For the other three African LDCs covered in detail in the model, the results show modest gains for Ethiopia (1.35 percent increase in exports) and Mozambique (0.39 percent). Madagascar is the only LDC which ends up losing in this scenario, with estimated losses of 0.03 percent of total exports. Interestingly the authors emphasise that the export losses in Madagascar come from a minor contraction in agriculture and not apparel. The study also shows that there is minimal impact on the US under the scenario of full DFQF access for all LDCs. The agricultural sector is currently treated as sensitive in the US market and tariff rate quotas are in place to control the supply and prices of many agricultural commodities. The study finds no evidence that full market access for LDCs would affect US agricultural production and destabilise price support programs. The main reasons for this being that LDCs lack capacity to significantly expand supply of these products, and that producers in LDCs have difficulties meeting the US food safety standards. Apparel is another sensitive sector for the US and the CGE model employed in the study does show large increases in exports from Bangladesh and Cambodia. Once again, the impact of these increased exports on US production is found to be minimal for two reasons. Firstly, the increased imports from these LDCs are offset by decreases in exports from other exporters. Secondly, the apparel exports from these countries are generally low value products and do not compete with more advanced US producers. Laborde (2008) also models the scenario of full and DFQF access for LDCs to developed markets, but uses partial equilibrium model. This model is less conservative than the CGE model and is based on strong assumptions, in that LDCs are assumed to have no supply constraints and can react perfectly to the increased demand for their products when tariffs are removed. The model shows losses for Lesotho and Madagascar of around one percent of the value of their current apparel exports as they suffer from increased competition from Bangladesh and Cambodia, who in turn increase their exports to the US by USD$865m and USD$609m. Malawi, Tanzania and Sierra Leone are the African LDCs which gain most under this scenario, with exports projected to increase by USD$279m, USD$41.7m and USD$21.4m respectively.
4.6.6 Summary
The two studies (both high quality) above which empirically measure the value of AGOA preferences find that for most SSA LDCs the value of AGOA preferences are negligible, but importantly for exporters of apparel, they can be considerable. One study (high quality) finds that the largest proportion of the benefit or rent on preferences provided in the US market accrues to buyers in this market, with a very small share going to African exporters. For LDCs, which have little market power in the US market, this greatly diminishes the economic value of AGOA. Three studies (all high quality) found that AGOA has had a limited impact on local economic development and, in the apparel sector, domestic linkages and opportunities for skills transfer are weak.

41
Both modelling studies considered above find that SSA apparel-exporting LDCs will be adversely impacted by the extension of DFQF access to the US market, though their results indicate that the scale of these losses will be reasonably modest. In addition both studies find that Sub-Saharan African countries might achieve net gains under full DFQF access to the US market as this will remove duties on products not covered by AGOA preferences, most importantly on agricultural commodities.

42
5 Implications
This section assesses some of the strengths and limitations of the review and outlines key policy recommendations.
5.1 Strengths and limitations of the systematic review
The rigour of studies covered in the synthesis was high and provided a strong evidence base from which we were able to draw reasonably definitive insights and conclusions. In addition, virtually all of the studies included in the synthesis use the same data source – United States International Trade Commission (USITC) trade data - adding consistency and credibility to the results and minimising any ambiguities around data quality and sources. A couple of points are worth noting on some potential weaknesses in the research. There has been relatively little recent research on export trends under AGOA – the majority of the analysis in the synthesis is based on export data before 2005. Although it is unlikely that the structure of exports has changed significantly in the meantime, this remains a gap in the research. Moreover, with the MFA terminating in 2005, the specific and ongoing impacts of this change would be worth investigation. Confidence intervals were not calculated for the gravity model results presented in section 4.4. The primary reason for this was that the confidence intervals were not reported in some the original studies and the data required to calculate them was not consistently reported across all the studies included. This systematic review synthesises research which the reviewers were able to collect within a reasonably short time-frame and we are confident that we haven’t missed or omitted any significant research on the topic. Finally, this project has been a steep learning curve for the lead researchers, for whom this was the first systematic review they had undertaken. The South African Cochrane Centre, the EPPI-Centre and DFID were very helpful in this regard and provided invaluable advice and guidance throughout the process.
5.2 Conclusions and Recommendations
The findings of the review provide an in-depth insight into the strengths, weaknesses and overall effectiveness of AGOA. The main implications of these findings for policy and research are described below.
5.2.1 Key conclusions
This systematic review aimed to assess the impact AGOA has had on exports from SSA LDCs as well as the likely impact of the extension of full DFQF access to the US market for all LDCs. The review provides for consistent and reasonably definitive answers in both cases. Firstly, although AGOA has clearly played an important role in boosting apparel exports from a relatively small group of SSA LDCs to the US market, its broader economic impact has been much more modest. In the apparel sector, linkages with the local economy are weak and there has been little transfer of capital or skills. Moreover, most of the rent from apparel preferences goes to importers in the US.

43
Looking beyond the apparel sector, the preference margins are low and AGOA has consequently had little or no impact on exports. Secondly, the evidence strongly indicates that the liberal rules of origin on apparel exports from LDCs have been instrumental in explaining the surge in apparel exports to the US under AGOA. Conversely, the evidence suggests that restrictive rules of origin on apparel exports from non-LDCs and the general rules of origin on non-apparel items have impeded the potential gains from AGOA. Finally, the evidence suggests that SSA apparel-exporting LDCs will be adversely impacted by the extension of DFQF access to the US market, though the scale of these losses will be reasonably small. On the other hand, many SSA countries might achieve net gains under full DFQF access to the US market as this will involve the removal of duties on products not covered by AGOA preferences, such as agricultural commodities.
5.2.2 Policy Recommendations
The body of evidence reviewed suggests that AGOA’s impact could be enhanced by addressing a number of issues. Tariffs on products excluded from AGOA, especially on agricultural goods, remain relatively high and AGOA’s broader economic impact could be improved if preferences were extended to all products. Equally, products which are currently subject to tariff rate quotas should be fully liberalised. The available evidence shows that this would likely benefit some commodity-exporting countries, such as Malawi. The above measure needs to be coupled with non-restrictive rules of origin. The surge in apparel exports under AGOA clearly illustrates the powerful effect of liberal rules of origin. The 35 percent value added rule on non-apparel goods is in all likelihood too demanding for firms in most LDCs. Brenton and Hoppe (2006) instead recommend that a 10 percent value-added requirement would be more appropriate and would give AGOA exporters the flexibility they need to source inputs globally and exploit their comparative advantage in labour intensive products. Consideration also needs to be given to enhancing the certainty of the current arrangement by fixing AGOA preferences for a longer period of time. Although no empirical evidence is given, it is likely that the short duration of AGOA constrains major investment and supply responses in recipient countries. Finally, evidence found on the weak linkages between the apparel sector in AGOA beneficiary countries, and the local economy, is cause for concern. So too is the likelihood that a large proportion of the benefits of price margins accrue to foreign buyers and investors. Governments and donors in these countries need to find ways to deepen and extend these benefits by enhancing local participation and skills in export industries.
5.2.3 Research Recommendations
Most of the trade analysis in the review, particularly in the first section of the synthesis, is based on data which is over five years old. Although it is unlikely that there have been major shifts in export patterns over the last few years, more up to date research and analysis is clearly required in order to confirm early work done

44
on AGOA and interrogate the impact of reduced preferences, particularly in the apparel sector. Two of the more interesting observations emerging from the existing work, are the importance of rules of origin and market power in determining the scale and allocation of preference rents. On rules of origin, further research would seem worthwhile in order to determine whether a value added requirement closer to 10 percent would be more appropriate, particularly for LDCs. With regards to market power, it would be instructive to find out if there is more recent evidence of learning by exporters in African countries in order to establish what can be done to increase their share of the preference rent over time. The increased time period since the implementation of AGOA should also provide opportunities for more rigorous data and modelling work. Although there is a general consensus in the result, many of the studies reviewed remain statistically inconclusive. Further work in this area should look to improve on existing models but should also make use of the extensive amount of trade data available for descriptive work. Finally, it was surprising that so few analytical case studies were identified in the review. As the impact of AGOA preferences and their erosion becomes clearer, it would be useful to document the experience of particular countries and even companies.

45
6 References
6.1 Studies included in review
Bouet A, Debucquet DL, Dienesch E and Elliot K (2010) The costs and benefits of duty-free, quota-free market access for poor countries: who and what matters. Centre for Global Development, CGD Working Paper 206, March 2010. Brenton P and Hoppe M (2006) The African Growth and Opportunity Act, exports, and development in Sub-Saharan Africa. World Bank Policy Research Working Paper 3996, August 2006. Brenton P and Ikezuki T (2004) The initial and potential impact of preferential access to the US market under the African Growth and Opportunity Act. World Bank Policy Research Working Paper 3262, April 2004. Collier P and Venables A (2007) Rethinking trade preferences: how Africa can diversify its exports. Centre for Economic Policy Research Discussion Paper 6262, May 2007. Dean J and Wainio J (2006) Quantifying the value of US Tariff preferences for developing countries. Paper presented at the Preference Erosion: Impacts and Policy Responses International Symposium, World Trade Organisation, Geneva, June 2005. Fayissa B and Tadesse B (2007) Assessing the impact of development cooperation: the case of the African Growth and Opportunity Act (AGOA) and U.S imports from Sub-Saharan Africa. Department of Economics and Finance Working Paper Series, December 2007. Frazer G and Van Biesebroeck (2007) Trade growth under the African Growth and Opportunity Act. NBER Working Paper Series, National Bureau of Economic Research, July 2007. Laborde D (2008) Looking for meaningful duty free quota free market access initiative in the Doha Development Agenda. International Centre for Trade and Sustainable Development, Issue Paper no.4, December 2008. Lall S (2003) FDI, AGOA and Manufactured Exports from a Land-Locked, Least Developed African Economy: Lesotho. Oxford: QEH Working Paper Series, Working Paper 109, University of Oxford. Mattoo A, Roy D, and Subramanian A (2003) The Africa Growth and Opportunity Act and its rules of origin: generosity undermined? The World Economy, 26(6): 829-51. Mueller T (2008) The effect of the African Growth and Opportunity Act (AGOA) on trade. Paper prepared for the 2008 Annual Meeting of the International Studies Association, San Francisco, March 2008. Nouve K (2005) Estimating the effects of AGOA on African exports using a dynamic panel analysis. World Bank Policy Research Working Paper Series, July 2005. Nouve K and Staatz J (2003) Has AGOA increased agricultural exports from Sub-Saharan Africa to the United States? Paper presented at the International

46
Conference on Agricultural Policy Reform and the WTO - Where Are We Heading? June 23-26, Capri, Italy. Office of the US Trade Representative (2008) Comprehensive report on the US Trade and Investment Policy toward Sub-Saharan Africa and the implementation of the African Growth and Opportunity Act. Washington, US: Office of U.S Trade Representative. Olareeaga M and Ozden C (2004) AGOA and Apparel: who captures the tariff rent in the presence of preferential market access? The World Economy 28(1): 63-77. Portugal Perez A (2008) The cost of rules of origin in apparel: African preferential exports to the United States and the European Union. United Nations Conference on Trade and Development, Policy Issues in International Trade and Commodities Study Series No.39, Geneva. Phelps NA, Stillwell JCH and Wanjiru R (2008) Broken chain? Foreign direct investment in the Kenyan clothing industry. World Development 37(2): 314-325. Rolfe RJ, Woodward DP (2005) African apparel exports, AGOA, and the trade preference illusion. Global Economy Journal 5(3): Article 6. Seyoum B (2007) Export performance of developing countries under the African Growth and Opportunity Act: experience from US trade with Sub-Saharan Africa. Journal of Economic Studies 34(6): 515-533. Shapouri S , Trueblood M (2003) The African Growth and Opportunity Act (AGOA): does it really present opportunities? Paper presented at the International Conference on Agricultural Policy Reform and the WTO - Where Are We Heading? June 23-26, Capri, Italy. Van Grasstek (2003) The African Growth and Opportunity Act: a preliminary assessment. New York, US: UNCTAD.
6.2 Studies excluded at final screening
Anderson K, Martin W, Van der Mensbrugghe D (2005) Would multilateral trade reform benefit Sub-Saharan Africa? Journal of African Economies 15(4): 626-670. Bede U (2007) Preferential trade agreements as a path to economic development: the case of Nigeria’s response to African Growth and Opportunity Act (AGOA). Unpublished doctoral thesis: Miami University, Florida, US. Bchir MH (2006) The Doha Development Round and Africa: partial and general equilibrium analyses of tariff preference erosion. Paper presented at the 2006 Annual Meeting of the International Association of Agricultural Economists. August 2006, Queensland, Australia. Chatima C (2007) Analysis of Malawi’s trade performance under the African Growth and Opportunity Act. Integrated Framework Policy Analysis Working Paper Series No.3, April 2007.

47
Cline WR (2003) Trading up: strengthening AGOA’s development potential. Centre for Global Development (CGD) Brief 2(3), June 2003. DFID (2002) Lesotho Garment Sector Study. A technical report for the Government of Lesotho. London: DFID. Flatter F (2002) Rules of Origin and AGOA: hard choices for textiles and clothing in SADC. USAID report for the SADC Secretariat, June 2002. Gibbon P (2003) The African Growth and Opportunity Act and the global commodity chain for clothing. World Development 31(11): 1809-1827. Ianchovivhina E, Mattoo A and Olareeaga M (2003) Unrestricted market access for Sub-Saharan Africa – how much is it worth and who pays? World Bank Policy Research Working Paper Series, April 2003. Inama S (2002) Trade preferences for LDCs: A qualitative analysis of their utilization and suggestions to improve it. New York, US: UNCTAD. Jauch H and Mwilima N (2007) An assessment of the African Growth and Opportunity Act (AGOA) and its implications for Namibia. Windhoek, Namibia: Labour Resource and Research Institute. Jones V (2009) US trade and investment relationship with Sub-Saharan Africa: the African Growth and Opportunity Act. Washington, US: CRS Report for Congress. Lederman D and Ozden C (2004) US trade preferences: all are not created equal. Working Paper Central Bank of Chile No.280, December 2004. McCormick, R (2006) The African Growth and Opportunity Act: the perils of pursuing African development through US Trade Law. Texas International Law Journal 41(1): 339-384. Noble, Keith (2006) The complete guide to understanding the US Sub-Saharan Africa trade relationship: analysis and opinions on the Ghanaian implementation of AGOA. Unpublished doctoral thesis: Miami University, Florida, US. Obuah E (2007) North-South cooperation: an assessment of US multilateral trade arrangement with Sub-Saharan Africa under AGOA. Journal of Sustainable Development 9(3): 64-85. Perez R (2008) Preference erosion and market access liberalization: the African dilemma in multilateral negotiations on agriculture. Review of World Economics 145(2): 277-292. Reynolds R (2007) The biggest losers (and winners) from US trade liberalisation. Washington: American University Department of Economics Working Paper Series, July 2007. Stevens C Kennan K (2004) Comparative study of G8 preferential access schemes for Africa. IDS DFID commissioned report, April 2004. Thompson C (2004) US trade with Africa: African growth and opportunity? Review of African Political Economy 31(101): 457-454.

48
Yongzheng Y (2005) Africa in the Doha Round: dealing with preference erosion and beyond. IMF Discussion Paper, December 2005.
6.3 Other references used in the text of the technical report
Bora B, Cernat L, Turrini A (2002) Duty and quota free access for LDCs: further evidence from CGE modelling. Policy Issues in International Trade and Commodities study series no.14. Geneva: UNCTAD.
Bougheas S, Demetriades P, Morgenroth E (1998) Infrastructure, transport costs and trade. Journal of International Economics 47: 169-189. Bouet A, Mishra S and Roy D (2008) Does Africa trade less than it should and why? The role of market access and domestic factors. IFPRI, IFPRI Discussion Paper 903, December 2008. Campbell R, Pound P, Pope C, Britten N, Pill R, Morgand M, Donovan J (2003) Evaluating meta-ethnography: a synthesis of qualitative research on lay experiences of diabetes and diabetics care. Social Science and Medicine 56: 671-684. Chatima CZ (2007) An analysis of Malawi’s trade performance under the African Growth and Opportunity Act. Malawi Ministry of Industry Trade and Private Sector Development, Integrated Framework Policy Analysis Working Paper Series 3, April 2007. Edwards L and Lawrence R (2010) AGOA rules: the intended and unintended development consequences of Special Fabric Provisions. Draft Paper prepared for the meeting of NBER, Accra, Ghana, July 2010. Hoekman B, Martin JM, Primo Braga CA (2006) Preference erosion: the terms of the debate. Washington: World Bank. Naumann E (2009) AGOA at nine: some reflections on the Act’s impact on Africa-US trade. www.agoa.info/download.php?file=94 (accessed 26 June 2010). Yeats AJ, Amjadi A, Reincke U, and Ng F (1996) Did external barriers cause the marginalization of Sub-Saharan Africa in world trade? World Bank Policy Research Working Paper no. 1586. World Bank, Washington.

49
Appendix 1.1: Authorship of this report
Authors
This systematic review was prepared by Niall Condon and Matthew Stern of DNA Economics
Review Team Membership
Niall Condon, Matthew Stern.
Acknowledgement of conflict of interest
There are no conflicts of interest for any of the members of the review team

50
Appendix 2.1: Inclusion and exclusion criteria
The following are the criteria which were used to select studies:
- Studies had to present primary research and analysis; and - Studies had to have a robust methodology. Methodologies considered for
inclusion are modelling analysis (gravity models, partial equilibrium, CGE), raw trade data analysis and ex post country specific case studies; and
- Studies had to focus specifically on AGOA, either exclusively or as a substantial chapter or component of a wider analysis of preferential trade agreements; and
- Studies had to include sufficient trade and/or economic analysis i.e. the results from these studies had to be underpinned by a clear economic theory or framework and primary empirical analysis; and
- Studies had to be medium or high quality as measured by our quality appraisal tool

51
Appendix 2.2: Note on modelling methodologies
The studies included in the first section of the review use a number of different modelling techniques to analyse and understand the impact of AGOA. All of these modelling approaches are well established, accepted and robust techniques for analysing international trade flows and in the case of this review each provides useful insights into the impact of AGOA. As with any economic model though, they are underpinned by an array of assumptions which can often be difficult to reconcile with real life situations.
Gravity model
The gravity model is a widely accepted methodology used to analyse trade patterns. The model specifies bilateral trade flows between countries as a function of their respective incomes and geographical distance. The most basic gravity model for trade between two countries (i and j) takes the form of:
Where F is trade flow between the countries, M is the economic mass of each country (generally expressed as GDP in most applications of the model) and D is the geographical distance between the countries (a proxy for transportation costs) and G is a constant. The theoretical model posits that larger economic mass (i.e. GDP) in the importing countries implies greater potential for imports while higher GDP in the exporting country imply increased capacity for exports. Increases in geographical distance on the other hand reduce the potential for trade.
This basic specification of the gravity model can be augmented to control for additional factors that influence trade flows. In applying the gravity model to AGOA additional trade inhibiting and trade facilitation variables such as the stock of immigrant population from beneficiary SSA countries, or whether English is the official language in the recipient SSA country, an index of economic openness was used in gravity model studies included in the final synthesis.
Dynamic Panel Gravity model
The traditional gravity model is based on static panel data, only allowing for contemporaneous effects of regressors on trade. The dynamic trade model views trade as a dynamic process and extends the static model by including lagged exports in the gravity model. The key insight in this approach is that historical trade patterns are a key indicator of current trade flows and thus a dynamic gravity equation is preferred to a static equation.
Difference in Differences Gravity model
In trade analysis the difference in differences approach involves comparing difference across countries in their differences over time. This approach is suitable in the analysis of AGOA as preferences under the scheme are applied selectively to both countries and products, allowing for a difference in differences estimation of the impact of the policy. In this case the increase in SSA exports to the US of a specific eligible AGOA product from an AGOA eligible country is measured relative to firstly the overall increase in exports from that country, secondly to the overall increase in exports of that product and thirdly the base level of exports of AGOA products from AGOA countries, thereby isolating the impact of AGOA.
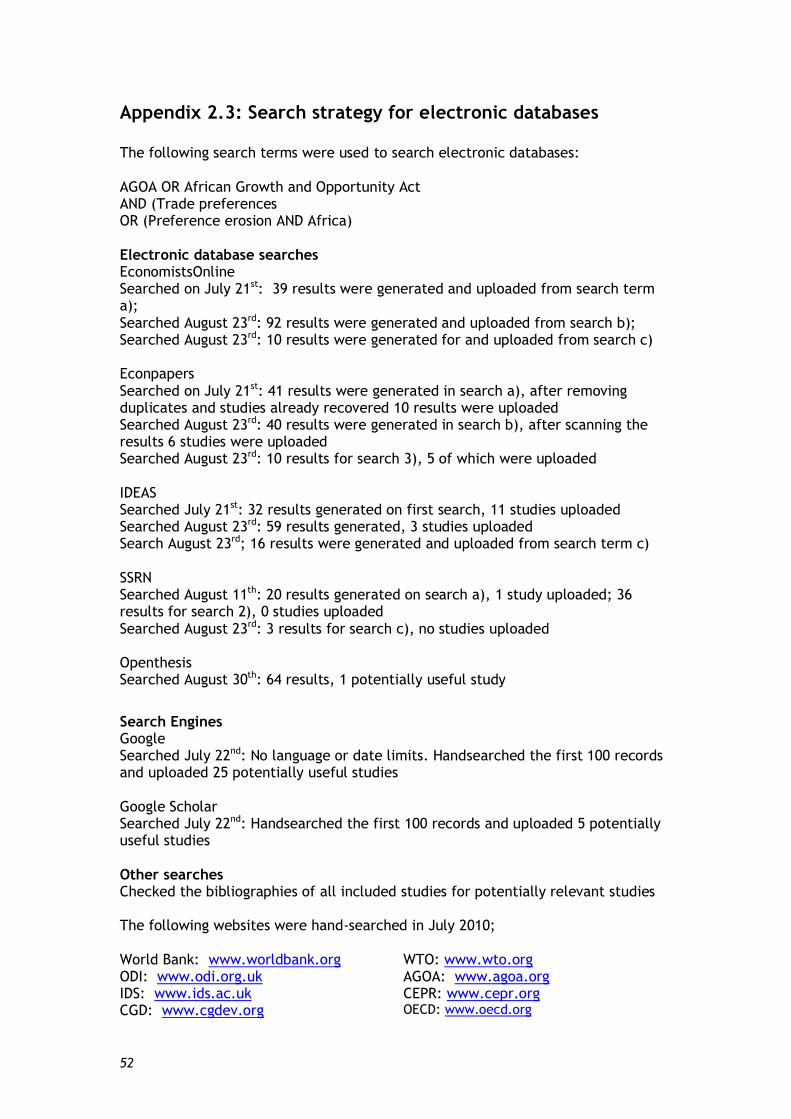
52
Appendix 2.3: Search strategy for electronic databases
The following search terms were used to search electronic databases: AGOA OR African Growth and Opportunity Act AND (Trade preferences OR (Preference erosion AND Africa) Electronic database searches EconomistsOnline Searched on July 21st: 39 results were generated and uploaded from search term a); Searched August 23rd: 92 results were generated and uploaded from search b); Searched August 23rd: 10 results were generated for and uploaded from search c) Econpapers Searched on July 21st: 41 results were generated in search a), after removing duplicates and studies already recovered 10 results were uploaded Searched August 23rd: 40 results were generated in search b), after scanning the results 6 studies were uploaded Searched August 23rd: 10 results for search 3), 5 of which were uploaded IDEAS Searched July 21st: 32 results generated on first search, 11 studies uploaded Searched August 23rd: 59 results generated, 3 studies uploaded Search August 23rd; 16 results were generated and uploaded from search term c) SSRN Searched August 11th: 20 results generated on search a), 1 study uploaded; 36 results for search 2), 0 studies uploaded Searched August 23rd: 3 results for search c), no studies uploaded Openthesis Searched August 30th: 64 results, 1 potentially useful study
Search Engines Google Searched July 22nd: No language or date limits. Handsearched the first 100 records and uploaded 25 potentially useful studies Google Scholar Searched July 22nd: Handsearched the first 100 records and uploaded 5 potentially useful studies Other searches Checked the bibliographies of all included studies for potentially relevant studies The following websites were hand-searched in July 2010; World Bank: www.worldbank.org ODI: www.odi.org.uk IDS: www.ids.ac.uk CGD: www.cgdev.org
WTO: www.wto.org AGOA: www.agoa.org CEPR: www.cepr.org OECD: www.oecd.org

53
Appendix 2.4: Journals handsearched (post 2000)
The following journals were handsearched:
Journal of Economics Studies
Global Economy
The World Economy
Journal of World Trade
Journal of International Trade and Economic Development
World Development
Review of Development Economics
Review of African Political Economy

54
Appendix 2.5: Coding/Keywording tool
The following sets of keywords were used in the review:
General Keywords Source of report - Citation - Contact - Handsearch - Database - Specialist website - Other
Report status - Published - Unpublished Year of publication - Please specify
Institution responsible for the report - Please specify Review Specific Keywords Topic focus of the study
- Measuring extent of impact of AGOA on export - AGOA rules of origin - Analysis of AGOA provisions - Apparel sector - AGOA rents analysis - Preference erosion
Geographical focus of the study
- Multi-country/regional study - Country focused (specify country)
Methodology
- Country case study - Econometric model/analysis - Raw trade data analysis
Data collected
- Trade quantities and values - Export price data - Production data
Data source
- Please specify Data time series
- Please specify
Review specific findings - Findings relevant to section one (Thematic area one) of synthesis
o Please specify details

55
- Findings relevant to section two (Thematic area two) of synthesis o Please specify details
- Findings relevant to section three (Thematic area two) of synthesis o Please specify details

56
Appendix 2.6: Critical Appraisal Tool
The tool consists of 9 sections as below, each with one or more question and ends with an overall assessment of quality. Studies will be given a rating of high (++), medium (+) or low (-). Studies were given a high rating if they responded positively to 8 of the 9 sections medium for 5 to 7, and poor if less than 5.
1) Aims – Is there a clear statement of the aims of the research? Yes/No/Unclear
2) Methodology – Is the methodology appropriate? Yes/No/Unclear 3) Theoretical perspective – Is a theoretical perspective identified?
Yes/No/Unclear 4) Data collection – Was the data collected in a way that addressed the
research issue? Yes/No/Unclear 5) Data analysis – Was the data analysis sufficiently rigorous?37 Yes/No/Unclear 6) Research partnership relations – Is it clear whether the researchers critically
identified their own role, potential bias an influence? Yes/No/Unclear 7) Findings – Were the findings explicit and easy to understand?
Yes/No/Unclear 8) Justification of data interpretation – Are you confident that all the data was
taken into account? Yes/No/Unclear 9) Relevance and usefulness – Do the findings of the study contribute to the
synthesis? Yes/No/Unclear Overall assessment of the study
37 Meaning that the analysis of the data was completely explicit, logical, thorough and clear

57
Appendix 3.1: Details of studies included in the review
Bouet et al. (2010) The Costs and Benefits of Duty-Free, Quota-Free Market Access for Poor Countries: Who and What Matters?
Overall quality: High: 9/9
Objective of study: This study assesses four broad questions around improved market access for poor countries: - How much would LDCs gain from 100 percent versus 97 percent DFQF market access in OECD markets? - How would the distribution of gains and losses change if eligibility for DFQF access were extended to additional small and poor countries? - How much would LDC gains rise if Brazil, China, and India also provide full market access? - What would be the effect of improved access on producers in preference-giving countries?
Report Focus: Implication of full DFQF access for all LDCs
Methodology: MIRAGE CGE model
Review specific findings:
Asian LDCs, particularly apparel exporters such as Bangladesh, would gain most from DFQF access into the US market. Model showing modest reductions in African apparel exports to the US, generally in a range of one to one-and-a-half percent of current exports. African LDCs would likely achieve some gains from 100 percent DFQF access as a result of the elimination of tariffs on important agricultural commodities - increased exports of over 12 percent for Malawi due to the elimination of US tariffs on tobacco. For the other three African LDCs covered in detail in the model, the results show modest gains for Ethiopia (1.35 percent increase in exports) and Mozambique (0.39 percent). Madagascar is the only LDC which ends up losing in this scenario, with estimated losses of 0.03 percent of total exports Minimal impact on the US under the scenario of full DFQF access for all LDCs. Full market access for LDCs would not affect US agricultural production and destabilize price support programs.
Brenton and Ikezuki (2004) The Initial and Potential Impact of Preferential Access to the US Market under the African Growth and Opportunity Act
Overall quality: High: 9/9
Objective of study: Analyse the initial impact of AGOA, highlight the magnitude of the benefits for individual beneficiaries, as well as key constraints.
Report Focus: Scope and coverage of AGOA preferences
Methodology: Analysis of raw trade data and AGOA provisions
Review specific findings:
2002; total value of LDC exports to the US amounted to USD$963m, of which about half of this value, USD$437m, consisted of AGOA exports - 93 percent were apparel exports from the group of LDCs that qualified for the full apparel benefits - LDCs without clothing

58
benefits did not export any products under AGOA in 2002. 1999 and 2002; Exports from the group of LDCs with AGOA apparel benefits - just 9 countries in 2002 - increased by 80 percent, with virtually all of this increase coming from apparel exports under AGOA. Exports from non-LDCs are more diversified than those from LDCs. The value of total AGOA exports from non-LDCs to the US in 2002 was USD$7.9bn – of which 85 percent consisted of petroleum exports from non-LDCs without apparel benefits, principally from Nigeria. The value of exports from the group of non-LDCs eligible for the special rule of origin was $342m in 2002 – of which 60 percent ($201m) consisted of apparel exports. For LDCs, the average MFN duty (i.e. preference margin) on the additional agricultural products covered by AGOA is 7.7 percent, compared to 5.2 percent for agricultural products covered by the GSP. The average duty on excluded agricultural products is 31 percent for LDCs and 30.7 percent for non-LDCs. For manufactured products, the average duty on products covered by the GSP is 3.8 percent, whilst products covered by the basic AGOA provisions are subject to an average duty of 6.1 percent. For clothing products, the average duty on products included in AGOA is more than 12 percent.
Brenton and Hoppe (2006) The African Growth and Opportunity Act, Exports, and Development in Sub-Saharan Africa
Overall quality: High: 9/9
Objective of study: To measure and quantify the measure the value of exports under AGOA and identify features which have limited its impact.
Report Focus: Product coverage and AGOA rules origin, apparel exports
Methodology: Analysis of the evolution of the exports of 37 2005 AGOA beneficiary countries.
Review specific findings:
2004; AGOA exports USD$22bn - 90 percent petroleum exports - USD$2.2bn in non-oil exports. Non-oil exports dropped in 2005 to USD$1.7bn – 40 percent of this decrease was due to AGOA apparel exporters losing market share in the US due to the lifting of US quotas on Asian producers. AGOA exports concentrated in a small number of countries, principally ones with access to apparel benefits - 2004, 96 percent of US AGOA imports of apparel products came from just 7 countries and 75 percent from just four countries (Kenya, Lesotho, Madagascar, and Swaziland). AGOA apparel exports from 2000 to 2004 - all of the growth during this time has been from countries utilising the third country fabric rule – SSA exports of apparel to the US under the third country fabric rule increased from 158.9 million square metre equivalents (SMEs) to 343.4 million SMEs between 2001 and 2004. Volume of SSA apparel exports accessing the US market under the more restrictive regional fabric rule has actually declined over the same period - from 28.9 million SMEs to 27.4 million SMEs. Fifty percent of Mauritius’s apparel exports to the US in 2004 did not utilize available AGOA preferences.

59
Exports of apparel from SSA to the EU and US were almost equal in 2000 – but by 2005, the value of exports to the US was over four times greater than the value of exports to the EU. For 26 of the 37 beneficiaries the value of AGOA preferences is less than two percent of the value of their exports to the US in 2005. For the remaining 11 countries the value of the preferences are much higher – Swaziland (19 percent), Cape Verde (18.7 percent), Lesotho (18 percent), Madagascar (15.1 percent), Kenya (14.2 percent), Malawi (13.9 percent), Mauritius (12.4 percent) Mozambique (10.5 percent), Namibia (7.2 percent), Botswana (3.7 percent) and Uganda (3.5 percent) – mostly accounted for by apparel exports
Collier & Venables (2007) Rethinking trade preferences: How Africa can diversify its exports
Overall quality: High: 9/9
Objective of study: To understand how trade preferences can be designed to maximise their effectiveness
Report Focus: Manufactured exports, with particular of focus on apparel exports under AGOA and the impact of rules of origin
Methodology: Analysis of raw trade data and econometric analysis
Review specific findings:
AGOA has had a positive and very significant effect on apparel exports, raising apparel exports to the US by a factor of almost seven Apparel exports to the US from AGOA eligible LDCs were USD$1.1bn in 2008 – three times their level in 2000 –all under the special third party country rule of origin. Exports from South Africa and Mauritius, the two largest clothing exporters to the US pre-AGOA, had declined to a third of their 2000 level by 2008.
Dean & Wainio (2006) Quantifying the Value of US Tariff Preferences for Developing countries
Overall quality: High: 9/9
Objective of study: Measure the size, utilization and value of all US non-reciprocal trade preference programs
Report Focus: Value of AGOA preferences
Methodology: Comparative analysis of US preferential schemes
Review specific findings:
2003 data; AGOA offered no additional coverage on agricultural exports for LDCs - 100 percent of their agricultural exports were already exempted from duties under the GSP (the only exception being Tanzania). Significant gains for two non-LDCs, Kenya and South Africa whose coverage increased by 87 percent and 80 percent respectively under AGOA. The value of AGOA preferences represents a small share of the overall value of exports to the US. Where the value of preferences is high it is typically almost entirely due to apparel - nine countries in which the value of preferences exceeds 3 percent of value of

60
total exports to the US - Lesotho (17.9 percent), Swaziland (15.8 percent), Cape Verde (14.6 percent), Kenya (13.4 percent), Malawi (10.9 percent), Madagascar (8.2 percent), Mauritius (8 percent), Mozambique (7.7 percent), Namibia (4.8 percent). Again though, with the exception of Malawi, the value of preferences is derived entirely from apparel preferences.
Fayissa & Tadesse (2007) Assessing the impact of Development Cooperation: the case of the African Growth and Opportunity Act (AGOA) and U.S imports from Sub-Saharan Africa
Overall quality: Medium: 7/9 Failed to meet criterion; 7. Results of model not clear and/or explained in sufficient detail 8. Limited analysis of AGOA conditions (i.e. products access, rules
of origin) and their impact
Objective of study: To use data on US imports from each AGOA eligible SSA country for the years 1991-2006, control for country and time specific determinants of bilateral trade flow, and investigate if the increase in the volume of US imports from AGOA eligible SSA countries can be attributed to the implementation of AGOA. Additionally they aim to measure the trade initiation and trade intensification effect of AGOA.
Report Focus: Impact of AGOA on exports from Sub-Saharan Africa
Methodology: Gravity model based on HS-2 level disaggregated trade data (99 product classifications) on exports from eligible SSA countries to the US over the period 1991-2006.
Review specific findings:
AGOA has enhanced the propensity of US imports from eligible SSA countries by initiating imports in several sectors and product categories. Compared to the trade initiation effects it has had, the impact of the initiative in raising the volume of US imports from eligible SSA countries has, however, remained minimal.
Frazer & Van Biesebroeck (2007) Trade Growth under the African Growth and Opportunity Act
Overall quality: High: 9/9
Objective of study: To empirically measure the impact of AGOA on exports from Sub-Saharan Africa
Report Focus: Extent of impact of AGOA on SSA exports up to 2006
Methodology: Triple differences in difference estimation model. The increase in imports into the US of a specific AGOA-eligible product from an AGOA-eligible country during the AGOA period is measured relative to: (i) the overall increase in imports from that country, (ii) the overall increase in imports of that product, and (iii) the base level of imports of AGOA products from AGOA countries. The objective is to isolate the impact of AGOA and understand its impact. A highly disaggregate commodity specification (at the 6-digit level),

61
and estimate a single equation across time use fixed effects to control for time-varying exporter and product effects, and (time-invariant) exporter-product effects.
Review specific findings:
Export increase in the period 2000-2006 which can be attributed to AGOA amounts to USD$439m – eight percent of the total increase in non-oil exports from SSA during this period - 80 percent or USD $348m apparel exports. AGOA induced increase was worth approximately 0.15 percent of the 2000 GDP of all AGOA eligible countries USD$13m - 15 percent of the USD$83m increase in agricultural exports from SSA to the US in the post AGOA period 2000-2006 attributed to AGOA - just 0.2 percent of total non-oil exports (USD$5.4bn) in the pre AGOA period (1998-2000) and 0.5 percent of the total non-oil export growth from SSA (USD$2.5bn) in the post AGOA period up until 2006 Export responses to AGOA have grown over time and were the largest in product categories where the tariffs removed were large. Overall AGOA resulted in an eight percent increase in total non-oil exports from Africa to the US.
Lall (2003) African Apparel Exports, AGOA, and the Trade Preference Illusion
Overall quality: High; 9/9
Objective of study: Explore the rationale, features, effectiveness and sustainability of AGOA led FDI in the clothing sector in Lesotho.
Report Focus: AGOA apparel exports
Methodology: Analysis of the evolution of the FDI, primarily from East Asia, in clothing sector in Lesotho. The author assesses the contribution of this FDI by exploring linkages with the local economy, employment created, skills development and spillover effects from FDI.
Review specific findings:
Apparel sector has created large scale employment in Lesotho – minimal linkages with the local economy. Apparel firms make little effort to impart more advanced skills, with training limited to basic production requirements - most supervisory, technical and managerial jobs remain with expatriates, even within firms that have been in Lesotho for a decade or more. Scant evidence of backward linkages with the local economy, with almost no local firms competing with, supplying, or subcontracting with the foreign firms. Overall contribution of AGOA-induced FDI has been very limited – very little skills upgrading, limited training, low worker productivity, virtually no backward linkages to the local economy.

62
Laborde (2008) Looking for Meaningful Duty Free Quota Free Market Access Initiative in the Doha Development Agenda
Overall quality: High; 9/9
Objective of study: Analyse the implications of extended market access for LDCs
Report Focus: Full DFQF access for all LDCs
Methodology: Partial equilibrium model
Review specific findings:
Model shows losses for Lesotho and Madagascar of around one percent of the value of their current apparel exports under the scenario of full DFQF access to the US for all LDCs, as they suffer from increased competition from Bangladesh and Cambodia, who increase their exports to the US by USD$865m and USD$609m with increased market access for their apparel products. Malawi, Tanzania and Sierra Leone are the African LDCs which gain most under this scenario, with exports projected to increase by USD$279m, USD$41.7m and USD$21.4m.
Mattoo et al. (2003) The Africa Growth and Opportunity Act and its rules of origin: Generosity Undermined?
Overall quality: High; 9/9
Objective of study: This paper describes the provisions of AGOA and assesses its quantitative impact on African, exports, particularly in the apparel sector.
Report Focus: Export impact of AGOA and effect of rules of origin
Methodology: Partial Equilibrium analysis
Review specific findings:
AGOA export gains could have been much greater if AGOA had not imposed certain conditions, the most important condition is the stringent rule of origin. Authors estimates suggest that the absence of these conditions would have magnified the impact nearly five- fold, resulting in an overall increase in non-oil exports of US$0.54 billion compared with the US$100-US$140 million increase that is expected in the presence of these restrictions
Mueller T (2008) The Effect of the African Growth and Opportunity Act (AGOA) on Trade
Overall quality: High; 8/9 Failed to meet criterion; 8. Limited exploration of AGOA conditions (i.e. product access, rules of origin) as explanatory factor
Objective of study: To test the following two hypotheses: first, that AGOA has a negative effect on trade flows, measured as total non-oil US imports, from Sub-Saharan African countries; and secondly, that eligibility for AGOA textile benefits has a positive impact on US non-oil imports from these countries
Report Focus: Impact of AGOA on SSA non-oil exports

63
Methodology: Gravity model Independent variables used in the model include the GDP of AGOA countries (not the US), Consumer Price Index CPI in AGOA countries (as a proxy for prices), exchange rates and also a control variable for conflict.
Review specific findings:
The results of the gravity model show that overall AGOA eligibility has had no significant impact on trade for eligible SSA countries for the time period 1995-2005.
Nouve (2005) Estimating the Effects of AGOA on African Exports using a Dynamic Panel Analysis
Overall quality: High; 8/9 Criterion failed to meet; 8. Limited exploration of AGOA conditions (i.e. product access,
rules of origin) as explanatory
Objective of study: To assess the impact of AGOA on aggregate exports from Sub-Saharan Africa to the US up to 2004
Report Focus: Impact of AGOA on aggregate exports
Methodology: Gravity model Total AGOA exports and AGOA apparel exports included as additional endogenous variables in an augmented gravity equation – to understand the impact AGOA has on total overall SSA exports to the US (i.e. AGOA and non-AGOA exports).
Review specific findings:
AGOA has had a strong positive effect on aggregate SSA exports to the US - estimated coefficients vary from 0.16 to 0.20 – each dollar increase in AGOA exports translates into a 16 to 20 cents spillover effect on aggregate exports to the US. AGOA apparel exports were found to have a negative effect on overall SSA exports to the US - focusing exclusively on increased apparel exports may be misleading – important to evaluate the impact of the agreement on the entire economy. Gains in some sectors could potentially come at the cost of others.
Nouve & Staatz (2003) Has AGOA increased agricultural exports from SSA to the United States?
Overall quality: Medium; 7/9 4. Doubts about the quality of the data used 8. No analysis of AGOA agricultural product access as an
explanatory factor
Objective of study: Estimate the extent of agricultural exports from SSA under AGOA
Report Focus: AGOA agricultural exports
Methodology: Gravity Model Use panel data from 2002 on US agricultural trade with 46 SSA countries to test the impact of AGOA on three dependant variables: firstly, on total overall agricultural exports from 46 SSA countries; secondly on exports from the 27 countries with quarterly agricultural exports greater than USD$100k in the post AGOA period;

64
and finally, on exports from the top eight SSA agricultural exporters.
Review specific findings:
In all three scenarios tested the AGOA induced gains in agricultural exports are found to be not statistically different from zero.
Office of US Trade Representative (2008) 2008 Comprehensive Report on the US Trade and Investment Policy toward Sub-Saharan Africa and the Implementation of the African Growth and Opportunity Act
Overall quality: Medium; 6/9 5. Limited data analysis 6. Doubts about the objectivity of the report 7. Findings overemphasised success of AGOA and were not
supported by data presented
Objective of study: To provide new and updated information on US trade and investment policy toward SSA, including the implementation of AGOA, the designation of AGOA beneficiary countries, the impact that AGOA has had on US trade and investment with SSA, and information on reforms being undertaken by AGOA beneficiary countries.
Report Focus: AGOA exports 2006-2007
Methodology: Analysis of trade data 2006-2007
Review specific findings:
2007 – US AGOA imports of USD$51.1bn – 93 percent petroleum products - and $3.4bn non-oil exports. Of these non-oil exports - USD$1.3bn apparel exports, 271.5m agricultural exports (a 25 percent drop on 2006). Balance made up of minerals and metals, transportation equipment and chemical products.
Olareeaga and Ozden (2004) AGOA and Apparel: Who captures the tariff rent in the presence of preferential market access?
Overall quality: High; 9/9
Objective of study: Analyze the impact of AGOA preferences on prices received by apparel exporters
Report Focus: AGOA apparel exports
Methodology: Analysis of prices received by exporters under AGOA based on the exports of the seven leading AGOA apparel exporters – South Africa, Mauritius, Kenya, Malawi, Swaziland, Madagascar and Lesotho - to the US in 2002.
Review specific findings:
Average export price increase for apparel products benefitting from AGOA preferences is around 6 percent, whereas the average MFN tariff on these products is 20 percent - exporters receive less than
one third of the tariff preference rent. Variation in the share of the preference rent that accrues to exporters across countries – LDCs receive a smaller share. Malawi receives just less than one seventh of preference rent available and Lesotho just under a quarter. Mauritius and South Africa, which export to a diversified number of countries and have strong trade experience, are found to capture over fifty percent of preference
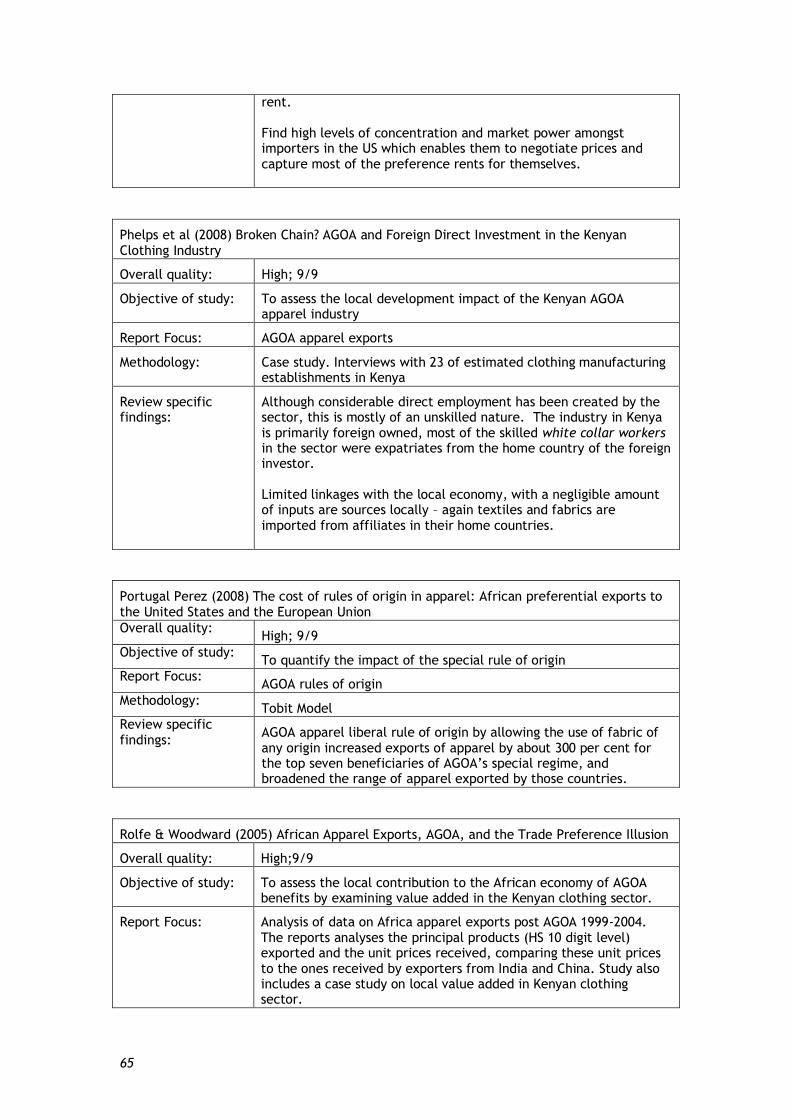
65
rent. Find high levels of concentration and market power amongst importers in the US which enables them to negotiate prices and capture most of the preference rents for themselves.
Phelps et al (2008) Broken Chain? AGOA and Foreign Direct Investment in the Kenyan Clothing Industry
Overall quality: High; 9/9
Objective of study: To assess the local development impact of the Kenyan AGOA apparel industry
Report Focus: AGOA apparel exports
Methodology: Case study. Interviews with 23 of estimated clothing manufacturing establishments in Kenya
Review specific findings:
Although considerable direct employment has been created by the sector, this is mostly of an unskilled nature. The industry in Kenya is primarily foreign owned, most of the skilled white collar workers in the sector were expatriates from the home country of the foreign investor. Limited linkages with the local economy, with a negligible amount of inputs are sources locally – again textiles and fabrics are imported from affiliates in their home countries.
Portugal Perez (2008) The cost of rules of origin in apparel: African preferential exports to the United States and the European Union
Overall quality: High; 9/9
Objective of study: To quantify the impact of the special rule of origin
Report Focus: AGOA rules of origin
Methodology: Tobit Model
Review specific findings:
AGOA apparel liberal rule of origin by allowing the use of fabric of any origin increased exports of apparel by about 300 per cent for the top seven beneficiaries of AGOA’s special regime, and broadened the range of apparel exported by those countries.
Rolfe & Woodward (2005) African Apparel Exports, AGOA, and the Trade Preference Illusion
Overall quality: High;9/9
Objective of study: To assess the local contribution to the African economy of AGOA benefits by examining value added in the Kenyan clothing sector.
Report Focus: Analysis of data on Africa apparel exports post AGOA 1999-2004. The reports analyses the principal products (HS 10 digit level) exported and the unit prices received, comparing these unit prices to the ones received by exporters from India and China. Study also includes a case study on local value added in Kenyan clothing sector.

66
Methodology: Analysis of clothing trade data
Review specific findings:
Weak linkages with the local economy – the value of local Kenyan components in apparel exports is just three percent of sales value and none of these companies use local textiles and fabrics. Scant evidence of skills transfer and upgrading in the sector with most production requiring marginal skills and minimal value added. What SSA apparel has achieved under AGOA to date is a form of temporary trade diversion, where low-value added production is moved to Africa by Asian contractors, who directly supply US low-price retailers. Without local supply linkages and integrated factories, African economies remain vulnerable to rapid deindustrialization as preferences are eroded.
Shapouri & Trueblood (2003) The African Growth and Opportunity (AGOA): Does it really present opportunities?
Overall quality: High; 9/9
Objective of study: To assess how well did the provisions in AGOA match up with the structure of African exports prior to its enactment and a preliminary analysis of which countries have been able to take advantage of the program and why
Report Focus: Structure of AGOA and its initial impact on exports from SSA
Methodology: Analysis of AGOA trade data 2001 - 2002
Review specific findings:
Share of AGOA exports in total SSA exports to the US was 43 percent (USD$7.6bn) in 2001 - 60 percent (USD$8.2bn) in 2000. AGOA exports dominated by previously low-tariff petroleum products (which essentially switched from MFN to AGOA after 2000) – 89 percent (USD$6.8bn) and 85 percent (USD$6.9bn) of AGOA exports in 2001 and 2002 respectively consisted of oil exports from three countries (Nigeria, Angola and Gabon). Apparel exports – from USD$337m in 2001 to USD$800m in 2002. Small group of countries exporting apparel - Kenya, Lesotho, Madagascar, Malawi, and Swaziland – all of whom were eligible for the special apparel rule of origin.
Seyoum (2007) Export Performance of developing countries under the African Growth and Opportunity Act: Experience from US trade with Sub-Saharan Africa
Overall quality: High; 9/9
Objective of study: To examine whether there is a statistically significant increase in African exports under AGOA and to analyse the role of AGOA in stimulating exports from beneficiary countries
Report Focus: Impact of AGOA on exports
Methodology: Gravity model using US import data for 36 AGOA beneficiaries for the period 1997-2004 using three control variables in his gravity equation – exchange rates, GDP and populations of recipient countries.
Review specific AGOA has had a marginally positive (0.046) but statistically non-

67
findings: significant impact on total SSA exports to the US up to 2004 AGOA induced statistically significant impact on apparel exports - coefficient of 11.9 in this sector.
Van Grasstek (2003) The African Growth and Opportunity Act: A Preliminary Assessment
Overall quality: High; 9/9
Objective of study: To provide an early assessment of the utility of AGOA to beneficiary countries, with the aim of reaching quantifiable conclusions regarding its actual utility for the exporting countries.
Report Focus: AGOA exports
Methodology: Analysis of raw US import data from 2001 and 2002.
Review specific findings:
AGOA coverage: 15 of the top 25 exports from SSA (20 percent of the total value of this product group) already encountered a zero percent MFN tariff rate in the US prior to AGOA – six additional products (76 percent of the value of these exports), were already covered by GSP preferences for LDCs - just 3.4 percent of the total value of these top 25 export products received improved coverage under AGOA, all in the apparel sector. Preference margins: petroleum products faced an average tariff of less than one percent prior to AGOA. Motor vehicle products were subject to a tariff of 2.5 percent, slightly above the average US tariff rate. Low preference margins in both cases. Preference margins significantly higher for the remaining four products, all in the apparel sector, with MFN tariff rates on these products ranging between 16.8 percent and 17.3 percent.
This material has been funded by the Department for International Development. However the views expressed do not necessarily reflect the department’s official policies. The report was first published in 2011 by:
Evidence for Policy and Practice Information and Co-ordinating Centre (EPPI-Centre) Social Science Research Unit Institute of Education, University of London18 Woburn SquareLondon WC1H 0NR
Tel: +44 (0)20 7612 6397 http://eppi.ioe.ac.uk http://www.ioe.ac.uk/ssru
ISBN: 978-1-907345-07-4Cover image - UN Photo/Eskinder Debebe
The International Initiative for Impact Evaluation (3ie) works to improve the lives of people in the developing world by supporting the production and use of evidence on what works, when, why and for how much. 3ie is a new initiative that responds to demands for better evidence, and will enhance development effectiveness by promoting better informed policies. 3ie finances high-quality impact evaluations and campaigns to inform better program and policy design in developing countries. 3ie Systematic Reviews examine the range of available evidence regarding a particular intervention.
International Initiative for Impact Evaluations (3ie)Tel: + 44(0)20 7958 8351/8350 http://www.3ieimpact.org
The views expressed in this work are those of the authors and do not necessarily reflect the views of the EPPI-Centre, 3ie or the funder. All errors and omissions remain those of the authors.
This document is available in a range of accessible formats including large print. Please contact the Institute of Education for assistance: telephone: +44 (0)20 7947 9556 email: [email protected]
The authors of this report were supported by the Evidence for Policy and Practice Information and Co-ordinating Centre (EPPI-Centre) and the International Initiative for Impact Evaluation (3ie).
The Evidence for Policy and Practice Information and Co-ordinating Centre (EPPI-Centre) is part of the Social Science Research Unit (SSRU), Institute of Education, University of London.
Since 1993, we have been at the forefront of carrying out systematic reviews and developing review methods in social science and public policy. We are dedicated to making reliable research findings accessible to the people who need them, whether they are making policy, practice or personal decisions. We engage health and education policy makers, practitioners and service users in discussions about how researchers can make their work more relevant and how to use research findings.
Founded in 1990, the Social Science Research Unit (SSRU) is based at the Institute of Education, University of London. Our mission is to engage in and otherwise promote rigorous, ethical and participative social research as well as to support evidence-informed public policy and practice across a range of domains including education, health and welfare, guided by a concern for human rights, social justice and the development of human potential.