Embed Size (px)
Citation preview

University of Massachusetts Amherst
Department of Resource Economics Working Paper No. 2006-8
http://www.umass.edu/resec/workingpapers
The Effect of Wal-Mart Supercenters on Grocery Prices in New England
Richard J. Volpe III1 and Nathalie Lavoie2
Abstract: This study examines the competitive price effect of Wal-Mart Supercenters on national brand and private label grocery prices in New England. For this purpose, we use primary price data collected on a basket of identical products from six Supercenters in Massachusetts, Connecticut, and Rhode Island as well as a sample of conventional supermarkets. Taking into account demographics, store characteristics, and market conditions, we estimate the average prices charged by (1) Supercenters, (2) supermarkets competing directly with Supercenters, and by (3) supermarkets geographically distant from Supercenters. By comparing prices at competing stores and at distant stores, we show that the effect of Wal-Mart Supercenters is to decrease prices by 6 to 7 percent for national brand goods and 3 to 7 percent for private label goods. Price decreases are most significant in the dry grocery and dairy departments. Moreover, Wal-Mart sets prices significantly lower than its competitors in the food industry. Keywords: Wal-Mart, Supermarket Competition, Grocery Prices, National Brands, Private Labels JEL Classification: D21, D43, L11, L13, L81 ________________________
1Richard J. Volpe III, Department of Agricultural and Resource Economics University of California at Davis, One Shields Avenue, Davis, CA 95616 E: [email protected] P: 530-752-8011 F: 530-752-5614
2Nathalie Lavoie, Department of Resource Economics University of Massachusetts, Stockbridge Hall, 80 Campus Center Way, Amherst, MA 01003 E: [email protected] P: 413-545-5713 F: 413-545-5853

The Effect of Wal-Mart Supercenters on
Grocery Prices in New England
Richard J. Volpe III Department of Agricultural and Resource Economics
University of California at Davis One Shields Avenue
Davis, CA 95616
And
Nathalie Lavoie Department of Resource Economics
University of Massachusetts-Amherst 80 Campus Center Way
Amherst, MA 01003-9246
October 4, 2006
Abstract This study examines the competitive price effect of Wal-Mart Supercenters on national brand and private label grocery prices in New England. For this purpose, we use primary price data collected on a basket of identical products from six Supercenters in Massachusetts, Connecticut, and Rhode Island as well as a sample of conventional supermarkets. Taking into account demographics, store characteristics, and market conditions, we estimate the average prices charged by (1) Supercenters, (2) supermarkets competing directly with Supercenters, and by (3) supermarkets geographically distant from Supercenters. By comparing prices at competing stores and at distant stores, we show that the effect of Wal-Mart Supercenters is to decrease prices by 6 to 7 percent for national brand goods and 3 to 7 percent for private label goods. Price decreases are most significant in the dry grocery and dairy departments. Moreover, Wal-Mart sets prices significantly lower than its competitors in the food industry. Keywords: Wal-Mart; Supermarkets; Retail Competition; Grocery Prices; National Brands; Private Labels. Acknowledgements: This article is based on Richard Volpe’s masters thesis. The authors appreciate the valuable comments received from Ronald Cotterill, Daniel Lass, Richard Sexton, and participants at the 2005 AAEA annual meeting in Providence, RI. The authors are responsible for any remaining errors in the paper. This project was funded by the Cooperative State Research, Extension, and Education Service, U.S. Department of Agriculture through the Massachusetts Agricultural Experiment Station under Project No. MAS00894.
1

The discount retailer Wal-Mart has been a popular topic of discussion and debate for more than a
decade. Much of the recent controversy surrounding Wal-Mart in the economic literature and the
popular press has focused on food retailing. Wal-Mart’s meteoric rise to dominance in the U.S.
food retailing has motivated efforts to understand the effects of Supercenter stores on consumers,
competitors, and the economy in general. The primary objective of this study is to estimate the
competitive effect of Wal-Mart Supercenters on prices at conventional supermarkets, i.e., the
extent to which Supercenters bring about a decrease in their rivals’ price. Additionally, we
estimate price differences between Supercenters and conventional stores to determine the savings
realized by shopping at Supercenters. We examine these two objectives separately for national
brands and private labels to determine whether Supercenters impact differently the two labels.
Supercenters are Wal-Mart stores that offer entire lines of groceries in addition to all of the
usual wares found at conventional Wal-Mart stores. Wal-Mart became the largest food retailer in
the United States in 2003, largely through the expansion of Supercenters, and is currently the
leading grocer worldwide (Progressive Grocer, 2005). By the end of 2003 there were 1,376
Supercenters in the United States, with over 1,000 more planned for construction by 2008
(Bianco and Zellner, 2003). Much of the Supercenter expansion is projected to take place in
regions such as New England and California, where Wal-Mart is newer and has a smaller
presence compared to the South and Midwest, where the firm originated.
Supercenters are the subject of as much, if not more, controversy than conventional Wal-
Mart stores. A glance at news headlines on any given day reveals that Wal-Mart is confronting
opposition from citizens and local governments in many of the locations where it chooses to
erect Supercenters. The public outcry is spurred partly from Wal-Mart’s low wages and
2

substandard health care benefits to its non-unionized employees. Family-supporting jobs are lost
when employee-unionized rivals go out of business due to Wal-Mart’s entry (Daykin, 2006). For
that reason, opposition in California has been particularly strong. Wal-Mart’s announcement that
it would open 40 Supercenters in this state led to a four-month strike of grocery unions in 2003
to protest the cuts made in labor expenses by rival chains to compete. In 2004, residents of a
suburb of Los Angeles protested and voted against the construction of a Supercenter citing low
wages paid to employees and Wal-Mart’s refusal to allow labor unions (Zwiebach, 2004; Hudson
and McWilliams, 2006). In the U.S. Northeast and in urban areas, the outcry also stems from the
store image. The construction of a store in Miami was blocked on the grounds that “its
sprawling, suburban aesthetics and low-end appeal didn’t conform to the city’s architectural and
social vision for the project” (Hudson and McWilliams, 2006).
Despite the ongoing controversy and the growing importance of Supercenters in all aspects
of food retailing, the economic literature remains relatively scarce on the economic impact of
Wal-Mart Supercenters. This is partly due to the absence of a data source; Wal-Mart does not
participate in any of the public data collection services.
Franklin (2001) examined the impact of Wal-Mart Supercenters on market concentration in
the 100 largest U.S. metropolitan areas in 1993 and 1999. He found that Supercenters have no
significant effect on supermarket concentration. However, the market share obtained by
Supercenters increases with time and is inversely proportional to the income of the local
consumers in metropolitan areas.
While there is no evidence in the literature that Supercenters are responsible for the closing
of supermarkets, Supercenters have been found to have a negative effect on the sales of
conventional supermarkets. Capps and Griffin (1998) estimated that Wal-Mart Supercenters
3

were directly responsible for a 21 percent reduction in sales for a regional chain of supermarkets
in the Dallas/Fort Worth area of Texas. The combined effect of Supercenters and Wal-Mart’s
wholesale outlet, Sam’s Club Stores, on supermarkets amounts to a loss of $15 to $17 billion in
sales from supermarkets nationwide in 2001 (USA Today, cited by Jones, 2004).
Wal-Mart Supercenters follow a different pricing strategy than most supermarkets. This may
affect how supermarkets compete in price when a Supercenter is present. All Wal-Mart stores
use Everyday Low Pricing (EDLP), meaning that all products are marked up by the same
percentage regardless of the price at which they were acquired (Vance and Scott, 1994). Sales,
promotions, and advertising do not play heavily into the practice of EDLP. Most supermarkets,
by contrast, employ High-Low Pricing (HLP), whereby most products are given a high markup
but a percentage of goods, changing on a regular basis, are put on promotion. In many cases,
promotional items are sold at a loss to the store with the intent to increase customer traffic. Using
a game theoretical approach, Jones (2004) demonstrated that EDLP is profitable for Supercenters
because it creates a stark difference in prices from supermarkets. Moreover, supermarkets would
be more profitable if they switched to EDLP when competing with Supercenters. Supporting this
notion, many of the largest supermarket chains in the nation are gradually lowering their prices
and decreasing the frequency and size of promotions at some of their locations (Adamy, 2005).
With the EDLP strategy and its countervailing market power towards manufacturers (Dobson
and Waterson, 1999; Chen, 2003; Wilke, 2004), Wal-Mart sets prices lower than its competitors.
According to a 2002 UBS Warburg study, Wal-Mart Supercenters’ prices are, on average, 14
percent lower than competing supermarkets (Bianco and Zellner, 2004). Studies surveyed by
Hausman and Leibtag (2005) show Wal-Mart prices to be 8 to 27 percent lower than large
supermarket chains.
4

To date however, the impact of Wal-Mart Supercenters on prices at conventional
supermarkets has not been explored much in the literature, with the exceptions of the studies by
Woo et al. (2001) and indirectly, Hausman and Leibtag (2005). Woo et al. monitored prices at
conventional supermarkets both before and after the entry of a Wal-Mart Supercenter in the
Athens, Georgia area. Their results showed that supermarkets lowered their prices significantly
prior to the Supercenter’s entry, but that prices gradually rose back to their original levels
following entry. The only supermarkets showing lasting effects from the Supercenter entry were
those with the highest prices at the beginning of the study. Hausman and Leibtag used an
ACNielsen household panel data for 1998-2001 to study the consumer welfare impact of Wal-
Mart in the U.S. food market by estimating the compensating variation. The compensating
variation is broken into two parts: a variety effect from having access to a new outlet, and an
indirect price effect associated with the decrease in price from existing outlet. They estimate the
variety effect to be 20.2 percent of food expenditure, and the indirect price effect to be 4.8
percent of food expenditure. Thus, they find a substantial benefit for households who have the
choice to shop at Supercenters, i.e., a total welfare effect of 25 percent of food expenditure.
This study contributes to the literature on the economic impact of Wal-Mart Supercenters and
is unique in four respects. First, we estimate both the competitive effect of Supercenters on
prices of competitors and the discount realized by shopping at a Supercenter, by grocery
department. Second, given that Wal-Mart does not participate in any of the public data collection
services, we use a unique data set consisting of prices collected directly off the shelves of the
stores sampled. Third, we focus on the effect of Supercenters in the states of New England
(Connecticut, Massachusetts, and Rhode Island), a new region of expansion for Supercenters and
also a region that is both wealthier and more densely populated than the U.S. South and
5

Midwest, where Supercenters originated. Fourth, we conduct separate analyses for national brand
and private label products. National brand products are obtained from national distributors and
therefore are identical across all stores. National brand products are more heavily advertised and
are more popular among higher income shoppers. Private label products, alternatively, are
produced through a form of vertical coordination and are heterogeneous across different chains.
Despite having higher markups, they are universally cheaper than their national brand substitutes
and appeal to lower income shoppers.1 Examining separately national brands and private labels
enables us to shed some light on the impact of Supercenters on the national brand/private label
margin and on strategic efforts by supermarkets to maintain consumer loyalty.
Data
Because Wal-Mart does not participate in any public data collection services, it was necessary to
gather primary price data. The data were gathered from 18 stores throughout the states of
Massachusetts, Connecticut, and Rhode Island. The selection of the 18 stores was made by the
following criteria: six of the stores are Wal-Mart Supercenters, another six are the largest
supermarkets, in terms of floor size, found within five miles of each of the Supercenters.
Henceforth, these stores are referred to as “competing stores.” The final six stores are used as
comparison stores to the six supermarkets competing with Wal-Mart Supercenters, and they will
be referred to as “comparison stores.” Using data from the 2000 Census as well as the 2004
Trade Dimensions Retail Data Directory, we selected stores that shared many similarities with
the six competing supermarkets in terms of size, market conditions, and demographics.2
The 54 products sampled in this study were selected from a larger list compiled by Cotterill
(1999a) and span the six major supermarket departments: grocery, dairy, frozen food, health and
1 For a review of the literature on national brand and private label products, see Bergès-Sennou, Bontems, and Réquillart (2004). 2 See Appendix A for information on the stores sampled and their location.
6

beauty aids (HBAs), meat, and produce.3 The products were selected in proportion to
departmental shares of sales calculated by Cotterill (1999a) in order to represent a typical
consumer’s market basket. This explains, for example, why more goods were sampled from the
grocery department than from the dairy department. In every department the selection of
products was divided evenly between national brand and private label goods, with the exception
of the produce department, in which only national brand goods were available. Taking into
account that private label products differ across different supermarket chains, we used data from
Consumer Reports to select products that do not vary much in quality among manufacturers.
The prices of the products were recorded directly off the shelves of the 18 stores. Figure 1
reports the average price of the national brand and private label market baskets for the three store
categories. Only the non-promotional prices were recorded when a sampled product was on
promotion. Data gathering was performed within a three-week period in October 2004 to avoid
any time-series trends in the data.
Figure 1 shows that for both national brand and private label products, the average price of
the entire basket is lower at competing stores than at comparison stores. Moreover, Supercenters
have the lowest average price for both market baskets and the average price difference between
Supercenters and competing stores exceeds the average difference between competing and
comparison stores.
Price Indexes and Model Formulation
To examine the impact of Wal-Mart Supercenters on the price of food products, we constructed
price indexes by supermarket departments. Binkley and Connor (1998) have shown that fresh
3 See Appendix B for the complete market basket as well as the average price of each product at the 18 stores.
7

$50.99
$82.94
$46.73
$76.04
$33.99
$59.38
0
10
20
30
40
50
60
70
80
90
National Brand Private Label
Ave
rage
Tot
al P
rice
(US
Dol
lars
)
Comparison
Compete
Wal-Mart
Figure 1: Average total price of the national brand (30 goods) and private label (24 goods) market baskets, by store category
goods (red meats, milk, and produce) are priced differently than packaged goods (products in the
“dry grocery” and “health and beauty” department). Departmental price indexes were
constructed using expenditure-weighted relative prices. Expenditure-weighted relative prices
have been used in previous work examining supermarket prices (Cotterill, 1999b; Woo, et al.,
2001, Yu and Connor, 2002). Weighting prices by expenditure allows for proper accounting of
the different nature of market baskets as well as respects the patterns of consumption in the
United States. Formally, the indexes are given by:
1
11
100
j
j
M
mj mijkm
ijk M
mj mijm
W PV
W P
=
=
= ⋅∑
∑
8

where Vijk is the price index for brand i (i = N for national brand or P for private label),
department j, and store k. Wmj is the weight assigned to good m in department j and Pmijk is the
relative price of good m of brand i in department j at store k. The relative prices Pmijk were
obtained by standardizing each observed shelf price by the average price paid for the given
product across all stores.4 Thus, the price index Vijk is constructed as the weighted average price
of the Mj goods of brand i in department j of store k, divided by the same expression for store 1
(the reference store) and multiplied by 100. The reference store is the Supercenter in Raynham,
MA, for national brand indexes and the Supercenter in Jewett City, CT, for private label indexes.
These stores were chosen because across departments they have the lowest average prices.
The weight Wmj is the expenditure on good m, found in the market basket of department j,
relative to the total expenditure on all goods sampled in department j. It is calculated as
1
j
mjmjmj M
mjmjm
CPWCP
=
=
∑
where mjP is the average price of good m in department j across all 18 stores sampled for this
study and Cmj is the estimated per capita annual consumption of good m in department j in the
United States in 2003 as measured by the Economic Research Service of the USDA.
Tables 1 and 2 display the descriptive statistics for the departmental price indexes. They
reveal two trends in the price indexes. First, for all departments except for national brand meat,
Supercenters have the lowest price indexes (least expensive) and comparison stores have the
highest price indexes (most expensive). Second, the coefficient of variation statistics reveal that
the Supercenters generally have the lowest price volatility while competing stores have the
4 Expressing prices in relative term eliminates the effect of package-size discrepancy across products.
9

Table 1: Summary statistics for expenditure-weighted national brand price indexes
Grocery Dairy Frozen Food
HBA Meat Produce
MeanSupercenters Compete Compare
102.62 126.67 143.19
100.36 137.10 168.76
108.03 145.97 159.64
107.76 133.25 141.03
100.76 139.26 132.89
111.47 141.52 159.50
Standard DeviationSupercenters Compete Compare
1.58 12.56 7.60
0.28 21.24 6.35
8.24 22.44 15.91
5.87 11.76 11.72
1.39 2.21 12.60
5.92 19.40 11.23
Coefficient of VariationSupercenters Compete Compare
1.54% 9.92% 5.31%
0.03% 15.57% 3.76%
7.63% 15.37% 9.97%
5.48% 8.83% 8.31%
1.38% 1.58% 9.48%
5.31% 13.71% 7.04%
Table 2: Summary statistics for expenditure-weighted private label price indexes
Grocery Dairy Frozen Food
HBA Meat
MeanSupercenters Compete Compare
102.36 142.43 158.64
100.38 133.84 158.43
103.73 138.58 151.93
119.50 128.09 151.58
134.77 129.09 147.68
Standard DeviationSupercenters Compete Compare
2.10 14.64 17.80
0.30 21.67 14.59
4.15 33.16 25.35
9.55 12.68 30.25
18.37 18.64 30.38
Coefficient of VariationSupercenters Compete Compare
2.05% 10.28% 11.22%
0.30% 16.19% 9.21%
3.99% 23.93% 16.69%
7.99% 9.90% 19.95%
13.63% 14.44% 20.57%
highest price volatility. One possible explanation is that Supercenters reduce the ability of
supermarkets to coordinate prices and promotional activities. Marion, Heimforth, and Bailey
(1993) found this to be true in the context of heterogeneous competition among supermarkets
and larger warehouse stores. In addition, stores competing with Wal-Mart have been found to
engage in both price and non-price strategies (Khanna and Tice, 2000). Non-price strategies
include improving service, image, or variety. Several of the competing supermarkets sampled for
this study were recently renovated, with features such as gasoline stations, coffee shops, and
bookstores. If competing stores use a greater number of strategic instruments to compete with
10

Supercenters than comparison stores, we may expect competing stores to have the greatest
overall price variability among the store categories.
The price indexes for all three store categories were pooled to enable a direct test of the
effect of Wal-Mart Supercenters on supermarket prices. The resulting model can be expressed as:
(1) V= β 0+ β1 DAIRY + β2 FROZEN + β3 HBA +β4 MEAT + β5 PRODUCE + β6 COMPETE + β7 COMPARE + β8 COMPETEDAIRY + β9 COMPETEFROZ + β10 COMPETEHBA + β11 COMPETEMEAT
+ β12 COMPETEPROD+ β13 COMPDAIRY + β14 COMPFROZ + β15 COMPHBA + β16 COMPMEAT+ β17 COMPPROD + δX +u where V represents the expenditure-weighted relative price indexes, as described above. DAIRY,
FROZEN, HBA (health and beauty aids), MEAT, and PRODUCE are binary variables included to
capture price differences across departments. Therefore, the reference category is grocery.
COMPETE and COMPARE are binary variables that represent the different supermarket
categories. COMPETE equals one if the supermarket is a store competing with the Supercenter,
and zero otherwise. COMPARE equals one if the supermarket is a store located further away
from a Supercenter and represents a comparison store, and zero otherwise. These variables are
also interacted with the departmental binaries. We expect the results to indicate that Supercenters
have the lowest average prices among all store categories and that the competing stores have
lower average prices than the comparison stores. Hence the coefficients for COMPETE and
COMPARE are anticipated to have positive signs, and the coefficient on COMPARE is expected
to be greater in magnitude than the coefficient on COMPETE, to represent this pattern for the
grocery department. Given the proper mapping of coefficients, we expect similar results to be
realized for all departments.5
X represents a vector of variables consisting of demographics, store characteristics, and
5 For example, the expected price index value for the dairy department at competing stores is given by β0 + β1 + β6 + β8, while the expected price index for the dairy department at comparison stores is β0 + β1 + β7 + β13.
11

market conditions. These variables, stressed in importance by a survey of the literature on
supermarket pricing and competition, measure income, population density, the distance to the
nearest large competitor, store size, concentration, and the percentage of minorities in the local
population. We describe these variables next.
INCOME is a binary variable equal to 1 if the city or town, associated with the index value,
has a median household income greater than $45,725, i.e., in the upper half of the data set. Given
that consumers become less price sensitive as income increases (Hoch et al., 1995) we expect the
coefficient to be positive. The binary nature of this variable is intended to reflect the average
difference in prices between areas of “high income” versus “low income” in New England.6
Income data from the 2000 Census were used to generate this variable.
POPDENS represents population density and is expected to have a negative sign, as food
retailers have greater incentive to compete when consumers can easily travel among stores
(Lamm, 1981; Cotterill, 1986). Data on population and land area for the cities and towns were
available from the 2000 Census.
Concentration data were not available at levels disaggregated enough for this study, and
therefore two proxies are used in place of the conventional measurements of industry
concentration, e.g., four-firm concentration ratio and the Herfindalh-Hirschman Index. DTLC is
the distance, in miles, to the nearest supermarket or Supercenter. CONCENTRATED is a binary
variable equal to one if the town or city associated with the price index has fewer than three large
food retailers. Both of these coefficients are expected to be positive. The locations of the stores
in each town or city were obtained from the Trade Dimensions 2004 Retail Data Directory and
driving distances among stores were determined using the electronic service Mapquest.
6 Areas falling below the median income value in the data set are not necessarily low-income areas as defined by the U.S. Census Bureau.
12

SSIZE is the size of the store, in thousands of square feet. According to Binkley and Connor
(1996, 1998), store size can affect prices in two opposite directions. Larger stores may enjoy
economies of scale and thus charge lower prices. However, larger stores may also stock more
items and provide more services, which contribute to raise costs and thus prices. Binkley and
Connor (1998) argue that the second effect dominates for conventional retailers. The first effect
most likely dominates for Wal-Mart. Thus, the expected sign on SSIZE is indeterminate for both
national brands and private labels.7 Data on store size in square footage were available from
Trade Dimensions 2004 Retail Data Directory.
BH is the percentage of blacks and Hispanics living in the associated town. Blacks and
Hispanics are more sensitive to grocery prices (Hoch et al., 1995). Thus, this variable is expected
to be negative. Demographic data were obtained from the 2000 Census.
Results and Discussion
Equation (1) was estimated separately for national brand and private label price indexes for ease
of interpretation and readability. The results of the Generalized Least Squares (GLS) estimations
are compiled in table 3. The models were estimated using GLS rather than Ordinary Least
Squares (OLS) because preliminary regression results indicated heteroskedasticity resulting from
different variances across departments. The models have high explanatory power, as evidenced
by the models’ F-statistics and the adjusted R2 values. Diagnostics revealed no multicollinearity
problem among the variables in the X vector. Consistent price data were not available for private
label produce and therefore price indexes were not calculated for those goods.
7 Note that five of the 12 conventional retailers in our sample are relatively large supermarkets with store areas greater than 50 000 square feet. Those stores have amenities, such as coffee shop or deli area, which are typically not found in smaller stores.
13

Table 3: Regression Results Model A Model B
National Brands Private Labels Intercept 113.476***
(7.430) 139.961*** (14.665)
DAIRY -2.258 (6.609)
-1.976 (10.385)
FROZEN 5.412 (6.023)
1.373 (10.891)
HBA 4.814 (4.681)
17.135* (9.467)
MEAT -1.851 (4.818)
32.404*** (9.464)
PRODUCE 8.852 (5.530)
COMPETE 18.765*** (5.131)
27.897*** (10.722)
COMPARE 32.041*** (5.171)
41.297*** (10.796)
COMPETEDAIRY 12.684 (9.347)
-6.617 (14.687)
COMPETEFROZ 13.888 (8.518)
-5.224 (15.402)
COMPETEHBA 1.764 (6.620)
-21.472** (13.388)
COMPETEMEAT 14.444** (6.813)
-45.749*** (13.384)
COMPETEPROD 5.992 (7.821)
COMPDAIRY 27.828*** (9.347)
1.763 (14.687)
COMPFROZ 11.044 (8.518)
-8.090 (15.402)
COMPHBA -6.974 (6.620)
-24.194* (13.388)
COMPMEAT -8.447 (6.813)
-43.365*** (10.428)
COMPPROD 7.461 (7.821)
INCOME 8.570*** (2.493)
21.743*** (4.826)
POPDENS -0.638 (0.427)
-1.581* (0.826)
DTLC 0.627 (0.499)
0.887 (0.966)
SSIZE -0.297*** (0.094)
-0.795*** (0.182)
CONCENTRATED 7.561*** (3.058)
1.031 (5.920)
BH 0.020 (0.132)
0.168 (0.256)
N 108 90 F 20.51*** 6.81*** Adjusted R2 0.81 0.57 ***: Coefficient is significant at the .01 level. **: Coefficient is significant at the .05 level. *: Coefficient is significant at the .10 level. Standard errors are in parenthesis.
14

The demographics and market conditions all have expected signs, with the exception of BH,
which is not statistically significant. SSIZE is negative and significant for both national brands
and private labels indicating that larger stores have lower prices. The likely explanation for this
result is that economies of scale enable large stores, such as Supercenters and large conventional
supermarkets, to be more efficient and charge lower prices. The coefficients indicate that a 1000
square feet increase in store size results in an average decrease in price of .25 percent for national
brands and a .88 percent decrease in price for private labels, when the coefficient is expressed as
a percentage of the average value of the dependent variable.8
The coefficient on INCOME is positive and statistically significant for both brands. In
percentage terms, the coefficients indicate that the price of national brands is seven percent
higher, and the price of private labels is 24 percent higher in higher income locations in New
England than in lower income locations.
In general, expressed as a percentage of the average value of the dependent variable, the
effects of the demographics and market conditions on price are greater in magnitude for private
label products than for the national brand products, except for the effect of market concentration
(CONCENTRATED). This pattern supports the findings that supermarkets have greater control
over private label prices as opposed to the national brand prices set by manufacturers (Mills,
1995) and that consumers who purchase private label goods are more price sensitive than those
who primarily shop purchase national brands (Dhar and Hoch, 1997).
Tables 4 and 5 give the expected price index value for each department and store type,
holding all demographics, market conditions, and store characteristics constant. Column 6 in
each table is of particular interest. It reports the average price difference in percentage term
between competing stores and comparison stores. Those percentages represent the estimated 8 The mean national brand departmental price index is 118.65 while the mean private label index is 90.69.
15

competitive effect of the presence of Wal-Mart Supercenters on the prices at conventional
supermarkets.
Table 4: Expected expenditure-weighted relative price indexes by department for national brand goods. (Model A) 9
(1): Wal-Mart
Supercenters
(2): Competing
Stores
(3): Comparison Stores
(4):(1)– (2) % difference
(5):(1) – (3) % difference
(6):(2) – (3) % difference
Grocery 113.476 132.241 145.517 -14.19*** -22.02*** -9.12*** Dairy 111.218 142.667 171.087 -22.04*** -34.99*** -16.61*** Frozen Food 118.888 151.541 161.973 -21.55*** -26.60*** -6.44 HBA 118.290 138.819 143.357 -14.79*** -17.49*** -3.16 Meat 111.625 144.834 135.219 -22.93*** -17.45*** 7.11 Produce 122.328 147.085 161.830 -16.82*** -24.41*** -9.11** ***: Difference is significant at the .01 level **: Significant at the .05 level *: Significant at the .10 level
Table 5: Expected expenditure-weighted relative price indexes by department for private label goods. (Model B) (1):
Wal-Mart Supercenters
(2): Competing
Stores
(3): Comparison
Stores
(4):(1)– (2) % difference
(5):(1) – (3) % difference
(6):(2) – (3) % difference
Grocery 139.961 167.858 181.258 -16.62*** -22.78*** -7.39 Dairy 137.985 159.265 181.045 -13.36*** -23.78*** -12.03** Frozen Food 141.334 164.007 174.541 -13.82*** -19.03*** -6.04 HBA 157.096 163.521 174.199 -3.93 -9.82** -6.13** Meat 172.365 154.513 170.297 11.55** 1.21 -9.27* ***: Difference is significant at the .01 level. **: Significant at the .05 level. *: Significant at the .10 level.
A decrease in average prices is attributed to the presence of Supercenters in all departments
except for national brand meat. This counterintuitive finding for the national brand of meat is not
statistically significant. It may be attributed to a temporary pricing anomaly during the data
collection time frame or a small sample size for meat.
For both national brand and private label products, the largest competitive effect of
Supercenters occurs in the dairy department with estimated decreases in prices of 17 percent and
12 percent, respectively. Among national brand products, the grocery and produce departments
are also significantly affected by the presence of Supercenters. Supercenters cause a nine percent
9 Joint tests of significance were performed for the appropriate binary and interaction terms. For example, for national brand dairy, we tested Ho: COMPETE + COMPETEDAIRY = COMPARE + COMPAREDAIRY.
16

decrease in the price of national brands of both grocery items and produce. Significant average
price decreases are attributed to Supercenters for private label HBA and meat products. We are
unable to conclude that the presence of Wal-Mart Supercenters has a statistically significant
effect on the prices of frozen food items, regardless of the brand type. Finally, the grocery
department for private label goods is not significantly impacted by the presence of Supercenters.
Column 4 of tables 4 and 5 depicts the average price differences between the Wal-Mart
Supercenters and the conventional supermarkets with which they compete. These differences
indicate to what extent Supercenter prices are lower than competing stores (column 4) and lower
than comparison stores (column 5). With two exceptions, Supercenters prices are significantly
lower, on average, than those of competing stores, and the differences are greater in magnitude
than those calculated between competing and comparison stores. The two exceptional cases are
private label HBA products, for which the estimated difference is insignificant, and private label
meat, for which Supercenters have the highest average prices among all store categories. The
HBA department is unique in this study, as it is comprised of products that are also available at
many other store types, including pharmacies and other mass merchandisers. Therefore, greater
overall price competition and lower average price differences between Supercenters and
competing stores, relative to other departments, is expected for the HBA department. As
mentioned previously, the results for the meat department call for further investigation.
Column 4 of table 4 indicates that Supercenters price their national brand products between
14 and 23 percent lower than competing supermarkets. The estimated national brand price
differences between Supercenters and competing stores are generally larger than the
corresponding private label differences, which vary between 13 and 17 percent (according to
column 4 of table 5). The largest price differences are for national brand of dairy, frozen food,
17

and meat products, and private label grocery products. As expected, the price difference is larger
between Supercenters and comparison stores. Supercenter prices are lower than comparison
stores by 17 to 34 percent depending on the national brand department (column 5 of table 4), and
by 9 to 24 percent for private label departments (column 5 of table 5). The largest price
differences are for dairy products for both national brands and private labels.
Table 6 reports the average departmental shares of sales as determined by Cotterill (1999a).
The average departmental price differences reported in tables 4 and 5 were weighted by these
shares of sales. The results, reported in table 7, represent the average overall competitive effects
of Supercenters on prices at conventional supermarkets. They correspond to the overall average
price differences between competing and comparison stores. The estimates were calculated in
two ways. With method 1, the weighted price difference was calculated using all of the
percentage differences reported in tables 4 and 5. Method 2 utilizes only those effects that were
found to be statistically significant.
Table 6: Departmental shares of sales
Department Share of Sales Grocery 46.07% Dairy 7.99% Frozen Food 7.05% HBA 5.77% Meat 14.52% Produce 18.61% Source: Cotterill (1999a)
Table 7: The estimated overall competitive effect of the presence of Supercenters, by model Model Estimated Overall Effect of Wal-Mart Method 1 Method 2 A. National Brand -6.83%* -5.82%* B. Private Label -6.73% -3.11%* ***: Difference is significant at the .01 level **: Significant at the .05 level *: Significant at the .10 level
The overall competitive effect of the presence of Supercenters on supermarket prices ranges
18
from a 5.82 to a 6.83 percent price decrease for national brand goods and a 3.11 to a 6.73 percent
price decrease for private labels. Given that the private label estimate calculated using method 1
is statistically insignificant, our results show that the overall effect of Supercenters is greater for
national brand products. National brand products are universally more expensive and more
heavily promoted than their private label substitutes. Therefore this finding is in agreement with
the ongoing trend of lower prices in conventional supermarkets as a response to Wal-Mart, as
noted by Adamy (2005). Moreover, we may expect a lower competitive effect on private label
prices because their heterogeneity relative to Wal-Mart private labels is such that the competition
is not as strong for those goods as for national brands.
Applying the same weighting scheme to the average price differences between Supercenters
and conventional supermarkets, table 8 reports the overall price differences by store category and
brand type. Only statistically significant price differences were included in the calculations.
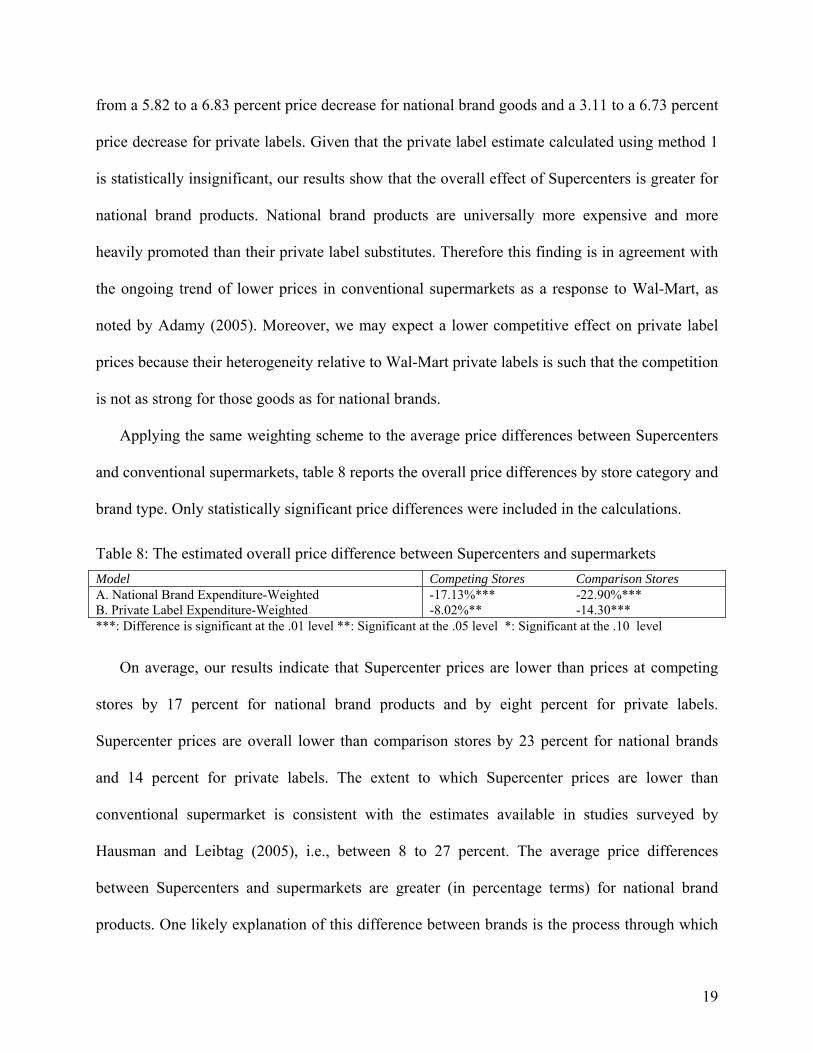
Table 8: The estimated overall price difference between Supercenters and supermarkets Model Competing Stores Comparison Stores A. National Brand Expenditure-Weighted -17.13%*** -22.90%*** B. Private Label Expenditure-Weighted -8.02%** -14.30*** ***: Difference is significant at the .01 level **: Significant at the .05 level *: Significant at the .10 level
On average, our results indicate that Supercenter prices are lower than prices at competing
stores by 17 percent for national brand products and by eight percent for private labels.
Supercenter prices are overall lower than comparison stores by 23 percent for national brands
and 14 percent for private labels. The extent to which Supercenter prices are lower than
conventional supermarket is consistent with the estimates available in studies surveyed by
Hausman and Leibtag (2005), i.e., between 8 to 27 percent. The average price differences
between Supercenters and supermarkets are greater (in percentage terms) for national brand
products. One likely explanation of this difference between brands is the process through which
19

the food retailers obtain their wares. National brand products are purchased from national brand
manufacturers and distributors. Dobson and Waterson (1999) and Chen (2003) have argued that
Wal-Mart possesses market power to countervail that of manufacturer, which drives down the
prices of the products purchased from suppliers. The supermarket chains of New England such
as Stop n’ Shop and IGA are too small to possess such power, resulting in a cost advantage for
Wal-Mart Supercenters. Private label products, alternatively, are produced through a form of
vertical integration and countervailing power plays less of a role in the process by which Wal-
Mart obtains its Great Value product line.
The margin between brands has been a frequently visited topic in the literature on
supermarket pricing (Bergès-Sennou, Bontems, and Réquillart, 2004). With Wal-Mart
Supercenters taking an increasing importance in food retailing, it becomes relevant to question
their effect on the national brand/private label margin. We can shed some light on this question.
According to our results, Supercenters have a greater price impact on national brands than on
private labels. Combining this result with the fact that national brands are more expensive than
private labels suggests that Supercenters have for effect to reduce the national brand/private label
margin in the supermarkets with which they compete.
Conclusion
Wal-Mart is introducing Supercenters at a fast pace in the United States, especially in regions
such as New England and California where Wal-Mart has a smaller presence. The projected
introduction of a Supercenter typically creates much controversy and debate concerning the
economic impacts of the new store. In this article, we examine one aspect of the impact of
introducing Supercenters, that is the effect on grocery prices. More specifically, we examine the
competitive effect of Wal-Mart Supercenters on prices at conventional supermarkets in New
20

England. This effect was examined for the six major supermarket departments (dairy, frozen
goods, health and beauty aids (HBA), meat, produce, and dry grocery) as well as both national
brand and private label goods. We also examine the extent to which Wal-Mart’s grocery prices
are lower than those at conventional supermarkets. Thus, this article sheds some light on the
pricing strategy of Wal-Mart Supercenters and the response of supermarkets when facing direct
competition from a Supercenter.
The primary findings of this study are as follows:
1) Wal-Mart Supercenters result in a decrease in grocery prices between six and seven percent
for national brand goods at conventional supermarkets competing within a radius of five
miles from the Supercenter. The associated decrease in the price of private label goods is
between three and seven percent. These findings are in line with those in the literature, more
specifically those of Hausman and Leibtag (2005) who found an indirect price effect of Wal-
Mart of five percent of consumer expenditure. Given that national brand goods are more
expensive, Supercenters lower the price margin between branded and unbranded goods.
2) The greatest impact of Wal-Mart Supercenters, in terms of price decreases, is in the grocery
and dairy departments for both national brands and private labels. Lower prices are also
observed for national brand produce, and private label HBA. Supercenters have no
statistically significant effect on goods in the frozen food department.
3) Taking into account market concentration, other demographic variables, and store
characteristics, Wal-Mart Supercenters price their national brand and private label products
significantly lower than conventional supermarkets. The estimated average price difference
between Supercenters and conventional supermarkets for national brand products ranges
from 17 to 23 percent for competing stores and comparison stores, respectively. The
21

corresponding differences for private labels are lower, ranging from 8 to 14 percent.
The greater overall competitive effect of Supercenters on national brand than on private label
prices may reflect a strategic effort by competing supermarkets to increase consumer traffic or
maintain customer loyalty. Dhar and Hoch (1997) found that a common strategy for
supermarkets to increase consumer traffic is to lower the price and improve promotions on
national brands as well as carry a greater number and assortment of national brands. In a region
such as New England, which is wealthy relative to the nation as a whole, consumer demand for
national brand products is high and this strategy may be particularly effective.
An average American family, with a total household income between $50,000 and $70,000,
spends $1,411 per person annually on food intended for at-home consumption.10 This range
encompasses many of the cities and towns sampled for this study, as well as much of New
England. According to our results, a family living within five miles of a Wal-Mart Supercenter
can expect to save between $44 and $97 per person annually by shopping exclusively at
conventional supermarkets located within a five-mile radius from a Supercenter, allowing for the
shopping basket to consist of some combination of national brand and private label products.11
The annual savings for consumers shopping entirely at Supercenters are larger. The size of
the savings depends on whether the alternative supermarket directly competes with a Supercenter
or not. Consumers living within five miles of Supercenters can achieve estimated annual savings
ranging from $113 to $241 per person annually, if they shop at Supercenters rather than at
competing supermarkets. Shoppers willing to travel from cities and towns without Supercenters
can save between $201 and $323 per person annually on grocery expenditures by shopping at
10 This value is from the 2001 ERS report Food Spending in American Households. The expenditure data used in the report are from 1997-1998, and the spending estimates are reported in 2004 dollars. 11 The savings figures are calculated based on the range of price decrease estimates reported in table 7. The percentage price differences between competing and comparison supermarkets range from 3.11 percent to 6.83 percent across national brands and private labels.
22

Supercenters relative to conventional supermarkets.
The controversies surrounding Wal-Mart beg the question “Is Wal-Mart good for the
economy?” This question can typically only be partially answered because so many economic
factors must be considered. Wal-Mart’s effects on customers, employees, competitors, and
distributors must all be taken into account. In this article, we focused on the retail price impact of
Supercenters. Based on our empirical results, we conclude that Wal-Mart Supercenters have a
positive welfare effect on price-sensitive consumers. Consumers who seek to purchase their
groceries as inexpensively as possible benefit from the presence of Supercenters.
The results presented in this article suggest possible avenues for further research. In addition
to the implications resulting from the regression analysis, the coefficient of variation (CV)
pattern in the price indexes show that for nearly all departments and for both national brand and
private label products, supermarkets competing with Supercenters have higher price variability
than those located further away from the nearest Supercenter. This finding may reflect a
reduction in the ability of supermarkets to coordinate promotional patterns. It may also reflect
the presence of non-price competitive strategies in addition to standard price-cutting strategy. In
fact, several of the competing supermarkets visited for data collection were recently renovated,
featuring amenities such as gas stations, salons, or coffee shops. The CV pattern calls for an
exploration of the strategies utilized by supermarkets when faced with competition from
Supercenters. In general, more research is needed on the short-run and long-run price and non-
price response of supermarkets to the entry of Wal-Mart Supercenters. Such research would
enable a better understanding of the profitability and viability of the supermarket industry in the
context of the rapid proliferation of Wal-Mart Supercenters.
23

REFERENCES
Adamy, J. (2005). Grocery Stores Cut Out Weekly Special. The Wall Street Journal. July 20, 2005: D1 Bergès-Sennou, F., P. Bontems, V. Réquillart (2004). "Economics of Private Labels: A Survey of Literature." Journal of Agricultural & Food Industrial Organization 2(3): 1-23. Bianco, A. and W. Zellner (October 6, 2003). Is Wal-Mart Too Powerful? [WWW document] http://www.businessweek.com/magazine/content/03_04/b3852001_mz001.htm. Business Week Online. Binkley, J. K. and J. M. Connor (1996). Market Competition and Metropolitan-Area Grocery Prices. Storrs, Connecticut, University of Connecticut. Regional Research Project NE-165, Report No. 44. Binkley, J. K. and J. M. Connor (1998). "Grocery Market Pricing and the New Competitive Environment." Journal of Retailing 74(2): 273-94. Capps, O. and J. M. Griffin (1998). "Effect of a Mass Merchandiser on Traditional Food Retailers." Journal of Food Distribution Research 29: 1-7. Chen, Z. (2003). "Dominant Retailers and the Countervailing-Power Hypothesis." RAND Journal of Economics 34(4): 612-25. Cotterill, R. W. (1986). "Market Power in the Retail Food Industry: Evidence from Vermont." The Review of Economics and Statistics 68(3): 379-86. Cotterill, R. W. (1999a). An Antitrust Economic Analysis of the Proposed Acquisition of Supermarkets General Holdings Corporation by Ahold Acquisition Inc. University of Connecticut, Food Marketing Policy Center, Research Report No. 46. Cotterill, R.W. (1999b) "Market Power and The Demsetz Quality Critique: An Evaluation for Food Retailing." Agribusiness 15(1): 101-118. Daykin, Tom (2006). "Wal-Mart Proposes Milwaukee Supercenter; Plans to Expand S. 27th Store Expected to Draw Opposition." Milwaukee Journal Sentinel, September 22, 2006, Section D Business, p.1. Dhar, S. K. and S. J. Hoch (1997). "Why Store Brand Penetration Varies by Retailer." Marketing Science 16(3): 208-27. Dobson, P. and M. Waterson (1999). "Retailer Power: Recent Developments and Policy Implications." Economic Policy 14(28): 133-64. Franklin, A. W. (2001). "The Impact of Wal-Mart Supercenters on Supermarket Concentration
24

in U.S. Metropolitan Areas." Agribusiness 17(1): 105-14. Hausman, J., E. Leibtag (2005). "Consumer Benefits from Increased Competition in Shopping Outlets: Measuring the Effect of Wal-Mart." National Bureau of Economic Research, Working Paper 11809. Hoch, S.J., K. Byung-Do, A.L. Montgomery, and P.E. Rossi, 1995. "Determinants of Store-Level Price Elasticity." Journal of Marketing Research, 32:17-29. Hudson, K. and G. McWilliams (2006). "Seeking Expansion in Urban Areas, Wal-Mart Stores Gets Cold Shoulder." Wall Street Journal, September 25, 2006, p. A1. Jones, E. (2004). Supermarket Pricing and Game Theory: The Presence of Wal-Mart. Paper presented at the AEAA annual meeting, Denver, CO, August 1-4. Khanna, N. and S. Tice (2000). "Strategic Responses of Incumbents to New Entry: The Effect of Ownership Structure, Capital Structure, and Focus." The Review of Financial Studies 13(3): 749-79. Lamm, R. M. (1981). "Prices and Concentration in the Food Retailing Industry." The Journal of Industrial Economics 30(1): 67-78. Marion, B. W., K. Heimforth, F. Bailey (1993). Strategic Groups, Competition, and Retail Food Prices. in: R. W. Cotterill, ed. Competitive Strategy Analysis in the Food System. Boulder and Oxford: Westview Press: 179-99. Mills, D. E. (1995). "Why Retailers Sell Private Labels." Journal of Economics & Management Strategy 4(3): 509-528. Progressive Grocer (2005) "Wal-Mart Tops Planet Retail's Global Grocers List." May 24, 2005. [WWW document] http://www.againstthewal.com/new_page_9.htm#Wal-Mart_Tops_Planet_Retails_Global_Grocers_List__ Vance, S. S. and R. V. Scott (1997). Wal-Mart: A History of Sam Walton's Retail Phenomenon, New York: Twayne Publishers. Wilke, J.R. (2004). "How Driving Prices Lower Can Violate Antitrust Statutes." Wall Street Journal, January 27, 2004, p. A1 and A11. Woo, B.-J., C. L. Huang, H. Epperson, D. Cude (2001). "Effect of a New Wal-Mart Supercenter on Local Retail Food Prices." Journal of Food Distribution Research 32: 173-80. Yu, C.-C. and J. M. Connor (2002). "The Price-Concentration Relationship in Retailing: Retesting Newmark." Agribusiness 18(4): 413-26. Zwiebach, E. (August 23, 2004). Shake-Up in California. The Supermarket News: 12, 15-19.
25

APPENDIX A: STORES SAMPLED AND THEIR CHARACTERISTICS
Store Type Location Population Median Household Income ($)
Store Size (sq. feet)
Wal-Mart Supercenter North Windham, CT
38,680 30,155 55,000
Super Stop n' Shop
Competing North Windham, CT
38,680 30,155 41,000
Super Stop n' Shop
Comparison Vernon-Rockville, CT
35,771 44,510 37,000
Wal-Mart Supercenter Westerly, RI 22,966 44,613 57,000 Super Stop n' Shop
Competing Westerly, RI 22,966 44,613 47,000
Super Stop n' Shop
Comparison Seekonk, MA 13,425 56,364 51,000
Wal-Mart Supercenter Jewett City, CT 3,053 45,826 63,000 Better Value IGA
Competing Jewett City, CT 3,053 45,826 22,000
Better Value IGA
Comparison Plainfield, CT 14,619 42,851 15,000
Wal-Mart Supercenter Ware, MA 9,707 36,875 55,000 Big Y Competing Ware, MA 9,707 36,875 29,000 Big Y Comparison Stafford Springs,
CT 11,307 52,699 35,000
Wal-Mart Supercenter Waterford, CT 19,152 56,047 66,000 Super Stop n' Shop
Competing Waterford, CT 19,152 56,047 50,000
Super Stop n' Shop
Comparison Fairhaven, MA 16,159 41,696 60,000
Wal-Mart Supercenter Raynham, MA 11,739 64,464 67,000 Super Stop n' Shop
Competing Raynham, MA 11,739 64,464 67,000
Stop n' Shop Comparison Attleboro, MA 42,068 50,807 60,000
26

APPENDIX B: THE MARKET BASKET OF PRODUCTS
Product Department Minimum
Price ($) Maximum Price ($)
Average Price ($)
Standard Deviation ($)
Coca-Cola 2-Liter Grocery 1.07 1.59 1.38 0.17 PL Cola 2-Liter Grocery 0.50 0.99 0.66 0.16 Maxwell House Coffee (13 oz.) Grocery 1.97 3.29 2.49 0.46 PL Coffee (13 oz.) Grocery 1.67 2.69 2.03 0.37 Bumble Bee Tuna (6 oz.) Grocery 1.12 1.59 1.38 0.17 PL Tuna (6 oz.) Grocery 0.88 1.39 1.17 0.16 Cheerios (15 oz.) Grocery 2.44 3.99 3.15 0.62 PL O-Shaped Cereal (15 oz.) Grocery 1.50 2.88 2.02 0.47 Lays Potato Chips (12 oz.) Grocery 1.99 2.99 2.66 0.48 PL Potato Chips (12 oz.) Grocery 1.47 1.99 1.77 0.25 Kraft Mac n’ Cheese (7.25 oz.) Grocery 0.66 1.39 0.97 0.19 PL Mac n’ Cheese (7.25 oz.) Grocery 0.33 0.60 0.44 0.10 Prego Pasta Sauce (26 oz.) Grocery 1.50 2.69 2.00 0.38 PL Pasta Sauce (26 oz.) Grocery 1.00 1.59 1.29 0.23 Jif Creamy Peanut Butter (28 oz.) Grocery 2.68 3.89 3.11 0.34 PL Creamy Peanut Butter (28 oz.) Grocery 2.12 2.89 2.49 0.25 Del Monte Sliced Peaches (15.25 oz.) Grocery 0.88 1.59 1.25 0.24 PL Sliced Peaches (15.25 oz.) Grocery 0.78 1.29 0.99 0.18 Nabisco Chips Ahoy (16 oz.) Grocery 2.50 4.15 3.21 0.59 PL Chocolate Chip Cookies (16 oz.) Grocery 0.78 2.99 1.92 0.88 Heinz Ketchup (24 oz.) Grocery 1.29 1.99 1.65 0.20 PL Ketchup (24 oz.) Grocery 0.78 1.39 1.07 0.19 Bisquik Pancake Mix (40 oz.) Grocery 2.23 3.19 2.72 0.35 PL Pancake Mix (40 oz.) Grocery 1.15 2.49 1.79 0.45 Hood Milk 1% Milk (gallon) Dairy 2.96 4.15 3.51 0.44 PL 1% Milk (gallon) Dairy 2.37 3.75 2.94 0.47 Kraft American Singles (16 ct.) Dairy 1.97 3.99 2.87 0.85 PL American Singles (16 ct.) Dairy 1.77 3.35 2.47 0.65 Land o’ Lakes Butter (1 lb.) Dairy 3.24 4.77 4.03 0.67 PL Butter (1 lb.) Dairy 2.50 3.99 3.08 0.55 Breyers Vanilla Ice Cream (1/2 gal.) Frozen 3.24 6.57 4.70 1.08 PL Vanilla Ice Cream (1/2 gal.) Frozen 2.50 5.49 3.41 1.02 Eggo Homestyle Waffles (10 ct.) Frozen 1.50 2.37 1.85 0.32 PL Homestyle Waffles (10 ct.) Frozen 1.00 1.99 1.28 0.35 Birdseye Frozen Broccoli (10 oz.) Frozen 0.73 1.89 1.14 0.34 PL Frozen Broccoli (10 oz.) Frozen 0.59 1.19 0.89 0.20 Q-Tips Cotton Swabs (500 ct.) HBA 2.95 3.99 3.57 0.47 PL Cotton Swabs (500 ct.) HBA 1.88 3.49 2.73 0.66 Dial Anti-Bacterial Soap (3 ct.) HBA 1.62 2.65 2.06 0.32 PL Anti-Bacterial Soap (3 ct.) HBA 1.47 1.99 1.58 0.19 Edge Shaving Gel (7 oz.) HBA 1.78 3.89 2.65 0.50 PL Shaving Gel (7 oz.) HBA 1.14 3.59 1.92 0.74 Purdue Chicken Drumsticks (1 lb.) Meat 0.59 2.29 1.62 0.58 PL Chicken Drumsticks (1 lb.) Meat 0.59 2.29 1.29 0.43 Perri Italian Sausage (1 lb.) Meat 2.38 3.99 3.40 0.78
27

The basket of goods, continued PL Italian Sausage (1 lb.) Meat 2.22 4.59 2.96 0.64 Oscar Meyer Bacon (1 lb.) Meat 4.87 5.49 4.98 0.14 PL Bacon (1 lb.) Meat 1.98 4.99 3.29 0.61 Perfect Orchard Red Delicious Apples (1 lb.)
Produce 2.44 3.99 3.38 0.64
Russet Red Potatoes (1 lb.) Produce 0.66 1.69 1.24 0.30 Bolthouse Farms Carrots (1 lb.) Produce 0.58 1.99 0.83 0.47 Foxy Lettuce Head (head) Produce 0.78 1.99 1.30 0.41 Chiquita Bananas (1 lb.) Produce 0.38 0.69 0.55 0.11 Foxy Celery (1 lb.) Produce 1.24 2.21 1.57 0.33
28