Embed Size (px)
Citation preview

Analyst
PAPER
Cite this: Analyst, 2016, 141, 4130
Received 12th February 2016,Accepted 19th April 2016
DOI: 10.1039/c6an00359a
www.rsc.org/analyst
The effect of thermal processing on the behaviourof peanut allergen peptide targets used in multiplereaction monitoring mass spectrometryexperiments†
R. L. Sayers,*a P. E. Johnson,‡a J. T. Marsh,‡a P. Barran,b H. Brownc and E. N. C. Millsa
Mass spectrometry-based methods offer an alternative means of determining allergens in foods. Whilst
targeted methods are likely to offer the most robust approach for detection and quantification, little is
known about how food processing may affect the behaviour of peptide targets. A systematic study has
been undertaken to investigate the effects of thermal processing (boiling, roasting, frying) on the behav-
iour of a suite of peanut peptide targets representing the major clinically-relevant allergens. Initially the
effect of thermal processing on protein extractability was investigated and a mass spectrometry-compati-
ble buffer identified comprising 50 mM Tris-HCl, pH 8.8 containing 50 mM dithiothreitol and 0.04% (w/v)
acid labile detergent which was able to extract 45–100% of protein from raw, boiled, roasted and fried
peanuts using sonication at 60 °C. Eight peptide targets were identified including two peptides from each
cupin allergen, Ara h1 and Ara h3 and four peptides from the prolamin superfamily allergens Ara h2, 6 and
7. AQUA peptide standards were synthesised and used to undertake multiple-reaction monitoring experi-
ments, giving assay sensitivities of 0.1–30 amoles of peptide on-column (3 : 1 signal : noise), calculated
limits of quantification between 96–1343 amoles of peptide on-column and a linear dynamic range of
4–5 orders of magnitude. Absolute quantification of individual peanut allergens in thermally processed
samples showed that peptide targets in the cupin allergens were more prone to processing-induced
effects than those from Ara h2, 6 and 7. Targets flanked by arginine residues showed greater thermostabil-
ity. Identification of processing-stable targets, coupled with more efficient extraction procedures and a
wide dynamic range, shows that targeted mass spectrometry methods have great potential as an
additional method for quantifying peanut allergens in complex food matrices.
Introduction
IgE mediated food allergies have been estimated to affectaround 1–2% of adults and between 5–6% of infants andyoung children.1 At present there is no accepted cure for foodallergy and hence allergic individuals have to practice foodavoidance, usually life-long. Those at risk of a severe reactionare given rescue medication, often in the form of self-adminis-
tered adrenaline. In order to help support food allergic consu-mers avoid their problem food, labelling legislation has beenenacted around the world which requires a list of priority aller-genic foods to be labelled, irrespective of the level at whichthey might be included in a recipe. In the European Unionthis is enshrined in the Food Information for Consumers regu-lation EC/1169/2011 which lists 14 allergenic foods that mustbe labelled on pre-packaged and loose products (includingcatered foods).2 However, this legislation does not address theissues of cross-contact allergens, where traces of allergenicingredients may find their way into non-allergenic food pro-ducts through, for example, the use of common food proces-sing lines or where cleaning processes cannot guarantee anallergen-free environment. Dose distribution modelling usingthreshold dose challenges in food allergic subjects has indi-cated that consumption of residual allergen of around3–30 mg protein for most allergenic foods, apart from shrimp,is sufficient to cause a reaction in around 10% of the foodallergic population.3–6 Concerns over the hazard posed by such
†Electronic supplementary information (ESI) available. See DOI: 10.1039/c6an00359a‡Current address: The Food Allergy Research and Resource Programme,The University of Nebraska, Lincoln, USA.
aInstitute of Inflammation and Repair, Manchester Academic Health Science Centre,
Manchester Institute of Biotechnology, The University of Manchester, UK.
E-mail: [email protected] of Chemistry, Michael Barber Centre, Manchester Institute of Biotechnology,
The University of Manchester, UKcCampden BRI (Chipping Campden) Limited - part of the Campden BRI group,
Chipping Campden, Gloucestershire, UK
4130 | Analyst, 2016, 141, 4130–4141 This journal is © The Royal Society of Chemistry 2016
Ope
n A
cces
s A
rtic
le. P
ublis
hed
on 1
9 A
pril
2016
. Dow
nloa
ded
on 1
/3/2
022
2:53
:22
AM
. T
his
artic
le is
lice
nsed
und
er a
Cre
ativ
e C
omm
ons
Attr
ibut
ion
3.0
Unp
orte
d L
icen
ce.
View Article OnlineView Journal | View Issue
traces have led to the use of precautionary labelling (PAL) towarn allergic consumers of the potential presence of aller-gens.7 However, recent surveys have indicated that PAL givesno clear indication of likely presence of allergen.8 This workrelied on immunoassay test kits to provide data on the pres-ence and quantity of allergens but a recent ring trial for analy-sis of egg and milk showed significant short comings in thetechnology with regards quantification4,9 Although assay sensi-tivities as low as 1 ppm have been reported, accurate quantifi-cation at such low levels remains a challenge.10 Foodprocessing adversely affects detection of allergens partly byreducing their solubility in the simple buffers compatible withimmunoassays, resulting in under-estimation of allergencontent and false negative test results.11–14 The changes inthree-dimensional structure induced by processing can alsoreduce recognition by the antibody preparations used inimmunoassays, leading to falsely declared allergen-freefoods.4,14 Such effects can be compounded by covalent modifi-cations, notably sugars, through the formation of Maillardreaction products. Mass spectrometry (MS) based methodshave the potential to address these short comings, providingan alternative and complementary approach to immunologicalassays.9,12 The technique can be compatible with extractionmethods that employ denaturants, detergents, and sonication,to aid recovery from processed food products and thereforeimprove quantification.13,15 However, the inclusion of deter-gents can necessitate additional clean-up steps makingmethods more difficult to use in routine analysis and Maillardadducts can reduce their susceptibility to the proteolytic pro-cesses employed in proteomic workflows.16,17
One of the most prevalent allergies in the UK is peanut,which is estimated to affect around 2% of children and acci-dental consumption has been known to cause fatalities.18–21
Of the 17 peanut allergens listed in the IUIS allergen databasethe most clinically important are the 2S albumins Ara h2 and6, which belong to the prolamin superfamily.22–24 They com-prise a conserved pattern of cysteine residues and adopt acompact α-helical bundle disulphide-bonded structure whichmakes them stable to thermal treatment and digestion. IgEresponses towards these proteins are an important marker ofclinical reactivity to peanut. The other clinically importantallergens belong to the cupin superfamily, and comprise the seedstorage globulins Ara h1, a 7S vicilin-type globulin and Ara h3, an11S legumin-type globulin. These proteins share a common stableβ-barrel structure and form large aggregates on heating.
Since these proteins represent the main allergenic hazardin peanuts, they are the target analytes of choice for any MS-based method. Peptides selected from these allergens need tobe peanut-specific and resistant to food processing inducedmodifications. This is because peanuts are rarely consumedraw, usually undergoing some form of thermal processingmost commonly roasting or frying, whilst boiling may reduceallergenicity of peanuts.25 Several targeted approaches usingliquid chromatogram electrospray ionisation (LC/ESI) MS/MSmethods with triple quadrapole mass analyser for determi-nation of peanut have been described with limits of detection
of 4–10 ppm of peanut in simple food matrices.26–28 Howeverto date, there has been no systematic study on the impact offood processing on either the efficiency of MS-compatibleextraction procedures, or on peptide targets used in MSmethods. Therefore, we have investigated the effect of boilingroasting and frying on the extraction of proteins from peanutsand their allergen profiles determined by targeted MS analysisusing stable isotope dilution multiple-reaction monitoring(SID-MRM) MS.
Materials and methodsMaterials
All reagents and chemicals were of analytical grade unlessotherwise stated. HPLC grade acetonitrile and water, urea,thiourea and tris(hydroxymethyl)aminomethane, were pur-chased from Fisher Scientific UK Ltd (Loughborough, UK).Iodoacetamide, dithiothreitol (DTT), proteomic-grade trypsin,formic acid and 3-[(3-cholamidopropyl)dimethylammonio]-2-hydroxy-1-propanesulfonate (CHAPS) were purchased fromSigma (Poole, Dorset, UK). RapiGest™ (Sodium 3-[(2-methyl-2-undecyl-1,3-dioxolan-4-yl)methoxy]-1-propanesulfonate) wasthe gift of Dr Lee Gethings (Waters Corporation, Wilmslow,UK). 2D Quant-Kit™ was obtained from GE Healthcare(Buckinghamshire, UK). Isotopologues of the target peptidesequences were synthesised with either 13C(6)15N(4) C-term Ror 13(C)15N(2) C-term K by JPT Peptide Technologies GmbH(Berlin, Germany). Peptides were produced with trifluroaceticacid as a counter ion, target mass confirmed by LC-MS andpurity confirmed as >95% by HPLC.
Peanut samples
Peanuts (var. Runner) were the kind gift of Dr Sue O’Hagan(PepsiCo, Leicester, UK) and included raw samples with skinsintact (raw 1), mechanically blanched (raw 2) and oil-fried(152 °C for 400 seconds) peanuts. Lightly roasted mechanicallydefatted peanut flour manufactured by the Golden PeanutCompany (GPC), LLC, Alpharetta, GA 30022, USA was obtainedfrom Byrd Mill (Byrd Mill Co., Ashland, VA 23005, USA).Peanuts (raw 1) were peeled and 10 g batches either boiled(0.5, 1, 2, 4 or 6 h, under reflux) or roasted in a domestic fan-assisted oven (15 min at 150, 160, 170 or 180 °C). Peanuts andpeanut products were ground using a pestle and mortar anddefatted by addition of hexane (1 : 10, w/v), once for 3 h andthen repeated overnight. The total protein content of defattedsamples was determined by Kjeldahl using the Dumas com-bustion method and a Nitrogen conversion factor of 5.46.29
Protein extraction
Protein extractability was assessed using five different buffers:(1) 0.01 M phosphate buffered saline (PBS), pH 7.4;(2) 50 mM Tris-HCl, pH 8.8;(3) 50 mM Tris-HCl, pH 8.8 containing 50 mM DTT;(4) 50 mM Tris-HCl, pH 8.8 containing 50 mM DTT with
0.04% (w/v) RapiGest™;
Analyst Paper
This journal is © The Royal Society of Chemistry 2016 Analyst, 2016, 141, 4130–4141 | 4131
Ope
n A
cces
s A
rtic
le. P
ublis
hed
on 1
9 A
pril
2016
. Dow
nloa
ded
on 1
/3/2
022
2:53
:22
AM
. T
his
artic
le is
lice
nsed
und
er a
Cre
ativ
e C
omm
ons
Attr
ibut
ion
3.0
Unp
orte
d L
icen
ce.
View Article Online

(5) Chaotropic zwitterionic buffer, pH 8.8 (7 M urea, 2 Mthiourea, 2% (w/v) CHAPS, 1% (w/v) DTT).
Peanut samples were extracted in triplicate using either20 mg of sample in 1 ml of buffers (1–3) and (5), or 5 mg in250 μl of buffer (4). Extractions were performed either using aStuart SB3 rotator (Bibby Scientific Ltd, Staffordshire, UK) for1 h at 19–21 °C for buffers (1) and (2), or for 15 min at 60 °C inan ultrasonic bath for buffers (3)–(5). Samples were clarified bycentrifugation (10 000g, 20 °C, 10 min), the supernatantsremoved and stored at −20 °C until required. Extracted proteinwas quantified using a 2D Quant-Kit™ (GE Healthcare LifeSciences, Buckinghamshire, UK), which can determine proteinin the presence of interfering substances such as detergentsand reducing agents, using bovine serum albumin (BSA) as thestandard. The extraction efficiency was calculated as theamount of extracted protein relative to the total protein in thedefatted peanut samples.
Sample preparation for MS analyses
Extracts for untargeted MS analysis were prepared using buffer(5). The extracted protein was then precipitated using precipi-tants in 2D Quant-Kit™ and re-solubilised in 50 mM Tris-HCl,pH 8.8 containing 50 mM DTT and 0.04% (w/v) RapiGest™.Extracts for targeted MS analysis were prepared using buffer(4). Samples were then diluted to 1 mg protein per mL with50 mM ammonium bicarbonate prior to addition of fresh50 mM DTT to give a final concentration of 5 mM DTT andheated to 80 °C for 10 min. Proteins were then alkylated byaddition of 150 mM idoacetamide to give a final concentrationof 15 mM and incubated for 30 min in the dark at (19–21 °C).Subsequently proteins were digested by addition of trypsin(0.1 mg mL−1, 1 : 10 (w/w)) (≥10 000 benzoyl arginine ethylester (BAEE) units per mg protein) for 3 h at 37 °C and after asecond addition of trypsin (0.1 mg mL−1) and incubated for15 h at 31 °C. The resulting digests were passed through spincolumn (Pierce™ C-18 spin columns, Thermo Fisher Scientific,
UK.), and allowed to dry by air before being re-suspendedbuffer a (0.1% (v/v) formic acid in HPLC grade water), andstored at −20 °C.
Untargeted MS analysis
Untargeted data acquisition was carried out by the BiologicalMass Spectrometry Facility of the University of Manchester.Briefly two samples of raw peanut were separated using a gra-dient from 92% A (0.1% (v/v) formic acid in HPLC grade water)and 8% B (0.1% (v/v) formic acid in HPLC grade acetonitrile)to 33% B, in 44 min at 300 nL min−1, using a 250 μm × 75 mmi.d. 1.7 μM BEH C18, analytical column (Waters). Samples wereanalysed in singlet by LC-MS/MS using an UltiMate® 3000Rapid Separation LC (RSLC, Dionex Corporation, Sunnyvale,CA) coupled to an Orbitrap Elite (Thermo Fisher Scientific,Waltham, MA) mass spectrometer (tune parameters inTable S-1†). Peptides were selected for fragmentation automati-cally by data dependant analysis; +2 or +3 precursor ions andpreviously observed ions were excluded from fragmentation fora 30 minute period. Raw data was analysed using PEAKS™version_6 (Bioinformatics Solutions Inc., Waterloo, Ontario,Canada), and protein identification performed using a data-base of curated peanut sequences from UniProt (08.07.2015).
Targeted MRM experiments
Data acquisition. A Skyline method was derived from thetarget peptide sequences in Table 1. using a curated databasecontaining all available peanut sequences in UniProt (http://www.uniprot.org/) as a background proteome (proteinsequences, n = 1131).30 Fixed modifications were set ascarbamidomethylation of cysteine and for synthetic peptides,isotopically labelled C-terminal lysine or arginine. A minimumof 3 MRM transitions were selected for each peptide, eachcorresponding to precursor ions with a 2+ charge paired withthe resulting y fragment ions (Table S-2†).
Table 1 Characteristics of allergens and associated peptide targets selected for MRM development. Peptides have been named according to theirposition within the amino acid sequence of the major isoforms identified in purified proteins including the signal peptide and the molecular weightshave been given as the mature protein (the signal peptide and post-translationally processed peptides removed), using an exemplar sequence
Proteinfamily Allergen
UniProtID
Subunit Mr(kDa)
Peptide targetresidues
Peptide targetsequence
Peptide targetname
Previousidentification
Cupins 7S vicillin-globulin
Ara h1 P43237 61.72 329–342 VLLEENAGGEQEER Arah1(P43237)329–342
29, 32, 33
555–577 DLAFPGSGEQVEK Arah1(P43237)555–577
29, 32, 34, 35
11S legumin-globulin
Ara h3 Q647H4 59.64 25–41 QQPEENACQFQR Arah3(Q647H4)25–41
32
372–384 SPDIYNPQAGSLK Arah3(Q647H4)372–384
27, 32, 34,36–39, 40
Prolamins 2S albumins Ara h2 Q6PSU2 17.99 103–115 CCNELNEFENNQR Arah2(Q6PSU2)103–115
14, 32, 36,40
147–155 NLPQQCGLR Arah2(Q6PSU2)147–155
32,40
Ara h6 Q647G9 14.85 136–144 CDLDVSGGR Arah6(Q647G9)136–144
None
Ara h7 B4XID4 17.38 143–151 NLPQNCGFR Arah7(B4XID4)143–151
None
Paper Analyst
4132 | Analyst, 2016, 141, 4130–4141 This journal is © The Royal Society of Chemistry 2016
Ope
n A
cces
s A
rtic
le. P
ublis
hed
on 1
9 A
pril
2016
. Dow
nloa
ded
on 1
/3/2
022
2:53
:22
AM
. T
his
artic
le is
lice
nsed
und
er a
Cre
ativ
e C
omm
ons
Attr
ibut
ion
3.0
Unp
orte
d L
icen
ce.
View Article Online

A stock solution, containing 1 mM of each labelled peptide,was used to prepare serial dilutions from 100 and 33.3 nM,1 : 10 (v/v) in 0.1% (v/v) formic acid in HPLC grade-water andanalysed using 6 replicate injections. A second series ofdilutions was prepared in a reduced, alkylated and trypsindigested peanut protein extract (1 : 10 (v/v) roasted peanutflour protein extract in 0.1% (v/v) formic acid in HPLC grade-water) and analysed using 3 replicate injections. Peanutsamples were diluted 1 : 20 (v/v) in 0.1% (v/v) formic acid inHPLC grade-water and spiked with stable isotope mix to give afinal concentration of 5 nM, equivalent to 15 fmoles of eachpeptide loaded onto the column.
Samples were randomised and analysed using 3 replicateinjections with a blank sample included every 5 injections.Every tenth samples was an extract prepared from the lightlyroasted mechanically defatted peanut flour and was includedas a quality control sample to check instrument base-linevariability. Samples were analysed on a Waters nanoACQUITY®Ultra Performance LC™ (Waters, Milford, MA, USA) interfacedto a Thermo Scientific TSQ Vantage triple stage quadrupoleMass Spectrometer (Thermo Fisher Scientific, Warrington,UK). Three microliters of each sample was loaded onto ananalytical reverse-phase C18 column (75 μm × 15 cm) with1.8 μm ACQUITY UPLC HSS (High Strength Silica) T3 particlepacking (Waters, Milford, MA, USA) heated to 40 °C and equili-brated in 98% 0.1% formic acid in HPLC-grade water (bufferA) and 2% 0.1% formic acid in acetonitrile (buffer B). At a flowrate of 250 nL−1, the gradient was ramped from 2 to 23% (v/v)B in 5 min and then to 45% (v/v) B in 30 min followed bycolumn rise at 90% (v/v) B. The mass spectrometer was oper-ated in positive ESI mode using a NSI ion source, peak widthset to 0.70 FWHM in Q1 and Q3 with auto selected dwell time<0.05 ms. over a spectral acquisition time of 35 min. Targetedanalysis was performed using the list of predetermined tran-sitions and collision energies generated by Skyline.
Data analysis
Statistical analyses. All statistical analyses, including 2-wayANOVA and pairwise t-tests, were performed using GraphPadPrism version 6.05 for Windows, GraphPad Software, SanDiego California USA, http://www.graphpad.com.
Stable isotopic dilutions (SID). The raw data files wereimported into Skyline and ion chromatograms examined visu-ally for each peptide at each concentration to assess the dataquality and check peak selection. The analytical response ofeach peptide was determined by the measured ion intensityfor 3 monitored transitions during the associated chromato-gramic retention time. Mean response values and standarddeviations (SD) values were calculated from peak integration ofthe resulting ion chromatograms and calibration curves con-structed from log-transformed data using GraphPad Prism.The linear range of detection was determined for each SIDseries and linear regression analysis performed using least-square fitting. The lowest limit of detection (LLOD) was evalu-ated by visual inspection of the XIC using a signal to noiseratio (S/N) of 3 : 1. The LLOD required a minimum of 2 tran-
sitions to be visible above the noise for reliable detection.Using the linear regression analyses performed on SID inextract, limits of detection (LOD) and quantification (LOQ)were calculated using the calibration plot method (eqn(S-1)†).51
Sample analysis. No adjustments were deemed necessarybecause the contribution of unlabelled peptide present instandards was found to be negligible at the level used forspike. The peak areas corresponding to the total ion intensityfor each target peptide in each of the peanut samples were nor-malised to the heavy label spike which remained at a constantconcentration. Resulting peak area ratios (light to heavy) wereexported and measurements converted to intensity beforeinterpolation from linear regression analysis using GraphPadPrism. Resulting values were given in molar amounts, whichwere then converted to amount of protein using matureprotein molecular weight of a representative isoform(Table S-4†).40 This calculation assumes that peptide andprotein are in a molar equivalent ratio.
Results and discussionEffect of thermal processing on protein solubility
The defatted raw peanut samples comprised 43–45% (w/w) wetweight protein (Table S-3†) with the mechanically blanchedpeanuts (raw 2) containing slightly less protein than the handpeeled peanuts (raw 1) although both were within the rangenormally expected for peanuts. Boiling reduced the proteincontent to about 25% (w/w) as a consequence of progressiveleaching into the cooking water, and increased the moisturecontent of the seeds. In contrast moisture was lost duringroasting causing a slight increase in protein content at temp-eratures above 160 °C. It is also possible that extensive boilingand roasting conditions chemically modified the protein andaffected the nitrogen determination further contributing tothese changes.
Protein extractability from the raw peanut samples wasbroadly similar, irrespective of the buffer and extraction con-ditions employed (Fig. 1 and Table S-3†). However, processingreduced protein extractability using simple buffers and gentleextraction conditions (buffers 1 and 2). Buffer 1 was inefficientat solubilising protein from processed peanuts, extracting only1–14% of the protein from all samples. Whilst protein extrac-tion by buffer 2 was less affected by processing, it was stillreduced by ∼50% after 30 min boiling, and by an additional∼25% after 1 h boiling. After this time no further reduction inextractability was observed even after 6 h boiling. Extraction bybuffer 2 was also reduced by ∼50% following roasting at150 °C, and decreased progressively with roasting temperatureto only 13% at 180 °C. Protein extractability from the roastedpeanut flour and fried peanuts was similar, with ∼50% of thetotal protein being extracted by buffer 2. The addition of redu-cing agents to buffer 2 and use of sonication at elevated temp-eratures (buffer 3) did not generally enhance proteinextractability but had the advantage of reducing extraction
Analyst Paper
This journal is © The Royal Society of Chemistry 2016 Analyst, 2016, 141, 4130–4141 | 4133
Ope
n A
cces
s A
rtic
le. P
ublis
hed
on 1
9 A
pril
2016
. Dow
nloa
ded
on 1
/3/2
022
2:53
:22
AM
. T
his
artic
le is
lice
nsed
und
er a
Cre
ativ
e C
omm
ons
Attr
ibut
ion
3.0
Unp
orte
d L
icen
ce.
View Article Online

time. The addition of an acid labile anionic detergent, Rapi-Gest™, (buffer 4) greatly improved the extractability of theprotein from the severely heat treated peanut samplesalthough it was still reduced to less than 50% for the exten-sively boiled peanuts and those roasted at 180 °C. The chaotro-pic buffer (buffer 5) was the most efficient buffer and whilstprotein extractability was reduced to 75% after 1 h boiling itthen increased to >100% after prolonged boiling times. In con-trast, protein extractability with buffer 5 was reduced as a func-tion of roasting temperature to ∼50% after roasting at 180 °Cfor 15 min. The over estimation in protein observed in certainsamples is likely to be a result of using a mammalian protein,BSA, as a standard. BSA has a significantly different aminoacid composition to plant proteins and will give a differentresponse in the copper reaction that is used in the 2D Quant-Kit™. This maybe further compounded by thermally inducedmodifications to the peanut proteins affecting responsivenessin the assay.
An overall comparison of protein extractability using thefive different buffer conditions (Fig. 2) showed that the use ofa shorter extraction time (15 min) combined with the use ofsonication and inclusion of a reducing agent (buffer 3) gaveequivalent protein extraction to a more gentle extractionundertaken over 1 h (buffer 2). The addition of an acid labiledetergent (buffer 4) enhanced extraction and was found to bestatistically significant using a 2-way ANOVA with Sidak’s mul-tiple comparison test, for all except the raw samples and thelightly roasted mechanically defatted commercial flour. Extrac-tion of raw peanuts was optimal without the need for additionof reducing agents, detergent or chaotropes. The lack of effecton protein extractability from the roasted peanut flour whenan acid labile detergent was included may be due to its fine
particle size. The most effective buffer for solubilising highlyprocessed samples was the chaotropic buffer 5. However, asthis is not compatible with MS analysis and in order to mini-mise clean-up steps, which may introduce additional errors inquantitation, buffer 4 was chosen for targeted MS analysis.
Peptide target selection and verification
A suite of eight peptide targets was identified from the majorallergen families in peanut using an informatics pipeline(Fig. S-1†). A curated list of non-redundant peanut allergen
Fig. 1 Effect of thermal processing conditions on extractability of peanut proteins using five different buffer conditions. The extraction efficiencywas calculated as the amount of protein extracted (mg) determined by the 2D Quant-Kit™ divided by the amount of protein present in the defattedpeanut flour (mg) calculated from the protein Nitrogen content determined using the Kjeldahl method. Results are displayed as mean value anderror bars corresponding to the SD over 3 replicate samples. Buffers were as follows: (1) 0.01 M Phosphate Buffered Saline (PBS), pH 7.4; (2) 50 mMTris-HCl, pH 8.8; (3) 50 mM Tris-HCl, pH 8.8, 50 mM DTT; (4) 50 mM Tris-HCl, pH 8.8, 50 mM DTT with 0.04% (w/v) RapiGest™; (5) Chaotropiczwitterionic buffer, pH 8.8 (7 M urea, 2 M thiourea, 2% (w/v) CHAPS, 1% (w/v) DTT). Com. Flour – commercially available lightly roasted mechanicallydefatted peanut flour.
Fig. 2 Box-whisper plots showing the comparison of different buffersfor extraction of protein from thermally processed peanuts. The boxrepresents the 25th to 75th percentiles with whiskers extending fromthe smallest to largest values and a line at the median. All extractionswere performed in triplicate. Buffers were as follows: (1) 0.01 M Phos-phate Buffered Saline (PBS), pH 7.4; (2) 50 mM Tris-HCl, pH 8.8;(3) 50 mM Tris-HCl, pH 8.8, 50 mM DTT; (4) 50 mM Tris-HCl, pH 8.8,50 mM DTT with 0.04% (w/v) RapiGest™; (5) chaotropic zwitterionicbuffer, pH 8.8 (7 M urea, 2 M thiourea, 2% (w/v) CHAPS, 1% (w/v) DTT).
Paper Analyst
4134 | Analyst, 2016, 141, 4130–4141 This journal is © The Royal Society of Chemistry 2016
Ope
n A
cces
s A
rtic
le. P
ublis
hed
on 1
9 A
pril
2016
. Dow
nloa
ded
on 1
/3/2
022
2:53
:22
AM
. T
his
artic
le is
lice
nsed
und
er a
Cre
ativ
e C
omm
ons
Attr
ibut
ion
3.0
Unp
orte
d L
icen
ce.
View Article Online

sequences from Ara h1, 3, 2, 6 and 7 was first interrogatedusing CONSeQuence, a machine learning algorithm whichtakes account of factors such as charge and hydrophobicity.41
A second analysis of peptide secondary structure and candi-date peptides was performed using MCPRED, an algorithmthat assesses the likelihood of having missed cleavages.42 Thelist of candidates was then assessed for uniqueness by under-taking BLAST searching against UNIPROT. Peptide candidateslonger than 20 residues were excluded. Peptides containingmethionine or tryptophan were avoided and preference wasgiven to those flanked by arginine residues rather than lysinein an effort to minimise processing-induced modifications.The final candidate list was then assessed using data fromuntargeted MS analysis of raw peanut samples to ensure thepresence and abundance of peptides in raw peanut samples(Table S-4†). Six of the peptide targets selected for the mainpeanut allergens Ara h1, 2 and 3 had previously been identi-fied as MRM candidates with two additional peptides identi-fied from prolamin proteins Ara h6 and 7 (Table 1 andFig. S-2†). Peptides were mapped on to the 3D structures avail-able for the cupin allergens, Ara h1, and Ara h3 together withthe prolamin superfamily allergen Ara h6.
Ara h1: when synthesised in the seed Ara h1 contains a pre-cursor which is then post translationally cleaved generatingragged N-termini, two of which dominate and are arrowed inFig. 3A.16 Ara h1 exists as a homotrimer, each monomer held
together by hydrophobic interactions and usually glycosy-lated.43 Within each monomer the N-terminal and C-terminalmodules both contain a β-barrel core domain. The target pep-tides are located on opposite extended loop domains at themonomer–monomer contact during trimer formation(Fig. 3B). This is also the strategic location for IgE epitopes asit may provide some protection from digestion.44 Ara h1(P43237)329–342 is known to overlap an immunologically activeepitope EQEERGQRRW and Ara h1(P43237)555–577 overlaps twodifferent immunologically active epitopes IDQIEKQAKD andKDLAFPGSGE.45 Ara h1(P43237)329–342 has been cited in theliterature and is flanked by arginine residues making it lesssusceptible to Maillard modifications.31,32 A second peptideAra h1(P43237)329–342, has previously been identified as apeptide target.26,28,31,33,34 This peptide is flanked by lysine resi-dues and is therefore less robust to processing-induced modifi-cations. Mueller et al. detected the Maillard reaction productspyrraline and carboxymethyllysine (CML). Ara h1(P43237)329–342 is located in a flexible region of the proteinwhich was not fully resolved in the crystal structure.
Ara h3: Ara h3 is a multigenic protein, which undergoesposttranslational processing to yield an acidic a basic subunitcovalently linked by an intermolecular disulphide bondforming each monomer (Fig. S-4†).46 The monomers assembleinto heterotrimers, which in the mature protein associate toform a hexamer.47 Peptide Ara h3(Q647H4)25–41 has only been
Fig. 3 Peptide targets for Ara h1 were mapped on to the protein sequence (A) and its 3D structure (B). (A) Ara h1 isoform sequence P43237(UniProt) is shown with the signal peptide sequence in italics, possible mature N-termini underlined and glycosylation site in green. Target peptidesAra h1(P43237)329–342 and Ara h1(P43237)555–577 are shown in red and blue respectively (B) 3D structure of Ara h1 showing (i) Ara h1 trimer (DOI:10.2210/pdb3smh/pdb), coloured by monomer and (ii) Ara h1 monomer with target peptides Ara h1(P43237)329–342 and Ara h1(P43237)555–577
marked in red and blue respectively. Cartoons show van der Waal’s space-filling at 60 or 80% transparency and cartoon structures modelled usingthe PyMOL Molecular Graphics System, Version 1.5.0.4 Schrödinger, LLC.
Analyst Paper
This journal is © The Royal Society of Chemistry 2016 Analyst, 2016, 141, 4130–4141 | 4135
Ope
n A
cces
s A
rtic
le. P
ublis
hed
on 1
9 A
pril
2016
. Dow
nloa
ded
on 1
/3/2
022
2:53
:22
AM
. T
his
artic
le is
lice
nsed
und
er a
Cre
ativ
e C
omm
ons
Attr
ibut
ion
3.0
Unp
orte
d L
icen
ce.
View Article Online
mentioned previously by Chassaigne et al. but was chosen as arepresentative peptide from the acidic subunit and is flankedby arginine residues. The second peptide Ara h3(Q647H4)372–384 has been published in several literary sourcesbut has an N-terminal lysine that is more likely to becomemodified.13,26,35–39 Hebling et al. have previously identifiedMaillard modifications of lysine, CML and pyrraline, in therelated peptide SPDIYNPQAGSLKTANDLNLLILR.
Ara h2, 6 and 7: the 2S-albumins allergens Ara h2 and 6share a high degree of sequence homology (59%) and havebeen shown to be potent allergens.48,49 These allergens share acommon 3D structure cross-linked by intramolecular disul-phide bonds which cause them to be both thermally stableand resistant to digestion. The 3D structure has only beendetermined for Ara h6 (Fig. S-5†) and shows the target Ara h6peptide sequence, which is flanked by arginine residues andlies on flexible loop regions of the protein, outside the pro-tease resistant core. Both Ara h2 peptide targets Ara h2(Q6PSU2)103–115 and Ara h2(Q6PSU2)147–155 have been pre-viously described as peptide targets.13,31,35,38,39,50 Ara h6(Q647G9)136–144 and Ara h7(B4XID4)143–151 are both novelpeptide targets and are flanked by arginine residues.
Development of multiple-reaction monitoring (MRM)experiments for peanut allergens
A 12 point SID series of the synthesised AQUA peptides wasused to generate standard curves for each target in eitherbuffer or in reduced, alkylated and digested roasted peanutflour extract (buffer 4) in order to assess matrix interference.Transitions are listed in Table S-2.† Peak areas correspondingto the total ion intensities, for 3 transitions, were used whenconstructing calibration curves and calculating LOD and LOQvalues. The ratio between the 3 monitored transitionsremained constant across the processed samples with <20%variation. Concentration values were adjusted using the theore-tical peptide content calculated by adjusting the dry weight toaccount for the contribution of counter-ions and calculatingthe percentage purity of target in the peptide content from thepeak area in the HPLC trace. Corrected stock solutions werebetween 0.77–0.86 mM.
Cupin allergens
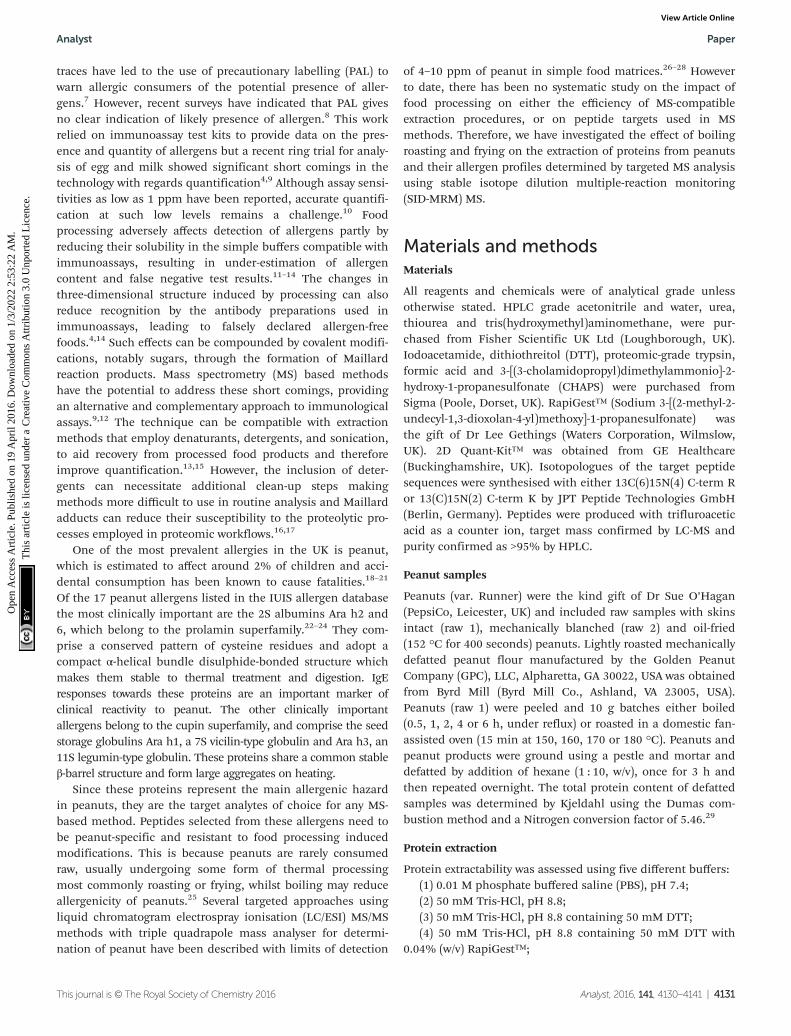
Ara h1: the contribution of each monitored MRM transition tothe total ion intensity was assessed for each of the peptidetargets using a mid-range concentration. Extracted ion chro-matograms (XIC) are displayed with fragmentation patterns inFig. S-6i-ii.† The signal intensity for all transitions associatedwith Ara h1 targets were strong, and although fragmentationof Ara h1(P43237)555–577 is directed towards formation of aN-terminal proline y9 ion improving the signal of this production, others responded more equivalently.28 Comparison of theion chromatograms for Ara h1(P43237)329–342 and Ara h1(P43237)555–577 at the same concentration showed a 6-folddifference in the signal intensity most likely due to variationsin ionisation efficiency. The SID series evaluated in peanutextract demonstrated a decrease in the analytical response
compared to SID performed in buffer (Fig. 4(ii)). Using log-transformed data a clear response plateau was observed atlevels where peptides were detected but not quantifiable asthey were outside of the linear range of the assay.
Ara h3: XIC’s and fragmentation patterns are shown inFig. S-6iii-iv.† The SID calibration curves performed in bufferand matrix are presented in Fig. 4(ii). The y10 ion fragmentwas highest for peptide Ara h3(Q647H4)25–41, with the y7 andy6 ions being readily identified. The y7, y8 and y9 ions were
Fig. 4 Calibration curves for each isotopically labelled peptide target inbuffer (solid line) and in a peanut extract (dashed line) constructed fromlog-transformed data. (i) Ara h1(P43237)329–342 in blue/light blue and Arah1(P43237)555–577 in red/orange. (ii) Ara h3(Q647H4)25–41 in blue/lightblue and Ara h3(Q647H4)372–384 in red/orange. (iii) Ara h2(Q6PSU2)103–115 in blue/light blue, Ara h2(Q6PSU2)147–155 in red/orange,Ara h6(Q647G9)136–144 in green/light green and Ara h7(B4XID4)143–151 inpurple/pink.
Paper Analyst
4136 | Analyst, 2016, 141, 4130–4141 This journal is © The Royal Society of Chemistry 2016
Ope
n A
cces
s A
rtic
le. P
ublis
hed
on 1
9 A
pril
2016
. Dow
nloa
ded
on 1
/3/2
022
2:53
:22
AM
. T
his
artic
le is
lice
nsed
und
er a
Cre
ativ
e C
omm
ons
Attr
ibut
ion
3.0
Unp
orte
d L
icen
ce.
View Article Online

readily detected in peptide Ara h3(Q647H4)372–384, the y7 ionbeing the most intense.
Ara h2, 6 and 7: XIC’s and fragmentation patterns areshown in Fig. S-6v-viii.† The SID calibration curves performedin buffer and matrix are presented in Fig. 4(iii). All transitionsmonitored for Ara h2(Q6PSU2)103–115 were comparable but lessintense than Ara h2(Q6PSU2)147–155 in which the y7 fragmention was most abundant. Ara h6Q647G9136–144 and Ara h7(B4XID4)143–151 both have a least 2 good transitions. Ara h7(B4XID4)143–151 was dominated by y7 ion. The Ara h7 peptidewas the only target where an improved response in matrix overbuffer was observed.
Statistical analysis using a pairwise t-test showed no signifi-cance between SID performed in buffer and matrix for any ofthe target peptides. Differences between resulting linearregression analyses for the same target peptide were thereforethe result of instrument variation over the course of the experi-ments. The LLOD was evaluated by visual inspection of theXIC’s (Table 2). The majority of peptides were reproduciblydetected between 1–30 amoles on column, except Ara h1(P43237)329–342 which was detected at the lowest concentrationinjected (0.1 amoles on the column). At these levels peanutcould be confidently identified but not accurately quantified.Accurate detection and quantification was defined by thelinear dynamic range of the given peptide and was typicallyachieved over 4–5 orders of magnitude. Calculated LOD’s weredetermined in the range of 32–448 amoles and LOQ’s between96–1343 amoles on column.51 Calculated LOD’s were muchhigher than LLOD values for the cupin allergens but weresimilar for the 2S-albumins targets. As expected LOQ’s werelower for the 2S albumin peptides from Ara h2, 6 and 7,with Ara h2(Q6PSU2)147–155, Ara h6(Q647G9)136–144 and Ara h7(B4XID4)143–151 performing especially well with LOQ’s of96–126.89 amoles on column.
Effect of thermal processing on peptide target quantification
To overcome fluctuations in signal intensity, quantificationwas performed on normalised data corresponding to the totalion intensity of all monitored transitions. Results are pre-sented as nmoles peptide per mg of extracted protein (Fig. 5).
These were converted to protein amount (mg) for each aller-genic protein using molecular weights for mature proteinsequences (Fig. S-7†). Values appear to be underestimated by a∼10-fold, since Ara h1 and Ara h3 together account for around50% of peanut seed proteins. This most likely due to loss ofpeptides following the C-18 spin column clean-up which haspreviously been shown to reduce signal intensity by 50–90%.38
After clean-up solvent was allowed to evaporate and peptideswere re-suspended in buffer. During this process furtherpeptide could be lost if it was not fully re-solubilised. The con-tribution from each of the 3 monitored MRM transitions foreach target remained consistent independent of thermal pro-cessing. The majority of CV’s relating to the normalised peakarea intensities were <10% with less than 13% of resultshaving a CV between 10–20%. Variation in protein extractionwas responsible for the range in samples observed (Fig. S-7†).
Ara h1: peptide Ara h1(P43237)329–342 was present at doublethe intensity of peptide Ara h1(P43237)555–577 in both raw andprocessed samples (Fig. 5(i)). The difference in the abundanceof these peptide targets could be due to differences in thecorresponding ionisation efficiencies or fragmentation pat-terns. Ara h1(P43237)555–577 is flanked by lysine residues whichare less efficiently cleaved by trypsin than arginine.52 Sucheffects may be compounded the formation of modified aminoacids as a consequence of thermal treatment as lysine is sus-ceptible to processing-induced modifications. It has beenreported that this sequence frequently carries a Maillard modi-fication at the C-terminal K.34 Modified peptides would not bedetected using the current MRM targets. The roasting seriesshows how such a processing modification could explain thereduction in abundance, although this reduction is not statisti-cally significant compared to raw. It is evident that the Ara h1comprises a smaller proportion of the extracted protein fromall the boiled and roasted samples but was represented in theextracts of the roasted peanut flour and fried peanuts at a levelequivalent to the raw peanuts (Fig. S-7†).
Ara h3: the basic subunit peptide Ara h3(Q647H3)372–384
was reported around 2–5-fold higher than the acidic subunitpeptide Ara h3(Q647H3)25–41 in the raw peanut samples(Fig. 5(ii)). As peptide Ara h3(Q647H4)25–41 is located close to
Table 2 Linear regression analyses and calculated assay sensitivities for peanut allergen peptide targets using SID performed in peanut matrix. Limitof detection (LOD) and quantification (LOQ) values were calculated using the calibration plot method (eqn (S-1)) with a base y value determinedusing log of the mean analytical response for lowest concentration significantly different (2 × standard deviation [SD]) from background.51 Lowerlimit of detection (LLOD) values were estimated from visual inspection of XIC’s where S/N ratio > 3 : 1 for minimum of 2 transitions
Target peptide
Linear regression analysis Assay sensitivities (amoles on column)
r2 Line equation Sy|x y (log10) LOD LOQ LLOD
Ara h1(P43237)329–342 0.9931 Y = 0.9460 × X + 2.797 0.08 5.09 248.38 745.15 0.1Ara h1(P43237)555–577 0.9863 Y = 0.9098 × X + 3.636 0.11 5.73 125.93 377.80 1Ara h3(Q647H4)25–41 0.9938 Y = 0.9705 × X + 2.587 0.09 4.40 104.26 312.79 30Ara h3(Q647H4)372–384 0.9902 Y = 0.9604 × X + 3.075 0.11 5.50 447.71 1343.13 1Ara h2(Q6PSU2)103–115 0.9925 Y = 0.9829 × X + 2.160 0.09 4.24 208.07 624.21 10Ara h2(Q6PSU2)147–155 0.9935 Y = 0.9143 × X + 3.596 0.09 5.15 32.10 96.29 30Ara h6(Q647G9)136–144 0.9953 Y = 0.9456 × X + 3.067 0.08 4.63 42.30 126.89 30Ara h7(B4XID4)143–151 0.9939 Y = 0.9225 × X + 3.246 0.09 4.84 40.04 120.11 30
Analyst Paper
This journal is © The Royal Society of Chemistry 2016 Analyst, 2016, 141, 4130–4141 | 4137
Ope
n A
cces
s A
rtic
le. P
ublis
hed
on 1
9 A
pril
2016
. Dow
nloa
ded
on 1
/3/2
022
2:53
:22
AM
. T
his
artic
le is
lice
nsed
und
er a
Cre
ativ
e C
omm
ons
Attr
ibut
ion
3.0
Unp
orte
d L
icen
ce.
View Article Online

the N-terminus of the acidic subunit it may be susceptible tomissed cleavages and hence give lower than expectedresponses.53 Furthermore these peptides are not representativeof the acidic or basic subunits of all Ara h3 isoforms. Forexample, neither target represents isoforms corresponding toAra h3.02 (formerly Ara h4).54 Peptide abundance appeared tobe reduced as a function of processing time or temperature.
This could be the result of the formation of Maillard reactionproducts during, for example, roasting. Ara h3(Q647H3)372–384
was more susceptible to processing induced effects and wasreduced in all the thermally processed samples apart from theroasted peanut flour. This was found to be statistically signifi-cant by 2-way ANOVA when comparing target levels in rawpeanuts compared to all processed samples, except the sample
Fig. 5 Effect of thermal processing on quantification of peanut allergen peptide targets. Results are displayed according to protein family; Cupinsuperfamily (i) 7S-vicillin type protein Ara h1, (ii) 11S-legumin type protein Ara h3 and prolamin superfamily (iii) 2S ablumins Ara h2, 6, 7. Results areexpressed as nmoles of peptide per mg of extracted protein.
Paper Analyst
4138 | Analyst, 2016, 141, 4130–4141 This journal is © The Royal Society of Chemistry 2016
Ope
n A
cces
s A
rtic
le. P
ublis
hed
on 1
9 A
pril
2016
. Dow
nloa
ded
on 1
/3/2
022
2:53
:22
AM
. T
his
artic
le is
lice
nsed
und
er a
Cre
ativ
e C
omm
ons
Attr
ibut
ion
3.0
Unp
orte
d L
icen
ce.
View Article Online
roasted at 150 °C. Boiling also gave statistically significantdifferences when compared to raw for peptide Ara h3(Q647H3)372–384. The intramolecular disulphide bond whichlinks acidic and basic subunits in Ara h3 is thought to bemetastable and readily hydrolyses during boiling. The result-ing separated basic subunit may have the propensity to aggre-gate and may not re-solubilise effectively during the extractionprocedure, affecting recoveries of peptide target. Whilst Ara h3(Q647H3)372–384 could be a good marker of processing pro-cedures, it may not be reliable for allergen quantification inprocessed foods. The Ara h3(Q647H3)25–41 peptide was lessaffected by thermal processing such that in the 6 h boiledsamples levels were equivalent to those of the Ara h3(Q647H3)372–384 peptide.
Ara h2: peptides from Ara h2, Ara h2(Q6PSU2)103–115 andAra h2(Q6PSU2)147–155, behaved quite similarly and were oftenfound in equivalent amounts in all samples analysed, apartfrom peanuts boiled for ≥2 h (Fig. 5(iii)). In those samples Arah2(Q6PSU2)147–155 appeared to be less affected than Ara h2(Q6PSU2)103–115. Reduction of ion abundances in roasted com-pared to raw or boiled could be partially explained by associ-ated function as a trypsin inhibitor which is reported toincrease during roasting.55
Ara h6 and Ara h7: Ara h6(Q647G9)136–144 and Ara h7(B4XID4)143–151 were present in similar amounts in all samplesanalysed (Fig. 5(iii)).
If one considers the relationship in molar terms the 2S-albumin fraction was found to be present in equivalentamounts to Ara h1, which may be a reflection of its greatersolubility. This may help to explain the clinical significance ofallergens belonging to 2S-albumins such as Ara h2. Allergensthat retain their solubility following processing will havegreater availability for interaction with IgE, contributing totheir higher allergenic potential.
Conclusions
Any analytical method for determining the presence of aller-gens in foods requires an effective extraction methodology.The inefficiency of simple salt buffers to extract processedprotein underlies, in part, the lack of reliability of immuno-logical assays for quantification.11 The recovery of highly pro-cessed protein is greatly improved using MS compatiblebuffers but for more complete extraction the use of harshdenaturing conditions employing chaotropic buffers isrequired56,57 However, the addition of sample clean-up step toremove any interfering contaminants may result in sampleloss through binding to the plastics and stationary phase ofthe column.58 Further studies are required to assess whetherthe inclusion of acid labile detergents at higher levels (such as2% (w/w)) and the use of spin filters can further improveextraction efficiency and sample processing.56,57 It was evidentthat variations in sample extraction adversely affected thereproducibility of the MRM analysis. This might be improvedby increasing sample size used for extraction and would in any
case, be a requirement for application of such methods to theanalysis of complex food matrices.
We have identified a set of peptide targets found in themajor peanut allergens thought to be responsible for the aller-genic activity of peanuts. The selectivity and sensitivity ofMRM experiments allowed detection of target peptides at lowattomole levels. Low level LOQ’s were also achieved betweenatto-femtomole levels. When the impact of thermal processingon the behaviour of the peptide targets was assessed thosefrom the cupin allergens Ara h1 and Ara h3 showed morecomplex behaviour than those from the 2S albumin allergensAra h2, 6 and 7. Differences in the behaviour of peptide targetsfrom the same protein were evident which may relate to differ-ences in efficiency of trypsin digestion, variations in the abun-dance of different isoforms and processing-inducedmodifications. Ara h1 and 3 form complex aggregated struc-tures following thermal processing, impairing both theirextractability and hence their reliability as targets for quantifi-cation in thermally processed peanuts.59,60 The prolamin pro-teins which are heat-stable appeared to be less affected and inthis study the peptide targets from these proteins proved morestable to the effects of thermal processing.59,61 Trypsin clea-vage yields targets flanked by lysine or arginine which canbecome modified through Maillard-type reactions affectingdigestion and detection. Targets flanked by arginine residuesappeared to be more thermostable.
This report shows that the effect of food processing pro-cedures on peptide target behaviour is unpredictable andhence an assessment of the robustness of any allergen targetshould be a pre-requisite for development of a MS method fordetection of allergens in food. These data will support develop-ment of targeted MS methods to the analysis of peanut infoods. The ability to couple sensitive detection methodologywith a wide dynamic range, to harsh methods of extractionrequired for processed foods will allow methods able to quan-tifying peanut allergens in complex food matrices to be develo-ped in future.
Acknowledgements
This work was funded through a BBSRC CASE awarded toR. L. Sayers. We would like to thank Sue O’Hagan at PepsiCofor peanut samples, Lee Gethings and Antonietta Wallace atWaters for RapiGest™ and helpful discussions, Frances Smithfor helpful discussions and Cunyu Yan of the Michael BarberCentre for support with MS analysis.
References
1 B. I. Nwaru, L. Hickstein, S. S. Panesar, A. Muraro,T. Werfel, V. Cardona, A. E. Dubois, S. Halken,K. Hoffmann-Sommergruber, L. K. Poulsen, G. Roberts,R. Van Ree, B. J. Vlieg-Boerstra, A. Sheikh andE. F. A. A. G. Group, Allergy, 2014, 69, 62–75.
Analyst Paper
This journal is © The Royal Society of Chemistry 2016 Analyst, 2016, 141, 4130–4141 | 4139
Ope
n A
cces
s A
rtic
le. P
ublis
hed
on 1
9 A
pril
2016
. Dow
nloa
ded
on 1
/3/2
022
2:53
:22
AM
. T
his
artic
le is
lice
nsed
und
er a
Cre
ativ
e C
omm
ons
Attr
ibut
ion
3.0
Unp
orte
d L
icen
ce.
View Article Online

2 Official Journal of the European Union, L 304, 22 Novem-ber 2011.
3 B. K. Ballmer-Weber, M. Fernandez-Rivas, K. Beyer,M. Defernez, M. Sperrin, A. R. Mackie, L. J. Salt,J. O. B. Hourihane, R. Asero, S. Belohlavkova, M. Kowalski,F. de Blay, N. G. Papadopoulos, M. Clausen, A. C. Knulst,G. Roberts, T. Popov, A. B. Sprikkelman, R. Dubakiene,S. Vieths, R. van Ree, R. Crevel and E. N. C. Mills, J. AllergyClin. Immunol., 2015, 135, 964–971.
4 S. L. Taylor, S. L. Hefle, C. Bindslev-Jensen, S. A. Bock,A. W. Burks, L. Christie, D. J. Hill, A. Host,J. O. B. Hourihane, G. Lack, D. D. Metcalfe, D. A. Moneret-Vautrin, P. A. Vadas, F. Rance, D. J. Skrypec,T. A. Trautman, I. M. Yman and R. S. Zeiger, J. Allergy Clin.Immunol., 2002, 109, 24–30.
5 S. L. Taylor, D. A. Moneret-Vautrin, R. W. R. Crevel,D. Sheffield, M. Morisset, P. Dumont, B. C. Remington andJ. L. Baumert, Food Chem. Toxicol., 2010, 48, 814–819.
6 S. L. Taylor, R. W. R. Crevel, D. Sheffield, J. Kabourek andJ. Baumert, Food Chem. Toxicol., 2009, 47, 1198–1204.
7 A. DunnGalvin, C. H. Chan, R. Crevel, K. Grimshaw,R. Poms, S. Schnadt, S. L. Taylor, P. Turner, K. J. Allen,M. Austin, A. Baka, J. L. Baumert, S. Baumgartner, K. Beyer,L. Bucchini, M. Fernandez-Rivas, K. Grinter, G. F. Houben,J. Hourihane, F. Kenna, A. G. Kruizinga, G. Lack,C. B. Madsen, E. N. Clare Mills, N. G. Papadopoulos,A. Alldrick, L. Regent, R. Sherlock, J. M. Wal andG. Roberts, Allergy, 2015, 70, 1039–1051.
8 O. N. Robertson, J. O. B. Hourihane, B. C. Remington,J. L. Baumert and S. L. Taylor, Food Addit. Contam., Part A,2013, 30, 1467–1472.
9 P. E. Johnson, S. Baumgartner, T. Aldick, C. Bessant,V. Giosafatto, J. Heick, G. Mamone, G. O’Connor, R. Poms,B. Popping, A. Reuter, F. Ulberth, A. Watson, L. Monaci andE. N. Mills, J. AOAC Int., 2011, 94, 1026–1033.
10 S. Jayasena, M. Smits, D. Fiechter, A. de Jong, J. Nordlee,J. Baumert, S. L. Taylor, R. H. Pieters and S. J. Koppelman,J. Agric. Food Chem., 2015, 63, 1849–1855.
11 R. E. Poms, C. Capelletti and E. Anklam, Mol. Nutr. FoodRes., 2004, 48, 459–464.
12 A. Gomaa, S. Ribereau and J. Boye, J. Nutr. Food Sci., 2012,52(2), 483–489.
13 C. M. Hebling, M. A. McFarland, J. H. Callahan andM. M. Ross, J. Agric. Food Chem., 2012, 61(24), 5638–5648.
14 T.-J. Fu and N. Maks, J. Agric. Food Chem., 2013, 61, 5649–5658.
15 S. M. Albillos, F. Al-Taher and N. Maks, Food Chem., 2011,127, 1831–1834.
16 S. Khuda, A. Slate, M. Pereira, F. Al-Taher, L. Jackson,C. Diaz-Amigo, E. C. Bigley 3rd, T. Whitaker andK. M. Williams, J. Agric. Food Chem., 2012, 60, 4195–4203.
17 R. A. Kopper, N. J. Odum, M. Sen, R. M. Helm, J. S. Stanleyand A. W. Burks, Int. Arch. Allergy Immunol., 2005, 136, 16–22.
18 R. S. H. Pumphrey and M. H. Gowland, J. Allergy Clin.Immunol., 2007, 119, 1018–1019.
19 N. Nicolaou, M. Poorafshar, C. Murray, A. Simpson,H. Winell, G. Kerry, A. Harlin, A. Woodcock, S. Ahlstedtand A. Custovic, J. Allergy Clin. Immunol., 2010, 125(1), 191–197, e1–13.
20 P. J. Turner, M. H. Gowland, V. Sharma, D. Ierodiakonou,N. Harper, T. Garcez, R. Pumphrey and R. J. Boyle, J. AllergyClin. Immunol., 2015, 135(4), 956–963, e1.
21 C. Venter, S. Hasan Arshad, J. Grundy, B. Pereira, C. BernieClayton, K. Voigt, B. Higgins and T. Dean, Allergy, 2010, 65,103–108.
22 N. Nicolaou and A. Custovic, Curr. Opin. Allergy Clin.Immunol., 2011, 11, 222–228.
23 S. Hazebrouck, B. Guillon, M.-F. Drumare, E. Paty,J.-M. Wal and H. Bernard, Mol. Nutr. Food Res., 2012, 56,548–557.
24 N. Nicolaou, C. Murray, D. Belgrave, M. Poorafshar,A. Simpson and A. Custovic, J. Allergy Clin. Immunol., 2011,127, 684–685.
25 P. J. Turner, S. Mehr, R. Sayers, M. Wong, M. H. Shamji,D. E. Campbell and E. N. C. Mills, J. Allergy Clin. Immunol.,2014, 134, 751–753.
26 L. Monaci, E. De Angelis, S. L. Bavaro and R. Pilolli, FoodAddit. Contam., Part A, 2015, 1–10.
27 G. Mamone, G. Picariello, S. Caira, F. Addeo andP. Ferranti, J. Chromatogr. A, 2009, 1216, 7130–7142.
28 K. J. Shefcheck, J. H. Callahan and S. M. Musser, J. Agric.Food Chem., 2006, 54, 7953–7959.
29 J. B. Misra, Peanut Sci., 2001, 28, 48–51.30 B. MacLean, D. M. Tomazela, N. Shulman, M. Chambers,
G. L. Finney, B. Frewen, R. Kern, D. L. Tabb, D. C. Lieblerand M. J. MacCoss, Bioinformatics, 2010, 26, 966–968.
31 H. Chassaigne, J. V. Nørgaard and A. J. van Hengel, J. Agric.Food Chem., 2007, 55, 4461–4473.
32 J. Sealey-Voyksner, J. Zweigenbaum and R. Voyksner, FoodChem., 2016, 194, 201–211.
33 J. Heick, M. Fischer and B. Pöpping, J. Chromatogr. A, 2011,1218, 938–943.
34 G. A. Mueller, S. J. Maleki, K. Johnson, B. K. Hurlburt,H. Cheng, S. Ruan, J. B. Nesbit, A. Pomes, L. L. Edwards,A. Schorzman, L. J. Deterding, H. Park, K. B. Tomer,R. E. London and J. G. Williams, Allergy, 2013, 68, 1546–1554.
35 M. Careri, L. Elviri, M. Maffini, A. Mangia, C. Mucchinoand M. Terenghi, Rapid Commun. Mass Spectrom., 2008, 22,807–811.
36 C. Bignardi, L. Elviri, A. Penna, M. Careri and A. Mangia,J. Chromatogr. A, 2010, 1217, 7579–7585.
37 C. Bignardi, M. Mattarozzi, A. Penna, S. Sidoli, L. Elviri,M. Careri and A. Mangia, Food Anal. Methods, 2013, 6,1144–1152.
38 M. Careri, A. Costa, L. Elviri, J. B. Lagos, A. Mangia,M. Terenghi, A. Cereti and L. P. Garoffo, Anal. Bioanal.Chem., 2007, 389, 1901–1907.
39 C. H. Parker, S. E. Khuda, M. Pereira, M. M. Ross, T. J. Fu,X. Fan, Y. Wu, K. M. Williams, J. DeVries, B. Pulvermacher,B. Bedford, X. Zhang and L. S. Jackson, J. Agric. FoodChem., 2015, 63, 10669–10680.
Paper Analyst
4140 | Analyst, 2016, 141, 4130–4141 This journal is © The Royal Society of Chemistry 2016
Ope
n A
cces
s A
rtic
le. P
ublis
hed
on 1
9 A
pril
2016
. Dow
nloa
ded
on 1
/3/2
022
2:53
:22
AM
. T
his
artic
le is
lice
nsed
und
er a
Cre
ativ
e C
omm
ons
Attr
ibut
ion
3.0
Unp
orte
d L
icen
ce.
View Article Online

40 P. E. Johnson, R. L. Sayers, L. A. Gethings, A. Balasundaram,J. T. Marsh, J. I. Langridge and E. N. C. Mills, Anal. Chem.,2016, DOI: 10.1021/acs.analchem.5b04466.
41 C. E. Eyers, C. Lawless, D. C. Wedge, K. W. Lau,S. J. Gaskell and S. J. Hubbard, Mol. Cell. Proteomics, 2011,10(11), 1–12.
42 C. Lawless and S. J. Hubbard, OMICS: J. Integr. Biol., 2012,16, 449–456.
43 C. Cabanos, H. Urabe, M. R. Tandang-Silvas, S. Utsumi,B. Mikami and N. Maruyama, Mol. Immunol., 2011, 49,115–123.
44 M. Chruszcz, S. J. Maleki, K. A. Majorek, M. Demas,M. Bublin, R. Solberg, B. K. Hurlburt, S. Ruan,C. P. Mattison, H. Breiteneder and W. Minor, J. Biol. Chem.,2011, 286, 39318–39327.
45 D. S. Shin, J. Biol. Chem., 1998, 273, 13753–13759.46 S. R. Piersma, M. Gaspari, S. L. Hefle and S. J. Koppelman,
Mol. Nutr. Food Res., 2005, 49, 744–755.47 T. Jin, F. Guo, Y. W. Chen, A. Howard and Y. Z. Zhang, Mol.
Immunol., 2009, 46, 1796–1804.48 K. Otsu, R. Guo and S. C. Dreskin, Clin. Exp. Allergy, 2015,
45, 471–484.49 T. Kleber-Janke, R. Crameri, U. Appenzeller, M. Schlaak
and W. Becker, Int. Arch. Allergy Immunol., 1999, 119, 265–274.
50 R. Pedreschi, J. Norgaard and A. Maquet, Nutrients, 2012, 4,132–150.
51 D. R. Mani, S. Abbatiello and S. Carr, BMC Bioinf., 2012, 13,S9.
52 T. Glatter, C. Ludwig, E. Ahrné, R. Aebersold, A. J. R. Heckand A. Schmidt, J. Proteome Res., 2012, 11, 5145–5156.
53 J. Marsh, N. Rigby, K. Wellner, G. Reese, A. Knulst,J. Akkerdaas, R. van Ree, C. Radauer, A. Lovegrove,A. Sancho, C. Mills, S. Vieths, K. Hoffmann-Sommergruberand P. R. Shewry, Mol. Nutr. Food Res., 2008, 52(Suppl 2),S272–S285.
54 P. Rabjohn, E. Helm, J. Stanley, C. West, H. Sampson,A. Burks and G. Bannon, J. Clin. Invest., 1999, 103, 535–542.
55 S. J. Maleki, O. Viquez, T. Jacks, H. Dodo,E. T. Champagne, S.-Y. Chung and S. J. Landry, J. AllergyClin. Immunol., 2003, 112, 190–195.
56 J. R. Wisniewski, A. Zougman, N. Nagaraj and M. Mann,Nat. Methods, 2009, 6, 359–362.
57 L. L. Manza, S. L. Stamer, A.-J. L. Ham, S. G. Codreanu andD. C. Liebler, Proteomics, 2005, 5, 1742–1745.
58 H. John, M. Walden, S. Schäfer, S. Genz andW.-G. Forssmann, Anal. Bioanal. Chem., 2004, 378, 883–897.
59 F. Blanc, Y. M. Vissers, K. Adel-Patient, N. M. Rigby,A. R. Mackie, A. P. Gunning, N. K. Wellner, P. S. Skov,L. Przybylski-Nicaise, B. Ballmer-Weber, L. Zuidmeer-Jonge-jan, Z. Szepfalusi, J. Ruinemans-Koerts, A. P. Jansen,H. Bernard, J. M. Wal, H. F. Savelkoul, H. J. Wichers andE. N. Mills, Mol. Nutr. Food Res., 2011, 55, 1887–1894.
60 E. L. van Boxtel, L. A. M. van den Broek, S. J. Koppelmanand H. Gruppen, Mol. Nutr. Food Res., 2008, 52, 674–682.
61 Y. M. Vissers, F. Blanc, P. S. Skov, P. E. Johnson,N. M. Rigby, L. Przybylski-Nicaise, H. Bernard, J. M. Wal,B. Ballmer-Weber, L. Zuidmeer-Jongejan, Z. Szepfalusi,J. Ruinemans-Koerts, A. P. Jansen, H. F. Savelkoul,H. J. Wichers, A. R. Mackie, C. E. Mills and K. Adel-Patient,PLoS One, 2011, 6, e23998.
Analyst Paper
This journal is © The Royal Society of Chemistry 2016 Analyst, 2016, 141, 4130–4141 | 4141
Ope
n A
cces
s A
rtic
le. P
ublis
hed
on 1
9 A
pril
2016
. Dow
nloa
ded
on 1
/3/2
022
2:53
:22
AM
. T
his
artic
le is
lice
nsed
und
er a
Cre
ativ
e C
omm
ons
Attr
ibut
ion
3.0
Unp
orte
d L
icen
ce.
View Article Online