Embed Size (px)
Citation preview

The Effect of the Shareholder Dividend Tax Policy on
Corporate Tax Avoidance
Dan Amiram
Columbia Business School Columbia University
Andrew M. Bauer
Department of Accountancy University of Illinois at Urbana-Champaign
Mary Margaret Frank
Darden School of Business The University of Virginia
Draft as of: January 16, 2012
Keywords: Imputation, corporate tax avoidance, dividend taxation, tax policy JEL Classification:
Corresponding author: Mary Margaret Frank, Darden School of Business, The University of Virginia, 100 Darden Boulevard, Charlottesville, VA 22903, tel: +1-434-924-4432, email: [email protected]. We thank Trevor Harris, Glenn Hubbard, Dimitra Koutsantoni, Chris Mayer and Jake Thornock for helpful discussions and comments. We gratefully acknowledge the financial support provided by the University of Virginia Darden School Foundation.

The Effect of the Shareholder Dividend Tax Policy on Corporate Tax Avoidance
Abstract
This study adds to the current policy debate on corporate tax avoidance by investigating the effects of shareholder dividend tax policies on the incentives of managers to avoid corporate taxation. One such tax policy, imputation systems, eliminates the double taxation of corporate earnings by crediting the shareholders for the amount of taxes that the corporation pays. As a result, corporate tax avoidance under an imputation system simply shifts the burden to the shareholders. It does not reduce the shareholders’ overall tax burden. Corporate tax avoidance is less desirable for these shareholders because tax avoidance structures are costly and do not provide additional after-tax cash flows to them. We find that firms from countries with imputation systems have significantly lower tax avoidance relative to other firms. In addition, we find that firms from countries with full imputation systems avoid less tax than firms from countries with only partial imputation systems. We also examine firms from countries that eliminated their imputation systems and find that tax avoidance increased after the change. We also exploit Canada’s increase in imputation credits for its corporations in 2006 and find a significant reduction in tax avoidance followed the change. Our findings have implications for our understanding of managerial incentives to avoid tax and the debate over tax reform.

[1]
The Effect of the Shareholder Dividend Tax Policy on Corporate Tax Avoidance
I. Introduction
Corporate tax avoidance is a widely discussed issue in the press and academia as
governments around the world struggle to support their planned expenditures, and as scandals
involving corporate tax shelters test the public’s patience with aggressive business practices.
Officials looking for various ways to raise revenue must balance the popular mandate to close
corporate “loopholes” with the need to maintain a competitive business environment in a global
economy. While many constituents in the United States currently argue for changing to a
territorial tax system to help the country’s corporations become more globally competitive, this
change raises concerns over corporations’ increased ability to avoid taxation. One reform, which
has largely been ignored in the recent debate in the United States, can potentially reduce
corporate tax avoidance while increasing global competitiveness – an imputation system for the
taxation of dividends. This paper is the first to examine the effect of a country’s system for the
taxation of dividends on corporate tax avoidance.
A switch from a classical system, which imposes double taxation on corporate earnings,
to an imputation system, which imposes tax only once on corporate earnings, can increase global
competitiveness of a country’s resident corporations by reducing the overall tax burden of their
shareholders. However, other tax policy choices can achieve this same objective. Lowering the
corporate or dividend tax rate, moving from a worldwide to a territorial tax system, and
decreasing the level of enforcement or book-tax conformity can all potentially reduce the overall
tax burden of corporate shareholders. What makes a shift to an imputation system unique is its
effect on corporate tax avoidance. Theoretically, corporate tax avoidance under an imputation
system does not provide additional after-tax cash flows to the shareholders, thus reducing a

[2]
manager’s incentive to engage in tax avoidance behavior. The disincentive for corporate tax
avoidance under an imputation system arises because every dollar saved at the corporate level is
a dollar less that is credited to shareholders to reduce their tax bill. Therefore, corporate tax
avoidance in an imputation system simply shifts who pays the taxes. It does not reduce the
overall tax burden of the shareholders. If corporate tax avoidance provides no additional after-tax
cash flows and is costly, tax avoidance behavior under an imputation system may also reduce
firm value.
While imputations systems reduce managers’ incentives to avoid corporate taxes for their
shareholders, managers may still have other incentives to engage in tax avoidance. First,
managers’ compensation may be related to after tax income (Rego and Wilson, 2011). Second,
tax avoidance structures may allow managers to extract additional rents and private benefits
(Desai and Dharmapala, 2006). Third, managers may value corporate tax avoidance because the
tax savings leaves them with higher levels of free cash flows until dividends are distributed.
We use a sample of 52,895 firm-year observations from 1994 through 2008 across 28
countries to examine the effect of countries’ dividend tax policies on corporate tax avoidance.
Our empirical findings are based on regressions of corporate tax avoidance on country-level
shareholder dividend tax policy while controlling for other factors expected to affect corporate
tax avoidance. We also exploit the relatively recent changes in several countries’ shareholder
dividend tax policies to examine their effects on corporate tax avoidance. Results from our
empirical analyses confirm that corporate tax avoidance is lower for firms from countries with
imputation systems. Moreover, corporate tax avoidance is lower for firms under full imputation
systems than under partial imputation systems; both are lower than firms under the non-
imputation systems. Difference in differences estimations examine firms from countries that had

[3]
an exogenous elimination of their imputation systems and find that the years after the change in
shareholder dividend tax policy have lower corporate tax avoidance. In contrast, evidence of
higher corporate tax avoidance is found for firms from Canada beginning in 2006 following an
increase in the value of its imputations credits. Our results are robust to the use of different
common measures of corporate tax avoidance and the inclusion of controls shown to affect
corporate tax avoidance in an international setting.
Prior empirical research focuses on the effects of firm or manager characteristics on
corporate tax avoidance in a setting of classical tax systems (e.g. Frank et al. 2009; Frank et al.
2011; Dyreng et al. 2008, 2010; Kim et al. 2011; Desai and Dharmapala 2006; Rego 2003). That
is, a setting where both the corporation and its shareholders pay tax on the same income. This
focus is in large part due to the concentration of research on corporations headquartered in the
United States. One exception is Atwood et al. (2011), which analyzes important country tax
system characteristics that are the subject of current corporate tax reform proposals in the United
States.1 Specifically, they examine the effects of a country’s international tax system (worldwide
versus territorial) and corporate statutory tax rates, as well as a country’s level of enforcement
and book-tax conformity, on corporate tax avoidance – all of which provide managers with an
incentive to avoid corporate level taxes because shareholders still benefit through a lower overall
tax burden. We move beyond the current corporate tax proposals and are the first to examine the
unique opportunity implementing an imputation system provides countries to reduce managers’
1 In October 2011, House Ways and Means Committee Chairman David Camp proposed tax reforms, which include a reduction of the corporate tax rate and implementing a territorial tax system, to increase the global competitiveness of U.S. businesses. The Business Roundtable and the National Foreign Trade Council among others welcomed the proposal. However, many groups, including Citizens for Tax Justice, labor unions and small business coalitions wrote a letter urging the members of the Joint Select Committee of Deficit Reduction to oppose a move to a territorial system because it favors multinationals, which generally already enjoy lower corporate effective tax rates due to their overseas operations.

[4]
incentives to engage in corporate tax avoidance. An imputation system simply shifts the overall
tax burden, it does not lower it.
This study also sheds light on potential unintended consequences of the European
Union’s effort to harmonize the tax consequences of its residents. In 2004 and 2005, the
European Court of Justice (ECJ) ruled that several imputation systems in place throughout
Europe were discriminatory. That is, the countries’ imputation systems favored their residents
over non-residents. As a result, many European countries began to move away from these tax
systems, but at what cost? While the objective of the ECJ’s ruling was well-intended, the ECJ
may have unknowingly increased corporate tax avoidance in Europe. Our evidence speaks to
concerns over the ECJ’s attempts to harmonize tax policy through its rulings at the expense of its
member states by the potential negative impact on members’ tax revenues (Graetz and Warren
2007).
While the findings in this study have important policy implications, we offer a word of
caution. Our study speaks to one aspect of tax policy only; however, tax policy is a complex
issue in a global economy with many competing objectives. For example, Amiram and Frank
(2011) show that certain implementations of imputation systems may deter foreign equity
portfolio investors. In addition, any declines in corporate tax avoidance under an imputation
system may increase the shareholders’ benefits from avoiding personal taxes.
The remainder of this paper is organized as follows. Section II briefly discusses the
different taxation of dividends around the world and develops our research design. Section III
describes the data, sample selection, and descriptive statistics. Section IV presents the results of
our analyses. Section V concludes.

[5]
II. Background, predictions and research design
A. The political debate over corporate tax avoidance
We define corporate tax avoidance for our purposes as the reduction of taxes that a firm
would otherwise pay under the prevailing corporate statutory tax rates. In a heavily cited and
debated study, the Citizens for Tax Justice (CTJ) reports that 280 of the largest U.S. publicly-
traded companies have an effective tax rate during 2009 - 2010 that is less than half of the U.S.
corporate statutory tax rate.2 The CTJ argues that these firms are not paying their “fair share” of
tax, particularly when a quarter of the companies that they cite pay tax on less than 10% of
profits and that 30 companies pay no tax at all. The CTJ also advocates that “closing corporate
tax loopholes will have real benefits, including a fairer system, reduced federal budget deficits,
and more resources to improve roads and schools – things that are really important for economic
development here in the United States.” 3
While tax avoidance has social costs, and efforts to reduce corporate taxes are met with
negative press and government scrutiny4, not engaging in tax avoidance reduces the after-tax
cash flows to the firm and its shareholders. Other stakeholders in the political debate argue that
U. S. firms must engage in tax avoidance because U.S corporate tax rates are too high relative to
the rest of the world, and managers have the incentive and fiduciary duty to avoid taxes if it
increases their shareholders’ value.5,6 Concern over high U.S. corporate tax rates recognizes the
2 “Corporate Taxpayers & Corporate Tax Dodgers 2008-2010” by R. McIntyre, M. Gardner, R. Wilkins, and R. Phillips published in November 2011 by the Citizens for Tax Justice and the Institute for Taxation and Economic Policy. 3 “Biggest Public Firms Paid Little in U.S. Tax Study Says” by D. Kocieniewski published in The New York Times on November 3, 2011. 4 Other examples include a story aired March 27, 2011 on 60 Minutes entitled “The New Tax Havens” and a story on ABC World News aired October 21, 2010 building on an article entitled “Google 2.4% Rate Shows How $60 Billion Lost to Tax Loopholes” by Jesse Drucker published by Bloomberg. 5 “U.S. Corporations Suffer High Effective Tax Rates by International Standards” by P. Dittmer and published by the Tax Foundation on September 2011. 6 “Who Could Blame G.E.?” by Joe Nocera in the New York Times on April 4, 2011.
[6]
potential incentive for tax avoidance created by international tax competition that arises from
differing tax rates and the mobility of capital in a global economy (Avi-Yonah 2000). Unlike
many suggested corporate tax reforms, imputation systems address the origin of corporate tax
avoidance by eliminating managerial incentives to avoid corporate taxes for the benefit of
shareholders.
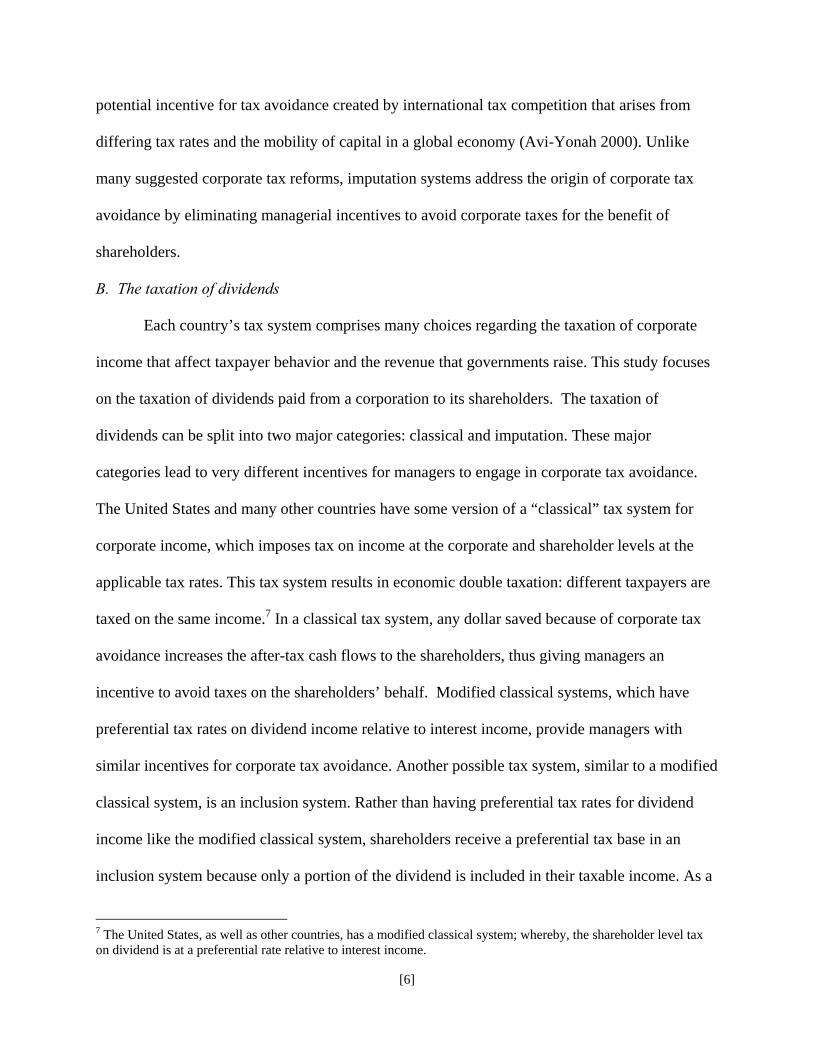
B. The taxation of dividends
Each country’s tax system comprises many choices regarding the taxation of corporate
income that affect taxpayer behavior and the revenue that governments raise. This study focuses
on the taxation of dividends paid from a corporation to its shareholders. The taxation of
dividends can be split into two major categories: classical and imputation. These major
categories lead to very different incentives for managers to engage in corporate tax avoidance.
The United States and many other countries have some version of a “classical” tax system for
corporate income, which imposes tax on income at the corporate and shareholder levels at the
applicable tax rates. This tax system results in economic double taxation: different taxpayers are
taxed on the same income.7 In a classical tax system, any dollar saved because of corporate tax
avoidance increases the after-tax cash flows to the shareholders, thus giving managers an
incentive to avoid taxes on the shareholders’ behalf. Modified classical systems, which have
preferential tax rates on dividend income relative to interest income, provide managers with
similar incentives for corporate tax avoidance. Another possible tax system, similar to a modified
classical system, is an inclusion system. Rather than having preferential tax rates for dividend
income like the modified classical system, shareholders receive a preferential tax base in an
inclusion system because only a portion of the dividend is included in their taxable income. As a
7 The United States, as well as other countries, has a modified classical system; whereby, the shareholder level tax on dividend is at a preferential rate relative to interest income.

[7]
result, inclusion systems, similar to classical and modified classical systems, incentivize
managers to engage in corporate tax avoidance in order to return more after-tax cash to their
shareholders.
Other countries impose only a single layer of taxation on corporate income through a
dividend imputation system. An imputation system imposes a tax on corporate income, but the
shareholder receives credits for the taxes paid by the corporation such that that the shareholder
pays only the difference between the corporate tax rate and the shareholder’s tax rate on dividend
income. As a result, the overall tax burden on dividends in an imputation system is equivalent to
the shareholder’s tax burden and corporate tax avoidance simply shifts the tax burden from the
corporation to the shareholder.8 Currently Australia, Chile, Mexico, and New Zealand have a
full imputation system where a tax credit is given to shareholders for the full corporate tax.
Canada, the United Kingdom and South Korea have partial imputation systems where
shareholders receive a tax credit for only a portion of the corporate tax. The United Kingdom is
the only member of the EU that has maintained its imputation system. France, Germany, Spain,
Italy, Ireland and Finland have all had imputation systems at some point but from 1999 to 2006
they all moved away from imputation systems.
B. Predictions and research design
The differences in shareholder dividend tax policy discussed in the previous subsection
lead us to predict firms that are residents of countries with imputation systems will have lower
8 For example, a corporation in a country with an imputation system and a 30% corporate tax rate earns $1 million and pays $300,000 in corporate taxes. The corporation also pays a $100,000 cash dividend to its sole shareholder, which is 14.3% of the remaining $700,000 after-tax corporate profits. The shareholder is viewed as having received $142,857 profits before corporate taxes ($100,000*(30%/(1-30%)), which includes the $100,000 cash dividend and an additional $42,847 or 14.3% of the $300,000 taxes paid by the corporation on the shareholder’s behalf. If the shareholder’s tax rate on dividend income is 45% then the shareholder owes $64,286 taxes on the $142,857 “grossed-up” dividend. However, the shareholder receives a credit of $42,857 for the taxes paid by the corporation such that the total taxes paid directly by the shareholder equal $21,429. Corporate tax avoidance reduces the company’s credits available to issue with the company’s cash dividend which forces the shareholder to pay more taxes directly to the government.

[8]
corporate tax avoidance relative to firms that are residents of countries with other shareholder
dividend tax policies. We examine this prediction using equation (1):
TAX AVOIDANCEit = γ0 + γ1*IMP_DUMit + γ2-k Xit + ψi + ξt + μit. (1)
where
TAX_AVOIDANCEit is the amount of corporate tax avoidance. IMP_DUMit equals one if a firm’s
country of residence has an imputation tax system during the year, and zero otherwise. We
expect a negative relation between corporate tax avoidance and the presence of an imputation
system. Xit represents a set of firm-year control variables, and ψi and ξt represent industry and
year fixed effects, respectively.
Because only a full imputation system completely eliminates managers’ incentives to
engage in corporate tax avoidance for the benefit of the shareholders, a manager’s incentive to
tax plan should vary with the level of imputation credits. The higher the level of credits provided
by the imputation system then the more corporate tax avoidance the imputation system will
likely deter. We examine this prediction using equation (2)
TAX_AVOIDANCEit = γ0 + γ1*IMP_PARTIALit + γ2*IMP_FULLit + γ3-k Xit + ψi + ξt + μit. (2)
where
IMP_PARTIALit (IMP_FULLit) equal one if a firm’s country of residence has a partial (full)
imputation tax system, respectively, during the year, and zero otherwise. While we expect a
negative relation between corporate tax avoidance and the presence of full and partial imputation
systems, we expect the negative relation to be larger in the presence of a full imputation system
relative to a partial imputation system. All the remaining variables are as defined in equation (1).
Given our predictions that countries with imputation systems have lower corporate tax
avoidance than countries with classical systems, we also predict that countries that eliminate

[9]
their imputation systems have higher levels of avoidance after the change. We examine this
prediction using equation 3:
TAX_AVOIDANCEit = γ0 + γ1*IMPi + γ2*POSTit + γ3*IMP_POSTit + γ4-k Xit + ψi + ξt + μit (3)
where
IMPi equals one if a firm’s country of residence has ever had an imputation system in any year of
the sample, zero otherwise. POSTit equals one for the period after a firm’s country of residence
eliminates its imputation system or for the period after a randomly selected year for all countries
that never change their tax system, and zero otherwise. IMP_POSTit is an interaction variable
that represents countries that eliminate their imputation system in the years after and including
the change. All of the remaining variables are as defined in equation (1).
One concern with the difference in differences design discussed in Equation (3) is that it
captures only increases in managerial incentives to avoid taxes because it includes the
elimination of imputation systems only. If managers have already invested in costly tax
avoidance structures, a policy change implementing an imputation system may not reduce their
incentives to avoid taxes because these structures are already in place. In 2006, during our
sample period, Canada implemented legislation that enhanced imputation credits for large,
publicly traded Canadian corporations. Because Canadian corporations in our sample are large
and publicly-traded, we expect that they are the type of firms that would be affected by this
legislation. Thus we implement another difference in differences design in equation (4). We
predict that Canadian corporations will reduce their levels of tax avoidance after the 2006 change
relative to firms in other countries. We examine this prediction using equation 4:

[10]
TAX_AVOIDANCEit = γ0 + γ1*IMP_DUMit + γ2*CANADAi + γ3*POST06it +
γ4*CANADA_POST06it + γ5-k Xit + ψi + ξt + μit (4)
where
CANADAi equals one if a firm resides in Canada, zero otherwise. POST06it equals one for the
period after and including the 2006 change in legislation, zero otherwise. CANADA_POST06it is
the interaction between CANADAi and POST06it. All the remaining variables are as defined in
equation (1). We expect firms from Canada will have less tax avoidance after the increase in
imputation credits in 2006.
III. Data and Sample
A. Data sources
To construct the tax-related variables in our empirical models, we require data on three
tax policies of each country: the system of dividend taxation, the corporate statutory tax rate and
the dividend imputation rate. We obtain these data from the OECD and, when necessary, hand
collection. The system for corporate taxation includes categories such as classical, full and
partial imputation, inclusion, etc. The remainder of our independent variables are constructed
from data available in Datastream. Finally, for brevity we provide Appendices A and B to
summarize the details and individual sources of data needed to construct our control variables.
B. Definition of Tax Avoidance
We use four tax avoidance proxies as dependent variables in our regression models. All
of these measures are based on the Cash ETR constructs from Dyreng et al. (2008), but in our
main analyses we use annual measures, instead of their long run measures, because of data
restrictions that substantially reduce the size of the sample. We rely on Cash ETR measures of

[11]
tax avoidance because they are less sensitive to home-country financial accounting standards
than other tax avoidance measures such as effective tax rates reported in the financial statements.
The first variable, SPREAD_INC, subtracts a firm’s annual Cash ETR from the corporate
statutory tax rate (CSTR) of the country it resides in. In this specification, Cash ETR equals taxes
paid divided by pre-tax income adjusted for special items. The second variable, SPREAD_CF,
also subtracts a firm’s annual Cash ETR from the CSTR of the country in which it resides.
However in SPREAD_CF, Cash ETR equals taxes paid divided by net operating cash flows with
taxes paid added back. Therefore, the first set of tax constructs, SPREAD_INC and
SPREAD_CF, represent the spread between what a benchmark firm would pay in tax in its
resident country and what a firm actually pays in tax. We interpret that larger spreads imply
more corporate tax avoidance relative to the statutory benchmark.
As an alternative to tax spreads, the second set of tax constructs are tax ratios.
RATIO_INC (RATIO_CF) divides Cash ETR, with income (cash flows) in the denominator, by
CSTR. We interpret that larger ratios imply less corporate tax avoidance relative to the statutory
benchmark. We adjust all four of these tax avoidance proxies for the respective corporate
statutory tax rates because a potential confound in our setting is that countries that implement
imputation systems have lower statutory tax rates and thus less incentive to avoid taxes ex ante.9
Thus, our dependent variables implicitly control for this country-level characteristic examined in
Atwood et al. (2011).
Our main variable of interest is IMP_DUM, a country-level indicator variable that takes
the value of one if a country provides an imputation tax credit to shareholders, and zero
9 In support of this concern, we find that CSTR is highly correlated with the imputation rate (IMPR) and thus our imputation indicator variables and Atwood et al. (2011) find a positive relation between corporate tax avoidance and CSTR. Furthermore, including CSTR as a control variable in our empirical regressions would introduce severe multicollinearity that would affect the interpretation of the imputation variables. As a result, we control for CSTR within our dependent variables.

[12]
otherwise. If a country has a non-zero and non-missing imputation rate in our OECD data, then
we consider that country to have an imputation system. Although relatively static, IMP_DUM
does vary across years within country in our sample, which we exploit further in additional
analyses. Based on our predictions of the influence of imputation systems on corporate tax
avoidance, we expect IMP_DUM to be negatively associated with SPREAD_INC and
SPREAD_CF and positively associated with RATIO_INC and RATIO_CF.
Consistent with prior studies in the tax avoidance literature (e.g. Gupta and Newberry,
1997; Mills et al., 1998; Rego, 2003; Dyreng et al,. 2008; Frank et al., 2009; Wilson, 2009; Chen
et al., 2010), we include an extensive list of additional variables in our models to control for
other factors that are associated with tax avoidance. ROA is measured using pre-tax income and
captures the profitability of firms while LEV represents financial leverage. Profitable firms and
firms with greater leverage or complex financing arrangements have greater incentives and
opportunities, respectively, to avoid taxes.
The natural log of total assets (SIZE) controls for the influence of firm size while
FOROPS captures the presence of operations in foreign jurisdictions. BM or book-market ratio
controls for a firm’s growth opportunities. Although larger firms can have greater incentives to
tax plan, they can face higher political costs also (Zimmerman, 1983) and thus we do not predict
a direction of association between our tax avoidance proxies and SIZE. Firms taking advantage
of foreign tax rate differentials as well as those firms with stable growth (i.e. higher BM) should
avoid more tax on average.
Firms that perform poorly have fewer financial resources to allocate to their various
functions, often because their primary concern is to remain in business. Such firms will likely
allocate fewer resources to their tax function and thus pay tax at a rate closer to the prevailing

[13]
statutory tax rate while they attempt to return the business to profitability for financial
accounting purposes. Consistent with Bauer (2011), we control for consecutive accounting losses
(AGGR_LOSS) and constrained cash flow resources (COCF).10
We include INTANG and R&D to control for intangible asset and R&D intensity. We
would expect that the more intensely a firm’s business model is driven by intangible assets,
which are easier to shift to low tax jurisdictions, the higher the level of tax avoidance. R&D and
PPE are also expected to lead to lower taxes relative to the statutory benchmark and thus a
positive relation for SPREAD_INC and SPREAD_CF (a negative relation for RATIO_INC and
RATIO_CF) because these assets generate large tax deductions which decrease the tax base.
Finally, we control for financial reporting aggressiveness and include the performance-adjusted
discretionary accruals variable DAP in our models. Frank et al. (2009) show that financial
reporting aggressiveness and tax aggressiveness are positively related, thus we expect DAP to be
positively associated with tax avoidance.
C. Sample
We begin by collecting data available from the Thompson Reuters Datastream Advance
Database. We rely primarily on accounting data from Worldscope (WC), although market level
data is available through Datastream. We restrict our selection to securities that contain primary
quotes, but we allow for all major security types, equity instruments and American or Global
Depository Receipts. Next, we eliminate those observations that have missing fiscal year-end
dates (WC05350) and thus missing accounting data. Further, we restrict our sample to the fiscal
years 1993 through 2008. These criteria result in 479,376 firm-year observations.
10 Tax loss carryovers represent an additional control that would be appropriate in this setting. Tax losses can be used to reduce tax payments in subsequently profitable periods. However, such data is not separately identifiable in Datastream.

[14]
Following a match of our country-level tax data from the OECD to our Datastream
sample, we have 362,930 observations remaining. After eliminating observations where CSTR or
the type of tax system is missing, we have 336,816 observations. Finally, in order to use a
consistent sample across our empirical tests, we eliminate observations with missing values in
any of our dependent or independent variables or with missing industry values. Because we
require one-year lag values of total assets to scale our continuous variables, the year 1993 is
effectively removed from our dataset. Our final sample includes 52,895 firm-year observations
from 1994 through 2008. We attempt to minimize the undue influence of outlier observations by
winsorizing all continuous variables in the 1st and 99th percentiles of their respective
distributions. For our dependent variables, we adjust the Cash ETR measures before we calculate
our spreads and ratios. We provide more detail on the variable construction in Appendices A and
B.
C. Descriptive statistics
Table 1 presents the various countries in our dataset and whether or not they have an
imputation system. Our sample is comprised of 14,389 firm-year observations from imputation
countries (27% of the sample). Eleven countries have an imputation system during our sample,
such as Australia, Canada, Finland, France, Germany and the United Kingdom. Finland, France
and Germany are among the seven countries that have undergone a change in their imputation
system during our sample period.
Table 2, Panels A and B provide descriptive statistics for our sample firms. Panel A
reports statistics for the entire sample. Panel B compares the mean and median values of our
dependent and independent variables across imputation and non-imputation countries. For all
four of our dependent variables, the differences in mean and median values are significant at the

[15]
1% level. Firms in non-imputation countries have a mean (median) SPREAD_INC value of 0.031
(0.087) while firms in imputation countries have a mean (median) SPREAD_INC value of 0.016
(0.062). Likewise, mean (median) SPREAD_CF values are higher in non-imputation countries,
0.135 (0.187), than imputation countries, 0.085 (0.128). Higher spreads in non-imputation
countries are consistent with higher tax avoidance in those countries. When we examine the
ratios, we find the mean (median) RATIO_INC of 0.922 (0.768) in non-imputation countries is
lower than the mean (median) RATIO_INC of 0.957 (0.796) in imputation countries. The
differences in the mean and median values of RATIO_CF are also significantly lower.
Consistent with the conclusions from the spreads, lower ratios in non-imputation countries also
suggest higher tax avoidance in those countries.
Reviewing the independent variables in Panel B of Table 2, we see significant variation
in most of the mean and median values. Mean ROA and LEV values are lower in non-imputation
countries, suggesting less profitability and leverage on average in these countries. Firms tend to
be larger and have more stable growth in non-imputation countries compared to imputation
countries; however, resources (AGGR_LOSS and COCF) appear to be more constrained in non-
imputation countries as well. Imputation countries appear to use intangible assets and capital
assets more intensely than non-imputation countries, but the opposite is true of R&D.11 FOROPS
and DAP are not significantly different across the two tax systems. The significant differences in
most of these independent variables support the importance of controlling for these factors in our
empirical models.
11 The difference in intangible assets could also be driven by differences in financial accounting standards across countries.

[16]
IV. Results
A. The relation between tax avoidance and country-level imputation systems
Table 3 presents the empirical results from the estimation of equation (1). The table
contains four columns for each measure of tax avoidance used as the dependent variable. In
Model 1, with SPREAD_INC as the dependent variable, the coefficient on IMP_DUM is negative
and significant (coefficient of -0.029 with a t-statistic of -5.77) as predicted. This coefficient
implies that the difference between the statutory tax rate and the taxes paid by firms within a
country is smaller on average in countries with an imputation system. Thus, firms in countries
with imputation systems appear to avoid less tax than firms in countries without an imputation
system, consistent with our predictions. In Model 2, we would expect to see a similar relation
between SPREAD_CF and IMP_DUM. The significantly negative coefficient on IMP_DUM
(coefficient of -0.057 with a t-statistic of -16.14) supports this expectation. In economic terms,
the coefficient on IMP_DUM of -0.029 from Model 1 suggests that the average spread between
the statutory tax rate and the rate of actual taxes paid for firms under an imputation system is
approximately zero (0.031 from Table 2, Panel B less 0.029 = 0.002). The coefficient on
IMP_DUM from Model 2 implies that tax avoidance (SPREAD_CF) is 42.2% (-0.057/0.135)
lower in the presence of imputation.
Table 3 shows that the coefficients for ROA, SIZE, AGGR_LOSS, COCF, PPE, R&D and
DAP are statistically significant across Models 1 and 2. LEV and BM are statistically significant
in Model 1 only, while FOROPS and INTANG are statistically significant in Model 2 only. In
general, the signs of the coefficients are consistent in the two models and thus tax avoidance is
associated with higher leverage, growth and discretionary financial accruals, larger firms and
operations in foreign jurisdictions, greater intangible, capital and R&D intensity, and lower cash

[17]
flow constraints. ROA is positive and AGGR_LOSS is negative in Model 1, but the signs are the
opposite in Model 2. Both measures rely on book income in their calculation, as does
SPREAD_INC. SPREAD_CF, however, relies on cash flows from operations and this difference
in measurement could explain the opposite signs.
As an alternative to the spread measures of Models 1 and 2, Models 3 and 4 use ratios of
cash taxes to the statutory rate as measures of tax avoidance. The higher these ratios, the less tax
firms avoid. RATIO_INC is positively and significantly associated with IMP_DUM in Model 3
(coefficient of 0.073 with a t-statistic of 4.85) and RATIO_CF is positively and significantly
associated with IMP_DUM in Model 4 (coefficient of 0.101 with a t-statistic of 9.17). These
coefficients imply less tax avoidance on average in imputation countries, consistent with the
results from Models 1 and 2. Economically, these coefficients imply firms from countries with
imputation systems have average ratios of taxes paid to statutory rates 7.8% and 15.4% higher,
respectively, compared to non-imputation firms. The signs and significance of the control
variable coefficients in Models 3 and 4 are consistent with those of Models 1 and 2, noting that
the signs of these coefficients should switch when a ratio is used for the dependent variable
rather than a spread.
B. The relation between tax avoidance and the type of country-level imputation system
In equation (2), we dichotomize imputation countries into partial and full imputation
systems and estimate our empirical model with the four different dependent variables.
IMP_PARTIAL equals one for firms that reside in countries with partial imputation systems, and
zero otherwise, and IMP_FULL equals one for firms that reside in countries with full imputation,
and zero otherwise. Table 4 presents the results of this estimation, including F-tests comparing
the coefficients of the partial and full imputation tax systems.

[18]
In Models 1 and 2 of Table 4, the coefficients on IMP_PARTIAL and IMP_FULL are
negative and significant, consistent with the earlier evidence provided in Table 3. Furthermore in
Models 1 and 2, the IMP_FULL coefficients of -0.064 and -0.065 are larger than the respective
IMP_PARTIAL coefficients of -0.019 and -0.055. However, only the F-test in Model 1
significantly rejects the null that the two coefficients are equal (Model 1: F-statistic 21.991,
probability 0.000; Model 2: F-statistic 2.015, probability 0.156). Nevertheless, these tests
provide some evidence that the higher the level of imputation within a country, the less tax firms
avoid.
Models 3 and 4 of Table 4 provide similar evidence. The coefficients on IMP_PARTIAL
and IMP_FULL are positive and statistically significant. Furthermore, like Models 1 and 2, the
coefficients of IMP_FULL (0.178 and 0.115, respectively) are larger than the coefficients of
IMP_PARTIAL (0.045 and 0.097, respectively) in Models 3 and 4. The F-statistic of 18.142
(probability 0.000) rejects the null for Model 3, but the F-statistic of 0.697 (probability 0.404)
does not reject the null for Model 4. Overall, our expectations about the relation between tax
avoidance and the type of imputation system are supported, regardless of whether the dependent
measure is a spread or a ratio. This evidence also suggests that tax avoidance on average is
lowest in full imputation countries.
C. Tax avoidance following elimination of a country-level imputation system
The coefficients on the imputation variables in Tables 3 and 4 reflect average effects for
cross-sections of firms. Recall that our sample of observations contains several countries that
eliminate their imputation systems during our sample period in response to European Court of
Justice (ECJ) rulings as well as other reasons. The firms, which are residents of countries that

[19]
eliminate imputation, could have different levels of tax avoidance in the pre and post periods that
are not observable by the average effects reported in Tables 3 and 4.
To examine whether the elimination of an imputation system has a significant influence
on tax avoidance, we use equation (3) as a form of difference in differences estimation and
substitute three new indicator variables into our empirical models. IMP equals one for countries
that have ever had an imputation system during our sample period, and zero otherwise. POST
equals one for the years after a country eliminates its imputation system, and zero otherwise.
IMP_POST represents the countries that eliminate their imputation system in the years after the
elimination (i.e. the interaction of IMP and POST).
With this basic construction, POST and IMP_POST are collinear. The issue is that
different countries can eliminate their imputation system at different times and thus we cannot
simply choose one period in time as a partition for all countries, regardless of the presence or
absence of imputation. To respond to this issue, we randomly determine a year in our sample
period as a partition period. Subsequently, we adjust POST such that all countries that never
change their tax system are assigned years equal to one after this randomly chosen period in
time. Finally, we adjust IMP_POST to reflect this update in POST.
Table 5 reports the results of these difference-in-differences models. In Models 1 and 2,
IMP is negative and statistically significant and in Models 3 and 4, IMP is positive and
statistically significant (all at 1% levels). These coefficients corroborate the results in our
previous analysis, that on average firms in imputation countries engage in less tax avoidance.
Across all four models, POST is not statistically significant. Consistent with our predictions,
IMP_POST is positive and statistically significant in Models 1 and 2 and negative and
statistically significant in Models 3 and 4 (all at 1% levels). Thus, all four models provide strong

[20]
evidence that tax avoidance increases in countries following the elimination of imputation. On
the whole, this evidence is consistent with our predictions that firms in countries without
imputation systems avoid more corporate taxes than firms in countries with imputation systems.
D. Tax Avoidance Following Changes in the Canadian Imputation System
In Equation (4) we implement a second difference in differences model to examine the
implementation of additional imputation credits in 2006 for large, Canadian firms. We expect
Canadian firms to reduce their tax avoidance activity following the change in legislation more so
than other countries in the same period. Table 6 reports the variable of interest,
CANADA_POST06, is negative and statistically significant, which is consistent with our
prediction. This result suggests that implementing an imputation system as a policy could reduce
tax avoidance.
E. Additional tests
E.1 Inclusion of additional control variables
Our models control for some country-level factors by estimating DAP at the year-
industry-country level and by benchmarking our dependent variables against country-level
statutory tax rates. However, to examine the sensitivity of our results to additional country-level
control variables that may influence our inferences, we include an extensive set of variables that
are included in prior literature, specifically Atwood et al. (2011). We do not include these
variables in our main tests because they significantly reduce the number of countries in our
sample and thus reduce the generalizability of our results. As discussed below, inclusion of these
variables does not change any of our inferences.
The results in Table 7 include the variables BTAXC (country-level book-tax conformity),
WW (worldwide tax system), TAXENF (tax enforcement index), COMLAW (common law legal

[21]
system), INVRIGHTS (investor rights index), OWNCON (ownership concentration index),
POPGRT (population growth) and GDP (index in constant $2005). While these variables are
generally statistically significant and have the expected signs, our main variables of interest also
remain statistically significant and have the expected signs. Specifically, the analysis in Panels A
and B of Table 7 replicate the analysis of Tables 3 and 5, respectively, and we continue to find
that IMP_DUM is associated with less tax avoidance (Panel A) and the interaction variable
IMP_POST (Panel B) is associated with more tax avoidance. In summary, increasing the internal
validity of our results relative to their external validity yields consistent evidence.
E.2 Long-run cash ETR
Our main analyses use firm-year Cash ETRs in the construction of the SPREAD_INC,
SPREAD_CF, RATIO_INC and RATIO_CF, which are noisy approximations of tax avoidance.
However, we use them to preserve the size of the rich international sample of firm-years. To
address the measurement error in firm-year Cash ETRs, Dyreng et al. (2008) use five-year
averages. Therefore, we also conduct our original analysis from Table 3 using long-run Cash
ETR, which we calculate as the five-year average Cash ETR subsequently subtracted from or
divided by the respective five-year average statutory corporate tax rate in each country. We also
construct five-year averages for all of our independent variables. In this analysis, our sample size
is reduced from 52,895 observations to as few as 18,355 observations, but the untabulated results
are consistent with the main findings in Table 3. That is, we find that IMP_DUM is statistically
significant and negatively associated with tax spreads and statistically significant and positively
associated with tax ratios. The signs and significance of the control variables are generally
consistent with the results from Table 3. Altogether, our analysis with long-run Cash ETRs

[22]
supports our earlier evidence that firms in countries with imputation systems avoid less corporate
tax than firms in country without such systems.
E.3 Effective tax rate (ETR)
Given the international setting, it is difficult to identify tax avoidance measures that can
be consistently estimated across countries. One reason is the financial statement data reported on
Datastream is not as readily available as it is for U.S. companies reported in Compustat.
Therefore, the calculation of common measures of tax avoidance, such as book-tax differences,
requires several variables to be ignored in their estimation or the observations must be dropped
from the analysis.
The data to calculate effective tax rates (ETR) is readily available, but the differences in
accounting standards across countries create inconsistencies in reported tax expense limiting the
suitability of ETRs. However to be complete, we replicate our analysis in Table 3 using ETR in
place of Cash ETR. In untabulated tests, we find that our results hold, albeit not as significantly,
with the ETR tax avoidance measures as the dependent variables. The coefficients on the
imputation variables are statistically significant in regressions that examine the difference
between the statutory corporate tax rates while the coefficients are statistically significant less
frequently when the ratio of ETR to statutory corporate tax rate is the dependent variable.
E.4 Country-level fixed effects
All of our empirical models include year and industry fixed effects, and the estimation of
these models relies on standard errors clustered by firm. Our empirical models do not include
country fixed effects. Inclusion of these fixed effects would subsume the influence of country-
level imputation systems that we are interested in. Our imputation variables are generally static
and resemble fixed effects by construction, except for the relatively small subset of countries that
[23]
change their tax system. Estimation of a model that includes country-level fixed effects
effectively removes the influence of countries with imputation systems that never change. Thus,
IMP_DUM becomes a variable which captures only the influence of countries that change
imputation systems. Consistent with our analysis in Section III C, untabulated analysis shows
that positive and significant coefficients for IMP_DUM are estimated when country-level fixed
effects are included in Models 1 and 2. These coefficients reflect that firms in countries that
eliminate imputation avoid more tax on average.
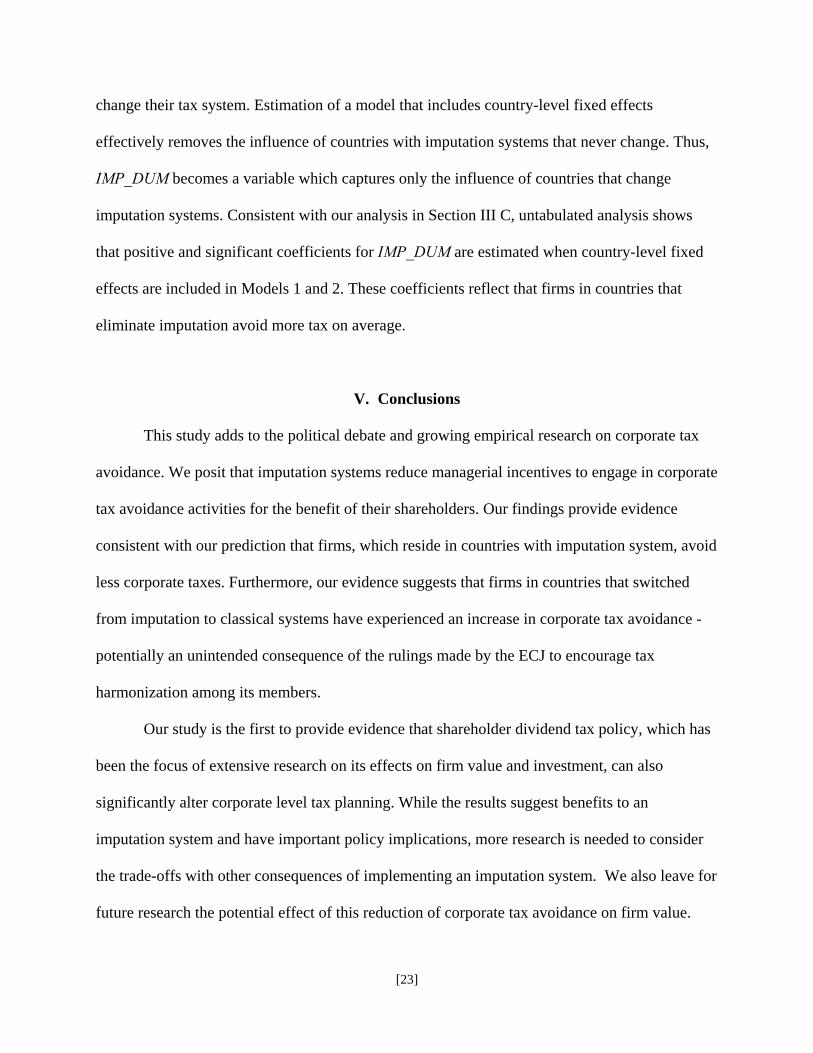
V. Conclusions
This study adds to the political debate and growing empirical research on corporate tax
avoidance. We posit that imputation systems reduce managerial incentives to engage in corporate
tax avoidance activities for the benefit of their shareholders. Our findings provide evidence
consistent with our prediction that firms, which reside in countries with imputation system, avoid
less corporate taxes. Furthermore, our evidence suggests that firms in countries that switched
from imputation to classical systems have experienced an increase in corporate tax avoidance -
potentially an unintended consequence of the rulings made by the ECJ to encourage tax
harmonization among its members.
Our study is the first to provide evidence that shareholder dividend tax policy, which has
been the focus of extensive research on its effects on firm value and investment, can also
significantly alter corporate level tax planning. While the results suggest benefits to an
imputation system and have important policy implications, more research is needed to consider
the trade-offs with other consequences of implementing an imputation system. We also leave for
future research the potential effect of this reduction of corporate tax avoidance on firm value.

[24]
Appendix A Definition of Variables
Tax Avoidance Description and/or Data Details and Source SPREAD_INC
CSTRjt - CASH_ETR_INCijt
Annual tax avoidance spread, calculated as the corporate statutory tax rate in country j less the annual income-based Cash ETR value for firm i in country j.
SPREAD_CF
CSTRjt - CASH_ETR_CFijt
Annual tax avoidance spread, calculated as the corporate statutory tax rate in country j less the annual cash flow-based Cash ETR value for firm i in country j.
RATIO_INC
CASH_ETR_INCijt / CSTRjt Annual tax avoidance ratio, calculated as the annual income-based Cash ETR value for firm i in country j divided by the corporate statutory tax rate in country j.
RATIO_CF
CASH_ETR_CFijt / CSTRjt Annual tax avoidance ratio, calculated as the annual cash flow-based Cash ETR value for firm i in country j divided by the corporate statutory tax rate in country j.
CASH_ETR_INC TXPDijt / (PINCijt – DOPSCFijt – XITEMSijt)
Annual Cash ETR, calculated as taxes paid (WC04150) divided by [pre-tax income (WC01401) less discontinued operations (WC04054) & extraordinary items (WC04225)]. Set to missing if denominator <= 0. Source: Datastream (DS) / Worldscope (WC)
CASH_ETR_CF TXPDijt / (NCFOijt + TXPDijt) Alternative annual Cash ETR, calculated as taxes paid divided by [net cash flow from operations (WC04860) plus taxes paid]. Set to missing if denominator <= 0. Source: Datastream (DS) / Worldscope (WC)
CSTR Corporate statutory tax rate Collected as reported by source. Source: OECD and hand collection
Tax System Description and/or Data Details and Source IMP_DUM Indicator variable for the
presence of imputation
Equal to 1 if country j in year t has a non-zero imputation rate, 0 otherwise. Source: OECD and hand collection
IMP_PARTIAL Indicator variable for the presence of partial imputation
Equal to 1 if country j in year t has a non-zero imputation rate and participates in partial imputation, 0 otherwise. Source: OECD and hand collection
IMP_FULL Indicator variable for the presence of full imputation
Equal to 1 if country j in year t has a non-zero imputation rate and participates in full imputation, 0 otherwise. Source: OECD and hand collection
IMP Indicator variable for a country that has ever had an imputation system
Equal to 1 if country j has ever had an imputation system at any time during the sample period, 0 otherwise. Source: OECD and hand collection
POST Indicator variable for the period after an actual or “induced” elimination of an imputation system
Equal to 1 if year t is after or includes the year country j eliminates its imputation system or if year t is after or includes the randomly selected year for all countries that never change their imputation system, 0 otherwise.

[25]
Source: OECD and hand collection IMP_POST Interaction variable: Countries
that eliminate imputation* POST
Equal to 1 if year t is after or includes the year country j changes its imputation system, 0 otherwise. Source: OECD and hand collection
CANADA Indicator variable for Canada
Equal to 1 if country j is Canada, 0 otherwise. Source: OECD and hand collection
POST06 Indicator variable for the period after and including 2006
Equal to 1 if year t is after or includes 2006, which corresponds to the inclusion of an additional imputation credit for public companies in Canada, 0 otherwise. Source: OECD and hand collection
CANADA_POST06 Interaction variable: CANADA * POST
Equal to 1 if country j is Canada and year t is after or includes 2006, 0 otherwise. Source: OECD and hand collection
Control Variables Description and/or Data Details and Source ROA (PINCijt – XITEMSijt) / TAijt-1 Return on Assets, calculated as pre-tax income
less extraordinary income divided by lagged assets (WC02999). Source: Datastream (DS) / Worldscope (WC)
LEV LTDijt / TAijt-1 Leverage, calculated as long-term debt (WC03251) divided by lagged assets. Source: Datastream (DS) / Worldscope (WC)
SIZE Natural log (TAijt) Firm size, calculated as the natural logarithm of total assets. Source: Datastream (DS) / Worldscope (WC)
FOROPS Indicator variable for foreign operations
Equals 1 if foreign income (WC07126) is non-missing and non-zero, 0 if missing or zero. Source: Datastream (DS) / Worldscope (WC)
BM CEQijt-1 / MKTCAPijt-1 Book-market ratio, calculated as opening common equity (WC03501) at t divided by opening market capitalization (WC08002) at t. Source: Datastream (DS) / Worldscope (WC)
AGGR_LOSS Indicator variable for consecutive accounting losses
Equals 1 if the sum of earnings before extraordinary items and dividends (WC01551) at t and t-1 < 0, 0 otherwise. Source: Datastream (DS) / Worldscope (WC)
COCF 1 – (NCFOijt / TAijt-1) Cash flow constraint, calculated as 1 minus (net cash flow from operations divided by lagged assets). Source: Datastream (DS) / Worldscope (WC)
INTANG OIANijt / TAijt-1 Intangible intensity, calculated as intangible assets (WC02649) divided by lagged assets. Source: Datastream (DS) / Worldscope (WC)
PPE PPENijt / TAijt-1 Capital intensity, calculated as capital assets (WC02501) divided by lagged assets. Source: Datastream (DS) / Worldscope (WC)
R&D RDijt / TAijt-1 R&D intensity, calculated as R&D expense (WC01201) divided by lagged assets. Source: Datastream (DS) / Worldscope (WC)
DAP Performance-adjusted discretionary accruals
See Appendix B.

[26]
Additional Control Variables Description and/or Data Details and Source BTAXC Country-level book-tax
conformity index A proxy for the level of required book-tax conformity measured at the country-level. Source: Atwood et al. (2011)
WW Indicator variable for the presence of a worldwide tax system
Equals 1 if country j has a worldwide tax system, 0 otherwise. Source: Atwood et al. (2011)
TAXENF Country-level tax enforcement index
A proxy for the level of tax enforcement measured at the country-level. Source: Atwood et al. (2011)
COMLAW Indicator variable if a country has a common law legal system
Equals 1 if country j has a common law legal system, 0 otherwise. Source: La Porta et al. (2011)
INVRIGHTS Country-level strength of investor rights index
A proxy for the strength of investor rights measured at the country-level. Source: La Porta et al. (2011)
OWNCON Country-level ownership concentration index
A proxy for the country-level ownership concentration. Source: La Porta et al. (2011)
POPGRT Annual percentage change in country population
Population growth, calculated as the year-to-year percentage change in the population of country j. Source: OECD
GDP GDP index in constant $2005 Gross Domestic Product of country j in year t in constant 2005 US dollars. Source: OECD
*All continuous variables are winsorized at the 1st and 99th percentile to mitigate the influence of outliers.

[27]
Appendix B Performance-Adjusted Discretionary Accruals
We calculate the independent variable DAP as the performance-adjusted discretionary accruals measure of financial reporting aggressiveness consistent with Kothari et al. (2005) and Frank et al. (2009). This measure requires calculation of discretionary accruals, which we base on the modified-Jones model (Dechow et al. 1995). First, we estimate total accruals (TACC) using the following model by two-digit ICB code (from Worldscope), fiscal year and country, where all variables (including the intercept) are scaled by lagged total assets.
TACCijt = β0 + β1(ΔREVijt – ΔARijt) + β2PPEijt + μijt (B.1)
Where: TACCijt = [NICFijt + TXijt – (NCFOijt + TXPDijt – DOPSCFijt – XITEMSijt)]; NICFijt = income before extraordinary items from the statement of cash flows (WC04001) for firm i of country j in year t; TXijt = total tax expense (WC01451) for firm i of country j in year t; NCFOijt = net cash flows from operations as detailed in Appendix A; TXPDijt = taxes paid as detailed in Appendix A; DOPSCFijt = discontinued operations from the cash flow statements as detailed in Appendix A; XITEMSijt = extraordinary items from the statement of cash flows as detailed in Appendix A; ΔREVijt = sales (WC01001) of firm i of country j in year t less its sales in year t-1; ΔARit = total receivables (WC02051) of firm i of country j in year t less its total receivables in year t-1; PPEit = capital assets as detailed in Appendix A; μit = the unadjusted discretionary accruals measure of firm i in year t, a residual value. Second, after estimating the discretionary accruals residual μ from Equation (B.1) we rank ROA by industry-year-country put them into ROA deciles and determine the median discretionary accrual value. Individual values of μ are set to missing if less than 10 observations exist for a particular industry-year-country decile. We then subtract the median industry-year-country-ROA_decile discretionary accrual value from each observation’s residual value to get the performance-adjusted discretionary accrual measure DAP. We adjust the median values of each industry-year-country-ROA_decile group such that no median value is calculated while including the specific observation for which we are estimating DAP. Overall, DAP is an annual value calculated for each firm-year-country observation in our sample (where data is available). DAP is winsorized after estimation at the 1st and 99th percentile to mitigate any undue influence of outlier observations.

[28]
References
Amiram, D. and M.M. Frank. 2011. “The Effects of the Taxation of Dividends on the Allocation of
Foreign Portfolio Investment around the World.” Working paper, Columbia University.
Atwood, T., M. Drake, J. Myers and L. Myers. 2011. “Home Country Tax System Characteristics and
Corporate Tax Avoidance: International Evidence.” Working paper, University of Arkansas.
Avi-Yonah, R. S. 2000. “Globalization, Tax Competition and the Fiscal Crisis of the Welfare State.”
Harvard Law Review 113 (7): 1573.
Bauer, A. 2011. “Internal Control Quality as an Explanatory Factor of Tax Avoidance.” Working paper,
University of Waterloo.
Chen, S., X. Chen, Q. Cheng and T. Shevlin. 2010. "Are family firms more tax aggressive than non-
family firms?" Journal of Financial Economics 95(1):41.
Citizens for Tax Justice. 2011. "Corporate Taxpayers and Corporate Tax Dodgers 2008-2010".
Dechow, P. M., R. G. Sloan and A. P. Sweeney. 1995. “Detecting earnings management.” The
Accounting Review 70(2):193.
Desai, M.A. and D. Dharmapala. 2006. “Corporate tax avoidance and high-powered incentives.” Journal
of Financial Economics 79(1): 145.
Dittmer, P., “U.S. Corporations Suffer High Effective Tax Rates by International Standards” The Tax Foundation (September 2011).
Drucker, J. “Google 2.4% Rate Shows How $60 Billion Lost to Tax Loopholes” Bloomberg
Dyreng, S., M. Hanlon and E. Maydew. 2008. "Long-Run Corporate Tax Avoidance." The Accounting
Review 83(1):61.
Dyreng, S., M. Hanlon and E. Maydew. 2010. “The Effects of Executives on Corporate Tax Avoidance.”
The Accounting Review 85(4): 1163.
Frank, M., L. Lynch and S. Rego. 2009. "Tax Reporting Aggressiveness and Its Relation to Aggressive
Financial Reporting." The Accounting Review 84(2):467.

[29]
Frank, M., L. Lynch., R, Zhao, and S. Rego. 2011. "Are Aggressive Reporting Practices Indicative of an
Aggressive Corporate Culture?” Working paper, Indiana University.
Graetz, M. and A. Warren. 2006. “Income Tax Discrimination and the Political and Economic Integration
of Europe.” Yale Law Journal 115 (April): 1186
Gupta, S. and K. Newberry. 1997. "Determinants of the variability in corporate effective tax rates:
Evidence from longitudinal data." Journal of Accounting and Public Policy 16(1):1.
Kim, J., Y. Li, and L. Zhang. 2011, “Corporate Tax Avoidance and Stock Price Crash Risk: Firm-Level
Analysis.” Journal of Financial Economics 100: 639.
Kocieniewski. D., “Biggest Public Firms Paid Little in U.S. Tax Study Says”. The New York Times
(November 3, 2011)
Kothari, S. P., A. J. Leone and C. E. Wasley. 2005. “Performance matched discretionary accrual
measures.” Journal of Accounting & Economics 39(1):163.
McIntyre, R., M. Gardner, R. Wilkins, and R. Phillips. “Corporate Taxpayers & Corporate Tax Dodgers
2008-2010” The Citizens for Tax Justice and the Institute for Taxation and Economic Policy
(November 2011)
Mills, L., M. Erickson and E. Maydew. 1998. "Investments in tax planning." The Journal of the American
Taxation Association 20(1):1.
Nocera, J., “Who Could Blame G.E.?” The New York Times (April 4, 2011)
Rego, S. 2003. "Tax-Avoidance Activities of U.S. Multinational Corporations." Contemporary
Accounting Research 20(4):805.
Rego, S. and R.J. Wilson. 2011. “Equity Risk Incentives and Corporate Tax Aggressiveness.” Working
paper, University of Iowa.
Wilson, R. 2009. "An Examination of Corporate Tax Shelter Participants." The Accounting Review 84(3):
969.

[30]
Table 1 Country Composition by Imputation System
The table presents the 52,895 firm-year observations used in the analyses by country and presence of an imputation tax system. Observations span the years 1994 through 2008 and are limited to the OECD countries for which tax data is available.
IMPUTATION FIRM-YEARS COUNTRY NO YES TOTAL FIRM-YEARS Australia 0 2,393 2,393 Austria 54 0 54 Belgium 46 0 46 Canada 0 2,225 2,225 Chile 0 169 169 Czech Republic 4 0 4 Denmark 268 0 268 Finland 161 194 355 France 822 24 846 Germany 977 63 1,040 Greece 137 0 137 Ireland 9 0 9 Israel 53 0 53 Italy 223 10 233 Japan 11,059 0 11,059 Korea (South) 2 0 2 Mexico 14 2 16 Netherlands 265 0 265 New Zealand 0 27 27 Norway 78 150 228 Poland 27 0 27 Portugal 22 0 22 Spain 10 4 14 Sweden 861 0 861 Switzerland 925 0 925 Turkey 158 0 158 United Kingdom 0 9,128 9,128 United States 22,331 0 22,331 TOTAL 38,506 14,389 52,895

[31]
Table 2 Descriptive Statistics
The table presents descriptive statistics for the 52,895 firm-year observations from year 1994 through 2008 used in the analyses. Panel A reports the descriptive statistics for the entire pooled sample. Panel B compares the mean and median values for firm-years with and without an imputation tax system. The last two columns in Panel B report the two-sided p-values for the difference between the mean and medians of the two groups, respectively. T-tests are used to test the difference in means and Wilcoxon rank tests, with continuity correction, are used to test the difference in medians. See Appendix A for detailed variable definitions. Panel A: Full Sample
N = 52,895
Mean Median Std Dev Min Max
Dependent Variables Tax Avoidance Spreads SPREAD_INC 0.027 0.080 0.415 -3.046 0.676SPREAD_CF 0.121 0.170 0.313 -2.302 0.625Tax Avoidance Ratios RATIO_INC 0.932 0.777 1.161 -0.984 16.232RATIO_CF 0.674 0.526 0.876 -0.933 12.511 Independent Variables IMP_DUM 0.272 0.000 0.445 0 1IMP_PARTIAL 0.215 0.000 0.411 0 1IMP_FULL 0.057 0.000 0.232 0 1ROA 0.115 0.088 0.101 0.000 0.590LEV 0.177 0.119 0.214 0.000 1.616SIZE 13.574 13.318 2.440 4.288 24.701FOROPS 0.336 0.000 0.472 0 1BM 5.657 0.543 19.723 -3.096 149.374AGGR_LOSS 0.063 0.000 0.243 0 1COCF 0.880 0.900 0.094 0.466 1.404INTANG 0.162 0.055 0.247 0.000 1.649PPE 0.339 0.274 0.284 0.000 1.854R&D 0.022 0.000 0.049 0.000 0.629DAP -0.010 -0.002 0.176 -1.182 1.129

[32]
Table 2 – continued
Panel B: Comparison across the presence of an imputation system
N Mean Median N Mean Median Mean Median
Dependent Variables No Imputation Imputation P-value of difference
SPREAD_INC 38,506 0.031 0.087 14,389 0.016 0.062 0.00 0.00SPREAD_CF 38,506 0.135 0.187 14,389 0.085 0.128 0.00 0.00RATIO_INC 38,506 0.922 0.768 14,389 0.957 0.796 0.00 0.00RATIO_CF 38,506 0.652 0.507 14,389 0.734 0.581 0.00 0.00 Independent Variables ROA 38,506 0.111 0.084 14,389 0.127 0.098 0.00 0.00LEV 38,506 0.173 0.117 14,389 0.186 0.126 0.00 0.00SIZE 38,506 13.841 13.547 14,389 12.860 12.525 0.00 0.00FOR_OPS 38,506 0.336 0.000 14,389 0.337 0.000 0.70 0.71BM 38,506 6.625 0.562 14,389 3.066 0.488 0.00 0.00AGGR_LOSS 38,506 0.065 0.000 14,389 0.060 0.000 0.04 0.04COCF 38,506 0.884 0.903 14,389 0.868 0.893 0.00 0.00INTANG 38,506 0.156 0.057 14,389 0.180 0.048 0.00 0.00PPE 38,506 0.313 0.260 14,389 0.410 0.326 0.00 0.00R&D 38,506 0.025 0.001 14,389 0.013 0.000 0.00 0.00DAP 38,506 -0.010 -0.002 14,389 -0.010 -0.002 0.89 0.83

[33]
Table 3 The Relation between Firms’ Tax Avoidance and Country-Level Imputation Systems
This table presents the results of the estimation of the following equation:
TAX AVOIDANCEit = γ0 + γ1*IMP_DUMit + γ2-k Xit + ψi + ξt + μit.
The dependent variable, TAX AVOIDANCEit, varies between SPREAD_INCit and SPREAD_CFit, which are larger the more a firm avoid taxes, and RATIO_INCit and RATIO_CFit, which are smaller the more a firm avoids taxes. IMP_DUMit equals one if a firm’s country of residence has an imputation tax system during the year, 0 otherwise. Xit represents a set of control variables included in the model and ψi and ξt represent untabulated industry and year fixed effects, respectively. Further variable descriptions are reported in Appendices A and B. Standard errors have been adjusted for clustering within firm and the related t-statistics are reported in parentheses. *, **, *** refer to significance at the 10%, 5% and 1% levels, respectively. Significance for all variables is calculated using two-tailed tests.
Firms from countries with imputation systems are predicted to have
smaller tax spreads.
Firms from countries with imputation systems are predicted to have
larger tax ratios.
Variables
(1) SPREAD_INC
(2) SPREAD_CF
(3)
RATIO_INC (4)
RATIO_CF
IMP_DUM -0.029*** -0.057*** 0.073*** 0.101*** (-5.77) (-16.14) (4.85) (9.17) ROA 0.537*** -1.506*** -1.551*** 4.155*** (17.42) (-51.87) (-18.04) (50.96) LEV 0.078*** 0.013 -0.220*** -0.035 (6.17) (1.46) (-6.27) (-1.34) SIZE 0.003*** 0.008*** -0.009** -0.022*** (2.59) (9.79) (-2.57) (-9.91) FOROPS -0.002 0.012*** 0.009 -0.028*** (-0.35) (3.89) (0.65) (-3.16) BM 0.000*** -0.000 -0.001*** 0.000 (3.40) (-0.85) (-3.62) (0.71) AGGR_LOSS -0.027** 0.079*** 0.092** -0.209*** (-1.99) (13.65) (2.38) (-13.00) COCF -0.404*** -2.220*** 1.027*** 6.154*** (-12.21) (-57.21) (11.20) (56.31) INTANG -0.001 0.014** 0.038 -0.026 (-0.13) (2.01) (1.25) (-1.30) PPE 0.037*** 0.037*** -0.115*** -0.099*** (3.66) (4.85) (-3.88) (-4.52) R&D 0.181*** 0.125*** -0.501*** -0.271** (3.34) (3.02) (-3.45) (-2.29) DAP 0.135*** 0.051*** -0.359*** -0.144*** (10.13) (6.72) (-10.25) (-7.01) Intercept 0.231*** 2.103*** 0.452*** -4.816*** (6.37) (57.44) (4.51) (-46.64) Observations 52,895 52,895 52,895 52,895 Adjusted R2 0.059 0.276 0.058 0.266

[34]
Table 4 The Relation between Tax Avoidance and the Type of Country-Level Imputation System
This table presents the results of the estimation of the following equation:
TAX AVOIDANCEit = γ0 + γ1*IMP_PARTIALit + γ2*IMP_FULLit + γ3-k Xit + ψi + ξt + μit.
The dependent variable, TAX AVOIDANCEit, varies between SPREAD_INCit and SPREAD_CFit, which are larger the more a firm avoid taxes, and RATIO_INCit and RATIO_CFit, which are smaller the more a firm avoids taxes. IMP_PARTIALit and IMP_FULLit equal one if a firm’s country of residence has a partial or full imputation tax system, respectively, during the year, 0 otherwise. Xit represents a set of control variables included in the model and ψi and ξt represent untabulated industry and year fixed effects. Further variable descriptions are reported in Appendices A and B. Standard errors have been adjusted for clustering within firm and the related t-statistics are reported in parentheses. *, **, *** refer to significance at the 10%, 5% and 1% levels, respectively. Significance for all variables is calculated using two-tailed tests. F-tests of the difference between IMP_PARTIALit and IMP_FULLit are reported at the bottom of the table.
Firms from countries with full imputation systems are predicted to
have smaller tax spreads.
Firms from countries with full imputation systems are predicted to
have larger tax ratios.
Variables
(1) SPREAD_INC
(2) SPREAD_CF
(3)
RATIO_INC (4)
RATIO_CF
IMP_PARTIAL -0.019*** -0.055*** 0.045*** 0.097*** (-3.56) (-14.20) (2.77) (8.00) IMP_FULL -0.064*** -0.065*** 0.178*** 0.115*** (-7.20) (-10.48) (6.17) (5.93) ROA 0.541*** -1.505*** -1.565*** 4.153*** (17.57) (-51.77) (-18.19) (50.83) LEV 0.080*** 0.014 -0.226*** -0.036 (6.32) (1.50) (-6.43) (-1.37) SIZE 0.003** 0.008*** -0.008** -0.022*** (2.55) (9.77) (-2.52) (-9.90) FOROPS -0.003 0.012*** 0.011 -0.027*** (-0.54) (3.83) (0.85) (-3.11) BM 0.000*** -0.000 -0.001*** 0.000 (3.53) (-0.80) (-3.76) (0.69) AGGR_LOSS -0.028** 0.079*** 0.093** -0.209*** (-2.01) (13.63) (2.41) (-12.98) COCF -0.405*** -2.221*** 1.030*** 6.154*** (-12.26) (-57.23) (11.26) (56.34) INTANG -0.002 0.014** 0.039 -0.026 (-0.15) (2.00) (1.27) (-1.29) PPE 0.036*** 0.036*** -0.110*** -0.099*** (3.51) (4.80) (-3.74) (-4.49) R&D 0.176*** 0.124*** -0.486*** -0.269** (3.24) (2.99) (-3.35) (-2.27) DAP 0.136*** 0.051*** -0.360*** -0.145*** (10.16) (6.74) (-10.29) (-7.02)

[35]
Intercept 0.233*** 2.103*** 0.445*** -4.817*** (6.45) (57.49) (4.44) (-46.69) Observations 52,895 52,895 52,895 52,895 Adjusted R2 0.060 0.276 0.058 0.266 F-test 21.991 2.015 18.142 0.697 (Prob > F) 0.000 0.156 0.000 0.404

[36]
Table 5 Tax Avoidance following Changes from an Imputation to a Non-Imputation System
This table presents the results of the estimation of the following equation:
TAX AVOIDANCEit = γ0 + γ1*IMPj + γ2*POSTit + γ3*IMP_POSTit + γ4-k Xit + ψi + ξt + μit.
The dependent variable, TAX AVOIDANCEit, varies between SPREAD_INCit and SPREAD_CFit, which are larger the more a firm avoid taxes, and RATIO_INCit and RATIO_CFit, which are smaller the more a firm avoids taxes. IMPi equals 1 if a firm’s country of residence has ever had an imputation system in any year of the sample, 0 otherwise. POSTit equals 1 for the period after a firm’s country of residence eliminates its imputation system or for the period after a randomly selected year for all countries that never their change tax system, 0 otherwise. IMP_POSTit is the interaction between POSTit and countries that eliminate their imputation system. Xit represents a set of control variables included in the model and ψi and ξt represent untabulated industry and year fixed effects. Further variable descriptions are reported in Appendices A and B. Standard errors have been adjusted for clustering within firm and the related t-statistics are reported in parentheses. *, **, *** refer to significance at the 10%, 5% and 1% levels, respectively. Significance for all variables is calculated using two-tailed tests.
Firms from countries that eliminate their imputation systems are predicted to have
larger tax spreads after the change.
Firms from countries that eliminate their imputation systems are predicted to have
smaller tax ratios after the change.
Variables (1)
SPREAD_INC (2)
SPREAD_CF (3)
RATIO_INC (4)
RATIO_CF IMP -0.028*** -0.058*** 0.072*** 0.101*** (-5.65) (-16.21) (4.74) (9.18) POST -0.005 0.006 0.011 0.003 (-0.30) (0.61) (0.24) (0.11) IMP*POST 0.040*** 0.046*** -0.107*** -0.101*** (3.46) (5.31) (-3.14) (-3.85) ROA 0.537*** -1.506*** -1.551*** 4.155*** (17.42) (-51.86) (-18.04) (50.95) LEV 0.078*** 0.013 -0.220*** -0.035 (6.17) (1.45) (-6.28) (-1.34) SIZE 0.003** 0.008*** -0.008** -0.022*** (2.56) (9.82) (-2.53) (-9.89) FOROPS -0.001 0.012*** 0.008 -0.028*** (-0.30) (3.82) (0.60) (-3.15) BM 0.000*** -0.000 -0.001*** 0.000 (3.41) (-0.85) (-3.63) (0.71) AGGR_LOSS -0.027** 0.079*** 0.092** -0.209*** (-1.99) (13.64) (2.38) (-13.00) COCF -0.404*** -2.220*** 1.027*** 6.154*** (-12.21) (-57.19) (11.21) (56.31) INTANG -0.002 0.014** 0.039 -0.026 (-0.14) (2.04) (1.27) (-1.30) PPE 0.037*** 0.037*** -0.115*** -0.099*** (3.66) (4.86) (-3.89) (-4.52) RND 0.181*** 0.125*** -0.501*** -0.271**

[37]
(3.34) (3.02) (-3.45) (-2.28) DAP 0.135*** 0.051*** -0.359*** -0.144*** (10.12) (6.73) (-10.24) (-7.01) Intercept 0.235*** 2.097*** 0.443*** -4.820*** (5.90) (54.91) (4.01) (-44.86) Observations 52,895 52,895 52,895 52,895
Adjusted R2 0.059 0.276 0.058 0.266

[38]
Table 6 Tax Avoidance following Changes in the Canadian Imputation System
This table presents the results of the estimation of the following equation:
TAX AVOIDANCEit = γ0 + γ1*IMP_DUMit + γ2*CANADAj + γ3*POST06it + γ4*CANADA_POST06it
+ γ4-k Xit + ψi + ξt + μit.
The dependent variable, TAX AVOIDANCEit, varies between SPREAD_INCit and SPREAD_CFit, which are larger the more a firm avoid taxes, and RATIO_INCit and RATIO_CFit, which are smaller the more a firm avoids taxes. IMP_DUMit equals one if a firm’s country of residence has an imputation tax system during the year, 0 otherwise. CANADAj equals 1 if a firm’s country of residence is Canada, 0 otherwise. POST06it equals 1 for the period after and including 2006, which corresponds to the inclusion of an additional imputation credit for public companies in Canada, 0 otherwise. CANADA_POST06it is the interaction between CANADAi and POST06it. Xit represents a set of control variables included in the model and ψi and ξt represent untabulated industry and year fixed effects. Further variable descriptions are reported in Appendices A and B. Standard errors have been adjusted for clustering within firm and the related t-statistics are reported in parentheses. *, **, *** refer to significance at the 10%, 5% and 1% levels, respectively. Significance for all variables is calculated using two-tailed tests.
Firms from Canada, where more imputation credits are available starting in 2006, are predicted to have smaller tax spreads after the
change.
Firms from Canada, where more imputation credits are available starting in 2006, are predicted to
have larger tax ratios after the change.
Variables (1)
SPREAD_INC (2)
SPREAD_CF (3)
RATIO_INC (4)
RATIO_CF IMP_DUM -0.041*** -0.066*** 0.108*** 0.120*** (-7.87) (-17.31) (6.70) (10.03) CANADA 0.098*** 0.063*** -0.267*** -0.129*** (7.98) (7.56) (-7.86) (-5.55) POST06 -0.062*** -0.039*** 0.179*** 0.099*** (-4.41) (-4.20) (4.81) (4.01) CANADA*POST06 -0.047*** -0.021* 0.107** 0.015 (-2.67) (-1.88) (2.10) (0.46) ROA 0.541*** -1.503*** -1.563*** 4.148*** (17.54) (-51.80) (-18.14) (50.94) LEV 0.077*** 0.013 -0.219*** -0.035 (6.14) (1.43) (-6.25) (-1.33) SIZE 0.003** 0.008*** -0.008** -0.021*** (2.34) (9.54) (-2.32) (-9.70) FOROPS 0.001 0.014*** 0.001 -0.032*** (0.19) (4.44) (0.11) (-3.59) BM 0.000*** -0.000 -0.001*** 0.000 (3.34) (-0.93) (-3.55) (0.77) AGGR_LOSS -0.027** 0.079*** 0.093** -0.209*** (-2.00) (13.62) (2.40) (-12.97) COCF -0.398*** -2.216*** 1.008*** 6.143*** (-12.01) (-57.08) (10.99) (56.29)

[39]
INTANG -0.001 0.014** 0.038 -0.026 (-0.13) (2.01) (1.26) (-1.29) PPE 0.033*** 0.034*** -0.104*** -0.093*** (3.28) (4.47) (-3.51) (-4.23) R&D 0.172*** 0.119*** -0.476*** -0.258** (3.19) (2.89) (-3.29) (-2.18) DAP 0.134*** 0.050*** -0.355*** -0.142*** (10.01) (6.60) (-10.12) (-6.91) Intercept 0.291*** 2.140*** 0.277*** -4.912*** (7.71) (56.98) (2.67) (-46.19) Observations 52,895 52,895 52,895 52,895 Adjusted R2 0.061 0.277 0.059 0.266

[40]
Table 7 The Relation between Tax Avoidance and Country-Level Imputation Systems – Additional Control
Variables This table presents the results of the estimation of the following two equations:
Panel A: TAX AVOIDANCEit = γ0 + γ1*IMP_DUMit + γ2-k Zit + ψi + ξt + μit
Panel B: TAX AVOIDANCEit = γ0 + γ1*IMPj + γ2*POSTit + γ3*IMP_POSTit + γ4-k Zit + ψi + ξt + μit.
The dependent variable, TAX AVOIDANCEit, varies between SPREAD_INCit and SPREAD_CFit, which are larger the more a firm avoid taxes, and RATIO_INCit and RATIO_CFit, which are smaller the more a firm avoids taxes. In panel A, IMP_DUMit equals one if a firm’s country of residence has an imputation tax system during the year, 0 otherwise. In panel B, IMPi equals 1 if a firm’s country of residence has ever had an imputation system in any year of the sample, 0 otherwise. POSTit equals 1 for the period after a firm’s country of residence eliminates its imputation system or for the period after a randomly selected year for all countries that never their change tax system, 0 otherwise. IMP_POSTit is the interaction between POSTit and countries that eliminate imputation. Zit represents a set of control variables that includes Xit and the following additional country-level control variables suggested in the extant literature, including Atwood et al. (2011): BTAXCj, WWj, TAXENFj, COMLAWj, INVRIGHTSj, OWNCONj, POPGRTjt and GDPjt. Untabulated industry and year fixed effects are represented by ψi and ξt, respectively. Further variable descriptions are reported in Appendices A and B. Standard errors have been adjusted for clustering within firm and the related t-statistics are reported in parentheses. *, **, *** refer to significance at the 10%, 5% and 1% levels, respectively. Significance for all variables is calculated using two-tailed tests. Panel A: TAX AVOIDANCEit = γ0 + γ1*IMP_DUMit + γ2-k Zit + ψi + ξt + μit
Firms from countries with imputation systems are predicted to have
smaller tax spreads.
Firms from countries with imputation systems are predicted to have
larger tax ratios.
Variables (1)
SPREAD_INC (2)
SPREAD_CF (3)
RATIO_INC (4)
RATIO_CF IMP_DUM -0.092*** -0.059*** 0.216*** 0.129*** (-9.93) (-10.16) (6.89) (6.73) BTAXC 0.050** -0.081*** -0.092 0.118** (2.32) (-5.29) (-1.36) (2.50) WW -0.090*** -0.031*** 0.245*** 0.122*** (-8.47) (-4.29) (7.47) (5.50) TAXENF -0.034*** -0.012* 0.106*** 0.022 (-3.20) (-1.67) (2.96) (0.94) COMLAW 0.232*** 0.031** -0.574*** -0.138*** (11.18) (2.11) (-9.59) (-3.19) INVRIGHTS -0.034*** -0.007 0.096** 0.033 (-2.67) (-0.79) (2.39) (1.24) OWNCON -0.257** -0.213*** 0.942*** 0.565** (-2.39) (-3.01) (2.59) (2.46) POPGRT -3.300*** -1.935*** 9.227*** 4.870*** (-4.50) (-3.86) (4.04) (3.20) GDP -0.009*** 0.002** 0.016*** -0.006** (-4.91) (2.34) (3.13) (-1.96) ROA 0.510*** -1.515*** -1.471*** 4.141***

[41]
(16.39) (-51.60) (-17.00) (50.63) LEV 0.045*** 0.001 -0.134*** 0.001 (3.63) (0.08) (-3.93) (0.04) SIZE 0.005*** 0.009*** -0.013*** -0.023*** (4.09) (10.80) (-3.81) (-10.43) FOROPS -0.007 0.008*** 0.023* -0.022** (-1.50) (2.64) (1.71) (-2.40) BM 0.000** -0.000 -0.001*** 0.000 (2.48) (-1.49) (-2.61) (1.41) AGGR_LOSS -0.017 0.082*** 0.058 -0.221*** (-1.26) (14.35) (1.51) (-14.05) COCF -0.326*** -2.188*** 0.835*** 6.025*** (-9.72) (-54.98) (9.03) (54.31) INTANG -0.055*** -0.005 0.167*** 0.016 (-5.18) (-0.70) (5.42) (0.80) PPE 0.046*** 0.041*** -0.138*** -0.114*** (4.61) (5.44) (-4.79) (-5.17) R&D 0.118** 0.113*** -0.351** -0.250** (2.24) (2.74) (-2.48) (-2.14) DAP 0.132*** 0.052*** -0.351*** -0.142*** (9.90) (6.85) (-10.04) (-7.05) Intercept 1.361*** 1.991*** -2.021*** -4.517*** (6.45) (15.93) (-3.18) (-12.07) Observations 51,384 51,384 51,384 51,384 Adjusted R2 0.076 0.285 0.072 0.275

[42]
Table 7 (continued) The Relation between Tax Avoidance and Country-Level Imputation Systems – Additional Control
Variables
Panel B: TAX AVOIDANCEit = γ0 + γ1*IMPj + γ2*POSTit + γ3*IMP_POSTit + γ4-k Zit + ψi + ξt + μit.
Firms from countries that eliminate their imputation systems are
predicted to have larger tax spreads after the change.
Firms from countries that eliminate their imputation systems are
predicted to have smaller tax ratios after the change.
Variables (1)
SPREAD_INC (2)
SPREAD_CF (3)
RATIO_INC (4)
RATIO_CF IMP -0.093*** -0.059*** 0.218*** 0.130*** (-9.99) (-10.21) (6.95) (6.77) POST 0.028 -0.006 -0.081 0.026 (1.49) (-0.51) (-1.58) (0.77) IMP*POST 0.106*** 0.087*** -0.268*** -0.162*** (5.70) (6.88) (-4.73) (-4.29) BTAXC 0.051** -0.088*** -0.090 0.129*** (2.30) (-5.59) (-1.30) (2.63) WW -0.088*** -0.027*** 0.237*** 0.118*** (-8.35) (-3.78) (7.11) (5.21) TAXENF -0.030*** -0.005 0.091** 0.015 (-2.61) (-0.71) (2.44) (0.62) COMLAW 0.220*** 0.015 -0.532*** -0.121*** (9.66) (0.92) (-7.99) (-2.60) INVRIGHTS -0.024* 0.005 0.060 0.021 (-1.68) (0.56) (1.37) (0.72) OWNCON -0.202* -0.145** 0.754** 0.493** (-1.85) (-2.01) (2.06) (2.11) POPGRT -3.111*** -1.838*** 8.618*** 4.868*** (-4.22) (-3.60) (3.75) (3.14) GDP -0.009*** 0.003** 0.016*** -0.006** (-4.98) (2.49) (3.19) (-2.07) ROA 0.511*** -1.515*** -1.472*** 4.141*** (16.40) (-51.58) (-17.01) (50.62) LEV 0.045*** 0.001 -0.134*** 0.001 (3.64) (0.08) (-3.94) (0.05) SIZE 0.005*** 0.009*** -0.013*** -0.023*** (4.12) (10.86) (-3.85) (-10.45) FOROPS -0.007 0.008** 0.023* -0.021** (-1.55) (2.55) (1.77) (-2.38) BM 0.000** -0.000 -0.001*** 0.000 (2.47) (-1.52) (-2.61) (1.42) AGGR_LOSS -0.017 0.082*** 0.058 -0.221*** (-1.27) (14.34) (1.53) (-14.04) COCF -0.325*** -2.188*** 0.833*** 6.025*** (-9.71) (-54.96) (9.02) (54.30)

[43]
INTANG -0.055*** -0.005 0.167*** 0.017 (-5.20) (-0.73) (5.44) (0.80) PPE 0.046*** 0.041*** -0.138*** -0.114*** (4.60) (5.44) (-4.78) (-5.17) R&D 0.119** 0.114*** -0.353** -0.251** (2.24) (2.76) (-2.49) (-2.15) DAP 0.132*** 0.052*** -0.351*** -0.142*** (9.90) (6.85) (-10.03) (-7.05) Intercept 1.280*** 1.890*** -1.744*** -4.412*** (5.85) (14.53) (-2.64) (-11.33) Observations 51,384 51,384 51,384 51,384 Adjusted R2 0.076 0.285 0.072 0.275


![FY16 2nd Quarter Financial Results [IFRS] · R&D Shareholder returns Maintain a stable dividend, targeting a dividend payout ratio of 30% Capital investment Increase investments centered](https://img.dokumen.tips/doc/110x75/5ed8d6956714ca7f4768a959/fy16-2nd-quarter-financial-results-ifrs-rd-shareholder-returns-maintain-a.jpg)