Embed Size (px)
Citation preview
The Effect of Storage in Collapsible Containers on Olive Oil Quality
AUGUST 2012 RIRDC Publication No. 12/008


The Effect of Storage in Collapsible Containers on Olive
Oil Quality
Rodney J. Mailer, Kerrie Graham and Jamie Ayton
August 2012
RIRDC Publication No. 12/008 RIRDC Project No. PRJ-006488
ii
© 2012 Rural Industries Research and Development Corporation. All rights reserved.
ISBN 978-1-74254-363-5 ISSN 1440-6845
The Effect of Storage in Collapsible Containers on Olive Oil Quality Publication No. 12/008 Project No. PRJ-006488
The information contained in this publication is intended for general use to assist public knowledge and discussion and to help improve the development of sustainable regions. You must not rely on any information contained in this publication without taking specialist advice relevant to your particular circumstances.
While reasonable care has been taken in preparing this publication to ensure that information is true and correct, the Commonwealth of Australia gives no assurance as to the accuracy of any information in this publication.
The Commonwealth of Australia, the Rural Industries Research and Development Corporation (RIRDC), the authors or contributors expressly disclaim, to the maximum extent permitted by law, all responsibility and liability to any person, arising directly or indirectly from any act or omission, or for any consequences of any such act or omission, made in reliance on the contents of this publication, whether or not caused by any negligence on the part of the Commonwealth of Australia, RIRDC, the authors or contributors.
The Commonwealth of Australia does not necessarily endorse the views in this publication.
This publication is copyright. Apart from any use as permitted under the Copyright Act 1968, all other rights are reserved. However, wide dissemination is encouraged. Requests and inquiries concerning reproduction and rights should be addressed to the RIRDC Publications Manager on phone 02 6271 4165.
Researcher Contact Details
Rodney Mailer PO Box 914 Wagga Wagga NSW 2650 Email: [email protected] Web: www.australian-oils-research.com
In submitting this report, the researcher has agreed to RIRDC publishing this material in its edited form.
RIRDC Contact Details Rural Industries Research and Development Corporation Level 2, 15 National Circuit BARTON ACT 2600 PO Box 4776 KINGSTON ACT 2604 Phone: (02) 6271 4100 Fax: (02) 6271 4199 Email: [email protected]. Web: www.rirdc.gov.au
Electronically published by RIRDC in August 2012 Print-on-demand by Union Offset Printing, Canberra at www.rirdc.gov.au or phone 1300 634 313

iii
Foreword This report is the second stage of a study on storing of olive oil in collapsible containers. In the first report (RIRDC Publication. No. 09/160) olive oil was filled into a range of types of plastic containers with different gas transmission rates and stored in a shed at ambient temperature. Additionally, the containers were exposed to light. In contrast, this current study has utilised more acceptable conditions, storing the oil in a similar range of containers within an air-conditioned environment, sealed in black opaque plastic bins.
The prime purpose of both studies has been to illustrate the influence of the different types of material from which the containers are manufactured on the storage life of olive oil. However, the secondary aim was to illustrate that the external environment in which the containers are stored also has a powerful influence on oil quality.
Although controlled environment storage is generally used by oil producers, it is well known that often oil is stored in sheds or convenient locations on the farm with no proper temperature control. Additionally, oil is often stored in clear or translucent plastic containers without consideration for the effects of light. This report, in conjunction with the previous study, illustrates clearly the importance of temperature and light control and the need to use storage containers constructed of suitable material to exclude air.
This report was funded from RIRDC Core Funds provided by the Australian Government and the Australian Olive Association.
This report is an addition to RIRDC’s diverse range of over 2000 research publications and it forms part of our Olives R&D program, which aims to:
• provide information which establishes the benefits of Australian olive products • maintain the current high quality product while improving productivity, profitability and
environmental management through all stages of the supply chain • develop strategies for existing and new olive producers to reduce the effects of climate change
and variability • build and educated, collaborative, innovative and skilled industry workforce and a cost
effective , well funded RD&E program
Most of RIRDC’s publications are available for viewing, downloading or purchasing online at www.rirdc.gov.au. Purchases can also be made by phoning 1300 634 313.
Craig Burns Managing Director Rural Industries Research and Development Corporation

iv
About the Author Dr Rod Mailer, Australian Oils Research, www.australian-oils-research.com, has been involved in olive research since 1996. He was principal investigator for RIRDC projects: DAN197A -Harvest timing; DAN 237A - Optimal olive oil quality; DAN-239A - Compliance to international standards; PRJ-002297 - Effect of storage containers on olive oil quality; and joint participant in UCS-19A -Assessment of olives. The research team at the Wagga Wagga Agricultural Institute play a leading role in national olive industry research having developed substantial expertise in oil chemistry and quality. Dr Mailer works closely with the olive industry through participation in field days, conferences and workshops. He has been an AOCS Approved Chemist since 1993 and is an honorary member of the Australian Olive Association. During the last 5 years, Dr Mailer has published numerous scientific papers on olives and presented at over 40 olive workshops and conferences. In addition, he has published extensively on canola and other oil products. He has mentored several students and has held the following positions:
• Adjunct Professor, Charles Sturt University
• Past President - International Society for Fat Research, Germany
• Chair – World Congress on Fats and Oils and ISF Congress, 2005- 2009.
• Past President – Groupe Consultatif International de Recherche sur le Colza, Paris 1997-2001
• Chair – International Rapeseed Congress, 1999.
• ISO Fats and Oils Committee, Australian representative TC34/SC 11 & SC 2
Acknowledgments This study was carried out at the NSW Department of Primary Industries ‘Australian Oils Research Laboratory’ at Wagga Wagga, NSW. Rapak Asia Pacific Limited supplied a range of collapsible, 20 litre sample containers, constructed of various materials, for the study. The rigid container was manufactured by Class Plastics and provided to the project by Luna Solutions Pty Ltd. Olive oil was supplied by Modern Olives Pty Ltd. The Australian Olive Association, AOA President Paul Miller and Mr Leandro Ravetti have provided advice and support for this research. Funding for this research was gratefully received from RIRDC and the Australian Olive Association.

v
Abbreviations/Glossary AOA Australian Olive Association
AORL Australian Oils Research Laboratory
AOCS American Oil Chemists' Society
DAG diacylglycerol
DGF German Society of Fats and Oils
EVOH Ethylene Vinyl Alcohol
EVOO extra virgin olive oil
FFA free fatty acids
GC gas chromatography
HDPE high density polyethylene
HPLC high performance liquid chromatograph
IOC International Olive Council
ISO International Organization of Standardization
K232 Absorbance at 232 nm, measured according to IOC method COI/T.20/Doc 19/Rev 2
K268 Absorbance at 268 nm measured according to IOC method COI/T.20/Doc 19/Rev 2
MPE metallised polyethylene
NATA National Association of Testing Authorities
NSW DPI New South Wales Department of Primary Industries
PE polyethylene
PET polyethylene terephthalate
PP pheophytins
PPP pyropheophytin
PV peroxide value
PVC polyvinyl chloride
RIRDC Rural Industries Research and Development Corporation
SF silver foil
Silylation derivatisation prior to analysis by gas chromatograph
Sparge pass inert gas through to remove oxygen
TAG triacylglycerol
UV ultra violet

vi
Contents Foreword ............................................................................................................................................... iii
About the Author ................................................................................................................................. iv
Acknowledgments ................................................................................................................................. iv
Abbreviations/Glossary......................................................................................................................... v
Executive Summary ............................................................................................................................. ix
1. Introduction ....................................................................................................................................... 1
1.1 Background .................................................................................................................................. 1 1.2 Oil stability .................................................................................................................................. 2 1.3 Oil properties ............................................................................................................................... 2
1.3.1 Peroxide value .................................................................................................................... 2 1.3.2 Free fatty acid ..................................................................................................................... 2 1.3.3 Total phenolic content ........................................................................................................ 2 1.3.4 Induction time .................................................................................................................... 3 1.3.5 α-tocopherol ....................................................................................................................... 3 1.3.6 Ultraviolet absorption ......................................................................................................... 3 1.3.7 Pyropheophytin a ................................................................................................................ 3 1.3.8 1,2-diaclyglycerol ............................................................................................................... 3 1.3.9 Fatty acid profile ................................................................................................................ 3
2. Aims/Objectives ................................................................................................................................. 4
3. Methodology ...................................................................................................................................... 5
3.1 Australian Oils Research Laboratory ........................................................................................... 5 3.2 Samples ........................................................................................................................................ 5
3.2.1 Apparatus ........................................................................................................................... 5 3.2.2 Sample collection ............................................................................................................... 6
3.3 Conditions .................................................................................................................................... 7 3.4 Methodology ................................................................................................................................ 7
3.4.1 Peroxide value .................................................................................................................... 7 3.4.2 Free fatty acid ..................................................................................................................... 7 3.4.3 Total phenolic content ........................................................................................................ 8 3.4.4 Induction time .................................................................................................................... 8 3.4.5 α-tocopherol ....................................................................................................................... 8 3.4.6 Ultraviolet absorption ......................................................................................................... 8 3.4.7 Pyropheophytin a ................................................................................................................ 8 3.4.8 1,2-diacylglycerol ............................................................................................................... 9 3.4.9 Fatty acid profile ................................................................................................................ 9
4. Results .............................................................................................................................................. 10
4.1 Peroxide value ............................................................................................................................ 10 4.2 Free fatty acid ............................................................................................................................ 11 4.3 Phenolic content ......................................................................................................................... 12 4.4 Induction time ............................................................................................................................ 14 4.5 α-tocopherol ............................................................................................................................... 15
vii
4.6 Specific extinction coefficient ................................................................................................... 16 4.6.1 K232nm value ...................................................................................................................... 16 4.6.2 K268nm Value ..................................................................................................................... 16
4.7 Pyropheophytin a ....................................................................................................................... 18 4.8 1,2-diacylglycerol ...................................................................................................................... 19 4.9 Fatty acid profile ........................................................................................................................ 20
5. Discussion of Results ....................................................................................................................... 21
5.1 Peroxide value ............................................................................................................................ 22 5.2 Free fatty acid ............................................................................................................................ 22 5.3 Phenolic content ......................................................................................................................... 22 5.4 Induction time ............................................................................................................................ 22 5.5 α-tocopherol .............................................................................................................................. 23 5.6 UV absorption ............................................................................................................................ 23 5.7 Pyropheophytin a ....................................................................................................................... 23 5.8 1,2-diacylglycerol ...................................................................................................................... 24 5.9 Fatty acid profile ........................................................................................................................ 24
6. Implications ...................................................................................................................................... 25
7. Recommendations ........................................................................................................................... 26
8. References ........................................................................................................................................ 27
9. Author References ........................................................................................................................... 28
10. Appendices ..................................................................................................................................... 29
viii
Tables Table 3.1 Description of each of 5 containers used for a study of shelf life stability. ..................... 5
Table 3.2 Gas transmission rates of various polymers @ 80% R.H ................................................ 6
Table 4.1 Comparison of FFA of olive oil in 5 various polymer containers at initial analysis and after 12 months storage............................................................................................ 11
Table 10.1 Comparison of peroxide value, total polyphenol content, and induction time and α-tocopherol content of olive oil in 5 various polymer containers at initial analysis and after 12 months storage............................................................................................ 29
Table 10.2 Comparison of specific extinction coefficients, K232nm and K268nm, of olive oil stored in 5 various polymer containers at initial analysis and after 12 months storage. ........... 29
Table 10.3 Comparison of free fatty acid, pyropheophytin a and 1,2-diacylglycerol of olive oil in five containers of various polymers at initial analysis and after 12 months storage. . 30
Table 10.4 Comparison of fatty acid profile of olive oil in 5 various polymer containers at initial analysis and after 12 months storage. .................................................................. 31
Figures Figure 3.1 Examples of the range of plastic containers being tested and the crates they were
stored in within the laboratory.......................................................................................... 7
Figure 4.1 Effect of 5 various polymer containers on peroxide value of olive oil stored for 12 months. ...................................................................................................................... 10
Figure 4.2 Effect of 5 various polymer containers on total phenolic content of olive oil stored for 12 months. ................................................................................................................ 12
Figure 4.3 Effect of 5 various polymer containers on induction time of olive oil stored for 12 months. ........................................................................................................................... 14
Figure 4.4 Effect of 5 various polymer containers on α-tocopherol of olive oil stored for 12 months. ........................................................................................................................... 15
Figure 4.5 Effect of 5 various polymer containers on K232nm of olive oil stored for 12 months. ..... 16
Figure 4.6 Effect of 5 various polymer containers on K268nm of olive oil stored for 12 months. ..... 17
Figure 4.7 Effect of 5 various polymer containers on pyropheophytin a content of olive oil ............ stored for 12 months. ...................................................................................................... 18
Figure 4.8 Effect of 5 various polymer containers on 1,2-diacylglycerol content of olive oil stored for 12 months. ...................................................................................................... 19
ix
Executive Summary What the report is about?
This report is the second part of a study on oil storage, preceded by project number PRJ-002297. This report provides further information on the effects of long term storage of olive oil in plastic collapsible containers and the influence of this storage on oil quality. A wide range of packaging material is currently available and being used by olive oil producers and marketers to store and transport oil. Some of this material is suitable for oil storage however some is not.
Initial studies at the Australian Oil Research Laboratory (AORL), RIRDC Publication No 09/160, “Effect of storage containers on olive oil quality”, investigated changes in oil quality when stored in extreme environmental conditions in a range of containers commonly used by growers in the olive oil industry. The oil in some cases deteriorated quickly, reducing oil quality within a short period, sometimes in only a few days.
This second study has measured changes in the oil when stored in a temperature controlled environment, away from direct light, reputably the most desirable conditions for storage of olive oil. The chemical parameters which are indicative of oxidation and ageing were monitored and results are reported here.
Who is the report targeted at?
The report is targeted at those who might need to store or transport edible oil, in particular olive oil. This will include farmers and oil producers, wholesale and retail merchants, importers and exporters and transport companies. It is important not only for the seller, but also the purchaser, to be aware of the risks of improper storage of the product. Oil may be satisfactory in short term storage and during initial evaluation but will age quickly in the incorrect containers, particularly when stored under adverse conditions.
Background
The initial study of oil quality in plastic storage containers was carried out following the discovery of relatively fresh oil which had deteriorated significantly after being stored in collapsible plastic containers. This storage has been common practice in the olive oil industry, particularly for small producers without adequate storage facilities.
Despite warnings from the manufacturers of these containers that some containers are suitable for oil storage and some are not, cheaper and less suitable containers are sometimes used. Although most producers have their oil analysed for quality following oil extraction, there has been little subsequent analysis of the oil after short term storage. The considerable effort taken by growers and processors to produce high quality extra virgin olive oil can be lost within a short period of incorrect storage.
Manufacturers of the containers have been supportive of the project to illustrate the importance of both using the correct material and also of storing the filled containers in suitable environmental conditions.
Considerable effort taken by growers and processors to produce high quality extra virgin
olive oil can be lost within a short period of incorrect storage.
x
Aims/Objectives
Due to extra virgin olive oil (EVOO) being mechanically extracted without chemical treatments or ‘improvements’ to the product, the oil must be stored in a manner to preserve and maintain the original fresh fruit quality. The aim of this project has been to provide the industry producers and market with a description of the effects of plastic storage containers on the quality of EVOO stored in them. The project was designed to help those who need to store and transport oil to make decisions about the type of container to use and under what conditions they should be used.
An additional aim has been to evaluate the relationship with new methods used to assess oil freshness during oil storage such as pyropheophytin and diacylglycerol content. These methods, recently included in the Australian Standard for olive oil are used to detect freshness, ageing, and thermal application to the oil. The project also evaluated changes in traditional parameters for olive oil quality, particularly peroxide value, following short to long term storage on the range of containers.
Methods used
Various storage containers, constructed of five different types of polymer, were obtained from manufacturers of the containers. Extra virgin olive oil (EVOO) was obtained from an Australian bulk supplier and decanted into the containers within 48 hours of arrival to minimise any quality changes to the oil. The oil was tested shortly after receival to ensure it was of high quality at the commencement of the project. This also provided a baseline for the project. Although 1000 L containers were used for the previous study, 20 litre containers were used in this case to minimise the cost of the project.
Four collapsible containers and one rigid plastic container were filled with EVOO and sparged with nitrogen to omit oxygen. The containers were stored in the AORL in a temperature controlled environment and away from light. Containers were sub-sampled at 2, 4, 8, 16, 24 and 32 and 52 weeks and tested at each stage to determine changes in the oil quality.
Each sample was tested for free fatty acid and fatty acid profiles to determine changes in oil composition. Additionally, the oil was tested for oxidative stability by Rancimat® to indicate deterioration of the oil. Other analyses included peroxide value, total polyphenol content, induction time, UV absorbance and tocopherol content of the oil. The pyropheophytin and diacylglycerol content was established to help monitor ageing of the oil but also to study the effectiveness of these tests for determining oil freshness.
Results/Key findings
This study confirms earlier findings of the importance of good storage for olive oil quality. It builds on previous knowledge relating to storage in collapsible containers and the range of material from which they are manufactured. Although these types of containers are generally utilised for short term storage or transport of oil, it is clear from this work that olive oil will maintain its quality for a longer period if the containers are stored in good environmentally controlled conditions.
Pyropheophytin and diacylglycerol content was established to study the effectiveness of
these tests in determining oil freshness.

xi
Implications for relevant stakeholders
The results of these studies are important for the industry. Although containers are sold for the purpose of oil storage, it has been shown that some are clearly more suitable than others. Additionally, it is not sufficient to simply use the best containers but those containers need to be stored under good conditions.
Manufacturers of the containers already recommend that olive oil is best stored in metallic containers with light barriers for longer life. Despite that it has been seen that less expensive containers are sometimes used to reduce costs but at the expense of losing oil quality. The changes in oil quality described here and previously will hopefully encourage all producers who use these types of containers to purchase the recommended types in preference to the lower cost material.
Olive oil begins to deteriorate from the time of extraction and all methods available to reduce the rate of this deterioration need to be adopted. RIRDC projects PRJ-002297: Shelf life and olive oil stability and PRJ-006488: The effect of olive oil storage in collapsible bags have shown that low temperature and exclusion of oxygen are important factors which can assist to maintain longer shelf life. Light has also been shown to be a strong contributor to oxidation of oil and therefore clear plastic containers are not recommended for use unless they are contained within another light exclusive container.
Recommendations
This study has shown that the shelf life of olive oil can be extended by utilising containers constructed of good quality impervious material. In addition to using the best grade of material for the container, shelf life can be further extended by storing these containers under the lowest temperature possible (15-25°C would be ideal) and with the exclusion of light.
These results, funded by RIRDC and the Australian Olive Association need to be disseminated to the industry to ensure the excellent quality product produced by Australian growers is maintained for the benefit of consumers. Both the AOA and the RIRDC have a wide range of media and opportunities to ensure the industry adopt best practice in terms of storage and handling of this sensitive product.
Manufacturers can also use these results to both inform their customers about the ideal material for containers and also to promote their products which best conform to the requirements for long shelf life.
It is not sufficient to simply use the best containers but those containers need to
be stored under good conditions.

1
1. Introduction 1.1 Background Olive oil has been grown in Australia for nearly 200 years but it is only in recent times that it has become a commercial industry for both domestic and exports markets. Extra virgin olive oil (EVOO) is the highest grade of olive oil and is produced from fresh olives using mechanical extraction processes and without the use of excessive heat, chemical interference or blending with other edible oils. Consumption of EVOO is increasing as consumers begin to appreciate the taste and the apparent health benefits of the product. The monounsaturated fatty acid profile has been shown to have exceptional nutritional benefits over saturated fat. Many studies have also shown the health benefits of EVOO over other grades due to lower levels of peroxide and free fatty acids. Mechanically extracted olive oil has additional benefits over other “solvent extracted or refined” oils due to higher levels of antioxidants in the form of polyphenolic compounds and tocopherols.
To be classified as EVOO the oil must contain less than 0.8% free fatty acid (measured as oleic acid) and the peroxide content must not exceed 20 mEq oxygen/kg of oil). Additionally, the oil must not contain anything but mechanically extracted olive oil. Numerous chemical tests have been developed to determine if the oil has been adulterated by the addition of seed oils or if it contains oil which has been extracted by methods other than mechanical extraction. The product must also pass an organoleptic assessment which indicates that there are positive attributes in terms of fruitiness and no defects, such as rancidity, to be classified as EVOO.
Chemical composition of the olive oil can be influenced by a number of factors including genetic variety, harvesting time of the fruit and storage of the fruit before processing. The storage of the extracted oil can also have an effect on the quality of the oil (Mailer 2006). Storage of olive oil is known to be of critical importance in maintaining quality. Kiritsakis (1984) compared glass and plastic bottles in direct and diffused sunlight and found dark glass the best to avoid oxidation. Another study (Francesco et al., 2005) also compared oil exposed to light and dark to show the influences of light in increasing the rate of oxidation. Tsimis and Karakasides (2002) looked at the benefits of tinplate against various plastic containers (PVC, PET, HDPE) in terms of suitability for export, environmental benefits and protection from sunlight, oxygen humidity and microorganisms. Tin and Tetra-Brik® were found to be superior to glass and plastic (Mendez and Falque 2005) in storage trials over 6 months. Comparison of glass with PET containers for sunflower oil showed plastic to be inferior, especially in the light. No prior scientific surveys, other than the RIRDC project PRJ-002297, were found for large capacity plastic containers proposed for this study.

2
1.2 Oil stability The factors affecting olive oil stability have been previously discussed. Light, oxygen and heat reduce the organoleptic and nutritional assets of the product through oxidation. Although oxidative stability varies between oils as a result of cultivar, crop management during fruit development, harvest timing and the seasonal climate can also have a marked influence on fruit quality. Generally, this is related to the composition of the oil and particularly to the level of antioxidants and the degree of polyunsaturation. Higher levels of linoleic acid result in reduced oxidative stability.
Olive oil contains antioxidants such as polyphenolic compounds and tocopherols such as vitamin E (α-tocopherol) and these are implicated with nutritional benefits for consumers. In addition, phenolic compounds provide the pungent sensory characteristics in olive oil.
Extending the shelf life of olive oil is important for the benefit of the consumer but also for the long term viability of the producer. Sensory characteristics of olive oil are expected to be of high quality during storage and up to the time of consumption. The assessment of stability is important for the prediction of shelf life and used-by-dates. Measurement of all components such as fatty acid profiles, phenolic content, chlorophyll, and tocopherols, can assist to predict the stability of oil. New tests, for pyropheophytin a and 1,2-diacylglycerol content show good potential for predicting and determining olive oil quality and ageing.
1.3 Oil properties
1.3.1 Peroxide value
Peroxides are intermediate oxidation products of oil which leads to rancidity and typically occurs when oil is exposed to oxygen and/or light, particularly at elevated temperatures. Oxidation, and the formation of peroxides, occur during oil extraction and processing and continue after bottling and during storage.
1.3.2 Free fatty acid
Olives contain endogenous lipase enzymes which hydrolyse triacylglycerides (oil molecules) to release free fatty acids. Although isolated from the oil in intact fruit, fruit damage releases lipases into contact with the oil. Increases in free fatty acids are therefore largely affected by fruit damage, fruit quality, time and temperature of oil extraction from the fruit. This damage occurs prior to the oil being separated from the water and solid portions of the fruit.
1.3.3 Total phenolic content
Phenolics are important minor components in olive oil which, due to the powerful antioxidant effect, contribute to shelf life stability of olive oil (Mailer et al., 2005). Phenolic content is greater in immature olives and decreases as the fruit ripens. The maturity of the fruit therefore is closely related to oil stability (Mailer et al., 2002).
3
1.3.4 Induction time
Induction time is a laboratory designed test to cause oxidation of oil at an accelerated rate. It is used to indicate the relative oxidative stability of oil in comparison to others. The process involves passing oxygen through oil at an elevated temperature whilst measuring the increased level of peroxides. The most stable oils resist peroxide formation and result in longer induction time. Although induction time can be used to compare oils to determine relative stability it cannot be used to precisely represent shelf life. This is because the conditions in which the oil is stored will have a major influence on shelf life. Induction time can be used to indicate the relative stability of oil when stored under the same conditions (Mailer, et al. 2005).
1.3.5 α-tocopherol
Tocopherols are fat soluble antioxidants valued for their ability to inhibit oxidation in food. Vitamin E, α-tocopherol, is only synthesized by plants and is an important dietary nutrient for humans. The tocopherol content of food increases storage life by protecting food lipids from autoxidation (Kamal-Eldin and Appelqvist, 1996).
1.3.6 Ultraviolet absorption
Fatty acids absorb light at particular wavelengths in the UV region and this may be used to determine olive oil quality. Refining causes a change in the configuration of fatty acids and the formation of conjugated dienes and trienes (Angerosa et al., 2006). Olive oils with increased values of K232 and K268 usually indicate the presence of refined oils. Autoxidation reactions are also associated with conjugation, due to the formation of either carbon-carbon bonds or carbon-oxygen bonds which cause an increase of absorption in the region between 225 and 325nm (Boskou, 1996).
1.3.7 Pyropheophytin a
Pyropheophytins are by-products of chlorophyll formed when the pigments structure changes as a result of heating or age. Chlorophyll converts to pheophytin and ultimately to pyropheophytins. The proportion of pyropheophytin a to the total pheophytins has been suggested to be useful in discriminating fresh oil from oil which has been in long term storage or which has been heated in the refining process (Mailer and Ayton, 2008).
1.3.8 1,2-diaclyglycerol
Diaclyglycerols (DAGs) are formed when a fatty acid is hydrolysed from a triacylglycerol molecule. The resulting DAG is a glycerol moiety and two fatty acids. As oil ages, or undergoes heat treatment, fatty acids can be lost from the 3-position of the triacylglycerol to form 1,2-diacylglycerols. Over time, these molecules equilibrate to form 1,3-diacylglycerols (Fronimaki et al., 2002). The proportions of 1,2 and 1,3 -diacylglycerols reportedly can be used to detect old or damaged oil (Mailer and Ayton, 2008).
1.3.9 Fatty acid profile
Fatty acid profile is a description of all of the fatty acids which make up particular oil. The fatty acid composition is an important measure of quality as the proportions of individual fatty acids determine the physical properties and nutritional value of the oil. The profile describes the structure of the fatty acids, if they are saturated, monounsaturated or polyunsaturated. Olive oil has a characteristic fatty acid profile which distinguishes it from many seed oils.

4
2. Aims/Objectives The aims of this study were to evaluate a range of collapsible plastic containers currently used for olive oil storage. Generally these containers come in various sizes and are made from a range of materials. For this study 20 litre collapsible sample containers were used. Changes in olive oil quality, particularly peroxide values, following short to long term storage on the range of containers were studied.
In addition, the relationship with new analytical methods, pyropheophytin a and 1,2-diacylglycerol content, used to detect ageing and freshness of the oil, were studied to determine their usefulness in identifying old oil.
The objectives were to help growers understand the effects of short to long term storage in collapsible containers used for oil storage. The report provides producers, traders and exporters a guide to storing oil for short to long term transport and storage to help reduce oil damage and waste due to oxidation due to poor storage techniques. A variety of collapsible and rigid materials composed of different polymers were selected for testing. The testing took place over a 12 month period to provide details on the influence these containers had on the quality of EVOO
.

5
3. Methodology 3.1 Australian Oils Research Laboratory This study was carried out at the NSW Department of Primary Industries, Australian Oils Research Laboratory at Wagga Wagga. The laboratory staff is well experienced in oil quality evaluation with olives and other oil crops. The laboratory is AS / NZS ISO 9001:2000 certified and has ISO 17025 certification through the National Australian Testing Authority (NATA). The AORL has had Approved Chemist status of the American Oil Chemists’ Society for many years. The laboratory is also accredited by the IOC.
3.2 Samples
3.2.1 Apparatus
Five types of plastic storage containers, designed for food storage and commonly used for olive oil storage, were obtained from manufacturers within Australia. They included four types of collapsible containers and one rigid plastic container of 20 litre capacity. Each of the collapsible 20 L containers were stored in covered black boxes within the laboratory, under controlled environmental conditions. The rigid container was also stored in the laboratory under controlled conditions. The container descriptions as given by the suppliers are provided in Table 3.1.
Each of the polymers has different porosity and oxygen transmission rates. These rates are well documented in relevant literature. The gas transmission rates of the various polymers at 80% relative humidity are given in Table 3.2. This data has been sourced from the Flextank website, www.flextank.com.au/technical.htm.
Table 3.1 Description of each of 5 containers used for a study of shelf life stability.
Product Description Volume (L) Brand
1 PE Polyethylene - clear 20 L Rapak
2 Nylon Nylon co-extrusion laminate - clear 20 L Rapak
3 MPE Metallised polyester - silver 20 L Rapak
4 SF Silver Foil 20 L Rapak
5 HDPE HDPE with UV filter
Rigid white plastic storage container 20 L Class
Plastics

6
Table 3.2 Gas transmission rates of various polymers @ 80% R.H
(sourced from Flextank website, www.flextank.com.au/technical.htm)
3.2.2 Sample collection
EVOO cv Barnea (200 L) was obtained from Boundary Bend in Victoria, and delivered by road transport to Wagga Wagga in July 2010. A polythene tap was fitted to the container to access the contents.
The oil was dispensed into each of four 20 litre collapsible sample containers and one 20 litre rigid plastic container. Each container was loaded to capacity to remove any oxygen from the container. The collapsible sample containers were stored in sealed black boxes in the laboratory under controlled temperature conditions. The rigid white plastic container was stored in the laboratory under the same temperature conditions.
Throughout the study, samples were collected from all of the containers including the original drum to determine changes in oil quality. A sample from the original drum was analysed at the time of receival (July 2010) to set a baseline for the quality of the original product. All of the containers were sampled and tested after 2, 4, 8, 16, 32 and 52 weeks. After sampling, each container was sparged with nitrogen to retard oxidation.

7
Figure 3.1 Examples of the range of plastic containers being tested and the crates they were stored in within the laboratory
3.3 Conditions This project was undertaken in the Australian Oils Research Laboratory, Wagga Wagga, with temperature maintained at a constant 21 oC. The collapsible containers were held in black plastic boxes sealed with lids to prevent direct light from penetrating the samples. Samples were only exposed to light for a short period during sub sampling. The white rigid container was not stored in a black box. All containers were filled with 20 litres with EVOO and sparged with nitrogen after each sub sampling.
3.4 Methodology
3.4.1 Peroxide value
The peroxide value was determined using the International Standard Organisation method, ISO 3960:2007 (E): Animal and vegetable fats and oils – Determination of peroxide value – Idometric (visual) endpoint determination.
Oil (2.50 g) was dissolved in an acetic acid / 2,2,4-trimethylpentane mixture (3:2). To this solution, 0.5 mL of saturated potassium iodide (KI), (70 g KI/40 mL water), was added and shaken for 1 minute. Water (50 mL) was added, followed by approx 0.5 ml of 1 % starch solution (1 g starch/100mL water). The solution was titrated with previously standardised 0.01N sodium thiosulphate (Na2S2O3). The volume of titrant was recorded and the peroxide value calculated and reported as mEq of active oxygen/kg oil.
3.4.2 Free fatty acid
Free fatty acids were determined by the method of the American Oil Chemists Society, AOCS Ca 5a-40 (1998): Free fatty acids
Oil (7.05 g) was dissolved in 50 ml neutralised isopropanol. Two drops of phenolphthalein (1% in ethanol) was added to the solution. The solution was the titrated with 0.1N sodium hydroxide (NaOH), previously standardised against hydrochloric acid (HCl). The volume of titrant was recorded and the results were calculated as a percentage of the oil (expressed as oleic acid).

8
3.4.3 Total phenolic content
A modification of the Gutfinger (1981) method, using caffeic acid as the standard, was used to determine total phenolic content.
Oil (10 g) was dissolved in 50 mL hexane and extracted 3 times with 20 mL portions of 80% aqueous methanol. The mixture was shaken for 2 minutes for each extraction. The sample was made to 100 ml with water and left to stand in a dark cupboard overnight. A 1 ml aliquot was transferred to a 10 ml volumetric flask to which 5 mL of water was added. Folin-Ciocalteau reagent (0.5 mL) was then added to the flask and the sample shaken and left for 3 minutes. Saturated sodium carbonate (Na2CO3) (1 mL) was added to the sample and shaken. The sample was made to volume with water and allowed to stand in the dark for an hour. The absorption of the sample was read at 725 nm on a spectrophotometer. Known solutions of caffeic acid were prepared and used to produce a standard calibration curve. The standards were prepared and analysed in the same way as the sample solution. Results were expressed as mg of caffeic acid/kg of oil.
3.4.4 Induction time
A Metrohm® 743 Rancimat was utilised to determine the induction time of the oil.
Oil (2.50 g) was weighed and placed in a block at 110 oC and an airflow of 20 L / hour. Volatile components which develop as a result of oxidation were measured. When the oil begins to oxidise, the change is recorded on the Rancimat. These results were reported as induction time in hours.
3.4.5 α-tocopherol
α-tocopherol was measured using the International Standards Organisation method, ISO-9936:2006 (E): Animal and vegetables fats and oils – Determination of tocopherol and tocotrienol contents by high-performance liquid chromatography.
Oil (2 g) was weighed into a 25 mL volumetric flask, and made up to volume with hexane. The samples were filtered and transferred to HPLC vials. The α-tocopherol concentration was determined by HPLC, with hexane/isopropanol (99:1) as the mobile phase, with a flow rate of 0.9 mL/minute. A Phenomonex Luna 5µ silica column (250 x 4.60 mm) was used. The peaks were measured using a UV detector set at 292 nm. Data was analysed using Waters Empower Pro version 5.00. A calibration curve was used to calculate the α-tocopherol, which was expressed as mg/kg oil.
3.4.6 Ultraviolet absorption
Ultraviolet absorption was determined using the International Olive Council method COI/T.20/Doc19/Rev2 (2008): Spectrophotometric investigation in the ultraviolet.
A slight modification to the method was made where a smaller sample weight and solvent volume was used to save on solvent usage (0.1 g oil/10 mL solvent vs. 0.25 g oil/25 mL solvent). This does not have any significant effect on the final result. Oil (0.1g) was weighed into a 10ml volumetric flask and made to volume with 2, 2, 4-trimethylpentane. The absorbance of the oil sample was measured on a double beam spectrophotometer, using 2, 2, 4-trimethylpentane as a reference, at 264, 268 272 and 232 nm. The UV content was then calculated and reported as ΔK, K232 and K268.
3.4.7 Pyropheophytin a
Pyropheophytin was measured using the International Standards Organisation method, ISO 29841:2009 (E): Vegetable fats and oils – Determination of the degradation products of chlorophyll a and á (pheophytins a, á and pyropheophytins). This method determines the degradation products of chlorophyll a into pheophytin a, pheophytin á and pyropheophytin a.

9
A miniaturised chromatography column of silica gel 60 at 5% moisture was used to separate the pheophytins. A 5 ml pipette tip was plugged with defatted cotton wool. Silica gel 60 (1.0 g) that had been prepared at 5% moisture was then weighed on top of the cotton wool. The silica layer was then covered with a stopper of cotton wool. Oil (0.6 g) was weighed into a test tube and dissolved in hexane. The solution was transferred to the column with the aid of two 1 mL portions of petroleum ether. The column was washed with two 5 mL portions of eluent (petroleum ether: diethyl ether (90:10)) and extracted under slight vacuum using a solid phase extraction unit. This initial solution was then discarded. The pheophytin portion of the solution was then eluted using two 5 mL portions of acetone. The solution was filtered, transferred to a pear shaped flask and evaporated to dryness using a rotary evaporator. The residual sample was dissolved in 200 μL of acetone and analysed on the HPLC with a mobile phase of water:methanol : acetone (4:36:60), using a Phenomonex Luna 5 µ silica column (250 x 4.60 mm). The separated components were measured at 410nm using a photodiode array detector and data was analysed with Waters Empower Pro version 5.00. Peak areas were quantified and reported as % pyropheophytin a (of total pheophytins).
3.4.8 1,2-diacylglycerol
Diacylglycerols were determined using the International Standards Organisation method, ISO 29822:2009 (E): Vegetable fats and oils – Isomeric diacylglycerols – Determination of relative amounts of 1,2 and 1,3 diacylglycerols.
A miniaturised chromatography column of silica gel 60 at 5% moisture was used to separate the isomeric diacylglycerols. A 5 ml pipette tip was plugged with defatted cotton wool. Silica gel 60 (1.0 g) that had been prepared at 5% moisture was weighed on top of the cotton wool. The silica layer was then covered with a stopper of cotton wool. Oil (0.1 g) was weighed into a test tube and dissolved in toluene. The solution was transferred to the column with the aid of 1 mL of eluent, (2, 2, 4-trimethylpentane: di-isopropyl ether (85:15)). The column was washed with two 3.5 mL portions of eluent and extracted under slight vacuum using a solid phase extraction unit. This initial solution was discarded. The diacylglycerols were eluted using two 3.5 mL portions of diethyl ether. The solution was transferred to a pear shaped flask and evaporated to about 1 mL using a rotary evaporator. The remainder of the solution was evaporated under a gentle stream of nitrogen. Silylation reagent, 3:1:9 - SylonTM HPT, was added to the flask (200 μL) and allowed to react for at least 20 minutes. After silylation, 1 mL acetone was added and left to stratify for 10 minutes before being transferred to a GC vial. The diacylglycerol profiles were determined by gas chromatography using a SGE BP5 capillary column (30 m, 0.25 mm, 0.25 µm film) and a flame ionisation detector. The column temperature program was set at 240oC for 1 minute, increased at a rate of 10oC / minute to 320oC and held for 10 minutes, increased to 340oC at 20oC /min and held for 10 mins. The injector temperature was set at 340oC. The detector temperature was 340oC. Data was analysed using Star® Workstation Chromatography software (version 6.20). Results were expressed as a percentage of 1,2-diacylglycerols (of total 1,2 and 1,3-diacylgylerols)
3.4.9 Fatty acid profile
Fatty acid methyl esters were prepared using the International Olive Council method COI/T.20/Doc. No 24 - Preparation of the fatty acid methyl esters from olive oil and olive-pomace oil.
Oil (0.1 g or 5 drops) was dissolved in 2 mL heptane. The sample was mixed and 0.2 ml of 2N methanolic potassium hydroxide was added. The sample was mixed for 30 seconds, covered and left until the two phases separated (30 minutes). The upper heptane layer was then transferred to GC vials. The fatty acid profiles were determined by gas chromatography using a SGE BPX70 capillary column (30 m, 0.25 mm, 0.25 µm film) and a flame ionisation detector. The column temperature program was set at 185oC for 8 minutes and then increased at 10 oC / minute to a final temperature of 220 oC and held for 3 minutes. The injector temperature was set at 250 oC with a split ratio of 1:50. The detector temperature was 260 oC. Results were expressed as a percentage of the total fatty acids.
10
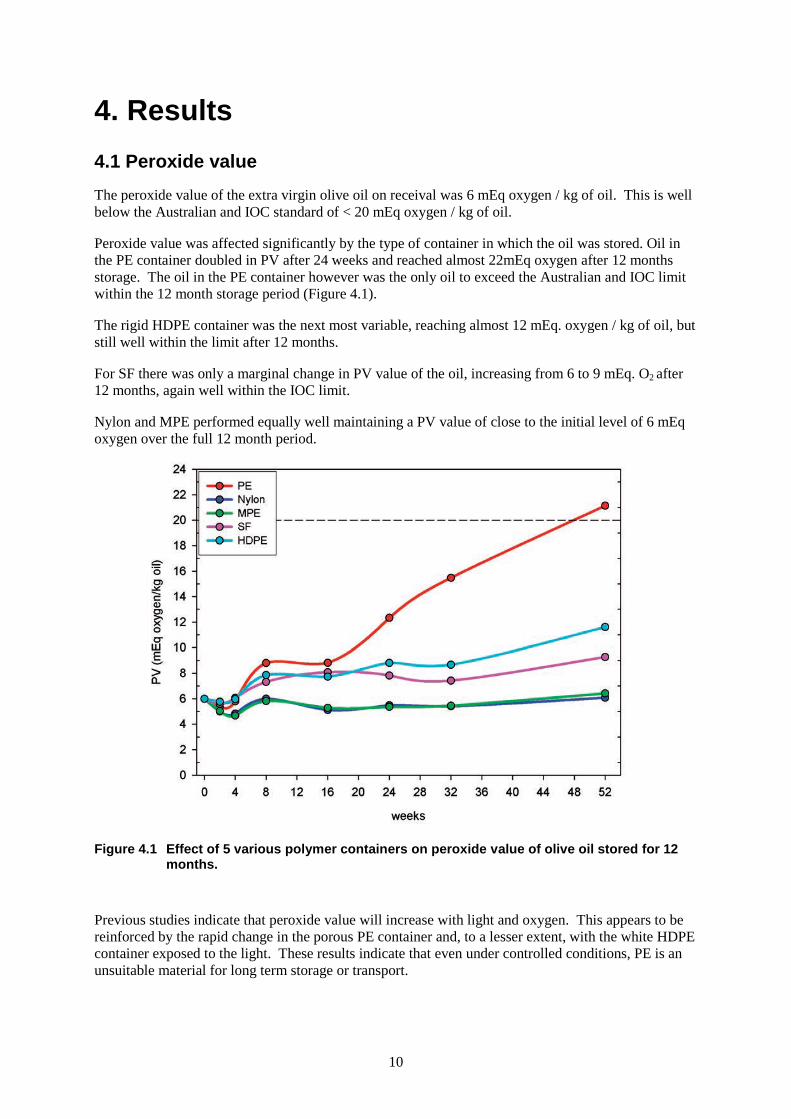
4. Results 4.1 Peroxide value The peroxide value of the extra virgin olive oil on receival was 6 mEq oxygen / kg of oil. This is well below the Australian and IOC standard of < 20 mEq oxygen / kg of oil.
Peroxide value was affected significantly by the type of container in which the oil was stored. Oil in the PE container doubled in PV after 24 weeks and reached almost 22mEq oxygen after 12 months storage. The oil in the PE container however was the only oil to exceed the Australian and IOC limit within the 12 month storage period (Figure 4.1).
The rigid HDPE container was the next most variable, reaching almost 12 mEq. oxygen / kg of oil, but still well within the limit after 12 months.
For SF there was only a marginal change in PV value of the oil, increasing from 6 to 9 mEq. O2 after 12 months, again well within the IOC limit.
Nylon and MPE performed equally well maintaining a PV value of close to the initial level of 6 mEq oxygen over the full 12 month period.
Figure 4.1 Effect of 5 various polymer containers on peroxide value of olive oil stored for 12 months.
Previous studies indicate that peroxide value will increase with light and oxygen. This appears to be reinforced by the rapid change in the porous PE container and, to a lesser extent, with the white HDPE container exposed to the light. These results indicate that even under controlled conditions, PE is an unsuitable material for long term storage or transport.

11
In contrast to oil stored in summer conditions without temperature control (RIRDC Publication. No. 09/160), these containers generally performed adequately, except for the PE container. Storage for six months would be sufficient for most applications at which time most of these containers remained under 10 mEq. Oxygen and well within acceptable limits.
Peroxides are the primary oxidation products as the oil deteriorates and PV is commonly used to measure oil quality. Eventually peroxides convert to secondary oxidation products and the peroxide value will fall. A low peroxide value is therefore not verification that the oil is good quality.
4.2 Free fatty acid Free fatty acids (FFA) are known to be a result of hydrolysis of triacylglycerols by endogenous lipase enzymes in the olive fruit. As the enzymes are not soluble in the oil, once the oil is separated from the water and solid material, free fatty acids are expected to remain constant. As expected, free fatty acids have showed no change in any of the containers over the 12 month period. The significance of this is that free fatty acids provide no indication of diminishing quality or in determining degradation of olive oil in storage.
Table 4.1. Comparison of FFA of olive oil in 5 various polymer containers at initial analysis and after 12 months storage.
-------------------------- Free fatty acids (% as oleic acid) ----------------------------
PE Nylon MPE SF HDPE
0 months 0.21 ± 0.00 0.21 ± 0.00 0.21 ± 0.00 0.21 ± 0.00 0.21 ± 0.00
12 months 0.22 ± 0.01 0.21 ± 0.01 0.21 ± 0.01 0.21 ± 0.00 0.21 ± 0.01

12
4.3 Phenolic content The total phenolic content of this oil was initially 245 mg/kg of fruit. This is similar to the former study in which the oil contained 270 mg/kg fruit.
Phenolics diminished most rapidly in the oil in the PE container which was the most porous material of the five container types. The oil decreased to below 200 mg/kg in the 12 month study (Figure 4.2).
Figure 4.2 Effect of 5 various polymer containers on total phenolic content of olive oil stored for 12 months.
The Nylon and MPE containers were the most efficient with minimal change of the phenolic content of the oil over the entire 12 month period. This would indicate that there had been negligible transfer of oxygen through the container.
Phenolic content of the oil in containers SF and HDPE had changed only marginally with phenolic content dropping from 245 mg/kg to around 235-240 mg/kg oil.
Previous projects from this laboratory show clearly that phenolic compounds decreases naturally with fruit maturity. These phenolics are antioxidants and help preserve the oil. Therefore oil from early harvested olives contains higher amounts of phenolics than oil from more mature fruit. This oil will have a greater resistance to oxidation and increased shelf life compared to oil from late harvested olives. The phenolic content of this oil was sufficient to allow good stability.
Despite the presence of antioxidants, oxidation and rancidity will be accelerated with increased levels of oxygen or free radicals which reduce their effectiveness. The better the oxygen barrier of the container, the more stable is the oil.
PE containers are markedly less effective at protecting antioxidants than any of the other materials as shown by the decrease in phenolic compounds. SF and HDPE were better but the best materials were the metallic (MPE) and Nylon materials.

13
These results correlate very closely with the peroxide value illustrated in Figure 4.1. The PE container had the least protection against oxidation of the oil. Nylon and MPE were in both cases the superior packaging. It could also be concluded that samples SF and HDPE had maintained quality over the 12 months and could be recommended for this purpose if they were stored in acceptable environmental conditions.
14
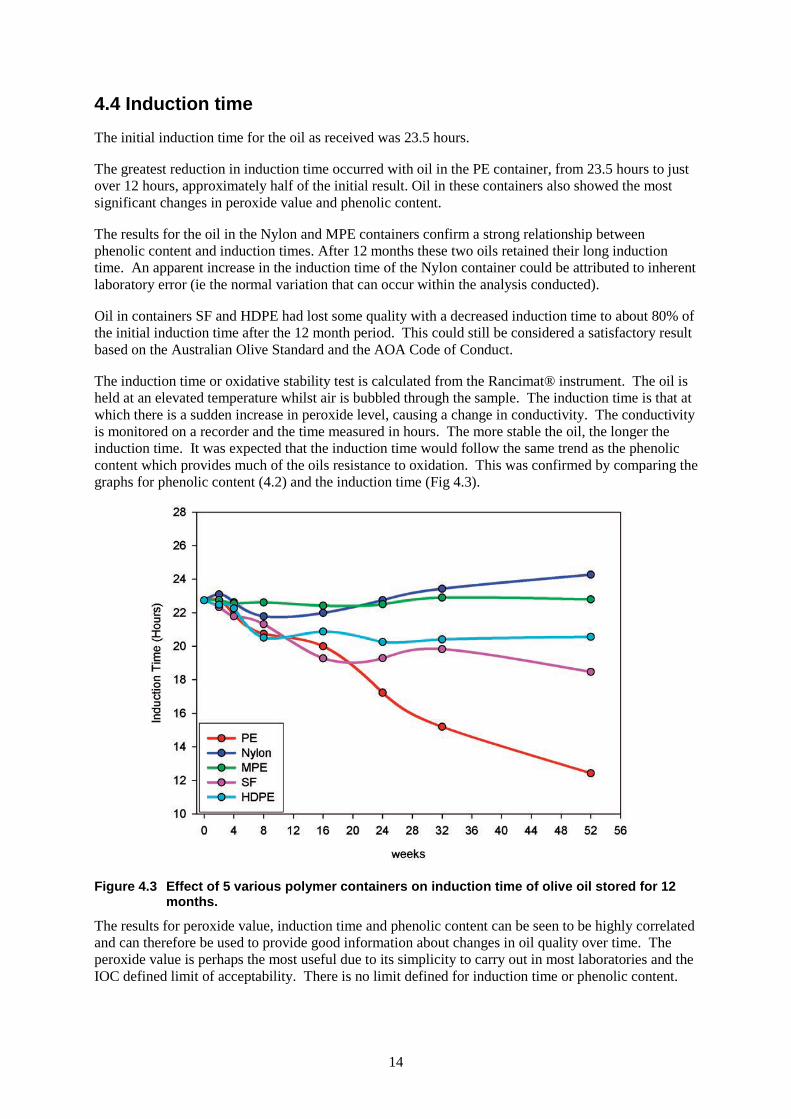
4.4 Induction time The initial induction time for the oil as received was 23.5 hours.
The greatest reduction in induction time occurred with oil in the PE container, from 23.5 hours to just over 12 hours, approximately half of the initial result. Oil in these containers also showed the most significant changes in peroxide value and phenolic content.
The results for the oil in the Nylon and MPE containers confirm a strong relationship between phenolic content and induction times. After 12 months these two oils retained their long induction time. An apparent increase in the induction time of the Nylon container could be attributed to inherent laboratory error (ie the normal variation that can occur within the analysis conducted).
Oil in containers SF and HDPE had lost some quality with a decreased induction time to about 80% of the initial induction time after the 12 month period. This could still be considered a satisfactory result based on the Australian Olive Standard and the AOA Code of Conduct.
The induction time or oxidative stability test is calculated from the Rancimat® instrument. The oil is held at an elevated temperature whilst air is bubbled through the sample. The induction time is that at which there is a sudden increase in peroxide level, causing a change in conductivity. The conductivity is monitored on a recorder and the time measured in hours. The more stable the oil, the longer the induction time. It was expected that the induction time would follow the same trend as the phenolic content which provides much of the oils resistance to oxidation. This was confirmed by comparing the graphs for phenolic content (4.2) and the induction time (Fig 4.3).
Figure 4.3 Effect of 5 various polymer containers on induction time of olive oil stored for 12 months.
The results for peroxide value, induction time and phenolic content can be seen to be highly correlated and can therefore be used to provide good information about changes in oil quality over time. The peroxide value is perhaps the most useful due to its simplicity to carry out in most laboratories and the IOC defined limit of acceptability. There is no limit defined for induction time or phenolic content.
15
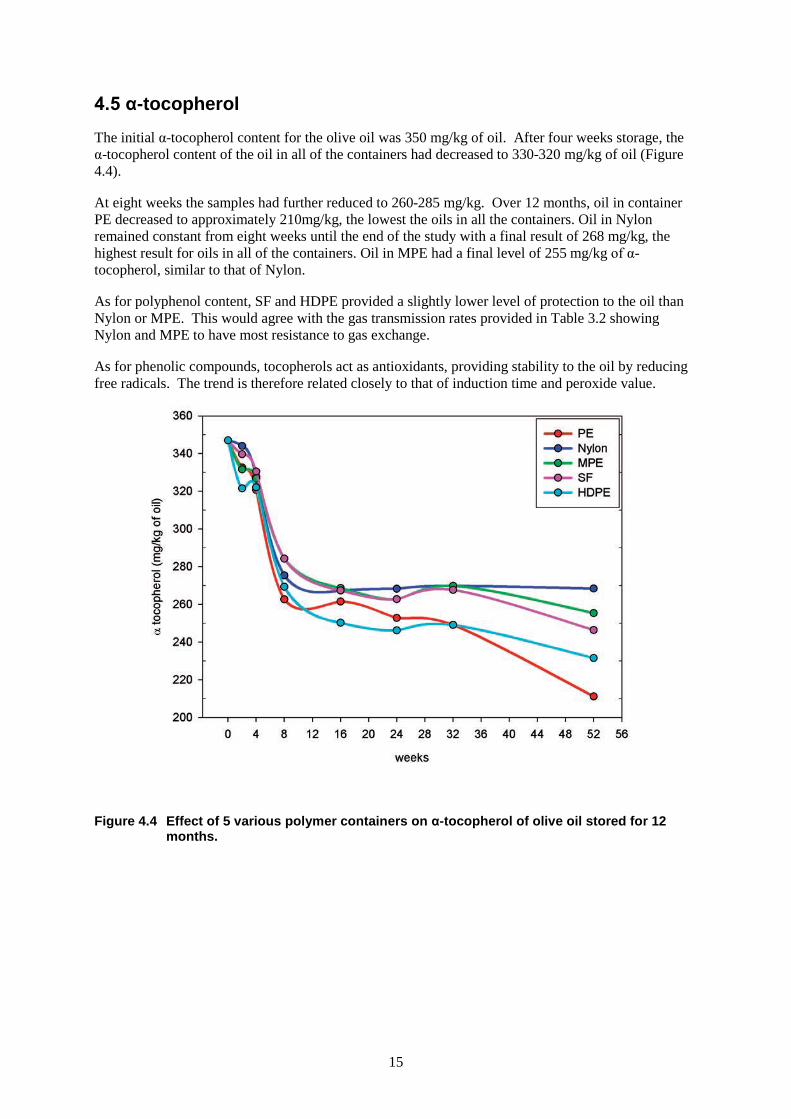
4.5 α-tocopherol The initial α-tocopherol content for the olive oil was 350 mg/kg of oil. After four weeks storage, the α-tocopherol content of the oil in all of the containers had decreased to 330-320 mg/kg of oil (Figure 4.4).
At eight weeks the samples had further reduced to 260-285 mg/kg. Over 12 months, oil in container PE decreased to approximately 210mg/kg, the lowest the oils in all the containers. Oil in Nylon remained constant from eight weeks until the end of the study with a final result of 268 mg/kg, the highest result for oils in all of the containers. Oil in MPE had a final level of 255 mg/kg of α-tocopherol, similar to that of Nylon.
As for polyphenol content, SF and HDPE provided a slightly lower level of protection to the oil than Nylon or MPE. This would agree with the gas transmission rates provided in Table 3.2 showing Nylon and MPE to have most resistance to gas exchange.
As for phenolic compounds, tocopherols act as antioxidants, providing stability to the oil by reducing free radicals. The trend is therefore related closely to that of induction time and peroxide value.
Figure 4.4 Effect of 5 various polymer containers on α-tocopherol of olive oil stored for 12 months.

16
4.6 Specific extinction coefficient
4.6.1 K232nm value
The oil used in the study had an initial K232nm value of 1.52.
The K232nm value of the oil in the PE container increased significantly after 12 months, exceeding the IOC limit of 2.5 after 24 weeks. The oil in the SF container also increased markedly over the 12 months study but remained within the IOC limit (Figure 4.5).
The remaining oils in Nylon, MPE and HDPE containers showed only a marginal change in the K232nm and did not exceed the IOC limit.
Figure 4.5 Effect of 5 various polymer containers on K232nm of olive oil stored for 12 months.
K232nm measures increases in primary oxidation products and it can be seen that there is a direct relationship between peroxide value (primary oxidation) and K232nm. These results endorse the relationship with the best performers for low peroxide and the lowest result for K232nm.
There is a significant difference however in the change in K232nm for SF compared to Nylon, MPE and HDPE. This was not so apparent for the previous tests and the reason for the clear difference is not known. It was shown however that this material did not perform well in the previous study carried out at higher ambient temperature and may result in oil failing this test within a relatively short storage time.
4.6.2 K268nm Value
Analysis for this oil showed the K268 value initially to be 0.09. The K268 of EVOO must be less than 0.22 to comply with IOC regulations. All of the oil stored in the five different polymer containers remained well below the IOC limit after 12 months (Figure 4.6).

17
K268nm is a measure of secondary oxidation products (Bilancia et al., 2007). Therefore it would be expected that the oil with the highest K232nm would ultimately have the highest K268nm value. It would appear that the current storage conditions were not conducive to the formation of these secondary oxidation products in this test period but this would be expected to ultimately increase over time.
Although Nylon and MPE sowed the most resistance to change of K268nm, the levels between all containers were not significant. A better understanding of the factors which drive the production of secondary products and the change in K268nm is necessary to understand these results.
Figure 4.6 Effect of 5 various polymer containers on K268nm of olive oil stored for 12 months.
It is understood that UV absorption at K232 and K268 is useful in determining if oil has been heated, or is in some way degraded, due to changes in the configuration of the fatty acids. These results do show that UV absorption at K232 is useful to show ageing of the oil. The more rapid change in K232, was illustrated when the oil was stored at higher temperature (RIRDC Publication No. 09/160). The comparison of the two studies show the high value of this test in identifying oil which has been heated or poorly stored.

18
4.7 Pyropheophytin a The initial level of pyropheophytin a (PPP) for the oil used in this study was 1% of the total pheophytins content. The Australian Olive Association has adopted a standard of <17 % for PPP in EVOO.
Oil stored in all of the containers in the study increased in pyropheophytins a over the 12 month period but all remained well within the AOA’s limit (Figure 4.7).
Unexpectedly, oil in the PE container that fared worst for oil quality in the previous tests described in this report, showed least change in PPP over 12 months. This oil increased in pyropheophytin a from 1% to only 6% over 12 months in storage. It was also unexpected that HDPE, which showed good protection for the oil for all of the other quality tests, gave the highest level of PPP for all the containers for the 12 months period, with a final concentration of 12%.
Pyropheophytins are by-products of chlorophyll pigments, produced through the conversion of chlorophyll to pheophytins and eventually to pyropheophytin a. These results are well below the AOA adopted standard of <17 %.
It can be seen from this study, and previously (RIRDC Publication No. 09/160), that this reaction will occur under the influence of time, in the absence of light, and under optimal storage conditions. Analysis of pyropheophytins is a useful tool in discriminating fresh oil from oil which has been in long term storage. Samples which are exposed to higher temperatures during storage, or during processing or refining will also result in a higher pyropheophytin a level.
There is limited information on the storage effects on pyropheophytins and the usefulness of this technique to determine the storage conditions on olive oil.
Figure 4.7 Effect of 5 various polymer containers on pyropheophytin a content of olive oil stored for 12 months.

19
4.8 1,2-diacylglycerol The EVOO utilised for this study had an initial 1,2- diacylglycerol (DAG) concentration of 91 %. The Australian Olive Association has adopted a level of >35 % as the Australian standard for EVOO.
In this project, the level of DAG decreased significantly over 12 months and resulted with oil in all container types producing a DAG concentration of 55 - 57 %. All of the oils stored in the range of containers remained within the Australian Olive Association limit after storage for 12 months. All samples decreased at the same rate, regardless of the container material over 12 months (Figure 4.8).
Diacylglycerols are derived from triacylglycerols (TAGs), in which one of three fatty acids has been hydrolysed from the molecule. The loss of fatty acids may be enzymatic but also may form during storage or processing. The proportion of 1,2-diacylglycerols to the total 1,2 and 1,3-DAGs was developed by the DGF as a method to detect old or adulterated olive oil which may contain refined oil.
This study has shown that the DAG concentration is a good method to illustrate ageing in olive oil. Changes in the DAG content were independent of the type of containers.
Additionally, a similar decrease could be identified between the results in this study when compared with the previous study (RIRDC Publication No. 09/160). In the previous study DAG content decreased to approximately the same level as the final results of this study (55-57 %) however within a much quicker time frame (4 months), due to the increased temperature conditions. Under the controlled temperature conditions present in study the DAG content reached the same level (55-57 %) after 12 months.
No oils in either study have failed the AOA limit of >35 %. This would reassure producers that the method and level set by AOA is sufficient to avoid rejection of good quality oil in routine screening.
Figure 4.8 Effect of 5 various polymer containers on 1,2-diacylglycerol content of olive oil stored for 12 months.

20
4.9 Fatty acid profile The fatty acid profile of olive oil stored in various containers composed of different polymers did not vary for the different treatments. Differences of 0.1%, or less, are insignificant and within laboratory error. The results are shown in Appendices in Table 10.4

21
5. Discussion of Results This is the second of a two part study to determine the effects on oil quality of the various types of plastic material used in the construction of olive oil containers.
The first study utilised oil samples stored in various containers and housed in uncontrolled environmental conditions. These containers reached temperatures as high as 46oC over the summer period. These containers were also exposed to indirect sunlight.
This second part of the study has repeated the storage and analysis of oil from a range of containers but in this case they were stored in temperature controlled facilities at a constant temperature of 21 ºC and without exposure to light. The oil was analysed at the time of filling the containers and then retested at regular intervals over a period of 12 months. The containers were fully loaded to remove oxygen and sparged with nitrogen to remove any remaining oxygen. Sub sampling of the containers took place at two, four, eight, 16, 24, and 32 weeks. A final sample was taken and analysed at 12 months. The report describes the changes in oil quality which resulted from long term storage.
The two studies complement each other, indicating in the first instance, effects of a variable environment on oil stability. It was shown that even the best quality material was not able to fully protect the oil from deterioration under those extremes. This is relevant because many producers currently house their oil in sheds on farms in these containers. Samples have been received in the laboratory for testing which far exceeded the acceptable limits for extra virgin olive oil and in many cases this could be attributed to poor storage.
This study has limited the changes in olive oil quality to the physical protection provided by the containers. Light and temperature have been controlled and the main factor affecting oil deterioration would be exposure to oxygen. The containers were filled and sealed at the initial stage of filling to remove air and at each sampling period were sparged with nitrogen to remove air. The only exposure to oxygen therefore would be where the containers had a significant gas transmission through the polymer.
In addition to the information gained about the polymers and the changes in oil quality, this was an opportunity to investigate the methods used to define oil freshness and shelf life, or stability. Peroxide value, induction time and UV absorption are common tests used to evaluate oil but these were compared in this study with organoleptic quality. Other tests such as fatty acid profiles, free fatty acids, tocopherols and phenolic compounds were carried out to relate the changes in these parameters to deterioration of the oil.
In the recently released “Australian Olive Oil Standards” AS5264-2011, two new tests have been incorporated which are designed to illustrate oil freshness and authenticity. These tests are pyropheophytin a and 1,2-diacylglycerol. As they are relatively new tests, this project was a good opportunity to observe the changes under various conditions and evaluate their usefulness in identifying oils which were old or degenerated.
Each of these tests is discussed in detail below. The results were very different to those found in the previous study. Although it was recommended that plastic containers not be used for long term olive oil storage, it has been shown in this study that if the containers are stored in cool conditions and way from the light, some materials are quite adequate for maintaining the quality of those oils for 12 months or more. The projects therefore have been useful in emphasising the importance, not only of what polymer material to use but also of how those containers must be stored. The importance of excluding oxygen and light and maintaining a cool environment have often been discussed but this study provides even more evidence of their importance.
22
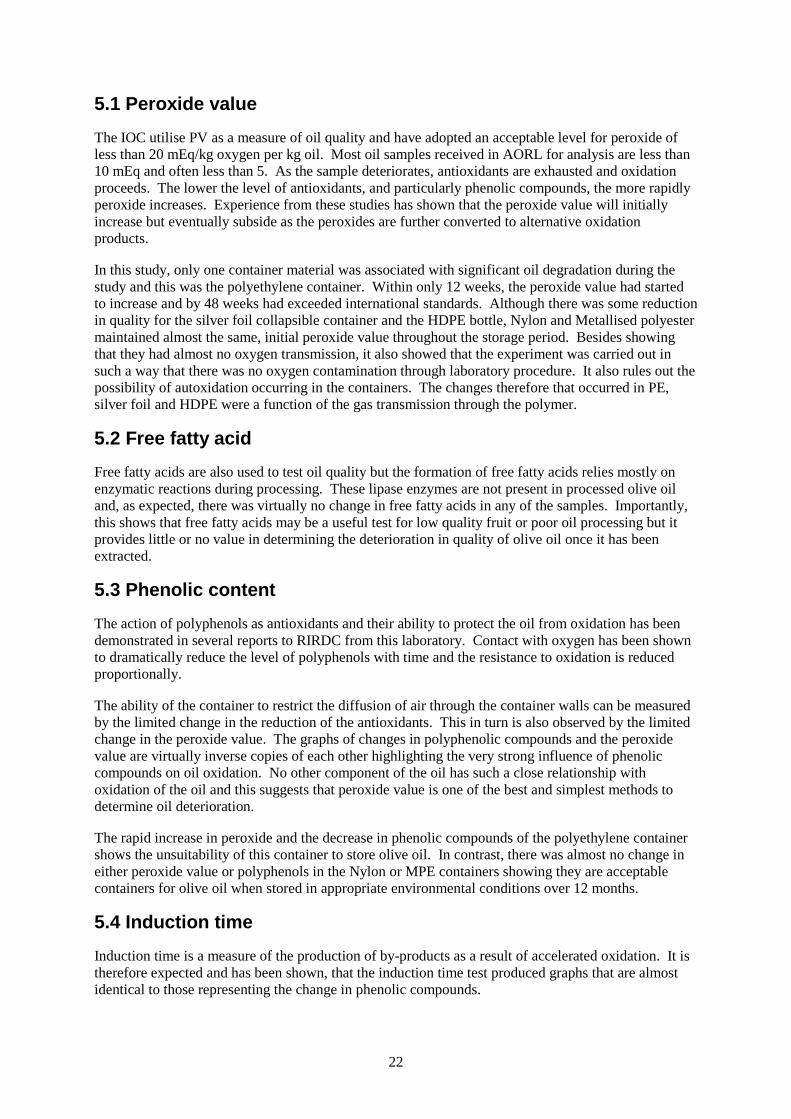
5.1 Peroxide value The IOC utilise PV as a measure of oil quality and have adopted an acceptable level for peroxide of less than 20 mEq/kg oxygen per kg oil. Most oil samples received in AORL for analysis are less than 10 mEq and often less than 5. As the sample deteriorates, antioxidants are exhausted and oxidation proceeds. The lower the level of antioxidants, and particularly phenolic compounds, the more rapidly peroxide increases. Experience from these studies has shown that the peroxide value will initially increase but eventually subside as the peroxides are further converted to alternative oxidation products.
In this study, only one container material was associated with significant oil degradation during the study and this was the polyethylene container. Within only 12 weeks, the peroxide value had started to increase and by 48 weeks had exceeded international standards. Although there was some reduction in quality for the silver foil collapsible container and the HDPE bottle, Nylon and Metallised polyester maintained almost the same, initial peroxide value throughout the storage period. Besides showing that they had almost no oxygen transmission, it also showed that the experiment was carried out in such a way that there was no oxygen contamination through laboratory procedure. It also rules out the possibility of autoxidation occurring in the containers. The changes therefore that occurred in PE, silver foil and HDPE were a function of the gas transmission through the polymer.
5.2 Free fatty acid Free fatty acids are also used to test oil quality but the formation of free fatty acids relies mostly on enzymatic reactions during processing. These lipase enzymes are not present in processed olive oil and, as expected, there was virtually no change in free fatty acids in any of the samples. Importantly, this shows that free fatty acids may be a useful test for low quality fruit or poor oil processing but it provides little or no value in determining the deterioration in quality of olive oil once it has been extracted.
5.3 Phenolic content The action of polyphenols as antioxidants and their ability to protect the oil from oxidation has been demonstrated in several reports to RIRDC from this laboratory. Contact with oxygen has been shown to dramatically reduce the level of polyphenols with time and the resistance to oxidation is reduced proportionally.
The ability of the container to restrict the diffusion of air through the container walls can be measured by the limited change in the reduction of the antioxidants. This in turn is also observed by the limited change in the peroxide value. The graphs of changes in polyphenolic compounds and the peroxide value are virtually inverse copies of each other highlighting the very strong influence of phenolic compounds on oil oxidation. No other component of the oil has such a close relationship with oxidation of the oil and this suggests that peroxide value is one of the best and simplest methods to determine oil deterioration.
The rapid increase in peroxide and the decrease in phenolic compounds of the polyethylene container shows the unsuitability of this container to store olive oil. In contrast, there was almost no change in either peroxide value or polyphenols in the Nylon or MPE containers showing they are acceptable containers for olive oil when stored in appropriate environmental conditions over 12 months.
5.4 Induction time Induction time is a measure of the production of by-products as a result of accelerated oxidation. It is therefore expected and has been shown, that the induction time test produced graphs that are almost identical to those representing the change in phenolic compounds.

23
The comparison of the increase in peroxide value and the changes in induction time should be considered when calculating use-by-dates for olive oil based on induction time (Rancimat®).
5.5 α-tocopherol α-tocopherol (Vitamin E) is a strong antioxidant. The results obtained for α-tocopherol were quite different to those shown for polyphenolic antioxidants. In this case, α-tocopherol decreased in all containers despite the apparent absence of oxygen even in the best containers. Within 8 weeks, all oils in the four containers had decreased from around 340 mg/kg to only 280 mg/kg of oil. From 8 weeks the reduction proceeded more slowly with the PE container showing the most significant change. However, the change in α-tocopherol from 8 weeks to 52 weeks was relatively small and even in the worst case only reduced to 210 mg/kg oil.
The rapid change in α-tocopherol in the initial stages may suggest that this compound is more sensitive to oxidation than the polyphenolics. They may have actually protected the polyphenolics which didn’t show any real change for the first 8 weeks. Peroxide value also showed little change in the early period but increased dramatically in the PE container after 8-12 weeks.
This result would indicate that α-tocopherol has a very important role in protecting the oil between processing and bottling when it is exposed to oxidative elements. Once the oil is sealed from oxygen the polyphenolic compounds can maintain oil quality and relatively long term stability.
5.6 UV absorption The specific extinction co-efficient, or the UV absorption readings at UV232 and UV268 nanometres (nm), measures changes in the conformation of the fatty acids. The initial changes due to oxidation, or formation of primary oxidation products, are detected by absorbance at UV232 nm and further breakdown products, or secondary oxidation products, at UV268 nm.
This phenomenon was illustrated clearly in the results. There was a relatively rapid increase in absorption after 8 weeks at UV232, particularly for the less suitable containers of PE and SF, in line with the increased peroxide value (Fig 4.1). This would indicate the formation of primary oxidation products such as peroxides.
The more subtle changes in absorbance at UV268 nm would suggest that there was little conversion of these primary products in this period. The lack of change in the UV268 absorbance might be attributed to the low temperature at which the containers were stored based on the fact that all of the containers performed in a similar manner. It would be expected that the UV268 absorbance would increase over time as secondary products develop.
The slow production of UV268 absorbance in all containers over 12 months provides some valuable information when evaluating the quality of supermarket oils. Often oil obtained from supermarkets is found to have high UV268 absorbance levels. Based on the findings in this report it might be suggested that the oil with high UV268 absorbance have been stored in unacceptable environments for considerable time thus contributing to the production of the secondary products associated with rancidity. The UC Davis reports (Frankel et. al. 2010, Frankel et. al. 2011) showed a strong relationship between UV268 absorbance and organoleptic quality.
5.7 Pyropheophytin a Chlorophyll is the green pigment in fresh olive oil. The green colour changes as the oil ages. The chlorophyll is converted to alternative yellow and brown pigments pheophytins (PP) and pyropheophytins (PPP). The German Fat Society (DGF) has indicated that the proportion of PPP to the total pheophytins is a good indicator of aged oil.
24
In this study the level of PPP increased in a similar way that was observed in the previous study carried out at higher temperatures and exposed to light. The lower temperatures and exclusion of light does not seem to have made a significant difference to the outcome. In both cases the proportion of PPP increased from around 3% to approximately 10%.
Remarkably, the PE container, that which has shown least ability to retain oil quality, produced the lowest level of PPP. The HDPE container, which was generally of good stability, showed the biggest increase in PPP. Other containers including the light impermeable MPE container, all increased at similar rates.
The outcomes present new information about how PPP might be used to evaluate olive oil. A high level of PPP does not relate to an increase in peroxide or a decrease in antioxidant. PPP can increase in the light or dark at the same rate, regardless of the temperature. The relationship between PPP and organoleptic quality was significantly less than the relationship with DAGs or UV268 absorbance. It may be that there would be a much greater change in PPP at higher temperatures, particularly those at which oil is generally refined.
5.8 1,2-diacylglycerol Diacylglycerols (DAGs) are formed as fatty acids are lost from oil molecules (triacylglycerols). Although the fatty acids are lost to form 1,2-diacylglycerol, in time the fatty acids move to the 1,3-diacylglycerol position. The proportion of 1,3-diacylglycerol is an indicator of the age of the oil. As the formation is accelerated by higher temperature, it may also indicate some refining.
As for PPP, oil in all containers exhibited the same results with a continuous reduction in 1,2-diacylglycerol over 52 weeks.
• As for PPP, there appeared to be no relationship with the container, indicating that the presence of oxygen, higher in the PE container, did not contribute to decreases in 1,2-diacylglycerol.
• DAGs decreased to 60% within 52 weeks in air conditioned storage. The reduction was more rapid in the hotter conditions of the previous study without climate control, with levels decreasing to 60% within only 16 weeks indicating that temperature was a significant contributor.
• The lack of difference between the clear and metallic containers used in the original study suggests that light has little effect.
The most important outcome form this observation is the continuous decline in DAG over time. Within 12 months the level of 1,2-diacylglycerol decreased from 90 to 60%. Although all of the oils showed deterioration with no clear relationship to the plastic container this method is an excellent indication of oil which has been stored for a long time. This ageing can be accelerated if the oil is stored at higher temperatures. Regardless of the temperature the oil quality is reflected by low 1.2-diacylglycerol and this was also shown in the UC Davis reports (Frankel et. al. 2010, Frankel et. al. 2011)
5.9 Fatty acid profile Fatty acid profiles determine the proportion of individual fatty acids within the total oil complex. Despite the changes in triacylglycerols and oxidative processes, these are minor variations to the total oil body and show no significant variation to the fatty acid profile. The fatty acids results, before and after storage, are shown in Appendices Table 10.4.

25
6. Implications Storage in incorrect container types can result in rapid loss of quality. The poor quality products that result from this procedure will reflect on the company which supplies the oil regardless of the care taken initially to produce high quality olive oil.
The results of this study, conducted in optimum storage facilities in an air conditioned room, and stored in the dark, produced considerably different outcomes to the previous study conducted in uncontrolled temperatures over summer months. Many of the containers in the original study exceeded peroxide limits within a few weeks of storage. With better storage, most containers were adequate over a period of 12 months The oil in the polyethylene and silver foil containers did show some signs of oxidation occurring during the 12 months study. Peroxide value for the PE container was outside the IOC limit by the end of the study, which led to the K232 ( a measure of the primary oxidation products in olive oil) also being outside the standard limit. This is valuable information for producers, transporters, exporters and retailers.
Many of the studies untaken by the NSW Department of Primary Industries at the AORL have found a high proportion of supermarket oils fail the basic international quality standard tests proposed by IOC, DGF and Australia. In many cases, the oils which fail may be the end product of poor storage which results in them being classified as “virgin” or “lampante”.
The results provided in this and the previous report will help the oil industry make important decisions about storage and transport of olive oil. The quality of olive oil in many instances is lost post harvest through lack of knowledge about storage. Hopefully, future oil products will be better maintained to increase shelf life and improve quality to the consumer.
26
7. Recommendations The results of this study concerning the use of collapsible containers for the storage of olive oil has major implications for all of the industry where oil is being stored, transported or sold. This report,in conjunction with the previous study (RIRDC Publication No. 09/160) needs to be distributed to the industry to draw attention to the positive and negative attributes of these containers.
The report has generated new information about the methods used to determine olive oil quality. Free fatty acids and fatty acid profiles have been shown to provide no extra information about olive oil quality once the oil has been packaged. Polyphenols, induction time and peroxide value all provide similar data and this can be focussed to reduce the amount and cost of analysis to evaluate olive oil. This information should be used to develop a more streamlined process of evaluating packaged olive oils.
The new methods incorporated into the Australian standard (pyropheophytin a and 1,2 diacylglycerol) have been evaluated in this study to determine their usefulness in measuring oil degeneration over time. Diacylglycerols in particular have been shown to decrease at a regular rate, regardless of the packaging but accelerated with increases in temperature. This method alone can provide a valuable set of data on oils to determine their shelf life and level of ageing. Pyropheophytin a levels are more complex in their development over time and need to be analysed in conjunction with other tests. They did however produce a regular pattern of degeneration to help evaluate oil quality. Unlike peroxide value or phenolic content, pyropheophytin were not related to the container material or to the storage conditions. From that point of view it provides an additional measure of oil quality which can be used in conjunction with other methods. These factors need to be considered in future olive oil evaluation.
Continued research on oil storage and use by dates is essential to fully understand when oil is labelled as extra virgin olive oil, how long and under what conditions it will remain so.
27
8. References Angerosa, F., Campestre, C. and Giansante, L. (2006) Analysis and authentication. In Olive oil: Chemistry and Technology. Boskou, D (ed) (second edition). AOCS Press, Champaign. Illinois.
AOCS (1998). Official Methods and Recommended Practices of the American Oil Chemists Society. 5th ed. AOCS Press, Champaign, Illinois.
Bilancia, M.T., Caponio, F., Sikorskab, E., Pasqualonea, A. and Summo, C. (2007). Correlation of triacylglycerol oligopolymers and oxidised triacylglycerols to quality parameters in extra virgin olive oil during storage. Food Research International 40 (7) 855-861.
Boskou, D. (1996). Chapter 8. Olive Oil Adulteration. In “Olive Oil Chemistry and Technology” pp 121–133.
Francesco, C., Bilancia, M.T., Pasqualone, A., Sikorska, E. and Gomes, T. (2005). Influence of the exposure to light on extra virgin olive oil quality during storage. European Food Research and Technology 221(1-2): 92–98.
Frankel, E. N., Mailer, R. J., Wang, S. C., Shoemaker, C. F., Guinard, J.-X., Flynn, J. D., Sturzenberger, N. D. Tests indicate that imported “extra virgin” olive oil often fails international and USDA standards. UC Davis Report. July 2010. olivecenter.ucdavis.edu.
Frankel, E. N.; Mailer, R. J.; Wang, S. C.; Shoemaker, C. F.; Guinard, J.-X.; Flynn, J. D.; Sturzenberger, N. D. Evaluation of Extra-Virgin Olive Oil Sold in California. UC Davis Report. April 2011. olivecenter.ucdavis.edu.
Fronimaki, P., Spyros, A., Christophoridou, S., and Dais, P. (2002) Determination of diglyceride content in Greek virgin olive oils and some commercial olive oils by employing 31P NMR spectroscopy. Journal of Agricultural and Food Chemistry 50, 2207-2213.
Gutfinger, T. (1981). Polyphenols in olive oils. Journal of the American Oil Chemists’ Society 62: 895–898.
Kamal-Eldin, A. and Appelqvist, L.A. (1996). The Chemistry and antioxidant properties of tocopherols and tocotrienols, Lipids 31: 671-701.
Kiritsakis, A.K. (1984). Effect of storage conditions and packaging materials on olive oil quality. JAOCS 61(12): 1868–1870.
Mailer, R.J., Ayton, J. and Conlan, D. (2002). Comparison and evaluation of the quality of thirty eight commercial Australian and New Zealand olive oils. Advances in Horticultural Sciences. 16(3-4): 259–256.
Mailer, R.J., Conlan, D. and Ayton, J. (2005). Olive Harvest: Harvest timing for optimal olive oil quality. RIRDC publication no. 05/013. A report prepared for the Rural Industries Research and Development Corporation, Canberra.
Mailer, R.J. (2006). The natural chemistry of Australian extra virgin olive oil. RIRDC Publication No: 06-132. A report prepared for the Rural Industries Research and Development Corporation, Canberra.
Mailer, R.J. and Ayton, J. (2008). A Survey of Australian Olive Cultivars to Determine Compliance with International standards. RIRDC publication no. 08/167. A report prepared for the Rural Industries Research and Development Corporation, Canberra.
28
Mailer, R.J. and Graham, K. (2009) Effect of storage containers on olive oil storage. RIRDC publication No. 09/160. A report prepared for the Rural Industries Research and Development Corporation, Canberra.
Mendez, A.I. and Falque, E. (2007). Effect of storage time and container type on the quality of extra virgin olive oil. Food Control 18: 521–529.
Tsimis, D.A. and Karakasides, N.G. (2002). How the choice of container affects olive oil quality - a review. Packaging Technology and Science 15:147–154.
9. Author References Ayton, J., Mailer, R.J., Haigh, A., Tronson, D. and Conlan, D. (2007). Quality and oxidative stability of Australian olive oil according to harvest date and irrigation. Journal of Food Lipids 14: 138–156.
Mailer, R.J., Ayton, J. and Conlan, D. (2007). Influence of harvest timing on Olive (Olea europaea) oil accumulation and fruit characteristics under Australian conditions. J Fd Agric & Environ. 5(3&4): 58–63
Mailer, R.J., Ayton, J. and Graham, K. (2010). The influence of growing region, cultivar and harvest timing on the diversity of Australian olive oil. JAOCS 87:877-884.

29
10. Appendices Table 10.1 Comparison of peroxide value, total polyphenol content, and induction time and
α-tocopherol content of olive oil in 5 various polymer containers at initial analysis and after 12 months storage.
sample PV
mEq oxygen/kg oil
Polyphenols
mg/kg of caffeic acid
Induction Time
Hours
α Tocopherol
mg/kg
0 months initial 6 245 23.5 347
12 months PE 21 199 12.4 211
12 months Nylon 6 246 24.7 268
12 months MPE 6 249 22.8 255
12 months SF 9 234 18.5 246
12 months HDPE 12 239 20.6 231
Table 10.2 Comparison of specific extinction coefficients, K232nm and K268nm, of olive oil stored in 5 various polymer containers at initial analysis and after 12 months storage.
Sample
Specific Extinction Coefficient
K 232nm (K 1% 1cm)
Specific Extinction Coefficient
K 268nm (K 1% 1cm)
0 months initial 1.52 0.09
12 months PE 2.92 0.15
12 months Nylon 1.68 0.11
12 months MPE 1.72 0.11
12 months SF 2.35 0.13
12 months HDPE 1.78 0.14
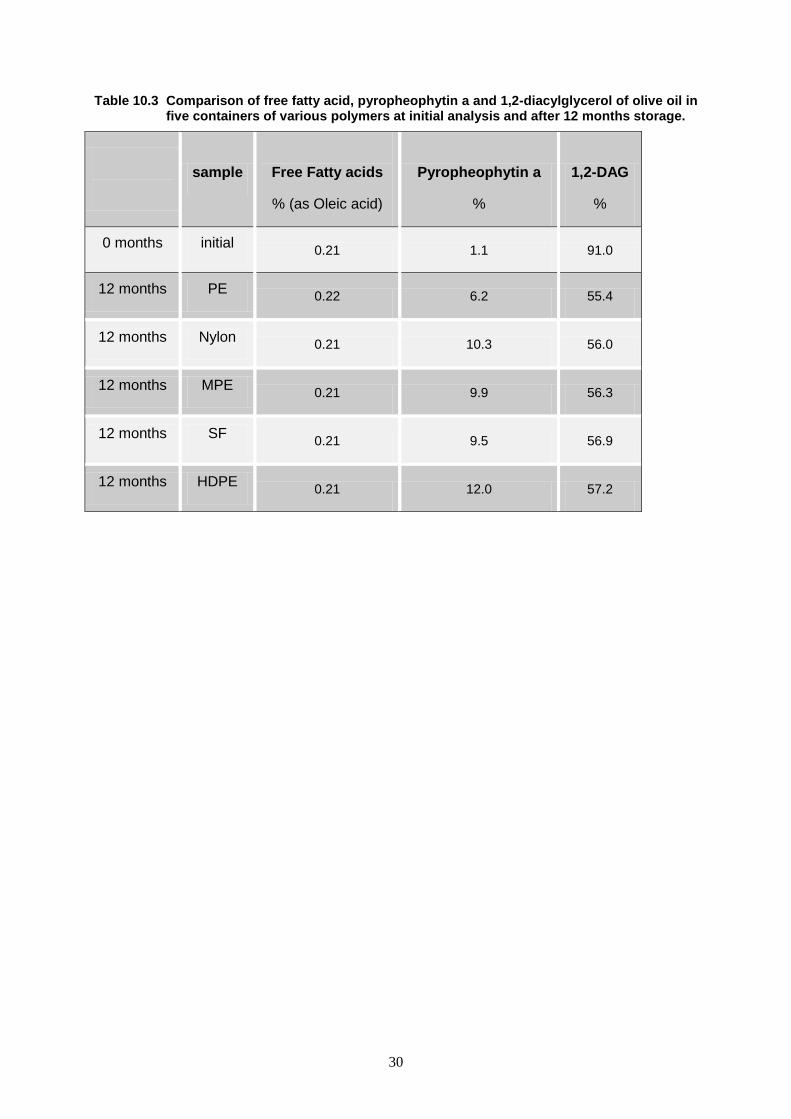
30
Table 10.3 Comparison of free fatty acid, pyropheophytin a and 1,2-diacylglycerol of olive oil in five containers of various polymers at initial analysis and after 12 months storage.
sample
Free Fatty acids
% (as Oleic acid)
Pyropheophytin a
%
1,2-DAG
%
0 months initial 0.21 1.1 91.0
12 months PE 0.22 6.2 55.4
12 months Nylon 0.21 10.3 56.0
12 months MPE 0.21 9.9 56.3
12 months SF 0.21 9.5 56.9
12 months HDPE 0.21 12.0 57.2
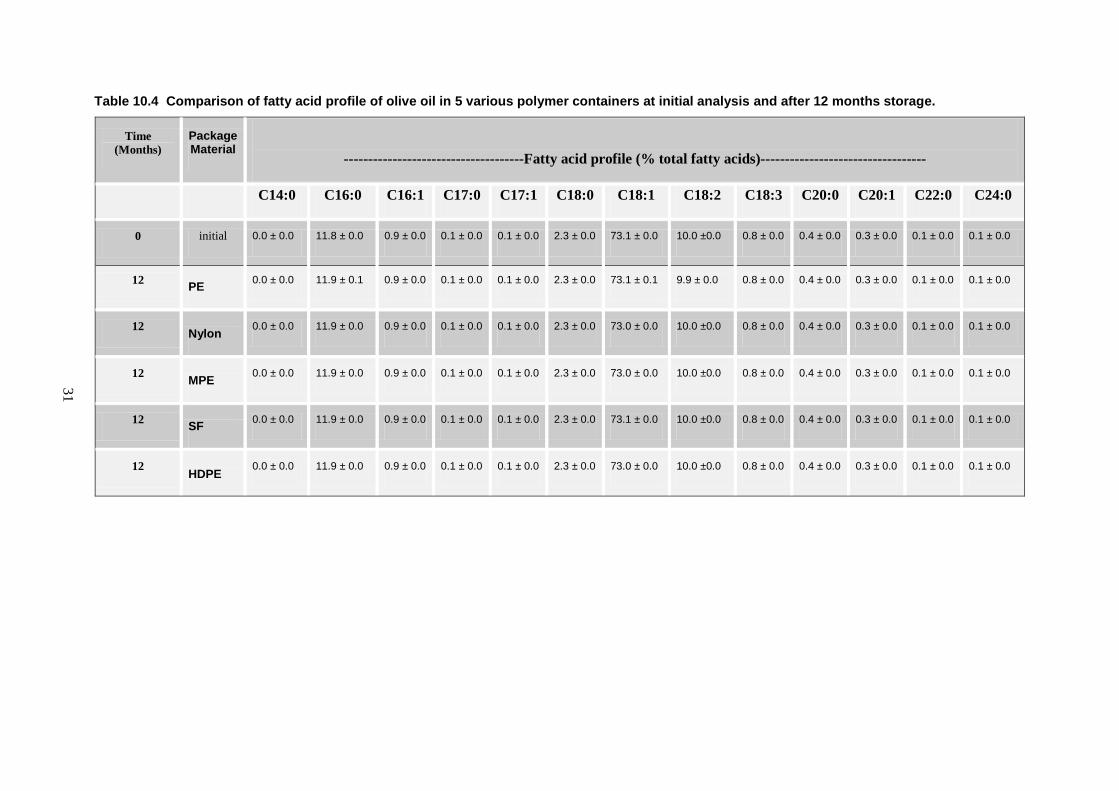
31
Table 10.4 Comparison of fatty acid profile of olive oil in 5 various polymer containers at initial analysis and after 12 months storage.
Time (Months)
Package Material
-------------------------------------Fatty acid profile (% total fatty acids)----------------------------------
C14:0 C16:0 C16:1 C17:0 C17:1 C18:0 C18:1 C18:2 C18:3 C20:0 C20:1 C22:0 C24:0
0 initial 0.0 ± 0.0 11.8 ± 0.0 0.9 ± 0.0 0.1 ± 0.0 0.1 ± 0.0 2.3 ± 0.0 73.1 ± 0.0 10.0 ±0.0 0.8 ± 0.0 0.4 ± 0.0 0.3 ± 0.0 0.1 ± 0.0 0.1 ± 0.0
12 PE 0.0 ± 0.0 11.9 ± 0.1 0.9 ± 0.0 0.1 ± 0.0 0.1 ± 0.0 2.3 ± 0.0 73.1 ± 0.1 9.9 ± 0.0 0.8 ± 0.0 0.4 ± 0.0 0.3 ± 0.0 0.1 ± 0.0 0.1 ± 0.0
12 Nylon 0.0 ± 0.0 11.9 ± 0.0 0.9 ± 0.0 0.1 ± 0.0 0.1 ± 0.0 2.3 ± 0.0 73.0 ± 0.0 10.0 ±0.0 0.8 ± 0.0 0.4 ± 0.0 0.3 ± 0.0 0.1 ± 0.0 0.1 ± 0.0
12 MPE 0.0 ± 0.0 11.9 ± 0.0 0.9 ± 0.0 0.1 ± 0.0 0.1 ± 0.0 2.3 ± 0.0 73.0 ± 0.0 10.0 ±0.0 0.8 ± 0.0 0.4 ± 0.0 0.3 ± 0.0 0.1 ± 0.0 0.1 ± 0.0
12 SF 0.0 ± 0.0 11.9 ± 0.0 0.9 ± 0.0 0.1 ± 0.0 0.1 ± 0.0 2.3 ± 0.0 73.1 ± 0.0 10.0 ±0.0 0.8 ± 0.0 0.4 ± 0.0 0.3 ± 0.0 0.1 ± 0.0 0.1 ± 0.0
12 HDPE 0.0 ± 0.0 11.9 ± 0.0 0.9 ± 0.0 0.1 ± 0.0 0.1 ± 0.0 2.3 ± 0.0 73.0 ± 0.0 10.0 ±0.0 0.8 ± 0.0 0.4 ± 0.0 0.3 ± 0.0 0.1 ± 0.0 0.1 ± 0.0
Phone: 02 6271 4100
Fax: 02 6271 4199
Bookshop: 1300 634 313
Email: [email protected]
Postal Address: PO Box 4776, Kingston ACT 2604
Street Address: Level 2, 15 National Circuit, Barton ACT 2600
www.rirdc.gov.au
The Effect of Storage in Collapsible Containers on Olive Oil QualityBy Rodney J. Mailer, Kerrie Graham and Jamie Ayton Pub. No. 12/008
This report is the second part of a study on oil storage. Initial studies at the Australian Oil Research Laboratory (AORL), RIRDC Publication No. 09/160, “Effect of storage containers on olive oil quality”, investigated changes in oil quality when stored in extreme environmental conditions in a range of containers commonly used by growers in the olive oil industry. The oil in some cases deteriorated quickly, reducing oil quality within a short period, sometimes in only a few days.
This second study has measured changes in the oil when stored in a temperature controlled environment, away from direct light, reputably the most desirable conditions for storage of olive oil. The chemical parameters which are indicative of oxidation and ageing were monitored and results are reported here.
RIRDC is a partnership between government and industry to invest in R&D for more productive and sustainable rural industries. We invest in new and emerging rural industries, a suite of established rural industries and national rural issues.
Most of the information we produce can be downloaded for free or purchased from our website <www.rirdc.gov.au>.
RIRDC books can also be purchased by phoning 1300 634 313 for a local call fee.