Embed Size (px)
Citation preview

FR-UBM-9.1.1.9/R1
Versi Online: http://journal.ubm.ac.id/ Journal of English Language and Culture Hasil Penelitian Vol. 8 (No. 1) : 45 - 59. Th. 2017
ISSN: 2087-8346 E-ISSN: 2597-8896
*Author(s) Correspondence: E-mail: [email protected]
45
THE EFFECT OF SELF TALK STRATEGY IN PUBLIC SPEAKING AS EFL CLASSROOM ON THE THIRD YEAR STUDENTS (ACADEMIC YEAR 2013) AT ENGLISH DEPARTMENT IN FKIP UNIVERSITAS
HKBP NOMMENSEN PEMATANGSIANTAR
Rudiarman Purba* & Sotarduga Sihombing
English Department of Teaching Training, HKBP Nommensen Pematangsiantar University
Received on 24 July 2017 / Approved on 25 September 2017
ABSTRACT
This research will tend to find out the significance and the effect Self Talk Strategy in Public Speaking as EFL classroom on the third year students (Academic Year 2013) at English Department in FKIP Universitas HKBP Nommensen Pematangsiantar. This research will use experimental research design. To answer the problems of the research, the writer uses the following theories: O‟Malley, et al. (2002), Braiker (1987), Vygotsky (1986), Winsler et al (2009), Gaskins (2005) in self-talk strategy and the writer uses the theory of Harris (1969), Ur (1996), Harmer (1998), Scrinever (2005), Thornburry (2005), Grugeon et al (2005) and Harmer (2007). The population of this research is the third year students (Academic Year 2013) at English Department that sit in Public Speaking Class in FKIP Universitas HKBP Nommensen Pematangsiantar. There are 40 students taken as the sample of this research. The sample was divided into two groups: the first group (20 students) as the experimental group and the second group (20 students) as the control group. The writers will give a treatment in class by applying self talk strategy in teaching speaking in public speaking class. To analyze the data, the writer uses the theory of Arikunto. After analyzing and calculating the data, the writer finds that The Mean Score was 7.8 and the value of t-test was higher than t-table (t-test > t-table), 2.671 > 1.686. Ha (Alternate Hypothesis) was accepted and Ho (Null Hypothesis) was rejected. Keywords: Self Talk Strategy, Speaking, English, Foreign Language, Teaching
ABSTRAK
Penelitian ini bertujuan untuk mengetahui signifikansi dan efek dari Strategi Bicara Diri dalam kelas
Public Speaking yang diikuti oleh mahasiswa tahun ketiga (Tahun Akademik 2013) di program studi Bahasa Inggris di FKIP Universitas HKBP Nommensen Pematangsiantar. Penelitian ini menggunakan desain penelitian eksperimental. Untuk menjawab permasalahan penelitian, penulis menggunakan teori berikut: O'Malley, et al. (2002), Braiker (1987), Vygotsky (1986), Winsler et al (2009), Gaskins (2005) dalam strategi self talk. dan penulis menggunakan teori Harris (1969), Ur (1996), Harmer (1998), Scrinever (2005), Thornburry (2005), Grugeon et al (2005) dan Harmer (2007). Populasi dalam penelitian ini adalah mahasiswa tahun ketiga (Tahun Akademik 2013) di program studi Bahasa Inggris yang berpartisipasi dalam kelas Public Speaking di FKIP Universitas HKBP Nommensen Pematangsiantar. Ada 40 mahasiswa yang diambil sebagai sampel penelitian ini. Sampel dibagi menjadi dua kelompok: kelompok pertama (20 siswa) sebagai kelompok eksperimen dan kelompok kedua (20 siswa) sebagai kelompok kontrol. Penulis akan memberikan treatment di kelas dengan menerapkan Strategi Bicara Sendiri dalam mengajar berbicara di kelas Public Speaking. Untuk menganalisa data, penulis menggunakan teori Arikunto. Setelah menganalisis dan menghitung data, penulis menemukan bahwa skor rata-rata adalah 7,8 dan nilai t-test lebih tinggi dari t-table (t-test> t-table), 2,671> 1,686. Karena itu, Ha (Hipotesis Alternatif) diterima dan Ho (Hipotesis Nol) ditolak. Kata Kunci: Strategi Bicara Sendiri, Berbicara, Bahasa Inggris, Bahasa Asing, Pengajaran

FR-UBM-9.1.1.9/R1
Versi Online: http://journal.ubm.ac.id/ Journal of English Language and Culture Hasil Penelitian Vol. 8 (No. 1) : 45 - 59. Th. 2017
ISSN: 2087-8346 E-ISSN: 2597-8896
*Author(s) Correspondence: E-mail: [email protected]
46
INTRODUCTION
This research aims to find out the effect of self talk strategy in public speaking as EFL classroom on the third year students (Academic Year 2013) at English Department in FKIP Universitas HKBP Nommensen Pematangsiantar There are some reason why this research is necessary to be done. First, the need of documentation for English Department of Teacher Training Faculty Nommensen HKBP University Pematangsiantar. It is also useful for the practical and scientific needs in future. The second is for the researchers themselves as the strategy for them to teach the students with lack of self confidence in doing public speaking in EFL class The findings of the preliminary research of this study shows that there many students are lack of confidence in in doing public speaking in EFL class. To get the real data of this research, the writer formulate the research problem by the following question: “Is there any significant effect of self talk strategy in public speaking as EFL classroom on the third year students (Academic Year 2013) at English Department in FKIP Universitas HKBP Nommensen Pematangsiantar?”
THEORETICAL FRAMEWORK Self-Talk Strategy Self-talk defines as intrapersonal communication is language use or thought internal to the communicator. It can be useful to envision intrapersonal communication occurring in the mind of the individual in a model which contains a sender, receiver, and feedback loop. O‟Malley, et al. (2002, p. 139) define self-talk is reducing anxiety by using mental techniques that make one feel competent to do the learning task. This strategy requires students to have their self-talk individually whatever they talk in their mind. It is usually in the form of actual words, although self-talk sometimes takes the form of pictures or concepts. Self-talk, based on Vygotsky‟s (1978) theory of the internalization of dialogue as inner speech, is
thought itself. It regulates how students feel and act, interprets what they experience, guides and controls academic achievement, and determines the quality of students‟ lives. The self develops as a result of repeated everyday events and interactions with parents, teachers, and peers. The self is the mediating variable in human behavior, the filter through which all new phenomena are interpreted. In self-talk, a person discusses many matter of importance with ones own self. The individual explores his or her own mind to find new ideas, answers to problems, information on difficult relationships, and many more matters that are important in life. Anybody can benefit from intelligent self-talk. Our failures in life are due to our lack of knowledge about ourselves. Therefore, knowledge about the self is the first step toward living a full, productive, and happy life. We have to use our inner strength through self-talk to know more about ourselves and to ensure a happy and successful life for ourselves. Self-talk helps us develop a positive mental attitude. The ability to reassure ourselves that everything will be alright, especially during the trying moments in our lives, fills us with power and self-confidence. In addition, helps us convert negative patterns into uplifting positive patterns of thought and behavior. It gives us the required motivation to maintain our body, mind, and spirit in a healthy condition. This valuable technique enables us to give ourselves a lot of positive feedback, which, in turn, boosts our energy. We feel good about ourselves, and if we feel good about ourselves, our way of life becomes easy and fun filled. We become more productive, have satisfying relationships, and lead a happier life. Example: Let‟s take the thought “I‟m such a loser”. Then, ask yourself: a. "Is this really true?" and if so, "Is it true
all of the time?" b. "What evidence do I have that this
thought is true?"

FR-UBM-9.1.1.9/R1
Versi Online: http://journal.ubm.ac.id/ Journal of English Language and Culture Hasil Penelitian Vol. 8 (No. 1) : 45 - 59. Th. 2017
ISSN: 2087-8346 E-ISSN: 2597-8896
*Author(s) Correspondence: E-mail: [email protected]
47
c. "What are the costs and benefits of believing this?"
d. "Would I say this to a friend?" Based on the example above he/she has self talk about his/herself. Self-talk here is comprised of statements said to oneself and not addressed to others. So, it can be positive or negative self-talk like this examples; Is it really true that I am a loser? Well, yes, I believe it to be true. Is it true all of the time? It's true most of the time or a lot of the time, so I don't feel too much better. But has it always been true? I'm not sure, maybe not. I might have felt better than this at one time. Types of Self-Talk Strategy Self talk strategy can be divided into two types namely: (1) Positive self talk strategy and (2) negative self talk strategy. According to Gaskins (2005, p. 79) states positive self-talk is fostered when individual differences are appreciated, rules are fair, mistakes are accepted, and nurturance is pervasive. As students come to define themselves in positive ways, they face each day with greater confidence and assurance, accepting their limitations and recognizing their potential. Caring teachers structure situations that provide authentic, successful experiences, and they avoid placing students in situations in which repeated failure is likely. They point out areas of accomplishment rather than focus on mistakes. They find something special that each student can do or is interested in, and invite students to see themselves as able, valuable, and responsible. A caring teacher also helps young people develop a positive, yet realistic, image of what he or she can become or do, because the “possible self” is the essential link between self concept and motivation. In a caring environment young people experience respect, trust, and confidence from caregivers and, as a result, develop self-respect, self-trust, and self-confidence. Positive self-talk can do a lot to give you the confidence that frees you to use your talents to the fullest. If public speaking makes you nervous, use your inner voice to reassure
yourself: “You can do it. You‟ve done it well before.” Braiker (1987) states a positive attitude and positively worded self-talk affect behavior more than many people realize because of the nature of the mind-body connection. In language learning English of speaking skill, many good things result from developing a habit of positive self-talk. The students can raise their enthusiasm and focus on the task at hand by thinking about what to do (not what to avoid). Negative self-talk is self-critical or represents an inability to succeed. Negative self-talk is exemplified by comments such as “Stupid mistake” and “This is too hard” (Hardy, et al., 2001). Most of students used this negative self talk so they didn‟t have the confidence, negative feelings or anxiety. It also takes your focus away from what you should be doing, which makes it more likely that you will miss something important or make a mistake. So, when we talk negatively to ourselves, it affects other important mental skills such as intensity regulation, confidence, and concentration. In negative self-talk is self-blame. Obviously, what we blame ourselves about or even that we are self-blaming can be traced to our early experiences. But all of us think in blaming ways automatically. In effect, it is built into our software. In addition, negative self-talk can occur so quickly in our heads that it sometimes slips by our awareness. We‟re going to practice pausing to notice and catch these thoughts, so that we can each shrink our own negative self talk and protect our self confidence. We need to appreciate that we all make mistakes; it is what makes us human. Mistakes are part of the process of learning anything, and we all need to learn how to accept them when they occur. When we are not able to accept our mistakes and move on, we can get stuck in a rut and become afraid to keep trying. Speaking Skill Thornburry (2005, p. 1) defines speaking is a part of daily life that we take it for granted. In language teaching, the four skills are described in terms of their direction language generated by the learner (in speech

FR-UBM-9.1.1.9/R1
Versi Online: http://journal.ubm.ac.id/ Journal of English Language and Culture Hasil Penelitian Vol. 8 (No. 1) : 45 - 59. Th. 2017
ISSN: 2087-8346 E-ISSN: 2597-8896
*Author(s) Correspondence: E-mail: [email protected]
48
or writing) is referred to as productive. Language directed at the learner (in reading or listening) is called receptive. Another important idea is the channel, which refers to the medium of message (aural/oral or written). Thus, speaking is the productive aural/oral skill. It consists of producing systematic verbal utterances to convey meaning. Either four or five components are generally recognized in analyses of the speech process: (1) Pronunciation (including the segmental features – vowels and consonants – and the stress and intonation patterns), (2) Grammar, (3) Vocabulary, (4) Fluency (the ease and speed of the flow of speech), (5) Comprehension, for oral communication certainly requires a subject to respond to speech as well as to initiate it.”
Hypothesis of the Research The hypothesis of the research is in the following: Ha : There is a significant effect of using self
talk strategy on the students‟ ability in public speaking as EFL classroom
Ho : There is no significant effect self talk strategy on the students‟ ability in public speaking as EFL classroom.
RESEARCH METHOD Research Design The research was conducted by using experimental design which was to find the effect of the independent variable on the dependent variable. There were two group and experimental group. The pre-test was administered to both groups before treatment were given. The post-test was given after treatment. The control group was treated without using self talk strategy while the experimental group was treated by using self talk strategy.
Table 1. Randomized Groups Pre-Test and Post-Test Design
Group Pre-test
Treatment Post-test
Experi-mental
√ Self talk strategy
√
Control √ Without using self
talk strategy
√
Population and Sample There are 200 students in academic year (2013). Best and Khoan (2002, p.14) stated that sample is a small proportion of population selected for observation and analysis. From the whole population 40 students was taken by using random sampling technique as the sample of this research, which consists, 20 students for experimental group and 20 students for control group. There are three groups of the public speaking class at FKIP UHN. The writers use only two classes as the sample of the research. Group A was chosen as experimental group which was taught by using Self-Talk Strategy and group B as control group without using self talk strategy. The reason for taking the number of the sample is based on Arikunto (1998, p. 120) says that if the subject or population consists of a large number, the sample taken from 10-15% or 20-25% or more. It depends on the ability of the researcher. The sample was expected to represent the population. Data Collection Instrument The instruments that are used to collect the data are oral production tests. The marking, as well as being reliable, is simple, more rapid and often much more effective than other forms of written test. The writers use 5 criteria to measure data based on Harris‟ frame (1969, p. 84) that used 1-5 points of rating scale. The speaking class rating is used the range of point 1-10 or 10-100. The amount of maximum scores gained in 25. It is gained from the five elements of speaking. According to the rounding the system, the researcher

FR-UBM-9.1.1.9/R1
Versi Online: http://journal.ubm.ac.id/ Journal of English Language and Culture Hasil Penelitian Vol. 8 (No. 1) : 45 - 59. Th. 2017
ISSN: 2087-8346 E-ISSN: 2597-8896
*Author(s) Correspondence: E-mail: [email protected]
49
concludes that 100 is the highest score and 20 is the lowest score gained by the students. This rounding system will be done in pre-test and post-test. Data Collection Procedures The data will be collected by following these procedures: 1. Preparation
In preparation, the writer divided two class namely experimental class and control class. In experimental class the writer applied self-talk strategy to the students while control class without self talk strategy.
2. Pre-test Pre-test is given first to the control and experimental class which is done usually before doing the teaching and learning process.The pretest was administered before the treatment. The pre-test was given to both experimental group and control group. The aim of the pre-test is to find out the homogeneity in the mean score of experimental and control group. In doing the pre-test, the students were asked to do a simple conversation related to the given materials.
3. Treatment The treatment was conducted to the experimental group. The experimental group was taught by using prediction strategy. Meanwhile, the control group was taught without using Prediction Strategy.
4. Post-test After explaining the material, both of the groups were given the same test to know the result of the treatment. At last, the writer found the effect of using self-talk strategy which was given the influence to the students‟ speaking skill. The post-test was administered after the treatment. The post-test was given to both experimental group and control group. The aim of the post-test is to find out the difference in the mean score of experimental and control group. For the post test, the students were asked to do a simple
conversation related to the given materials.
Data Analysis Techniques There are two groups of data: those of
the control and experimental groups. To analyze the data, mean of variable, standard deviation and the t-test formula are shown below:
Seeking gained score symbolized with d from the students‟ speaking test and describing it in the tables. The gained score (d) of experimental class are variable I and the gained score (d) of control class are variable II.
1. Determining mean of variable of
experimental class with formula:
2. Determining mean of variable of control class with formula:
3. (Arikunto, 2006, p. 307) Determining standard deviation score of experimental class with formula:
4. Determining standard deviation score of
control class with formula:
5. (Arikunto, 2006, p. 308) Analyzing the data result by using statistic of t-test with formula:
(Arikunto, 2006, p. 311)
Where:
= Mean of experimental class, = Mean of control class
= The standard deviation of experimental class, = The standard deviation of control class
FR-UBM-9.1.1.9/R1
Versi Online: http://journal.ubm.ac.id/ Journal of English Language and Culture Hasil Penelitian Vol. 8 (No. 1) : 45 - 59. Th. 2017
ISSN: 2087-8346 E-ISSN: 2597-8896
*Author(s) Correspondence: E-mail: [email protected]
50
= Total students of experimental class. = Total students of control class
= Standard Deviation of experimental class, = Standard Deviation of control class ,
= t-value
RESULTS AND DISCUSSION
Data Analysis The data acquired in the study were obtained from the result of the test given to the students, the first class as the experimental class and the second as the control class. There were some steps to following in order to get the data, namely administrating the test to the
students, checking the test performance done by the students, collecting the result as the data analyzed and comparing the achievement between the group after giving them different treatment. The complete data of the students as presented in the next table, the experimental class will be the first and the following is the control class. Description of Data The data given to the students is a speaking test and the score was based on five components of speaking skill; Pronunciation (P), Grammar (G), Vocabulary (V), Fluency (F), and Comprehension (C) (Harris, 1969: 84). The results of the data were pre-test and post-test as this following result.
Table 2. The Scores of the Students’ Pre-Test in Experimental Class
No Students Rating Score Total Scores of Pre-Test (X) P G V F C
1. A D 3 3 3 3 3 15 60 2. A N T 3 3 3 3 3 15 60 3. A A S 3 4 4 4 3 18 72 4. B I S S 3 4 4 3 3 17 68 5. C S P 4 4 4 3 4 19 76 6. C B N 2 1 1 2 2 8 32 7. D T A 3 4 4 4 4 19 76 8. G L H 1 2 2 2 2 9 36 9. R L S 3 2 2 3 2 12 48
10. M H 3 4 4 3 3 17 68 11. M A A S 2 4 4 3 3 16 64 12. P D I 3 4 4 3 3 17 68 13. P M H 2 1 1 2 2 8 32 14. R W 3 4 4 4 3 18 72 15. S P A 4 4 4 3 3 18 72 16. T J S 3 3 3 3 2 14 56 17. Y V 4 4 4 3 4 19 76 18. A 2 2 2 2 2 10 40 19. M N P P 3 2 2 3 3 13 52

FR-UBM-9.1.1.9/R1
Versi Online: http://journal.ubm.ac.id/ Journal of English Language and Culture Hasil Penelitian Vol. 8 (No. 1) : 45 - 59. Th. 2017
ISSN: 2087-8346 E-ISSN: 2597-8896
*Author(s) Correspondence: E-mail: [email protected]
51
20. D W 2 2 2 2 2 10 40 N = 20 ∑a1 = 1168
Ma1 = 58,4 From the table above showed that the score of pre-test is low, the lowest score of pre-test is 32. There are two students who got 32. There are one student who got 36, two students who got 40, one student who got 48, and one student who got 56. And the highest score is 76. There are three students who got 76. There are three students who got 72, three students who got 68, one student who got 64 and two students who got 60. The mean score of pre-test was 58, 4. It means that the mean score was medium.
The score of the five components in speaking is as follows:
100 – 86 = the ability is very high 85 – 66 = the ability is high 65 – 46 = the ability is fair 45 – 0 = the ability is low
The mean lists of mean score are as
follows: 99.50 – 85.00 = the mean score is very high 80.35 – 70.00 = the mean score is high 65.35 – 50.00 = the mean score is medium 45.35 – 0.00 = the mean score is low Meanwhile, let‟s have a look at the result of post-test from experimental class.
Table 3. The Scores of the Students’ Post-Test in Experimental Class
No Students Rating Score Total Scores of Post-Test (Y) P G V F C
1. A D 3 4 4 4 4 19 76 2. A N T 3 4 4 3 3 17 68 3. A A S 4 5 5 5 5 24 96 4. B I S S 4 4 4 4 4 20 80 5. C S P 5 5 5 5 5 25 100 6. C B N 3 2 2 5 3 15 60 7. D T A 4 5 5 5 5 24 96 8. G L H 1 4 4 3 3 15 60 9. R L S 3 3 3 3 3 15 60
10. M H 2 5 5 3 3 18 72 11. M A A S 4 3 3 5 3 18 72 12. P D I 5 5 5 5 5 25 100 13. P M H 3 2 2 5 3 15 60 14. R W 3 5 5 4 3 20 80 15. S P A 5 2 2 5 5 19 76 16. T J S 4 3 3 4 4 18 72 17. Y V 5 3 3 5 5 21 84 18. A 4 5 5 5 4 23 92

FR-UBM-9.1.1.9/R1
Versi Online: http://journal.ubm.ac.id/ Journal of English Language and Culture Hasil Penelitian Vol. 8 (No. 1) : 45 - 59. Th. 2017
ISSN: 2087-8346 E-ISSN: 2597-8896
*Author(s) Correspondence: E-mail: [email protected]
52
19. M N P P 3 4 4 3 3 17 68 20. D W 2 4 4 2 3 15 60
N = 20
∑b1 = 1536
Mb1 = 76,8
From the table above showed that in the post-test, the students are able in speaking ability by using self-talk strategy. The highest score is 100. There were two students who got 100 and the ability is very high, two students who got 96, one student who got 92, one student who
got 84, two students who got 80, two students who got 76, three students who got 72, two students who got 68 and five students who got 60. The mean score in post-test was 76,8. It means that the mean score was high.
Table 4. The Scores of the Students’ Pre-Test in Control Class
No Students Rating Score Total Scores of Pre-Test (X) P G V F C
1. A A A 4 4 4 3 4 19 76 2. A S S 4 3 3 4 3 17 68 3. A S R 3 2 2 4 3 14 56 4. C N T 4 3 3 4 4 18 72 5. C A 4 3 3 3 3 16 64 6. E M G 4 3 3 4 3 17 68 7. E M S 4 3 3 5 4 19 76 8. F A 3 3 3 3 3 15 60 9. I H 3 4 4 3 3 17 68
10. J A S 3 3 3 3 3 15 60 11. M H W 3 3 3 3 3 15 60 12. M Z 2 3 3 3 2 13 52 13. R S A 3 3 3 3 3 15 60 14. T C 3 4 4 3 3 17 68 15. U K 3 4 4 3 3 17 68 16. V F 2 4 4 2 3 15 60 17. W H 3 3 3 3 3 15 60 18. W M M 3 3 3 3 3 15 60 19. A K 3 2 2 3 3 13 52 20. M F S 3 4 4 3 3 17 68
N = 20
∑a1 = 1276
Ma1 = 63,8

FR-UBM-9.1.1.9/R1
Versi Online: http://journal.ubm.ac.id/ Journal of English Language and Culture Hasil Penelitian Vol. 8 (No. 1) : 45 - 59. Th. 2017
ISSN: 2087-8346 E-ISSN: 2597-8896
*Author(s) Correspondence: E-mail: [email protected]
53
From the table above showed that the score of pre-test is fair, the lowest score of pre-test is 52. There were two students who got 52 and one student who got 56. The highest score is 76. There were two students who got 76, one
student who got 72, six students who got 68, one student who got 64, and seven students who got 60. The mean score was 63,8. It means that the mean score was medium.
Table 5. The Scores of the Students’ Post-Test in Control Class
No Students Rating Score Total Scores of Post-Test (Y) P G V F C
1. A A A 4 4 4 4 4 20 80 2. A S S 4 3 3 4 3 17 68 3. A S R 3 4 4 4 3 18 72 4. C N T 4 4 4 4 4 20 80 5. C A 4 4 4 3 3 18 72 6. E M G 3 5 5 4 4 21 84 7. E M S 4 4 4 4 4 20 80 8. F A 3 5 5 3 4 20 80 9. I H 3 4 4 4 4 19 76
10. J A S 4 4 4 4 4 20 80 11. M H W 3 4 4 4 4 19 76 12. M Z 3 3 3 3 3 15 60 13. R S A 3 4 4 3 4 18 72 14. T C 4 4 4 3 4 19 76 15. U K 3 5 5 4 4 21 84 16. V F 3 3 3 3 3 15 60 17. W H 3 3 3 4 4 17 68 18. W M M 3 4 4 4 4 19 76 19. A K 3 4 4 3 4 18 72 20. M F S 3 4 4 4 3 18 72
N = 20
∑b1 = 1488
Mb1 = 74,4
From the table above showed that in the post-test, the students are able in speaking ability. The highest score was 84. There are two students who got 84, five students who got 80, four students who got 76, five students who got 72, two students who got 68, and two students who got 60. The mean score was 74,4. It means that the mean score was high.
Data Analysis on Experimental Class Using t-test Formula Seeking gained score symbolized with (d) from the students‟ speaking test and describing it in the tables. The gained score (d) between pre-test and post-test of experimental class will show in the table below:
FR-UBM-9.1.1.9/R1
Versi Online: http://journal.ubm.ac.id/ Journal of English Language and Culture Hasil Penelitian Vol. 8 (No. 1) : 45 - 59. Th. 2017
ISSN: 2087-8346 E-ISSN: 2597-8896
*Author(s) Correspondence: E-mail: [email protected]
54
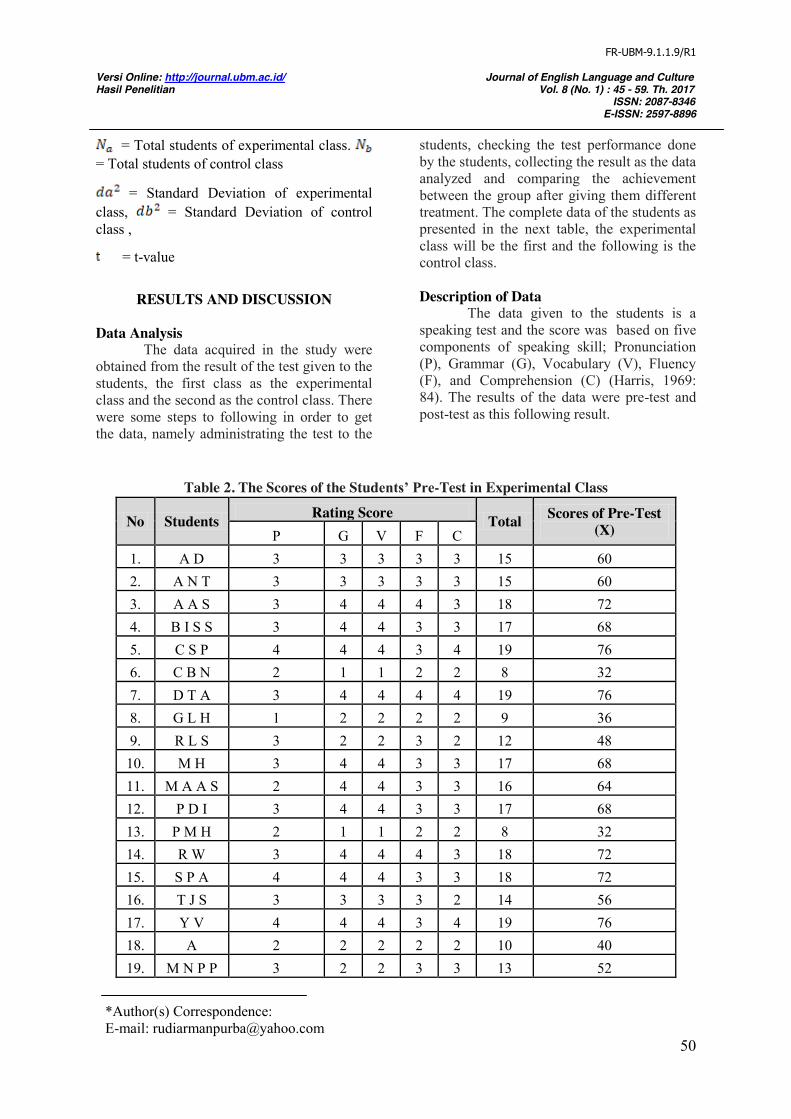
Table 6. Gained Score between Pre-test and Post-test of Experimental Class No. Students Pre-Test Post-Test d d² 1. A D 60 76 16 256 2. A N T 60 68 8 64 3. A A S 72 96 24 576 4. B I S S 68 80 12 144 5. C S P 76 100 24 576 6. C B N 32 60 28 784 7. D T A 76 96 20 400 8. G L H 36 60 24 576 9. R L S 48 60 12 144 10. M H 68 76 8 64 11. M A A S 64 72 8 64 12. P D I 68 100 32 1024 13. P M H 32 60 28 784 14. R W 72 80 8 64 15. S P A 72 76 4 16 16. T J S 56 72 16 256 17. Y V 76 84 8 64 18. A 40 92 52 2704 19. M N P P 52 68 16 256 20. D W 40 60 20 400
Na = 20
∑d = 368 ∑d² = 9216
Note: Na is the total number of the students in experimental class. ∑d is the gained score in experimental class from pre-test and post-test whereas ∑d² is the result‟s score from gained score and it will be calculated to find the significant score in t-test formula. Determining Mean of variable of experimental class with formula:
So, the result was:
After getting the result of Mean variable of experimental class, the writer
calculated the standard deviation score as follows: Determining standard deviation score of variable I (experimental class) with formula:
So, the calculation and result were:

FR-UBM-9.1.1.9/R1
Versi Online: http://journal.ubm.ac.id/ Journal of English Language and Culture Hasil Penelitian Vol. 8 (No. 1) : 45 - 59. Th. 2017
ISSN: 2087-8346 E-ISSN: 2597-8896
*Author(s) Correspondence: E-mail: [email protected]
55
From the calculation above, the results of experimental class were: a. Total number of the students (Na) = 20 b. Mean of variable (Ma) = 18.4 c. Standard deviation score (da²) = 2444.8
The result above will be calculated again after find the calculation in control class to find out the comparison scores in two classes and then find out the significant influence of
the students‟ speaking ability taught by self-talk strategy with t-test formula. Data Analysis on Control Class Using t-test Formula Seeking gained score symbolized with (d) from the students‟ speaking test and describing it in the tables. The gained score (d) between pre-test and post-test of control class will show in the table below:
Table 7. Gained Score between Pre-test and Post-test of Control Class
No. Students Pre-Test Post-Test d d² 1. A A A 76 80 4 16 2. A S S 68 68 0 0 3. A S R 56 72 16 256 4. C N T 72 80 8 64 5. C A 64 72 8 64 6. E M G 68 84 16 256 7. E M S 76 80 4 16 8. F A 60 80 20 400 9. I H 68 76 8 64 10. J A S 60 80 20 400 11. M H W 60 76 16 256 12. M Z 52 60 8 64 13. R S A 60 72 12 144 14. T C 68 76 8 64 15. U K 68 84 16 256 16. V F 60 60 0 0 17. W H 60 68 8 64 18. W M M 60 76 16 256 19. A K 52 72 20 400 20. M F S 68 72 4 16
Nb = 20
∑d = 212 ∑d² = 3056
Note: Nb is the total number of the students in control class. ∑d is the gained score in control class from pre-test and post-test while ∑d² is the result‟s score from gained score and it will be
calculated to find the significant score in t-test formula.
Determining Mean of variable of control class with formula:

FR-UBM-9.1.1.9/R1
Versi Online: http://journal.ubm.ac.id/ Journal of English Language and Culture Hasil Penelitian Vol. 8 (No. 1) : 45 - 59. Th. 2017
ISSN: 2087-8346 E-ISSN: 2597-8896
*Author(s) Correspondence: E-mail: [email protected]
56
So, the result was:
After getting the result of Mean
variable of control class, the writer calculated the standard deviation score as follows:
Determining standard deviation score of variable II (control class) with formula:
So, the calculation and result were:
From the calculation above, the results of control class were: a. Total number of the students (Nb) = 20 b. Mean of variable (Mb) = 10.6 c. Standard deviation score (db²) = 808.8
The results above will be calculated
again in t-test formula. And from the results, it can be seen that the experimental class has a high mean variable and standard deviation than in control class. The total number both of the class (Na and Nb) are the same so that it is easy to calculated the two classes by using t-test formula which proposed by Arikunto (2006, p. 311). Before doing the calculation of t-test formula, the writer must found the degree of freedom (df) with the formula: df = Na + Nb - 2 = 20 + 20 – 2 = 38
Based on the data calculation above from experimental class and control class, the results were:
Ma = 18.4 Na = 20
Mb = 10.6 Nb = 20 da² = 2444.8 db² = 808.8 df = 38
The result of the data analysis was
2.671 with the degree of freedom (df) in calculating two tails is 38. So, the t-table result is 1.686. It is shown that t-test is higher than t-table (2.671>1.686) at the level of significance (0.05) with two tails. So, from the results it can be seen that there is significant influence by using Self-Talk Strategy on the students‟ speaking ability.
Hypothesis Testing The hypothesis testing is aimed to know the answer of the question about the significant influence of the students‟ speaking ability taught by using Self-Talk Strategy. To get the answer of the question the writer should propose Alternate Hypothesis and Null Hypothesis as follow: Ha : There is a significant effect of using
Self-Talk Strategy on the students‟ speaking ability.
Ho : There is no significant effect of using Self-Talk Strategy on the students‟ speaking ability.

FR-UBM-9.1.1.9/R1
Versi Online: http://journal.ubm.ac.id/ Journal of English Language and Culture Hasil Penelitian Vol. 8 (No. 1) : 45 - 59. Th. 2017
ISSN: 2087-8346 E-ISSN: 2597-8896
*Author(s) Correspondence: E-mail: [email protected]
57
“The value of t-test the same or less than the value of t-table (t-test = t-table or t-test < t-table)”
The calculation of t-test for the degree
freedom (df) 38 at the level of significance 0.05 showed that the critical value (t-test) was 2.671. t-test > t-table with df 38 2.671 > 1.686 with df 38
Based on the calculation of hypothesis testing above, it was concluded that the value of t-test was higher than the value of t-table (2.671 > 1.686). Therefore, the Alternate Hypothesis (Ha) was accepted and the Null Hypothesis (Ho) was rejected.
Research Findings
As stated above that if t-test was higher than t-table, so the alternative hypothesis is accepted. According to the explanation about the analysis of the results on the table above, the writer can conclude that there is a significant influence of the students‟ speaking ability taught by using Self-Talk Strategy. With the research data and results findings of the calculation below:
1. Na and Nb = 20 and 20
There are 20 students in Experimental Class and 20 students in Control Class. The writer will include the score of data research in this thesis findings. They are: a) Pre-test (Experimental Class)
The lowest score of pre-test is 32. There are two students who got 32 (the ability is low). There are one students who got 36 (the ability is low), two students who got 40 (the ability is low), one students who got 48 (the ability is fair), and one students who got 56 (the ability is fair). And the highest score is 76 (the ability is high). There are three students who got 76 (the ability is high). There are three students who got 72 (the ability is high), three students who got 68 (the ability is high), one students who got
64 (the ability is fair) and two students who got 60 (the ability is fair).
b) Post-test (Experimental Class) The highest score is 100. There are two students who got 100 (the ability is very high), two students who got 96 (the ability is very high), one student who got 92 (the ability is very high), one student who got 84 (the ability is high), two students who got 80 (the ability is high), two students who got 76 (the ability is high), three students who got 72 (the ability is high), two students who got 68 (the ability is high), and five students who got 60 (the ability is fair).
c) Pre-test (Control Class) the lowest score of pre-test is 52. There are two students who got 52 (the ability is fair) and one student who got 56 (the ability is fair). The highest score is 76. There are two students who got 76 (the ability is high), one student who got 72 (the ability is high), six students who got 68 (the ability is high), one student who got 64 (the ability is fair), and seven students who got 60 (the ability is fair).
d) Post-test (Control Class) The highest score is 84. There are two students who got 84 (the ability is high), five students who got 80 (the ability is high), four students who got 76 (the ability is high), five students who got 72 (the ability is high), two students who got 68 (the ability is high), and two students who got 60 (the ability is fair).
2. The writer found the mean score in Experimental Class from pre-test and post-test were (Ma1 and Mb2) = 58.4 and 76.8.
3. The writer found the mean score in Control Class from pre-test and post-test were (Ma1 and Mb2) = 63.8 and 74.4.
4. The writer found the total mean score from Experimental Class (Ma) was 18.4.
5. The writer found the total mean score from Control Class (Ma) was 10.6.
6. Df (degree of freedom) was 38.

FR-UBM-9.1.1.9/R1
Versi Online: http://journal.ubm.ac.id/ Journal of English Language and Culture Hasil Penelitian Vol. 8 (No. 1) : 45 - 59. Th. 2017
ISSN: 2087-8346 E-ISSN: 2597-8896
*Author(s) Correspondence: E-mail: [email protected]
58
7. The writer found the total standard deviation from Experimental Class (da2) was 2444.8.
8. The writer found the total standard deviation from Control Class (db2) was 808.8.
9. After calculated the data from the previous point, the writer found the t-table score with df 38 = 1.686 from William Knight.
10. After calculated the data from the previous point, the writer got the t-test score = 2.671 from the t-test formula.
Data Interpretation The problem of this research is: “Is there any significant effect of self talk strategy in public speaking as EFL classroom on the third year students (Academic Year 2013) at English Department in FKIP Universitas HKBP Nommensen Pematangsiantar?”. After analyzing the data, the writer finds that using Self-Talk Strategy has the influence to increase the students‟ confidence to be more focus and aware about themselves. The students can know about their weakness, accepting their mistakes and recognizing their potential. The students must ensure themselves that they can do it in positive self-talk while they can lose it if they have negative self-talk. In positive self-talk, the students can be confident in speaking skill in front of their classmates. Discussion Speaking is a productive skill. It involves putting a message together, communicating the message and interacting with other people. Thornburry (2005, p. 1) defines speaking is a part of daily life that we take it for granted. The average person produces tens of thousands of words a day, although some people like politicians or auctioneers may produce even more than that. So natural and integral is speaking that we forget how we once struggled to achieve this ability until we have to learn how to do it all over again in a foreign language.
The goal of teaching speaking skills is communicative efficiency. Learners should be
able to make themselves understood, using their current proficiency to the fullest. They should try to avoid confusion in the message due to faulty pronunciation, grammar, or vocabulary, and to observe the social and cultural rules that apply in each communication situation.
According to Harmer (2007, p. 345) students are often reluctant to speak because they are shy and are not predisposed to expressing themselves in front of other people, especially when they are being asked to give personal information or opinions. Frequently, too, there is a worry about speaking badly and therefore losing face in front of their classmates. So, speaking activities in class and helping students to improve their speaking skill is part of teacher‟s job. Therefore, the teacher must be applying one way of strategy on the students‟ speaking skill. The strategy is self-talk to increase their confidence be better. As O‟ Malley and Chamot (2002, p. 139) defines self-talk is reducing anxiety by using mental techniques that make one feel competent to do the learning task. This strategy requires students to have their self-talk individually whatever they talk in their mind. It is usually in the form of actual words, although self-talk sometimes takes the form of pictures or concepts. How students feel about themselves depends on how their minds filter and interpret everyday experiences. How students define themselves depends on how they think others define them. So, it is expected that self-talk strategy in teaching speaking skill can increase the students‟ confidence be better.
CONCLUSION
The researcher concluded this research with several points as follow:
1. By self-talk strategy the students can help
them to come closer to themselves and to learn to trust their actions.
2. Having been analyzed, the data showed a significant effect of the students‟ speaking ability taught by Self-Talk Strategy in Experimental Class and no significant
FR-UBM-9.1.1.9/R1
Versi Online: http://journal.ubm.ac.id/ Journal of English Language and Culture Hasil Penelitian Vol. 8 (No. 1) : 45 - 59. Th. 2017
ISSN: 2087-8346 E-ISSN: 2597-8896
*Author(s) Correspondence: E-mail: [email protected]
59
effect of the students‟ speaking ability taught by Conventional Method in Control Class. The value t-table was 1.686 while the value of t-test was 2.671.
3. It means that t-test (2.671) was higher than t-table at the level of significant of 0. 05 (1.686), or 2.671 > 1.686.
4. It can be concluded that there is a significant effect of using Self-Talk Strategy of the students‟ speaking ability. It can be seen on the table of the students‟ speaking scores that the students who learn speaking through Self-Talk Strategy and Conventional Method.
In other words, the effect of Self-Talk Strategy has a significant influence on the students‟ speaking ability of students in Public Speaking class at FKIP Universitas HKBP Nommensen.
REFERENCES
Arikunto, S. (2006). Prosedur penelitian (Suatu pendekatan praktek). Jakarta: Rineka Cipta.
Gaskins, I. W. (2005). Success with struggling readers. New York: The Guilford Press.
Grugeon, E., et al. (2005). Teaching speaking & listening in the primary school, London: David Fulton.
Hardy, J., Gammage, K., & Hall, C. (2001). A descriptive study of athlete self-talk. Sport Psychologist,15(3), 306. Retrieved from
http://search.ebscohost.com/ login.aspx?direct=true&db=aph&AN=6165216&site=ehost-live.
Harmer, J. (1998). How to teach English. Cambridge: Longman.
Harmer, J. (2007). The practice of English language teaching (4th edition). Cambridge: Longman
Harris, D. P. (1969). Testing English as a second language. New York: McGraw-Hill, Inc.
Harrison, B. (1973). English as a second and foreign language. London: Butler & Tanner Ltd.
http://en.wikipedia.org/wiki/Self-talk O‟Malley, J. M., et al. (2002). Learning
strategies in second language scquisition. Cambridge: Cambridge University Press.
Sapir, E. (1921). Language: An introduction to the study of speech. New York: Harcourt, Brace & World, Inc.
Scrinever, J. (2005). Learning teaching. UK: Macmillan.
Thornburry, S. (2005). How to teach speaking, New York: Pearson Education.
Ur, P. (1996). A course in language teaching, Cambridge: Cambridge University Press.
Vygotsky, L. (1986). Thought and language. USA: The Massachusetts Institute of Technology.
Winsler, A., et al. (2009). Private speech, executive functioning, and the development of verbal self-regulation. Cambridge: Cambridge University Press.