Embed Size (px)
Citation preview
THE EFFECT OF MACROECONOMIC VARIABLES ON THE MORTGAGE
UPTAKE FOR MORTGAGE INDUSTRY IN KENYA
BY
EMILY ADHIAMBO AGAO
D61/79814/2012
A RESEARCH PROJECT SUBMITTED IN PARTIAL FULFILLMENT OF THE
REQUIREMENTS FOR THE AWARD OF THE DEGREE OF MASTER IN
BUSINESS ADMINISTRATION, SCHOOL OF BUSINESS, UNIVERSITY OF
NAIROBI
OCTOBER, 2014

ii
DECLARATION
Student Declaration
I hereby declare that this research project is my original work and has not been presented
for a degree by myself or any other person from any other institution known or unknown
to me.
Signed…………………………………….Date ……………………………………..
Emily Adhiambo Agao
D61/79814/2012
Supervisor Declaration
This research project has been submitted with my approval as university supervisor.
Signed…………………………………….Date ……………………………………..
Mr. Mirie Mwangi

iii
ACKNOWLEDGEMENTS
First and foremost, I thank God the Almighty, for His abundant grace that enabled me to
start and complete the project. The wisdom, strength and insight I received from you,
were invaluable and I am forever grateful.
I thank my supervisor, Mr. Mirie Mwangi for his commitment and the guidance that he
provided step by step through the project. Your regular follow ups ensured that I
completed the project. Thank you very much.
I thank my beautiful family for their support and encouragement. To my husband
Wycliffe, thank you for the many days spent together in the libraries and your
encouragement to burn the midnight oil. To my child, Darrel, thank you for sacrificing
your well-deserved time with mummy to allow me work on the project.
To my friend Christopher, thank you so much for your tremendous support in analyzing
the data. I appreciate you most sincerely.

iv
DEDICATION
To the love of my life, my husband and my best friend, Wycliffe Oketch.
To the most beautiful little jewel: my treasured child, Darrel Oketch.
To my dear parents: Joyce and Wilson Agao.

v
TABLE OF CONTENTS
DECLARATION ..................................................................................................................... ii
ACKNOWLEDGEMENTS ................................................................................................... iii
DEDICATION ........................................................................................................................ iv
LIST OF TABLES ................................................................................................................. vii
LIST OF FIGURES .............................................................................................................. viii
ABBREVIATIONS ................................................................................................................. ix
ABSTRACT.............................................................................................................................. x
CHAPTER ONE: INTRODUCTION .................................................................................... 1
1.1 Background of the Study ..................................................................................................... 1
1.1.1 Macroeconomic Variables ........................................................................................ 2
1.1.2 Mortgage Uptake ....................................................................................................... 2
1.1.3 Effect of Macroeconomic Variables on Mortgage Uptake ....................................... 3
1.1.4 The Mortgage Industry in Kenya .............................................................................. 5
1.2 Research Problem ................................................................................................................ 7
1.3 Research Objectives ............................................................................................................. 8
1.4 Value of the Study ............................................................................................................... 9
CHAPTER TWO: LITERATURE REVIEW ..................................................................... 10
2.1 Introduction........................................................................................................................ 10
2.2 Theoretical Review ............................................................................................................ 10
2.2.1 Title Theory and Lien Theory of Mortgages ........................................................... 10
2.2.2 Innovation Theory of Mortgage Financing ............................................................. 11
2.3 Determinants of Mortgage Uptake .................................................................................... 14
2.3.1 Central Bank Rate/ Interest Rates ........................................................................... 15
2.3.2 Inflation Rates ......................................................................................................... 16
2.3.3 Level of Money Supply ........................................................................................... 17
2.3.4 Gross Domestic Product ....................................................................................... 17
2.3.5 Residential House Prices ......................................................................................... 18
2.4 Empirical Review .............................................................................................................. 18
2.5 Summary of Literature Review ......................................................................................... 22
CHAPTER THREE: RESEARCH METHODOLOGY .................................................... 24
3.1 Introduction........................................................................................................................ 24
vi
3.2 Research Design ................................................................................................................ 24
3.3 Population .......................................................................................................................... 24
3.4 Data Collection .................................................................................................................. 25
3.5 Data Analysis ..................................................................................................................... 25
CHAPTER FOUR: DATA ANALYSIS, RESULTS AND DISCUSSION ....................... 27
4.1 Introduction........................................................................................................................ 27
4.2 Descriptive Statistics ......................................................................................................... 28
4.2.1 Mortgage Uptake ..................................................................................................... 28
4.2.2 Residential Real Estate Prices ................................................................................. 29
4.2.3 Interest Rates ........................................................................................................... 30
4.2.4 GDP per Year .......................................................................................................... 31
4.2.5 Level of Money Supply ........................................................................................... 32
4.2.6 Inflation Rates ......................................................................................................... 33
4.3 Correlation analysis ........................................................................................................... 34
4.4 Multiple Regression Analysis ............................................................................................ 36
4.5 Discussion of Research Findings ....................................................................................... 38
CHAPTER FIVE: SUMMARY, CONCLUSION ANDRECOMMENDATIONS .......... 40
5.1 Introduction........................................................................................................................ 40
5.2 Summary of Findings ........................................................................................................ 40
5.3 Conclusions........................................................................................................................ 41
5.4 Recommendations .............................................................................................................. 42
5.5 Limitations of the Study .................................................................................................... 43
5.6 Suggestions for Further Research ...................................................................................... 44
REFERENCES ...................................................................................................................... 45
APPENDICES ........................................................................................................................ 51
Appendix I: Mortgage Firms in Kenya .................................................................................... 51
Appendix II: Data for Residential Real Estate Prices per Quarter .......................................... 53
Appendix III: Quarterly GDP at Market Prices ....................................................................... 54
Appendix IV: Quarterly Inflation Rates .................................................................................. 55
Appendix V: Quarterly Level of Money Supply, M3 .............................................................. 56
Appendix VI: Quarterly CBK Interest Rates ........................................................................... 57
Appendix VII: Mortgage loan Assets (“million”) ................................................................... 58

vii
LIST OF TABLES
Table 1: Mean Mortgage Uptake in Billions by year ........................................................ 28
Table 2: Mean House Prices in Millions by year ............................................................... 29
Table 3: Mean Interest Rates by year ................................................................................ 30
Table 4: Mean GDP in 000's by year ................................................................................. 31
Table 5: Mean LMS in 000's by year ................................................................................. 32
Table 6: Mean Inflation Rates by year ............................................................................... 33
Table 7: Correlations Matrix .............................................................................................. 35
Table 8: Multiple regression analysis on the predictors of mortgage Uptake between ..... 36

viii
LIST OF FIGURES
Figure 1: Mean Mortgage Uptake in Billions by Year ...................................................... 29
Figure 2: Mean House Prices in Millions by Year ............................................................ 30
Figure 3: Mean Interest Rates by year ............................................................................... 31
Figure 4: Mean GDP in 000's by year ................................................................................ 32

ix
ABBREVIATIONS
CBK - Central Bank of Kenya
CIC - Central Intelligence Agency
CRB - Credit Reference Bureaus
GOK - Government of Kenya
IDB - International Development Bank
IFC - International Financial Corporation
IMF - International Monetary Fund
KCB - Kenya Commercial Bank
LTVs - Loan to Value Ratios
NHC - National Housing Corporation
SPSS - Statistics Package for Social Sciences
UK - United Kingdom
USA - United States of America
WHO - World Health Organization
x
ABSTRACT
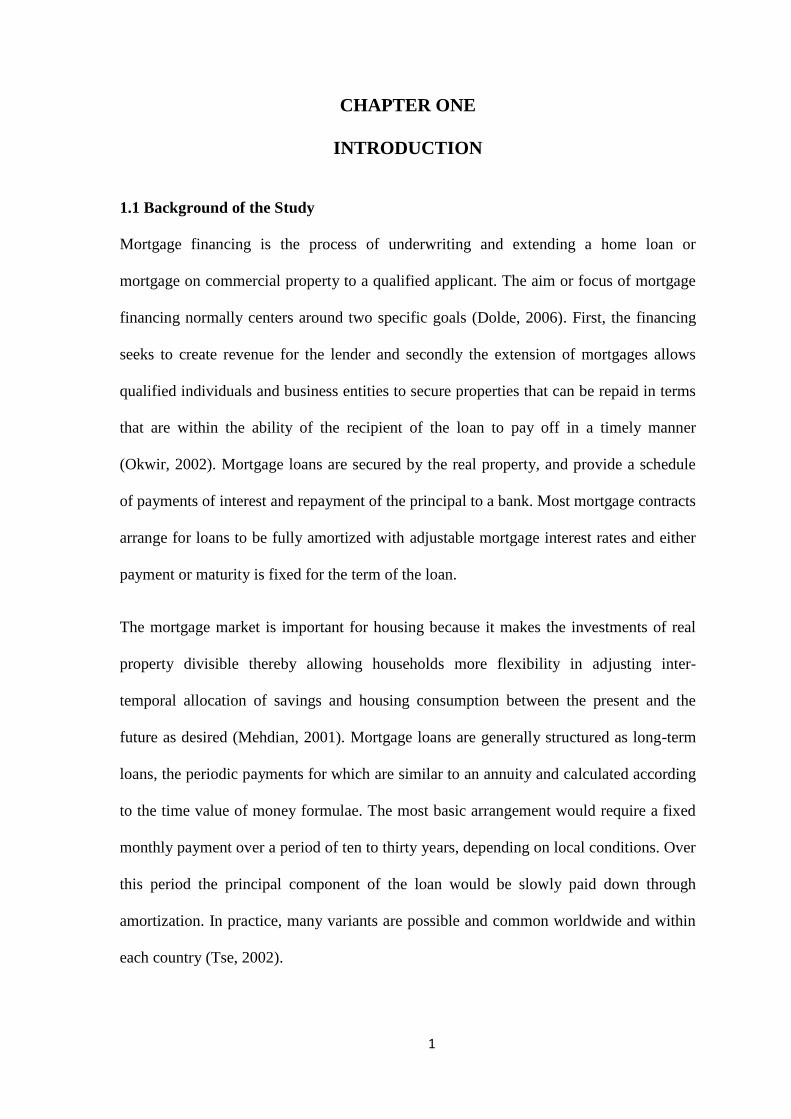
The mortgage market plays a very important role in any economy. It is known to have a
dramatic multiplier effect and is a key economic indicator. The mortgage market has
experienced significant growth in the last decade with many countries experiencing
mortgage boom. The Kenyan mortgage market has been experiencing a boom in the past
ten years and the latest findings have shown that the trend will continue into the
foreseeable future. To ensure the economy is proper positioned a study into forces behind
the boom and hence the market growth is paramount. This study investigated the
determinants of mortgage uptake. Monthly secondary data for a period of ten years
spanning from 2004 to 2013 was collected from publications in government and financial
institutions. Descriptive as well as multiple regressions were run using SPSS version
21.0. A multivariate regression model showing the relationship between mortgage uptake
and various variables was tested. The results show that that there are significant negative
relationship between mortgage uptake and inflation rates, and positive relationships with
interest rate, and level of money supply. Interest rates have the most significant effect on
mortgage uptake followed by GDP and level of money supply. Thus the rise in mortgage
uptake is well explained by macroeconomic variables. Although the study established a
positive relationship between mortgage uptake and interest rates, the relationship was
found to be insignificant. The trend also indicates an overall increase in mortgage uptake
with time hence the mortgage market in Kenya is expected to continue to grow. Even
without significant changes in the variables, the effect of time is that mortgage uptake
increase. This also indicates that the mortgage market is significantly stable.
1
CHAPTER ONE
INTRODUCTION
1.1 Background of the Study
Mortgage financing is the process of underwriting and extending a home loan or
mortgage on commercial property to a qualified applicant. The aim or focus of mortgage
financing normally centers around two specific goals (Dolde, 2006). First, the financing
seeks to create revenue for the lender and secondly the extension of mortgages allows
qualified individuals and business entities to secure properties that can be repaid in terms
that are within the ability of the recipient of the loan to pay off in a timely manner
(Okwir, 2002). Mortgage loans are secured by the real property, and provide a schedule
of payments of interest and repayment of the principal to a bank. Most mortgage contracts
arrange for loans to be fully amortized with adjustable mortgage interest rates and either
payment or maturity is fixed for the term of the loan.
The mortgage market is important for housing because it makes the investments of real
property divisible thereby allowing households more flexibility in adjusting inter-
temporal allocation of savings and housing consumption between the present and the
future as desired (Mehdian, 2001). Mortgage loans are generally structured as long-term
loans, the periodic payments for which are similar to an annuity and calculated according
to the time value of money formulae. The most basic arrangement would require a fixed
monthly payment over a period of ten to thirty years, depending on local conditions. Over
this period the principal component of the loan would be slowly paid down through
amortization. In practice, many variants are possible and common worldwide and within
each country (Tse, 2002).

2
1.1.1 Macroeconomic Variables
Macroeconomic factors are those economic factors that affect the whole economy in
which a commercial bank operates. Major macroeconomic factors include lending interest
rates, central bank rate, money supply, interest rate spread, inflation rate and growth in
gross domestic product etc. Lending interest rates is the cost of capital in an
economy/reward for investments. Interest can be thought of as "rent of money". Interest
rates are fundamental to a „capitalist society‟ and are normally expressed as a percentage
rate over the period of one year. Ngugi (2001) also defines interest rate as a price of
money which reflects market information regarding expected change in the purchasing
power of money or future inflation. It measures the price at which borrowers of funds are
willing to pay to the owners of capital while at the same time measures the price at which
information regarding expected change in the purchasing power of money or future
inflation. It measures the price at which borrowers of funds are willing to pay to the
owners of capital while at the same time measures the price at which lenders are willing
to lend their money to enterprise in exchange for consumption.
Inflation rate is the general increase in prices of commodities. It measures by how much
the value of the currency has been impaired. It is measured using a price index, based on
a representative basket of goods and services. Real Gross domestic product is the measure
of the size of an economy adjusted for price changes and inflation. It measures in constant
prices the output of final goods and services and incomes within an economy.
1.1.2 Mortgage Uptake
A mortgage loan is a loan secured by real property through the use of a mortgage note
which evidences the existence of the loan and the encumbrance of that realty through the
granting of a mortgage which secures the loan. However, the word mortgage alone, in

3
everyday usage, is most often used to mean mortgage loan. A home buyer or builder can
obtain financing (a loan) either to purchase or secure against the property from a financial
institution, such as a bank, either directly or indirectly through intermediaries. Features of
mortgage loans such as the size of the loan, maturity of the loan, interest rate, method of
paying off the loan, and other characteristics can vary considerably (Miller, 2000).
The mortgage market consists of financial institutions such as banks, mortgage companies
and regulatory body. Another player is the investors who take up the loans. The housing
or buildings is another important component. Mortgage uptake in the mortgage market
can increase when the types of mortgage loans increase, when the rates of these
mortgages are affordable, when mortgage financing is the preferred mode for acquiring
housing for companies and individual, when the housing supply meets the demand in the
market, when the competition in this market is strong enough to moderate rates through
several competitive commercial mortgage providers.
Mortgages have a big role to play in filling this gap; mortgages have great potential to
reach levels such as the average mortgage debt to GDP level in European countries is in
the region of 50 percent, whilst in the US it reaches 72 percent. According to World Bank
the potential size of the mortgage market is currently around Ksh 800 billion or $9.9
billion around 13 times the current level (World Bank, 2011).
1.1.3 Effect of Macroeconomic Variables on Mortgage Uptake
The Central Bank rate affects the mortgage uptake since mortgage rates are pegged
towards the Central Bank rate. Increase in the Central Bank rate leads to a consistent
increase in the mortgage rate which tends to slow down mortgage uptake since the
Central bank rate act as a signal for commercial banks to tighten their lending .This
subsequently leads to an increase in the Commercial bank lending rates which is

4
consistent with the mortgage rates (Central Bank Survey report, 2010). A higher
mortgage rate leads to an increased cost of borrowing from both surplus income side of
the demand of housing which further leads to defaults and foreclosures to the extreme
cases. However, higher mortgage rates may also be seen as an opportunity for investment
by mortgage investors and therefore could assess the risk return tradeoff and evaluate
other competing investment in order for them to make a business out of it (William,
2008).
Money Supply is a broad measure of money in an economy. Increase in money supply
gives rise to greater inflation uncertainty and this has an adverse impact on the real estate
market. Excessive growth in money supply may lead to an inflationary environment and
might affect the investments because of higher discount rate and this therefore affects the
mortgage uptake (Liow, Ibrahim and Huang, 2005).
Another key factor that affects the mortgage finance uptake is the overall health of the
economy. This is generally measured by economic indicators such as the GDP,
employment data, manufacturing activity, the prices of goods, etc. The GDP is the market
value of all officially recognized final goods and services produced within a country in a
given period of time. GDP per capita is often considered an indicator of a country‟s
standard of living.
Under economic theory, GDP per capita exactly equals the Gross Domestic Income per
capita. When the GDP is low it means that the people‟s purchasing power is also low
hence the demand for real estate and consequently the mortgage uptake will decrease.
Conversely, when the GDP increases, the purchasing power also increases hence
increasing the demand of Real estate and the mortgage uptake go up. Broadly speaking,
when the economy is sluggish, so is mortgage uptake. However, the cyclicality of the

5
economy can have varying effects on different types of real estate. For example, an
investment in hotels would typically be more affected by an economic downturn than one
in office buildings. Hotels are a form of property that is very sensitive to economic
activity due to the type of lease structure inherent in the business. Renting a hotel room
can be thought of as a form of short-term lease that can be easily avoided by hotel
customers should the economy be doing poorly. On the other hand, office tenants
generally have longer-term leases that can't be changed in the middle of an economic
downturn (Case et al, 2005).
Inflation is often defined as a sustained increase in prices for a broad range of prices
(Gallagher, 2011). Inflation rates affect the purchasing power of money. Inflation is
measured by the changes in the Consumer price index (CPI) which measures the retail
prices of goods and services purchased by households (Liow, Ibrahim and Huang, 2005).
It is theoretically expected that the higher the inflation rate the higher the house price and
therefore the lower the mortgage uptake.
The housing prices and other associated fees may enter mortgage lending both as a
demand and a supply factor. Housing prices, together with income and the mortgage rate,
determine how much credit households wish to take out. At the same time, banks‟
decisions regarding mortgage applications may also be influenced by housing prices,
which form an indicator of the collateral value of a house (Greef et al, 2000).
1.1.4 The Mortgage Industry in Kenya
In Kenya there are two types of lenders which can be authorized by the Central Bank of
Kenya. These are ordinary banks, which have the right to engage in mortgage business
and mortgage companies. The largest lender in Kenya is Kenya Commercial Bank (KCB)
which remains as a mortgage subsidiary of KCB. Overall the two largest lenders control

6
over half the market and only 9 banks (6 large, 2 medium and 1 small bank) have a
mortgage portfolio exceeding Ksh 1 billion (World Bank, 2011). The current cost of
mortgage financing is prohibitive for the percent of the urban population could consider
taking out a mortgage loan which represents just 2 or 3 percent of the national population
therefore mortgages are completely out of reach for the entire rural population (World
Bank, 2011).
Government has estimated a housing need of 190,000 dwellings per year in Kenya‟s
urban areas though it is not clear what assumptions underlie the estimate (Ministry of
Housing, 2011). Government further estimates that formal production by the public and
private sectors is not more than 30,000 units per year and concludes that the annual deficit
of more than 120,000 housing units is met by slum housing. In Nairobi, with a population
of around 3 million people, nearly 60% of households live in slum areas. A recent survey
of these settlements showed that 73% of households live below poverty line (Giddings,
2007).
Moreover, around 90% are tenants, are forced into this type of tenure by poor access to
land and, in some cases, by the deliberate choice to invest in their rural homes. To
complicate the housing matter further, the average mortgage loan is approximately Ksh. 4
million while the median household income of the non-poor in these slums was just over
ksh. 10,000(USD 125) in 2004, an indication that houses are quite expensive for most
Kenyans (Mutero, 2007). According to Center for Affordable Housing in Africa (2011),
in Niger, the smallest mortgage is equivalent to kshs.1.228 million (USD 14,444) while
85.6% of the country population earn below kshs 5,100(USD 60). Therefore, to enable
majority of the Kenyans afford to buy homes, tackling all the critical factors that leads to
low mortgage uptake in Kenya.

7
1.2 Research Problem
As identified earlier the key macro-economic variables affecting mortgage uptake are
interest rates, GDP, income opportunities, central bank rates and inflation rate. The
factors may have a negative or a positive relationship with the mortgage finance uptake.
The factors may also affect the market directly or indirectly. For example interest rates
affect mortgage uptake by lowering the demand for the houses due to high house prices.
Also, the degree to which each factor impacts the mortgage uptake varies. Knowing the
relative relationship is of paramount importance in making investment decisions as well
as policy formulations in a bid to boost the market even further.
Financial sector generally have been recognized in the literature to play important role in
the economic development of an economy. A strong financial sector leads to higher
saving and efficiency and thus to higher economic growth. Although quite a number of
studies have discussed the relationship that subsists between the financial sector, real
sector and economic growth. Mortgage finance at a macro level, generates economic
growth via job creation, economic linkages and it spurs entrepreneurial activities (IFC,
2010). In addition, housing finance plays an important role in shaping a country‟s wider
housing system and services the stability and effectiveness of the financial system and the
overall financial portfolio of the public, providing social stability and promoting
economic development (Akinwunmi et al., 2008).
Several studies have been made on the mortgage market in different geographical context.
Jayantha, (2012), used multivariate analysis in determination of the mortgage rates in
Hong Kong, using the demand side of the market. In a study on housing finance in Sub-
Saharan Africa and focusing on South Africa, Rust,( 2008) found that rising cost of
8
capital have had a dramatic impact on housing affordability and, while property prices
have been rising, have decreased the amount of loan that a household is able to receive.
In the Kenyan setting, studies done on the mortgage lending include, Jumbale (2012)
sought to determine the relationship between house prices and real estate financing in
Kenya. Muli (2011) studied the relationship between property prices and mortgage
lending in Kenya. Leonard and Owiti (2013), when investigating the determinants of
mortgage uptake in Kenya, used the regression analysis on the capital market variables as
his independent variables and they found out that the capital market variables negatively
affected the mortgage uptake.
Though a similar research as this study had been conducted, Leonard and Owiti‟s study
was limited to the capital market indicators and studied the relationship of mortgage
uptake with interest rates, inflation rate and return on savings. Other studies have
concentrated on the relationship between mortgage uptake and one particular variable
without the relative comparison of other factors. This study sought to extend and fill the
research gap by widening the scope to the whole country of Kenya. It also included
economic growth and level of money supply as variables. Therefore this study seeks to
answer the research question and fill the gap in knowledge and empirical study in Kenyan
context, what is the effect of macroeconomic variables on mortgage uptake in Kenya?
1.3 Research Objectives
To determine the effect of macroeconomic variables on the mortgage uptake in the
mortgage industry in Kenya.

9
1.4 Value of the Study
The study will be significant to the financial Institutions, Real estate developers and the
Government who will be able to understand the contribution of mortgage financing, on
real estate development in Kenya and the necessary factors for acquisition of the capital
and the challenges facing financing of mortgages in Kenya so that they can be able to
plan, develop and provide housing to majority of Kenyans. This study will also be of
importance to the government as it will facilitate in identifying the factors facing the
mortgage market in Kenya therefore come up with policies e.g. tax incentives for both the
mortgagees and mortgagor hence regulatory strategies that will improve this market. In
this way, mortgage players will get an opportunity to consult with the finance institutions
thus achieve solutions that are relevant. The study will provide the background
information to research organizations and scholars who will want to carry out further
research in this area. The study will facilitate individual researchers to identify gaps in the
current research and carry out research in those areas.

10
CHAPTER TWO
LITERATURE REVIEW
2.1 Introduction
This chapter reviews the past literature on the study. The theoretical and empirical review
is critically reviewed. The chapter also reviews more studies on mortgage financing in an
economy. Possible macroeconomic variables of mortgage uptake are also presented in
this chapter.
2.2 Theoretical Review
Theories formulated to explain, predict and understand phenomena and, in many cases, to
challenge and extend existing knowledge, within the limits of the critical bounding
assumptions. The theoretical review is the structure that can hold or support a theory of a
research study. The theoretical review introduces and describes the theory which explains
why the research problem under study exists.
2.2.1 Title Theory and Lien Theory of Mortgages
In the title theory, the property-law doctrine states that a mortgage transfers title to a
property to the mortgagee, who holds it until the mortgage has been paid off, at which
time title passes to the mortgagor. Some banks retain and treat the mortgage as a title
theory. Since the mortgage is said to hold a title interest, she has the right to possession
under this theory. Some banks apply a lien theory. This theory only gives the mortgagee a
lien interest in the property. In a title theory bank, the mortgage is treated as having
transferred title to the mortgage, subject to the mortgagee‟s duty to recovery if payment is
made. The title is said to remain in the mortgagee until the mortgage has been satisfied
and foreclosed. Although the mortgagee has the right of possession to the property, there
is generally an express agreement giving the right of possession to the mortgagor. The

11
mortgagee is said to hold the title for security purposes only. The mortgagor is given the
right of possession (Buckley and Kalarickal, 2004).
In a lien theory bank, the mortgagor retains legal and equitable title to the property, but
conveys an interest that the mortgagee can only foreclose upon to satisfy the obligation of
the mortgagor. This is equivalent to a future interest in the property which allows the
mortgagee to use the process of foreclosure. The interest is a security interest or
mortgage, which forms a lien on the property. In this theory the right to possession arises
upon a default. The mortgagor has a right to sue the mortgagee for any interference with
his right of possession (Buckley and Kalarickal, 2004).
For practical applications there is usually very little difference between a lien theory and a
title theory. The principle difference arising in the title theory bank is that the mortgagee
is given the right to possession before the foreclosure is complete. The language of the
mortgage provides for possession rights being in the mortgagor up to the time of the
foreclosure.
2.2.2 Innovation Theory of Mortgage Financing
The theory was developed by Everett Mitchell Rodgers in 1962. Innovations are often
adopted by organizations through two types of innovation decisions: collective innovation
decisions and authority innovation decisions. The collection-innovation decision occurs
when the adoption of an innovation has been made by a consensus among the members of
an organization. The authority-innovation decision occurs when the adoption of an
innovation has been made by very few individuals with high positions of power within an
organization (Rogers, 2005). Unlike the optional innovation decision process, these
innovation-decision processes only occur within an organization or hierarchical group.
Within the innovation decision process in an organization there are certain individuals
12
termed "champions" who stand behind an innovation and break through any opposition
that the innovation may have caused. The champion within the diffusion of innovation
theory plays a very similar role as to the champion used within the efficiency business
model Six Sigma.
The innovation process within an organization contains five stages that are slightly
similar to the innovation decision process that individuals undertake. These stages are:
agenda-setting, matching, redefining/restructuring, clarifying and routinizing. There are
both positive and negative outcomes when an individual or organization chooses to adopt
a particular innovation. Rogers states that this is an area that needs further research
because of the biased positive attitude that is associated with the adoption of a new
innovation (Rogers, 2005). In the Diffusion of Innovation, Rogers lists three categories
for consequences: desirable vs. undesirable, direct vs. indirect, and anticipated vs.
unanticipated.
The innovation adoption curve of Rogers is a model that classifies adopters of
innovations into various categories, based on the idea that certain individuals are
inevitably more open to adaptation than others. The concept of adopter categories is
important because it shows that all innovations go through a natural, predictable, and
sometimes lengthy process before becoming widely adopted within a population (Rogers,
2000). Roger's categories include; innovators (2.5 %), early Adopters (13.5 %), early
Majority (34 %), late Majority (34 %) and laggards (16 %). Rogers‟s adopter‟s
characteristics are important because a person's innovation adoption characteristic affects
the rate of uptake of an innovation over time.

13
Different adopter groups buy into innovation for different reasons and have different
expectations. People who are innovators and early adopters are easier to convince to
innovate. Mainstream adopters (early and late majority) who make up 64 % of any
population and these adopters determine whether an innovative practice is embedded.
Mainstream adopters need different support structure from early adopters in terms of
support, different emphasis on technology and teaching practice. Innovators may require
looser and less tightly controlled conditions, while mainstream adopters may require more
stability and support (Repp, 2004).
Innovators and early adopters make up only a small proportion of any population (2.5%
are innovators and early adopters about 13%) and there are not enough of them to have an
impact on embedding innovation in an organization. The early and late majority (called
the mainstream adopters) makes up 64 % of any population and these are the ones who
can make the difference to whether an innovative practice is embedded in an
organization. The early majorities are more practical: they do think through the pros and
cons of a new idea before they adopt, so they help to make it more tangible and
acceptable. But if the support systems and infrastructure are lacking, they will hold back
on a commitment.
The late majority, on the other hand, are creatures of habit and predictability. They want
to know the rules, they love systems. The beautiful thing about the late majority is that
when they don‟t find rules or systems, they‟ll start figuring them out. Laggards are very
set in their way, and will only adopt innovation when it has become mainstream i.e.
standard practice in an organization (Repp, 2004).

14
Another important concept described by (Rogers, 2005) is the S-shaped adoption curve
i.e. successful innovation goes through a period of slow adoption before experiencing a
sudden period of rapid adoption and then a gradual leveling off (forms an S-shaped
curve).Rapid expansion of most successful innovations will occur when social and
technical factors combine to permit the innovation to experience dramatic growth.
2.3Determinants of Mortgage Uptake
Macroeconomic factors are factors that affect the whole economy in which mortgage
firms operate. The main macroeconomic factors include central bank rates, money supply,
inflation rate, growth in gross domestic product and house prices. It is important to
understand macroeconomic factors in an economy to aid in effective monitoring and
review of uptake of mortgage measured by mortgage advances. The performance of an
economy is evaluated by measuring the magnitude of its growth and the quality of its
growth.
Conceptual framework is a schematic presentation which identifies the variables that
when put together explain the issue of concern. The conceptual framework is therefore
the set of broad ideas used to explain the relationship between the independent variables
(factors) and the dependent variables (outcome). Conceptual framework provides the link
between the research title, the objectives, the study methodology and the literature review
(Coulthard, 2004). This study adopted some concepts generated by mortgage financing
theories and conceptualized them in a framework explaining the relationship between (the
independent variables-factors) such as central bank rates, income opportunities, inflation,
growth domestic product and house prices on mortgage financing and how they relate to
mortgage finance uptake in Kenya.
15
2.3.1 Central Bank Rate/ Interest Rates
Positive Interest rates (lending in excess of inflation rates) are viewed as prerequisite for
successful and sustainable finance (Buckley, 1999). Long term loans, such as mortgage
financing loans have higher interest rates as a result of expectation of, among other
factors higher inflation, (Gitman, 1997). The market rate of interest on mortgage loans is
established by what borrowers are willing to pay for the use of funds over a specified
period of time and what lenders are willing to accept in the way of compensation for the
use of such funds. Real estate tends to be highly levered and thus the rate of return earned
by equity investors tends to be affected by changes in interest rate. Even where the
investor has a fixed rate of mortgage, an increase in interest rate may lower the price a
subsequent buyer is willing to pay. Furthermore the yield rate (required rate of return)
that an investor requires for real estate tends to increase with the overall levels of interest
rates in the economy (Fisher, 1999).
Excessive high interest rates in Kenya Finance sector have strongly discouraged long-
term investment and constrained Kenyan investors‟ ability to take up mortgage finance.
With nominal interest rates ranging from 20-30% the private sector is unable to borrow to
finance long term investments in the mortgage sector. In addition, the 11-18% point
spread between lending and deposit rate is much higher than the 5 point spread common
in other developing countries (Economic Report on Africa, 2002).
Interest rates chargeable on mortgages influence the mortgage quality in that the higher
the interest the more expensive the mortgage product becomes and the low the mortgage
finance uptake. Low interest rates on the other hand encourage mortgage uptake and
prompt repayment thus guaranteeing quality products.

16
2.3.2 Inflation Rates
According to Dobson (2002), inflation is a rise in the general level of prices of goods and
services in an economy over a period of time. When the general price level rises, each
unit of currency buys fewer goods and services. Consequently, inflation reflects a
reduction in the purchasing power per unit of money. A chief measure of price inflation is
the inflation rate, the annualized percentage change in a general price index (normally the
consumer price index) over time. Inflation's effects on an economy are various and can be
simultaneously positive and negative.
Negative effects of inflation include an increase in the opportunity cost of holding
money, uncertainty over future inflation which may discourage investment and savings,
and if inflation is rapid enough, shortages of goods as consumers begin hoarding out of
concern that prices will increase in the future. Positive effects include ensuring that
central banks can adjust real interest rates (to mitigate recessions), and encouraging
investment in non-monetary capital projects. Inflation leads to an economic recession. All
investors when making investment decisions are concerned on how inflation will affect
investment returns, more so mortgage firms who have long term investments.
The rate of inflation is of particular importance to investors and lenders making or
purchasing loans made at fixed rate of interest over long periods of time. Hence when
deciding whether or not to make such commitments, lenders and investors must be
convinced that interest rate commitments are sufficiently high to compensate for any
unexpected loss in purchasing power during the period that the investment or loan is
outstanding; otherwise, an inadequate real return will be earned. Therefore, a consensus
of what lenders and investors expect inflation to be during the time that their loan and
17
investment are outstanding is also incorporated into interest rate at the time investments
and loans are made.
2.3.3 Level of Money Supply
Money Supply is a broad measure of money in an economy. Increase in money supply
gives rise to greater inflation uncertainty and this has an adverse impact on the real estate
market. Excessive growth in money supply may lead to an inflationary environment and
might affect the investments because of higher discount rate and this therefore affects the
mortgage uptake (Liow, Ibrahim and Huang, 2005).
2.3.4 Gross Domestic Product
GDP per capita exactly equals the Gross Domestic Income per capita. When the GDP is
low it means that the people‟s purchasing power is also low hence the demand for real
estate and consequently the mortgage uptake will decrease. Conversely, when the GDP
increases, the purchasing power also increases hence increasing the demand of Real estate
and the mortgage uptake go up. Broadly speaking, when the economy is sluggish, so is
mortgage uptake. However, the cyclicality of the economy can have varying effects on
different types of real estate. For example, an investment in hotels would typically be
more affected by an economic downturn than one in office buildings. Hotels are a form of
property that is very sensitive to economic activity due to the type of lease structure
inherent in the business. Renting a hotel room can be thought of as a form of short-term
lease that can be easily avoided by hotel customers should the economy be doing poorly.
On the other hand, office tenants generally have longer-term leases that can't be changed
in the middle of an economic downturn (Case et al, 2005).

18
2.3.5 Residential House Prices
The housing prices may enter mortgage lending both as a demand and a supply factor.
Housing prices, together with income and the mortgage rate, determine how much credit
households wish to take out. At the same time, banks‟ decisions regarding mortgage
applications may also be influenced by housing prices, which form an indicator of the
collateral value of a house (Greef et al, 2000).
Mortgage contracts attract fees and costs that are levied on the mortgage that increase the
cost of procurement. Such costs include; legal fees. stamp duty, arrangement fees,
valuation fees, mortgage protection policy all of which add to increase the cost of
mortgage and this pushes the costs of mortgages out of reach from most individuals as
one not only has to bear in mind the cost of the property but also consider the additional
costs which on average amount to 10% of the property value. (Central Bank of Kenya -
Mortgage Finance in Kenya –a Baseline survey 2011).
2.4 Empirical Review
Martinez and Maza (2003) did a study on house prices in Spain and they found out that
housing prices and real income were positively related to mortgage credit while interest
rates have a negative impact on the variation in short term credit.
Gerlach and Peng (2005) examined the long and short term relationship between interest
rates and mortgage credit with an application to the Hong Kong housing market and
found out that the increase in interest rates were positively and significantly related to
growth in long term mortgage loans.
Avery, Brevoot and Canner (2006) indicted that low interest rate schemes in commercial
banks make positive impact on the credit growth of mortgage finance loans for loan
takeovers from existing lenders. Over a longer term, growth rates in banks was linked to

19
mortgage firms ability to march services to the need of the customers and generate
adequate risk-adjusted returns, besides being influenced by the overall growth in
mortgage finance market.
Fang (2004), conducted a study on the relationship between home mortgage loan and real
estate market in China and their effect on banks financial performance, the study sought
to analyze the correlation between the development of real-estate market and home
finance and their effect on banks financial performance. The study revealed that although
residents‟ sustainable income, macroeconomic factors are all the reasons for the
development of the China‟s real estate market, but the mortgage cannot be ignored which
is also an important factor for rising home prices, and at different times, different regions
show different characteristics. In the short term, the function of mortgage is more
apparent in promoting house prices. While the real estate market in a region or city
getting gradually mature, the effect of mortgage on the house prices tends to be less
evident, but it remains an important factor that cannot be ignored. The study further
revealed that both real estate financing and mortgage had positive effects on the banks
profitability, (Fang, 2004).
Somoye (2010) investigated at the macroeconomic level, the correlation between
nonperforming loans and a subset of economic variables: per capita gross domestic
product, inflation, interest rates, and changes in the real exchange rate, interest rate spread
and broad money supply (M2). Non-performing Loans were adjusted for specific
provisions (nonperforming loans as a proportion of loans loss provisions) to provide the
basis for cross country comparisons. Most of the variables were found to be positively
correlated with non-performing loans.

20
Ersoy (2009) conducted a study on the impact of the global financial crisis on the
efficiency of foreign banks in Turkey. The study empirically searched for the impact of
the global financial crisis on the technical efficiency of foreign banks in Turkey. To
estimate stochastic frontiers and to predict bank-level technical efficiencies relative to the
estimated frontier, a Cobb-Douglas Stochastic Frontier Production Function is used for
the period of 2002-2008.
The study also estimates the bank specific determinants of technical inefficiencies of
commercial banks in Turkey using a single equation of the Frontier model proposed by
Bacchetta and Wincoop, (2009). The results of the empirical research suggest that the
ranking of commercial banks in terms of technical efficiency as state-owned, private
domestic and foreign did not change during the crisis. The technical efficiencies of
foreign bank subsidiaries, despite a decrease in 2007, are even closing the gap with
private domestic commercial banks. The technical efficiency of state-owned banks, in
contrast to both domestic and foreign private banks, continued to increase during both
2007 and 2008. The foreign bank subsidiaries have much higher technical efficiency
scores compared to foreign bank branches, which have the most volatile efficiency scores.
The technical efficiencies of commercial banks have a high, positive and statistically
significant relation with the asset size.
Empirical studies done locally include; Muli (2011) studied the relationship between
property prices and mortgage lending in Kenya. The research was inspired by the fact that
swings in the property prices have been extremely large in the recent years. This research
employed a quarterly database from 2006 to 2010. A dynamic economic model was
employed to assess the relationship between housing prices and credit using multiple
regressions. The study concluded that changes in housing prices are positively and

21
significantly related to the long term evolution of mortgage credit. This result suggests
that the evolution of housing prices is not triggered by bank real estate lending and that
banks just accommodate real estate financing to the evolution of house prices. Though the
study shows a bi-directional causality it concludes that the real estate market does not
really affect housing price changes rather changes in housing prices do affect the amount
of real estate financing.
In a study to investigate the factors inf1uencing mortgage uptake in Kenya, the study was
guided by several specific objectives. A descriptive survey was employed in this study.
This study targeted 238 staffs in selected department in Housing finance Corporation,
Kenya. Stratified random sampling method was conducted to capture the various levels of
staffs and management. The study concluded that interest rate setting on mortgage debt;
government instruments and fiscal measures are the major policies that govern mortgage
financing (Aguko, 2012).
Muguchia (2012) studies the effect of flexible interest rates and the results show a
negative relationship between flexible interest rates and mortgage financing. The
document argues that if banks charge a fixed rate of interest, it would be possible for
investors to plan for a predictable amount of money to be repaid hence stability and
increased level of borrowing. Other independent variables in the study include; inflation,
non-performing loans, liquidity ratio and negative effects on mortgage financing, while
money supply, GDP, customer deposits, bank capitalization and bank size had positive
effect on mortgage financing. The study relied on secondary data from annual reports of
the banks and regression analysis was mainly used to analyze the data.

22
Jumbale (2012) studied the relationship between house prices and real estate financing in
Kenya. The objective of the study was to determine the relationship between house prices
and real estate financing in Kenya. Causal study design was employed in this research.
Purposive sampling technique was used to select the sample. The study purposively
selected a total of 20 respondents who formed the sample size of this study. The
researcher administered a survey questionnaire to each member of the target population.
Secondary data was collected for this study. Quantitative data collected was analyzed by
the use of descriptive statistics using SPSS latest version (20.0).Regression analysis was
done to establish the relationship between growth in Real Estate financing and house
prices. The study found that the changes in housing prices are positively and significantly
related to the long-term evolution of real estate financing. This result suggests that the
evolution of housing prices is not triggered by bank real estate lending and that banks just
accommodate real estate financing to the evolution of house prices. Though the study
shows a bidirectional causality it concludes that the real estate market does not really
affect housing price changes rather changes in housing prices do affect the amount of real
estate financing.
2.5 Summary of Literature Review
In conclusion, there is wide literature to support mortgage finance lending. The title and
lien and the innovations theories each try to explain mortgage lending from different
aspects and provide a good basis for empirical study. Empirical studies have also been
undertaken on the macroeconomic variables of mortgage uptake globally. Locally no
comprehensive research has been done to cover the whole nation. There is evidence that
the mortgage finance market is enlarging not only in Nairobi but also in other parts of the
country. Hence there is need to extend the research.

23
Scholars have not carried out any research on the relationship between macroeconomic
variables and mortgage financing uptake and as such this study seeks to address this
existing knowledge gap. The objective of the paper therefore will be to determine the
effect of macroeconomic variables on mortgage financing uptake by the Kenyans
population.
24
CHAPTER THREE
RESEARCH METHODOLOGY
3.1 Introduction
This chapter describes the methodology used to conduct the research and analyze the data
collected. We shall review the Research design, Population, Data Collection and Data
Analysis.
3.2 Research Design
Research design is the basic plan that indicates an overview of the activities that are
necessary to execute the research project. This research problem was studied through the
use of a descriptive research design. According to Cooper and Schindler (2003), a
descriptive study is concerned with finding out the what, where and how of a
phenomenon. The nature of this study was such that the findings were generalized to all
the commercial banks. This method is concerned with the intense investigation of
problem solving situations in which problems are relevant to the research problem.
The research project focuses on the relationship between macro-economic variables and
mortgage uptake of mortgage firms in Kenya. The underlining concept is to select several
targeted cases where an intensive analysis identifies the possible alternatives for solving
the research questions on the basis of the existing solution applied in the selected case
study. The study attempts to describe and define a subject, often by creating a profile of
group of problems (Cooper and Schindler, 2006).
3.3 Population
Target population is the entire set of units for which survey data is to be used to make
inferences. It is a well-defined or set of people, services, elements, events, group of things
or households that are being investigated (Ngechu, 2004). In this study the population
25
was therefore the 44 mortgage firms that offer mortgage financing in Kenya (Appendix
1). Since the study was about the whole industry the researcher carried out a census study
consisting of all the mortgage firms offering mortgage finance hence no need for
sampling.
3.4 Data Collection
Data can be either primary or secondary. Primary data is gathered directly from the
respondents. It can either be quantitative or qualitative where open ended questions are
asked. Secondary data is acquired from published materials. Secondary data is mostly
collected where a researcher is seeking to establish relationships between variables. In
this study, quarterly secondary data for a period of 10 years was collected from; Central
Bank of Kenya regarding interest rates, level of money supply and mortgage uptake
figures; Kenya National Bureau of Statistics regarding GDP and inflation rate, Hass
Consulting Ltd regarding Residential Real Estate Prices.
3.5 Data Analysis
Data analysis was carried out by use of Simple Mean, Standard Deviation, Regression
and Correlation Analysis by use of SPSS.A multivariate regression analysis was used to
come up with the model expressing the relationship between the dependent variable
(Mortgage Finance Uptake) and the macroeconomic variables namely interest rates, GDP,
House prices, Level of money supply and Inflation rate. A multivariate regression
analysis will be used where a particular internal attribute measure may have a significant
impact in a multivariate context. The model was proposed by Green (1997). The form is:
y= a + b1x1 +b2X2 + e

26
Translating the variables to our study the formula will be applied as follows:
Y = β0 + β1X1 + β2X2 + β3X3 + β4X4 + β5X5+ε
Where;
Y is uptake of Mortgage loans of Mortgage industry as shown by the amount of advanced
mortgage loans.
β0= the value of Y when all Xs are zero
β1, β2, β3, β4 and β5 =are the coefficients of independent variables
X1= Central Bank Rate
X2= Inflation Rate (annual change in the Consumer Price Index)
X3= Level of Money Supply (aggregate amount of monetary assets, M3)
X4= Gross Domestic Product at Market Prices as provided by the Kenya National Bureau
of Statistics
X5=Residential Real House Prices (Composite Property Index – Average offer price of all
properties listed in the Hass Consult in the three months prior to the relevant quarter).
ε = the random error term accounting for all other variables that affect mortgage loans
uptake but not captured in the model. The significance of the regression model was
determined at 95% confidence interval and 5% level of significance.
The multiple regression function expresses the effect of each of the independent variables
on the dependent variable. The value of β will be the degree of the effect on Y. A positive
or negative sign will show the direction of the relationship. The higher the value of β, the
higher the effect of that particular variable on Y (Julius, 2012).
27
CHAPTER FOUR
DATA ANALYSIS, RESULTS AND DISCUSSION
4.1 Introduction
This chapter presents the analysis and interpretation of the data collected. The data was
obtained from published reports from Kenya National Bureau of Statistics, Central Bank
of Kenya, Hass Consult Ltd and the World Bank. Its accuracy, validity and reliability are
assumed on the authority of the publishers‟ credibility as trusted market information
sources. The data was then fed into SPSS version 21.0 and used to detect how interest
rates, GDP, level of money supply, house prices and inflation affect mortgage uptake,
using descriptive and multivariate regression models.
The results are presented in two parts: first using descriptive statistics to enable the
researcher establish statistical conclusions about the behavior of the data and then
inferential statistics to establish the relationship between the dependent and independent
variables.
28
4.2 Descriptive Statistics
Minimum Maximum Mean
Std.
Deviation Median
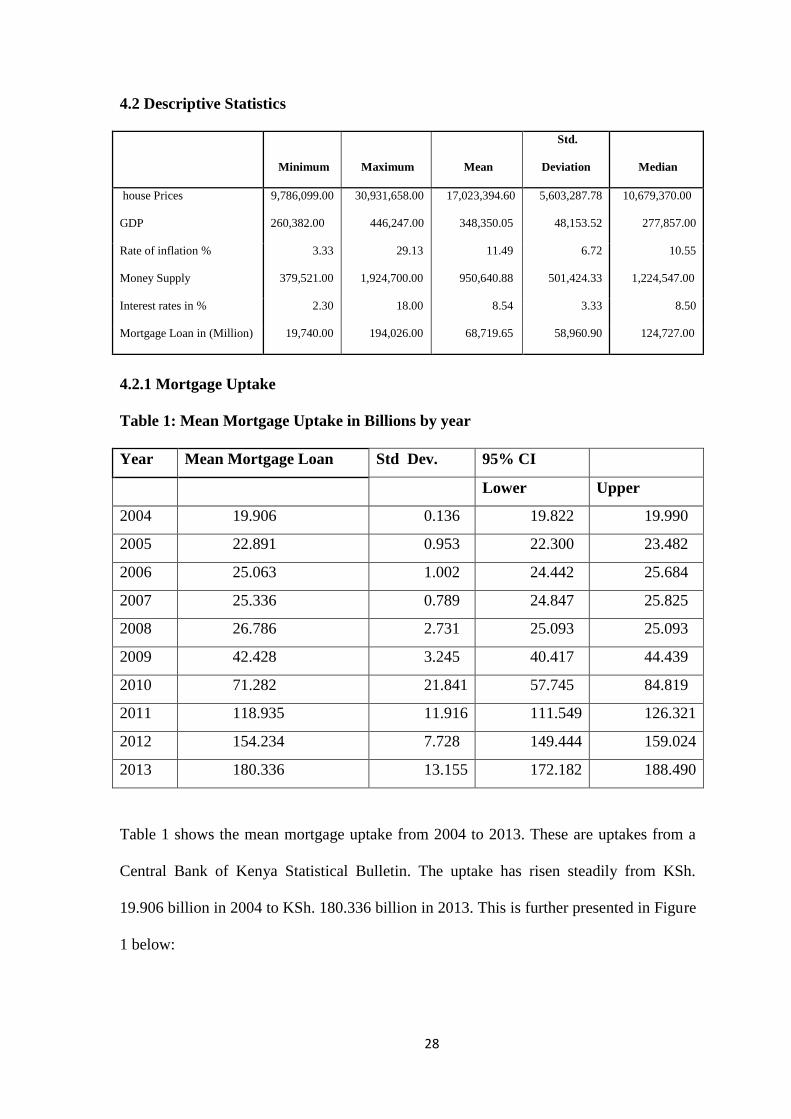
house Prices 9,786,099.00 30,931,658.00 17,023,394.60 5,603,287.78 10,679,370.00
GDP 260,382.00 446,247.00 348,350.05 48,153.52 277,857.00
Rate of inflation % 3.33 29.13 11.49 6.72 10.55
Money Supply 379,521.00 1,924,700.00 950,640.88 501,424.33 1,224,547.00
Interest rates in % 2.30 18.00 8.54 3.33 8.50
Mortgage Loan in (Million) 19,740.00 194,026.00 68,719.65 58,960.90 124,727.00
4.2.1 Mortgage Uptake
Table 1: Mean Mortgage Uptake in Billions by year
Year Mean Mortgage Loan Std Dev. 95% CI
Lower Upper
2004 19.906 0.136 19.822 19.990
2005 22.891 0.953 22.300 23.482
2006 25.063 1.002 24.442 25.684
2007 25.336 0.789 24.847 25.825
2008 26.786 2.731 25.093 25.093
2009 42.428 3.245 40.417 44.439
2010 71.282 21.841 57.745 84.819
2011 118.935 11.916 111.549 126.321
2012 154.234 7.728 149.444 159.024
2013 180.336 13.155 172.182 188.490
Table 1 shows the mean mortgage uptake from 2004 to 2013. These are uptakes from a
Central Bank of Kenya Statistical Bulletin. The uptake has risen steadily from KSh.
19.906 billion in 2004 to KSh. 180.336 billion in 2013. This is further presented in Figure
1 below:

29
Figure 1: Mean Mortgage Uptake in Billions by Year
4.2.2 Residential Real Estate Prices
Table 2: Mean House Prices in Millions by year
Year Mean House Prices Std. Dev 95% CI
Lower Upper
2004 9.927 0.153 9.832 10.022
2005 11.362 0.238 10.528 10.801
2006 11.569 0.556 11.250 11.888
2007 12.875 0.270 12.721 13.030
2008 14.892 1.200 14.204 15.580
2009 18.004 0.835 17.525 18.482
2010 19.673 0.631 19.311 20.034
2011 22.015 0.293 21.847 22.183
2012 22.504 0.848 22.536 23.509
2013 24.317 0.240 24.168 24.466
Table 2 shows the mean residential real estate prices from 2004 to 2013. These are prices
from a composite index comprising of apartments, townhouses, villas, bungalows,
0.000
20.000
40.000
60.000
80.000
100.000
120.000
140.000
160.000
180.000
200.000
Mean Mortgage Loan
Lower:95% CI
Upper:95% CI
30
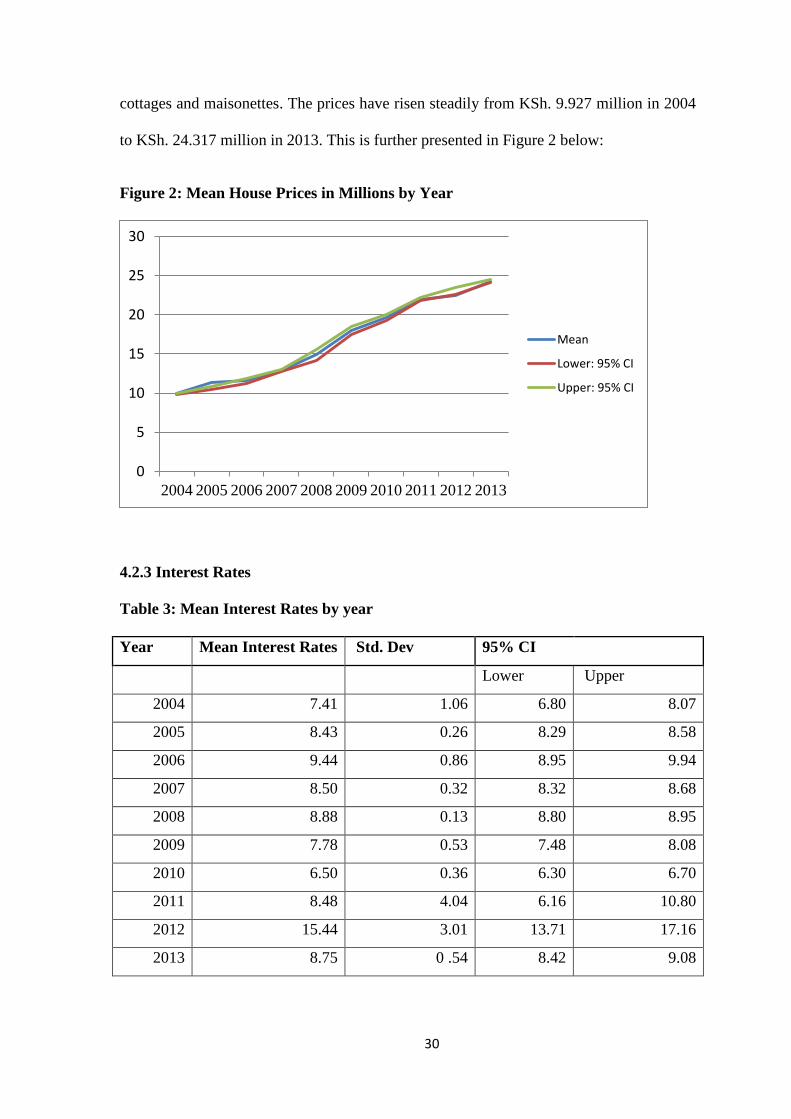
cottages and maisonettes. The prices have risen steadily from KSh. 9.927 million in 2004
to KSh. 24.317 million in 2013. This is further presented in Figure 2 below:
Figure 2: Mean House Prices in Millions by Year
4.2.3 Interest Rates
Table 3: Mean Interest Rates by year
Year Mean Interest Rates Std. Dev 95% CI
Lower Upper
2004 7.41 1.06 6.80 8.07
2005 8.43 0.26 8.29 8.58
2006 9.44 0.86 8.95 9.94
2007 8.50 0.32 8.32 8.68
2008 8.88 0.13 8.80 8.95
2009 7.78 0.53 7.48 8.08
2010 6.50 0.36 6.30 6.70
2011 8.48 4.04 6.16 10.80
2012 15.44 3.01 13.71 17.16
2013 8.75 0 .54 8.42 9.08
0
5
10
15
20
25
30
2004 2005 2006 2007 2008 2009 2010 2011 2012 2013
Mean
Lower: 95% CI
Upper: 95% CI

31
Table 2 shows the mean interest rates from 2004 to 2013. Interest rates were 7.41in 2004
and varied over time with the lowest being in 2010 at 6.50 and the highest being in 2012
at 15.44. This is further presented in figure 3 below:
Figure 3: Mean Interest Rates by year
4.2.4 GDP per Year
Table 4: Mean GDP in 000's by year
Year Mean GDP Std. Dev 95% CI
Lower Upper
2004 277.33 12.51 269.58 285.08
2005 293.81 15.35 285.02 302.61
2006 312.37 16.47 302.93 321.81
2007 334.21 15.38 325.40 343.02
2008 339.32 15.60 330.38 348.25
2009 348.60 12.43 341.47 355.72
2010 368.83 19.56 357.62 380.03
2011 384.98 20.89 373.01 396.95
2012 402.52 23.16 389.25 415.79
2013 421.54 22.75 407.44 435.64
0.00
2.00
4.00
6.00
8.00
10.00
12.00
14.00
16.00
18.00
20.00
2004 2005 2006 2007 2008 2009 2010 2011 2012 2013
Mean Interest Rates
Lower:95 % CI
Upper:95 % CI

32
Table 4 shows the mean GDP per year from 2004 to 2013 with the lower and upper
limits. GDP has risen steadily from 277,330 in 2004 to 421,540 in 2013. Figure 4 below
gives a clearer picture of the trend:
Figure 4: Mean GDP in 000's by year
4.2.5 Level of Money Supply
Table 5: Mean LMS in 000's by year
Year Mean LMS Std. Dev 95% CI
Lower Upper
2004 396.584 13.357 388.305 404.863
2005 443.405 16.707 433.830 452.980
2006 514.378 27.150 498.818 529.937
2007 598.281 33.063 579.333 617.229
2008 714.320 31.418 696.315 732.325
2009 810.541 42.387 786.249 834.833
2010 1183.284 72.386 1141.800 1,224.768
2011 1402.907 83.689 1354.945 1,450.868
2012 1609.326 86.526 1559.739 1,658.914
2013 1833.383 64.919 1793.146 1873.620
0.00
50.00
100.00
150.00
200.00
250.00
300.00
350.00
400.00
450.00
500.00
2004 2005 2006 2007 2008 2009 2010 2011 2012 2013
Mean GDP
Lower:95% CI
Upper:95% CI
33
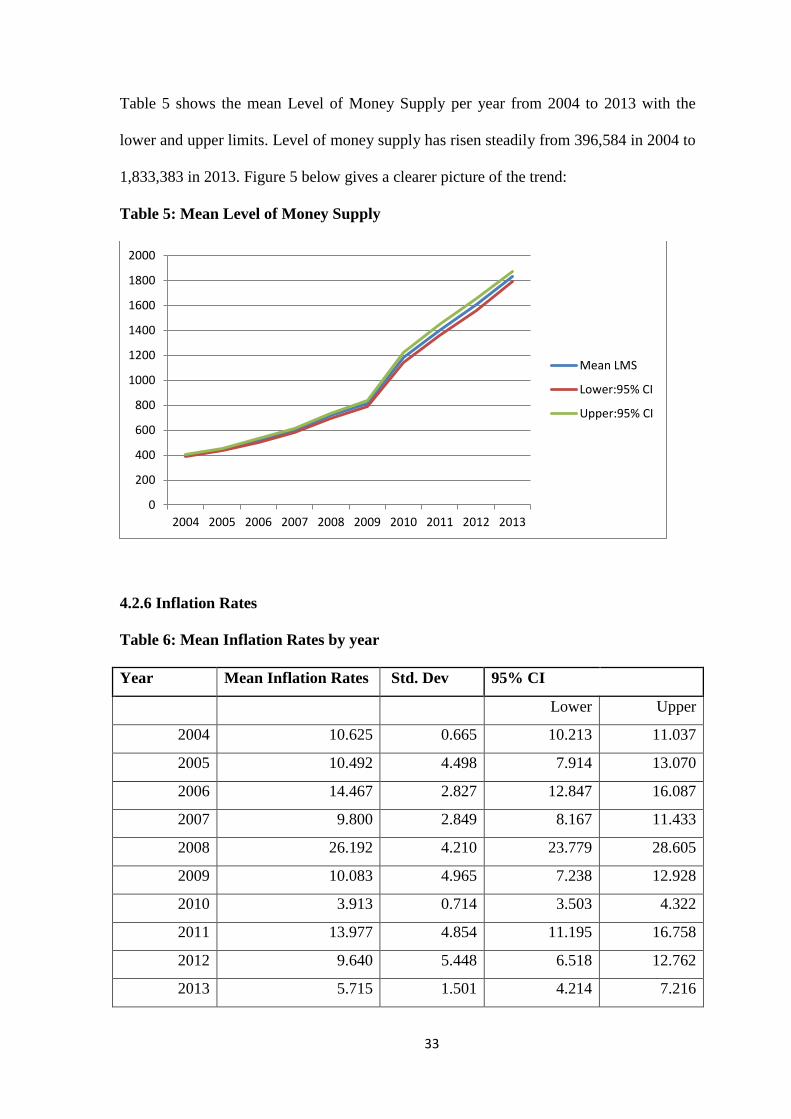
Table 5 shows the mean Level of Money Supply per year from 2004 to 2013 with the
lower and upper limits. Level of money supply has risen steadily from 396,584 in 2004 to
1,833,383 in 2013. Figure 5 below gives a clearer picture of the trend:
Table 5: Mean Level of Money Supply
4.2.6 Inflation Rates
Table 6: Mean Inflation Rates by year
Year Mean Inflation Rates Std. Dev 95% CI
Lower Upper
2004 10.625 0.665 10.213 11.037
2005 10.492 4.498 7.914 13.070
2006 14.467 2.827 12.847 16.087
2007 9.800 2.849 8.167 11.433
2008 26.192 4.210 23.779 28.605
2009 10.083 4.965 7.238 12.928
2010 3.913 0.714 3.503 4.322
2011 13.977 4.854 11.195 16.758
2012 9.640 5.448 6.518 12.762
2013 5.715 1.501 4.214 7.216
0
200
400
600
800
1000
1200
1400
1600
1800
2000
2004 2005 2006 2007 2008 2009 2010 2011 2012 2013
Mean LMS
Lower:95% CI
Upper:95% CI

34
Table 6 shows the mean Inflation rates per year from 2004 to 2013 with the lower and
upper limits. Interest rates varied significantly over the years going as high as 26.19% in
2008 and as low as 3.9% in 2010. Figure 6 below gives a clearer picture of the trend:
Figure 6: Mean Inflation Rates by year
Inferential analysis in this study is used to determine whether there is a relationship
between the dependent variable and the independent variables as well as the strength of
that relationship. This study uses correlation as well as a multiple regression analysis to
determine the strength of the relationship between the dependent and the independent
variables.
4.3 Correlation analysis
Analysis on the association between mortgage uptake and other variables. The study
sought to establish the association between individual independent variables (interest rate
charged, GDP, levels of money supply, inflation rates, house prices and the amount of
mortgage loan uptakes in the industry for the ten year period (2004 – 2013).
0.000
5.000
10.000
15.000
20.000
25.000
30.000
35.000
2004 2005 2006 2007 2008 2009 2010 2011 2012 2013
Mean Inflation Rates
Lower:95% CI
Upper:95% CI
35
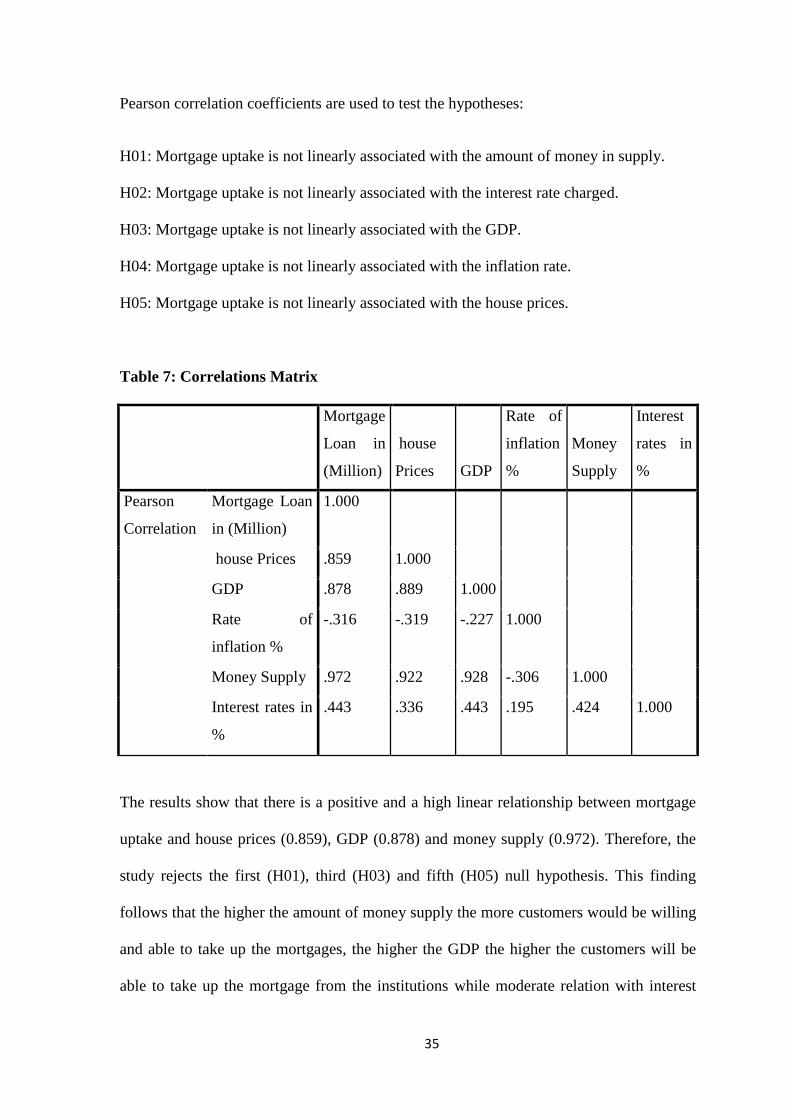
Pearson correlation coefficients are used to test the hypotheses:
H01: Mortgage uptake is not linearly associated with the amount of money in supply.
H02: Mortgage uptake is not linearly associated with the interest rate charged.
H03: Mortgage uptake is not linearly associated with the GDP.
H04: Mortgage uptake is not linearly associated with the inflation rate.
H05: Mortgage uptake is not linearly associated with the house prices.
Table 7: Correlations Matrix
Mortgage
Loan in
(Million)
house
Prices GDP
Rate of
inflation
%
Money
Supply
Interest
rates in
%
Pearson
Correlation
Mortgage Loan
in (Million)
1.000
house Prices .859 1.000
GDP .878 .889 1.000
Rate of
inflation %
-.316 -.319 -.227 1.000
Money Supply .972 .922 .928 -.306 1.000
Interest rates in
%
.443 .336 .443 .195 .424 1.000
The results show that there is a positive and a high linear relationship between mortgage
uptake and house prices (0.859), GDP (0.878) and money supply (0.972). Therefore, the
study rejects the first (H01), third (H03) and fifth (H05) null hypothesis. This finding
follows that the higher the amount of money supply the more customers would be willing
and able to take up the mortgages, the higher the GDP the higher the customers will be
able to take up the mortgage from the institutions while moderate relation with interest

36
rates (0.443) means that the interest rates affects the mortgage uptake is the costs of the
mortgage goes up therefore (H02) is rejected.
On the other hand there is a negative and a low relationship between mortgage uptake and
the inflation rate (-0.316). The study, thus, rejects the fourth null hypothesis (H04) as it
follows that inflation has an effect on the interest rate and therefore has an effect on the
mortgage uptake as purchasing power goes low.
4.4 Multiple Regression Analysis
Table 8: Multiple regression analysis on the predictors of mortgage Uptake
between2004 and 2013
Model Summary
Model
R R Square
Adjusted R
Square
Std. Error of the
Estimate
dimension0
1 .978a .957 .951 13067.43299
a. Predictors: (Constant), Interest rates in %, Rate of inflation %, house Prices, GDP,
Money Supply
ANOVAb
Model Sum of
Squares Df Mean Square F Sig.
1 Regression 1.298E11 5 2.595E10 151.997 .000a
Residual 5.806E9 34 1.708E8
Total 1.356E11 39
a. Predictors: (Constant), Interest rates in %, Rate of inflation %, house Prices,
GDP, Money Supply
b. Dependent Variable: Mortgage Loan in (Million)
37
Coefficientsa
Model
Unstandardized Coefficients
Standardized
Coefficients
t Sig. B Std. Error Beta
(Constant) 16279.514 31047.641 .524 .603
house Prices -.002 .001 -.209 -2.167 .037
GDP -.151 .123 -.124 -1.230 .227
Rate of
inflation %
-332.790 356.348 -.038 -.934 .357
Money Supply .147 .014 1.248 10.454 .000
Interest rates
in %
811.835 762.917 .046 1.064 .295
a. Dependent Variable: Mortgage Loan in (Million)
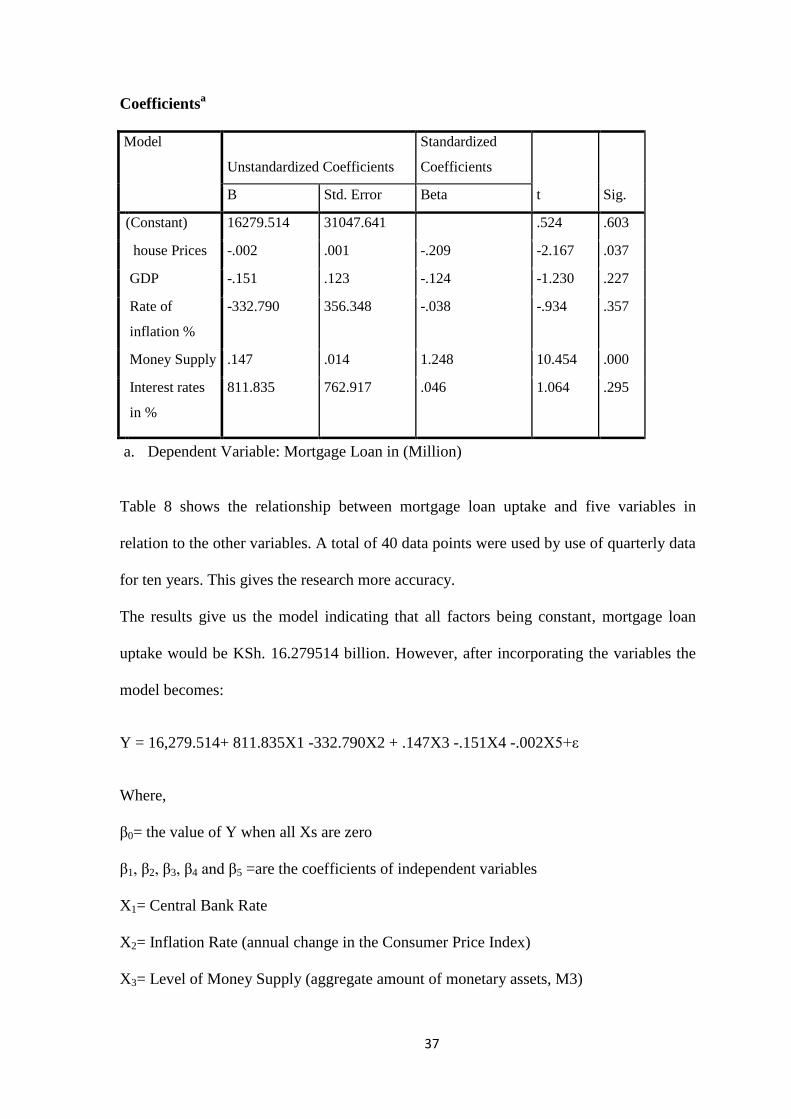
Table 8 shows the relationship between mortgage loan uptake and five variables in
relation to the other variables. A total of 40 data points were used by use of quarterly data
for ten years. This gives the research more accuracy.
The results give us the model indicating that all factors being constant, mortgage loan
uptake would be KSh. 16.279514 billion. However, after incorporating the variables the
model becomes:
Y = 16,279.514+ 811.835X1 -332.790X2 + .147X3 -.151X4 -.002X5+ε
Where,
β0= the value of Y when all Xs are zero
β1, β2, β3, β4 and β5 =are the coefficients of independent variables
X1= Central Bank Rate
X2= Inflation Rate (annual change in the Consumer Price Index)
X3= Level of Money Supply (aggregate amount of monetary assets, M3)

38
X4= Gross Domestic Product at Market Prices as provided by the Kenya National Bureau
of Statistics
X5=Residential Real House Prices (Composite Property Index – Average offer price of all
properties listed in the Hass Consult in the three months prior to the relevant quarter).
4.5 Discussion of Research Findings
The results indicate that the Y- intercept is 16,279.514. Holding all other factors constant,
mortgage uptake would be KSh 16.279514 billion. The coefficients of correlation indicate
the way each of the variables “go together” with mortgage uptake figures.
When taken in consideration with other variables, which is not the ideal situation, interest
rates have a positive correlation with the mortgage uptake. A unit increase in interest rates
would lead to 811.835 increases in mortgage uptake. Unit increases in GDP leads to
0.151 decreases in mortgage uptake. A unit increase in inflation rates would lead to
332.790 decreases in mortgage uptake. A unit increase in the level of money supply
would on the other hand lead to 0.147 increases in mortgage uptake. A unit increase in
real residential house prices would lead to 0.002 decreases in mortgage uptake.
These coefficients indicate the extent to which each of the variables affects the mortgage
uptake. From the results a change in interest rates would have the highest effect on the
mortgage uptake. The lower and upper limits indicate the short term effects of the
variables on mortgage uptake. In the short term inflation could also have a negative
relation. This is likely to be the case because inflation rates also affect interest rates.
The sig values indicate the level of significance of each of the variables to mortgage
uptake. A value of less than 5% shows that the variable is significant. This shows that
money supply is the most significant determinant of mortgage uptake followed by
Residential house prices. On other hand, although the co-efficient for central bank rate
39
shows a positive correlation, the sig value of 29.5% indicates that it is insignificant. This
is apparent in that despite high variations in central bank rates, the mortgage uptake
continued to rise over time hence other factors were more significant. The R- square of
0.957 gives the coefficient of determination. This indicates that 95.7% of changes in the
mortgage uptake figures can be explained by the determinants studied. Due to the
reliability of the data having come from published government and financial institutions
the model is likely to be accurate as indicated by the prob>F of 0.000.
40
CHAPTER FIVE
SUMMARY, CONCLUSION ANDRECOMMENDATIONS
5.1 Introduction
This chapter provides a summary of the study, discussions and conclusions. The
researcher then presents the major limitations of the study and the recommendations for
both the research and for the policy and practice.
5.2 Summary of Findings
The purpose of the study was to investigate the effect of macroeconomic factors on
mortgage uptake for the mortgage industry in Kenya. The researcher sought to confirm
theoretical relationships between mortgage uptake and interest rates, inflation rate, house
prices, GDP, and level of money supply. Descriptive as well as inferential statistics were
obtained. The study found out that mortgage uptake has increased over time from KSh.
19.906 Billion in 2004 to KSh. 180.336 Billion in 2013. The Residential real estate price
has risen steadily from 9.927 million in 2004 to 22.015 million in 2013. Interest rates
have varied from period to period with the lowest mean interest rates being in 2010 at
6.50 and the highest being in 2012 at 15.44.GDP has risen steadily from 277,330 in 2004
to 421,540 in 2013. The mean levels of money supply have risen steadily from 396,584 in
2004 to 1,833,383 in 2013. Inflation rates varied significantly over the years going as
high as 26.19% in 2008 and as low as 3.9% in2010.
The regression analysis indicates that holding all factors constant, the value of mortgage
uptake would be KSh. 16.279514 billion. A relationship was established between all the
variables and mortgage uptakes. The positive relationship between interest rates and
mortgage uptake when all other factors are held constant is reversed by the introduction
of the other variables in the multiple regression. A unit increase in interest rates would
41
lead to an811.835 increase in mortgage uptake. A unit increase in GDP would lead to a
0.151decrease in mortgage uptake. A unit increase in the level of money supply would
lead to 0.147 increases in mortgage uptake. A unit increase in inflation rates would lead
to 332.790decreases in mortgage uptake. A unit increase in house prices would lead to
.002 decreases in mortgage uptake.
5.3 Conclusions
From the study findings, it would be safe to conclude that macroeconomic variables have
an effect on mortgage uptake in Kenya. The conclusion is supported by the study findings
which showed that there was a strong positive relationship (R= 0.978) between the
variables. The study also revealed that 95.7% of mortgage finance uptake in mortgage
firms in Kenya could be explained by macroeconomic variables. From this study it is
evident that at 95% confidence level, the variables produce statistically significant values
and can be relied on to explain mortgage finance uptake in Kenya. This study concludes
that there are significant relationships between mortgage uptake and interest rates,
inflation rates, house prices, GDP, and level of money supply. Interest rates have the most
significant effect on house prices followed by GDP and level of money supply. Thus the
rise in mortgage uptake is well explained by macroeconomic variables. Although the
study established a positive relationship between mortgage uptake and interest rates, the
relationship was found to be insignificant. The trend also indicates an overall increase in
mortgage uptake with time hence the mortgage industry in Kenya is expected to continue
to grow. Even without significant changes in the variables, the effect of time is that
mortgage uptake increase. This also indicates that the mortgage industry is significantly
stable.

42
5.4 Recommendations
From the findings and conclusions, the sustained increase in mortgage uptake is explained
by macroeconomic fundamentals. Financial analysts should realize the need to sensitize
their clients on monitoring these factors so as to be able to make informed predictions of
mortgage costs and therefore uptake. Investors would also be encouraged to invest in the
mortgage industry which is relatively stable. Government should also closely monitor
interest rates and maintain it at reasonable levels. This is because of the significant effect
they have on the mortgage uptake and they determine lending rates and hence drive the
demand through increased or reduced access to financing. The study also recommends
that government takes a proactive role in collecting and analyzing data on mortgage
industry. The data available was very scanty and very important in making policy
decisions.
With due regard to the ever increasing desire to have better mortgage finance uptake for
mortgage firms in Kenya, there is need to invest in proper mortgage financing strategies
so as to meet these expectations. This should be done in a manner in which all the
stakeholders are happy. This therefore calls for embracing proper financing practices
which are acceptable, accessible, ethically sound, have a positive perceived impact,
relevant, appropriate, innovative, efficient, sustainable and replicable.
The management of commercial banks should ensure that interests charged on mortgage
facilities are competitive in the market so as to attract consumers of this product. The
government should enact legislation which regulates the inflation and interest rates in the
mortgage industry so as to protect the interests of both consumers and lenders in the
market.
43
This legislation should ensure that banks issue reasonable charge affordable interest rates
to their customers. The government should also enforce monetary and fiscal policies
through the Central Bank of Kenya (CBK) so as to regulate money supply in the market.
5.5 Limitations of the Study
Since the research was to rely mostly on secondary data, obtained online, from published
end of year accounts of financial statements, the researchers encountered many challenges
particularly during the process of data collection. Most of the financial statements were
obtained online from the various reliable search engines such as Google and Yahoo. The
search for the information was a bit time consuming due to slow network on the search
sites such as google.co.ke.
The study also encountered some other various limitations which hindered access to
information. The first limitation was limited information regarding house prices. The
researcher had to rely on information from one real estate company regarding residential
real estate prices. No information was accessible from other institutions including
government institutions responsible for housing. However, the researcher did establish
that the real estate company collects data from 20 other institutions and compiles a
composite index. Hence the data is believed to be reliable. The study further sought to
increase the reliability and accuracy by stretching the period of study to 10 years and
using quarterly data hence establishing 40 data points.
The study also experienced a limitation in collecting data on other variables such as
number of houses on offer. The study could have covered more variables but with time
constraints, information regarding number of houses constructed per month or number of
houses on offer for sale could not be obtained. This information would have assisted the
study to incorporate supply as a variable.
44
5.6 Suggestions for Further Research
The findings of this study set a ground for further research in the number of areas. First,
the results indicated that inflation rate is insignificant in determining mortgage uptake.
Further studies could be done to confirm these findings and get explanations. Secondly,
the findings indicated most changes in mortgage uptake could be explained by the
determinants examined. It is not clear why this is so as the coefficients of correlations
were relatively small. Further studies could seek explanations for this.
This study faced the limitation of unavailable data. However there were indications that
government is working to collect and analyze data relating to housing and mortgage in its
efforts to achieve vision 2030. With more information available, the study should be
extended to include more variables like supply side of housing. From the findings it was
not clear why a correlation analysis showed a positive relationship between interest rates
and mortgage uptake while the multiple regressions showed a negative one. More studies
should be done to establish the short term and long term effects of interest rates and
mortgage uptake.

45
REFERENCES
Aguko, J. (2010). Analysis of the Factors Influencing Mortgage Financing in Kenya a
Case of Housing Finance Company of Kenya. Unpublished MBA Project,
University of Nairobi.
Akinwunmi, A., Gameson, R. H. & Olomolaiye, P. (2008).The effect of Macroeconomic
Policies on Project (Housing) Finance in Emerging Economies. A Paper Prepared
for the First International Conference on Construction in Developing Countries,
Advancing and Integrating Construction Education, Research& Practice in
Pakistan.
Alder, G. & Mutero, J. (2007). Housing Micro-finance in Kenya. Background Paper for
Meeting of the Rockefeller Foundation Global Urban Summit.
Asare, E. & Whitehead, C. (2006). Formal Mortgage Markets in Kenya: Nature and
Implications. RICS Research Paper Series 6, 13.
Avery, R. & Canner G.B. (2006). Higher Priced Home Lending the 2005.HMDA Data
Federal Reserve Bulletin.
Buckley, R. & Kalarickal, J. (2005). Housing Policy in Developing Countries.
Conjectures and Refutations. The World Bank Research Observer, 20(2)122-130.
Buckley, R. & Kalarickal, J. (2004).Shelter Strategies for the Urban Poor. Idiosyncratic
and successful but hardly mysterious. World Bank Policy Research Working
Paper 3427, Washington, DC.
Case, K., Shiller, R. & Quigley, M. (2005). Comparing Wealth Effects: The Stock Market
Versus the Housing Market. Advances in Macroeconomics5, (1)132-138.
Central Bank of Kenya (2010).World Bank, Mortgage Finance in Kenya: Survey
Analysis.
46
Central Bank of Kenya (2011). Mortgage Finance in Kenya: A Baseline Survey.
Central Bank of Kenya (2011). Bank Supervision Annual Report.
Central Bank of Kenya (2013). Monthly Economic Review from
www.centrabank.go.ke/index.php/monthly-economic-review.
Chiquier, L. & Lea, M. (2009). Housing Finance Policy in Emerging Markets. Washing
DC: the World Bank
Cooper, D. R. & Schindler, P. S. (2003). Business Research Methods for Business
Students, 9th
Edition, U.K: Irwin McGraw-Hill.
Coulthard, M. (2004). Financial Innovation and European Housing and Mortgage Market.
Oxford Review of Economic Policy. 24(1)145-175.
Dobson, J. A. (2002). An Introduction to Generalized Linear Models, Second Edition,
University of British Columbia, Canada.
Dolde, M. J. (2006). Sources of Funds for Mortgage Finance. Journal of Housing
Research, 1(1) 139-61.
Economic Survey, (2012). Retrieved from www.knbs.or.ke/downloads.php
Ersoy, M. (2009). The Impact of the Global Financial Crisis on the Efficiency of Foreign
banks in Turkey.
Fang, Y. I. (2004). The Relationship between Mortgage Loan and Real Estate and their
Effect on Banks Financial Performance, China.
Fisher, J. D. (1997). Real Estate Finance & Investments. Boston: Massacheuttes U.S.A:
Irwin McGraw-Hill.

47
Gallagher, M. (2011).The Effect of Inflation of Housing Prices from
http://homeguides.sfgate.com/effect-inflation-housing-prices-2161.html
Gerlach, S. & Peng, W. (2005). Bank Lending and Property Prices in Hong Kong.
Journal of Banking and Finance 29, 461–481.
Gitman, L. J. & Joehnk, M.D. (2002).Fundamentals of Investing.8th edition. Boston:
Addison Wesley.
Giddings, C. (2007). Housing Finance in sub-Saharan Africa, Pretoria, South Africa.
Greef, I. J.M. & Haas, R.T.A. (2000).House Prices, Mortgage Lending and Monetary
Policy.
Green, R. K. (1997). Follow the Leader: How Changes in Residential and Non-
Residential Investments Predict Changes in GDP. Real Estate Economics, 253-
270.
Hass Consult Ltd (2013). Base Figures – Sales and Letting Monthly Changes.
Jayantha, W. M. (2012). Factors Affecting Long-run Homeownership Rates in Hong
Kong. International Conference on Management, Economics and Social Sciences
(ICMESS‟2012) June 30-July1, 2012 Bali.
Julius, S. M. (2012). Determinants of Residential Real Estate Prices in Nairobi.
Unpublished MBA Project, University of Nairobi.
Jumbale, D.K. (2012). The Relationship between House Prices and Real Estate Financing
in Kenya. Unpublished MBA Project, University of Nairobi.
KNBS (2013). Leading Economic Indicators from
www.knbs.or.ke/economicindicators.php
48
Leonard, G. M. & Owiti, K. (2013). The Determinants of Mortgage Uptake in Kenya
using Capital Market indicators. Unpublished MBA Project, Jomo Kenyatta
University of Agriculture and Technology.
Liow, K.H., Ibrahim, M.F. & Huang, Q. (2006). Macroeconomic Risk Influences in the
Property Stock Market. Journal of Property Investment and Finance, 24(4).
Martinez, J. A., Maza, L. & Restroy, F. (2003). House Prices in Spain. Economic October
Bulletin, Madrid, Banco de Espana.
Mehdian, M. (2001). Professor of Finance School of Management. An Analysis of Stock
Market Anomalies 28 (7).
Melzer, I. (2005). Access to Housing Finance in the Low-Income Market.
Miller, E. K. (2000). Task-Specific Neural Activity in the Primate Prefrontal
Cortex.J.Neurophysiol. 84, 451–459.
Muguchia, L. (2012). The Effect of Flexible Interest Rates on the Growth of Mortgage
Financing in Kenya. Unpublished MBA Project, University of Nairobi.
Muli, J. (2011). The Relationship between Property Prices and Mortgage Lending in
Kenya. Unpublished MBA Project, University of Nairobi.
Mutero, J. (2007). Housing Finance in Africa. Nairobi: Kenya.
Nabutola, W. (2004). Affordable Housing-Some Experiences from Kenya. FIG working
Week, Athens Greece.
Ngechu, M. (2004). Gender-Sensitive Communication Research among Rural Male 3(3)
68-95.
Ngugi, R.W. (2001). An Empirical Analysis of Interest Rate Spread in Kenya. African
Economic Research Consortium, Research Paper 106.
49
Okwir, N. (2002). Lessons Learnt so far from Housing Finance Operations Experience in
Kenya. UN Habitat Financing Adequate Shelter for All: Addressing the housing
finance problem in developing countries, 93 – 98.
Repp, P. C. (2004). Technology Precipitates Reflective Teaching. The Evolution of a Red
Square Change, 28 (2), 49, 56-57.
Rakodi, C. & Leduka, C. (2003). Informal Land Delivery Processes and Access to Land
for the Poor in Six African Cities: Towards a Conceptual Framework,
Birmingham: International Development Department, School of Public Policy,
Informal Land Delivery Processes in African Cities.
Rogers, E. M. (2005). Diffusion of Innovation, (4th Ed.). New York: Free Press.
Retirement Benefits Authority (2009). The Retirement Benefits Act 2009.
Rust, K. (2008). Housing Finance in Sub-Saharan Africa. Reference from South Africa.
Finmark Trust.
Somoye, R. O. C. (2010). The Variation of Risks on Non-Performing Loans on Bank
Performances in Nigeria. Indian Journal of Economics and Business, 9(1).
Trading Economics, (2013). From http://www.tradingeconomics.com/kenya/interest-rate.
Trading Economics, (2013). from http://www.tradingeconomics.com/kenya/money-
supplym2.
Tse, R.Y.C. (2002). Mortgage Default Risk and Lending Policy. A Study of the Mortgage
Lending in Hong Kong. Australian Land Economics Review, 2(2)12-17.
Villosio, N. (1995). The Average Mortgage Loan in the Largest Thirteen Cities. Percent
of Family income. 4 (1) 23-24.

50
William, B. B. & Jeffrey, D.F. (2008). Real Estate Finance and Investment (13th
Edition). McGraw Hill, Singapore.
World Bank, (2011). Developing Kenya’s Mortgage Market. Report No. 63391-KE.
World Bank, (2011). Turning the Tide in Turbulent Times: Making the Most of Kenya's
Demographic Change and Rapid Urbanization. © Washington, DC.
https://openknowledge.worldbank.org/handle/10986/13002 License: CC BY
3.0Unreported.

51
APPENDICES
Appendix I: Mortgage Firms in Kenya
List of commercial banks in Kenya as at December 2013
1. African Banking Corporation Ltd
2. Bank of Africa Kenya Ltd
3. Bank of Baroda (Kenya) Ltd.
4. Bank of India
5. Barclays bank of Kenya Ltd
6. CFC Stanbic Bank Limited
7. Charterhouse Bank Ltd
8. Chase Bank Kenya Ltd
9. Citibank N A Kenya
10. Commercial Bank of Africa
11. Consolidated Bank
12. Co-operative Bank of Kenya Ltd
13. Credit Bank Ltd
14. Development Bank of Kenya Ltd
15. Diamond Trust Bank
16. Dubai Bank Kenya Ltd
17. Ecobank Kenya Ltd
18. Equatorial Commercial Bank Limited
19. Equity Bank
20. Family Bank ltd
21. Fidelity Commercial Bank Ltd
22. Guaranty Trust Bank (K) Limited (Formely-Fina Bank Limited)
23. First community Bank Ltd
24. Giro Commercial Bank Ltd
25. Guardian Bank Ltd.
26. Gulf African Bank Ltd
27. Habib Bank A.G Zurich
28. Habib Bank Ltd
29. Imperial Bank Ltd
30. Investments & Mortgages Bank Limited – I&M Bank

52
31. Jamii Bora Bank Ltd
32. KCB Bank
33. K-Rep Bank
34. Middle East Bank (K) Ltd
35. National Bank
36. NIC Bank
37. Oriental Commercial Bank Ltd.
38. Paramount Universal Bank Ltd
39. Prime Bank
40. Standard Chartered Bank Kenya Ltd
41. Trans-National Bank (K) Ltd
42. UBA Kenya Bank Ltd
43. Victoria commercial Bank Ltd
Non-Banking Financial Institution
1. Housing Finance Company Ltd
CBK supervision report 2013 pg. 85-106
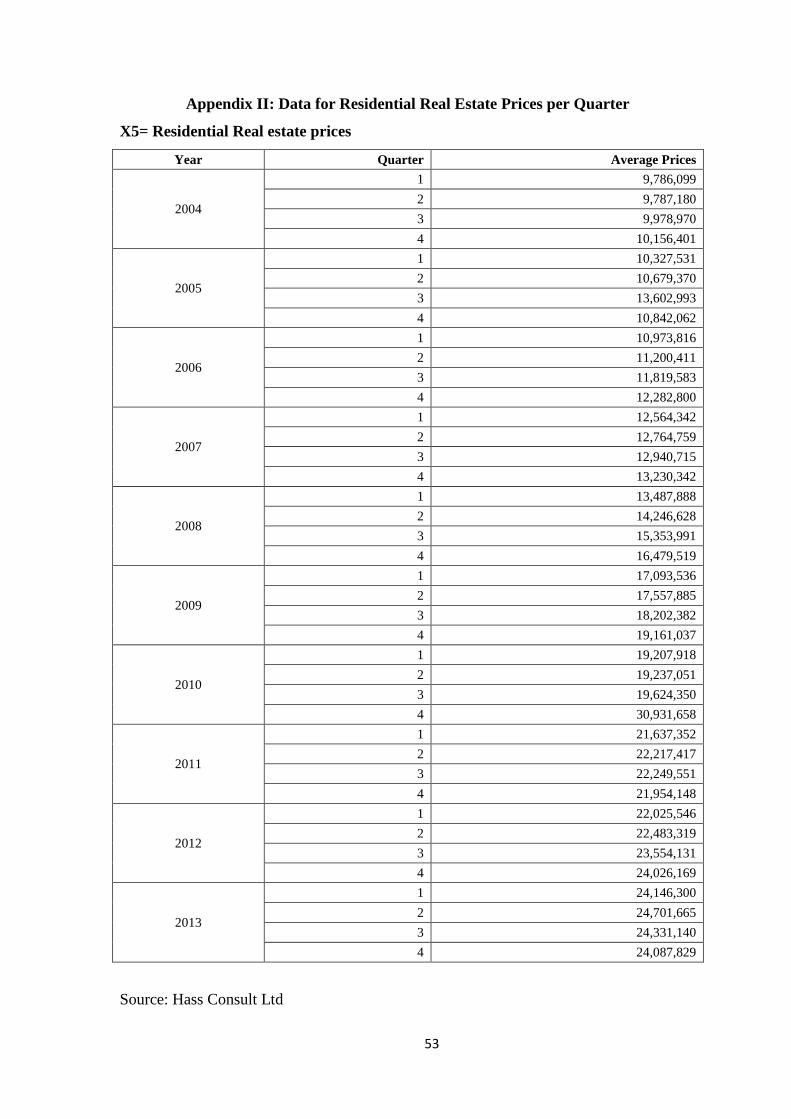
53
Appendix II: Data for Residential Real Estate Prices per Quarter
X5= Residential Real estate prices
Year Quarter Average Prices
2004
1 9,786,099
2 9,787,180
3 9,978,970
4 10,156,401
2005
1 10,327,531
2 10,679,370
3 13,602,993
4 10,842,062
2006
1 10,973,816
2 11,200,411
3 11,819,583
4 12,282,800
2007
1 12,564,342
2 12,764,759
3 12,940,715
4 13,230,342
2008
1 13,487,888
2 14,246,628
3 15,353,991
4 16,479,519
2009
1 17,093,536
2 17,557,885
3 18,202,382
4 19,161,037
2010
1 19,207,918
2 19,237,051
3 19,624,350
4 30,931,658
2011
1 21,637,352
2 22,217,417
3 22,249,551
4 21,954,148
2012
1 22,025,546
2 22,483,319
3 23,554,131
4 24,026,169
2013
1 24,146,300
2 24,701,665
3 24,331,140
4 24,087,829
Source: Hass Consult Ltd

54
Appendix III: Quarterly GDP at Market Prices
Quarterly GDP Values
Year Quarter GDP
2004
1 273,983
2 260,382
3 279,699
4 295,274
2005
1 281,335
2 277,857
3 303,053
4 313,004
2006
1 298,153
2 295,111
3 327,868
4 328,338
2007
1 319,289
2 319,696
3 348,672
4 349,189
2008
1 322,757
2 326,599
3 357,649
4 350,258
2009
1 342,820
2 332,800
3 364,423
4 354,344
2010
1 347,744
2 352,979
3 390,817
4 383,763
2011
1 364,549
2 365,470
3 406,453
4 403,440
2012
1 378,795
2 381,962
3 425,119
4 424,209
2013
1 398,511
2 399,156
3 446,247
4 442,235
Source: Kenya National Bureau of Statistic.

55
Appendix IV: Quarterly Inflation Rates
Inflation Rates per Quarter
Year Quarter Rate
2004
1 9.80
2 10.30
3 10.80
4 11.60
2005
1 14.30
2 14.23
3 7.67
4 5.77
2006
1 17.80
2 12.97
3 11.80
4 15.30
2007
1 7.47
2 7.70
3 12.57
4 11.47
2008
1 19.70
2 29.13
3 27.43
4 28.50
2009
1 17.03
2 10.20
3 7.47
4 5.63
2010
1 4.58
2 3.68
3 3.33
4 3.84
2011
1 7.05
2 13.16
3 16.51
4 19.19
2012
1 16.87
2 11.78
3 6.38
4 3.53
2013
1 4.08
2 4.37
3 6.99
4 7.42
Source: Kenya National Bureau of Statistics.
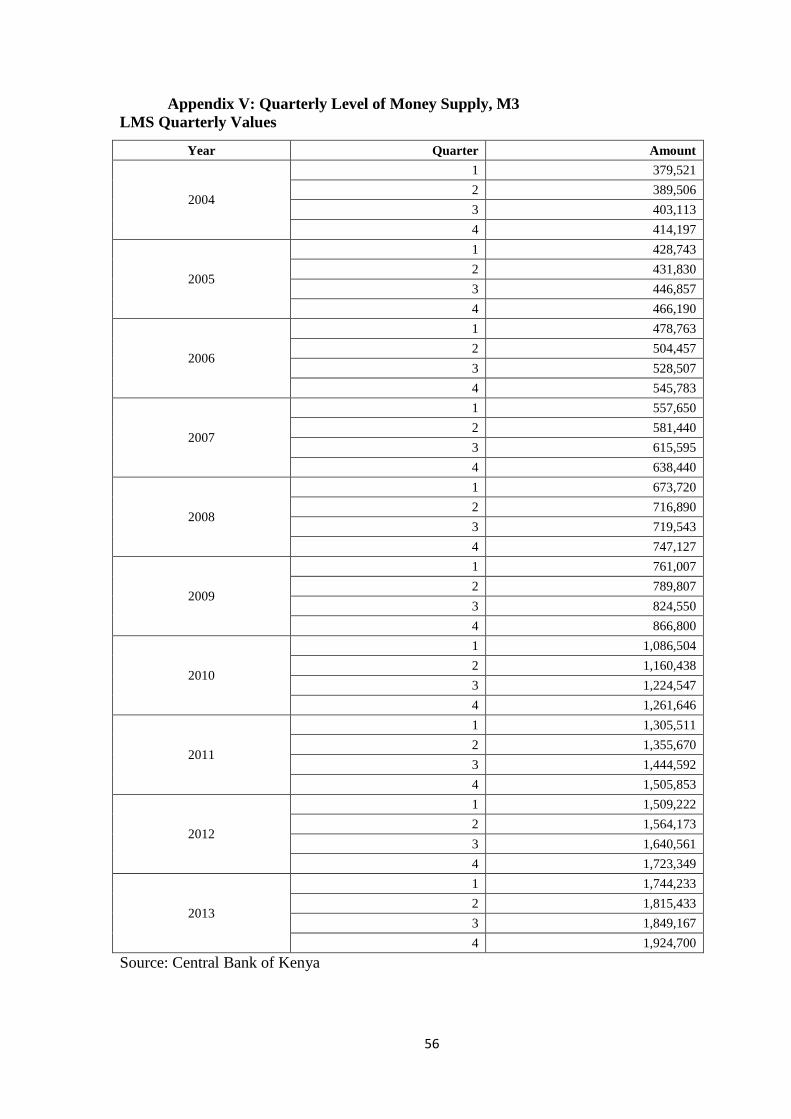
56
Appendix V: Quarterly Level of Money Supply, M3
LMS Quarterly Values
Year Quarter Amount
2004
1 379,521
2 389,506
3 403,113
4 414,197
2005
1 428,743
2 431,830
3 446,857
4 466,190
2006
1 478,763
2 504,457
3 528,507
4 545,783
2007
1 557,650
2 581,440
3 615,595
4 638,440
2008
1 673,720
2 716,890
3 719,543
4 747,127
2009
1 761,007
2 789,807
3 824,550
4 866,800
2010
1 1,086,504
2 1,160,438
3 1,224,547
4 1,261,646
2011
1 1,305,511
2 1,355,670
3 1,444,592
4 1,505,853
2012
1 1,509,222
2 1,564,173
3 1,640,561
4 1,723,349
2013
1 1,744,233
2 1,815,433
3 1,849,167
4 1,924,700
Source: Central Bank of Kenya
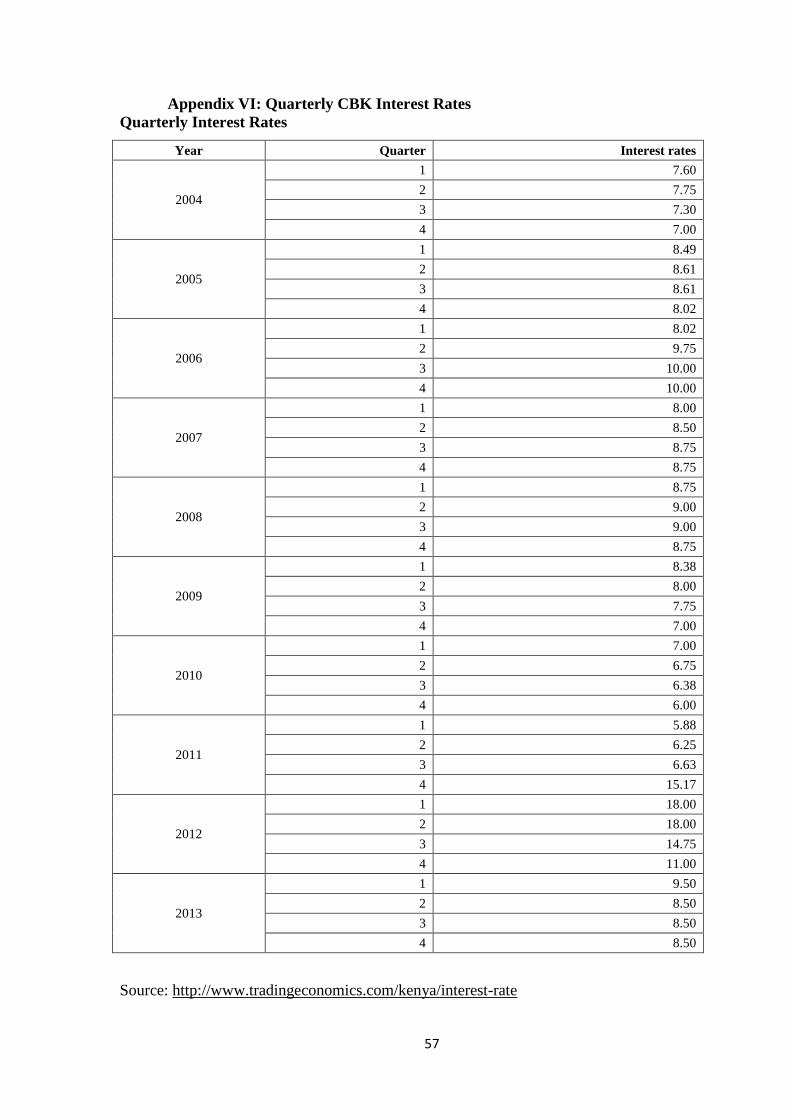
57
Appendix VI: Quarterly CBK Interest Rates
Quarterly Interest Rates
Year Quarter Interest rates
2004
1 7.60
2 7.75
3 7.30
4 7.00
2005
1 8.49
2 8.61
3 8.61
4 8.02
2006
1 8.02
2 9.75
3 10.00
4 10.00
2007
1 8.00
2 8.50
3 8.75
4 8.75
2008
1 8.75
2 9.00
3 9.00
4 8.75
2009
1 8.38
2 8.00
3 7.75
4 7.00
2010
1 7.00
2 6.75
3 6.38
4 6.00
2011
1 5.88
2 6.25
3 6.63
4 15.17
2012
1 18.00
2 18.00
3 14.75
4 11.00
2013
1 9.50
2 8.50
3 8.50
4 8.50
Source: http://www.tradingeconomics.com/kenya/interest-rate
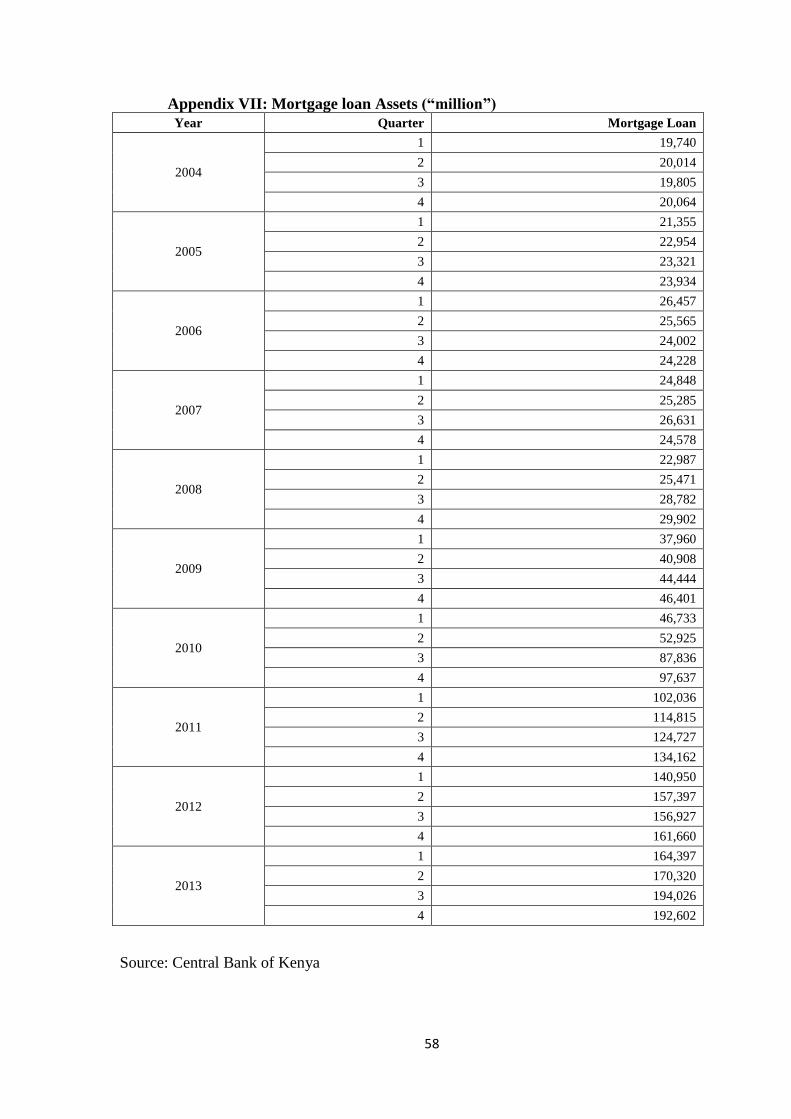
58
Appendix VII: Mortgage loan Assets (“million”)
Year Quarter Mortgage Loan
2004
1 19,740
2 20,014
3 19,805
4 20,064
2005
1 21,355
2 22,954
3 23,321
4 23,934
2006
1 26,457
2 25,565
3 24,002
4 24,228
2007
1 24,848
2 25,285
3 26,631
4 24,578
2008
1 22,987
2 25,471
3 28,782
4 29,902
2009
1 37,960
2 40,908
3 44,444
4 46,401
2010
1 46,733
2 52,925
3 87,836
4 97,637
2011
1 102,036
2 114,815
3 124,727
4 134,162
2012
1 140,950
2 157,397
3 156,927
4 161,660
2013
1 164,397
2 170,320
3 194,026
4 192,602
Source: Central Bank of Kenya