Embed Size (px)
Citation preview

_-TR-033- 5
HEAT TRANSFER BETWEEN SURFACES IN CONTACT:
THE EFFECT OF LOW CONDUCTANCE INTERSTITIAL MATERIALS
PARTS IV and V
INVESTIGATION OF THERMAL ISOLATION MATERIALS AND
THEIR APPLICATION IN BOLTED FLAN
by GPO PRICE $
D.A. Gyoros and P.A. Smuda CSFTI PRICE(S) $
Hard copy (HC) ,_./'J'_l
Microfiche (MF) ,/'_--
ff 653 July 65
Research Sponsored by
AMES RESEARCH CENTER
NATIONAL AERONAUTICS AND SPACE ADMINISTRATION
under Grant NGR 03-001-033
/:-? :qo o'(NAIA at _'T/MX OI AD NUMII|I) (CA|IGORY)
Nechanlcal Engineering DepartmentArlgona State University
Tempe, Arizona
AUGUST, 1968
https://ntrs.nasa.gov/search.jsp?R=19680024608 2018-06-20T13:33:25+00:00Z

L_J
• z
HEAT TRANSFER BETWEEN SURFACES IN CONTACT:
THE EFPECT OF LOW CONDUCTANCE INTERSTITIAL MATERIALS
PARTS IV AND V
INVESTIGATION OF THERMAL ISOLATION MATERIALS AND
THEIR APPLICATION IN BOLTED FLANGE JOINTS
by
D. A. Gyorog and P. A. Smuda
Research Sponsored byAmes Research Center
NATIONAL AERONAUTICS AND SPACE ADMINISTRATION
under Grant NGR 03-001-033
Mechanical Engineering Department
Arizona State University
Tempe, Arizona
August, 1968

ACKNOWLEDGMENTS
The authors wish to express their appreciation to the
National Aeronautics and Space Administration for financial
support and to Ames Research Center for the loan of the test
apparatus used in this study.
Special thanks and gratitude is also expressed to Rod
McIntire, Joe Smith, Frank Hombaker_ Robert MacMillan, Dick
Fisher and Carlton Anderson for their exceptional help in
the construction of the test facility and apparatus.
Finally, special appreciation is expressed to Harold
Broda for typing the manuscript.
ii

11
TABLE OF CONTENTS
CHAPTER PAGE
I. INTRODUCTION ................... 1
II. SUMMARY OF PREVIOUS RESULTS ........... 4
Experimental Verification of Test Apparatus . . 4
Comparative Study of Interstitial Materials 9
Detailed Study of Promising Materials ..... 18
III. INTERSTITIAL MATERIAL AND MULTILAYER TESTS .... 31
IV. INSULATION OF FLANGE JOINTS ........... 42
V. SUMMARY ..................... 53
BIBLIOGRAPHY ....................... 55
APPENDIX A EXPERIMENTAL DATA .............. 57
APPENDIX B UNCERTAINTY ANALYSIS ............. 66
iii

f
LIST OF TABLES
TABLE PAGE
1. Manufacturer's Property Data ............. i0
2. Metal Specimen Designation ............... 14
3. Tabulated Experimental Data for Wire Screen ....... 29
4. Comparison of Multilayer combinations .......... 40
5. Two Bolt Flange Comparisons ............. 50
A1 Tabulated Experimental Results, Bare Junction Series . 58
A2 Tabulated Experimental Results_ Interstitial Materials 59
A 3 Tabulated Experimental Results3 Two Bolt Flange ..... 63
A_ Tabulated Experimental Results, Four Bolt Flange .... 65
iv

LIST OF FIGURES
FIGURE
i.
2.
3.
4.
5.
6.
7.
8.
9.
i0.
ii.
12.
13.
14.
15.
BI.
PAGE
Schematic Diagram of the NASA Experimental Apparatus . . 5
Diagram of the Axial Loading System ........... 6
Comparative Plot of Thermal Contact Conductance ..... 15
Thermal Contact Conductance of Bare Junctions ...... 16
Compression Strain Curves ................ 20
Effective Thermal Conductivity Curves .......... 24
Mass Per Thermal Resistance Curves ......... 26
Multilayer Mica Test Results .............. 34
Laminate Variable Thickness Results .......... 36
Thermal Resistance of Wire Screens ........... 38
Two Bolt Flange Joint .................. 43
Bolt Flange 44our . . . . . . . . . . • • . • • • ....
Schematic Diagram of the Flange Joint Installation • • . _5
Thermal Conductance Comparison for Two Bolt Flange • • . 48
Thermal Conductance for the Four Bolt Flange ...... 49
Estimated Uncertainty .................. 67
v
IlU ILl I IL _ I

A
h
I
k
L
M
n
P
O
q
R
r
T
AT
dt
W
dx
6
Subscripts
o
C
c
e
H
t
M
m
NOMENCLATURE
Apparent area, sq ft
Junction thermal conductance, Btu/hr sq ft OF
Current, amps
Thermal conductivity, Btu/hr sq ft OF
Load, pounds
Thickness, inches
Mesh size
Number of layers
Pressure, psi
Heat transfer, Btu/hr
Heat flux, Btu/hr sq ft
Junction thermal resistance, hr sq ft °F/Btu
Resistance, ohms
Temperature, OF
Junction temperature difference, OF
Increment of temperature, OF
Weight, pounds
Increment of length, inches
Uncertainty increment
Density, ib/cu ft
Initial
Cooled
Per contact
Effective
Heated
Heat. loss
Bulk material
Mean
vi

CHAPTERI
INTRODUCTION
The successful operation of a spacecraft is, to a
great extent, dependent upon the temperature control of its
components and surfaces. As missions become more demanding,
i.e. longer lifetime, near solar missions, etc., the use of
protective shields and other insulation techniques take on
increased importance. For most structures the thermal anal_
ysis requires design information regarding the thermal con-
ductance of joints. A great number of examples from current
spacecraft technology can be listed for which the thermal
contact conductance is an important design parameter. Some
of these are the thermal isolation of components such as re-
flective shields, antenna struts, and cryogenic storage com-
partments. In these particular cases the insulating effect
of low conductance interstitial materials would have a direct
benefit.
Although the measurement and prediction of thermal
contact resistance has received considerable attention, the
results have been somewhat disappointing because of the lack
of reproducible data and the difficulty of predicting joint
conductance under varying conditions of manufacture, load, and
surface conditions Ill _ One proposed solution to enable the
prediction of thermal resistance is the use of contact filler
materials which are more or less insensitive to loads and sur-
face conditions. The insertion of interstitial materials can
serve to increase or decrease the thermal resistance of the
_Numbers in parentheses refer to references.

junction. However, specific results on the thermal conductanceof metallic contacts with interstitial fillers are limited.Further, design information for thermal isolation is even morelimited since the majority of the previous investigations onthis subject have emphasized the improvement of the contactconductance with such materials as high conductivity metalfoils. Thus the primary purpose of this investigation was toprovide information, based on experiment, for thermal insula-tion of contacts with low conductance interstitial mater als.
In a vacuum environment the heat transfer at the con-
tacting surface is a result of conduction through the intersti-
tial material and for some materials possible radiation heat
transfer. Calculations for the metal test specimen tempera-
tures encountered during the investigation indicate that the
contribution due to radiati_m is less than 0.i percent. Hence
the primary mode of heat tzansfer is conduction. The effective
thermal resistance at the jlnction can therefore be increased
by use of a low thermal conductivity material and by reduction
of the contact area. Junc%ion materials which provide the de-
sired increase in thermal resistance can be classified into the
following general categories: Geometric, Powders, and Insula-
tion Sheets. The thermal contact conductance of the junction
is defined as
Q
h - A_TI - T 2 )
where T_ and T2 are the extrapolated temperatures of the
bounding surfaces of the contact and Q/A is the apparent heat
flux of the total cross-sectional area of the contact. Thus
the thermal contact resistance, Rj is defined as the reciprocal
of the product hA.

The investigation was composedof five distinct parts:
Part I - Assembly and experimental verification of
the test apparatus,
Part II Comparative study of interstitial materials,
Part III- Detsiled study of promising materials,
Part IV - Study of other promising materials and combi-
nations of materials for multilayer intersti-
tial configurations, and
Part V - Application to flange joints used in space-
craft construction.
Parts Ix II and III were supported by the initial
research grant and the results have been previously reported
_i, 2, 3_. The purpose of this report is to summarize the
pertinent results of the previous phases of the investigation
and to report the results of Parts IV and V.

C}LAPTER!I
SUmmARYOF PREVIOUSRESULTS
PARTI - Experimental Verification of Test Apparatus
The primary objective of the first phase of the in-vestigation was to assemble and test the experimental appa-ratus in the vacuumfacility. The test apparatu_ bad beendesigned and constructed at the AmesResearch Center and wasloaned for this investigation. In an earlier study (4) thevacuum facility and instrumentation techniques had been de-veloped. After assembly of the test apparatus, the initialruns were conducted with armco iron specimens to check the
instrumentation, to calculate the magnitude of the heat loss,
to test the deviation from one-dimensional heat transfer, and
to develop an experimental procedure. Following these runs,
aluminum 2024 specimens were installed and the resulting ther-
mal contact conductance values compared with those of previous
investigators. As a result of these tests the apparatus was
modified to include additional thermocouples, insulation, and
radiation shields. Techniques were also established for speci-
men surface preparation, thermocouple installation, specimen
alignment and loading_ and general test procedures.
The design criteria amd zpecific details of the ex-
perimental apparatus are discussed in the Part I report (i).
Ho_;ever, schematic diagrams of the test apparatus are re-
peated in Figures 1 and 2 for easy reference. The test sec-
tion was a one inch diameter column with the contact surface
at approximately mid-height. Each metal test specimen was

f
5
Bell Jar
,L
Nitrogen
Load
Bellows
Support
Plate
Heat
S ink
Specimens
Guard
Heater
Base Plate
linear
Source
AxialV//A
, Insulation
=>,J
Figure ]. Schematic Diagram of the NASA Experimental Apparatus.

p,-----
6
[1)(z)(3)
(5)
(6)(.7)_,8)tg)
(Io)(Ii)
(12)
Nitrogen Load Bellows
_eat Sink
Test Specimens
Heat Source
Guard Rearer
Base Plate
Passthrough Bellows
Load Cell
Mechanical Screw-Jack
Guide Plate
Support Rods
Support Plate
(12)
(6)i
i
Figure 2, Diagram of the Axial ioadlng System.

q.
7
instrumented with five centerline and three surface thermo-
couples. The centerline thermocouples were one-half inch
apart starting one-quarter inch from the junction. These
temperatures were used to calculate the temperature gradi-
ent and resulting heat flux and, in addition, the temperature
at the junction was found by extrapolation. Copper-constantan
30 gage wire thermocouples were inserted into holes drilled
with a No. 56 drill and carefully packed in place with alumi-
num powder. The first two specimen sets were x-rayed to
check the thermocouple installation and determine drill
runout. Since no flaws were detected it was deemed unneces-
sary to continue this procedure for all specimens. The conti-
nuity of the thermocouples was also checked before and after
installation. Surface thermocouples were placed in one-
sixteenth inch deep holes diametrically opposite the center-
line thermocouple. Thermocouple leads were wrapped around
the specimen to reduce the heat transfer from the junction.
The thermocouples, lead wires and thermocouple switches were
calibrated with reference to a Platinum-Platinum l0 g Rhodium
thermocouple and an uncertainty of 0.5{ was established.
For load application to the test specimens, high
pressure nitrogen gas was admitted to the stainless steel
bellows chamber (Fig. 2). The nitrogen bellows was selected
since it simplified specimen loading and provided a rela-
tively accurate means of adjusting and maintaining a constant
load. The load pressure, P, is defined as the load force
divided by the cross-sectional area of the cylindrical test
specimen. A calibrated load cell and strain indicator were
used to measure the load force. These measurements were cor-
rected for the deflection of the stainless steel load pass-
through bellows and the atmospheric pressure differential.

8
Since the thermal conductivity of the metal test
specimen is essential to the calculation of the heat flux,
it was desirable to establish that published values for k
were applicable to the test specimen material. An apparatus
consisting of a central heater sandwiched between two t-inch
long by 1-5./'8 inch diameter cylinders of the test material was
constructed. Each end of the column was attached to a liquid
cooled plate and heater combination which was adjusted to
maintain a given temperature difference. Temperature gradients
were calculated from measurements obtained by thermocouples
imbedded in the material. Armco iron specimens were installed
to calibrate the apparatus for heat loss since the k values
for armco iron are relatively well established (5). Then
thermal conductivity values for the test specimen materials
were determined. These values agreed within 5 percent of the
published data so for all subsequent calculations the thermal
conductivity values were obtained from References 6, ?, and 8.
A band heater was clamped arouP" the end of the
heated test specimen (Fig. i). This portion of the test spe-
cimen was insulated and surrounded by a radiation shield to
reduce the heat transferred to the adjacent apparatus. Aluminum
foil radiation shields were also installed around the thermo-
couple instrumented portions of the heated and cooled test
specimens. Because a large temperature difference (200°F to
400CF) existed between the two specimens, with the intersti-
tial materials in place, the radiation shields were separated
at the contact plane. Chilled water and liquid nitrogen
coolant fluids were supplied to the copper heat sinks.

mm _
9
The bare juncti_ exp_imental results for aluminum
2024 were shown to indicate the same trends and relative mag-
nitudes as those of other investigators. Thermal contact
conductance values for repeat test runs agreed within 5 per-
cent. The uncertainties in the calculated values of h were
estimated to vary from ?.2 percent at lower values of h to
11.6 percent at higher values. This variation is a result
of the reduction in junction temperature difference with
increasing h.
PART II - Comparative Study of Interstitial Materials
During thi,_ phase of the investigation thermal tests
in a vacuum environm,nt of 10 -5 Torr were conducted to experi-
mentally ascertain which were the most promising junction insu-
lation materials. A l!.st of possible materials was first com-
piled from a survey of the materials literature and from corre-
spondence with industriel concerns. In order to effectively
accomplish the experimen al study within the required t_ne the
number and types of mater:_als were restricted to those listed
in Table i. The results c:_ these comparison runs were reported
in Reference 2 and 3.
Since the purpose was to increase the resistance to
heat transfer at a junction, smooth test surfaces were selected
since they provide the minimur resistance for bare junction
conditions. To minimize deviations in contact resistance
between different sets of test ,pecimens, the same surface
finishing technique was followed for all specimens. The con-
tacting surfaces were finished on a lathe and then lapped and
polished. Measurements with a pro_ilometer and proficorder

I0
TABLE1
MANUFACTURER'SPROPERTYDATA
MATERIAL RUN SUPPLIERSYMBOL
K 0 VACUUM WEIGHT
Btu/hr. ft°F ibm/ft s AIR WEIGHT
_o
in
Asbestos AB
Board
Asbestos AT
Tape
(No. 207_)
Carbon CA
Paper
F-907
Ceramic CE
Paper
970-J
WRP-X-AQ FEFelt
Laminate LA
T-30LR
Magnesia MA
25
Mica MI
(Bonded)
Pluton B-I PL
Cloth
Pyroid PY
Pyrotex PI
23RPD
Johns-
Manville
Atlas
Asbestos
Company
Fiberite
Corp.
0.04 - 100°F 136
0.06 - 500°F
0.12 300°F 55 0.985
0.2 300°F 9 0.993
Carborundum 0.03 - 400°F
Company 0.10 -1600°F
Refractory 0.04 - 500°FProducts Co. 0.]2 -2000°F
Carborundum 0,37 - 250 °F
Company 0.13 -2000°F
Degussa Inc. 15.7 - i12 °F
Regan
Engineering
.21 - 100OF
1.24 -1000°F
3M 0.02 - 80°F
Company 0.03 - 180°F
Pyrogenics 1.00 - ?O°F
I c. 0.30 -5000°F
Raybestos- 1.39 70 °F
Manhattan
O. 1210
o.O8lO
q_55o
12 O. 999 O. 1030
18 0.995 0.1830
50 o.989 o. 12%o
196 O. 0990
13 O.999 0.0034
87
z62
o.o27o
0.1156
O. 1120

TABLE1 (Cont'd.) ii
MATERIAL RUN SUPPLIERSYMBOl,
0 VACUUM WEIGHT
Btul/hr. ft°F lbnvft 3 AIR WEIGHT_O
li]
Silica SI Fiberite
Paper Corp.
F-904
S,S.
Screen
i0/in
S,So
Screen
!00/in
SS 10
SS i00
S.S. Shim SH ---
Teflon TE DuPont Co.
Sheet
Teflon TFE Bel-Art
TFE Products
Textolite TX General
Electric Co.
Titanium TI l0 Newark
Screen Wire Cloth
10/in Company
Tungsten W20 NewarkScreen Wire Cloth
20/in Company
0.i0 - 300°F i0 0.992
9.30 - 2120F 500
9.30 - 212°F 500
9.J0 - 212°F 500
1.35 - 100 °F i0
1.40 250°F
ii.6 - 200°F 276
96 - 32°F 1210
70 - 932°F
o.o@95
o.o5oo
0.oo9o
0.0010
o.0028
o. 062
O. 062 i
0.050o
0. OlqO
Zirconia Zl Degussa Inc. 1.08 - 212°F 355 --- 0.i0_323

12
indicated a 3 to 6 u-inch roughness and approximately a 20 to
25 u-inch flatness deviation. The similarity of the surfaces
was substantiated by the agreement of the bare junction con-
ductance values for the different specimen sets. So that the
comparison of the different materials would be independent of
temperature two mean temperatures were selected for all of the
tests, +190°F and -IO0CF. For the higher temperature runs the
heated specimen was maintained at 300OF by adjusting the
heater power input and the flowrate of cooling water which
was at a temperature of approximately 60°F. To attain the
lower temperatures liquid nitrogen was used as the coolant
which produced temperatures as low as -300°F in the low tem-
perature specimen. The heated spec5men was adjusted to approx _
imately 90°F for these runs.
Generally from six to eight hours were required to
attain a steady-state condition. The experimental runs with
bare junctions and with interstitial materials were conducted
in the order of i_reasing load pressure. In all tests one
specimen was at a more extreme temperature, +3O0°F or -300°F,
while the other was nearer the ambient temperature. Since the
temperature measurement error should be less and the assump-
tion of one-dimensional heat flow better for the ambient tem-
perature specimen, the heat flux calculated for this specimen
was used to calculate h. However, some uncertainty exists in
the selection of the "best" temperature gradient especially
for small heat flux values (low h). For this reason maximum
and minimum slopes were estimated which usually gave a differ-
ence of from 2 to 3 Btu/hr ft 2 OF between the high and low
values of h for thermal conductance values less than
i0 Btu/hr ft e OF. This increased to a difference between the
_P
, °
13
high and low values of h of 20 Btu/hr ft 2 OF at thermal con-
ductance values near 400 Btu/hr ft 2 OF. The increased devi-
ation results as a consequence of the reduction in the junction
temperature difference. To provide a better estimate of the
contact conductance for the low heat flux cases, the heat flux
was also calculated by determining the energy losses from the
heated specimen in Part III. The results of the comparative
study (190°F mean temperature> are graphically illustrated in
Fig. 3. The initial thicknesses of the test materials are
listed in Table i. Only the eight materials having th_ lowest
thermal contact conductances in the high temperature tests
(Fig. 3) were considered in the low temperature comparison
tests (2). The thermal contact conductance decreased from
i0 to 50 percent for these materials with the reduction in
the mean temperature from +lg0°F to -100°F. This reduction
can be attributed to changes in material properties with tem-
perature.
The initial series Of bare junction tests were con-
ducted with specimen set i, which was machined from "as re-
ceived" aluminum stock. A description of the different test
specimens is given in Table 2. The resulting bare junction
conductance values for the test specimens is illustrated in
Fig. 4. Initially the ratio of calculated temperature gradi-
ents in the heated and cooled specimens for set 1 was 1.28,
nearly equal to the ratio of thermal conductivity of 1.2 for
"as received" aluminum. However, after heating set 1 to high
temperatures it was found that the temperature gradient ratio
increased to 1.4, which compares to the thermal conductivity
ratio of "annealed" aluminum in the heated specimen and "as
received" aluminum in the cooled specimen. This property

#
14
TABI,E 2
METAL SPECIMEN DESIGNATION
SPECIMEN NO. MATERIAL TYPE SURFACE CONDITIONS
Hot Cold Hot Cold
Specimen Specimen Specimen Specimen
Aluminum Aluminum
2024 2024AN UN
A A
Alumin'_m Aluminum
2024 2024
AN AN
A A
Aluminum Aluminum
2024 2024
AN AN
A A
Aluminum Aluminum
2024, 2024AN AN
A A
5 Aluminum Aluminum
2022: 2024AN AN
A B
6 Stainless Stainless
Steel Steel
3O4 304
A A
Notation
AN
UN
A
B
Stainless Stainless
Steel Steel
304 304
A A
Specimens annealed at 600°F for 24 hrs.
Specimen unannealed
Roughness _-5 _in Flatness 20-25 uin
Roughness 200-225 uin Flatness 25-50 uin

q
o
D"
_z
m
J
¢9
OL)
_-4
10 3
10 2
i01
i0 °
m
m
m
m
k
mn
m
I
m
mm
m
m
D
BJ-AL
_/ TE
I
W 20
MI
SSl00
PY
RP
TX
PL
TFE
SSlO
TII0
AT
AB
PI
SI
CA
CE
ZI
LA
0 i00 200 300 400
Load Pressure, P, psi
15
FIGURE 3. Comparative Plot of Thermal Contact
Conductance

16
103
%
e-
U
02
c-
OL)
Q0
lOl
Tm ~ 290°F
_ Tm -_-20°F J
_. 4
_ b, 5
- D 6- C) 7
, I i I i I i II00 200 300 400
Load Pressure, P, psi
FIGURE 4. Thermal Contact Conductance of Bare Junctions

mm _
1Z
variation, which must be attributed to a slow annealing of
the heated specimen while subjected to a compressive load,
caused a definite change in the bare junction h values. These
are denoted in Fig. 4 by the flagged symbols. Thus the heated
specimen of set 1 was treated as "annealed" and the cooled
psecimen as "as received". Since the heat transferred was
calculated by the temperature gradients in the cooled speci-
men_ the h values for interstitial materials obtained with
set 1 were not affected. This was confirmed in Part III by
repeat runs with other metal test specimens. To assume that
property changes would not occur in future runs, beginning
with set 2 all aluminum specimens were annealed by heating
in an oven to 600°F for _4 hours prior to finishing the speci-
men surfaces. Subsequent comparisons of the temperature gra-
dient and thermal conductivity ratios for the annealed speci-
mens showed excellent agreement and did not indicate any
further property variation.
Many bare junction runs were interspersed between
the interstitial material runs to test for changes in the sur-
face conditions. In some cases large variations in h were
encountered, but these were generally found to be the result
of some surface effect such as oxidation, contamination by
the previous material, or a scratch or imperfection. Only
initial test runs with each specimen set (i.e. before inter-
stitial matezial runs) or runs after cleaning the contact
surfaces are plotted in Fig. 4 to establish a curve to compare
interstitial materials. To limit the degree of oxidation the
test specimens were allowed to cool in the vacuun, chamber after
a test. Then nitrogen gas was released into the bell jar to
aid in the final cooling.

mm _
18
Although the laminate type T-30LR and the WRP-X-AQ
felt seem to provide the best thermal insulation character-
istics, the effect of the insulation thickness must also be
considered. As a result_further tests with the fibre papers
and mica were conducted in Part III. However/the surface of
the silica paper in contact with the 300°F surface discolored
as if scorched due possibly to a bonding deterioration.
PART III- Detailed Study of Promising Materials
The experimental procedure was essentially the same
for all tests. First the metal test specimens were installed
and tested in a bare junction configuration and then a one-
inch diameter disk of the interstitial material was positioned
between the metal specimens. The alignment of the test column
during the evacuation of the test chamber was maintained by a
slight contact pressure. After setting the test conditions the
guard heater (Fig. i) was monitored and adjusted to maintain a
temperature difference of less than 5°F across the axial insu-
lator. The results for these tests were reported in References
2 and 3.
As noted in Part II, the initial thicknesses of the
different interstitial materials were not the same and be-
cause the thickness, _, varies with the load pressure, the
comparison of junction thermal resistance, R, for the differ-
ent materials should account for the material thickness. A
better comparison would be the thermal resistance per unit
thickness, R/g. To obtain the necessary thickness informa-
tion, compression tests were run with material samples similar
to those used for the thermal tests. The apparatus consisted
of a compression testing machine and two one-ii_ch diameter
19
aluminum rods with an attached extensometer. No deflection
was observed in the apparatus itself in an initial run to
i000 pounds. For the interstitial materials the load was
applied slowly and continuously up to 300 pounds with dial
indicator readings recorded at designated increments. The
effective compressive strain (_o " _)/6o for the interstitial
materials is illustrated in Fig. 5. Since the compressive
strain may be influenced by the initial thickness for some
materials, compression data were obtained for multilayer
samples of carbon paper and mica. These particular materials
were selected for test since the carbon paper was extremely
compressible and Fry (9! in an earlier work had observed that
the contact resistance for mica was a result of a surface
effect. One, three and six layers of carbon paper were tested.
The compression strain curves (Fig. 5) agreed within four per-
cent of one another. On the other hand, for mica in which
one_ three, and five layers were run, the compressive strain
curves were decidedly different. It was observed that the
compressive strain for the multilayers was less than a single
layer by the approximate fractional relation of one over the
number of layers. The compression curves could be explained
as a surface effect which would agree with Fry's conclusion.
Therefore, in the opposite case, the carbon paper and materi-
als of the same type should evidence a thermal resistance as
a result of the effective thermal conductivity of the material
and not a surface contact resistance.
The difficulty in discerning the temperature gradient
for the metal test specimen became extremely important in the
calculation of Q when the temperature gradient was on the order
of leF per inch. An uncertainty in the calculated values was

10o
gO
//
Data Taken atRoom Tempera tu-. 78OF re
1°'4oL.._L _
100300
Load Pressure, _ psi 400
FIGURE 5. Compression Strain CUeves

21
derived by selecting maximum and minimum temperature slopes.
To improve the technique for the low heat flux cases the
heat transfer at the junction was also calculated from an
energy balance on the heated specimens. The energy loss cal-
ibration was essentially the same whether liquid nitrogen or
water was the coolant. The differences being the temperatures
of the specimens. Power input to the heater was measured at
several different heater surface temperatures <comparable to
those encountered in the test runs> with the test specimen
contact surfaces separated slightly in the vacuum environment.
Coolant flow was maintained to obtain shield and specimen tem-
peratures close to the test values. A regulated filtered d.c.
power supply was installed for the heater and the voltage and
current were measured with a potentiometer and shunt arrange-
ment. The emissivity of the specimen surfaces was estimated
as 0.2. With the shield and specimen temperatures, the heat
transferred by radiation from the instrumented section of the
specimen to the radiation shield and from one specimen to the
other across the contact gap was estimated. Subtracting these
losses, an estimated loss for the thermocouple leads, and a
heater lead wire resistance loss from the power input gave the
energy transferred from the heater region by radiation. For
the calibration runs the guard heater was monitored closely to
maintain a temperature difference across the axial insulator
<Fig. l) of less than 3°F. Division of the resulting heat loss,
Q_, by the temperature to the fourth power difference between
the heater surface and shield yielded a radiation heat loss
coefficient for the heater section. Thus for the low heat

2_
flux runs the heat transferred at the junction
Q = Qinput - I2r " Qt " Fspecimen surface radiation 7_loss and thermocouple loss _
The uncertainty in the energy loss calculation of Q
was estimated to be from 0 _ to 0.3 Btu/hr. For an assumed
uncertainty in the temperature slope of 0.5OF per inch, the
approximate uncertainties in the heat transfer calculated by
the product of thermal conductivity and temperature gradient
are:
annealed aluminum
as received aluminum
stainless steel
3 Btu/hr
2 Btu/hr
0.3 Btu/hr
These values were estimated for the ambient temperature
specimen (70OF to 90OF).
The junction temperature difference for the high
temperature runs with the better insulating materials was
usually near 200°F. Thus the uncertainty in h would be:
annealed aluminum 5 Btu/hr ft 2 OF
as received aluminum 2 Btu/hr ft 2 OF
stainless steel O.B Btu/hr ft 2 OF
For the low temperature runs these values would be reduced
somewhat since the junction temperature difference increased
to as much as 400°F for the liquid nitrogen collant runs.
Therefore, the energy balance method is preferred for the
aluminum specimens when the temperature gradient is less than
1-1/2 °F/inch, which corresponds to an approximate value of h
of ? to 9 for the high temperature runs. Although a heat bal-
ance was performed for the stainless steel specimens the heat
_m
_ IL _ IIIII Jmimuu __ I IIII _ IT i ___.i

23
calculated from the thermal conductivity is preferred. Be-
sides improving the ability to calculate the heat transfer,
the stainless steel specimens provided a means to test the
effect of surface hardness on the junction thermal resistance
with interstitial materials. Except for wire screens this
effect appeared to be negligible.
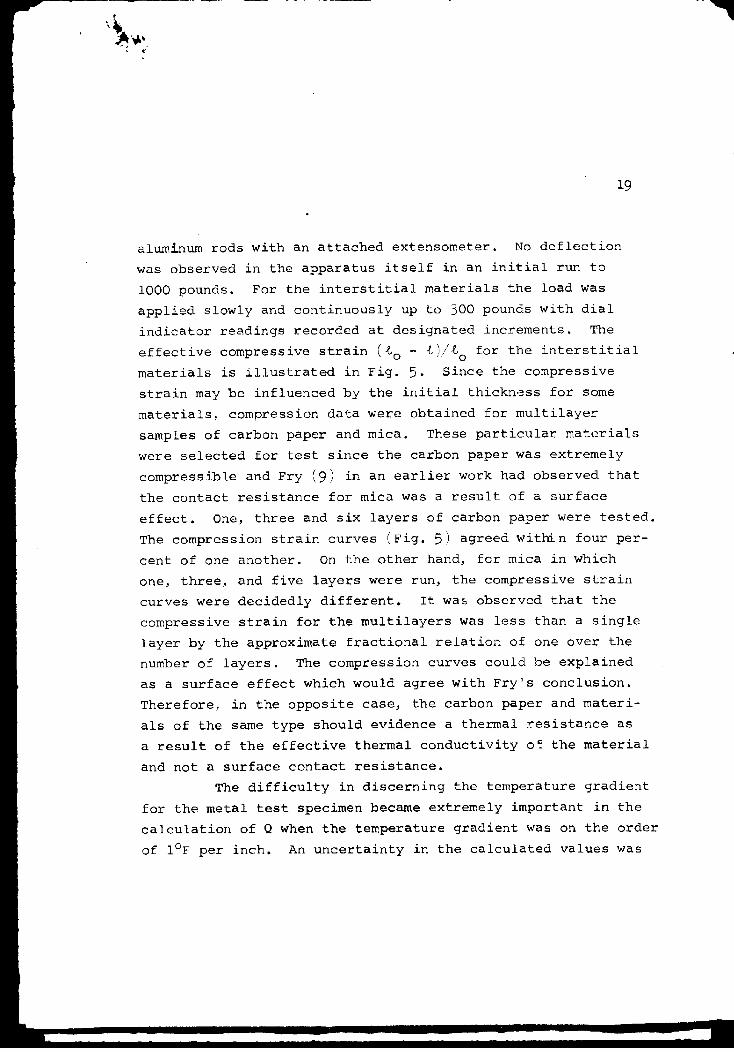
The primary purpose of a low conductance interstitial
material is to minimize the heat transfer for a given tempera-
ture difference, or Q/AT should be a minimum. If surface con-
tact effects are neglected and a linear temperature gradient
is assumed,
Q = b_AT = keA_
Thus,
k = h_e
A good thermal insulating material would therefore have a
very low value for the product hi. This is compared for all
of the materials tested as a function of pressure in Fig. 6.
The compression strain values used to calculate t were ob-
tained at room temperature, and some deviation in these values
could be expected at higher or lower temperatures depending on
the expansion or contraction of the interstitial material with
temperature. Since the sides of the disk are free, it was as-
sumed that any possible deviation can be neglected for the
comparison of materials in Fig. 6.
In some applications the insulation weight may be
important. This implies that the effective density of the
material, Pe' be a minimum. Combined equally with the ther-
Ma
Py
W 20TXTFE
AB, FI
ATSS 1O0ZI
PLTELA
C_,_4ICSIFE
lo" I I , I , I I I0 1O0 200 300 400
Load _essure, F, psi
FIGURE 6. Effective Thermal Conductivity Curves

25
mal criterion this suggests that the product
kW
ke_e ="A--
be a minimum. Since all test samples had the same cross-
sectional area_ the product hW is plotted in Fig. ?. An
Jn vacuv_ weight was obtained with a Cahn Electrobalance for
the fibre paper and laminated board materials. Since i/h is
proportional to the thermal resistance the product hW in Fig.
can be interpreted as the mass per unit thermal resistance.
Thus, this value would be a minimum for the better insulating
materials.
In any install_tion where a compressive load is ap-
plied the mechanical strength of the material must be consid-
ered. In static cases the compression strain curves (Fig. 5)
indicate the degree of compression. However_ for cyclic load
and temperature conditions the material should be subjected to
a variable load test. Carbon paper, ceramic paper and felt
were run in a cyclic load test to failure since their mechan-
ical strengths were the most questionable of the better mate-
rials indicated by Figs. 6 and 7. Silica paper was not con-
sidered due to the discoloring at higher temperatures. The
ceramic paper when cycled between i0 and 500 pounds six times
and the felt when cycled four times between i0 and 800 pounds
were found to disintegrate. On the other hand, carbon paper
which was also cycled six times between i0 and 500 pounds did
not fail but was compressed to approximately one-half of its
initial thickness.
The effect of initial compression of the sheet mate-
rials was illustrated with the WRP-X-AQ felt. First a series
of thermal tests were run with increasing load pressure to

_6
i,
o
q--
$.._=
t-_
mm
c-
(Jc-
%E
q__=
p-
m
I __ W 10
IO-2 7.._ _ LA
CE
F[CA
SI
10 -3
G
D
lo-4 , I i I I I .... i I0 100 200 300 400
Load _essure, P, psi
FIGURE 7. Mass Per Thermal Resistance Curves

_7
i000 psi, then return runs at 550 psi and i00 psi were taken.
The increases in conductance over the initial increasing load
runs were _0._ percent and 233 percent, respectively. Also
the effect of the metal specimen surface roughness was briefly
considered. The low temperature specimen surface was artifici-
ally roughened with a lathe cut to 200 U-inches. Subsequent
runs with asbestos board and carbon paper did not deviate from
the previous smooth surface results. This was expecte_ since
these particular materials demonstrate a thermal resistance
due to a bulk material resistance, i.e. %/kA, an_ not a surface
ccnnact effect. Further, for mica a small effect was observed
which would again emphasize the surface e_fect demonstrated by
mica.
As a result of the different behavior of carbon
paper and mica in the compression tests, multilayer thermal
tests of these materials were conducted. Five layers of mica
(overall 0.01Z_ inches_ and six layers of carbon paper !over-
all 0°_0 inehes_ were run at load press_!res of i00 psi and
_00 psi. Within the experimental uncertainty the product_ h%,
for carbon paper for the single layer and the six-layer tests
. a constant value at a given pressurewas constant, i e k e
In contrast to this the same comparison for mica indicates that
the product, hL, increases with the number of layers which
again suggests that a surface contact resistance effect is pre-
dominant for mica.
Since the heat transferred between metal surfaces is
significantly influenced by small variations in the contact
area. the insulating effect of a geometric resistance is
obvious Perforated sheets, roughened or corrugated surfaces.
or wire screens represent such materials. Three different

_8
wire screen materials were tested; tungsten, W, titanium, Ti,
and stainless steel, SS, Results for these tests are included
in Figs. 6 and Z with the mesh size denoted as i0, 20, or
100/inch. It can be assumed that contacts with the bounding
metal surfaces of the junction gap occur at the points where
the wire weave of the screen overlap. For a i00 mesh screen
there would be approximately 104 contacts per square inch but
for a l0 mesh size only i0 _ contacts per square inch. Thus
the larger thermal resistance of a i0 mesh screen over that
for a i00 mesh screen would be expected. However_ the wire
diameter is reduced with increased mesh size_ hence a smaller
area per contact. For this reason Table 3 was presented to
compare the thermal resistance per contact for the runs with
the aluminum specimens. Several runs with stainless steel
screens and stainless steel specimens were added in Part IV.
As a result of the earlier comparison testsj the
seven materials which had the lowest h values (Fig. 3) were
rerun with specimen sets 3 and 4 (Table 2 to check the re-
peatability of the experimental results. The repeat runs
were conducted for both the high and low 3unction tempera-
tures and the calculated h values agreed closely with the
comparative runs except for mica. The second series of runs
for mica were approximate].y _0 percent lower than the compara-
tive test series. The test samples were obtained from a local
heater manufacturer and were considered an economy grade.
Areas of discoloration were visible in the mica sample. These
were either black-gray or reddish-brown in color and indicate
the presence of impurities such as silicon or iron oxides.
Another t_st sample from the same batch of mica sheets with a
black-gray instead of the reddish-brown discoleration was

RUNNO.
2-ssi0-16
2-SSI0-I?
2-ss10-18
3-sslo-23
3-SSlo-24
l-ss100-57
i-ssi00-58
i-ssi00-59
I-TII0-60
I-TIIO-_!
I-TII0-62
I-W20-64
I-W20-65
1-W20-66
6-SSI00-43
6-ssI0-45
7-ssi00-49
7-ssi00-50
7-SSLO-51
7-ssi0-52
7-ssi00-53
7-ssi00-54
7-SSlOo-55
7-ssi0-56
7-SSLO-57
TABLE 3
TABULATED EXPERIMENTAL DATAFOR WIRE SCREEN
WIRE DIA.Tm LOAD/CONTACT
in. oF 'lb.
0.025 192 1.32 x i0 o
0.025 190 1.92 x i0 °
0.025 191 2.79 x i0°
0.025 -106 1.04 x i0o
0.025 -104 2.99 x i0°
0.004 216 0.96 x i0 -_
0.004 220 1.87 x i0 -_
0.004 229 2.77 x i0 -a
0.025 195 1.02 x i0o
0.025 192 1.86 x i0 °
0.025 189 2.75 x i0 o
L;.OO7 218 0.25 x i0 -I
0.007 229 0.47 x i0 -_
0.007 246 0.69 x i0 -l
0.004 249 1.04 x 10 -2
0.025 234 1.03 x i0o
0.004 -35 1.09 x 10 -2
0.004 -17 3.04 x 10 -2
0.025 -66 1.06 x i0o
0.025 -53 3.05 x i0o
0.004 293 1.05 x 10⁻²
0.004 236 1.00 x 10⁻²
0.004 254 3.04 × !0-2
0.025 217 1.03 × i0 o
0.025 219 3.07 x I0 °
RESISTANCE/CONTACT
Hr °F/Btu
8.32 x 10²
7.39 x 10²
6.02 x i0_
1.95 x I0 _
i.13 x 103
2.23 x 10⁴
1.60 x 10⁴
1.56 x iO4
13.45 x i0_
8.83 x i0_
6.58 x iO2
4.88 x lO2
3.79 x I02
3.10 x 10²
4.49 x 10⁴
19.46 x I0a
6.56 × 10⁴
3.12 x 10⁴
23.i5 x 102
14.02 × I0m
4.39 × iO4
4.39 x 10⁴
_.k5 X 10 4
20.51 x i02
11.25 x i0 m
_9
3O
tested. In this third run at i00 psi the h value was increased
to 83 percent of the first run. After cleaning the aluminum
specimen surfaces another mica sample of the same type was re-
run at i00 psi and the resulting h value for this fourth sun
was 95 percent of the initial value. Although the low h values
for the second run series could be somewhat attributed to con-
tamination of the aluminum surfaces, it seemed more likely that
the differences in the mica samples and perhaps possible mis-
alignment of the test column were more probable reasons. To
avoid a problem of variations in the test samples a clear grade
of mica (optically clear) was used in all remaining tests with
mica including those in Parts IV and V.
In summary, based on the criteria of low conductance
and minimum weight the carbon paper proved to be the better ma-
terial. However, if mechanical strength is of primary impor
tance_ wire screens should be considered. The highly compres-
sible materials such as carbon paper demonstrate a thermai
resistance which is a function of the bulk material resistance
(t/kA); whereas_ harder surface materials such as mica evidence
a strong dependence on a surface contact effech.

_J
CHAPTER III
INTERSTITIAL MATERIAL AND MULTILAYER TESTS
The test results for the additional interstitial
material and bare junction runs which were conducted during
Part IV are listed in Appendix A. The test runs were desig-
nated by several symbols to specify the metal test specimen
set, the interstitial material_ and the run number in chron-
ological order for a particular specimen set. For examples,
run 7-MICP-7 refers to the seventh run with specimen set 7 and
a single layer of perforated clear grade mica, and 6-SSI00L-44
iz the 44th run with set 6 and two layers of i00 mesh stainless
steel screen. The screens were oriented at 45 degrees to one
another for the two layer tests.
Comparative tests for textolite, pyrotex and TFE
teflon sheets were run in preparation for their possible use
as bolt insulating materials in Part V. The supplier, manu-
facturer's data and initial thicknesses of materials for the
thermal tests are listed in Table i. The effective thermal
conductivities, ht_ are plotted for comparison with the other
materials in Fig. 6. Although the magnitudes of ht are rel-
atively targe for all three materials the teflon and pyrotex
demonstrate the desirable feature of a small dependence of
h on the load pressure, for the range i00 to 300 psi. Re-
peat runs with textolite and teflon agreed very closely ex-
cept for run 7-TX_. Test samples for textolite_ which is
a hard glass laminated sheet, had to be cut on a mill. With-
out extreme care and a sharp cutting tool the edges break
apart slightly. Some evidence of this existed with the sample
for run 7-TX_44. Another sample was carefully machined to
avoid this problem and the results of 7-TX-_ 5 and -46 agree

32
more closely with the initial runs 6-TX-31 and -32. Dis-
agreement at the lower pressures could be attributed to the
surface effect which is reduced with increased load pressure.
Thus it can be concluded that the thermal resistance of tex-
tolite is a combination of surface contact and bulk material
effects. In earlier tests with teflon (2), indicated by the
symbol TE in Fig. 6, a 0.0028 inch thick sheet of FEP teflon
was used. In Part IV the interest was to test materials of
greater thickness for application in Part V. Unfortunately
the vacuum balance was not available so the weights in air
were used to calculate hW for Fig. 7. On a weight basis these
materials are comparable to the wire screens.
In an earlier study (i0) it was found that dusting
contacting stainless steel surfaces with manganese dioxide
powder resulted in a large increase in the thermal resistance
over that for the bare surfaces. Thus, as another comparison,
a very thin layer of rutile powder was placed on the stainless
steel specimen surfaces. To provide a more definitive measure
of the powder, it was separated between 0.0024 inch and 0.0017
inch sieves. Approximately a single grain thickness layer was
spread on the specimen surfacej this powder was then collected
and weighed (0.15 grams). The same weight of powder was then
placed on the specimen surface for testing. The powder is
crushed into a layer with increased loads with a resulting
large increase in h. Bare junction runs were intermixed with
the material runs to test for variations in the metal test
specimen surfaces. Run 6-BJ-38 followed the rutile powder
tests. The surfaces were wiped clean but the approximate 30
percent reduction in h can be directly attributed to the con-

33
tamination of the surface by the two previous runs with rutile
powder. Thus dusting of the surfaces can easily produce size-
able variations in the junction thermal resistance.
The multilayer test results for mica in Part III
had shown that the thermal conductance was greatly dependent
upon a surface contact effect. To demonstrate the dependence,
tests with one, two, and three layers of mica were conducted.
The results for these tests along with the data for five layer
tests which were reported in Reference 3 are graphed in Fig. 8.
A linear dependence of h on the load pressure seems evident.
The repeated runs generally agree within the experimental un-
certainty except for the two layer case at i00 psi. At any
particular pressure each test point was obtained for a new test
sample. Since the thermal resistance for mica is a function of
the surface contact, the most probable reason for this disagree-
ment is the possibility of changes in the surface conditions of
the mica layers and the metal specimens. Run ?-MIC2-3? is a re-
turn pressure test point for the same test sample as run
7-MIC2-35. Also run ?-MIC3-_I is a repeat of 7-MIC3-39. For
.both cases nearly the same values of h were obtained (Appendix
A). Thus a precompression of the test sample does not seem to
materially affect the thermal conductance.
The junction thermal resistance can be defined as,
R=I/hA
The values for I/h-RA and _ for the multilayer tests were
calculated and plotted in Fig. 8 for 100 and 300 psi loads.
A value for 6 was found from the compression strain curves
(Fig. 5) and the measured initial thicknesses of the test
samples. As a simplified analogy for these curves the total

34
mm
i,o
_=
(3"U_
e-
e,JOp..
X
e-
12
J I00 psi,
300 psi
, I i I , I i I , Iu 4 8 312 16 20
Thickness x I0 , l, in
i,o
C}"
l=e-
4_JC_
t--
60 j IL
40
3L
2O! . 5L
0 i I i I i I0 I00 200 30O
Load Pressure, P, psi
FIGURE 8. Multilayer Mica Test Results

35
junction resistance can be supposed to be a sum of the con-
tact resistance between the mica and the metal specimen, RC J
the contact resistance between the mica layers, RM, and a
bulk material resistance of I/kA.
R = 2R c + (n-l) R M + k--A
where n represents the number of layers. If each layer is
of the same thickness tl then, _ = nil. At a constant pres-
sure and temperature 6 1 and k wot_id remain constant, therefore,
A 1
i/h _ A(2_c-RM) ÷ (ZI _ + _)_
Futher, for these conditions R c and R M would be constant.
A linear function of this type is indicated by Fig. 8. The
decrease in the slope with pressure can be explained as a
reduction in RM and an increase in k for layer compressive
loads.
Variable thickness samples of laminate T-30LR were
tested to compare the results to a multilayer sample of the
same initial thickness and weight. The calculated value of
i/h is plotted versus the calculated compressed thickness in
Fig. 9. A linear function is shown for the same reason as
just described for the multilayer mica tests. In this case_
however, an intermediate contact resistance was not present
except for the three 1/16 inch layer run. Thus, the slope
provides a measure of i/k for laminate compressed to i00 psi.
The three layer sample increased the thermal resistance by
50 percent over that for a continuous piece of the same thick-
ness. The value for the nominal 1/4 inch sample was approx-
imately 0.14 hr ft 2 °F/Btu greater than the linear curve
36
i,o
4-
e-
e-
_.)
cO
u_
E
(--
F--
1.00
0.80
0.60
0.40
O.20
©[]
<>/k
1/16 inch thick disk
2/16 inch thick disk
3/16 inch thick disk
4/16 inch thick disk
3-1/16 inch thick disk
0 isi
i I i L , I i I u
0.06 0.12 0.18 0.24
Thickness, £, in
FIGURE 9. Laminate Variable Thickness Results

37
would predict. Laminate is a hard laminated board and the
test samples were machined from a sheet approximatell, 5/15
inch thick. The major laminations, which form the sheet, are
about 1/16 inch thick. After the test run with the i/'_ inch
sample one of these laminations was found to have separated.
Thus, an internal contacting surface was present during the
test. From the three layer result the increase in thermal
resistance due to two intermediate contacts is 0.22 hr ft _ OF/
Btu, one-half of which is very nearly equal to the increase
noted for the 1/4 inch sample.
Since wire screens are capable of withstanding
large compressive loads, additional runs with stainless steel
screens against the stainless steel surfaces were conducted.
The effective values of the junction thermal resistance, i/h
are illustrated in Fig. i0 to compare the different wire screens
and test specimen materials. All of the data are for the higher
junction temperature runs. Data for the aluminum surfaces de-
noted as a -AL in the figure were reported in Reference 3.
The thermal resistance for carbon paper (CP) is also included
for comparison. As shown the thermal insulation of contacting
stainless steel surfaces can be accomplished as well with i0
mesh paper. However the load bearing capacity of the screen
is superior to the carbon paper. Slight indentations were
noeiced in the stainless steel specimen surfaces after the
test runs with I0 mesh wire screens. The same type of inden-
tations were quite noticeable in the aluminum surfaces. There-
fore part of the increase in thermal resistance for stainless
steel surfaces can be attributed to a reduction in the contact
area, but the primary effect seems to be the large decrease in
thermal conductivity, a factor of i0 from aluminum to stainless

W
38
I_=0
C_J
4--
I0 °
High Temperature Runs
!0 -1
CP
SSIO-SSm
SSIO-AL
- TIIO-AL
10 "2
10 -3
n
m
m
SSIO0-SS
SSI O0-AL
W20-AL
I I J I , ! , II O0 200 200 300
Load Pressure, P, psi
FIGURE I0, Thermal Resistance of Wire Screens

39
steel. These same factors can be applied to the 20 mesh
tungsten screen. For the range of load pressures from 100
to 300 psi the data indicate an exponential decrease in the
thermal resistance for wire screens. In Table 3 the load
per contact is
PL =c _z
where M is mesh size, and the thermal resistance per contact
is
M 2R -c
It is assumed that the contacts occur at the points where the
wire weave overlays and that the resulting contacts are in
parallel. The increased thermal resistance for lower thermal
conductivity wire, smaller wire diameter, lower temperatures,
and stainless steel surfaces are apparent.
The effects of reducing the contact area by perforating
layers of mica and 0.001 inch stainless steel shim are shown by
runs _-MICP-39 and -40, 7-MICP_7, and 6-SH-_l and -42. Approxi-
mately 25 percent of the area was removed with a No. 45 drill.
The disk was divided into three equal area segments and the same
number of holes were drilled in each region. The lower value of
h for run 6-MICP-39 as compared with run 7-MICP-7 may be a re-
sult of the same difficulty encountered for the bare junction
run 6-BJ-58. The possible surface contamination with rutile
powder could have an effect on the contact resistance for mica.
Another very possible explanation could be the presence of rough
edges left by the drilling operation. Nevertheless a reduction
of at least 40 percent in the magnitude of h at i00 psi can be
obtained by the area reduction. On the other hand, the reduc-
tion in area for the stainless steel shim seems to have had
almost a negligible effect.

40
Several multilayer tests with two layers of mica
and a variable intermediate material were performed at a load
pressure of i00 psi _Table A-2), For reference an excerpt of
the experimental results is given in Table 4.
TABLE
COMPARISON OF MULTILAYER COMBINATIONS
Run
Z-MIC3-10
7-MIC3-10
7-MIC3-39
7-MZC3-41
z MICe -28" SH
MICe -e9"SHP
MIC2 -30"MICP
MICe -31""MICP
MIC2 _SSIO0 -_z
MIC2 _.MS100 -_
Intermediate Material
Mica
Mica
Mica
Mica
0.001S,S. shim
0.001S.S. shim (75% areal
Mica _754 area)
Mica (75% area)
i00 mesh S.S. screen
i00 mesh S.S. screen
h
Btu/hr ft 2 OF
i5.8
14.4
13.6
13.5
14.8
9.3
12.6
i_ .8
9.0
ll.1
all runs at i00 psi load pressure
average mean temperature, 245°F
* initially compressed to 800 psi
7

The effect of a stainless steel shim is approximately the same
as a layer of mica. Also, perforation of the shim has a notice-
able effect but a 25 percent area reduction with an intermediate
layer of mica has a lesser influence. Therefore, it could be
surmised that the surface contact resistance between mica sur-
faces is somewhat smaller than between mica and a stainless
steel surface. Insertion of a i00 mesh stainless steel screen
reduces the thermal conductance to one-half of that obtained
with two layers of screen oriented at 45 degrees to one another
IRun 6-SSI00L-_4>. The pre-compression to 800 psi has a small
effect except for the stainless steel screen which penetrates
the mica layers.

f
CHAPTER IV
INSULATION OF FLANGE JOINTS
TWO antenna assembly bolted flange joint configura-
tions were selected to test with interstitial insulating mate-
rials. In a typical application the upper flange <Figures 1!
and 121 would be attached to a relatively large surface. There-
fore the base flange was constructed somewhat larger than the
upper flange to provide a closer simulation of the actual instal-
lation. The flanges were machined from aluminum 6061 stock. In
the vacuum chamber the flange sections were fastened to one-inch
diameter metal support rods which were instrumented with three
centerline {i/2 inch apart} and two surface thermocouples for
the purpose of calculating the heat transfer. The installation
of the thermocouples was accomplished in the same manner as the
metal test specimens used for the interstitial material tests.
For both flanges the ends of the one-inch diameter shank were
cut down to a smaller diameter and inserted into a cylindrical
cavity drilled into the end of the respective support rod. They
were fastened into position by set screws. The mating surfaces
were coated with a mixture of aluminum powder and vacuum grease
to reduce the thermal resistance between the support rod and
the flange. One support rod was threaded into the he_t sink
IFig.131 and the other was machined with an enlarge_ diameter
(1-1/2 inch} at one end to which the band heater was fastened.
The other details of the support rods and radiation shields
were the same as for the metal test specimens used in the
earlier tests.

I -J
43
-f-_f2.350"Q+ D
1,000"Dia
UPPER FLANGE
3.000"
©
0
l. 5o_
1.000"Dia _/
J_---0. 500"
BASE FLANGE
FIGURE II. Two Bolt Flange Joint

W
44
l .000"Dia --_
•- 1. 620"-_ __,, 1,000"1,,.__
T2.3i0'-
m 0.125,,
UPPER FLANGE
3.000"
1
_- 2.000" --_
0 0I
--.T ÷ -.r.----%
ot'o_
1.000"Dia
j_4//'--O. 500"
_
BASE FLANGE
F[GURE 12. Four Bolt Flange

i
45
Bell Jar
I SupportPlate
Nitrogen
Load
Bellows|
lleat
Sink
Specimen
l!eat
Source
I-]Base Plate
_ V_ I'i"i i
D
j/ t/
Figure 13. Schemltic Diagram of the Fla_2e Joint Instailatl_

46
To meas_re the heat transfer rate over a wide range
of magnitudes the instrumented support rods were constructed
from armco iron and stainless steel 30_. For the uninsulated
flange higher heat flux _ the armco iron set of heat metering
rods were installed and for low heat flux runs the stainless
steel set was substituted. Two holes, one on either side of
the flange shank, were drilled iNo. 56 drill_ from the back
face of the flange to within 0.005 inch of the mating surfaces.
Copper-constantan thermocouples were inserted to obtain some
measure of the temperature difference across the flange junc-
tion. The two thermocouples on e_ch flange agreed within
2°F of one another for all of the test runs. The average of
these readings was taken as the flange temperature and subse-
quent values of the temperature difference AT and the mean
temperature Tm were calculated Tables A-3 and A-4 in Appen-
dix A!. The heat transfer rates were calculated by the product
of the thermal conductivity and temperature gradients for the
heat metering support rods. In the table of results QH refers
to the heated side and QC to the cooled side of the flange in-
stallation. Run numbers specify the flange test set, whether
two bolt or four bolt, and the chronological run number. For
an example, 2-2BT-4 is the second two bolt flange set upper
flange and base flange_ and the fourth run with this set.
Various combinations of bolt and flange face insulations were
tested for comparison with the two bolt flange configuration.
Following these runs, carbon paper and i00 mesh stainless steel
screen insulations were tested with the four bolt flange. The
symbols in Tables A-5 and A-_ used to describe the type of
insulation are defined in Table i. The uninsulated case is
denoted as BJ. With the exception of the textolite, pyrotex,

47
and teflon bolt insulating washers listed in Table A-3 all
insulating materials were the same thickness as the samples
for the earlier interstitial material tests. Face insulating
layers were cut to fit the upper flange surfaces, except the
center portion of the intermediate layer of stainless steel
shim in runs I-2BT-23 and -24 was removed.
The first seven runs listed in Table A-5 (l-2Bt-i
through i-2BT-Z) were preliminary performance runs. Bolt
torque was 15 in-lb and for runs 2 and _ of the series_ an
additional axial load of i00 psi was applied. The cooling
fluid was water for all runs with the two bolt flange with
the exception of runs i, 2_ 6 and Z for this series, during
which liquid nitrogen was the coolant.
In order to compare the performance of different
insulation combinations an effective thermal conductance
Q/AT was defined for the flange tests. This parameter is
plotted versus T in Figures 14 and 15. The two uninsulatedm
run series_ I-2BT-8 through -ii and 2-BT_I through J4, are
compared in Figure i_. Even though the bolt torque was greater
for set 2, 25 in-lbs as compared with 15 in-lbs, the thermal
conductance is much less than for set i. Some surface varia-
tion could be encountered from the machining operation, a mill
cut, but in addition set 1 was run through the preliminary
tests so the surface contact may have been improved. After
run i! the bolt attachment holes in the upper flange of set 1
were chamfered at 45 degrees and insulating washers of texto-
lite, pyrotex, and teflon were machined to fit the chamfer.
The threaded portion of the bolt, near the bolt head, was cut
down to avoid contact with the upper flange and the bolts were
threaded into the base flange. Test results for the comparison

48
I
I I
_ _ Z Z m
I I _ _ 0°
__._
_ _ m m M
E
00
0 _-
cN
,]
t_O
0
0
0
0
_y
0
J
D_

,,el ,..,-'-I 0
!
-,'4
q,_
X
r_
!
r_
0
J
t i I i I I I
0
.,D
L_
I,.,,. ,.,I
m
Q,. o'3
£)
I
m L,_
%
£..
o
C,,.I E .4_1---
0q--
c"
0
%
49

f
5O
runs I-2BT-12 through I-2BT-16 in Table A-3 are also included
in Fig. 14. Although insulation of the bolts has a very no-
ticeable effect the insulation of the flange face with a single
layer of carbon paper reduces the effective thermal conductance
by a factor of from 2-1/2 to 5 over the uninsulated case. The
values of QH/_T and Qc/_T are indicated by the bands plotted
in Figure 14. With both bolt and face insulation the conduc-
tance was reduced to 0.05 and 0.08 Btu/hr GF. The remainder of
the runs with the two bolt flange configuration were conducted
to test several different insulation combinations. The calcu-
lated conductance for these tests are tabulated in Table 5.
TABLE 5
TWO BOLT F_ANGE COMPARISON
Run Q_/AT Q_/_T Insulation Bolt torque, in-lbsNumber Btu_hr°F Btu/_hr°F Face Bolt Initial Final
I-2BT-17 0.17 0.12 CP TX 50 20
I-2BT-18 0.12 0.08 CP PI 25 i0
I-2BT-19 0.23 0.1Z CP PI 50 32
I-2BT-20 0.16 0.12 CP TFE 25 5
I-2BT-21 0.26 0.20 CP TFE 25 12
I-2BT-22 0.28 0.21 CP TFE _0 25
MIC2 TFE 25 5I-2BT-23 0.73 0.55 SH
I-2BT-24 0.31 0.2J_ MIC2 TFE 50 --
SH

51
TABLE5 Cont'd.
QHAT QCAT Insulation Bolt torque, in-lbsNumber Btuj hr°F Btuj hrCF Face Bo]t Initial Fir_al
I-2BT-25 0.42 0.32 SI TFE _95 5 *
MIC 25 15 *2-2BT-8 0.33 0.25 CP SH
2-2BT-9 0.17 O. 12 CP TX 25 i0
SH2-2BT-10 0.33 0.26 CP SSI00 25 15
SH 25 i02-2BT-II 0.37 0.28 TX ZSI00
2-2BT-12 0.74 0.58 SSI00 SHSS I00 25 --
SH 25 i02-2BT-13 0.94 0.6Z SSl00 SSI00
SH 25 --2-2ET-I_ 0.98 O.yY ssi00 ssi00
_Axial load of 500 psi applied before setting torque
From Table 5 the decrease in thermal conductance
for all of the insulation combinations over that for the unin-
sulated case is evident. However the carbon would be the bet-
ter choice for a flange face insulating material and the cham-
fered insulating washers for the bolt. The bolt breaking
torque was checked after each run. These values are listed
in Table 5 as the final bolt torque. For runs with insulat-
ing materials the bolt torque was reduced considerably as a
consequence of the thermal stresses encountered during the test
runs. This particular problem can be alleviated by several
means. For example, the material can be pre-stressed and

TABLE A-2 (Cont'd.)
62
Run P T AT hm
Psi OF OF Btu/hr sq ft OF
Special Multi-Layer Test (Cont'd.)
MIC2 _^ 104 241 193.5 12.6-MICP'D u
MIC2*.. 104 240 193.9 12.8"MICP'J _
MIC2 42-SSl00-_ 103 241 221.6 8.95
7.MIC2* _SSl00 JJ 102 23_ 198.9 ii. 1
* Material initially compressed to 800 psi

52
tension washers can be added. These solutions were tested
with the four bolt flange with the result of no measurable
decrease in torque. Also the bolt material could be the same
as the flange and threaded insulating inserts could be in-
stalled in tLe base.
Vibration tests were run with two insulating com-
binations for the two bolt flange. In both cases the face
insulation was a single layer of carbon paper and a chamfered
washer, one textolite and the other teflon. The flanges were
attached to a shaker table in a vertical position and the os-
cillation frequency was varied slowly from zero to 2000 cps
over a period of two minutes. An initial bolt torque of 25\
in-lbs was applied in both cases. In each case the break_g
tr)rque was reduced to 15 and _0 in-lbs for the two bolt_ _.
Similar tests were performed for the four bolt flange, then
without disturbing the torque, a thermal test was rerun.
These test points are indicated in Figure 15. After the
thermal test the final bolt torque was checked and in all
cases for the four bolt flange there was no reduction in
the bolt torque.
The effective junction thermal conductance for
the four bolt flange configuration is illustrated in Fig. 15.
The uninsulated tests were run with a bolt torque of 25 in-lbs,
all other with 15 in-lbs. Before run I_4BT-4 and run 1-4BT-9
the flange and insulation were compressed by a 1000-pound load
applied in a tensile testing machine. For run I-4BT-8 the
torque was initially set to I00 in-lbs and then reset to
15 in-lbs for the thermal test. From Fig. 15 the carbon
paper insulation demonstrates a very desireable trait of
small thermal conductance which is essentially unaffected
by the mean temperature.

CHAPTER V
SUMM_RY
The thermal insulation characteristics of the
interstitial materials listed in Table 1 were investigated.
Experimental results are reported herein and in pl-evious re-
ports (i, 2 and 3). Selection criteria on the bases of mate-
rial thickness, hi (Fig. 6) and weight, hW (Fig. 71 were pro-
posed. With these comparisons and the additional test of
compression under a large cyclic load, the carbon paper was
selected as the better material. Geometric resistances, such
as wire screen or multilayer configurations, should be consid-
ered if mechanical strength is of primary importance. The
junction thermal resistance with an interstitial material was
found to be a function of the contact surface and the thermal
resistance of the material (t/kA). Some materials, notably
mica, evidence a strong dependence on the surface contact ef-
fect. However, other materials such as carbon paper depend
solely on the mater_al resistance. The insulation of aluminum
surfaces with wire screen can be measurably improved by sep-
arating the screen from the surface with a stainless steel
shim. Dusting the mating surfaces with a powder, although
difficult to control, will also improve the thermal isolation.
Some materials offer the advantage , for prediction purposes,
of a small dependence of hi on load pressure (Fig. 61. Several
examples are pyrotex, asbestos board, and TFE teflon.
The insulation of bolted flange joints can be ef-
fectively accomplished by a single layer of carbon paper in-
serted between the mating surfaces and by textolite bolt
I

?
5_¢
insulating washers (Fig. 14). A difficulty which can be en-
countered is the reduction in bolt torque_ hence the mechan-
ical strength of the joint by compression of the insulating
materials as a result of thermal stress or vibration. Pre-
compression of the insulated joint and the use of tension
washers proved to be a satisfactory solution. The initial
compression of a joint insulated with wire screen has the ad-
ditional advantage that the contact area would not change ap-
preciably with load.
Further study should be directed to the consid-
eration of new materials and to methods for predicting the
experimentally derived values. The present investigation
only touched upon possible geometric and multilayer configu-
rations and the use of powders. Thus many variations in test
conditions, contact surfaces, joint configurations, etc. should
be considered.

B IBLIOGRAPHY
io
• 3.
Smuda, P. A., L. S. Fletcher, and D. A. Gyorog. "Heat
Transfer between Surfaces in Contact: The Effect _f
Low Conductance Interstitial Materials; Part _: Ex-
perimental Verification of NASA Test Apparatus", NASA
CR 73122, June, 1967.
Fletcher, Leroy S., Paul A. Smuda, and Donald A. Gyorog.
"Thermal Contact Resistance of Selected Low Conductance
Interstitial Materials", AIAA Paper No. 68-31, Janu-
ary, 1968.
Sl]uda, P. A. and D. A. Gyorog. "Heat Transfer Between Sur-
faces in Contact: The Effect of Low Conductance Inter-
stitial Materials: Part III: Comparison of the Effec-
tive Thermal Insulation for Interstitial Materials
Under Compressive Loads", Arizcna State university,
Mechanical Engineering Department, ME-TR-033-3,
August, 1968.
o Abbott, Rudolph Edward. "Experimental Facilities for
Investigating Thermal Contact Conductance in a
Vacuum Environment". Unpublished Master's report,
Arizona State University (Department of Mechanical
Engineering), Tempe, 1967.
. Eldridge, E. A. and H. W. Deem (eds.). "Report on Physical
Properties of Metals and Alloys from Cryogenic to
Elevated Temperatures", ASTM Special Technical Publica-
tion No. 296, April, 1961.

o
7,
o
a
i0.
56
BIBLIOGRAPHY (Cont'd.)
Aluminum Company of America, Alcoa Research Laboratories.
Through personal correspondence with C. R. Copper-
smith, Manager of the Phoenix Office, June, 1968.
Goldsmith, A., T. E. Waterman, and H. G. Hirschkorn. Hand-
book of Thermophysical Properties of Solid Materials, Vol. 2,
New York: Pergamon Press, 1961.
Touloukian, Y. S. <ed.). Metallic Elements and their Alloys,
Vol. I. Lafayette, Indiana: Thermophysical Properties
Research Center, Purdue university, 1966.
Fry, E.M. "Measurements of Contact Coefficients of Thermal
Conductance", AIAA Paper No. 65-662, September, 1966.
Mikesell, R. P. and R. B. Scott. "Heat Conduction through
Insulating Supports in Very Low Temperature Equipment",
Journal of Research of the National Bureau of Standards_
57: 371-379, December, 1956.
I

APPENDIX A
EXPERIMENTAL DATA

58,i:!
,ii
TABLE A-I
TABULATED EXPERIMENTAL RESULTS
BARE JUNCTION SERIES
Run P T &Tm
Psi OF OF
h
Btu/hr sq ft OF
6-BJ-35 i00 257 55.6
6-BJ-38 91 e59 73.6
6-BJ-47 105 26_ 74.6
7-BJ-I 105 327 91.8
7-BJ-2 308 359 L7.4
7-BJ-3 104 298 82.0
7-BJ-4 310 310 15. 3
7-BJ-5 105 296 80.6
7-BJ-20 106 324 90.5
7-BJ-2i 209 345 29.9
7 -BJ-22 305 376 21.7
7-BJ-24 105 326 79.3
7-BJ-42 105 277 77.5
93.8
69.3
64.4
54.5
381
65.6
457
68.7
57.6
,'-.I.'.2
347
67.4
64.9
ff

59
TABLE A-2
TABULATED EXPERIMENTAL RESULTS
INTERSTITIAL MATERIALS
Run P T _T hm
Psi oF OF Btu/hr sq ft OF
Carbon Paper
6-CA-30 319 2 ii 172.1 9.98
Textolite
6-TX-31 i04 247 165.3 18.8
6-TX-32 314 247 122.1 32.O
7-TX-44 103 244 223.0 8.83
7-TX-45 I04 239 131.4 24.o
7-TX-46 306 236 103.8 33.9
Pyrotex 23 RPD
6-PI-33 94 248 203.1 12.2
6-P1-34 310 249 196.7 13.8
Rutile Powder
6-RP-36 91 237 139.1 22.5
6-RP-37 310 237 96.1 47.8
Mica
6-MICP-39 i01 240 195.9 12.3
6-MICP-40 307 243 170.2 17.6
7-MIC-6 103 255 119.9 30.1
7-MICP-7 103 236 147.9 17.7
7-MIC2-9 i00 253 166.3 17.2

TABLE A-2 (Cont'd.)
Run P T AT hm
Psi OF OF Btu/hr sq ft OF
Mica (Cont'd.)
7-MIC3-10 103 241 162.0 15.8
7-MIC2 -26 104 256 136.0 23.4
7-MIC3-27 106 254 190.7 14.4
7-MIC2-34 20 239 230.6 7.88
7-MIC2 "35 105 254 190.3 15.02
7-MIC2 -36 306 262 123.0 34.8
7-MIC2-37 105 252 190.1 15.3
7-MIC3-38 23 233 236.5 6.71
7-_IC3-39 106 244 195.6 13.6
7-MIC3-40 306 258 143. i 27.3
7-MIC3-41 i02 244 194.8 13.5
Stainless Steel Shim -- .001 inch
6-SH-41 103 252 77.5 59.5
6-SHP-42 103 249 76.8 56.9
Stainless Steel Screen -- i00 Mesh
6-SS i00-43 104 249 118.5 32.1
6-SSI00L-44 103 251 165. i 18.7
7-ss 100-49 i0o -35 162.0 21.9
7-SS i00-50 304 -17 100.8 46.2
7-SS I00-53 105 293 77.6 32.8
7-SS i00-54 i00 236 i12.2 32.8
7-SSI00-55 304 254 77.9 64. i
60

TABLE A-2 (Cont'd.)
Run P T AT hm
Psi OF OF Btu/hr sq ft OF
Stainless Steel Screen -- i0 Mesh
6-ss10-45 103 234 218.2 7.40
6-SS101-46 104 217 221.8 5.07
7-SS]0-5i 106 -66 280.8 6.22
7-Ssi0-52 305 -53 236.5 10.3
7-SSI0-56 103 217 215.6 7.02
7-SSI0-57 307 219 174.6 12.8
Laminate T-30LR
7-LA1/16-11 107 218 215.1 5.04
7-LA2/16-12 108 2 13 232.3 2.90
7-LA2/16"-13 106 213 233. i 2.90
7-LA3/16--14 104 204 227.4 2.25
7-LA3/16 _-15 105 203 222.8 2.61
7-LA4/16-16 106 197 229.7 i. 38
7-LA4/16*-17 113 200 236.0 1.35
7-LA3-18 102 206 2%8.5 i.42
7-LA3*-19 i04 205 241.5 i.82
Teflon-TFE
7-TFE-25 106 286 135.7 28.5
7-TFE-#7 104 243 121.6 28.8
7-TFE-48 306 246 123.6 29.9
Special Multi-Layer Test
,, MIC2.28 102 251 188.5 14 8I SH
MIC2"SHP -29 104 256 238.9 9.33
61
* Material initially compressed to 800 psi

TABLE A-2 (Cont'd.)
62
Run P T dT hm
Psi OF oF Btu/hr sq ft OF
Special Multi-Layer Test (Cont'd.)
MIC2 _^ 104 241 193.5 12 6"MICP-_ u
7MIC2 _-MICP-31 104 240 193.9 12.8
MIC2 _2 103 241 221.6 8.95"SSl00"_
7 MIC2_ -- 102 234 198.9 Ii. 1"SSI00"55
* Material initially compressed to 800 psi

63
5
Run
TABLE A- 3
TABULATED EXPERIMENTAL RESULTS
TWO BOLT FLANGE
T m _T QH QC
OF OF Btu/hr Btu/hr
L-2BT-I -39 24.3 88.3 91.0
1-2BT-2 -28 14.8 86. # 90.5
1-2BT-3 333 4.8 83.3 ?2.6
I-2BT-4 28? 3.3 85.6 ?9.5
I-_BT-5 304 ?. 9 78. ? 70.3
I-2BT-6 9 18.3 84.5 84.9
I-2BT-7 277 42.6 262 241
I-2BT-8 91 2.0 4.26 5.44
l-e BT-9 143 4.5 18.5 18. &
1-2BT-10 237 8.0 41. ? 35.3
I-2BT-II 368 9.8 70.1 54.4
2-2BT-I 153 25.1 48.2 45.9
2-2BT-2 213 33.9 84.1 79.0
2-2BT-3 286 44.1 i_6 118
2-2BT-4 103 13.8 23.1 21.6
I-2BT-12 i04 12. ? 21.8 19. Z
1-2BT-13 151 33.5 47.3 43.8
I-2BT-14 218 32.5 82. ? Z?. 0
2-2BT- 5 167 39.4 18.2 15.1
2-2BT-6 260 ?2.0 35.9 29.0
2-2BT-? 92 i1.8 5.31 4.36
I-2BT-I 5 106 57.3 3. ?6 2.53
1-2BT-16 287 272.1 24.3 15.6
Insulation
Face Bolts
BJ BJ
BJ BJ
BJ BJ
BJ BJ
BJ BJ
BJ BJ
BJ BJ
BJ BJ
BJ BJ
BJ BJ
BJ BJ
BJ BJ
BJ BJ
BJ BJ
BJ BJ
BJ TX
BJ TX
BJ TX
CP BJ
CP BJ
CP BJ
CP TX
CP TX
Run
TABLEA- 3 (Cont'd.)
_T QH QCTm a Insulation
OF OF Btu/hr Btu/hr Face
64
B_ its
I-2BT-17 299 209.4 34.5 24.8 CP TX
i-2 BT-18 286 242.5 28.3 19.2 CP PI
I-2BT-19 287 161.4 37.8 28.1 CP PI
I-2BT-20 284 199.0 32.7 23.9 CP TFE
I-2BT-21 305 161.0 42.1 31.9 cP TFE
I-2BT-22 292 140.9 39.9 30.1 CP TFE
I-2BT-23 284 51.1 37.3 28.0 MIC2 TFESH
MIC2I-2BT-24 310 143.0 4h. 4 33.7 SH TFE
I-2BT-25 309 i12.8 47.6 36.4 s I TFE
MIC2-2BT-8 356 157.9 52.1 39.9 cp
SH
2-2BT- 9 328 226.9 38.6 28. I CP T_
SH2-2BT-10 330 146.9 48.8 37.9 CP SSI00
SH2 -2BT-I1 320 130.7 #7.7 36.7 Tx SSlOO
SH2-2BT-12 154 26.7 19.7 15. # SSl00 ssl00
SH2-2BT-13 244 45.2 37.8 30. i SSI00 SSI00
SH2-2BT-14 335 61.3 59.9 47.2 SSI00 SSI00
i " "" li ...... _--'--'_= "i-_ ........... ,,,,,,,.h_ ........_,,- _y,._iiii_ ,,,,i--, _ _--. ,,,,,,,

65
TABLE A-4
TABULATED EXPERIMENTAL RESULTS
FOUR BOLT FLANGE
RunT m ST QH QC
OF oF Btu/hr Btu/hr
I-4BT-I 88 5.9 45.5 43.3
Insulation
Face Boats
BJ BJ
I-4BT-2 32± 9.7 102 89.3
I-4BT-3 206 7.8 67.5 59.9
I-4BT-4 3 89.4 31.9 31.9
I-4BT- 5 130 ll3.0 48.5 45.2
BJ BJ
BJ BJ
CP
CP
I-4BT-6 252 150.3 74.1 64.4 CP
I-4BT-7 170 121.1 52.5 46.4
I-4BT-8 59 46.4 37.0 36.6
I-4BT-9
CP
SH2
SS i00
40 21.0 39.8 39.0 SSlO0
282 29.1 91.2 79.4 SSlO0
14 22.7 44.2 41.6 r,SlO0
CompresslonWasher
SSI00
CompresslonWasher
SSI00
CompresslonWasher
SSI00
CompressionWasher
SSl00
Compress&onWasher
SSl00
CompresslonWasher
SSl00
Compression
Washer
ssl00
CompressionWasher
SSl00
t,' ,..

\
APPENDIX B
UNCERTAINTY ANALYS IS
The junction thermal conductance is defined as
h =/L_T
where q is determined from the product of the thermal con-
ductivity and temperature gradient in the metal test specimen.
Since q is evaluated as the product of two terms, the un-
certainty as a percentage is given by
Some estimate of the uncertainty in the published
thermal conductivity values as an estimate a value of 5 per-
cent was selected. For each run a maximum and minimum slope
(dt/dx) was read from the plot of specimen temperature versus
length. In all cases the slope variation was well within
± l°F/inch. From these results a reasonable estimate of the
uncertainty in dt/dx is 0.5°F/inch for the low heat flux runs
with interstitial materials and perhaps as large as i-1/2°F/
inch for the much greater heat flux tests with the bare junc-
tion. All high temperature runs were conducted with water as
the coolant and for the interstitial materials the mean tem-
perature varied somewhat with the heat flux. Therefore, the
magnitudes of 6q/q, the estimated uncertainty in the calcu-
lated heat flux is presented as a function of Qj in Figure B-I.
Maximum and minimum possible slopes (dt/dx) were alsc estimated
from the graphs of temperature versus length. The magnitudes

67
X
LI.
4_tO_J
"I-
(.-
c-
(J¢.-
O.30
H 0 From Maximumml Minimum Slopes
O.28 nty
0.10
0
0 lO 20 30 40
Junction Heat Transfer, Q, Btu/hr
=_I= 0.30
Ue-
U
c-
O 0.20
E
e--
e'-
•," 0.I0
L
U
= 0 F,0
Estimated Uncertainty
I , I , I , I
20 40 60 80
Thermal Conductance, h, Btu/hr Ft2 °F
FIGURE Bl. Estimated Uncer¢ainty
• . :'.,_*',,_-_-k. _",," ....... '. :.... .... ." : '
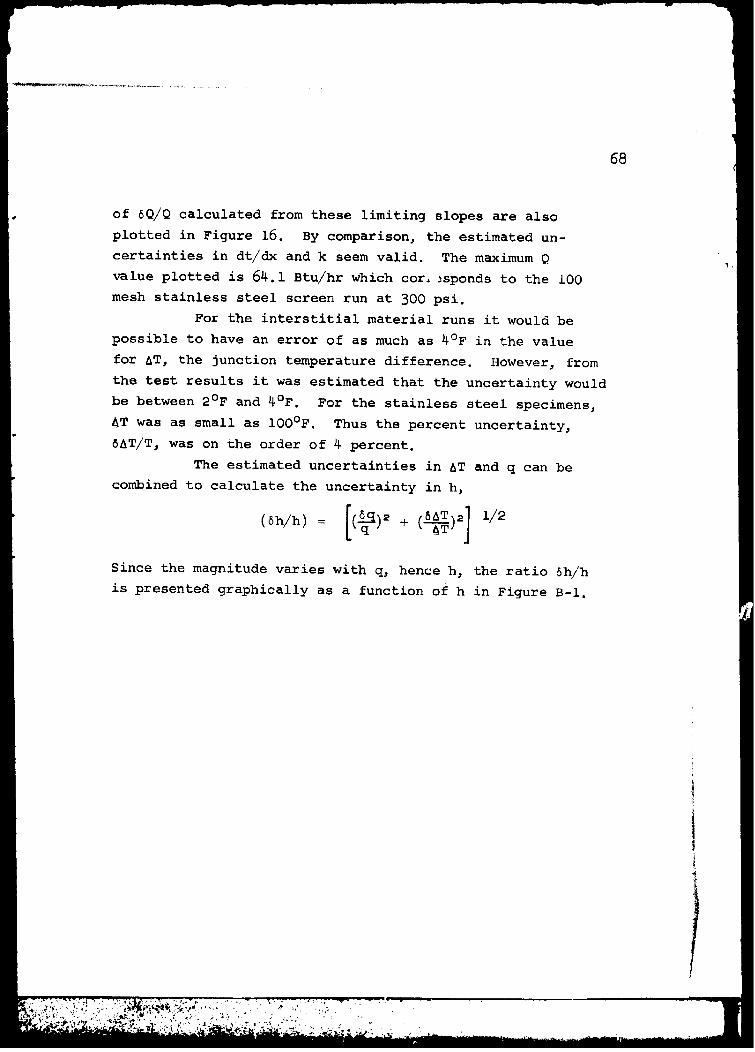
68
of 6Q/Q calculated from these limiting slopes are also
plotted in Figure 16. By comparison, the estimated un-
certainties in dt/dx and k seem valid. The maximum Q
value plotted is 6_.i Btu/hr which cor_ _sponds to the I00
mesh stainless steel screen run at 300 psi.
For the interstitial material runs it would be
possible to have an error of as much as _°F in the value
for AT, the junction temperature difference. However, from
the test results it was estimated that the uncertainty would
be between 2°F and _°F. For the stainless steel specimensj
_T was as small as 100°F. Thus the percent uncertainty 3
6_T/T, was on the order of 4 percent.
The estimated uncertainties in AT and q can be
combined to calculate the uncertainty in h,
[ (__)6_Ta] i/2(6h/h) = C_) 2 +
since the magnitude varies with q, hence h, the ratio 6h/h
is presented graphically as a function of h in Figure B-I.
i
t
!