Embed Size (px)
Citation preview
Perception &: Psychophysics1991.50 (6), 575-583
The effect of ingested alcohol on fusion latencyat various viewing distances
R. J. MILLERWashington State University, Pullman, Washington
Although diplopia is a frequently reported symptom of severe alcohol intoxication, there havebeen few past attempts to describe in any systematic fashion the specific impact of alcohol onfusion. In the present experiment, fusion latency was assessed for 8 male emmetropes. At thebeginning of the alcohol condition, they consumed a drink containing 1.4 ml/kg of 95% ethanol,plus diluent. For the placebo condition, the drink consisted only of diluent. In each condition,fusion latency (the time required to fuse a binocularly visible target) was recorded for targetsrequiring a magnitude of vergence that varied from +10 through -2 meter angles, in Lrneterangle steps. It was found that the far point offusion approached the observer as a direct functionof intoxication level. Furthermore, fusion latency increased for optically far and near targets asa systematic function of intoxication, with no effect of alcohol on intermediate targets. The resultswere consistent with previous findings of alcohol-induced narrowing of vergence range, suggesting that alcohol causes the farthest and nearest distances at which fusion latency is affected toapproach an intermediate value. Measurable effects on fusion latency were observed with bloodalcohol levels as low as 0.05%-0.06%, considerably below the legal limit for operating a motorvehicle in most states.
One of the symptoms of severe ethanol intoxication isdiplopia. Diplopia occurs when retinal disparity exceedsthe capacity of sensory fusion. Under normal circumstances, motor fusion produces sufficient vergence to reduce disparity until it lies within Panum's area. The sensory fusion mechanism then fuses the retinal images anddiplopia is eliminated. Alcohol-induced inability to produce fusion could, in theory, reflect alcohol effects onmotor fusion, sensory fusion, or both.
Most of the relevant available literature emphasizes theeffect of alcohol on vergence and related processes (e.g. ,Adams, 1978; Brecher, Hartman, & Leonard, 1955; Cohen& Alpern, 1969; Colson, 1940; Hogan & Linfield, 1983;McNamee, Piggins, & Tong, 1981; Miller, Pigion, & Martin, 1985; Miller, Pigion, & Takahama, 1986; Moskowitz,Sharma, & Shapero, 1972; Powell, 1938; Wilson &Mitchell, 1983; Zuschlag, 1965). A consistent generalfinding is that alcohol reduces the available range of vergence. That is, alcohol induces decreased divergence forfar viewing and decreased convergence for near viewing;the near and far limits are reduced.
This investigation was supported in part by funds provided for medical and biological research by the State of Washington Initiative Measure No. 171. Selected portions of this experiment were presented atthe 31st annual meeting of the Psychonomic Society, New Orleans,November 16, 1990. I thank Steven Meier, R. J. Densley, Jenny Fitzmorris, Debbie Metzler, Steven Raab, Annette Taylor, and Michael Donnelly for technical assistance rendered during various phases of this investigation. Correspondence should be addressed to R. J. Miller,209 Johnson Tower, Department of Psychology, Washington StateUniversity, Pullman, WA 99164-4820.
575
Although the studies above have been useful in describing the effect of alcohol on vergence, they have not forthe most part been direct tests of its effect on diplopia.Fusional ability can be represented in a number of ways.Three that are of practical interest are the near and farpoints of fusion and fusion latency.
The near point offusion is the minimum viewing distance (or maximum vergence angle) at which fusion canbe attained. In view of alcohol's tendency to narrow vergence range, one might expect near point distance to increase as a function of intoxication level. A few studieshave provided some description of the effect of alcoholon the near point of fusion (e.g., Brecher et al., 1955;Hogan & Linfield, 1983; Powell, 1938; Wilson & Mitchell,1983). These have mostly involved fairly crude measuresin which a vertical line or rod is moved toward the observer until the observer can no longer fuse it. Althoughit is difficult to determine precise details from most ofthese reports, their results all seem to indicate an outwardshift in near point with alcohol intoxication.
The far point offusion is the maximum viewing distances (or minimum vergence angle) at which fusion canbe attained. In view of alcohol's effect on vergence range,one might expect that the distance of the far point of fusion would decrease as a function of intoxication. The farpoint of fusion has not attracted much interest in alcoholresearch, but some measures of fusional reserve have beenreported. Fusional reserve is assessed by providing a binocularly viewed (usually far) target. Base-out or base-inprisms are inserted, and their power is increased until fusionis no longer attainable. The maximum divergence(abduction) or convergence (adduction) that can be pro-
Copyright 1991 Psychonomic Society, Inc.
576 MILLER
duced without loss of fusion is taken as a measure of thefar or near fusional reserve. With a far target, the maximum abduction is essentially equivalent to the far pointof fusion.
Moskowitz et al. (1972) found that alcohol produceda reduction in maximum abduction of 2.5-2.7 prism diopters (PD). Seedorff (1956) reported alcohol-induced reductions in abduction of 50% or more that were highlycorrelated with blood alcohol level (BAL).l In contrast,Colson (1940) reported that alcohol produced a decreasein adduction, with no change in abduction. However, hisconclusion was based on only 3 subjects and an unconventional representation of duction. In terms of more conventional duction measures, his results would appear tobe very similar to those of Moskowitz et al. (1972) andSeedorff (1956), with alcohol-induced decreases in abduction of about 6 PD.
Fusion latency (also sometimes called fusion speed, fusion time, or fusion power) is the amount of time requiredto attain fusion. Reduced fusional ability can be reflectedin an increase in fusion latency even when there is sufficient fusional ability to overcome diplopia. One might expect that as alcohol intoxication reduces the vergencerange, fusion latency would increase for far and near targets. Furthermore, if there is no sensory fusion involvement, there should be less or no change in fusion latencyat intermediate viewing distances. On the other hand, ifalcohol-induced diplopia affects sensory fusion, one mightexpect fusion latency to be affected even at intermediateviewing distances.
There is little direct evidence regarding the effect ofalcohol on fusion latency. Brecher et al. (1955) reportedthat fusion latency for targets at three distances (600,82,and 33 em) was correlated with BAL. The question ofwhether the effect at the intermediate distance was lessthan at the near and far distances in Brecher et al.'s experiment is difficult to evaluate because of their qualitative treatment of their data. However, it appears that thisis what in fact occurred with orthophoric subjects. Brecheret al. 's findings represent a very incomplete test. Theirreport lacks statistical analyses, they assessed responsesat only one intermediate distance, and their experimentlacked important controls for time- and expectation-relatedeffects on the vision variables.
On the basis of phoria measures at each of the threetarget distances, Brecher et al. (1955) suggested that thetarget distance at which no alcohol-induced heterophoriawould appearwouldbe about 56-60 ern. Cohen and Alpern(1969) made tests of accommodative vergence at variousintermediate distances and concluded that such a fixed"neutral" point could not be established. That is, the pointof no phoria appeared to vary with BAL, although it wasintermediate in all cases.
The goal of the present experiment was to examine systematically the relation between alcohol intoxication andfusion latency. Because of the previously described effect of alcohol in reducing the range of available vergence,it was expected that alcohol would increase fusion latencyat far and near viewing distances, that the far point of fu-
sion would shift toward the observer, and that the nearpoint would shift away from the observer as intoxicationlevel increased. If alcohol-induced diplopia resulted primarily from changes in motor fusion, with little or no impact of alcohol on sensory fusion, then fusion latency forintermediate distances would be relatively unaffected byalcohol. On the other hand, if alcohol affected sensoryfusion, alcohol-induced increases in fusion latency wouldoccur for intermediate distances as well.
METHOD
SubjectsSubjects were 8 volunteers, 21-24 years old, in good health, with
no current or prior drinking problems, and no genetic or familialhistory of alcoholism. All were within 10% of desirable weight(Metropolitan Life Insurance Company, 1983). To avoid the complexities of sex and menstrual cycle differences in alcohol absorption and metabolism (e.g., Frezza et al., 1990; Jones & Jones, 1976;Mishra, Sharma, Potter, & Mezey, 1989), the sample was limitedto males. All were moderate drinkers, defined by a QFA (quantityfrequency, adjusted) range of 0.25-1.5 oz ethanol/day, using thealcohol consumption questionnaire of Armor and Polich (1982).All subjects gave informed consent to participate after the natureof the procedures had been fully explained. Each received $65 forhis participation.
The subjects were screened with a Bausch and Lomb Ortho-Raterand a Dioptron Nova diagnostic eye computer. All had fine stereopsis within normal limits (threshold stereopsisangle of 27 sec or less),and no history of serious vision pathology. Each had uncorrectedacuity of at least 0.9, near and far, in both eyes. No subject hadany measurable vertical phoria, nor lateral phoria outside the following ranges: +2.33 PD eso to -1.66 PD exo (far); 0 to -7.5 PDexo (near). All subjects had spherical equivalents refractive errorswithin the range of -1.0 to +0.5 D, with cylinder values within-1.0 to +1.0, for each eye.
Apparatus and EnvironmentIntoximeter. An Intoximeter (Mark IV, Intoximeter, Inc.,
St. Louis) was used for BAL estimates. This instrument uses gaschromatography to estimate BAL from deep-lung air samples.
Amblyoscope. All fusion latency measurements were made witha modified Lyle Major Amblyoscope (shown schematically in Figure 1). Each of the subjects' eyes looked into a separate viewingtube, at the end of which, 16 em from the corneal apex, was a backilluminated target slide. By changing the angles of the viewing tubes,it was possible to vary the amount of vergence required for fusionof the targets. Accessory lens mounts were attached to the viewingtubes. Each target was illuminated by a 6-V Krypton bulb (RayovacK13-2), powered by a variable power supply. Between each bulband its slide was a Uniblitz Model 225L shutter, powered by a Uniblitz Model 300c control. Hunter decade interval timers and Industrial Timer Corporation stop clocks provided control over wheneach shutter opened and closed and a record of how long each shutterwas open.
Each target slide was constructed by cutting a vertical strip,1.5 x 44.0 mm, from the center of a square sheet of black paperwith 82-mm sides. The resulting opening was covered with a yellow filter. The slide was mounted on a sheet of transparent Plexiglas, 82.0 mm square and 3.0 mm thick. When the subject lookedinto the viewing tubes with the shutters open, each eye saw a vertical yellow line (0.5° x 15.4° visual angle; approximate Munsell notation = 2.5Y 8/12), which, when fused, appeared as a single linein a dark field. The luminance of each line was approximately150 cdfm'. The accommodation required for optimal focus of eachtarget (i.e., stimulus accommodation) could be controlled via theplacement of trial lenses in the lens mounts.

EFFECT OF ALCOHOL ON FUSION LATENCY 577
I1\
1\1\I \I \I \I \I \I
~\I II \I II \
Eyes
Figure 1. Schematic view of amblyoscope, as viewed from above. As indicatedby the arrows, the orientation of the viewing tubes can he varied to change thevergence angle required for binocular fixation. The vergence angle is indicatedas alpha.
Reaction timeappll'lltus. Simple reaction time (RT) was assessedwith an apparatus constructed of a Hunter decade interval timer, anIndustrial Timer Corporation stop clock, and a Lafayette Model 1605light box, which contained a GE F4T5 CW lamp mounted behinda translucent white Plexiglas screen. The screen was masked, sothat when the lamp was illuminated a 2.6x6.25 em back-illuminatedwhite rectangle appeared to theobserver. The luminance of thestrip,when lit, was 410 cd/m",
Testing environment. During testing, all lights were extinguishedwith the exception of some small lamps used by the experimentersto work by. When the subject was looking into the amblyoscope,the only light visible to him was that provided by the lines on thetarget slides.
ProcedureThe subjects volunteered in response to a newspaper advertise
ment. They were mailed a description of the experiment, a consentform, a health and vision questionnaire, and the alcohol consumption questionnaire. Of those who returned the forms, several whomet the health and alcohol consumption criteria participated in ascreening session. Those who successfully completed the screening tasks participated in the experimental sessions.
Screening session. During the screening session, the subject'sheight, weight, and interpupillary distance were assessed. He washanded a tube and asked to read a Snellen chart through it; the eyethat he used was recorded as his dominant eye. Then, Ortho-Raterand Dioptron Nova assessments were performed. If the subject metcriteria on these measures, he practiced fusing the amblyoscope targets with a variety of vergence settings. He was instructed to avoidalcohol and other drugs on testing days, and to avoid consuminganything other than water during the 3 h preceding each session.
Experimental sessions. There were two experimental sessions,administered in counterbalanced order, each corresponding to anexperimental condition. The procedures for each condition wereidentical except for the contents of the drink consumed at the beginning of the session. For the placebo condition, the drink consisted only of diluent. For the alcohol condition, the drink containeddiluent plus ethanol. Each condition was run on a different day,conducted at the same time of day (the evening) to minimize diurnaleffects on alcohol response.
Each experimental session began with weighing of the subject,questioning to ensure that he had consumed no alcohol, food, ormedication during the proscription intervals, and an IntoximeterBAL assessment. The subject then ate a small amount of plain whitebread (0.9 g/kg of body weight). Previous studies (e.g., Milleret al., 1985; Miller et al., 1986) have shown that this controls theoccasional problem of nausea resulting from alcohol on an emptystomach without unduly suppressing BAL curves.
Next, the subject was given a drink consisting of 7.5 rnl of liquid per kg of body weight. It was consumed during a 2o-min period,with 25 % of it given every 5 min. For the placebo (PL) condition,the drink was pure diluent. For the alcohol (AL) condition, it included 1.4 rnI/kg of 190 proof(95%) ethanol, the remainder beingdiluent. Each drink was served in a covered opaque cup and consumed through a straw. On the lid were two drops of ethanol andtwo drops of peppermint oil, making it difficult to discern the alcohol content by smell.
The diluent was made by mixing one package (0.14 oz or 3.97 g)of unsweetened lemon-lime flavored Kool-Aid brand soft drink mix,I liter distilled water, and eight l-g (.035-oz) packets Equal brandpowdered sweetener. It contained no carbonation, and little sugaror other ingredients that affect the absorption or metabolism of alcohol, and its flavor helped conceal the amount of alcohol whilebeing acceptable to (albeit not necessarily popularwith) thesubjects.
At the end of the 2o-min consumption period, an additional 10 minpassed while any alcohol remaining in the subject's mouth and throattissues was absorbed. Toward the end of this period, he rinsed hismouth thoroughly with distilled water. At the end of this period,three types of measurement were made, as described below. Thesemeasurements were repeated every 15 min for a total of 6 h.
I. Blood alcohol level. The first measurement was an Intoximeterassessment of BAL.
2. Simple reaction time. The second measurement was an assessment of simple RT. The subject looked at the RT light box, positioned approximately 170 em from his eyes. The experimenter initiated a 5-sec cycle of the Hunter timer. At the end of this 5-secinterval, the lamp in the light box was turned on and, concurrently,the stop clock was activated. The subject pushed a thumb-operatedbutton switch (held in his dominant hand) as quickly as possibleafter the appearance of the light. The time that elapsed between

578 MILLER
the illumination of the lamp and the pushing of the button wasrecorded by the stop clock. This procedure was repeated twice, andthe mean of the three values was taken as the subject's RT.
3. Fusion latency measurements. For each subject, on the basisof his interpupillary distance, it was determined which amblyoscopeviewing tube angle settings (to the nearest 0.5 0
) would correspondto whole-number meter angle' values of -2 through +10. To begin, the viewing tubes were set at the vergence angle corresponding to +2 meter angles. Trial lenses of -2 D back vertex powerwere placed in the lens mounts.
The subject looked into the amblyoscope while holding a thumboperated button switch in his dominant hand. To begin the first trial,the vertical yellow bar became visible to the subject's dominanteye. At this point, there was stimulation for accommodative vergence, but not for fusional vergence. Five seconds later, the othereye's stimulus also became visible and the stop clock was activated.As soon as the subject achieved fusion, he pushed the button, whichclosed both shutters and blacked out the visual field. Pushing thebutton also stopped the stop clock, providing a reading of how muchtime had elapsed between the appearance of the second eye's visualstimulus and the pushing of the button. This was the measure offusion latency. If the button was not pushed within 10 sec of theappearance of the nondominant eye's stimulus, the shutters closed.In such cases, fusion latency was recorded as 10 sec.
For the next (second) trial, the viewing tubes were set to a newangle, corresponding to either +l or +3 meter angles (randomlydetermined), appropriate trial lenses were inserted (-lor -3 D,respectively), and the procedure described above was repeated. Ifthis second trial was for +1 meter angle, succeeding trials werefor 0, then -1, then -2 meter angles. For each meter angle setting, trial lenses of appropriate power were inserted. At the firstsetting for which the subject could not achieve fusion (i.e., fusionlatency> 10 sec), the viewing tubes were reset to the previousmeter angle setting, and the viewing tube angle was decreased in0.5 0 steps, with a trial conducted at each step, until fusion latencywas again equal to 10 sec. The vergence angle lying midway between the smallest angle for which fusion latency was less than10 sec and the next smaller angle on the scale defined the far pointof fusion.
If, on the other hand, the second trial was for the +3 meter anglesetting, subsequent trials progressed in l-meter-angle steps towardthe near point of fusion, following the same strategy as that forthe far point. In reality, however, the near point almost always exceeded the IO-meter-angle limit of the apparatus.
Regardless of whether the near or the far point of fusion was approached first, once it had been determined the remaining valuewas then found. The subject then relaxed until the beginning of thenext IS-min time period, when the BAL, RT, and fusion latencymeasurements described above were again made. This procedurewas repeated every 15 min for a total of 6 h.
In summary, there were two conditions, AL and PL, each comprising 24 consecutive IS-min time periods. For each of these timeperiods were obtained measures of BAL, simple RT, the near andand far points of fusion, and fusion latencies for all the meter angie settings between these two extremes.
At the end of each session, the subject's BAL was assessed periodically until it was 0.02% or below. At that point he was takenhome. Each subject agreed to remain in the laboratory until his BALhad reached this criterion, and not to operate a motor vehicle orother dangerous machinery until at least 6 h following the session.
RESULTS
Basic Blood Alcohol LevelAll BAL readings during the PL condition equaled 0%,
as expected. For the AL condition, the mean peak BALfor the 8 subjects was 0.105% (SD = 0.017, range =
0.09 %-0.14%). The lowest BAL for the 24 time periodshad a mean for the 8 subjects of 0.020% (SD = 0.015,range = 0%-0.04%). With the time periods numberedconsecutively 1-24, the mean time period at which peakBAL was first observed was 3.63 (SD = 2.55, range =1-8). That is, peak BAL was first observed, on the average, about 40 min after testing began.
Analyses of Near and Far Points of FusionThe purpose of this set of analyses was to determine
whether near and far points of fusion were systematicallyrelated to intoxication level. Since both conditions requiredmaking repeated measurements for 6 h, the first step wasto determine whether there was any time-related changein near or far point in the absence of alcohol. Accordingly,near and far point values were examined across the 24 timeperiods for the PL condition alone. A formal analysis ofnear point values was unnecessary. Near point did not varyacross the 24 time periods for any subject. For each timeperiod, the mean near point was represented as 34.8°, defined by the IO-meter-angle limit of the apparatus.
The far point values (expressed in degrees and meter angles) for the PL condition are shown in Table 1. Whilethe variation across time period was small in absolute terms(range = 1.38°), the analysis of variance (ANOVA) offar point expressed in degrees showed it to be statisticallysignificant [F(23,161) = 2.55, p < .01]. Thus, the analysis of intoxication effects on far point required a controlfor the possible confounding effect of time period.
To analyze the effects of intoxication on far point, eachsubject's far point data were divided into four blood al-
Table 1Far Points of Fusion and Mean Fusion Latencies for the 24
Time-,Periods of the Placebo Condition
Time Far Point Far Point Mean FusionPeriod (Degrees) (Meter Angles) Latency (Seconds)*
1 -1.76 -0.48 0.902 -1.50 -0.41 0.773 -1.50 -0.41 0.814 -1.88 -0.51 0.825 -1.88 -0.51 0.76
6 -2.12 -0.58 0.747 -2.26 -0.62 0.758 -2.26 -0.61 0.739 -2.62 -0.73 0.79
10 -2.62 -0.72 0.73
11 -2.88 -0.79 0.7312 -2.38 -0.65 0.7913 -2.62 -0.72 0.7714 -2.38 -0.65 0.7415 -2.38 -0.66 0.76
16 -2.26 -0.62 0.6817 -2.38 -0.66 0.7118 -2.76 -0.76 0.7319 -2.62 -0.73 0.6920 -2.38 -0.66 0.70
21 -2.50 -0.69 0.7722 -2.76 -0.76 0.7223 -2.62 -0.73 0.7024 -2.62 -0.72 0.67
*Collapsed across 11 meter angle settings.

EFFECT OF ALCOHOL ON FUSION LATENCY 579
+0.8 o AL condition +0.2
+0.4 o PL conditionri1
en 0 0 ....CIl "0CIl 0... -0.4 ~0-CIl~ -0.8 -0.2 3'- ~c'0 - 1.2
Cl>a. -e
... -0.4 0~
~ - 1.6 <Cco
-2.0 _-0 !!!..
-0---- -0.6-2.4 D- ---------0---
BARI BAR2 BAR3 BAR4
Blood alcohol range
Figure 2. Far point, expressed in degrees and meter angles, plotted as a functionof blood aIcoboi range (BAR), for the a1cobol (AL) and placebo (PL) conditions.
cohol ranges (BARs), based on BAL values observed during the AL condition. For a given subject, the far pointvalue for the first range (BARI) consisted of the mean ofall far point values obtainedwhen his BAL = 0% -0.04%.BAR2 consisted of the mean of far point values when hisBAL = 0.05 %-0.06%. BAR 3 consisted of the mean forthat subject when his BAL = 0.07%-0.08%, and BAR4consisted of the mean when his BAL = 0.09% or greater.Far point data were expressed in the same way for the PLcondition, with the four BARs defined by the same timeperiods as for the AL condition. Thus, for example, ifTimePeriods 1-3 defined BAR4 for the AL condition, the samethree time periods defined BAR4 for the PL condition.
This procedure made possible a 2 x 4 factorial arrangement of condition (AL and PL) x blood alcohol range(BARI, BAR2, BARJ, and BAR4), as shown in Figure 2.The ANOVA showed that the effect due to condition wassignificant [F(l,7) = 73.38, p < .01], as were the effect due to BAR [F(3,21) = 13.81, p < .01] and the interaction [F(3,21) = 5.39, p < .01]. Newman-Keulscomparisons across the PL condition showed that noneof the four values differed significantly. Across the ALcondition, the comparison between BAR2 and BAR3 wasnot statistically significant. Comparisons between BARIand BAR 2, and between BAR3 and BAR4, were significant (p < .05). The remaining comparisons across theAL condition were significant at p < .01. The differencebetween AL and PL conditions was not significant atBARI, but was so at all other BARs (p < .01).
For consistency, the analysis of the effects of BAR onnear point was conducted in the same manner. The ANOVArevealed no significant effects. Indeed, only I subjectshowed a change in near point in the AL condition. It isclear that the subjects' true near points almost invariablyexceeded the limits of the apparatus for both conditions.
Analyses of Fusion LatencySince there were relatively few instances in which sub
jects were able to fuse the targets at meter angle settingsof -lor -2, these settings were excluded from analysis.This left II fusion latency values (representing meter angle settings of 0 through +10) per time period. Of theresulting 4,224 fusion latency values, only 186 (4.4%)exceeded 3.0 sec, and these contributed inordinately todata variability. Thus, all fusion latency values greaterthan 3.0 sec were recorded as 3.0 sec for analysis.
To determine if there was any change in fusion latencyas a function of time alone, an II x24 (meter angle setting X time period) ANOVA was performed for the fusion latency data from the PL condition. The effect ofmeter angle setting was significant [F(IO,70) = 2.86,P < .01], as was that of time period [F(23,161) = 1.61,P = .047]. The interaction was not significant. Mean fusion latency values for the II meter angle settings (collapsed across time period) are shown in Table 2. It is not
Table 2Mean Fusion Latencies for the 11 Meter Angle Settings
of the Placebo Condition
Meter Angle Mean FusionSetting Latency (Seconds)>
10 0.759 0~1
8 0.687 0.696 Q~
5 0.714 0.773 0.702 0.601 Qno 1.18
·Collapsed across 24 time periods.

580 MILLER
surprising that fusion latency was somewhat greater at theO-meter-angle setting than at the other settings, since thissetting was close to the far point and was thus pushingdivergence to its limit.
The principal reason for this analysis was to determinewhether time might be confounded with intoxication levelin the AL condition. Although there was a significant effect due to time period in the PL condition, the effect wasjust barely significant, and it rested almost entirely on thefact that fusion latency values were somewhat higher forthe first time period than for the other time periods (seeTable I). When the analysis was repeated with the firsttime period removed, there was no significant effect dueto time period. Furthermore, the first time period was notconfounded with intoxication level; each of the BARs observed in the AL condition appeared with about equal frequency in the first time period. Given these observations,it was concluded that there was no danger of confoundingtime with intoxication level, and subsequent analyses werebased on fusion latency data from the AL condition alone.
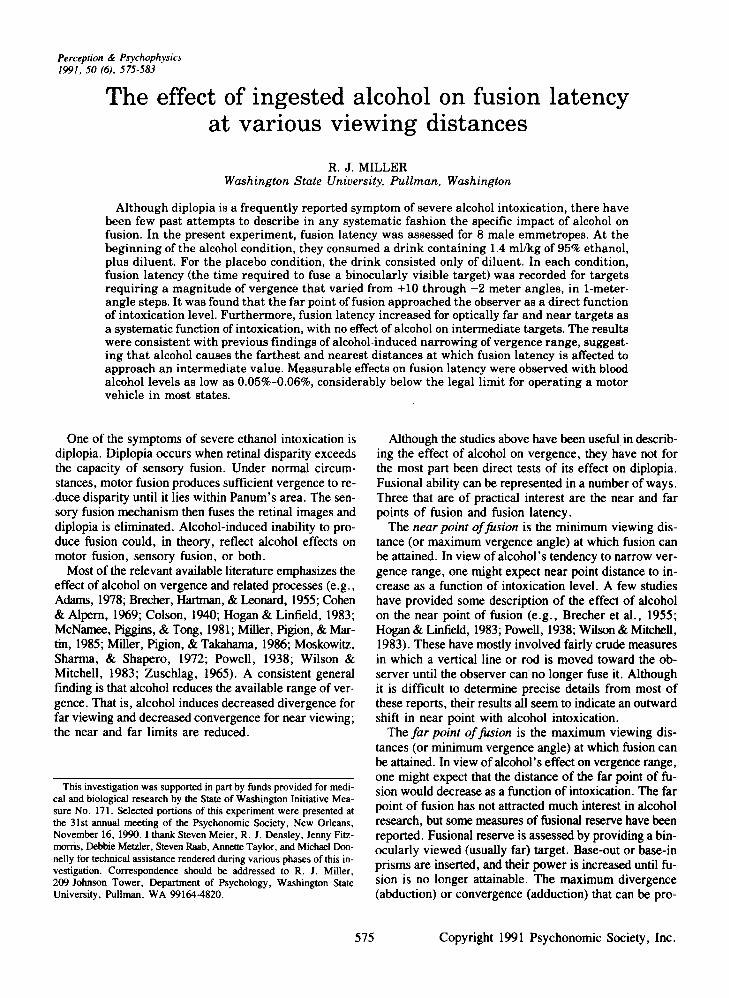
To analyze the effects of intoxication on fusion latency,the fusion latency values obtained in the AL conditionwere divided into four BARs, as described previously.This procedure made possible a 4 x II factorial arrangement of BAR (BARI , BAR2, BARJ, and BAR4) x meterangle setting (meter angles 0-10), as shown in Figure 3.
The effect of meter angle settingwas significant [F(I0,70)= 7.14,p < .01], as was that of BAR [F(3,21) = 28.39,P < .01]. The interaction was also significant [F(30,210)= 3.43, p < .01]. Newman-Keu1s analyses were performed at each meter angle setting. At 10 meter angles,BARI differed from BAR3 and BAR4 (p < .05). At 9meter angles, BARI differed from BARJ (p < .05), andfrom BAR4 (p < .01); and BAR2 differed from BAR4(p < .05). At I meter angle, BARI differed from BAR4(p < .05). At the O-meter-angle setting, all BAR valuesdiffered from each other (p < .01). None of the remaining comparisons was significant.
Analyses of Simple Reaction TimeSimple RT was included in the present experiment as
a matter of control. If fusion latency changed as a functionof intoxication, the change might not be specific to fusion.That is, it cou1dbe that alcohol produced an overall slowing of RT, and this wou1d be reflected on any task involving an RT component. Some investigators have suggestedthat alcohol produces a slowing of simple RT, but othershave found no effect (e.g., Carpenter, 1962; Moskowitz,1973; Moskowitz et al., 1972).
As with previous analyses, the first step was to determine whether there were significant effects of time periodalone on RT. A one-way ANOVA of RT values acrossthe 24 time periods of the PL condition showed a smallbut significant effect[F(23,161) = 1.71, p = .029]. RTvalues observed during the first 6-7 time periods weresomewhat larger than those during later time periods. Thiseffect seemed large enough statistically to require a control for time effects when the effects of intoxication on
2.4
2.2
2.0 9 BAR4 --(f) BAR3 0-._-_.-0
"Uc:
1.8 BAR2 .----..00 BARI cr----oQ)
~
>. 1.60c:Q)
:§1.4
c:.2(f)
~ 1.2 0
p'''''/
1.0
0.8
0.6
a I 2 3 4 5 6 7 8 9 10
Meter angle setting
Figure 3. Fusion latency, expressed in seconds, plotted as a function of the 11 meter-angle settings, for the four blood alcohol ranges(BAR).
RT were analyzed. However, its absolute magnitude wassmall (the largest difference in RT between time periodswas 0.06 sec) relative to the effects of intoxication on fusion latency (see Figure 3). Thus it appeared unnecessaryto consider time-related changes in RT when the effectsof intoxication on fusion latency were analyzed.
A 2 x4 (condition x BAR) ANOVA was performedon the RT data, with BAR defined as in previous analyses (see Figure 4). The effect of BAR was significant[F(3,21) = 8.23, p < .01], as was the interaction [F(3,21)= 4.71, P = .012]. The effect of condition was not significant. Newman-Keuls analysis showed that for the ALcondition, BARI differed significantly from BAR3 andBAR4 (p < .01), and BAR2 differed from BAR3(p < .05) and from BAR4 (p < .01). The remainingcomparisons for the AL condition, all comparisons forthe PL condition, and all comparisons of AL with PL ateach of the four levels of BAR were nonsignificant. Thus,RT tended to increase with intoxication level. However,the difference in RT between BARI and BAR4 for theAL condition was only 0.047 sec. Thus, while RT wastechnically confounded on fusion latency in comparisonsacross BAR, its effect was so small in absolute terms thatit was deemed unimportant.

EFFECT OF ALCOHOL ON FUSION LATENCY 581
DISCUSSION
*p < .05. tp < .01.
implications for those who drink and drive, particularlywith regard to their ability to see road signs, pedestrians,other vehicles, and so forth, at a distance.
It seems clear that the near point was not tested in thisexperiment. A calculated risk was taken, because the amblyoscope was not readily adaptable to induce vergencecloser than 10 meter angles. The findings of Brecher et al.(1955), Hogan and Linfield (1983), and Powell (1938)suggested that near points at the BALs used in this experiment would be in the general vicinity of 10 meter angles, and it was hoped that the present apparatus wouldbe sufficient to detect alcohol-induced change. Evidentlyit was not, although 1 subject did show a measurablealcohol-induced outward shift in near point.
The principal analyses for this experiment were thoseof fusion latency. Alcohol induced an increase in fusionlatency for near and far targets, with no effect at intermediate distances. Furthermore, as intoxication increased,S? did the effect, with fusion latency growing progressively longer for near and far viewing. It could be expected that if intoxication continued to increase, the curvesin Figure 3 would become progressively more V shaped,with the point of the V located at 2-3 meter angles. Suchan expectation remains to be tested, of course, but it isconsistent with the conception of an intermediate "neutral" point of vergence, which is perhaps synonymouswith the intermediate tonic position described by Owensand Leibowitz (1983).
It should be remembered that the fusion latency changesshown in Figure 3 were mostly at distances at which fusion was still attainable. People who drink alcohol canexpect that their fusional ability will be affectedeven whendiplopia is not evident. Tasks requiring rapid target detection and recognition (e.g., responding to unexpectedobjects on the highway) could be affected, because eventhough such targets could be fused, doing so could require more time if the viewer was intoxicated rather thansober. It is clear that targets do not have to be very faraway to produce such an effect-indeed, significant effects were observed as close as I meter angle.
It should also be noted that this experiment was a veryconservative test. The levels of intoxication were relativelylow, rarely exceeding most states' legal limits for the operation of motor vehicles. The fusion task was designed tomake fusion as easy as possible to attain. That is, eachtarget provided a stimulus for accommodation that wasconsistent with its vergence demand, and the subject hadsufficient time for accommodative vergence to occur before fusional vergence was required. Furthermore, eachtarget required only a small vergence increment or decrement relative to the target that preceded it. This is quiteunlike situations in the real world, in which attention oftenshifts quickly from near to far targets or vice versa, requiring large shifts in accommodative and fusional vergence. Nevertheless, significant effects of alcohol on fusional ability were observed, even (at 0 meter angles) forBAL values as low as 0.05%-0.06%. Such findings argue that the usual legal limit of 0.10% BAL for motorvehicle operation is a liberal one.
BAR4BAR3BAR2
o PL condition
o AL condition
BARI
Ii) 0.27-0c: 0.260uQ>
$ 0.25Q>
.S 0.24+-
c: 0.23.2+-o 0.22cQ>
0::0.21
Fusion latency at 10 meter angles .37*Fusion latency at 9 meter angles .42*Fusion latency at 8 meter angles .46*Fusion latency at 7 meter angles .24Fusion latency at 6 meter angles .25Fusion latency at 5 meter angles .26Fusion latency at 4 meter angles .14Fusion latency at 3 meter angles .10Fusion latency at 2 meter angles .14Fusion latency at 1 meter angle .38*Fusion latency at 0 meter angles .55tSimple reaction time .36*Far point of fusion .61t
Blood alcohol range
Figure 4. Simple reaction time, expressed in seconds, plotted asa function of blood a1cobol range (BAR), for tbe a1cobol (AL) andplacebo (PL) conditions.
Table 3Mean Pearson Correlation Coefficients (r) Derived
from Comparisons of Blood Alcobol Level witb Selected OtberVariables Across 24 Time Periods of tbe Alcobol Condition
Variable Mean r
As expected, alcohol caused the far point to approachthe observer, and the magnitude of this approach increasedwith intoxication. People who drink sufficient alcohol toraise their BAL above the legal limit for motor vehicleoperation can expect to experience diplopia for far targets and can probably expect further that the distance atwhich they can see without diplopia will continue to decrease as they become more intoxicated. This has clear
Correlational AnalysesAs an additional means of examining the relations be
tween intoxication and the variables of interest in thisstudy, the Pearson correlation coefficients between BALand all of these other variables were calculated, for eachsubject individually, across the 24 time periods of the ALcondition. The mean correlation coefficients for the 8 subjects are shown in Table 3. These correlational findingsare consistent with relations shown in earlier analyses.

582 MILLER
The use of a placebo condition yielded confidence thatthe effects were due to alcohol, rather than to time-relatedchanges resulting from fatigue, boredom, practice, andso forth, or to subjects' expectations regarding the effectsof alcohol. The subjects were led to believe that theplacebo drink contained alcohol, and self-ratings confirmed that they believed this. Such controls are rarelyused in studies of alcohol and vision, and they add considerably to the difficulty and expense of such research.The requirements of good experimental design demandedthat they be incorporated, however.
On a more theoretical level, the following account istentatively offered. Alcohol induces a general inhibitionof both convergence and divergence, perhaps via depression of vergence mechanisms in the brainstem reticularformation. This results in a functional narrowing of therange of available vergence, such that near convergenceand far divergence become more difficult. As a result,motor fusion at extreme near and far distances becomesmore difficult as intoxication level increases, resulting inan increase in fusion latency and eventually to loss offusion.
Such an account is, of course, extremely simplistic, andit requires substantiation on many levels. It requires, forexample, the presence of convergence and divergenceneurons. This is a point of considerable debate, but thereis evidence favoring the existence of such neurons in themesencephalic reticular formation (see, e.g., Mays, 1984).Also required is evidence that alcohol affects such neurons; it is widely believed that alcohol not only affectsthe reticular activating system, but that this is one of thefirst brain systems affected by even small amounts of alcohol (see, e.g., Blum, 1982; Himwich & Callison, 1972;Ritchie, 1985), a fact consistent with the observation inthe present experiment that even relatively low levels ofintoxication show measurable effects on fusion latency.If there is such an effect of alcohol on the vergence system, it would lead to the expectation of a generalized effect on vergence, not specific to fusion. Various studieshave shown that the range of both accommodative andfusional vergence is reduced by alcohol (e.g., Milleret al., 1986). Finally, if the effect of alcohol on diplopiais the result of changes in motor fusion, and not sensoryfusion, one would expect that fusion would not be affectedfor intermediate-distancetargets. The results of the presentexperiment are consistent with such an expectation.
The results of the present experiment can only be treatedas consistent with the above account. They certainly donot substantiate it, and alternative explanations are possible. One explanation might be that alcohol reduces therelative effectiveness of the stimulus to fusion, therebybiasing subjects' vergence toward their phoria position.That is, alcohol-induced changes might be due to a reduction of the efficacy of the sensory fusion system, suchthat vergence tends toward the phoria position. Althoughalcohol-induced changes in phoria were not assessed inthe present experiment, available evidence shows thatthere is an alcohol-induced shift in phoria toward an in-
termediate (possibly drifting) neutral value that would beconsistent with such an account (Brecher et al., 1955;Cohen & Alpern, 1969). Such an explanation cannot bedismissed on the basis of the present findings, althoughit seems likely that if alcohol produced some generalizedreduction in the effectiveness of the stimulus to fusion,changes in fusion latency also would have been detectedat intermediate distances.
Fusion latency was measured subjectively in the presentexperiment, and there were no measures of alcoholinduced changes in vergence or fixation disparity. Thus,the conclusion that the change in fusion latency can beaccounted for in terms of a restricted vergence range isan inference based on previous studies. However, suchstudies have shown that alcohol affects these phenomenain a manner consistent with this inference. That is, as mentioned previously, as alcohol is ingested, vergence rangeis reduced and fixation disparity is at its maximum fornear and far targets.
REFERENCES
ADAMS, A. J. (1978). Acute effects of alcoholand marijuana on vision.In S. J. Cool& E. L. Smith (Eds.), Frontiers in visual science (pp. 93105). New York: Springer-Verlag.
ARMOR, D. J., It POUCH, J. M. (1982). Measurement of alcohol consumption. In E. M. Pattison& E. Kaufman(Eds.), Encyclopedic handbook of alcoholism (pp. 72-80). New York: Gardner.
BLUM, K. (1982). Neurophysiological effects of alcohol. In E. M. Pattison & E. Kaufman (Eds.), Encyclopedic handbook ofalcoholism(pp. 105-134). New York: Gardner.
BRECHER, G. A., HARTMAN, A. P., It LEONARD, D. D. (1955). Effectof alcohol on binocular vision. American Journal ofOphthalmology;39 (No.2, Pt. 11), 44-52.
CARPENTER, J. A. (1962). Effects of alcohol on some psychologicalprocesses: A critical review with special referenceto automobiledriving skill. Quarterly Journal of Studies on Alcohol, 23, 274-314.
CUNE,D., HOFSTETTER, H. W., It GRIFFIN, J. R. (1989). Dictionaryof visual science (4th 00.). Radnor, PA: Chilton.
COHEN, M. M., '" ALPERN, M. (1969). Vergenceand accommodation:VI. The influence of ethanol on the ACI A ratio. Archives ofOphthalmology, 81, 518-525.
COLSON, Z. W. (1940). Theeffect of alcoholon vision: An experimentalinvestigation. Journal of the American Medical Association, 115,1525-1527.
DUKE-EWER, S., It WYBAR, K. (1973). System of ophthalmology:Vol. 6. Ocular motility and strabismus. St. Louis: Mosby.
FREZZA, M., DIPADOvA, C., POZZATO, G., TERPIN, M., BARAONA, E.,It LIEBER, C. S. (1990). High blood alcohol levels in women: Therole of decreasedgastric alcohol dehydrogenaseactivity and first-passmetabolism. New England Journal of Medicine, 322, 95-99.
HIMWlCH, H. E., It CALLISON, D. A. (1972). The effects of alcoholon evokedpotentials of variousparts of theCNSof thecat. In B. Kissin&H. Beglieter(Eds.), The biology ofalcoholism: Vol. 2. Physiologyand behavior (pp. 67-84). New York: Plenum.
HOGAN, R. E., '" LINFIEw,P. B. (1983).The effectsof moderate dosesof ethanol on heterophoria and other aspects of binocular vision.Ophthalmic & Physiological Optics, 3, 21-31.
JONES, B. M., '" JONES, M. K. (1976). Women and alcohol: Intoxication, metabolism,and the menstrual cycle. In M. Greenblatt & M. A.Schuckit (Eds.), Alcoholism problems in women andchildren (pp. 103136). New York: Grone & Stratton.
MAYS, L. E. (1984). Neural control of vergence eye movements: Convergence and divergence neurons in midbrain.Journal ofNeurophysiology, 51, 1091-1108.
McNAMEE, J. E., PiGGINS, D., '" TONG, J. (1981). Confirmation of

EFFECT OF ALCOHOL ON FUSION LATENCY 583
theinfluence of alcohol on heterophoria using a vision screener. American Journal of Optometry & Physiological Optics, 58, 761-765.
METROPOUTAN LIFE INSURANCE COMPANY (1983). 1983 Metropolitan height and weight tables. Statistical Bulletin, 64, 2-9.
MILLER, R. J., PtGION, R. G., & MARTIN, K. D. (1985). The effectsof ingested alcohol on accommodation. Perception & Psychophysics,37,407-414.
MILLER, R. J., PtGION, R. G., & TAKAHAMA, M. (1986). The effectsof ingested alcohol on accommodative, fusional, and dark vergence.Perception & Psychophysics, 39, 25-31.
MISHRA, L., SHARMA, S .• POTTER, J. J.• & MEZEY, E. (1989). Morerapid elimination of alcohol in women as compared to male siblings.Alcoholism: Clinical & Experimental Research, 13, 752-754.
MOSKOWITZ, H. (1973). Laboratory studies of the effects of alcoholon some variables related to driving. Journal of Safety Research, 5,185-199.
MOSKOWITZ. H .• SHARMA. S.• & SHAPERO, M. (1972). A comparisonof the effects of marijuana and alcohol on visual functions. In M. F.Lewis (Ed.), Current research in marijuana (pp. 129-150). New York:Academic Press.
OwENS, D. A., & LEIBOWITZ, H. W. (1983). Perceptual and motor consequences of tonic vergence. In C. M. Schor & K. J. Ciuffreda (Eds.),Vergence eye movements: Basic and clinical aspects (pp. 25-74).Boston: Butterworths.
POWELL, W. H.• JR. (1938). Ocular manifestations of alcohol and aconsideration of individual variations in seven cases studied. Journalof Aviation Medicine. 9, 97-103.
RITCHIE, J. M. (1985). The aliphatic alcohols. In A. G. Gilman. L. S.Goodman. T. W. Rall, & F. Murad (Eds.), Goodman and Gillman'sThe pharmacological basisoftherapeutics (7th ed., pp. 372-386). NewYork: Macmillan.
SEEOORFF, H. H. (1956). Effect of alcohol on the motor fusion reservesand stereopsis as well as on the tendency to nystagmus. Acta Ophshalmologica, 34. 273-280.
WILSON. G., & MITCHELL. R. (1983). TIle effect of alcohol 011thevisualand ocular motor systems. Australian Journal ofOphtholmology. 11.315-319.
ZUSCHLAG. H. G. (1965). Alkoholbedingte StOrungen von Sehfunktionen.Klinische MonatsbliJlter ~r Augenheillcunde. 147. 549.(,00.
NOTES
I. Blood alcohol level (BAL) is a standard indication of the amountof alcohol in the blood. A frequent alternative term is blood alcoholconcentration, or BAC. The most conunon expression of BAL is in grampercent (g %), which refers to grams of alcohol per 100 ml of bloodplasma, converted to a percentage. Thus. a subject whose blood contains 0.1 g alcohol per 100 ml blood would have a BAL of 0.10%, thevalue that defines the legal limit in most states for operating a motorvehicle.
2. One meter angle is the amount of vergence required when theeyesare binocularly fixating a point on the median line at a distance of 1m.The vergence angle that this represents varies, of course, with interpupillary distance. The distance of the point to which the observer isverged (in meters) is thus equal to the reciprocal of meter angles. justas with diopters of accommodation. For further details. see Duke-Elderand Wybar (1973) or Cline, Hofstetter. and Griffin (1989).
(Manuscript received December 7, 1990;revision accepted for publication July 25, 1991.)