Embed Size (px)
Citation preview

C R I M E A N D J U S T I C E
RESEARCH REPORT
The Effect of Gun Violence on Local
Economies Gun Violence, Business, and Employment Trends in Minneapolis, Oakland, and
Washington, DC
Yasemin Irvin-Erickson Bing Bai Annie Gurvis Edward Mohr
November 2016

ABOUT THE URBAN INST ITUTE The nonprofit Urban Institute is dedicated to elevating the debate on social and economic policy. For nearly five
decades, Urban scholars have conducted research and offered evidence-based solutions that improve lives and
strengthen communities across a rapidly urbanizing world. Their objective research helps expand opportunities for
all, reduce hardship among the most vulnerable, and strengthen the effectiveness of the public sector.
Copyright © November 2016. Urban Institute. Permission is granted for reproduction of this file, with attribution to
the Urban Institute. Cover photo by Joshua Lott/Getty Images.
C O N T E N T S I I I
Contents Acknowledgments iv
Executive Summary v
The Effect of Gun Violence on Local Economies 1
Background 1
Methods 2
City Profiles 7
Results 14
Conclusions 16
Appendix A. Fixed Effects and Difference-in-Differences Estimates 18
Appendix B. Selected Retail and Service Industry Codes 22
Notes 23
References 24
About the Authors 25
Statement of Independence 26

I V A C K N O W L E D G M E N T S
Acknowledgments This report was funded by Everytown for Gun Safety Support Fund, Inc. We are grateful to them and to
all our funders, who make it possible for Urban to advance its mission.
The views expressed are those of the authors and should not be attributed to the Urban Institute,
its trustees, or its funders. Funders do not determine research findings or the insights and
recommendations of Urban experts. Further information on the Urban Institute’s funding principles is
available at www.urban.org/support.
A central element of this study was obtaining access to gun homicide, gunshot, and neighborhood-
level establishment data. We would like to thank the City of Minneapolis Police Department, Oakland
Police Department, and Metropolitan Police Department of Washington, DC, for granting us access to
their gun homicide incident data. We would also like to thank Walls & Associates and ShotSpotter, Inc.,
for providing us with the National Establishment Time-Series database and gunshot detection
technology data.
We would like to also thank Ted Alcorn, Cecily Wallman-Stokes, Sarah Tofte, Commander Scott
Gerlicher, Captain Ersie Joyner, Deputy Chief John Lois, Sergeant Jeffrey Egge, Ms. Cassandra Lane,
Don Walls, Mark Jones, Doris Cohen, and Joe Hawkins for their support.
We owe a special thank you to our colleagues Sam Bieler, Nancy La Vigne, Janine Zweig, Akiva
Liberman, Christina Plerhoples Stacy, Breno Braga, KiDeuk Kim, Mathew Lynch, Nicole Weissman,
Fiona Blackshaw, Serena Lei, Vivian Hou, Benjamin Chartoff, Daniel Matos, Lydia Thompson, Kate
Villarreal, and Bridget Lowell for their invaluable insight and support.

E X E C U T I V E S U M M A R Y V
Executive Summary We already know that gun violence exacts enormous costs. The fear of gun violence, and people’s
perceived risk, has been shown to impose heavy social, psychological, and monetary burdens on
individuals that translate into monetary costs to society. We also know the health care costs of treating
gunshot injuries: just under $630 million in 2010 (Howell and Abraham 2013). American society
collectively pays all these costs. Yet we know comparatively little about the relationship between gun
violence and the economic health of neighborhoods at the most grassroots levels; we don’t know how
businesses, jobs, and many more indicators of economic health respond to increased levels of gun
violence. Could gun violence cause economic downturns? In communities and neighborhoods most
affected by gun violence, does the presence of gun violence hold back business growth?
To answer these important research questions at the neighborhood level, we assembled gun
violence and establishment data at the census tract level in six US cities. This report presents the initial
findings of an in-depth analysis of the relationship between gun violence and local economic health in
Minneapolis, Minnesota; Oakland, California; and Washington, DC. Our findings indicate a significant
relationship between gun violence and the ability of businesses to open, operate, and grow in the
affected communities. The data and research findings from this study can lend a new, economically
driven lens to the debate on gun safety and gun control.
Highlights
To understand the relationship between gun violence and the subsequent economic health of
communities, we looked at how communities within three cities varied by gun violence and economic
indicators. After controlling for the census tract and year effects, we found the following:
In Minneapolis, one less gun homicide in a census tract in a given year was statistically
significantly associated with the creation of 80 jobs and an additional $9.4 million in sales
across all business establishments the next year.
In Oakland, every additional gun homicide in a census tract in a given year was statistically
significantly associated with five fewer job opportunities in contracting businesses (businesses
losing employees) the next year.

V I E X E C U T I V E S U M M A R Y
In Washington, DC, every additional gun homicide in a census tract in a given year was
statistically significantly associated with two fewer retail and service establishments the next
year.
Examining the relationship between gunshots in a given year and employment and sales in
establishments that same year, we also were able to show that for Washington, DC, census
tracts covered by ShotSpotter sensors, 10 fewer gunfire incidents in a census tract were
significantly related to the creation of 20 jobs in new establishments, one new business
opening, one fewer establishment going out of business, and $1.3 million more in sales at new
establishments.
According to a subset analysis of census tracts across all three cities that experienced a surge in
homicides in 2011, controlling for existing levels of violence, we found that these surges were
significantly associated with an increase in contracting businesses.

The Effect of Gun Violence
on Local Economies This research report—the first report from the Urban Institute’s ongoing project on the effect of gun
violence on local economies—provides findings from three cities: Minneapolis, Minnesota; Oakland,
California; and Washington, DC.
We develop this report over four sections. First, we discuss what we know about the community-
level economic impact of gun violence. Next, we describe the methodology used in this project. We then
provide an overview of the annual broad trends in the level of gun violence, employment, and
establishments in the three study cities. Last, we present the findings from the panel data analysis and
conclude with a discussion of findings and suggestions for future work.
Background
Greenbaum and Tita (2004) and others (e.g., Stacy et al. 2016) argue that understanding businesses’
responses to violent crime is essential to understanding how crime limits the economic and non-
economic activities of community members (e.g., residents, business owners, and employees). In turn,
understanding community members’ responses to crime affects crime cycles.
Violence has an adverse impact on the economic health of communities, cutting into business
revenues and limiting business activities (Bowes 2007; Fisher 1991). The fear of gun violence, and
people’s perceived risk, has already been shown to impose a wide array of social (Dugan 1999) and
psychological burdens (Cohen 1988; Miller, Cohen, and Rossman 1993). Property values decrease as
violent crime increases (Hipp et al. 2009; Kirk and Laub 2010; Shapiro and Hassett 2012).
Further, research has calculated the hospital and lifetime health care costs of treating gunshot
injuries (Cook et al. 1999; Howell and Abraham 2013; Howell, Bieler, and Anderson 2014; Miller,
Cohen, and Rossman 1993), costs associated with lost productivity (Cook and Ludwig 2000), and how
much people are willing to pay to reduce the risk of gunshot injury (Cook and Ludwig 2000). In 2010, the
total firearm assault injury costs were just under $630 million (Howell and Abraham 2013). Gun
violence leads to higher associated costs across the criminal justice system because of prevention,
2 T H E E F F E C T O F G U N V I O L E N C E O N L O C A L E C O N O M I E S
investigation, court, and prison costs.1 All these factors translate into monetary costs that the public and
society at large pay for.
Despite this evidence that violence, and especially gun violence, has strong negative impacts on the
economic well-being of communities, we know comparatively little about the relationship between gun
violence and the economic health of neighborhoods at the most grassroots levels. The impact of gun
violence can extend beyond the victims and their families and can significantly affect the businesses and
residents in neighborhoods of gun violence in the form of downsizing, decreased revenues, and, in its
most severe form, the closing of businesses.
Very few studies have studied the impact of violent crime on local businesses with longitudinal data
(Greenbaum and Tita 2004; Stacy et al. 2016). But what we do know from longitudinal data is that
increases in deadly violence in zip codes caused businesses in the same zip codes to downsize and
prevented new businesses from forming (Greenbaum and Tita 2004) and that growth in economic
activity in a given year coincides with the decline in violent crime (Stacy et al. 2016).
Our current ongoing research builds on previous studies by Greenbaum and Tita (2004) and Stacy
and colleagues (2016). Our study leverages the precision of National Establishment Time-Series (NETS),
homicide, and gunfire detection technology (GDT) data to explore how changes and substantial surges
in gun violence affect the number of businesses, as well as employment and sales in businesses, in
census tracts.
Methods
This project uses a unique combination of very recently available data and micro-level data to capture
the effect of gun violence on local economies.
We use three annual measures for operationalizing economic activity at the census tract level:
number of establishments and employment; business sales in a given year; and annual growth rates of
net employment and the components of net employment, including the establishment, downsizing, and
closure of businesses (see table 1 for economic activity measures).
We use gun homicides at the census tract level for Minneapolis, Oakland, and Washington, DC,
along with additional gunshot data for DC, to measure gun violence.

T H E E F F E C T O F G U N V I O L E N C E O N L O C A L E C O N O M I E S 3
TABLE 1
Economic Activity Measures
Employment outcomes Employment in all establishment categories (hereinafter referred to as “all establishments”) Employment in retail and service industry establishments (hereinafter referred to as “retail and service establishments”) Employment in all new (birth) establishments Employment in new (birth) retail and service establishments Employment in all contracting establishments Employment in contracting retail and service establishments
Establishment count outcomes Number of all establishments Number of retail and service establishments Number of all new establishments Number of new retail and service establishments Number of all out-of-business (death) establishments Number of out-of-business (death) retail and service establishments Number of all contracting establishments Number of contracting retail and service establishments
Sales outcomes Sales in retail and service establishments Sales in new retail and service establishments Sales in contracting retail and service establishments
Gun Homicide Data
Homicide data were acquired from City of Minneapolis Police Department, Oakland Police Department,
and the Metropolitan Police Department of Washington, DC. Homicide data presented in this report
are all gun homicides between calendar years 2009 and 2012.
Gunshot Data
We acquired ShotSpotter gunshot data for Washington, DC, for the same period. Data from the
ShotSpotter GDT system offers a new source of information on firearm-related crimes. GDT uses a
network of acoustic sensors to identify the sound of a gunshot and relay this information to emergency
services personnel (Eng 2004; Showen 1997; Siuru 2007). Beginning in the 1990s, increasing numbers
of law enforcement agencies adopted GDT to improve their response to gun violence; by 2014, 50 cities
and 267 square miles were covered by just one GDT vendor system.2
The technology uses sensors to identify the gunfire sound and triangulate its position (figure 1).
Gunshots have a distinctive acoustic signature composed of the sound of the explosion, the muzzle
blast, the sound of the firearm’s projectiles, and, to lesser degrees, the mechanical sounds of the firearm
and vibrations from any solid surfaces near the discharge of the weapon (Maher 2007). A byproduct of

4 T H E E F F E C T O F G U N V I O L E N C E O N L O C A L E C O N O M I E S
FIGURE 1
How Gunfire Detection Technology Works
Source: Urban Institute.
the detection process is considerably precise, standardized data recording the location and time of
gunfire. The most recent versions of this technology also have been found to accurately record gunfire
under most conditions.3 Washington, DC’s gunfire system, ShotSpotter, was installed in 2005 and
currently covers a quarter (17 square miles) of the city’s total land area. Shots occurring on January 1,
T H E E F F E C T O F G U N V I O L E N C E O N L O C A L E C O N O M I E S 5
July 4, and December 31 were excluded because GDT systems tend to be overly sensitive on those days
because of the large number of firework detonations (Carr and Doleac 2016).
National Establishment Time-Series (NETS) Database
The 2013 NETS database, developed through a partnership with Dun and Bradstreet, includes more
than 52 million establishments with time-series information about their industries, location (by street
address), headquarters, performance (including sales), employment, and many other indicators between
1990 and 2012. The establishments in this database cover all businesses including sole-proprietors and
the self-employed. This database does not differentiate between full- and part-time employees.
In addition, this database counts owners as employees. Therefore, while a sole proprietor with three
employees should be captured by the Bureau of Labor Statistics data as a three-employee firm, it will be
captured as a four-employee establishment in the NETS database. We used several indicators of
business health in the analytic models documented here (see table 1). The indicators used in each model
are detailed in the corresponding model specification section.
American Community Survey Data
We conducted a subset analysis on the effect of a surge in gun violence on economic activity in
neighborhoods with an increase in gun violence levels from a baseline year. The aim of this analysis is to
understand the differential effect of a surge in gun violence in census tracts with already high levels of
gun violence versus census tracts with comparatively low increases in gun violence.
We used five indicators from the 2006–10 ACS five-year estimates (percentage of female-headed
households, unemployment rate, percentage of the population that is black, median household income,
and median household value) to create matched control groups and test whether a substantial increase in
homicides in a census tract affected employment and establishment growth rates in the subsequent year.
Though the gun homicide, gunshot, and NETS data are available at the address level, the smallest
territorial unit for which ACS data are available is the census tract. Because of the rarity of gun
homicides (relative to other forms of violent crimes) and the census tract–level resolution of ACS data,
all other data were joined to the city census tracts (rather than block groups).

6 T H E E F F E C T O F G U N V I O L E N C E O N L O C A L E C O N O M I E S
Regression Models
We used fixed-effects regression estimates and difference-in-differences estimates to examine the
association between gun violence and economic activity at the census tract level (appendix A describes
these methods and model specifications).
We defined economic activity by the number of establishments; employment and components of
employment, including new, closed, and contracting establishments; and sales in all establishments and
a subset of retail and service industries (see table 1). A new business is one at a particular location that
had no employment in the previous year and had positive employment in the current year. A closed
establishment had positive employment in the previous year and no employment in the current year. A
contracting establishment had a higher number of employees in the previous year than the current year.
Building on the work of Greenbaum and Tita (2004), we used propensity score matching (see
appendix A) to examine the impact of gun violence on net employment and components of net
employment at the census tract level. The aim of this subset analysis is to explore how surges in gun
violence affect the following economic outcomes in the subsequent year:
employment growth in establishments
employment growth in new establishments
employment growth in contracting establishments
growth in the number of establishments
growth in the number of new establishments
growth in the number of closed establishments
growth in the number of contracting establishments
A census tract is considered to have surged if, following a baseline year (2010), it had at least one
more homicide in the subsequent (observation) year and its level of gun homicide (number of homicides)
is above the median count of homicides in all census tracts with an increase. The census tracts that
experienced a surge in homicides in each city in 2011 were matched with non-surge census tracts that
also experienced an increase in homicides but had homicide levels below the median value in 2011. Table 2
shows the surge status by city for all census tracts that had an increase in homicides in 2011.

T H E E F F E C T O F G U N V I O L E N C E O N L O C A L E C O N O M I E S 7
TABLE 2
Census Tract Surge by City
Surge Yes No
Minneapolis 5 15 Oakland 15 33 Washington, DC 14 18
City Profiles
Minneapolis, Minnesota
The 48th largest city in the United States, Minneapolis’s population was 382,578 in 2010.4 The same
year, the city’s median household income was $46,075, compared with the US average of $49,445. The
Minneapolis workforce is highly educated and skilled. Forty-seven percent of its residents held
bachelor’s degrees in 2010. Of the 206,892 residents employed in the workforce the same year, 44.3
percent held jobs in management, business, science, and the arts; 23.3 percent worked in sales and
office occupations; and 18.3 percent worked in service occupations.5
The industries employing the largest percentage of the Minneapolis workforce were education,
health care, and social assistance, which accounted for 25.7 percent of the workforce; professional,
scientific, and management, and administrative and waste management services (14.4 percent each);
arts, entertainment, and recreation and accommodation and food services (11.9 percent each); retail
(11.5 percent); manufacturing (8.4 percent); and finance, insurance, and real estate (8.1 percent).6 In
2010, the city’s unemployment rate was 6.6 percent, while 16.4 percent of the city’s population had
income below the poverty level.
The same year, the homicide rate in Minneapolis was 9.6 per 100,000 people, and the violent crime
rate was 1,053.6 per 100,000 people. In 2012, Minneapolis’s gun homicide rate increased to 10.7 per
100,000 people—exactly the national rate.7 Looking closer, while 2009 marked the least gun-related
homicides (12), this number tripled in 2010 and remained at the same level until 2012 (table 3).
TABLE 3
Census Tract Gun Homicide Statistics for Minneapolis, MN
Observations Mean Standard deviation Minimum Maximum Total
2009 134 0.1 0.3 0 2 12 2010 134 0.3 0.7 0 4 39 2011 134 0.3 0.6 0 4 37 2012 134 0.3 0.7 0 6 42
Source: City of Minneapolis Police Department Crime Incident data.

8 T H E E F F E C T O F G U N V I O L E N C E O N L O C A L E C O N O M I E S
Between 2009 and 2012, employment in all city establishments increased from 326,800 to 352,766;
in retail and service establishments, employment increased from 200,513 to 224,594 (table 4). However,
the number of new establishments decreased (table 4). Average sales by census tract increased (table 5).
TABLE 4
Census Tract Establishment and Employment Statistics for Minneapolis, MN
Observations Mean Standard deviation Total
2009
All establishments 134 214 323 28,697 Employment 134 2,438 7,454 326,800 New establishments 134 28 31 3,801 Closed establishments 134 60 85 8,151
Retail and service 134 153 222 20,507 Employment 134 1,496 4,023 200,513 New establishments 134 20 20 2,646 Closed establishments 134 43 56 5,882
2010
All establishments 134 250 367 33,627 Employment 134 2,547 8,532 341,338 New establishments 134 50 67 6,734 Closed establishments 134 13 25 1,766
Retail and service 134 179 256 24,041 Employment 134 1,534 4,139 208,570 New establishments 134 35 49 4,785 Closed establishments 134 9 17 1,209
2011
All establishments 134 250 363 33,544 Employment 134 2,593 8,768 347,595 New establishments 134 27 42 3,643 Closed establishments 134 27 42 3,666
Retail and service 134 178 254 23,892 Employment 134 1,556 4,241 208,596 New establishments 134 17 27 2,330 Closed establishments 134 19 27 2,479
2012
All establishments 134 235 343 31,490 Employment 134 2,632 7,935 352,766 New establishments 134 10 16 1,356 Closed establishments 134 25 34 3,392
Retail and service 134 166 241 22,276 Employment 134 1,676 4,511 224,594 New establishments 134 6 10 782 Closed establishments 134 18 24 2,386
Source: National Establishment Time-Series database.

T H E E F F E C T O F G U N V I O L E N C E O N L O C A L E C O N O M I E S 9
TABLE 5
Census Tract Establishment Sales Statistics for Minneapolis, MN
In 2009 dollars
Mean Standard deviation
2009 All retail and service establishments 135,596,636 362,841,751 New retail and service establishments 6,485,154 22,460,687 Contracting retail and service establishments 8,726,646 35,720,373
2010 All retail and service establishments 137,449,160 355,656,769 New retail and service establishments 4,826,065 10,064,000 Contracting retail and service establishments 1,234,342 7,968,967
2011 All retail and service establishments 292,259,796 1,110,840,429 New retail and service establishments 6,456,195 24,600,000 Contracting retail and service establishments 4,207,987 14,809,862
2012 All retail and service establishments 272,924,808 980,823,791 New retail and service establishments 3,029,733 10,378,623 Contracting retail and service establishments 4,664,542 20,283,735
Source: National Establishment Time-Series database.
Note: Sales for each year were converted to 2009 dollars using Consumer Price Index conversion factors.
Oakland, California
Oakland was the 47th largest city in 2010 with a population of 390,724.8 The city’s median household
income was $49,721, roughly the same as the US average of $49,445. In 2010, 38.6 percent of Oakland
residents held bachelor’s degrees.
Of the 310,016 people in the workforce, 41.3 percent held jobs in management, business, science,
and the arts; 20.8 percent worked in sales and office occupations; 19.3 percent worked in service
occupations; and 10.1 percent worked in production, transportation, and material moving.9
The city’s unemployment rate was 6.7 percent, while 15.7 percent of the city’s families had incomes
below the poverty level.10
The violent crime rate in Oakland in 2010 was 1,529 per 100,000 people,
with a homicide rate of 21 per 100,000 people. In 2012, Oakland’s gun homicide rate increased to 28.9
per 100,000 people—2.5 times the national average.
Looking closer, while 2010 had the fewest gun-related homicides (78) between 2009 and 2012, this
number increased to 116 in 2012 (table 6).

1 0 T H E E F F E C T O F G U N V I O L E N C E O N L O C A L E C O N O M I E S
TABLE 6
Census Tract Gun Homicide Statistics for Oakland, CA
Observations Mean Standard deviation Minimum Maximum Total 2009 113 0.83 1.26 0 8 94 2010 113 0.69 1.14 0 8 78 2011 113 0.88 1.23 0 7 100 2012 113 1.02 1.32 0 7 116
Source: City of Oakland Police Department Crime Incident data.
Between 2011 and 2012, the number of new establishments in Oakland decreased (table 7). In the
same period, employment in all city establishments decreased from 210,132 to 205,008; employment in
retail and service establishments decreased from 130,095 to 120,102. Average sales in census tracts
increased from 2009 to 2012 (table 8).
TABLE 7
Census Tract Establishment and Employment Statistics for Oakland, CA
Observations Mean Standard deviation Total
2009
All establishments 113 239 219 27,074 Employment 113 1,745 2,813 197,281 New establishments 113 22 18 2,575 Closed establishments 113 69 67 7,907
Retail and service 113 174 159 19,762 Employment 113 1,061 1,488 119,993 New establishments 113 22 18 2,575 Closed establishments 113 50 46 5,724
2010
All establishments 113 288 247 32,567 Employment 113 1,806 2,726 204,140 New establishments 113 66 49 7,564 Closed establishments 113 17 20 1,997
Retail and service 113 226 193 25,566 Employment 113 1,155 1,544 130,440 New establishments 113 46 34 5,232 Closed establishments 113 12 14 1,397
2011
All establishments 113 284 250 32,124 Employment 113 1,859 8,768 210,132 New establishments 113 28 29 3,273 Closed establishments 113 32 25 3,620
Retail and service 113 214 188 24,214 Employment 113 1,151 1,523 130,095 New establishments 113 19 19 2,196 Closed establishments 113 21 17 2,481

T H E E F F E C T O F G U N V I O L E N C E O N L O C A L E C O N O M I E S 1 1
Observations Mean Standard deviation Total
2012
All establishments 113 262 236 29,616 Employment 113 1,814 2,893 205,008 New establishments 113 12 10 1,356 Closed establishments 113 34 26 3,850
Retail and service 113 187 170 21,177 Employment 113 1,062 1,390 120,102 New establishments 113 6 6 752 Closed establishments 113 25 18 2,853
Source: National Establishment Time-Series database.
TABLE 8
Census Tract Establishment Sales Statistics for Oakland, CA
In 2009 dollars
Mean Standard deviation
2009 All retail and service establishments 71,698,342 151,349,219 New retail and service establishments 2,600,692 7,309,972 Contracting retail and service establishments 1,155,057 4,319,208
2010 All retail and service establishments 77,017,541 1,321,578,585 New retail and service establishments 3,849,431 5,157,433 Contracting retail and service establishments 1,269,176 5,086,610
2011 All retail and service establishments 87,436,837 303,228,766 New retail and service establishments 21,950,718 191,243,164 Contracting retail and service establishments 762,437 2,446,322
2012 All retail and service establishments 135,897,835 1,180,762,100 New retail and service establishments 20,304,911 2,767,566 Contracting retail and service establishments 795,563 3,718,190
Source: National Establishment Time-Series database.
Note: Sales for each year were converted to 2009 dollars using Consumer Price Index conversion factors.
Washington, DC
Washington, DC, was the 24th most populous city in 2010, with a population of 601,723.11
The city’s
median family income was $70,88312
and median home sales price was $563,000.13
In DC, 57.7 percent
of the workforce was employed in management, business, science, and the arts. The other largest
occupations were sales and office (18.6 percent) and services (15.8 percent). The two largest industries
1 2 T H E E F F E C T O F G U N V I O L E N C E O N L O C A L E C O N O M I E S
were finance, insurance, and real estate (22.4 percent); and educational services and health care and
social assistance (19.7 percent each).
The violent crime rate in 2010 was 1,214 violent crimes per 100,000 people, above the average of
819 per 100,000 for US cities with populations between 500,000 and 999,999. Firearms were used in
76 percent of homicides, 19 percent of aggravated assaults, and 40 percent of robberies.14
The sizeable
amount of the city covered by SpotShotter gunshot detection technology—17.3 square miles—makes
DC an ideal city to study the relationship between economic indicators and gun violence, measured by
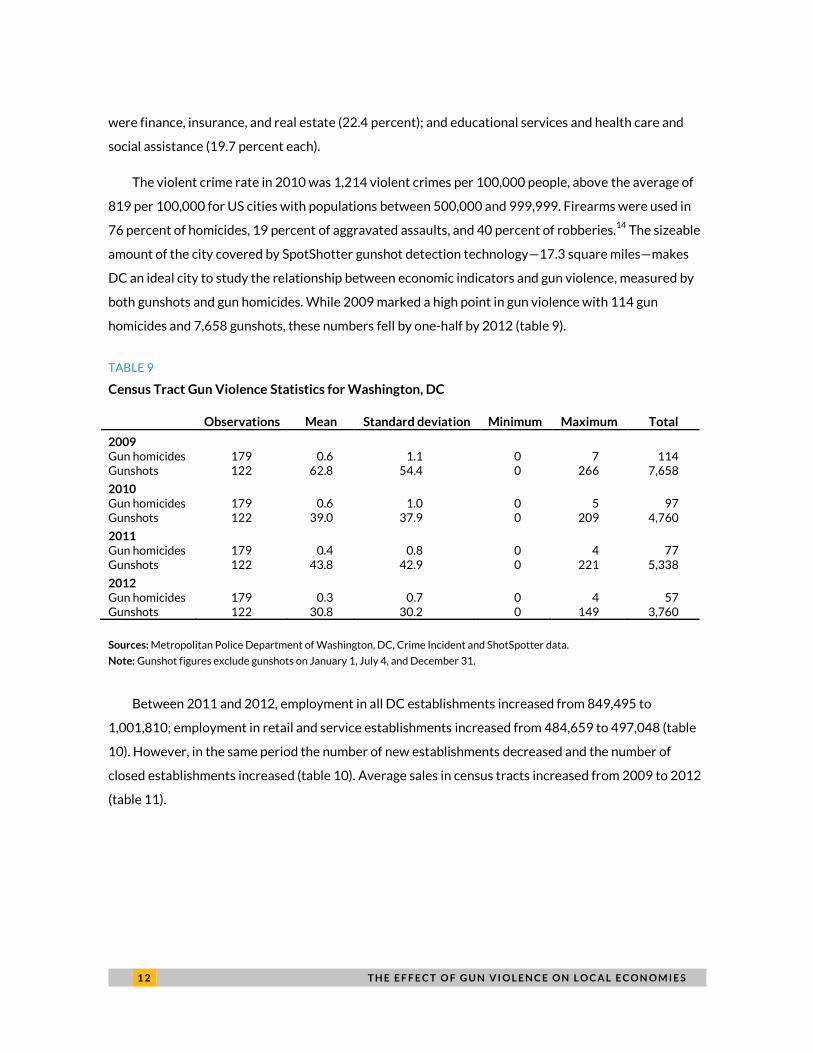
both gunshots and gun homicides. While 2009 marked a high point in gun violence with 114 gun
homicides and 7,658 gunshots, these numbers fell by one-half by 2012 (table 9).
TABLE 9
Census Tract Gun Violence Statistics for Washington, DC
Observations Mean Standard deviation Minimum Maximum Total
2009 Gun homicides 179 0.6 1.1 0 7 114 Gunshots 122 62.8 54.4 0 266 7,658
2010 Gun homicides 179 0.6 1.0 0 5 97 Gunshots 122 39.0 37.9 0 209 4,760
2011 Gun homicides 179 0.4 0.8 0 4 77 Gunshots 122 43.8 42.9 0 221 5,338
2012 Gun homicides 179 0.3 0.7 0 4 57 Gunshots 122 30.8 30.2 0 149 3,760
Sources: Metropolitan Police Department of Washington, DC, Crime Incident and ShotSpotter data.
Note: Gunshot figures exclude gunshots on January 1, July 4, and December 31.
Between 2011 and 2012, employment in all DC establishments increased from 849,495 to
1,001,810; employment in retail and service establishments increased from 484,659 to 497,048 (table
10). However, in the same period the number of new establishments decreased and the number of
closed establishments increased (table 10). Average sales in census tracts increased from 2009 to 2012
(table 11).

T H E E F F E C T O F G U N V I O L E N C E O N L O C A L E C O N O M I E S 1 3
TABLE 10
Census Tract Establishment and Employment Statistics for Washington, DC
Observations Mean Standard deviation Total
2009
All establishments 179 312 711 55,977 Employment 179 4,447 12,522 796,126 New establishments 179 27 46 5,000 Closed establishments 179 62 147 11,180
Retail and service 179 116 358 52,344 Employment 179 1,042 4,142 469,180 New establishments 179 22 36 3,909 Closed establishments 179 48 116 8,669
2010
All establishments 179 144.9 422 65,241 Employment 179 1,796 7,138 808,438 New establishments 179 29 80 7,658 Closed establishments 179 8 29 3,775
Retail and service 179 120 360 54,005 Employment 179 1,066 4,165 479,795 New establishments 179 23 67 10,467 Closed establishments 179 8 28 3,775
2011
All establishments 179 365 800 65,305 Employment 179 4,745 12,960 849,495 New establishments 179 37 83 6,549 Closed establishments 179 35 78 6,297
Retail and service 179 284 644 50,868 Employment 179 2,707 7,737 484,659 New establishments 179 26 61 4,686 Closed establishments 179 27 61 4,842
2012
All establishments 179 347 749 62,062 Employment 179 5,597 16,505 1,001,810 New establishments 179 14 25 2,517 Closed establishments 179 36 77 6,484
Retail and service 179 295 659 52,832 Employment 179 2,776 8,270 497,048 New establishments 179 4 9 1,746 Closed establishments 179 11 32 5,025
Source: National Establishment Time-Series database.
1 4 T H E E F F E C T O F G U N V I O L E N C E O N L O C A L E C O N O M I E S
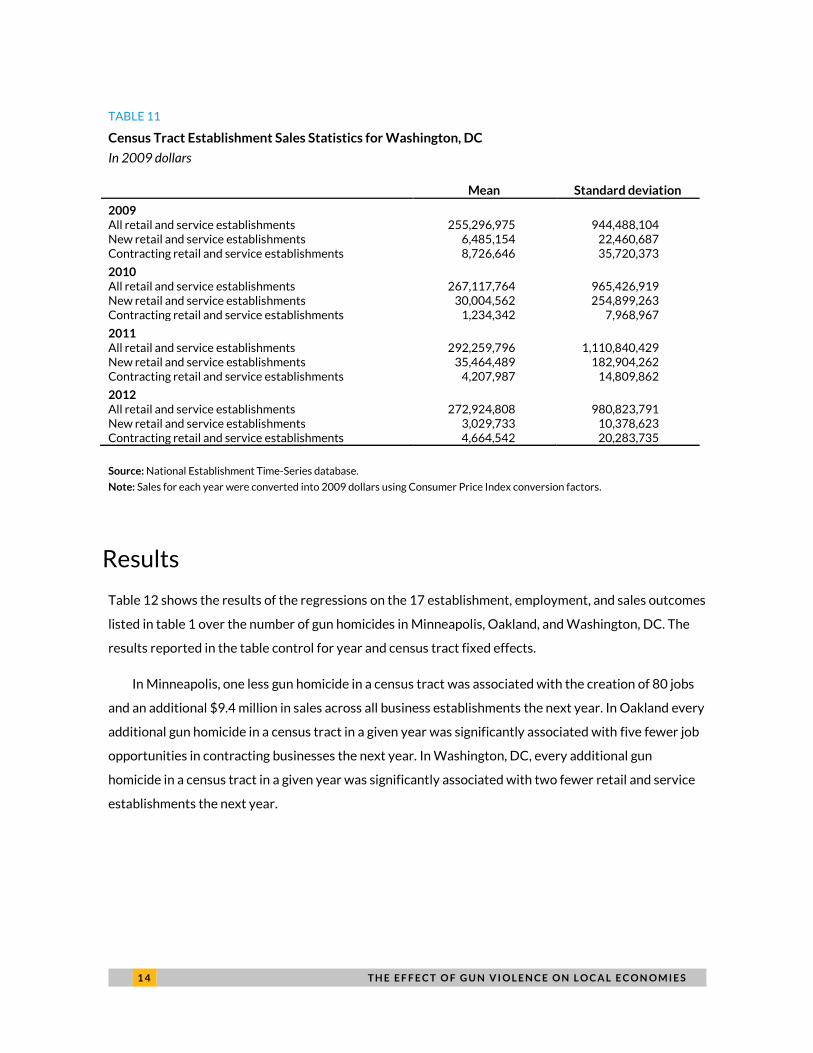
TABLE 11
Census Tract Establishment Sales Statistics for Washington, DC
In 2009 dollars
Mean Standard deviation
2009 All retail and service establishments 255,296,975 944,488,104 New retail and service establishments 6,485,154 22,460,687 Contracting retail and service establishments 8,726,646 35,720,373
2010 All retail and service establishments 267,117,764 965,426,919 New retail and service establishments 30,004,562 254,899,263 Contracting retail and service establishments 1,234,342 7,968,967
2011 All retail and service establishments 292,259,796 1,110,840,429 New retail and service establishments 35,464,489 182,904,262 Contracting retail and service establishments 4,207,987 14,809,862
2012 All retail and service establishments 272,924,808 980,823,791 New retail and service establishments 3,029,733 10,378,623 Contracting retail and service establishments 4,664,542 20,283,735
Source: National Establishment Time-Series database.
Note: Sales for each year were converted into 2009 dollars using Consumer Price Index conversion factors.
Results
Table 12 shows the results of the regressions on the 17 establishment, employment, and sales outcomes
listed in table 1 over the number of gun homicides in Minneapolis, Oakland, and Washington, DC. The
results reported in the table control for year and census tract fixed effects.
In Minneapolis, one less gun homicide in a census tract was associated with the creation of 80 jobs
and an additional $9.4 million in sales across all business establishments the next year. In Oakland every
additional gun homicide in a census tract in a given year was significantly associated with five fewer job
opportunities in contracting businesses the next year. In Washington, DC, every additional gun
homicide in a census tract in a given year was significantly associated with two fewer retail and service
establishments the next year.

T H E E F F E C T O F G U N V I O L E N C E O N L O C A L E C O N O M I E S 1 5
TABLE 12
Gun Homicide Fixed Effects OLS Regression on Establishment Number, Employment, and Sales
By establishment type
City and industry New Closed Contracting Total
Minneapolis
All Establishment -3.4 (2.8) 1.5 (1.2) -0.1 (0.2) -2.42 ( 1.55) Employment -79.8 (60.9) N/A -4.3 (7.7) - 80.0 (44.8)* Sales N/A N/A N/A -9,481,988 (5e+07)*
Retail and service Establishment -3.0 (2.3) 0.7 (0.7) -0.01 (0.17) -1.8 (1.1) Employment -79.8 (60.9) N/A -0.3 (5.1) -42.8 (27.0) Sales -2,923,690 (2e+6) N/A 2,709 (6e+5) 518,264 (5e+06)
Oakland
All Establishment 0.6 (0.8) 0.3 (0.4) 0.1 (0.1) 0.5 (0.6) Employment 16.3 (9.7) N/A -5.2 (3.1)* 12.1 (11.5) Sales 8,473,020 (8e+6) N/A -200,789 (3e+5) 4,862,555 (4e+6)
Retail and service Establishment 0.3 (0.7) 0.2 (0.3) 0.16 (0.1) -.8 (4.1) Employment -0.14 (2.9) N/A -0.9 (1.3) -2.6 (5.6) Sales 7,842,374 (7e+6) N/A 11,469 (1e+5) 3,010,006 (3e+6)
Washington, DC
All Establishment -5.2 (3.5) 0.4 (0.5) -0.1 (0.5) 2.9 (1.8) Employment 4.7 (21.6) N/A 1.29 (2.44) -31.5 (129.2) Sales -5,670,451 (6e+6) N/A -58,533 (1e+6) -5,670,451 (6e+6)
Retail and service Establishment 0.9 (1.3) -2.7 (1.3) -0.1 (0.1) -1.9 (0.8)** Employment -6.4 (10.7) N/A 0.8 (1.2) 34.9 (22.9) Sales -4,046,506 (4e+6) N/A -6,013 (1e+5) -1,068,725 (4e+6)
Source: National Establishment Time-Series database.
Notes: Standard errors in parentheses. N/A = not applicable.
* p ≤ 0.1; ** p ≤ 0.05
We conducted additional regressions on the 17 establishment, employment, and sales outcomes
controlling for the year and census tract effects. Examining the relationship between gunshots in a given
year and employment and sales in establishments that same year, we show that for census tracts
covered by ShotSpotter sensors, 10 fewer incidents of gunfire in a census tract were significantly
related with the creation of 20 jobs in new establishments, one new business opening, one fewer
business closing, and $1.3 million more in sales at new establishments.
We also conducted a difference-in-differences analysis to compare the pre-surge to post-surge
growth rates in all establishments, retail and service establishments, and employment in both industry
groups between treatment (an increase from baseline year and a gun homicide level above the median gun

1 6 T H E E F F E C T O F G U N V I O L E N C E O N L O C A L E C O N O M I E S
homicides among all census tracts with an increase in gun homicides in the same year) and control (an increase
from baseline year and a gun homicide level below the median gun homicides among all census tracts with an
increase in gun homicides in the same year) census tracts. According to this subset analysis (table 13),
controlling for existing levels of violence, surges in gun homicides from a baseline year were
significantly associated with a 1 percent increase in the growth rate of all contracting establishments
and contracting retail and service establishments.
TABLE 13
OLS Regression on Number of Establishments and Employment
By establishment type
New Closed Contracting Total
All Establishment -0.02 (0.02) -0.01 (0.01) 0.01 (0.01)* -0.01 (0.04) Employment -0.03 (0.04) N/A -0.01 (0.01) -0.01 (0.04)
Retail and service Establishment -0.03 (0.02) -0.01 (0.1) 0.01 (0.01)* -0.01 (0.03) Employment -0.01 (0.01) N/A 0.01 (0.01) 0.04 (0.07)
Source: National Establishment Time-Series database.
Notes: Standard errors in parentheses. N/A = not applicable.
* p ≤ 0.1
Conclusions
Our preliminary findings show that an increase in gun homicides or gunfire in neighborhoods can lower
the number of establishments, employment in establishments, and sales in establishments. The city-
specific results show that these effects can differ; however, in all cities an increase in gun violence has a
negative effect on different components of establishments and employment. Results suggest that these
negative effects can be felt more by new or contracting establishments. The results from our surge
analysis indicate differences in the economic health of neighborhoods that experience a relatively high
increase in gun homicides versus the ones that do not.
Our results support the findings from the recent but scant literature on the negative relationship
between violent crime and neighborhood economic activity. With the availability of new datasets on
neighborhood indicators of economic health and new measures of crimes and victimization (GDT
technologies as well as crowdsourced victimization data), future research should continue examining
how violent crime, and specifically firearm-related crimes and the fear of such, affect the choices and
behavior of people who live in and visit high- and low-crime neighborhoods.

T H E E F F E C T O F G U N V I O L E N C E O N L O C A L E C O N O M I E S 1 7
The preliminary findings from this study suggest that retail and service industries might be
disproportionately affected by gun violence levels. Future quantitative and qualitative studies should
pay particular attention to subcategories within retail and service industries and to different sizes of
businesses. Such studies should explore if certain establishments that rely heavily on foot traffic and
customer interaction suffer particularly from gun violence, in terms of additional costs required for
security and difficulties attracting customers and employees.
1 8 A P P E N D I X A
Appendix A. Fixed Effects and
Difference-in-Differences Estimates
Estimating the Fixed Effects
In researchers’ quest to determine the causal effect of changing a variable x1 (such as gun violence) on
an outcome y ( such as economic activity) the ideal source of variation is an exogenous variation in an
experimental setting, where all variation would be independent of any other variables affecting the
outcome.
Where such experimental settings are not possible, researchers overcome endogeneity issues using
different methodologies, such as measurement error, simultaneity, and omitted variables. One of these
methods is including a fixed effect to panel regression models to exploit within-group variation over
time. A fixed-effects regression model essentially assumes that unobservable factors that might
simultaneously affect the outcome and the predictor are time-invariant. In this study, to estimate the
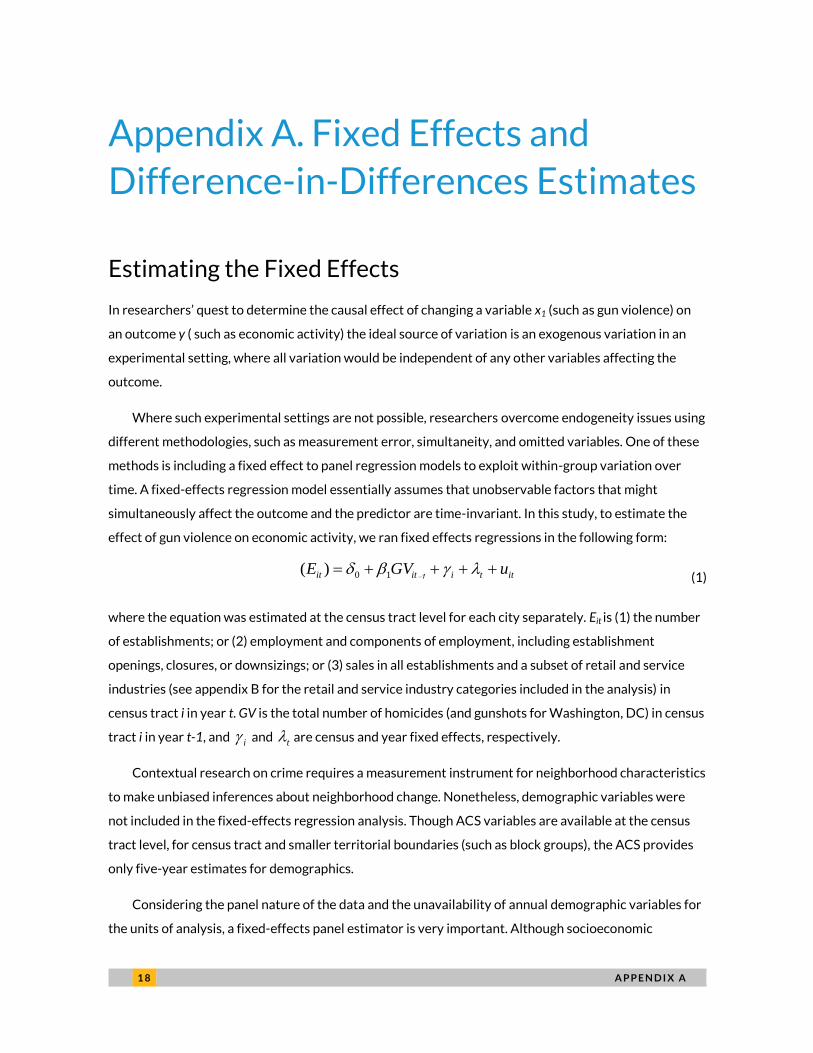
effect of gun violence on economic activity, we ran fixed effects regressions in the following form:
ittiitit uGVE
110)(
(1)
where the equation was estimated at the census tract level for each city separately. Eit is (1) the number
of establishments; or (2) employment and components of employment, including establishment
openings, closures, or downsizings; or (3) sales in all establishments and a subset of retail and service
industries (see appendix B for the retail and service industry categories included in the analysis) in
census tract i in year t. GV is the total number of homicides (and gunshots for Washington, DC) in census
tract i in year t-1, and i and t are census and year fixed effects, respectively.
Contextual research on crime requires a measurement instrument for neighborhood characteristics
to make unbiased inferences about neighborhood change. Nonetheless, demographic variables were
not included in the fixed-effects regression analysis. Though ACS variables are available at the census
tract level, for census tract and smaller territorial boundaries (such as block groups), the ACS provides
only five-year estimates for demographics.
Considering the panel nature of the data and the unavailability of annual demographic variables for
the units of analysis, a fixed-effects panel estimator is very important. Although socioeconomic

A P P E N D I X A 1 9
characteristics are expected to differ across groups (census tracts), working with a short panel (three
years) of crime and economic activity data, within-group differences of sociodemographic character-
istics are expected to be relatively smaller. Table 1 (see page 3) lists the 17 economic activity measures
we used in the fixed effects regressions, including establishment, employment, and sales outcomes.
Estimating the Difference-in-Differences with Propensity
Score Matching
Another statistical method that has been widely employed in social sciences to estimate the causal
effects of an intervention is the propensity score matching (PSM) techniques (Rosenbaum and Rubin
1983). A propensity score refers to the probability of the unit of analysis in a study (such as a census
tract) receiving a treatment or condition (a surge in gun violence in our case) based on observational
characteristics. The PSM method refers to a statistical procedure that uses observational
characteristics to produce scores to match treatment and control groups.
In this project, using PSM, we build on the work of Greenbaum and Tita (2004) to examine the
impact of gun violence on annual growth rate (at the census tract level) of net employment and
components of net employment with a subset analysis of census tracts included in our analysis. The aim
of this subset analysis is to explore how surges in gun violence from a baseline year affect the economic
outcomes in the subsequent year, in comparison to the economic growth rates before the surge.
The dependent variables for this analysis are annual growth rates at the census tract level of net
employment and the components of net employment including the births, deaths, and contractions of
establishments. Similar to the fixed effects regression analysis method described earlier, the growth
rates are calculated for all establishment categories and retail and service industry categories. The
growth rate for each category of establishment is estimated as follows:
Gjit=(Ej
it -Ejit-1)/Ej
it-1 (2)
where growth (G) in each category j (new, closed, contracting) in census tract i is calculated by
subtracting the employment at that category in the census tract in the previous year from the
employment in the same category in the same census tract in the current year and dividing it by the
total employment in the census tract in the previous year.

2 0 A P P E N D I X A
Growth rates for the number of establishments that are births and deaths for each category are
defined as
Gjit= Nj
it/Nit (3)
where N is the number of establishments. For the calculation of the growth in the number of contracting
establishments in equation 3, the E in equation 2 is replaced with N.
The Propensity Score Matching Process
To compare economic activity in census tracts with a surge in gun violence with outcomes of census
tracts with no surges in gun violence, every census tract that had a surge in homicides in 2011 needed to
be matched with another census tract that did not have a surge in gun violence in the same year. The
logic of assessing the impact of homicide surges rather than changes in raw homicides is that prior
research (Greenbaum and Tita 2004) has shown that business activity could account for crime and
violence levels in the area where the business is located. Thus, a neighborhood experiencing substantial
changes in violence can affect business activity differently than a neighborhood with a consistent level
of crime activity.
The independent variables included in the analysis to match surge and non-surge census tracts are
measures that research has shown to impact the likelihood of a census tract to have a surge in gun
violence. To estimate the probability of each census tract to have a homicide a surge indicator (a binary
variable created based on the two-step definition above) is regressed on five sociodemographic
variables of the census tracts (percent of female-headed households, percent unemployed, percent
black population, median household income, and median house value) that were drawn from the ACS
2006–10 five-year estimates. The selection of these variables was informed by the literature on violent
crime (see Greenbaum and Tita 2004 for a longer discussion). With these variables we aimed to capture
the population characteristics in a census tract including demography, economic well-being, family
structure, and housing attributes. Within each city we used a nearest neighbor method with
replacement to match the propensity score of each census tract with a surge in homicides to a census
tract without a surge that had the closest score.

A P P E N D I X A 2 1
After the matching process, we used difference-in-differences estimates to compare changes in
employment growth rates from before to after extreme surges in homicide in the three study cities
using the following equation:
y= β0 + β1dB + δ0d2 + δ1d2 •dB +u (4)
where y is the outcome of interest and d2 is a dummy variable for the second time period. The dummy
variable dB captures the differences between the surge and non-surge census tracts before the surge.
The time period dummy, d2, captures factors that would cause changes in the outcome even in the
absence of a surge. The coefficient of interest, δ1, multiplies the interaction term, d2 •dB, which is the
same as a dummy variable equal to one for those observations in the treatment group in the second
period. Standard errors for the model were clustered at the city level. The difference-in-differences
estimate is
∆δ= (�̅�B,2-�̅�B,1)-(�̅�A,2-�̅�A,1) (5)

2 2 A P P E N D I X B
Appendix B. Selected Retail and
Service Industry Codes
Code Industry title
52 Building materials, hardware, garden supply and mobile home dealers 53 General merchandise stores 54 Food stores 55 Automotive dealers and gasoline service stations 56 Apparel and accessory stores 57 Home furniture, furnishings and equipment stores 58 Eating and drinking places 59 Miscellaneous retail 70 Hotels, rooming houses, camps, and other lodging places 72 Personal services 73 Business services 75 Automotive repair, services and parking 76 Miscellaneous repair services 78 Motion pictures 79 Amusement and recreation services 80 Health services 81 Legal services 82 Educational services 83 Social services 84 Museums, art galleries and botanical and zoological gardens 86 Membership organizations 87 Engineering, accounting, research, management and related services 89 Services, not elsewhere classified

N O T E S 2 3
Notes 1. Mark Follman, Julia Lurie, Jaeah Lee, and James West, “The True Costs of Gun Violence in America,” Mother
Jones, May/June 2015, http://www.motherjones.com/politics/2015/04/true-cost-of-gun-violence-in-america.
2. “Seven New Cities Roll Out ShotSpotter Technology to Help Prevent Crime and Reduce Gun Violence,” SST,
Inc., press release, October 27, 2016, http://www.shotspotter.com/press-releases/article/additional-cities-
sign-on-to-use-shotspotter-to-combat-illegal-urban-gunshot.
3. Erica Goode, “Shots Fired, Pinpointed and Argued Over,” New York Times, May 28, 2012,
http://www.nytimes.com/2012/05/29/us/shots-heard-pinpointed-and-argued-
over.html?pagewanted=all&_r=0.
4. “American Fact Finder,” US Census Bureau, accessed October 1, 2016,
http://factfinder.census.gov/faces/nav/jsf/pages/index.xhtml.
5. Ibid.
6. Ibid.
7. “CDC WONDER,” Centers for Disease Control and Prevention, accessed October 1, 2016,
https://wonder.cdc.gov/.
8. “American Fact Finder,” US Census Bureau.
9. Ibid.
10. Ibid.
11. Ibid.
12. Ibid.
13. “DC City Profile–Housing,” Neighborhood Info DC, revised July 6, 2016,
http://www.neighborhoodinfodc.org/city/Nbr_prof_cityc.html.
14. “Table 8. Offenses Known to Law Enforcement, Washington, DC,” Crime in the United States, 2010, Federal
Bureau of Investigation, accessed November 1, 2016, https://ucr.fbi.gov/crime-in-the-u.s/2010/crime-in-the-
u.s.-2010/tables/table-8/10tbl08dc.xls.

2 4 R E F E R E N C E S
References Bowes, David R. 2007. “A Two-Stage Model of the Simultaneous Relationship between Retail Development and
Crime.” Economic Development Quarterly 21 (1): 79–90.
Carr, Jillian B., and Jennifer L. Doleac. 2016. The Geography, Incidence, and Underreporting of Gun Violence: New
Evidence Using ShotSpotter Data. Washington, DC: Brookings Institution.
Cohen, Mark A. 1988. “Pain, Suffering, and Jury Awards: A Study of the Cost of Crime to Victims.” Law and Society
Review 22 (3): 537–55.
Cook, Philip J., Bruce A. Lawrence, Jens Ludwig, and Ted R. Miller. 1999. “The Medical Costs of Gunshot Injuries in
the United States.” Journal of the American Medical Association 281 (5): 447–54.
Cook, Philip J., and Jens Ludwig. 2000. Gun Violence: The Real Costs. Oxford: Oxford University Press.
Dugan, Laura. 1999. “The Effect of Criminal Victimization on a Household’s Moving Decision.” Criminology 37 (4): 903–30.
Eng, Thomas R. 2004. “Population Health Technologies: Emerging Innovations for the Health of the Public.”
American Journal of Preventive Medicine 26 (3): 237–42.
Fisher, Bonnie. 1991. “A Neighborhood Business Area Is Hurting: Crime, Fear of Crime, and Disorders Take Their
Toll.” Crime & Delinquency 37 (3): 363–73.
Greenbaum, Robert T., and George E. Tita. 2004. “The Impact of Violence Surges on Neighbourhood Business
Activity.” Urban Studies 41 (13): 2495–514.
Hipp, John R., George E. Tita, and Robert T. Greenbaum. 2009. “Drive-Bys and Trade-Ups: Examining the
Directionality of the Crime and Residential Instability Relationship.” Social Forces 87 (4): 1778–812.
Howell, Embry, Sam Bieler, and Nathaniel Anderson. 2014. State Variation in Hospital Use and Cost of Firearm Assault
Injury, 2010. Washington, DC: Urban Institute.
Howell, Embry, and Peter Abraham. 2013. Hospital Costs of Firearm Assaults. Washington, DC: Urban Institute.
Kirk, David S., and John H. Laub. 2010. “Neighborhood Change and Crime in the Modern Metropolis.” Crime and
Justice 39 (1): 441–502.
Maher, Robert C. 2007. “Acoustical Characterization of Gunshots.” In Proceedings of IEEE SAFE 2007: Workshop on
Signal Processing Applications for Public Security and Forensics, 109–13. Washington, DC: Institute of Electrical
and Electronics Engineers.
Miller, Ted R., Mark A. Cohen, and Shelli B. Rossman. 1993. “Victim Costs of Violent Crime and Resulting Injuries.”
Health Affairs 12 (4): 186–97.
Rosenbaum, Paul R., and Donald B. Rubin. 1983. “The Central Role of the Propensity Score in Observational Studies
for Causal Effects.” Biometrika 70 (1): 41–55.
Shapiro, Robert J., and Kevin A. Hassett. 2012. The Economic Benefits of Reducing Violent Crime: A Case Study of 8
American Cities. Washington, DC: Center for American Progress.
Showen, Robert. 1997. “Operational Gunshot Location System.” In Proceedings of SPIE 2935 Surveillance and
Assessment Technologies for Law Enforcement, edited by A. Trent DePersia, Suzan Yeager, and Steve M. Ortiz,
130–142. Boston: SPIE.
Siuru, Bill. 2007. “Gunshot Location Systems.” Law and Order 55 (10): 10, 12, 15–17.
Stacy, Christina P., Helen Ho, and Rolf Pendall. 2016. “Neighborhood-Level Economic Activity and Crime.” Journal of
Urban Affairs.

A B O U T T H E A U T H O R S 2 5
About the Authors Yasemin Irvin-Erickson is a research associate I in the Urban Institute’s Justice Policy
Center. Her research primarily focuses on crime prevention and social protection
through the lens of inclusive growth and sustainable development.
Bing Bai is a research associate I in the Urban Institute’s Housing Finance Policy
Center, where he helps build, manage, and explore data to analyze housing finance
trends and related policy issues.
Annie Gurvis is a research assistant in the Urban Institute’s Justice Policy Center,
where her work covers a range of topics, focusing on policing and crime statistics.
Edward Mohr is a research assistant in the Urban Institute’s Justice Policy Center,
where his research focuses on new and unique approaches that organizations are
taking to alleviate poverty in urban areas across the country.

ST A T E M E N T O F I N D E P E N D E N C E
The Urban Institute strives to meet the highest standards of integrity and quality in its research and analyses and in
the evidence-based policy recommendations offered by its researchers and experts. We believe that operating
consistent with the values of independence, rigor, and transparency is essential to maintaining those standards. As
an organization, the Urban Institute does not take positions on issues, but it does empower and support its experts
in sharing their own evidence-based views and policy recommendations that have been shaped by scholarship.
Funders do not determine our research findings or the insights and recommendations of our experts. Urban
scholars and experts are expected to be objective and follow the evidence wherever it may lead.

2100 M Street NW
Washington, DC 20037
www.urban.org