Embed Size (px)
Citation preview

sustainability
Article
The Effect of Government Subsidy Policy for ForeignCapital R&D from the Perspective of Global Supply Chains:An Empirical Analysis with Time Lag and PropensityScore Matching
Haigang Li 1, Shaofeng Ru 1, Victor Shi 2, Peng Zhang 3 and Ganlin Pu 4,*
�����������������
Citation: Li, H.; Ru, S.; Shi, V.;
Zhang, P.; Pu, G. The Effect of
Government Subsidy Policy for
Foreign Capital R&D from the
Perspective of Global Supply Chains:
An Empirical Analysis with Time Lag
and Propensity Score Matching.
Sustainability 2021, 13, 8188. https://
doi.org/10.3390/su13158188
Academic Editor: Andrea Appolloni
Received: 19 May 2021
Accepted: 19 July 2021
Published: 22 July 2021
Publisher’s Note: MDPI stays neutral
with regard to jurisdictional claims in
published maps and institutional affil-
iations.
Copyright: © 2021 by the authors.
Licensee MDPI, Basel, Switzerland.
This article is an open access article
distributed under the terms and
conditions of the Creative Commons
Attribution (CC BY) license (https://
creativecommons.org/licenses/by/
4.0/).
1 School of Economics and Management, Northwest University, Xi’an 710127, China;[email protected] (H.L.); [email protected] (S.R.)
2 Lazaridis School of Business and Economics, Wilfrid Laurier University, 75 University Avenue West,Waterloo, ON N2L 3C5, Canada; [email protected]
3 School of Management, Xi’an University of Architecture and Technology, Xi’an 710127, China;[email protected]
4 School of Economics and Management, Wenzhou Institute of Technology, Wenzhou 325000, China* Correspondence: [email protected]
Abstract: (1) Background: with the emergence and continuous development of more multinationalcorporations, capital and resources flow rapidly in the form of global supply chains around the world.Furthermore, government subsidies for R&D are one of the key factors that affect foreign-fundedR&D activities and their innovation output and performance in global supply chains. (2) Methods: inthis paper, firstly, based on two sets of time series and dynamic panel data, we propose a distributiontime lag model to test the effect of R&D subsidy policies from the macro perspective. Secondly,we employ the propensity score matching method to test the micro effect of R&D subsidy policies.(3) Results: our empirical results show that there are significant differences in the impacts of R&Dsubsidy policies on foreign capital funded innovation and domestic innovation. The main effect ofgovernment subsidy on foreign capital R&D is to improve the innovation output. However, regardingdomestic R&D, it is to promote innovation performance. (4) Conclusions: Government subsidy isthe main cause of the individual differences among the foreign funded R&D institutions in terms ofinnovation output and innovation performance. From the perspective of global supply chains, ouranalysis and results provide managerial and policy insights on subsidizing foreign investment inR&D in China.
Keywords: foreign investment in R&D; government R&D subsidy; innovation output; innovationperformance; propensity score matching
1. Introduction
Global supply chains are generally complex, with multiple suppliers, distributors, andproducts located in different countries or regions. Product R&D activities are conducted insupply chains across many countries [1]. Supply chain extension is a process in which thecore enterprises of a supply chain start from a certain link with comparative advantage,continue to expand to related links upstream and downstream, and finally form a supplychain covering longer and more valuable creation links. Vertical global supply chainsextend the R&D, design, production, and sales of enterprises to foreign countries [2,3]. Forexample, with the continuous development of China’s economy, especially after its entryinto the WTO, multinational companies have extended their supply chains through soleproprietorship or joint venture with Chinese enterprises. These multinationals often setup R&D centers and increase R&D investment in China [4,5]. The early demonstrationeffect and spillover effect of foreign R&D have a positive impact on the formation and
Sustainability 2021, 13, 8188. https://doi.org/10.3390/su13158188 https://www.mdpi.com/journal/sustainability

Sustainability 2021, 13, 8188 2 of 12
promotion of China’s domestic innovation capability [6]. Governments also encourageforeign firms to increase their R&D investment with policy tools such as personal incometax refunds and business tax reductions [7]. However, as one of the most effective policiesto stimulate innovation, direct subsidies for foreign-invested R&D activities in China arestill lacking. In contrast, domestic innovation entities, especially research institutions ordomestic enterprises in strategic or emerging industries, are more likely to receive directgovernment funding support. At first instance, the government’s directly subsidizingdomestic innovators may not influence foreign firms’ decision making. However, theirinnovative activities can be influenced by their domestic partners in the form of R&Dalliances and joint research centers/institutes [8].
With the restructuring of the economy, the relationship between foreign-invested R&Dand domestic innovation has taken on new features. Firstly, with the emergence of govern-ment subsidies and other incentives, China’s domestic innovation capacity has been signifi-cantly enhanced, and the marginal effect of the positive spillover from foreign-investedR&D has been diminished. Secondly, with network embedding, foreign-invested R&D hasbecome one of the most important elements of innovation ecology in China. As a result,the boundary of foreign-invested R&D that depends on its parent company has becomeincreasingly blurred with the symbiosis and co-performance of its domestic innovationpartners. To a certain extent, government R&D subsidies have helped reduce innovationrisk caused by asymmetric market information and technological innovation externality.
As a policy signal, the government subsidizes foreign-funded R&D entities in Chinathrough various methods, such as project completion incentives, tax reductions, or post-export tax rebates. This incentivizes companies to increase innovation investment andstrengthen cutting-edge technology exploration. As a regulatory mechanism, the gov-ernment subsidizes and coordinates cooperation among R&D entities by enhancing theirwillingness to cooperate, resolving major conflicts, and establishing trust.
At present, the following views have been proposed on the influence of governmentsubsidies on innovation activities and the value creation of collaborative innovation inglobal supply chains. Firstly, as a transmission signal, government subsidy affects in-vestment in private R&D. For example, Kleer (2012) [9] and Sun et al. (2017) [10] believethat, as a transmission signal, government subsidy stimulates innovators to increase R&Dinvestment and improve its endogenous power to develop cutting-edge and high-risktechnology, and ultimately strengthen its innovation ability. Secondly, government regula-tions may hinder companies’ innovation or make them dependent on subsidy excessively,especially when they are in unequal status with asymmetric information. This may causepower rent seeking or make it difficult for enterprises to realize effective subsidy benefits.In the literature, corporate governance variables such as ownership nature and equitystructure are shown to be the determinants that influence government subsidy policy andits effectiveness [11–13].
State-owned enterprises have special market status and political connections, and it iseasier for them to obtain government subsidies. Subsidizing the R&D activities of state-owned enterprises has become the main method for the government to support domesticinnovation [14]. At the same time, in order to enhance the vitality of domestic innovation,both central and local governments have also set up innovation funds to support or incubatesmall- and medium-sized technology-based enterprises. Government subsidies have alsoshifted from traditionally key industries to enterprises or R&D institutions with innovationpotential and capabilities. Thirdly, Mao and Xu (2015) [15] adopt the three-stage dynamicgame model proposed by Deng and Wu (2017) [16], and argue that the level of governmentsubsidy should be within an appropriate range. Both under-subsidy and over-subsidycan negatively affect innovation. At the same time, the effect of government subsidies isalso affected by the size or growth stage of an enterprise. In general, the effects on smalland medium-sized enterprises using government subsidies for product development andtechnological innovation are more pronounced [17–19].

Sustainability 2021, 13, 8188 3 of 12
Another problem worthy of attention is that the inherent weakness of the R&D capa-bilities of SMEs may make government subsidies ineffective. Thus, several scholars haveproposed that government finance should support the innovation of SMEs and encouragethem to build links with R&D institutions such as universities [20–22]. The existing empiri-cal and qualitative research has outlined a logical framework of the influence of governmentR&D subsidies on enterprise innovation and the value creation of collaborative innovationin global supply chains from the perspectives of signaling, policy dependence, and subsidylevel design. However, most studies are limited to the mechanism by which domesticenterprises obtain government subsidies which promote or inhibit domestic innovation.
Foreign R&D centers in China are innovation entities with high heterogeneity andthat are under the control of foreign parent companies. The influences of government R&Dsubsidy on their innovation performance and innovation output are different from those ofdomestic enterprises. Our research in this paper investigates the characteristics of foreigncapital R&D innovation activities in China in the presence of R&D subsidies. In particular,we use innovation output and innovation performance as dependent variables. First, weapply time-series data to construct a time-lag model of foreign R&D innovation output andinnovation performance under government subsidy policies, and test their macro effects.Second, we employ dynamic panel data and the PSM method to infer whether governmentsubsidy’s effects are significant through counterfactual inference, i.e., whether it is the maincause of individual differences in innovative output and innovative performance.
2. Research Design and Data Acquisition2.1. Variable Selection
In what follows, we describe the process of selecting both dependent and indepen-dent variables.
The paper takes innovation output and innovation performance as dependent vari-ables. Exclusive use of new technologies through patent protection can ensure benefits forinventors. Hence, the number of invention patents granted can reflect innovative outputdirectly. Sales revenue of new products reflects the vitality of enterprise innovation and isa reliable indicator of innovation performance.
Next, we present the independent variables. Labor force and capital input are the keyelements of innovation activities. People engaging in R&D in enterprises and institutionsare chosen as the measurement of labor input (equivalent persons in macro-analysis).According to the funding source for innovation, R&D capital investment can be dividedinto two categories: internal capital investment and external capital investment (such asgovernment subsidies). For the innovators, subsidies are not only a tool for the governmentto support technology development, but also a part of its capital element investment. There-fore, labor, internal capital, and government subsidies are chosen as independent variables.
2.2. Model Development
Next, we construct an empirical model from both macro and micro levels to test theeffect of government subsidies on foreign funded R&D in China from the perspective ofglobal supply chains.
2.2.1. Time-Lag Distribution Model
The macro-effect test of government subsidies is based on the time series data offoreign investment in R&D and innovation investment and output in China. Because theinfluence of input factors on innovation output has time lag, a model of time distributionlag is constructed. From the perspective of government subsidy, a time-series regressionmodel is constructed as:
ln(output)t = α + δt ln(Persons)t + β1 ln Sel f .Fundt + ∑i
βi ln(GovSubsidy)t−1 + εt (1)

Sustainability 2021, 13, 8188 4 of 12
In Equation (1), the independent and dependent variables are both natural logarithmforms. Model (1) not only takes government subsidy as an important explanatory variable,but also considers the hysteresis of its influence on innovation output. In (1), t representsyear, i the hysteresis, and e the random error term. Output includes the two dependentvariables of innovation output and innovation performance.
2.2.2. Propensity Score Matching
Propensity Score Matching (PSM) has been employed to test the micro-mechanismof government subsidy affecting foreign R&D innovation. PSM is an effective method toreduce sampling confounding bias and has been widely adopted in economics and socialsciences. It aims to use non-experimental data (control data) to analyze the interventioneffect, and it can effectively avoid potential endogenous problems caused by sampleselection bias [23,24]. As a “counterfactual” inference method, the PSM assumes thatthe causal relationship between the research objects is the result of both observed andunobserved conditions (i.e., stating that fact A is the reason for B and analyzing what Bwill produce if A does not occur).
In this study, there may be a mixed bias in the causal inference between governmentsubsidy and foreign R&D innovation outputs. That is, it is difficult to determine whetherthe difference in the R&D innovation performance of foreign capital in China (measuredby sales revenue of new products) is caused by the differences within individuals or by thegovernment’s role (measured by R&D subsidies).
Using the method of bias score matching, the sample was divided into experimentalgroups. The experimental group consists of foreign R&D institutions that had received agovernment R&D subsidy. The control group consists of foreign-funded R&D institutionsthat had not received a government subsidy. Using government subsidy as a groupingvariable, we explore the systematic statistical differences between institutions with andwithout R&D subsidies with the following model:
Yi = Yi(Gov.Subsidy) ={
Yi(0), i f Gov.Subsidy = 0Yi(1), i f Gov.Subsidy = 1
(2)
where Yi(1) represents innovative output and innovative performance with governmentsubsidy, and Yi(0) indicates innovative output and innovative performance without gov-ernment subsidies. The difference between the above variables in the two scenarios, namelythe average processing effect (ATT), can be expressed as:
ATT = E{Yi(1)−Yi(0)|Gov.Subsidy = 1} (3)
2.2.3. Data Collection and Processing
(1) Time-series data collection and processing
The time-series data mainly come from the “China Science and Technology StatisticsYearbook”, “China Statistics Yearbook”, and “Compilation of Statistical Data of Institutionsof Higher Education”, as well as several research studies on foreign capital in China [25–30].
It should be noted that, before 2008, the “China Science and Technology StatisticalYearbook” did not include the expenditure sources in the internal expenditures of R&Dfunds for enterprises, universities, and research institutions. Enterprises usually will notuse up all the R&D funds secured in technology and product development activities. Forexample, some R&D funds can be utilized to improve the associated services. In thisresearch, after surveying and consulting with the 316 foreign-funded R&D institutionsin our sample, the internal expenditures of the R&D funds before 2008 are calculated as40% of the total R&D funds raised. Furthermore, we can eliminate the direct impact ofthe 2008 financial crisis on the R&D investments of domestic and foreign enterprises, asthey are synchronous in terms of the fluctuation of R&D investment and inflation rate,as argued in [31]. In addition, the “China Science and Technology Statistics Yearbook”and “Compilation of Statistical Data of Colleges and Universities” contain the data of
Sustainability 2021, 13, 8188 5 of 12
government funding in R&D activities, the number of invention patents granted, and R&Dpersonnel equivalents. However, there were no data of sales revenue of new products,which was then replaced in this study by the annual revenue of the commercialization ofcollege research findings.
(2) Panel Data Acquisition and Processing
It is necessary to obtain micro-data at the level of innovation entity (enterprise orR&D institution) to explore how government subsidies affect the embedding of foreigninvestment in R&D, as well as its R&D investment and output.
The following data were collected through a questionnaire. The structure of thequestionnaire is as follows. The first part mainly includes the industry, establishment time,and main layout of foreign R&D institutions in China under global supply chains. Thesecond section, the foreign input and output data in China, covers the yearly number ofpeople engaging in R&D, self-owned funds (enterprise funds), new product sales revenue,and the number of invention patents granted. The research needs to collect dynamic paneldata on foreign investors in China from 2015 to 2017. To this end, this research adopted afollow-up survey. The specific process was as follows.
Firstly, with the help of the Ministry of Commerce, the Ministry of Science andTechnology, and the official website of the Department of Commerce of some provinces,cities, and autonomous regions, the registered information of foreign companies wasobtained, including the name, address, and source country of capital.
Secondly, in 2015, members of the research group randomly selected 55 representativeforeign-funded R&D institutions in Beijing, Shanghai, and Suzhou, where foreign-fundedR&D institutions are concentrated. We conducted face-to-face interviews with these institu-tions. After obtaining the initial samples, we sent a questionnaire to a randomly selectedlist of foreign-funded enterprises or R&D institutions using tools such as email and socialmedia (e.g., WeChat). In this way, we obtained data from 261 more institutions. Eventually,we had a sample of 316 foreign-funded R&D institutions in China.
In order to avoid possible data inconsistency and incompleteness in data collectionover the years, the data collected for each year were treated as follows. The data collectedannually were filtrated based on the name of the R&D institutes and the location ofregistration to ensure that the sample could be observed continuously within three years.Then, incomplete data were removed to ensure data integrity. Finally, in order to eliminatethe influence of the variable dimension on empirical analysis at the macro level, thedimension of each indicator was eliminated in data use. Furthermore, the natural logarithmof the index data obtained from the questionnaire was taken.
3. Empirical Tests and Results3.1. Macro-Effect Test of Foreign Capital Affected by Government Subsidy in R&D
The time-lag distribution model can capture the dynamic analysis between the vari-ables mentioned above. However, it also introduces more complex estimation problems,especially because of the uncertainty regarding lag period. Applying the ordinary leastsquares method (OLS), we would inevitably have to explain whether there exists autocor-relation or multicollinearity among the variables. The method of Koyck transformationcan effectively alleviate these problems and test the distribution lag model. Hence, thefollowing transformation is performed on Equation (1). Assume that the influence of thedistribution hysteresis on the variable will attenuate with time, if βk = β0λk, γ is the atten-uation rate of the variable coefficient over time, and 1− γ represents the time adjustmentrate. Substituting βk = β0λk into Equation (1) yields:
ln(output)t = α + δt ln(Persons)t + ηt ln(Sel f .Fund)t + ∑k
β0λt ln(GovSubsidy)t−k + ε (4)
The equation of the delayed one period can be further expressed as:
ln(output)t−1 = α + δt−1 ln(Persons)t−1 + ηt−1 ln(Sel f .Fund)t + ∑k
β0λk ln(GovSubsidy)t−k−1 + ε (5)
Sustainability 2021, 13, 8188 6 of 12
Based on Equations (4) and (5), we have:
ln(output)t =
{(1− λ)α + ln(Persons)t − λδt−1 ln(Persons)t−1 + ηt ln(Sel f .Fund)t
−ληt−1 ln(Sel f .Fund)t−1 + β0 ln(Gov.Subsidy)t−1 + λ ln(output)t−1 + ε
}(6)
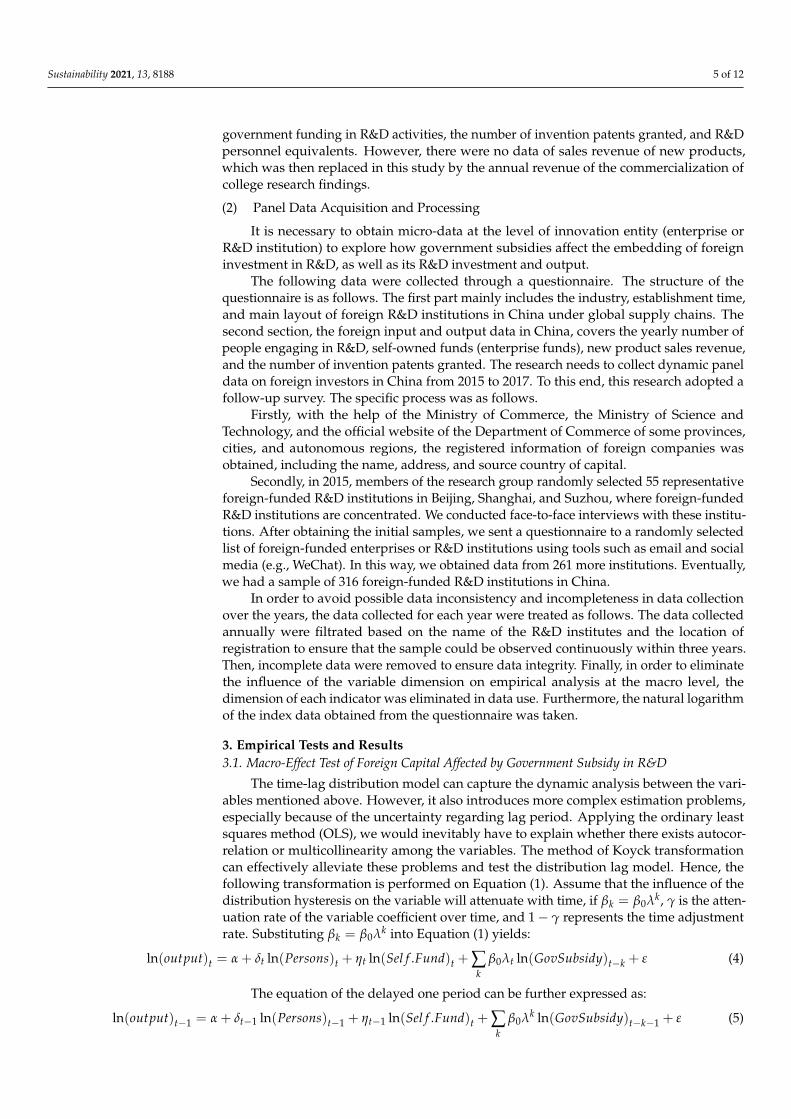
Then, the regression problem of Model (1) is transformed into the problem of estimat-ing and testing the auto-regression model of Model (4). The transformed Model (4) has twonew independent variables, the lag items of R&D personnel input and self-funded input.We applied Eviews 9.1 to test Models 1 and 2 (as shown in Table 1), where model 1 is basedon the testing of data related to foreign R&D and Model 2 is based on the testing of datarelated to domestic innovation. The dependent variables of Model 1-1 and Model 2-1 areinnovation outputs measured by the number of invention patents granted. The dependentvariables of Model 1-2 and Model 2-2 are the innovation performances measured by newproduct sales revenue. As can be seen from Table 2, while government R&D subsidy affectsthe output of invention patents, it also has a significant and positive regulatory effect on afirm’s own capital investment. The impact and adjustment coefficients have passed thesignificance test at the 0.05 level. The delayed phase of government R&D subsidies has aninsignificant impact on the output of invention patents and corrected standard errors. Atthe same time, it should be noted that Equation (6) is an autoregressive model. Therefore,it is difficult to directly estimate the possible autocorrelation.
Table 1. Parameter estimations and tests using single-equation models.
Independent VariablesDependent Variables
Model 1 (Foreign Capital R&D) Model 2 (Domestic Innovation)Model 1-1 (Output) Model 1-2 (Performance) Model 2-1 (Output) Model 2-2 (Performance)
C0.1556 6.7547 −8.7175 *** 3.2474 *
(4.4104) (1.0885) (2.3750) (1.5452)
NSt-10.8702 0.2209 * 0.4186
(0.4914) (0.1527) (0.2338)
PA t-10.3721 *
XXXXX0.1332
(0.1733) (0.1966)
L0.8702 * 0.5918 *** 0.1555 0.0858(0.4914) (0.1454) (0.3406) (0.2017)
K−0.4193 0.4481 ** 0.0038 0.0132(0.8373) (0.1762) (0.1478) (0.0868)
GS0.1559 0.1815 1.1266 ** 0.4901
(0.9517) (0.1987) (0.4023) (0.3067)R2 0.9397 0.9953 0.9960 0.9970
Adjusted R2 0.9457 0.9934 0.9944 0.9958P (F-statistic) 0.0000 0.0000
Note: Model 1 is about parameter estimations and tests based on the input and output data of foreign investment in R&D; Model 2 is aboutparameter estimations and tests based on input-output data of domestic enterprises. “*” means that the significance test was passed at the0.05 level, “**” means that the significance test was passed at the 0.05 level, and “***” means that the significance test was passed at the0.01 level. The numbers in brackets are standard errors. The F test value is less than 0.05, which means that the overall model passed thesignificance test.
Table 2. Variables and their proxies.
Variable Proxy Index Description
Innovation Outputs The Number of InventionPatents Granted PA
Invention patents granted toforeign-funded R&D institutions in
China annually
Innovation Performance Sales of New Products NS The proportion of the revenue fromnew products in total sale revenue
Innovation InputsR&D Self-Fund SF The proportion of the R&D internal
investment in total investment
R&D Persons PS The number of personals who involvein R&D activities
Government Subsidy GS

Sustainability 2021, 13, 8188 7 of 12
Self-correlation is tested by the Durbin’s H Test. The estimate is OLS = 0.067, which canbe used to obtain the Durbin’s H Test value of 0.586. There is a self-correlation phenomenonin the autoregressive model (6). After the test, it is corrected by standard errors.
From the parameter estimations and tests of Model 1, we have the following conclu-sions. Firstly, R&D personnel and own capital investment have a significant and positiveimpact on the innovation performance of foreign-funded R&D. The coefficients β0 passthe significance test at 1% and 10% levels, respectively.R2 and adjusted R2 are greaterthan the value of 0.95 in the test of Model 1-1, which confirms its good fit. From theestimate of parameter λ, the impacts of the R&D personnel input lag on revenue fromnew product sales are 0.5918, 0.1307, and 0.0289, respectively. The overall elasticity factorof R&D personnel input is 0.7596. Similarly, an overall elasticity factor of 0.5752 can beestimated for the self-funded inputs. This means that the natural logarithm of revenuefrom new product sales will increase by 76% and 57.52%, while each additional unit forR&D personnel (natural logarithm) and self-owned funds (natural logarithm) will increaseby 100%.
Secondly, R&D personnel investment has a significant and positive impact on foreignR&D innovation output. The influence coefficient β0 on the number of invention patentsgranted passes the significance test at the level of 10%. Based on the method above, theimpact factors for the distribution hysteresis of this variable can be calculated to be 0.8702,0.3228, and 0.1205. The overall elasticity factor for R&D personnel inputs to patent outputis 1.3859. That is, each additional unit of natural logarithm of the variables will contributeto an increase of 1.3859 units of invention patent granted.
Thirdly, the Coyle tests of Model 1-1 and Model 1-2 do not support the significantrelationship between government subsidies and their distribution lag, and foreign R&Dinnovation performance, innovation output, and value creation of collaborative innovationin global supply chains. In the long term, foreign investment in R&D innovation andgrowth still depends on its internal factor investment and combination. Governmentsubsidies do not exhibit a positive intervention effect.
According to the parameter estimation and test of Model 2, although the governmentsubsidy does not help the new product sales revenue of domestic enterprises, it has asignificant and positive impact on the innovation output. The parameter estimation andtest of Model 2-1 does not pass the significant level test. Therefore, we can concludethat government subsidy, R&D personnel, and self-owned funds have insignificant im-pacts on the innovation performance of domestic companies. In Model 2-2, in the test ofshort-term and long-term effects of government subsidy, λ = 0.1332; the relatively smallabsolute value indicates that the strength of government subsidies affecting the number ofinvention patents granted will quickly decline with time. The influence coefficient for thecurrent period is 1.1266, and the elasticity coefficients for the three phases are β1 = 0.1500,β2 = 0.0200, and β3 = 0.0027, respectively. We also derive the long-term impact factor tobe 1.2849.
The results of the tests above show that government subsidies have significant long-term effects on domestic innovation output. Finally, the parameter estimation and testof the time-series model with multiplier items also shows the indirect influence of thebehavior of government-subsidized domestic enterprises on foreign-invested R&D.
3.2. Micro-Effects of Government Subsidy on Foreign-Invested R&D3.2.1. Propensity Score Match (PSM)
Is the difference in innovation output and innovation performance of foreign-investedR&D due to government subsidy? To answer this question, it is necessary to divide thesamples into two groups: an experimental group and a control group.
The experimental group consists of those who had received government subsidy(Di = 1), and the control group consists of those who had not received government subsidy(Di = 0). After grouping, there are 152 samples in the experimental group and 159 samples inthe control group. Taking R&D personnel, R&D own capital investment, R&D cooperation
Sustainability 2021, 13, 8188 8 of 12
intensity, and patent protection index as covariates, and innovation output and innovationperformance as outcome variables, the propensity score can be calculated. The PSManalysis is carried out with Stata 11.0, a statistical analysis software.
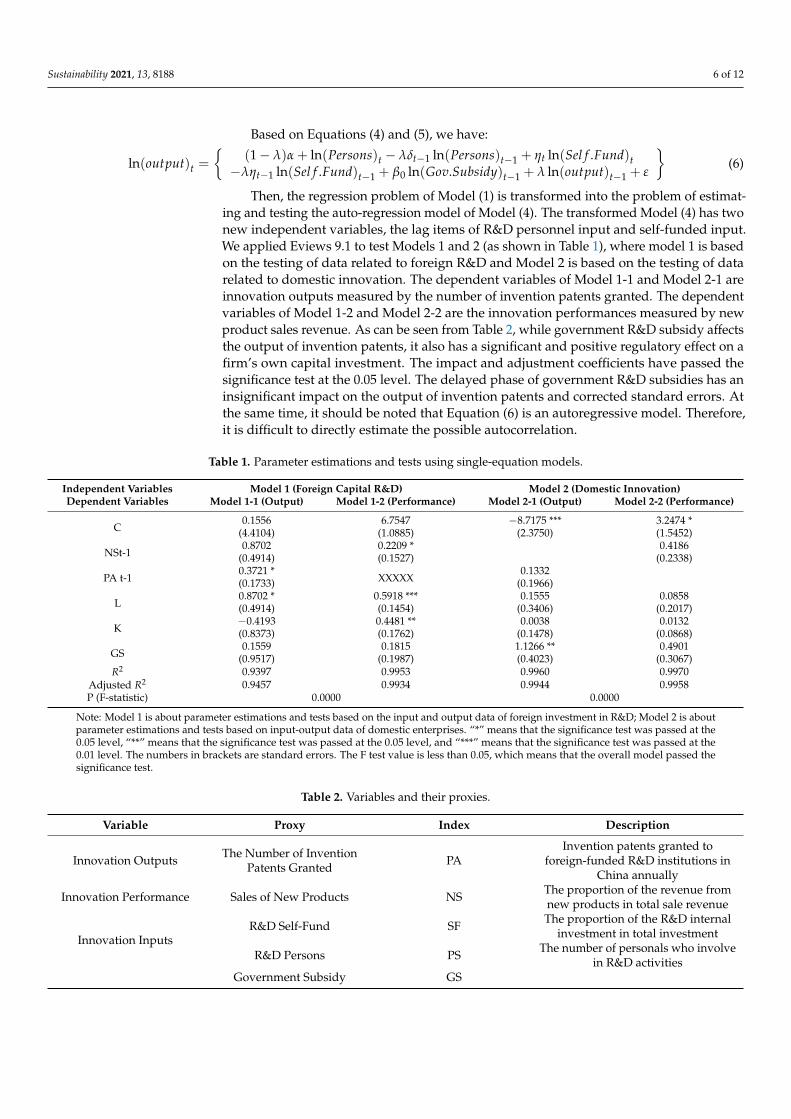
A logistic regression model is built to generate a probability value of the governmentsubsidy of each sample, and a pscore is calculated accordingly. Then, the radius matchingmethod is used to complete the match of samples. The average processing effect (ATT)and the control group average processing effect (ATE) values (as shown in Table 3) arecalculated at the same time.
Table 3. PSM Average Processing Effect (ATT)-End variable based on the number of invention patentsgranted and new product sales revenue.
Variables Samples Treatment T-Test
Innovation outputs Unmatched Treatment T-testATT 20.9727 −1.29ATU 77.215 −0.68
Innovation performance Unmatched 7632.53 1.24ATT 7691.67 0.48ATU 5241.90
Note: The radius matching method produces the average processing effect of the sample processing group,namely ATT, and the average processing effect of the sample control group, namely ATU.
Table 3 shows that the ATT and ATE values are 7691.67, 5241.90, 20.9727, and 77.215,respectively. After the matching, five samples in the experimental group failed to matchwith an appropriate control.
3.2.2. Balance Test
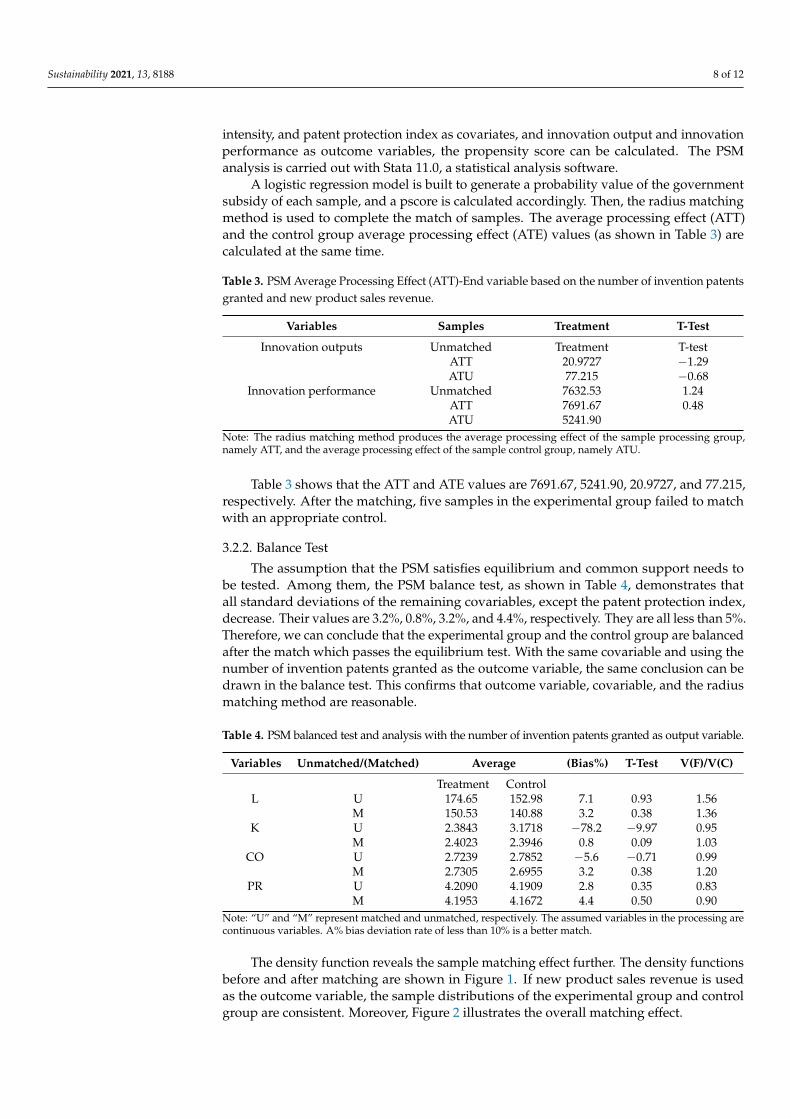
The assumption that the PSM satisfies equilibrium and common support needs tobe tested. Among them, the PSM balance test, as shown in Table 4, demonstrates thatall standard deviations of the remaining covariables, except the patent protection index,decrease. Their values are 3.2%, 0.8%, 3.2%, and 4.4%, respectively. They are all less than 5%.Therefore, we can conclude that the experimental group and the control group are balancedafter the match which passes the equilibrium test. With the same covariable and using thenumber of invention patents granted as the outcome variable, the same conclusion can bedrawn in the balance test. This confirms that outcome variable, covariable, and the radiusmatching method are reasonable.
Table 4. PSM balanced test and analysis with the number of invention patents granted as output variable.
Variables Unmatched/(Matched) Average (Bias%) T-Test V(F)/V(C)
Treatment ControlL U 174.65 152.98 7.1 0.93 1.56
M 150.53 140.88 3.2 0.38 1.36K U 2.3843 3.1718 −78.2 −9.97 0.95
M 2.4023 2.3946 0.8 0.09 1.03CO U 2.7239 2.7852 −5.6 −0.71 0.99
M 2.7305 2.6955 3.2 0.38 1.20PR U 4.2090 4.1909 2.8 0.35 0.83
M 4.1953 4.1672 4.4 0.50 0.90Note: “U” and “M” represent matched and unmatched, respectively. The assumed variables in the processing arecontinuous variables. A% bias deviation rate of less than 10% is a better match.
The density function reveals the sample matching effect further. The density functionsbefore and after matching are shown in Figure 1. If new product sales revenue is usedas the outcome variable, the sample distributions of the experimental group and controlgroup are consistent. Moreover, Figure 2 illustrates the overall matching effect.

Sustainability 2021, 13, 8188 9 of 12
Sustainability 2021, 13, x FOR PEER REVIEW 9 of 12
3.2.2. Balance Test
The assumption that the PSM satisfies equilibrium and common support needs to be
tested. Among them, the PSM balance test, as shown in Table 4, demonstrates that all
standard deviations of the remaining covariables, except the patent protection index, de-
crease. Their values are 3.2%, 0.8%, 3.2%, and 4.4%, respectively. They are all less than 5%.
Therefore, we can conclude that the experimental group and the control group are bal-
anced after the match which passes the equilibrium test. With the same covariable and
using the number of invention patents granted as the outcome variable, the same conclu-
sion can be drawn in the balance test. This confirms that outcome variable, covariable, and
the radius matching method are reasonable.
Table 4. PSM balanced test and analysis with the number of invention patents granted as output
variable.
Variables Unmatched/(Matched) Average (Bias%) T-Test V(F)/V(C)
Treatment Control
L U 174.65 152.98 7.1 0.93 1.56
M 150.53 140.88 3.2 0.38 1.36
K U 2.3843 3.1718 −78.2 −9.97 0.95
M 2.4023 2.3946 0.8 0.09 1.03
CO U 2.7239 2.7852 −5.6 −0.71 0.99
M 2.7305 2.6955 3.2 0.38 1.20
PR U 4.2090 4.1909 2.8 0.35 0.83
M 4.1953 4.1672 4.4 0.50 0.90
Note: “U” and “M” represent matched and unmatched, respectively. The assumed variables in the
processing are continuous variables. A% bias deviation rate of less than 10% is a better match.
The density function reveals the sample matching effect further. The density func-
tions before and after matching are shown in Figure 1. If new product sales revenue is
used as the outcome variable, the sample distributions of the experimental group and
control group are consistent. Moreover, Figure 2 illustrates the overall matching effect.
(a) Density pscore before matching. (b) Density pscore after matching.
Figure 1. Density pscore before and after matching with PA as output variable. Figure 1. Density pscore before and after matching with PA as output variable.
Sustainability 2021, 13, x FOR PEER REVIEW 10 of 12
(a) Density pscore before matching. (b) Density pscore after matching.
Figure 2. Density pscore before and after matching with NR as output variable.
In short, our results show that the main effect of governmental R&D subsidy for for-
eign enterprises is to enhance direct innovation output, while its main effect on domestic
innovation is to promote innovation performance. Government R&D subsidy has become
the main factor of internal differences between R&D innovation output and innovation
performance of the R&D activities of foreign enterprises in China. Furthermore, the causal
relationship between government R&D subsidy and innovation performance has also
been supported.
4. Discussion
Based on the estimation and test of the distribution lag model, we can explain how
government subsidies affect the innovation output and performance of foreign funded
R&D under global supply chains as follows. From the view of capital factors, both R&D
subsidy offered by the government and foreign capital investment in China can signifi-
cantly increase the innovation output in China. In contrast, the innovation performance
depends on the internal investment portfolio and growth to a large extent. The direct con-
tribution of government subsidy as an “enhancer” to the innovation output is insignifi-
cant. However, the indirect role of its externality cannot be ruled out.
Domestic innovators receive government subsidies, which may lead to better inno-
vation performance. The main reason is that government subsidy promotes R&D invest-
ment, which enhances the efficiency of R&D resource allocation and improves the output
rate of innovation in turn. Internal investment and innovation ability, as internal factors
driving innovation growth and market capacity of foreign investment, are still dominant
in China. The direct economic effect of R&D subsidy policy is pronounced. Moreover,
R&D institutions supported by the government can significantly increase the sales reve-
nue from new products and form market advantages.
5. Conclusions
In this paper, based on the macro data from 2000 to 2016, we examine the lag effect
of government subsidies, R&D personnel investment, and self-owned capital investment
on innovation output (represented by the number of invention patents granted) and in-
novation performance (represented by the sales revenue of new products) from the per-
spective of global supply chains using the Almon method. Our main findings are as fol-
lows.
First, the long-term effect of government R&D subsidy on foreign R&D innovation
ability in global supply chains is significant. However, government R&D subsidy does not
significantly promote the R&D performance of foreign-funded institutions. Moreover, the
innovation performance of domestic enterprises is significantly affected by the short-term
Figure 2. Density pscore before and after matching with NR as output variable.
In short, our results show that the main effect of governmental R&D subsidy forforeign enterprises is to enhance direct innovation output, while its main effect on domesticinnovation is to promote innovation performance. Government R&D subsidy has becomethe main factor of internal differences between R&D innovation output and innovationperformance of the R&D activities of foreign enterprises in China. Furthermore, the causalrelationship between government R&D subsidy and innovation performance has alsobeen supported.
4. Discussion
Based on the estimation and test of the distribution lag model, we can explain howgovernment subsidies affect the innovation output and performance of foreign fundedR&D under global supply chains as follows. From the view of capital factors, both R&Dsubsidy offered by the government and foreign capital investment in China can significantlyincrease the innovation output in China. In contrast, the innovation performance dependson the internal investment portfolio and growth to a large extent. The direct contribution ofgovernment subsidy as an “enhancer” to the innovation output is insignificant. However,the indirect role of its externality cannot be ruled out.
Domestic innovators receive government subsidies, which may lead to better innova-tion performance. The main reason is that government subsidy promotes R&D investment,which enhances the efficiency of R&D resource allocation and improves the output rate ofinnovation in turn. Internal investment and innovation ability, as internal factors driving

Sustainability 2021, 13, 8188 10 of 12
innovation growth and market capacity of foreign investment, are still dominant in China.The direct economic effect of R&D subsidy policy is pronounced. Moreover, R&D institu-tions supported by the government can significantly increase the sales revenue from newproducts and form market advantages.
5. Conclusions
In this paper, based on the macro data from 2000 to 2016, we examine the lag effect ofgovernment subsidies, R&D personnel investment, and self-owned capital investment oninnovation output (represented by the number of invention patents granted) and innovationperformance (represented by the sales revenue of new products) from the perspective ofglobal supply chains using the Almon method. Our main findings are as follows.
First, the long-term effect of government R&D subsidy on foreign R&D innovationability in global supply chains is significant. However, government R&D subsidy does notsignificantly promote the R&D performance of foreign-funded institutions. Moreover, theinnovation performance of domestic enterprises is significantly affected by the short-termeffects of government subsidies. Based on the adjustment effect test, the government’scapital subsidies for domestic enterprises moderate the relationship between the internalinvestment of external R&D institutions and their innovative performance and innovativeoutput, showing significant conductivity. Although R&D subsidies for foreign R&D insti-tutions are squeezed, due to the spillover and competition effects, R&D subsidies can alsosignificantly enhance the innovation vitality of foreign-invested R&D in China.
Second, we expand our research to individual levels of foreign-invested R&D andcollect panel data, from 2015–2017, about innovative investment, innovative output, andgovernment subsidies for R&D in China. The impact of government R&D subsidies onindividual innovation is tested using the PSM radius matching method. Furthermore, thestability test is carried out. The results show that the experimental and control groupssatisfy the assumption of equilibrium and common support, and the average treatmenteffect of R&D subsidies is significant.
We can derive the following policy insights based on our empirical analyses andresults. Firstly, the mechanism of sharing intellectual property rights should be improvedfurther. According to the differences between foreign funded and domestic institutions ofhigher learning and enterprises, measures and guidance should be devised for sharing andtransferring property rights. The procedures for handling disputes over the attributionof intellectual property rights should be standardized. The institutional environment inwhich foreign and domestic innovation entities participate on an equal footing to developcooperative projects and resolve conflicts should be improved. Secondly, the managementof R&D subsidies should be further refined. Financial subsidy standards and strategies forforeign funded R&D should be implemented, and foreign investors should be guided toestablish multi-platform and multi-form alliances with domestic research institutes andenterprises, such as joint research centers and joint laboratories. Governments should placemore emphasis on alliance or organizations engaging in basic research and key technologydevelopment. They should standardize strategies for fund allocation according to thecharacteristics of the R&D activities and incentivize R&D entities to collaborate.
Author Contributions: Conceptualization, H.L. and P.Z.; methodology, S.R.; validation, P.Z.; for-mal analysis, H.L.; resources, H.L. and S.R.; data curation, H.L., and P.Z.; writing—original draftpreparation, H.L., S.R. and V.S.; writing—review and editing, H.L., V.S., P.Z. and G.P.; visualization,H.L.; project administration, P.Z.; Funding acquisition: G.P. All authors have read and agreed to thepublished version of the manuscript.
Funding: Ministry of Education Humanities and Social Sciences Research Fund (Grant #: 20XJA630004);Dr. Pu’s research is supported by the National Social Science Fund of China (Grant # 17BSH110: astudy of the patterns of self-governance of social organizations).

Sustainability 2021, 13, 8188 11 of 12
Data Availability Statement: The time series data are mainly from China Science and TechnologyStatistics Yearbook, China Statistics Yearbook, University Statistics Collection, and some scholars’ re-search reports on foreign R&D in China. The panel data mainly comes from the questionnaire survey.
Conflicts of Interest: The authors state that there is no conflict of interest. The Ministry of Educationof China funded the study, but had no role in the design of the paper, the collection of data, theanalysis, the writing of the manuscript, or the decision to publish the results.
References1. Liu, L.W.; Fu, Q.L.; Liu, Y.Q. Research on Decision-making and Subsidy Strategy of Transnational Supply Chain under Tariff
Increase. China Manag. Sci. 2021, 3, 10–18.2. Cao, L.L.; Yang, T.T. Research on the Path of Supply Chain Extension of Multinational Corporations in China. Int. Trade 2014, 8,
35–41.3. Nielsen, I.E.; Majumder, S.; Sana, S.S.; Saha, S. Comparative analysis of government incentives and game structures on single and
two-period green supply chain. J. Clean. Prod. 2019, 235, 1371–1398. [CrossRef]4. Sun, C.H.; Li, X.Y.; Yu, H. Path Selection of Exit Strategy of Government Subsidy in Transnational Two-way Supply Chain. China
Manag. Sci. 2020, 12, 15–24.5. Wang, X.Q.; Zhao, Z.J. Optimal production and distribution planning decision model of transnational supply chain. Stat. Decis.
2012, 14, 32–35.6. Hollenstein, H.; Berger, M. Choice of foreign R&D entry mode and its relation to firm performance: A firm-level analysis for
Switzerland and Austria. Economics 2015, 9, 1–47.7. Jun, D.L.; Xie, Z.F. Developing sustainable supply chain management: The interplay of institutional pressures and sustainability
capabilities. Sustain. Prod. Consum. 2021, 4, 254–268.8. Bia, M.; Mattei, A. A Stata package for the estimation of the dose-response function through adjustment for the generalized
propensity score. Stata. J. 2008, 8, 354–373. [CrossRef]9. Kleer, R. Government R&D subsidies as a signal for private investors. Res. Policy 2010, 39, 1361–1374.10. Sun, X.; Guo, X.; Wang, J. Government subsidy, ownership, and firms’ R&D decisions. J. Manag. Sci. China 2017, 6, 18–30.11. Wu, J.; Yang, Z. Government subsidies, separation of ownership and control, and technological innovation. Sci. Res. Manag. 2014,
35, 54–61.12. Huo, J.; Liu, S. Research on the Impact of Foreign Investment on R&D Investment of Enterprises—An Empirical Analysis Based
on Chinese Listed Companies. J. Ind. Technol. Econ. 2016, 11, 115–120.13. Ha, D.R.; Vand, S.H.; Cahoon, S.L. The impact of supply chain network structure on relationship management strategies: An
empirical investigation of sustainability practices in retailers. Sustain. Prod. Consum. 2021, 4, 281–299.14. Guo, D.; Guo, Y.; Jiang, K. Government-subsidized R&D and firm innovation: Evidence from China. Res. Policy 2016, 45,
1129–1144.15. Mao, Q.; Xu, J. The effect of government subsidy on firm’s new product innovation: An analysis based on the moderate interval
of subsidy intensity. China Ind. Econ. 2015, 6, 94–105.16. Deng, R.; Wu, F. Research and development model, technology spillovers and optimal government subsidy. Stud. Sci. Sci. 2017,
35, 843–852.17. Kang, K.N.; Park, H. Influence of government R&D support and inter-firm collaborations on innovation in Korean biotechnology
SMEs. Technovation 2012, 32, 1361–1374.18. Yang, Y.; Wei, J.; Luo, L. Who is using government subsidies to innovate? The joint adjustment effect of ownership and distortion
of factor market. Manag. World 2015, 1, 23–31.19. Tat, D.; Bui, F.M.; Tai, M.K. Sustainable supply chain management towards disruption and organizational ambidexterity: A data
driven analysis. Sustain. Prod. Consum. 2020, 9, 373–410.20. Doh, S.; Kim, B. Government support for SME innovations in the regional industries: The case of government financial support
program in South Korea. Res. Policy 2014, 43, 1557–1569. [CrossRef]21. Du, J.; Li, M. Entry of foreign capital, merger and acquisition of foreign capital and R&D innovation of enterprises—An Empirical
Research Based on Micro-level. World Econ. Stud. 2016, 6, 15–23.22. Saha, S.; Majumder, S.; Nielsen, I.E. Is It a Strategic Move to Subsidized Consumers Instead of the Manufacturer? IEEE Access
2019, 29, 169807–169824. [CrossRef]23. Patra, S.K.; Krishna, V.V. Globalization of R&D and open Innovation: Linkages of Foreign R&D Centers in India. J. Open Innov.
Technol. Mark. Complex. 2015, 1, 1–24.24. Ghisetti, C. Demand-pull and environmental innovations: Estimating the effects of innovative public procurement. Technol.
Forecast. Soc. Chang. 2017, 125, 178–187. [CrossRef]25. Liu, Q.L.; Guo, P.; Chen, G.J. Research on the Conflict and Alliance between Foreign Investment R&D and Regional Independent
Innovation—From the Perspective of Government Subsidy Regulation. Res. Dev. Manag. 2019, 31, 110–120.26. 2020 Global Enterprises Report: MNC New Development in China. Glob. Think Tank 2020, 9, 1–38.27. Liu, Q.L.; Guo, P. Research on Conflict and Alliance between Foreign R&D and Independent Innovation System in China based
on GMCR II. Soft Sci. 2018, 32, 5–9.

Sustainability 2021, 13, 8188 12 of 12
28. Liu, Q.L.; Guo, P.; Zhang, P. Ecological Co-performance of Foreign Investment R&D and Regional Independent Innovation inChina. Stud. Sci. Sci. 2018, 36, 1058–1069.
29. Chen, G.J.; An, L.R. Research on Innovation Efficiency of R&D Institutions of Foreign-funded Enterprises in China. China Soft Sci.2015, 3, 117–126.
30. Zhang, Y.; Wang, S.; Chen, Y.W. Research on the Relationship between R&D Investment of Foreign-funded Enterprises in Chinaand R&D Investment of Local Enterprises. Sci. Technol. Manag. Res. 2020, 23, 108–114.
31. Xiao, M. Research on the Impact of Financial Crisis on R&D Investment Intensity in China. Sci. Manag. Res. 2010, 4, 96–99.