Embed Size (px)
Citation preview

THE EFFECT OF FOREIGN EXCHANGE RISK MANAGEMENT ON THE
FINANCIAL PERFORMANCE OF COMMERCIAL BANKS IN KENYA
BY
DENIS LIMO
A RESEARCH PROJECT SUBMITTED IN PARTIAL FULFILLMENT OF
THE REQUIREMENTS FOR THE AWARD OF A MASTER OF SCIENCE IN
FINANCE DEGREE, SCHOOL OF BUSINESS, UNIVERSITY OF NAIROBI
OCTOBER 2014

ii
DECLARATION
STUDENT’S DECLARATION
I declare that this Research Project is my original work and has never been submitted
for a degree in any other university or college for examination/academic purposes.
Signature: ……………………… Date: ………………………………
DENIS LIMO Reg: D63/76365/2012
SUPERVISOR’S DECLARATION
This Research Project has been submitted for examination with my approval as the
University Supervisor.
Signature…………………………………….….Date………………………………….
.
DR. J.O. ADUDA
SENIOR LECTURER - DEPARTMENT OF FINANCE AND ACCOUNTING
& DEAN SCHOOL OF BUSINESS, UNIVERSITY OF NAIROBI

iii
DEDICATION
I dedicate this work to my family for their moral support, encouragement and
understanding.
To the Almighty God for His unceasing blessings without which it is impossible to
accomplish anything.

iv
ACKNOWLEDGEMENTS
I would like to extend my appreciation and gratitude to all those that contributed
tremendous inputs towards completion of this research project.
First and foremost, I am grateful to my University of Nairobi Supervisor Dr. Josiah
Aduda for his tireless assistance, invaluable support, high quality and detailed work,
experience and initiatives which guided me in enriching and completing my research
project.
Secondly, I owe a debt of gratitude to my family who sacrificed time so that I
could realize my dreams. A special thanks to my loving wife Consolata who
especially was supportive in all aspects to make this dream come true.
To mum and dad, thanks for believing in me and for your invaluable support.
Thirdly, I am grateful to my colleagues in University of Nairobi, whose assistance to
this research project cannot be overlooked, for their inspirations, encouragements,
guidance and helpful recommendations concerning the procedures through academic
discussions and always raising the benchmark.
To crown it all thanks to the almighty God for giving me sufficient grace.

v
ABSTRACT
Foreign exchange risk management is complex and requires a thorough understanding
of the banks business needs, its internal and external environment and exposures to
the financial markets. Challenges abound as banking institutions commit themselves
to improving risk management practices. The banking industry in Kenya is
characterized by numerous teething problems. These emanate from their calibre of
target customers and the seemingly liberal and/or informal system of operations.
Many of the standard tools used to hedge currency risk, such as futures, swaps and
options contracts, are either not available in emerging markets or, where available, are
traded in illiquid and inefficient markets, making the range of products available
extremely limited. This has put an extra burden on corporate treasurers to be able to
find adequate hedge to their exposures in exotic currencies. The objective of the study
was to establish the effect of foreign exchange risk management on the financial
performance of commercial banks in Kenya.
The research used a descriptive research design. The target population comprised of
the forty three (43) commercial banks in Kenya. The study used census approach to
pick all the 43 commercial banks in Kenya since the population is not large. The study
made use of secondary data. The multiple linear regression analysis was applied to
examine the extent of influence of the independent variable on the dependent
variables.
The regression analysis established that ROA = 1.627 + 13.491*Options +
3.113*Forward Contracts + 4.820*Cross Currency Swaps + 0.720*Leading and
Lagging - 0.071*Price Adjustments + 0.044*Netting .The study further found that
there is a strong relationship between dependent and independent variables given an
R2
values of 0.856 and adjusted to 0.801. This shows that the independent variables
(Options, Forward Contracts, Cross Currency Swaps, Leading and Lagging, Price
Adjustments, Netting) accounts for 80.1% of the variations in profitability as
measured by ROA.

vi
TABLE OF CONTENTS
DECLARATION........................................................................................................... ii
DEDICATION.............................................................................................................. iii
ACKNOWLEDGEMENTS ........................................................................................ iv
ABSTRACT ................................................................................................................... v
LIST OF TABLES ....................................................................................................... ix
LIST OF ABBREVIATIONS ...................................................................................... x
CHAPTER ONE ........................................................................................................... 1
INTRODUCTION......................................................................................................... 1
1.1 Background of the Study ...................................................................................... 1
1.1.1 Foreign Exchange Risk Management ............................................................ 2
1.1.2 Financial Performance ................................................................................... 3
1.1.3 Effect of Foreign Exchange Risk Management on Financial Performance ... 5
1.1.4 Commercial Banks in Kenya ......................................................................... 6
1.2 Research Problem ................................................................................................. 7
1.3 Objectives of the study.......................................................................................... 9
1.3.1 General Objective .............................................................................................. 9
1.3.2 Specific Objectives ........................................................................................ 9
1.4 Value of the Study ................................................................................................ 9
CHAPTER TWO ........................................................................................................ 11
LITRATURE REVIEW ............................................................................................. 11
2.1 Introduction ......................................................................................................... 11
2.2 Theoretical Review ............................................................................................. 11
2.2.1 International Fisher Effect Theory ............................................................... 11
2.2.2 Purchasing Power Parity .............................................................................. 12

vii
2.2.3 Foreign Exchange Exposure Theory ............................................................ 14
2.2.4 Interest Rate Parity Theory .......................................................................... 14
2.2.5 Arbitrage Pricing Theory ............................................................................. 15
2.3 Determinants of Financial Performance of Commercial Banks ......................... 15
2.3.1 Bank Specific Factors/Internal Factors ........................................................ 16
2.3.2 External Factors/ Macroeconomic Factors .................................................. 19
2.4 Empirical Review................................................................................................ 19
2.5 Foreign Exchange Risk Management Strategies ................................................ 26
2.6 Financial Performance ........................................................................................ 30
2.7 Summary of the Chapter ..................................................................................... 31
CHAPTER THREE .................................................................................................... 33
RESEARCH METHODOLOGY .............................................................................. 33
3.1 Introduction ......................................................................................................... 33
3.2 Research Design.................................................................................................. 33
3.3 Target Population ................................................................................................ 33
3.4 Data collection .................................................................................................... 34
3.5 Data Analysis ...................................................................................................... 34
3.5.1 Analytical Model ......................................................................................... 35
CHAPTER FOUR ....................................................................................................... 38
DATA ANALYSIS AND PRESENTATION OF FINDINGS ................................. 38
4.1 Introduction ......................................................................................................... 38
4.2 Data Presentation ................................................................................................ 38
4.2.1 Correlation ................................................................................................... 39
4.2.2 Regression Analysis ..................................................................................... 40
4.3 Summary and Interpretation of Findings ............................................................ 44
CHAPTER FIVE ........................................................................................................ 47
SUMMARY, CONCLUSION AND RECOMMENDATIONS .............................. 47

viii
5.1 Summary ............................................................................................................. 47
5.2 Conclusions ......................................................................................................... 48
5.3 Policy Recommendations.................................................................................... 48
5.4 Limitations of the Study...................................................................................... 50
5.5 Suggestions for Further Study ............................................................................ 50
REFERENCES ............................................................................................................ 52
Appendix I: Raw Data .............................................................................................. 56

ix
LIST OF TABLES
Table 4.1: Descriptive Statistics .................................................................................. 39
Table 4.2: Correlation Matrix ...................................................................................... 65
Table 4.3: Model Goodness of Fit ............................................................................... 41
Table 4.4: Analysis Of Variance .................................................................................. 42
Table 4.5: Regression Model ....................................................................................... 43
Table 4.6: Multicollinearity Statistics .......................................................................... 44

x
LIST OF ABBREVIATIONS
CAR Capital Adequacy Ratio
CBK Central Bank of Kenya
FERM Foreign Exchange Risk Management
GDP Gross Domestic Product
IFE International Fisher Effect
IIF Institute of International Finance
MFC Mortgage Finance Company
MFI’s Microfinance Institutions
PPP Purchasing Power Parity
ROA Return on Assets
ROE Return on Equity

1
CHAPTER ONE
INTRODUCTION
1.1 Background of the Study
Foreign exchange rate risk management is an integral part in every banks decision
about foreign currency exposure (Allayannis, Ihrig, and Weston, 2001). Currency risk
hedging strategies entail eliminating or reducing this risk, and require understanding
of both the ways that the exchange rate risk could affect the operations of economic
agents and techniques to deal with the consequent risk implications (Barton, Shenkir,
and Walker, 2002). Selecting the appropriate hedging strategy is often a daunting task
due to the complexities involved in measuring accurately current risk exposure and
deciding on the appropriate degree of risk exposure that ought to be covered. The
need for currency risk management started to arise after the break down of the Bretton
Woods system and the end of the U.S. dollar peg to gold in 1973 (Papaioannou,
2001).
The issue of currency risk management for non-financial and financial firms is
independent from their core business and is usually dealt by their corporate treasuries.
Most multinational firms have also risk committees to oversee the treasury‟s strategy
in managing the exchange rate (and interest rate) risk (Lam, 2003). This shows the
importance that firms put on risk management issues and techniques. Conversely,
international investors usually, but not always, manage their foreign exchange rate
risk independently from the underlying assets and/or liabilities. Since their currency
exposure is related to translation risks on assets and liabilities denominated in foreign
currencies, they tend to consider currencies as a separate asset class requiring a
currency overlay mandate (Allen, 2003).

2
Exchange rate volatility creates a risky business environment in which there are
uncertainties about future profits and payments. These are especially exacerbated in
countries where financial instruments for hedging against foreign exchange risk are
not developed, which is the case in many developing countries including Kenya
(World Bank & MTTI, 2006).
1.1.1 Foreign Exchange Risk Management
Butler (2008) refers foreign exchange risk as the risk related with the unexpected
changes in exchange rates and foreign exchange exposure as the extent to which
unexpected changes in exchange rates affect the value of a firm‟s assets or liabilities.
Taggert and McDermott (2000) assert that forex related firms are subject to foreign
exchange risk on the payables and receipts in foreign currencies. Evan et al (1985)
defines foreign exchange risk management as a program of assessment (identification
and quantification) and counterstrategies to mitigate exchange rate risk and saves
firm`s economic value. Kirt further adds foreign exchange risk is a financial risk to
manage value creation and loss prevention in a firm by internal and external financial
tools. Piet and Raman (2012) say spot rate changes are offset by changes inflation
though small firms may depend on unstable currency rates for profits.
According to Featherson, Littlefield and Mwangi (2006), foreign exchange risk arises
when fluctuation in the relative values of currencies affects the competitive position
or viability of an organization. Firms are exposed to foreign exchange risk if the
results of their projects depend on future exchange rates and if exchange rate changes
cannot be fully anticipated. Generally, companies are exposed to, Transaction
exposure, Economic exposure and Translation exposure (El-Masry, 2006; Salifu et al,
2007).

3
Transaction risk occurs where the value of the existing obligations are worsened by
movements in the foreign exchange rates. Transactional exposure arises from future
cash flows such as trade contracts and also occurs where the value of existing
obligations are affected by changes in foreign exchange rates. Economic risk relates
to adverse impact on entity /income for both domestic and foreign operations because
of sharp, unexpected change in exchange rate. Operational exposure occurs where the
market position of a firm changes as a result of the effect of exchange rate changes on
competition, prices and demand (El-Masry, 2006). Translation risk is also related to
assets or income derived from offshore enterprise. Translation exposure occurs
through currency mismatch and it is related to assets or income derived from offshore
enterprise (Madura, 2003).
Foreign Exchange risk comes about as a disparity between the assets held by a bank
and the loans that fund its balance sheet. An unexpected depreciation of the local
currency against the USD can dramatically increase the cost of servicing debt relative
to revenues. It can also negatively affect the creditworthiness of the bank (hence the
ability to raise new funds) and even generate a negative net income, with serious
consequences for the long-term financial stability of the bank (Moles, 2002). Banks
are particularly vulnerable to foreign exchange rate risk, since they operate in
developing countries where the risk of currency depreciation is high.
1.1.2 Financial Performance
The firm‟s debt ratio is the proportion of the firm‟s debt in relation to the total equity
finance in the company‟s capital structure (McMenamin, 2009). This key ratio is
famously known as an indicator of the company‟s long term solvency position and
also indicator of the financial risk position of the company. It‟s obtained by dividing
the total company debt with the total shareholders‟ funds. Gross profit is the

4
difference between revenue and cost of goods sold. Gross Margin is the ratio of gross
profit to revenue. Depends on situation or decision analyzed both or one of these two
performance indicators can be more suitable. For merchandising decisions in
company with large assortment of products gross profit expressed in money terms
needs to be used when measuring financial result on the level of all product
assortments or on the level of big product group. This allows seeing what the overall
financial result without digging into details is.
Gross profits are the cleanest accounting measure of true economic profitability. The
farther down the income statement one goes, the more polluted profitability measures
become, and the less related they are to true economic profitability. For example, a
firm that has both lower production costs and higher sales than its competitors is
unambiguously more profitable. Even so, it can easily have lower earnings than its
competitors (Abor, 2005).
The Return on Assets ratio (ROA), also called return on investment, is an important
profitability ratio because it measures the efficiency with which the company is
managing its investment in assets and using them to generate profit. It measures the
amount of profit earned relative to the firm's level of investment in total assets. The
return on assets ratio is related to the asset management category of financial ratios.
The calculation for the return on assets ratio is: Net Income/Total Assets (Brealey et
al, 2008). In MIX definition the return on asset ratio is: (Net Operating Income Taxes)
/ Average Assets. The higher the percentage, the better, as a high percentage means
that the company is succeeding in using its assets to generate sales.

5
1.1.3 Effect of Foreign Exchange Risk Management on Financial Performance
Although there is a growing literature linking foreign exchange risk management to
company performance there is, equally, a growing diversity of results. The diversity
of results can be partly explained by differences in the theoretical perspectives
applied, selected research methodologies, measurement of performance and
conflicting views on general employee involvement in decision making and, in part,
to the contextual nature of the individual firm (Carter et al, 2003).
Even studies based on the integrative models of employee involvement; incorporating
different theoretical perspectives and various employee attributes, provide
inconclusive results, suggesting that currency risk management has, at least, an
indirect effect on company performance (Adler and Dumas, 2010).
Previous research studies have provided a link between currency risk management
and firm performance (Ankrom, 2007) with very little conclusive results. Others (Lee,
2010) have shown that firms that have robust currency risk management frameworks
have higher firm performance. The main characteristics of good risk management
identified in these studies include; leadership of the risk team, adequate compensation
of the risk team and compliance with laws & best practice. There is a view that
companies with risk management departments are better corporate performers. In
recent times on the contrary, emphasis has geared towards general employee training
in currency risk management. Dufey (2005) contend that risk management
departments without well trained personnel to man the departments are less effective
and the company will many a time be prone to such currency risks.
The use of foreign exchange management strategies results in reduced foreign
exchange exposure hence minimal losses. According to Carter et al (2003) changes in

6
exchange rate can influence a firms current and future expected cash flows and
ultimately, stock prices. The direction and magnitude of changes in exchange rate on
firms value are a function of a firm‟s corporate hedging policy which indicates
whether the firm utilizes operational hedges and financial hedges to manage currency
exposure and the structure of its foreign currency cash flows. Stacy and Williamson
(2010) examine risk management and performance in a sample of firms in 14
companies listed on the Johannesburg stock exchange. They find that better risk
management is associated with better performance in the form of Tobin's q and ROA.
1.1.4 Commercial Banks in Kenya
Commercial banks are financial intermediary institutions that take deposits and gives
credit amongst other financial services. In Kenya, the banking sector plays a dominant
role in the financial sector, particularly with respect to mobilization of savings and
provision of credit. As per Bank Supervision Annual Report (2012) the banking sector
consisted of the Central Bank of Kenya, as the regulatory authority, 44 banking
institutions (43 commercial banks and 1 mortgage finance company -MFC). Out of
the 44 banking institutions, 31 locally owned banks comprise 3 with public
shareholding and 28 privately owned while 13 are foreign owned. The foreign owned
financial institutions comprise of 9 locally incorporated foreign banks and 4 branches
of foreign incorporated banks. During the period 2008-2012, the Kenyan banking
system showed resilience, which was attributed in part to the low financial integration
in the global financial market and the intensive supervision and sound regulatory
reforms (Bank Supervision Annual Report, 2009).
The performance of commercial banks in Kenya is highly financial in nature. It is
hence affected through low net cash flows, low sales turnover and uncertain profits

7
due to financial exchange rate volatility in the era of globalization. The Kenyan
shilling per US Dollar is undervalued and depreciation proves to be
counterproductive. While exchange rate fluctuation is a recurrent event, it is a
challenge to acknowledge foreign exchange risk after realizing financial distress by
dismal profits or loss performance.
1.2 Research Problem
Foreign exchange risk management is complex and requires a thorough understanding
of the banks business needs, its internal and external environment and exposures to
the financial markets. Foreign exchange risk hedging needs to be tailored around the
banks mission and vision statements, operational infrastructure, risk exposure and risk
appetite. Consequently, there are no „one size fits all‟ solutions (Piet and Raman,
2012). Challenges abound as banking institutions commit themselves to improving
risk management practices (Institute of International Finance – IIF). The large
percentage of the unbanked economically active people in Kenya has triggered the
proliferation of both officially and non-officially recognized banking institutions
providing financial services such as savings, loans and remittances as well as other
social intermediation services to millions of Kenyans all over the country. However
essential these institutions are -giving their quest to liberate people from financial
insecurity- its clientele is so massive that a collapse or mismanagement of these
institutions can deal a hefty economic shock to millions of people in the country.
The banking industry in Kenya is characterized by numerous teething problems.
These emanate from their calibre of target customers and the seemingly liberal and/or
informal system of operations. The rapid increase in private sector, international
investment in microfinance, plus a dose of common sense, makes foreign currency

8
risk management an important topic for commercial banks. Seventy percent of cross-
border, fixed-income investments are denominated in foreign currencies (meaning
currencies other than the currencies in which the banks are operating), leaving banks
with significant foreign exchange exposure. During the most recent global financial
crisis, some banks that depend on foreign currency-denominated debt have suffered
heavy foreign exchange losses that threaten their overall viability (Littlefield and
Kneiding, 2009). Many of the standard tools used to hedge currency risk, such as
futures, swaps and options contracts, are either not available in emerging markets or,
where available, are traded in illiquid and inefficient markets, making the range of
products available extremely limited. This has put an extra burden on corporate
treasurers to be able to find adequate hedge to their exposures in exotic currencies.
Locally, Njunge (2012) conducted a survey of the foreign exchange rate risk
management practices adopted by MFI‟s in Kenya; Oduori (2012) did a study
focusing on the strategies used by banks in combating emerging operational, strategic
and credit risks while Mutua (2013) did a survey of foreign exchange risk
management practices by foreign owned commercial banks in Kenya. These previous
studies have focused on the practices adopted by microfinance institutions and
selected banks in managing foreign exchange risk without relating these management
practices to a banks financial performance. With increased transactions using foreign
currency, the fluctuations in exchange rates tend to pose significant foreign exchange
risk. Hence the management of the foreign exchange risk ultimately affects the
financial performance of the bank. The study seeks to fill the knowledge gap by
analyzing the effect of foreign exchange risk management on the financial
performance of commercial banks in Kenya. The following research questions will
therefore guide this study: What are the different methods of foreign exchange risk

9
management used by commercial banks in Kenya? What is the effect of foreign
exchange risk management on financial performance of commercial banks in Kenya?
1.3 Objectives of the study
1.3.1 General Objective
The objective of the study was to establish the effect of foreign exchange risk
management on the financial performance of commercial banks in Kenya.
1.3.2 Specific Objectives
i. To establish the different modes of foreign exchange risk management used by
commercial banks in Kenya.
ii. To assess the effect of foreign exchange risk management on financial
performance of commercial banks in Kenya.
1.4 Value of the Study
The study will enrich Treasury/Risk managers with knowledge on risk management
especially techniques associated with foreign exchange risk management within the
Kenyan banking industry. Most Treasury Managers of banks, insurance companies
and other financial institutions will use the findings in the enforcement of such
foreign exchange risk management policies in such organizations. The literature,
study findings and recommendations will supplement the existing body of knowledge
on bank foreign exchange risk management.
This study is important to various stakeholders in the financial sector because it will
provide an insight into the effects of financial risk management on financial
performance of banks. Banks are the most reliable savings and credit facilities
available in Kenya. The study will be valuable to investors because it will provide

10
information on the foreign exchange risks which will help them make sound
decisions.
The information that will be obtained will be useful to the Government and research
institutions that may want to advance the knowledge and literature on intellectual
capital. It will also add to literature on the subject as reference material and stimulate
further research in the area. This study will be very valuable to the area of study of
intellectual capital and financial performance of commercial banks in Kenya.
The study will be useful to academicians as it will provide information that can be
used as a basis for further research. The study will also propose areas for further
research which will be very important to researchers who will easily get to know what
needs to be done in the area of study.
11
CHAPTER TWO
LITRATURE REVIEW
2.1 Introduction
This chapter highlights the importance of foreign exchange risk management, various
categories of currency risks and various techniques used to manage foreign exchange
risks as advanced by a number of scholars. The chapter also focuses on review of
empirical studies, general literature review, and theoretical framework and finally the
conclusions from literature review are presented.
2.2 Theoretical Review
There are various theories that suggest the irrelevance of managing the risk of change
in exchange rates. These theories suggest that changes in exchange rates are evened
out in some form or the other.
2.2.1 International Fisher Effect Theory
This model was developed by Irving Fisher in his book The Theory of Interest (1930).
It uses market interest rates rather than inflation rates to explain why exchange rates
change over time. The International Fisher effect states that exchange rates changes
are balance out by interest rate changes. The Fisher theory simply argues that real
interest rates across countries was equal due to the possibility of arbitrage
opportunities between financial markets which generally occurs in the form of capital
flows. Real interest rate equality implies that the country with the higher interest rate
should also have a higher inflation rate which, in turn, makes the real value of the
country‟s currency decrease over time. The relationship between relative interest rates
and foreign exchange rates is explained within the interest rate theory of exchange

12
rate expectations. Nominal interest rate differentials between two countries tend to
reflect exchange rate fluctuations. Giddy (1977) called this the international Fisher
effect, a close relationship to the Fisher effect, a phenomenon observed by Irving
Fisher (1896). If the international Fisher effect holds, interest rates in appreciating
currencies tend to be low enough, and in depreciating currencies high enough, to
offset expected currency gains and losses.
The International Fisher Effect (IFE) theory suggests that foreign currencies with
relatively high interest rates will tend to depreciate because the high nominal interest
rates reflect expected rate of inflation (Madura, 2010). Does the interest rate
differential actually help predict future currency movement? Available evidence is
mixed as in the case of PPP theory. In the long-run, a relationship between interest
rate differentials and subsequent changes in spot exchange rate seems to exist but with
considerable deviations in the short run (Hill, 2004). The international Fisher effect is
known not to be a good predictor of short-run changes in spot exchange rates (Cumby
and Obstfeld, 1981).
2.2.2 Purchasing Power Parity
The Purchasing Power Parity (PPP) was first developed by the Swedish economist
Gustav Cassel in 1920s to examine the relationship between the exchange rates of
different countries. The PPP holds if and when exchange rates move to offset the
inflation rate differentials between two countries. The PPP is also defined as the basis
of the “law of one price” which asserts that the exchange rate between two currencies
should be equal to the ratio of the price level of identical goods and services in the
two countries. The Purchasing Power Parity (PPP) theorem explains the relationship
between relative prices of goods and exchange rates. The PPP theorem propounds that
under a floating exchange regime, a relative change in purchasing power parity for

13
any pair of currency calculated as a price ratio of traded goods would tend to be
approximated by a change in the equilibrium rate of exchange between these two
currencies (Shapiro and Rutenberg, 1976).
According to the PPP, increase in the price level of a country will cause depreciation
of its exchange rate relative to other countries, thereby keeping the relative price of
identical goods the same across countries. This theory suggests that exchange rate
changes were offset by relative price indices/inflation since the Law of One Price
should hold. PPP follows from the law of one price, which states that in competitive
markets, identical goods will sell for identical prices when valued in the same
currency. It relates to an individual product and its generalization is the absolute
version of PPP. Relative PPP relates to changes in prices and exchange rates, rather
than on absolute price levels. It states that change in exchange rates is proportional to
the change in the ratio of the two nations‟ price levels, structural relationships
remaining unchanged.
The assumptions for PPP to hold are that goods are identical, all goods are tradable,
there are no transportation costs, information gaps, taxes, tariffs, or restrictions of
trade, and exchange rates are influenced only by relative inflation rates. Due to these
restrictive assumptions and empirical violation of the law of one price which is the
building block of PPP, monetary models of exchange rate determination was adopted.
Since currencies are considered assets, exchange rates are asset prices that adjust to
equilibrate international trade in financial assets. Like other asset prices, exchange
rates are determined by expectations about the future. Since currencies are treated as
assets this approach is called the asset approach.

14
2.2.3 Foreign Exchange Exposure Theory
Contemporary foreign exchange exposure theory (Buckley, 2000; Levi, 1996;
Shapiro, 2003) is of the opinion that exchange rate fluctuations should affect the value
of a multinational company mainly via foreign sales and foreign (net) assets, which
have to be denominated in the domestic currency of the parent company. Despite that,
the earliest empirical studies on the topic (Levi, 2009; Amihud, 2009; Jorion, 2010.),
although focusing on companies with considerable operations abroad, fail to show a
significant impact of fluctuations in exchange rates on the stock price of multinational
companies.
More recent studies (Jongen et al., 2006; Gao, 2000; Bartov et al. 1996; Bodnar &
Gentry, 1993), however, are more consistent with financial theory and find that
exchange rate movements, through their effect on sales and net assets values, are an
important factor in determining firm value.
2.2.4 Interest Rate Parity Theory
Concept that any disparity in the interest rates of two countries is equalized by the
movement in their currency exchange rates (Huang, 2009). This theory states that the
interest rate differential between two countries is equal to the differential between the
forward exchange rate and the spot exchange rate. Interest rate parity plays an
essential role in foreign exchange markets, connecting interest rates, spot exchange
rates and foreign exchange rates (Roll and Yan, 2000).
Most importantly to our purpose, Bilson and Hsieh (1983), Huang (2009), have
shown that the economic theory relating interest-rate differences among countries to
subsequent exchange rate changes (uncovered interest-rate parity) seems to have
broken down during the recent float. As a consequence, exchange-rate changes are no

15
longer governed by international interest differentials. Hacche and Townsend (1981)
and Meese and Rogoff (1983) have demonstrated that other plausible economic
theories, such as purchasing power parity and the monetary model, also add little to
random walk forecasts of exchange rates, at least at horizons of less than a year.
These studies all reported strong rejections of uncovered interest-rate parity.
Subsequent studies have confirmed these results. There is also an active theoretical
literature, which attempts to determine if the failure of uncovered interest parity is due
to risk aversion or market segmentation rather than market inefficiency. In contrast,
Roll and Yan (2000) suggest that forward exchange rates are unbiased predictors of
subsequent spot rates and there is really no forward premium puzzle.
2.2.5 Arbitrage Pricing Theory
The underlying principle of the pricing theory involves the recognition that the
anticipated return on any asset may be charted as a linear calculation of relevant
macro-economic factors in conjunction with market indices (Ross, 1976). It is
expected that there will be some rate of change in most if not all of the relevant
factors. Running scenarios using this model helps to arrive at a price that is equitable
to the anticipated performance of the asset (Roll and Yan, 2000). The desired result is
that the asset price will equal to the anticipated price for the end of the period cited,
with the end price discounted at the rate implied by the Capital Asset Pricing Model.
It is understood that if the asset price gets off course, that arbitrage will help to bring
the price back into reasonable perimeters (Ross, 1976).
2.3 Determinants of Financial Performance of Commercial Banks
The determinants of bank performances can be classified into bank specific (internal)
and macroeconomic (external) factors (Al-Tamimi, 2010; Aburime, 2005). These are
16
stochastic variables that determine the output. Internal factors are individual bank
characteristics which affect the banks performance. These factors are basically
influenced by internal decisions of management and the board. The external factors
are sector-wide or country-wide factors which are beyond the control of the company
and affect the profitability of banks. The overall financial performance of banks in
Kenya in the last two decade has been improving. However, this doesn't mean that all
banks are profitable, there are banks declaring losses (Oloo, 2010). Studies have
shown that bank specific and macroeconomic factors affect the performance of
commercial banks (Flamini et al. 2009). In this regard, the study of Olweny and
Shipho (2011) in Kenya focused on sector-specific factors that affect the performance
of commercial banks. Yet, the effect of macroeconomic variables was not included.
2.3.1 Bank Specific Factors/Internal Factors
The internal factors are bank specific variables which influence the profitability of
specific bank. These factors are within the scope of the bank to manipulate them and
that they differ from bank to bank. These include capital size, size of deposit
liabilities, size and composition of credit portfolio, interest rate policy, labour
productivity, and state of information technology, risk level, management quality,
bank size, ownership and the like. CAMEL framework often used by scholars to
proxy the bank specific factors (Dang, 2011). CAMEL stands for Capital Adequacy,
Asset Quality, Management Efficiency, Earnings Ability and Liquidity. Each of these
indicators are further discussed below.
2.3.1.1 Capital Adequacy
Capital is one of the bank specific factors that influence the level of bank profitability.
Capital is the amount of own fund available to support the bank's business and act as a
buffer in case of adverse situation (Athanasoglou et al. 2005). Banks capital creates

17
liquidity for the bank due to the fact that deposits are most fragile and prone to bank
runs. Moreover, greater bank capital reduces the chance of distress (Diamond, 2000).
However, it is not without drawbacks that it induce weak demand for liability, the
cheapest sources of fund Capital adequacy is the level of capital required by the banks
to enable them withstand the risks such as credit, market and operational risks they
are exposed to in order to absorb the potential loses and protect the bank's debtors.
According to Dang (2011), the adequacy of capital is judged on the basis of capital
adequacy ratio (CAR). Capital adequacy ratio shows the internal strength of the bank
to withstand losses during crisis. Capital adequacy ratio is directly proportional to the
resilience of the bank to crisis situations. It has also a direct effect on the profitability
of banks by determining its expansion to risky but profitable ventures or areas
(Sangmi and Nazir, 2010).
2.3.1.2 Asset Quality
The bank's asset is another bank specific variable that affects the profitability of a
bank. The bank asset includes among others current asset, credit portfolio, fixed asset,
and other investments. Often a growing asset (size) related to the age of the bank
(Athanasoglou et al., 2005). More often than not the loan of a bank is the major asset
that generates the major share of the banks income. Loan is the major asset of
commercial banks from which they generate income. The quality of loan portfolio
determines the profitability of banks. The loan portfolio quality has a direct bearing
on bank profitability. The highest risk facing a bank is the losses derived from
delinquent loans (Dang, 2011). Thus, nonperforming loan ratios are the best proxies
for asset quality. Different types of financial ratios used to study the performances of
banks by different scholars. It is the major concern of all commercial banks to keep
the amount of nonperforming loans to low level. This is so because high
18
nonperforming loan affects the profitability of the bank. Thus, low nonperforming
loans to total loans shows that the good health of the portfolio a bank. The lower the
ratio the better the bank performing (Sangmi and Nazir, 2010).
2.3.1.3 Management Efficiency
Management Efficiency is one of the key internal factors that determine the bank
profitability. It is represented by different financial ratios like total asset growth, loan
growth rate and earnings growth rate. Yet, it is one of the complexes subject to
capture with financial ratios. Moreover, operational efficiency in managing the
operating expenses is another dimension for management quality. The performance of
management is often expressed qualitatively through subjective evaluation of
management systems, organizational discipline, control systems, quality of staff, and
others. Yet, some financial ratios of the financial statements act as a proxy for
management efficiency. The capability of the management to deploy its resources
efficiently, income maximization, reducing operating costs can be measured by
financial ratios. One of this ratios used to measure management quality is operating
profit to income ratio (Rahman et al. in Ilhomovich, 2009; Sangmi and Nazir, 2010).
The higher the operating profits to total income (revenue) the more the efficient
management is in terms of operational efficiency and income generation. The other
important ratio is that proxy management quality is expense to asset ratio. The ratio of
operating expenses to total asset is expected to be negatively associated with
profitability. Management quality in this regard, determines the level of operating
expenses and in turn affects profitability (Athanasoglou et al. 2005).
2.3.1.4 Liquidity Management
Liquidity is another factor that determines the level of bank performance. Liquidity
refers to the ability of the bank to fulfill its obligations, mainly of depositors.

19
According to Dang (2011) adequate level of liquidity is positively related with bank
profitability. The most common financial ratios that reflect the liquidity position of a
bank according to the above author are customer deposit to total asset and total loan to
customer deposits. Other scholars use different financial ratio to measure liquidity.
For instance Ilhomovich (2009) used cash to deposit ratio to measure the liquidity
level of banks in Malaysia. However, the study conducted in China and Malaysia
found that liquidity level of banks has no relationship with the performances of banks
(Said and Tumin, 2011).
2.3.2 External Factors/ Macroeconomic Factors
The macroeconomic policy stability, Gross Domestic Product, Inflation, Interest Rate
and Political instability are also other macroeconomic variables that affect the
performances of banks. For instance, the trend of GDP affects the demand for banks
asset. During the declining GDP growth the demand for credit falls which in turn
negatively affect the profitability of banks. On the contrary, in a growing economy as
expressed by positive GDP growth, the demand for credit is high due to the nature of
business cycle. During boom the demand for credit is high compared to recession
(Athanasoglou et al., 2005). The same authors state in relation to the Greek situation
that the relationship between inflation level and banks profitability is remained to be
debatable. The direction of the relationship is not clear (Vong and Chan, 2009).
2.4 Empirical Review
Griffin and Stulz (2001) find the effect of exchange rate shocks is minimal in
explaining relative US industry financial performance and is even smaller in other
countries that are more open to trade finding that industry effects are more significant
than exchange rate effects. While there may be some differences in empirical

20
findings, as Marston (2001) shows, foreign exchange exposure most likely depends
on the competitive structure in an industry.
It is widely believed that changes in exchange rates have important implications for
financial decision-making and for the profitability of firms. One of the central
motivations for the creation of the euro was to eliminate exchange rate risk to enable
European firms to operate free from the uncertainties of changes in relative prices
resulting from exchange rate movements. At the macro level, there is evidence that
the creation of such currency unions results in a dramatic increase in bilateral trade
(Frankel and Rose, 2002). But do changes in exchange rates have measurable effects
on firms? The existing literature on the relationship between international stock prices
(at the industry or firm level) and exchange rates finds only weak evidence of
systematic exchange rate exposure (Doidge et al., 2003; Griffin and Stulz, 2001, two
recent studies). This is particularly true in studies of US firm share values and
exchange rates.
Bhatia (2004) made research on mitigating currency risk for investing in microfinance
institutions in developing countries found that there is a clear trade-off for investors
mitigating currency risk in least developed countries in the form of contract fees for
the benefit of protection against currency fluctuations. The best financial instrument
for investors interested in MFI‟s is currency options.
Hudon (2006) in his study of subsidies and financial performances of the
microfinance institutions stated that financial institutions including MFI‟s still exhibit
better management ratings. The technical, organizational and communication
competencies of the top managers are the most important management dimensions to
explain all financial results. Under this dimension of management, the professional

21
skills of top managers must be emphasized. Therefore the institutions were effective
in risk management performance.
Ahmed (2007) in the study of microfinance: realizing the social role of Islamic
finance examined that the bank has to create various reserves to cover various risks
arising due to the nature of its assets and liabilities since it positively contributes to
risk management in microfinance. Some observations and suggestions stated that risk
management has become more important now and its importance will continue to
grow in the future. Factors such as the increasing competition in markets and the
integration of new technology into the industry further reinforce the importance of
risk management in banks. However, it is disturbing to note that systematic risk
management is still not as widespread as it should be.
Omagwa (2005) in his exploratory study on foreign exchange risk management
practices by foreign owned commercial banks in Kenya, most banks consider
credit/default risk to be the most critical of all the financial risks though empirical
evidence shows that foreign exchange risk is the most critical risk for most firms. For
most banks, foreign exchange risk management systems were governed by guidelines
set by at head office (highly centralized foreign exchange risk management systems).
Most banks, regardless of their size, extensively utilized most of conventional
hedging instruments. Transaction exposure was rated as the most critical to most
banks when compared to translation and economic exposures. Some hedging practices
were considered by most banks to be more important than others, foreign currency
option and forward contracts were most frequently used; natural hedging/ matching
strategy, leading and lagging were also used. Most banks preferred the selective
hedging strategy as compared to hedging all open positions immediately.

22
Ubindi (2006) in his research on foreign exchange risk management by forex bureaus
in Kenya, focused on a sample of forex bureas in Kenya. Transaction exposure was
rated as most critical compared to others. Transaction exposure was through buying
and selling foreign currencies, cross currency dealings and investing and financing in
foreign currencies. The US dollar, sterling pound and Euro were currencies that were
greatly traded and thus had the greatest contribution to foreign exchange risk. The
foreign exchange risk management practices they used to mitigate foreign exchange
risk were forward contracts (most frequently used), money market hedge, currency
swap, and currency option. Most forex bureaus indicated that their foreign exchange
risk management systems were governed by guidelines set by the central bank of
Kenya as well as their individual decisions.
Kidong'oi (2013) conducted a study was to analyze the foreign exchange risk
management performance Techniques used by airline companies in Kenya. The study
involved analyzing of specific performance techniques used to manage foreign
exchange risk by airline companies in Kenya, this included leading and lagging, use
of derivatives, payment netting, payment Matching and invoicing. The study was
significant to field of finance in the area of foreign exchange risk management and the
scanty empirical literature is a limiting factor. The scope of the study was based on
finance, since it's the one that is directly involved on foreign exchange management.
The literature review contained empirical and theoretical literature on management of
foreign exchange risk performance techniques. It also contained a critical review of
the document with information related to the research problem and summary of the
gaps to be filled. The conceptual framework of the study comprises of five
independent variables, intervening variable (central bank of Kenya) and dependent
variable. The study employed a descriptive survey research design. The study was

23
carried out on a census on the total target population of 14 registered airline
companies in Kenya. Data was collected by the use of questionnaires and was
analyzed by the use of descriptive statistics and SPSS. The findings were presented in
frequency tables and percentages, graphs and charts. Both airline companies in Kenya
and International business organization benefited with the findings of this research.
From the study, the researcher concludes that the variables; Invoicing and Currency
clause, Leading and Lagging and Payment Matching were the main foreign Exchange
risk performance techniques used by most airline companies as indicated by most
respondents.
Kimani (2012) did a study on the foreign exchange risk management: strategies and
techniques used by banks in Kenya to manage foreign exchange risk exposure. The
research design adopted in the study was a census survey. The population used
consisted of 42 commercial banks licensed to operate in Kenya as listed by the
Central Bank of Kenya. Primary data collection, through the use of a questionnaire,
was used to gather information from the target population outlining issues relevant to
the study. Analysis was then done using Microsoft Excel. The analysis sought to
generate descriptive statistics and frequencies. Finally the presentation of the results
was done by use of frequency tables, graphical presentation and pie-charts. The
results of the study showed that the forward contract was the most frequently used
instrument. The money market hedge and the currency swap were also frequently
used. Parallel loans (Back-to-back loan), foreign currency denominated debt and cross
hedging techniques were moderately used. Futures contract, foreign currency option
and leading and lagging techniques were occasionally used. Prepayment was the least
used technique. In conclusion, the strategies and techniques used by banks in Kenya
to manage foreign exchange risk are matching/ natural hedging, engaging in spot

24
transactions, diversification, risk sharing, invoicing in strong currencies, avoidance
netting, money market hedge, parallel loans(back-to-back loan), foreign currency
denominated debt and cross hedging, forward contract, futures contract, foreign
currency option and leading and lagging and prepayment. The forward contract is the
most frequently used instrument.
It can also be concluded from the study that majority of the banks in Kenya hedge all
positions immediately. Others hedge selectively while some of the banks create
additional exposure beyond that arising from its business activities in order to profit
from exchange rate changes, meaning that the currency market in Kenya is not
information efficient. Minority of banks use a fixed rule for partial hedging while
leaving the remainder exposed. It can also be concluded that some banks do not hedge
against foreign exchange rate risk at all.
In light of the above findings, it‟s imperative that banks in Kenya pick out best
practices from each other and abroad in order to put foreign exchange exposure under
control to mitigate the effects of losses due to this risk from resulting in crises in the
economy.
Boru (2011) did a study to determine the foreign exchange risk management practices
by oil companies operating in Kenyan market. To achieve this objective, data was
collected from the target population comprising 27 major oil companies operating in
Kenyan market as listed in appendix 1 through administration of questionnaire using
„drop-and-pick-later‟ technique. Out of 27 companies, only 20 responded representing
a response rate of 74%. The study found that foreign exchange risk is the second most
significant exposure to oil companies after fluctuation in global crude oil prices and
therefore most of the
companies find it as an important risk to manage. US Dollar is the currency to which

25
all
the oil companies are mostly exposed because importation costs are settled in this
currency. It was established that all the companies practice internal hedging
techniques
while only 35% of the companies used external hedging techniques (derivatives). The
study noted that the internal hedging technique of changing the currency of billing
was
the mostly used technique by the oil companies while use of forward contracts is most
frequently used derivative. As a recommendation, oil companies should enhance their
foreign exchange risk management practices by increasing the use of derivatives
Kipchirchir (2011) studied the relationship between financial performance for
multinational corporations in Kenya and exchange rates volatility. Kipchirchir found
that there was a strong relationship between financial performance for multinational
corporations and exchange rate volatility in Kenya. This was attributed to the
difference between trading currency and financial reporting currency.
Singh (2013) did a study on the relationship between foreign exchange trading and
financial performance of commercial banks in Kenya. The objective of the study was to
establish the relationship between Foreign exchange trading and financial performance of
commercial banks in Kenya. The study adopted a survey research design where all 42
commercial banks were the focus of the study. Data was collected from secondary
sources: annual financial reports of commercial banks and foreign trading data (currency
forwards and swaps, and spot trading) reported to CBK. Pearson correlation, descriptive
statistics and multiple linear regression analysis were used. The study established that
from the multiple regression analysis, the coefficients for spot trading was 13.491
(p<.001), currency forwards 3.113 (p = .057) and currency swaps 4.820 (p = .095). The

26
study concluded that: currency swaps and forwards are negatively related with ROA
while currency spot is positively related with financial performance. Thus, currency
swaps, forwards and spots are significantly related with commercial banks‟ financial
performance.
Wanjohi (2013) did a study on the effect of financial risk management on the
financial performance of commercial banks in Kenya. The purpose of this study was to
analyze the effect of financial risk management on the financial performance of
commercial banks in Kenya. In achieving this objective, the study assessed the current
risk management practices of the commercial banks and linked them with the banks‟
financial performance. Return on Assets (ROA) was averaged for five years (2008-2012)
to proxy the banks‟ financial performance. To assess the financial risk management
practices, a self-administered survey questionnaire was used across the banks. The study
used multiple regression analysis in the analysis of data and the findings were presented
in the form of tables and regression equations.The study found out that majority of the
Kenyan banks were practicing good financial risk management and as a result the
financial risk management practices mentioned herein have a positive correlation to the
financial performance of commercial banks in Kenya.
2.5 Foreign Exchange Risk Management Strategies
2.5.1 Forward Contracts
An FX forward is an agreement to purchase or sell a set amount of a foreign currency
at a specified price for settlement at a predetermined future date, or within a
predetermined window of time. FX forwards help investors manage the risk inherent
in currency markets by predetermining the rate and date on which they will purchase
or sell a given amount of foreign exchange. The portfolio is thus protected against a
possible negative currency move and there are no additional price complications in

27
execution from doing a spot trade. Deliverable forwards are contracts that are settled
with the physical delivery of the foreign currency. Non-deliverable forwards are cash-
settled for the gain or loss on the value of the contract (Marshal, 1997).
Bodnar and Richard (1998) indicate that the most frequently used method is forward
exchange contract. With forwards, the firm can be fully hedged. However, some risks
including settlement risk that exchange rate moves in the opposite direction as either
forecast, and counter party risk which the other party is unable to perform on the
contract, the high cost of forward contracts will sometimes prevent firms to exercise
this tool to fully hedge their exposures.
2.5.2 Cross-Currency Swaps
Sun et al (1993) adds currency swap where counterparties exchange equal initial
principal of two different currencies by spot rate and comparative advantage. Though
a costly third party offsets default risk. In general terms, a currency swap is when two
parties, usually between a bank and a company to exchange payments denominated in
one currency for payments denominated in another. The usual aim to replace cash
flows scheduled in an undesired currency with flows in a desired currency to raise
capital in currencies of no significant revenues. Having raised the capital however, the
company may wish to swap its repayment into a currency in which it has future
operating revenues.
2.5.3 Options
An option is a unique financial instrument or contract that confers upon the holder or
the buyer thereof the right, but not an obligation, to buy or sell an underlying asset, at
a specified price, on or up to a specified date. In short, the option buyer can simply let
the right lapse by not exercising it. On the other hand, if the option buyer chooses to

28
exercise the right, the seller of the option has an obligation to perform the contract
according to the agreed terms. The asset underlying a currency option can be a spot
currency or a futures contract on a currency. An option on a spot currency gives the
option buyer the right to buy or sell the said currency against another currency, while
an option on a currency futures contract gives the option buyer the right to establish a
long or short position in the relevant currency futures contract. Options on spot
currencies are commonly available in the interbank over-the-counter markets, while
those on currency futures are traded on exchanges (Bodnar & Richard, 1998).
Currency option is a derivative instrument where the owner has the right but not the
obligation to exchange money denominated in one currency into another currency at a
pre-agreed exchange rate on a specified date. It thus avoids potential exposure as
counterparties have free and open choice to trade currency amount at specified rate
before expiry date. Ross et al, (2005) states the holder may buy a call option while a
writer may sell a put option.
2.5.4 Leading and Lagging
A lead strategy involves attempting to collect foreign currency receivables only when
a foreign currency is expected to depreciate and paying foreign currency payables
before they are due when a currency is expected to appreciate. On the other hand a lag
strategy involves delaying collection of foreign currency receivables if that currency
is expected to appreciate and delaying payables if the currency is expected to
depreciate. Leading and Lagging involves accelerating payments from weak currency
countries and delaying in flows from strong currency countries to weak currency
countries. However lead and lag strategies can be difficult to implement. The firm
must be in position to exercise some control over payment terms. Leading and
Lagging is a zero sum game, that is while one party benefits, the counter part looses.

29
Thus the benefit gained from taking advantage of exchange may be out weighed by
the cost of losing business due to the zero sum nature of this method (Abor, 2005).
The practice of leading and lagging has developed as one of many methods of
hedging against adverse impact of exchange rate movements.
2.5.5 Netting
Netting is a system is used in international transactions, by multinational companies
and involves reducing fund transfers between affiliates to only a netted amount. It
requires a firm to have centralized organization of its cash management. There are
basically two forms of payments netting. These include; Bilateral netting payment is
valuable only to the extent that subsidiaries sell back and forth to each other.
Multinational netting involves the transfers of a netted amount among three or more
affiliates. The use of payments netting reduces the physical flow of another. As a
result measurable costs such as the cost of purchasing foreign exchange, the
opportunity cost of the float (time in transit) and other transaction costs are minimized
or accommodated. Netting systems are set up to reduce the costs associated with inter-
affiliate cash transfers that result from business transactions. The payoff from
Multinational netting systems can be large relative to their expense (CFTC, 2009).
2.5.6 Price Adjustments
Price adjustments involve changing prices in different manners. When the local
currency of a subsidiary is devaluating, the subsidiary can increase the price, so as to
cancel the effect of devaluation. This technique is particularly used in countries where
devaluation is high and where derivative markets are efficient. However, as a
disadvantage of this method, prices cannot be raised without any consideration about
competitors because if prices increase too much the client will choose an equivalent
cheaper product/service from a competitor. Flexibility may be exhibited in the ability

30
to pass through changes in the price of inputs or in the general level of prices to
consumers through frequent price adjustments (Jacque & Lorange, 2004).
2.6 Financial Performance
Firm performance is a multidimensional construct that consists of four elements
(Alam et al. 2011). Customer-focused performance, including customer satisfaction,
and product or service performance; financial and market performance, including
revenue, profits, market position, cash-to-cash cycle time, and earnings per share;
human resource performance, including employee satisfaction; and organizational
effectiveness, including time to market, level of innovation, and production and
supply chain flexibility. Consistent with the theoretical foundations in the capabilities
and resource-based perspectives, it is argued that organizational capabilities are rent-
generating assets, and they enable firms to earn above-normal returns. For example,
performance management capability influences various measures of firm performance
by allowing business leaders to review and take corrective actions on any potential or
actual slippages proactively and in a timely manner (Athanasoglou et al, 2008).
Likewise, prior studies in marketing and strategy argue that customer management
capability (Alam et al, 2011) and process management capability (Ahmad et al, 2011)
influence several dimensions of firm performance.
Financial performance measures how well a firm is generating value for the owners. It
can be measured through various financial measures such as profit after tax, return on
assets (ROA), return on equity (ROE), earnings per share and any market value ration
that is generally accepted. Generally, the financial performance of banks and other
financial institutions has been measured using a combination of financial ratios
analysis, benchmarking, measuring performance against budget or a mix of these
methodologies (Ahmad et al, 2011).

31
The financial statements of financial institutions commonly contain a variety of
financial ratios designed to give an indication of the corporation's performance.
Simply stated, much of the current bank performance literature describes the objective
of financial organizations as that of earning acceptable returns and minimizing the
risks taken to earn this return (Alam et al, 2011). There is a generally accepted
relationship between risk and return, that is, the higher the risk the higher the expected
return. Therefore, traditional measures of bank performance have measured both risks
and returns. The increasing competition in the national and international banking
markets, the changeover towards monetary unions and the new technological
innovations herald major changes in banking environment, and challenge all banks to
make timely preparations in order to enter into new competitive financial
environment. Aburime (2009) investigated the effectiveness of Nigerian banks based
on their political affiliation. The study found that political factors were a major
determinant of performance of Nigerian banks.
Profit after tax has been widely used as measures of banks‟ performance. Regarding
factors affecting bank performance, different factors have been used by researchers
such as: shareholders‟ equity; liquid assets to assets; total loans to total deposits; fixed
assets to total assets; total borrowed funds to total assets; reserves for loans to total
assets; market concentration; the market size; labor productivity; bank portfolio
composition; capital productivity, bank capitalization; financial interrelation ratio; the
level of capitalization; age of the bank; per capita Gross Domestic Product (GDP), the
cost to-income ratio and customer satisfaction (Athanasoglou et al, 2008).
2.7 Summary of the Chapter
In Kenya, despite its adverse effects on cash inflows and outflows, Foreign Exchange
Risk Management (FERM) is a somewhat new phenomenon. As such, few studies

32
have been carried out in that area especially in the banking industry. In countries,
where studies on the impact of FERM on financial performance have been carried out,
researchers have used a diversity of methods to justify existence of a link between the
two variables. Though foreign exchange risk management is considered to involve a
set of complex indicators which face substantial measurement error due to the
complex nature of the interaction between risk management variables and
performance indicators, the purpose of this research is to examine the influence of
selected foreign exchange risk management strategies, namely the use of forward
contracts, cross-currency swaps, options, leading and lagging, netting and price
adjustments on the banks FI‟s financial performance.
Three general conclusions can be drawn from the literature review of foreign
exchange risk and banks. First, banks need additional funding to meet demand, and
debt capital is the most likely source for this funding. Second, foreign exchange rate
risk is significant, and though it is only one factor in a decision to lend to a bank, it is
a strong deterrent. Finally, the existing foreign exchange risk management practices
are prohibitively expensive, either to the client or the institution.
However most of these studies have focused on foreign exchange risk management
practices in developed nations whose financial position is different from that of
Kenya. The ones done in Kenya have focused on different industries other than the
commercial banks. Thus there is no literature focusing on various foreign exchange
risk management practices by commercial banks in Kenya. This study therefore seeks
to add literature on the effect of various foreign exchange risk management practices
on financial performance of commercial banks in Kenya.

33
CHAPTER THREE
RESEARCH METHODOLOGY
3.1 Introduction
This chapter sets out various stages and phases that were followed in completing the
study. In this stage, most decisions were about how research is going to be executed
and how respondents were approached, as well as when, where and how the research
was completed. The following subsections are included; research design, target
population, data collection instruments, and data collection procedures and data
analysis.
3.2 Research Design
The research used a descriptive research design. Descriptive survey research portrays
an accurate profile of persons, events, or account of the characteristics, for example
behaviour, opinions, abilities, beliefs, and knowledge of a particular individual,
situation or group (Burns and Grove, 2003). The descriptive survey method was
preferred because it ensured complete description of the situation (in depth study of
foreign exchange risk management), making sure that there is minimum bias in the
collection of data.
3.3 Target Population
Target population in statistics is the specific population about which information is
desired. According to Ngechu (2004), a population is a well-defined or set of people,
services, elements, and events, group of things or households that are being
investigated. The target population comprised of the forty three (43) commercial banks in
Kenya. The target population for this study was 43 commercial banks in Kenya as at

34
December 2013. The study used census approach to pick all the 43 commercial banks
in Kenya since the population is not large. A census is where data is collected from all
members of the population (Hair, Celsi, Money, Samouel, & Page, 2011).
3.4 Data collection
The study made use of secondary data. This include data that have been collected by
other people for other purposes but which are still usable in this type of research
study. Secondary data was collected from annual reports submitted to the CBK by the
banks from the CBK website. Annual reports of the banks were analyzed for the
period between 2009 and 2013, which was the study period. All the banks under study
have been continually in business between 2009 and 2013 and were included to
ensure that the sampling frame is current and complete.
3.5 Data Analysis
The method for analyzing data involves the utilization of the right analytical tools to
address the research questions of the study. The study involved an assessment of
foreign exchange risk management to establish the relationship between foreign
exchange risk management and financial performance of commercial banks in Kenya.
Data collected from the study was sorted, edited and corded to have the required
quality and accuracy. It was then entered into SPSS (Version 21) for generation of
frequency tables, charts, correlations and regressions which helped in the analysis.
The multiple linear regression analysis was applied to examine the extent of influence
of the independent variable on the dependent variables. The regression model is a
multivariate model stating the commercial banks ROA as a function of the selected
foreign exchange risk management strategies.

35
3.5.1 Analytical Model
The study adopted the following regression function that includes the dependent variable
and independent variables;
Y = β0 + β1X1+ β2X2+ β3X3 + β4X4 + β4X4 + β5X5 + β6X6
Where:
Y= ROA of the commercial banks in Kenya which is a profitability measure is the
value of the dependent variable.
β0 - Constant/Y intercept
X1 - Forward Contracts, this was measured using the percentage change in
agreed market value of the currency and value agreed between parties to
buy/sell a specified amount of a currency at a specified rate on a particular date
in the future
X2 - Cross-Currency swaps, this was measured by the percentage change in
value of currency due to exchange in currency
X3 – Options, this was measured by the change in premium which is paid up
front to avoid foreign exchange exposure.
X4 - Leading and Lagging this was measured using the value of loss from
depreciation of the soft currency and benefit from the appreciation of the hard
currency
X5 - Price Adjustments, this was measured by the percentage change in price of
commodities due to change in foreign exchange

36
X6 – Is the size of the company which was used as the control variable, size was
measured using the Natural Log of Total assets
ε - Error term
The independent variables X1, X2, X3, X4, and X5 represent the foreign exchange risk
management strategies used for this study which was operationalised and measured
using the various data that was collected from annual reports of the commercial banks
submitted to the CBK. The study used the amount quoted in the reports in each
foreign exchange risk management strategy.
Additionally, the strength of the model was measured using the t-test because the
sample size of the study is small. The level of significance of a t-test compares the
means of two samples. Thus, the t-test compares the actual difference between two
means in relation to the variation in the data which is expressed as the standard
deviation of the means difference.
Operation definition of variable
Variables Definition Measurement
Y ROA is the
Return on
Asset
ROA; was measured using the banks ROA, ratio, this will be
used as the measure of financial performance
X1 X1is the
Forward
Forward Contracts, this was measured using the ratio of
change in agreed market value of the currency between
parties to buy/sell a specified amount of a currency at a

37
Contracts specified rate on a particular date in the future
X2 X2 is the
Cross
Currency
Swap
Cross-Currency swaps, this was measured by the ratio of
change in value of currency due to exchange in currency
X3 X3 is the
Options
Options, this was measured by ratio of change in premium
which is paid up front to avoid foreign exchange exposure.
X4 X4 is the
Leading and
Lagging
Leading and Lagging was measured as the ratio of loss in
value depreciation of Ksh due to change in foreign exchange
X5 X5 is the Price
Adjustments
Price Adjustments, was measured as ratio of change in
price of commodities due to change in foreign exchange
X6 X6 is the
Netting
Netting ; was measured using the natural logarithm of total
assets held by the bank Kenya

38
CHAPTER FOUR
DATA ANALYSIS AND PRESENTATION OF FINDINGS
4.1 Introduction
This chapter presents analysis and findings of the study as set out in the research
objective and research methodology. The general objective of the study was to
establish the relationship between Foreign Exchange trading on one hand and
financial performance on the other among commercial banks in Kenya. The data was
gathered exclusively from the secondary source which included records at Central
Bank of Kenya and commercial banks audited financial report. Data was collected
from a total of 42 banks.
4.2 Data Presentation
The study first found it necessary to determine the trend of foreign exchange trading
and financial performance of commercial banks in Kenya for the year 2009-2013.
This was to determine the overall financial performance as a result of foreign
exchange trading over a range of time period.
By determining the overall performance of the foreign trade variables under the study
from 2009-2013 i.e. Forward Contracts, Cross Currency Swaps, Options and the
financial performance measure Return on Assets (ROA). Their mean, median,
maximum, minimum, skewness and kurtosis were taken in to account. The findings
were as indicated in Table 4.1.

39
Table 4.1: Descriptive Statistics
ROA Forward
Contracts
Options Cross
Currency
Swaps
observations 206.000 208.000 208.000 202.000
Range 23.090 0.140 0.093 0.154
Minimum -12.690 0.001 0.001 0.000
Maximum 10.400 0.140 0.093 0.154
Mean 2.164 0.034 0.027 0.031
Std. Deviation 2.601 0.032 0.020 0.030
Skewness -1.475 1.033 1.095 1.117
Kurtosis 6.465 -0.042 0.762 0.865
4.2.1 Correlation
The study used correlation matrix to establish if linear relationship exists between
foreign exchange trading and profitability or financial performance of commercial
banks. From Table 4.2, there were very good, positive and significant linear
association between Options and financial performance in: Consolidated Bank (.887;
p = .045); Co-operative Bank (.911; p = .032); Dubai Bank (.986; p = 0.002).
Negative and significant relationship was established in: Standard Chartered Bank (-
.806; p = .10); NIC Bank (-.906; p = .034); K-Rep Bank (-.854; p =.066); KCB Bank
(-.854; p=.066); Giro Bank (-.930 = p=.022); Development Bank (-.908; p=.033).
The study established a very good but negative and significant relationship between
financial performance and Forward Contracts as displayed in Table 4.2: Bank of
Baroda (-.924; p=.025); Dubai Bank (-.966; p = .008); and, Eco bank (-.829; p=.083).
40
Very good and significant linear relationships were established between Forward
Contracts and financial performance in: Giro Bank (.878; p=.05); and, ABC Bank
(.864; p=.059).
From Table 4.2 the study further established a very good but negative and significant
relationship between financial performance and Cross Currency Swaps in:
Development Bank (-.897; p=.039); First Community (-.901; p<.001); Standard
Chartered (-.895; p=.04); and Transnational Bank (-.833; p=.08). Very good, positive
and significant relationship between financial performance and Cross Currency Swaps
in Bank of India (.935; p=.02).
See Table 4.2 - Correlation Matrix on Appendix II
4.2.2 Regression Analysis
In the endeavour, the study sought to determine the goodness of fit of the regression
equation using the coefficient of determination between the overall independent
variables and financial performance. Coefficient of determination established the
strength of the relationship.
Table 4.3 illustrates that the strength of the relationship between financial
performance and independent variables. From the determination coefficients, it can be
noted that there is a strong relationship between dependent and independent variables
given an R2 values of 0.856 and adjusted to 0.801. This shows that the independent
variables (Options, Forward Contracts, Cross Currency Swaps, Leading and Lagging,
Price Adjustments, Netting) accounts for 80.1% of the variations in profitability as
measured by ROA.

41
The study also used Durbin Watson (DW) test to check that the residuals of the
models were not auto-correlated since independence of the residuals is one of the
basic hypotheses of regression analysis. Being that the DW statistic were close to the
prescribed value of 2.0 (2.006) for residual independence, it can be concluded that
there was no autocorrelation.
Table 4.1: Model Goodness of Fit
R (Correlation) R Square
(Coefficient of
Determination)
Adjusted
R Square
Std. Error of
the Estimate
Durbin-
Watson
.925a .856 .801 2.40187 2.006
a. Dependent Variable: ROA
b. Predictors: (Constant), Cross Currency Swaps, Options, Forward Contracts,
Leading and Lagging, Price Adjustments, Netting
Analysis of Variance (ANOVA) was used to make simultaneous comparisons
between two or more means; thus, testing whether a significant relation exists
between variables (dependent and independent variables). This helps in bringing out
the significance of the regression model. The ANOVA results presented in Table 4.3
shows that the regression model has a margin of error of p = .008. This indicates that
the model has a probability of 0.8% of giving false prediction. This point to the
significance of the model.

42
Table 4.2: Analysis Of Variance
Sum of
Squares
df Mean
Square
F Sig.
Regression 17.937 6 5.979 41.036 .008b
Residual 1136.488 197 5.769
Total 1154.425 200
a. Dependent Variable: ROA
b. Predictors: (Constant), Cross Currency Swaps, Options, Forward Contracts,
Leading and Lagging, Price Adjustments, Netting
The regression analysis established was:
ROA = 1.627 + 13.491*Options + 3.113*Forward Contracts + 4.820*Cross Currency
Swaps + 0.720*Leading and Lagging - 0.071*Price Adjustments + 0.044*Netting
From the finding in Table 4.5, the study found that holding Options, Forward
Contracts, Cross Currency Swaps, Leading and Lagging, Price Adjustments and
Netting at zero profitability ratio (ROA) will be 1.627.
It was established that a unit increase in Options, while holding other factors (Forward
Contracts, Cross Currency Swaps, Leading and Lagging, Price Adjustments and
Netting) constant, will lead to an increase in ROA by 13.491 (p<.001). Further, unit
increase in Forward Contracts, while holding other factors (Options, Cross Currency
Swaps, Leading and Lagging, Price Adjustments, and Netting) constant, will lead to
an increase in ROA by 3.113 (p = .057). A unit increase in Cross Currency Swaps,
while holding other factors (Options, currency Forward, Leading and Lagging, Price

43
Adjustments, and Netting) constant, will lead to an increase in ROA by 4.820 (p =
.095).
Moreover, unit increase in Leading and Lagging, while holding other factors
(Options, Forward Contracts, Cross Currency Swaps, Leading and Lagging, Price
Adjustments and Netting) constant, will lead to an increase in ROA by 720 (p = .024).
A unit increase in Price Adjustments while holding Options, Forward Contracts,
Cross Currency Swaps, Leading and Lagging, and Netting constant will lead to a
0.071 (p = .036) decrease in ROA. Holding Options, Forward Contracts, Cross
Currency Swaps, Leading and Lagging, and Price Adjustments constant while
increasing Netting by a unit would result in 0.044 increase in ROA.
Table 4.3: Regression Model
Unstandardized
Coefficients
Standardized
Coefficients
t Sig.
B Std. Error Beta
(Constant) 1.627 .404 4.024 .123
Options 13.491 8.714 12.110 1.548 .000
Forward Contracts 3.113 5.292 3.042 .588 .057
Cross Currency
Swaps
4.820 5.656 3.060 .852 095
Leading and
Lagging
.720 .944 .154 4.762 .024
Price Adjustments -.071 .113 -.165 -3.628 .036
Netting .044 .103 .021 3.429 .016
a. Dependent Variable: ROA
The study conducted a multicollinearity tests to determine if two or more predictor
(independent) variables in the multiple regression model are highly correlated. The
study used tolerance and variance inflation factor (VIF) values for the predictors as a
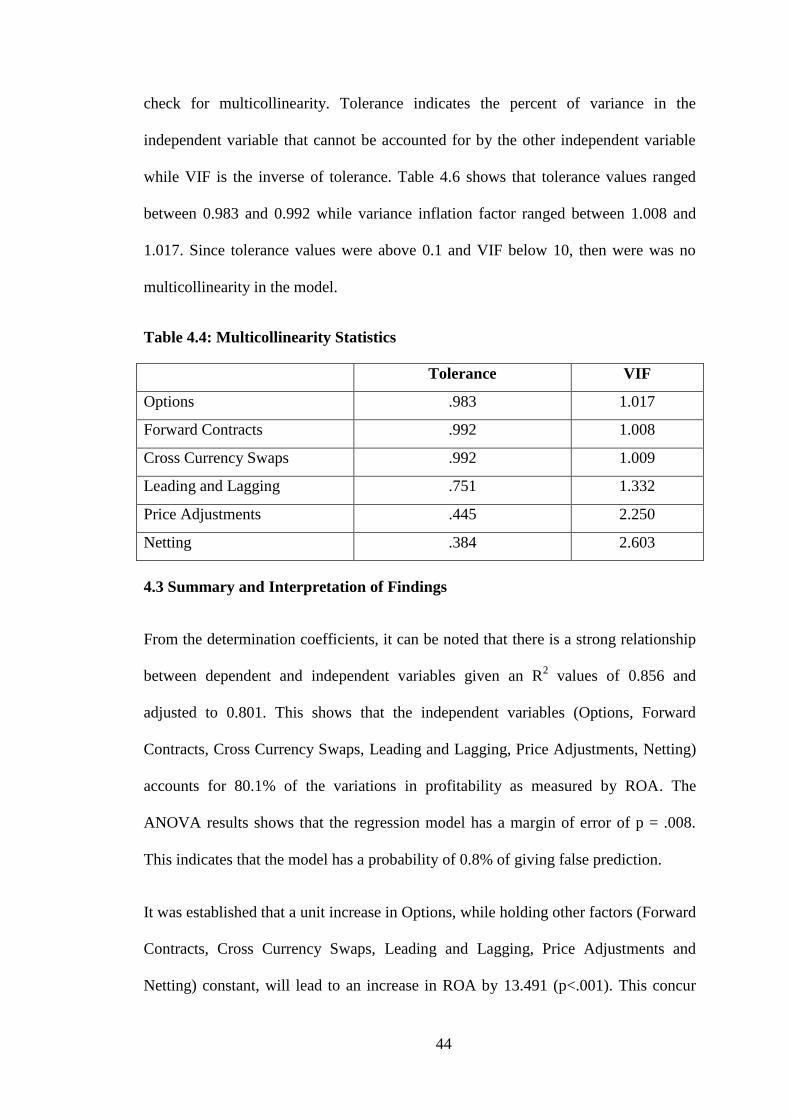
44
check for multicollinearity. Tolerance indicates the percent of variance in the
independent variable that cannot be accounted for by the other independent variable
while VIF is the inverse of tolerance. Table 4.6 shows that tolerance values ranged
between 0.983 and 0.992 while variance inflation factor ranged between 1.008 and
1.017. Since tolerance values were above 0.1 and VIF below 10, then were was no
multicollinearity in the model.
Table 4.4: Multicollinearity Statistics
Tolerance VIF
Options .983 1.017
Forward Contracts .992 1.008
Cross Currency Swaps .992 1.009
Leading and Lagging .751 1.332
Price Adjustments .445 2.250
Netting .384 2.603
4.3 Summary and Interpretation of Findings
From the determination coefficients, it can be noted that there is a strong relationship
between dependent and independent variables given an R2 values of 0.856 and
adjusted to 0.801. This shows that the independent variables (Options, Forward
Contracts, Cross Currency Swaps, Leading and Lagging, Price Adjustments, Netting)
accounts for 80.1% of the variations in profitability as measured by ROA. The
ANOVA results shows that the regression model has a margin of error of p = .008.
This indicates that the model has a probability of 0.8% of giving false prediction.
It was established that a unit increase in Options, while holding other factors (Forward
Contracts, Cross Currency Swaps, Leading and Lagging, Price Adjustments and
Netting) constant, will lead to an increase in ROA by 13.491 (p<.001). This concur
45
with Bodnar and Richard (1998) who indicate that options on spot currencies are
commonly available in the interbank over-the-counter markets, while those on
currency futures are traded on exchanges. Currency option is a derivative instrument
where the owner has the right but not the obligation to exchange money denominated
in one currency into another currency at a pre-agreed exchange rate on a specified
date. It thus avoids potential exposure as counterparties have free and open choice to
trade currency amount at specified rate before expiry date. Ross et al, (2005) states the
holder may buy a call option while a writer may sell a put option.
Further, unit increase in Forward Contracts, while holding other factors (Options,
Cross Currency Swaps, Leading and Lagging, Price Adjustments, and Netting)
constant, will lead to an increase in ROA by 3.113 (p = .057). This is in line with
Bodnar and Richard (1998) who indicate that the most frequently used method is
forward exchange contract. With forwards, the firm can be fully hedged. However,
some risks including settlement risk that exchange rate moves in the opposite
direction as either forecast, and counter party risk which the other party is unable to
perform on the contract, the high cost of forward contracts will sometimes prevent
firms to exercise this tool to fully hedge their exposures.
A unit increase in Cross Currency Swaps, while holding other factors (Options,
currency Forward, Leading and Lagging, Price Adjustments, and Netting) constant,
will lead to an increase in ROA by 4.820 (p = .095). This correlate Sun et al (1993)
who posits currency swap where counterparties exchange equal initial principal of
two different currencies by spot rate and comparative advantage. Though a costly
third party offsets default risk. The usual aim to replace cash flows scheduled in an

46
undesired currency with flows in a desired currency to raise capital in currencies of no
significant revenues.
Moreover, unit increase in Leading and Lagging, while holding other factors
(Options, Forward Contracts, Cross Currency Swaps, Leading and Lagging, Price
Adjustments and Netting) constant, will lead to an increase in ROA by 720 (p = .024).
this correlates with Abor (2005) that the firm must be in position to exercise some
control over payment terms. Leading and Lagging is a zero sum game, that is while
one party benefits, the counter part looses. Thus the benefit gained from taking
advantage of exchange may be outweighed by the cost of losing business due to the
zero sum nature of this method. The practice of leading and lagging has developed as
one of many methods of hedging against adverse impact of exchange rate movements.
A unit increase in Price Adjustments while holding Options, Forward Contracts,
Cross Currency Swaps, Leading and Lagging, and Netting constant will lead to a
0.071 (p = .036) decrease in ROA. Holding Options, Forward Contracts, Cross
Currency Swaps, Leading and Lagging, and Price Adjustments constant while
increasing Netting by a unit would result in 0.044 increase in ROA. This is in line
with CFTC (2009) who posit that the use of payments netting reduces the physical
flow of another. As a result measurable costs such as the cost of purchasing foreign
exchange, the opportunity cost of the float (time in transit) and other transaction costs
are minimized or accommodated. Netting systems are set up to reduce the costs
associated with inter-affiliate cash transfers that result from business transactions.

47
CHAPTER FIVE
SUMMARY, CONCLUSION AND RECOMMENDATIONS
5.1 Summary
The objective of this study was to determine the effect of foreign exchange risk
management on the financial performance of commercial banks in Kenya
The study provided two types of data analysis; namely descriptive analysis and
inferential analysis. The descriptive analysis helps the study to describe the relevant
aspects of the phenomena under consideration and provide detailed information about
each relevant variable. For the inferential analysis, the study used the Pearson
correlation and Regression analysis statistics. While the Pearson correlation measures
the degree of association between variables under consideration, the panel data
regression estimates the relationship between the dependent and independent
variables. Pearson correlation coefficient was also used to test if there exist any
relationship between foreign exchange trading and financial performance of
commercial banks in Kenya.
The study first found it necessary to determine the trend of foreign exchange trading
and financial performance of commercial banks in Kenya for the year 2009-2013.
This was to determine the overall financial performance as a result of foreign
exchange trading over a range of time period. All the banks financial statements
analysed in this study showed that banks undertake forex trading like Forward
Contracts, Cross Currency Swaps and Options which impact significantly on their
income. Tier I banks exhibit more of forex trading than most Tier II and Tier III banks
may be due to huge capital base. 100% of the banks had carried out forex trading.

48
This serves to show that majority of the banks income comes from other sources in
addition to interest income from the loans.
5.2 Conclusions
The findings show that the mean of Forward Contracts is relatively high at as
compared to other variables. It shows that there was significant variability or high
volatility (Risk) in the financial performance during 2009-2013. High volatility
indicated that there was a higher risk in financial performance of the commercial
banks. While the standard deviation of Cross Currency Swaps is relatively very low as
compared to other variables. Cross Currency Swaps has highest range as compare to
other variables. From skewness, the study observed that Options, Cross Currency
Swaps, Forward Contracts are positively skewed while ROA is negatively skewed
which clarified that the variables are asymmetrical. Skewness value of ROA is less
than zero so it is relatively asymmetrical. Kurtosis values indicated that all
independent variables have platy-kurtic distribution and it is concluded that variables
are not normally distributed.
The correlation matrix indicates that Forward Contracts is highly and negatively
correlated with Rate of return. Cross Currency Swaps is also highly and negatively
correlated with Rate of return. Finally Currency spot are also highly and positively
correlated with Rate of return. This implies that the foreign trading variables currency
options, Forward Contracts, and Options are very crucial in determining financial
performance of commercial banks in Kenya.
5.3 Policy Recommendations
The study investigated the relationship between foreign exchange trading and
financial performance of commercial banks in Kenya and aim to shed some additional
light on the topics of foreign exchange trading and risk. The study recommends that

49
the issues related to foreign exchange trading should always be taken in to account to
improve the banks foreign exchange transactions and hence performance.
The study recommends that Forex trading among commercial banks should be
continued and capital should be invested in projects that maximize returns. The
governance structures need to be put in place so as to enhance returns on capital and
assets and in turn maximize returns to the commercial banks.
The study also suggest that despite concerns that Forex trading among banks entail
new market risks that need regulatory intervention, the profitability and generally
performance of the banks has not changed so much. However, market risk does vary
considerably across the banks. Therefore a better way of assessing the risks associated
with Forex trading and how these risks affect the banking sector in general must be
undertaken.
The evidence suggests that Forex trading does improve the performance of the banks
in terms of their gross income. We recommend that this study be carried out further
and the whole banking industry to be studied under categories of listed and not listed
and a proper study on all the Tiers. This should also extend to other firms listed at the
NSE and not just the banking industry. From a broader perspective, we note that there
was a great improvement in most ratios like the ROA profitability ratios among other
variables that were considered in the study. Most items on the balance sheets showed
an increasing trend during the study period.
Policy makers should undertake to understand why Forex trading among commercial
banks is not as robust in Kenya as compared to other developed countries and what
should be done to improve capital investments to maximize returns.

50
5.4 Limitations of the Study
The researcher encountered various limitations that may have affected the findings of
this study. For instance, the study relied on secondary data sources. Secondary data
can, however, be unreliable as they are intended for other purposes. This could
include convincing external stakeholders that the business performs well. To curb
this, the study sought audited financial results of the commercial banks to collect data
on performance and data reported to CBK‟s Bank Supervisory Department.
The sample for this study might have been small and could have the drop-back of not
being representative of the population reality. To mitigate this, the researcher carried
the study on banks that had traded consistently for five years. Moreover, the study
intended to conduct a study at individual bank level to determine the relationship
between profitability and financial performance which improved the accuracy of
results. Further, other factors might have effect on the financial performance of banks
which might moderate the relationship between foreign trading and financial
performance. In cognizance of this, the study tested the significance of the established
relationship to mitigate this. In addition, information on forex trading is sensitive and
access to such information proved a challenge.
5.5 Suggestions for Further Study
The study suggests that another research be done on other independent variables that
explain financial performance under forex trading. All the aspects of forex trading in
the banking sector should be studied so that better results can be obtained.
This study covers a shorter period. A study should be done covering a longer period
say 10 years which may give different results than the one obtained in this study.
Also, Commercial banks should put more emphasis on investment and project
51
appraisal for a proper cost benefit analysis. Proper project appraisal is key in any
investment like in forex trading hence another study can be done on each aspect of
forex trading and its effect on financial performance. In addition, the study also
suggests that further studies should be conducted on long-term and short term capital
investments for the better option to be selected which maximizes the shareholders‟
value.
The study also suggests that broader areas of study like the economy in general and a
much bigger population be covered so that bigger and better results can be obtained
on other variables that can explain whether there is a relationship between forex
trading and financial performance or economic performance . This study was only
limited to the banking sector.
It addition, the study suggests that the qualitative aspects must also be introduced so
that first-hand information can be obtained from the bankers and even management of
the various banks. Questionnaires must be administered and one on one interview
with bank officers be held so that the qualitative aspects can also be measured. This
study centres more on quantitative aspects only and fails to capture the qualitative
aspects.
Finally, forex trading among Kenyan banks should also be compared to other banks in
the developed and undeveloped economies. Policy makers must come up with better
policies governing foreign exchange trading.

52
REFERENCES
Abor, J. (2005). Managing foreign exchange risk among Ghanaian firms. Journal of
Risk Finance, 6 (4)),6-318.
Adler, C. & Dumas, F. (2010). Does Fuel Hedging Make Economic Sense? The Case
of the US Airline Industry. Financial Management, 35, 53-86
Ahmad, H. K., Raza, A., Amjad, W. & Akram, M. (2011). Financial Performance of
Finance Companies in Pakistan. Interdisciplinary Journal of Contemporary
Research in Business , 2 (12), 732-744
Ahmed, H. (2007). Waqf-Based Microfinance: Realizing the Social Role of Islamic
Finance. Paper presented at the International Seminar on Integrating Awqaf in
the Islamic Financial Sector.
Alam, H. M., Raza, A. & Akram, M. (2011). Financial Performance of Leasing
Sector. The Case of China. Interdisciplinary Journal of Contemporary
Research in Business , 2 (12), 339-345
Allayannis, G. & Ofek, E. (2001). Exchange Rate Exposure, Hedging, and the Use of
Foreign Currency Derivatives. Journal of International Money and Finance,
20 (2), 273-296.
Ankrom, J. (2007). Corporate Financing and Investment Decisions When Firms Have
Information that Investors Do not Have. Journal of Financial Economics, 13,
187-221.
Athanasoglou, P. P., Brissimis, S. N. & Delis, M. D. (2008). Bank-specific, industry-
specific and macroeconomic determinants of bank profitability. International
Financial Markets Institutions & Money, 18, 121-136.
Barton, T. L., Shenkir, W. G. & Walker, P. L. (2002). Making enterprise risk
management pay off. FT Press.
Bartov, E. & Bodnar, G. M. (1996). Firm valuation, earnings expectations and the
exchange rate exposure effect, Journal of Finance, 13, 1755-1785.
Bhatia, R. (2004). Mitigating Currency Risk for Investing in Microfinance Institutions
in Developing Countries. Social Enterprise Associates. India: Springer.
Bilson, J. F. & Hsieh, D. A. (1983). The profitability of currency speculation.
International Journal of Forecasting, 3(1), 115-130.

53
Bodnar, G.M. & Gentry, W. M. (1993). Exchange rate exposure and industry
characteristics: Evidence from Canada, Japan and the USA, Journal of
International Money and Finance, 4, 29–45.
Bodnar, G.M. & Richard C. (1998). A Simple Model of Foreign Exchange Exposure.
Wharton/CIBC Survey of Risk Management by US Non-Financial Firms, 8(3),
15-20.
Brealey, R.A., Myers, S. C. & Allan, F. (2008). Principles of corporate finance (9th
edition ed.), New York: McGraw-Hill.
Carter D.A, Pantzalis, C & Simkins, B.J (2003).Firm wide Risk Management of
Foreign Exchange Exposure by U.S. Multinational Corporations Version of
April 28, 2003.
CFTC (2009). Staff Report on Commodity Swap Dealers and Index Traders with
Commission Recommendations. US: Commodity Futures Trading
Commission.
Cumby, R.E. & M. Obstfeld (1981). A note on Exchange Rate Expectations- and
Nominal Interest Differentials: A Test of the Fisher Hypothesis. Journal of
Finance, 5, 697 703
Dufey, G. & Srinivasulu, S. (2005). The Case for Corporate Management of Foreign
Exchange Risk, Financial Management, 6, 54-62.
El-Masry, A A. (2006). Derivatives use and risk management practices by UK
nonfinancial companies. Managerial Finance volume 32 number 2, pp.137-159
Featherson, S., Littlefield, E. & Mwangi, P. (2006).Foriegn Exchange Management
.Microfinance: What is it and how can it be managed? Retrieved from
http://www.cgap.org/sites/default/files/CGAP-Focus-Note-Foreign-Exchange-
Rate-Risk-in-Microfinance-What-Is-It-and-How-Can-It-Be-Managed-Jan-
2006.pdf Accessed October, 2009.
Giddy, I.H. (1977). Exchange Risk Whose view? Financial Management,8, 23-33.
Griffin, J. M. & Stulz, R. M. (2001). International competition and exchange rate
shocks: a cross-country industry analysis of stock returns. Review of Financial
Studies, 14(1), 215-241.
Huang, J C. & Brahmasrene, T. (2009). The effect exchange rate expectations on
Market share .Managerial 29 (1), 55-72.

54
Jacque, L.L. & Peter, L. (2004). Hyperinflation and global strategic management.
Columbia Journal of World Business, 19(2), 68-75
Jorion, P. (2010). The pricing of exchange rate risk in stock market, Journal of
Financial and Quantitative Analysis,26,(3),363–376.
Lee, C. (2010). Corporate diversification and firm performance. Journal of political
economy, 102, 1248-1280.
Littlefield, E. & Kneiding, C. (2009). The global financial crisis and its impact on
microfinance. Washington, DC, CGAP Focus Note, (52).
Madura, J. (2010). International Financial Management, 10th Edition, South-Western
College Publishing.
Mark, H. (2006). Appraising the Poverty Outreach of Microfinance. World
Development, 34(3), 446-464.
McMenamin, J. (2009). Financial Management: an introduction, London: Routledge.
Meese, R. A. & Rogoff, K. (1983). Empirical exchange rate models of the seventies:
Do they fit out of sample?. Journal of international economics, 14(1), 3-24.
Moles, P. (2002). Managing strategic exchange risks exposures. Managing Finance,
28, 29-39.
Njunge, G.T. (2012). A survey of the foreign exchange rate risk management
practices adopted by microfinance institutions in Kenya. MBA Thesis at the
University of Nairobi
Oduori, C.A. (2012). A survey of strategies used by microfinance institutions in
combating emerging operational, strategic and credit risks. MBA Thesis at the
University of Nairobi.
Roll, R. & Yan, S. (2000). An explanation of the forward premium „puzzle‟.
European Financial Management, 6(2), 121-148.
Salifu, Z., Osei, K A. & Adjasi, K. D. C. (2007). Foreign exchange risk exposure of
listed companies in Ghana. The Journal of Risk finance,8(4), 380-393.
Shapiro, A. C. (2003). Multinational financial Management,7th ed. New York: Wiley.
Singh, K. S. (2013). The relationship between foreign exchange trading and financial
performance of commercial banks in Kenya. Unpublished Masters thesis,
University of Nairobi.
Stacy, O. M. & Williamson, R. G. (2010). Exchange rate exposure, use of foreign
currency derivatives and corporate performance: a case of selected financial

55
institutions in South Africa, University of South Africa Business School.
South Africa.
Sun, T., Sundaresan, S. & Wang, C. (1993). An empirical investigation. Journal of
Financial Economics, 7, 34-132.
Wanjohi, J. G. (2013). The Effect Of Financial Risk Management On The Financial
Performance Of Commercial Banks In Kenya, Doctoral dissertation,
University of Nairobi.

56
Appendix I: Raw Data
Total Assets in Millions
Tier 1 >Ksh 150B 2013 2012 2011 2010 2009
Kenya Commercial Bank 323,312 305,161 282,494 251,356 195,012
Equity Bank 238,194 215,829 176,911 143,018 100,812
Co-operative Bank of Kenya 228,874 199,663 167,772 154,340 110,678
Standard Chartered Bank 220,524 195,493 164,182 142,746 123,779
CFC Stanbic Bank 170,726 133,378 140,087 107,139 97,337
Barclays Bank of Kenya 207,010 185,102 167,305 172,415 164,875
Tier II Ksh 50><Ksh 150B
NIC Bank 112,917 101,772 73,581 59,014 47,558
Commercial Bank of Africa 124,882 100,456 83,283 75,459 65,687
Diamond Trust 114,136 94,512 77,448 83,600 66,679
I&M Bank 110,316 91,520 76,903 62,552 44,009
Citibank 71,243 69,580 74,646 62,070 51,372
Chase Bank 76,569 49,105 36,513 21,859 12,970
Bank of Africa 52,683 48,958 38,734 26,699 16,920
Bank of Baroda 52,022 46,138 36,701 32,332 21,940
National Bank of Kenya 92,493 67,155 68,665 60,027 51,404
Tier III Ksh 15B><Ksh 50B
Prime Bank 49,461 43,463 35,185 32,444 23,700
Housing Finance 46,755 40,686 31,972 29,326 18,239
Imperial Bank 43,006 34,590 25,618 19,719 15,358
Ecobank 36,907 31,771 27,210 26,892 13,949
Family Bank 43,501 30,985 26,002 20,188 13,306
Bank of India 30,721 24,877 23,352 19,671 15,395
ABC Bank 19,640 19,071 12,507 10,349 8,972
Consolidated Bank 16,779 18,001 15,318 10,479 6,899
Equatorial Commercial Bank 15,562 14,109 12,927 10,399 4,461
Gulf African Bank 16,054 13,562 12,915 9,594 7,749
Development Bank of Kenya 15,581 13,417 11,523 10,645 8,109
GT Bank Kenya 25,638 17,150 14,630 20,944 18,331
Tier IV <Ksh 15B
Giro Commercial Bank 13,623 12,280 11,846 10,234 6,914
Fidelity Commercial Bank 12,779 11,772 10,789 8,209 5,499
Guardian Bank 12,835 11,745 8,836 8,031 6,778
Victoria Commercial Bank 13,644 10,323 7,645 6,215 5,130
First Community Bank 11,305 9,959 8,740 6,380 4,452
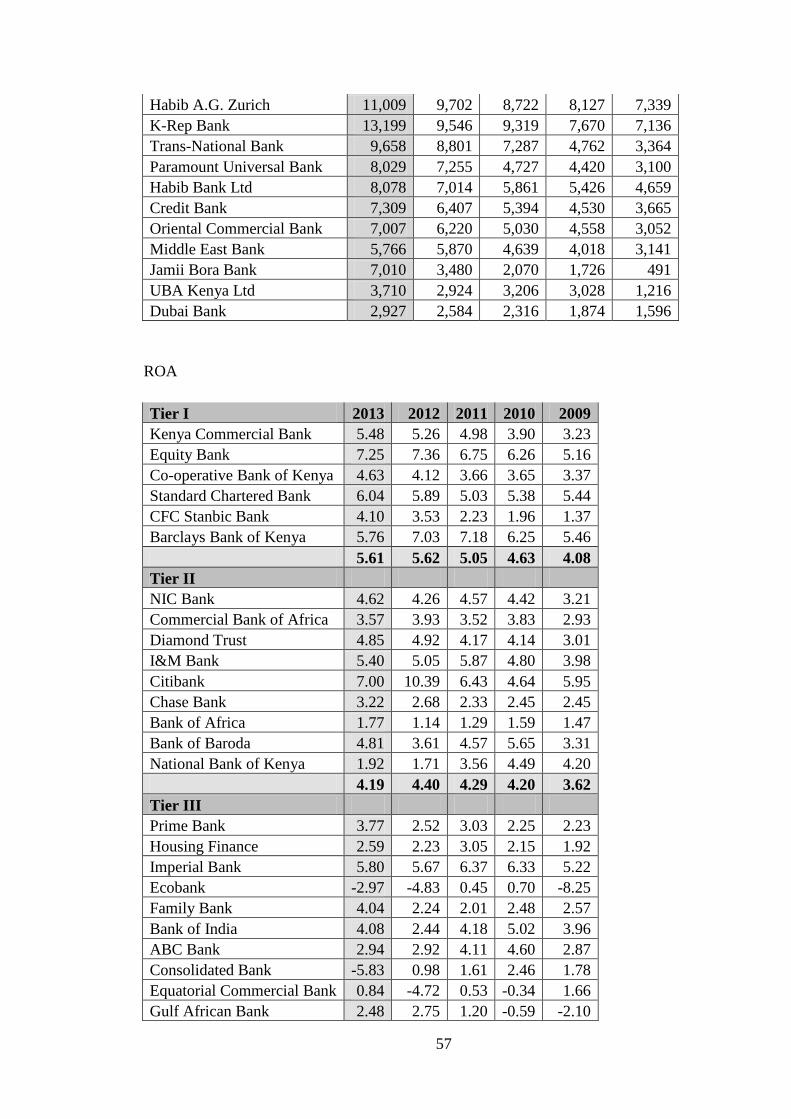
57
Habib A.G. Zurich 11,009 9,702 8,722 8,127 7,339
K-Rep Bank 13,199 9,546 9,319 7,670 7,136
Trans-National Bank 9,658 8,801 7,287 4,762 3,364
Paramount Universal Bank 8,029 7,255 4,727 4,420 3,100
Habib Bank Ltd 8,078 7,014 5,861 5,426 4,659
Credit Bank 7,309 6,407 5,394 4,530 3,665
Oriental Commercial Bank 7,007 6,220 5,030 4,558 3,052
Middle East Bank 5,766 5,870 4,639 4,018 3,141
Jamii Bora Bank 7,010 3,480 2,070 1,726 491
UBA Kenya Ltd 3,710 2,924 3,206 3,028 1,216
Dubai Bank 2,927 2,584 2,316 1,874 1,596
ROA
Tier I 2013 2012 2011 2010 2009
Kenya Commercial Bank 5.48 5.26 4.98 3.90 3.23
Equity Bank 7.25 7.36 6.75 6.26 5.16
Co-operative Bank of Kenya 4.63 4.12 3.66 3.65 3.37
Standard Chartered Bank 6.04 5.89 5.03 5.38 5.44
CFC Stanbic Bank 4.10 3.53 2.23 1.96 1.37
Barclays Bank of Kenya 5.76 7.03 7.18 6.25 5.46
5.61 5.62 5.05 4.63 4.08
Tier II
NIC Bank 4.62 4.26 4.57 4.42 3.21
Commercial Bank of Africa 3.57 3.93 3.52 3.83 2.93
Diamond Trust 4.85 4.92 4.17 4.14 3.01
I&M Bank 5.40 5.05 5.87 4.80 3.98
Citibank 7.00 10.39 6.43 4.64 5.95
Chase Bank 3.22 2.68 2.33 2.45 2.45
Bank of Africa 1.77 1.14 1.29 1.59 1.47
Bank of Baroda 4.81 3.61 4.57 5.65 3.31
National Bank of Kenya 1.92 1.71 3.56 4.49 4.20
4.19 4.40 4.29 4.20 3.62
Tier III
Prime Bank 3.77 2.52 3.03 2.25 2.23
Housing Finance 2.59 2.23 3.05 2.15 1.92
Imperial Bank 5.80 5.67 6.37 6.33 5.22
Ecobank -2.97 -4.83 0.45 0.70 -8.25
Family Bank 4.04 2.24 2.01 2.48 2.57
Bank of India 4.08 2.44 4.18 5.02 3.96
ABC Bank 2.94 2.92 4.11 4.60 2.87
Consolidated Bank -5.83 0.98 1.61 2.46 1.78
Equatorial Commercial Bank 0.84 -4.72 0.53 -0.34 1.66
Gulf African Bank 2.48 2.75 1.20 -0.59 -2.10

58
Development Bank of Kenya 1.81 0.66 1.28 2.14 1.15
GT Bank Kenya 1.61 2.03 2.12 1.74 0.87
2.31 1.53 2.70 2.50 1.31
Tier IV
Giro Commercial Bank 2.82 1.68 2.78 6.20 2.67
Fidelity Commercial Bank 2.47 0.84 2.79 6.26 0.93
Guardian Bank 2.99 1.90 1.92 1.39 1.69
Victoria Commercial Bank 4.24 4.68 4.31 5.03 4.22
First Community Bank 1.86 2.95 1.28 -2.50 -3.42
Habib A.G. Zurich 4.30 4.24 2.91 3.05 3.90
K-Rep Bank 4.22 3.21 2.75 1.44 -4.05
Trans-National Bank 2.34 3.66 4.02 3.24 3.18
Paramount Universal Bank 1.23 1.24 2.38 7.34 1.36
Habib Bank Ltd 6.19 6.50 4.62 4.34 4.22
Credit Bank -0.56 -0.34 -0.75 3.53 0.83
Oriental Commercial Bank 0.83 1.79 3.80 4.01 1.08
Middle East Bank 0.68 0.79 1.99 5.11 1.39
Jamii Bora Bank 1.28 1.51 -3.67 -4.84 -1.33
UBA Kenya Bank -7.49 -13.58 -6.42 -4.57 -17.47
Dubai Bank 0.53 -1.16 0.90 0.02 0.54
2.44 2.11 2.26 3.15 0.97
LEADS
loss in value depreciation of Ksh due to change in foreign
exchange in '0,000'
BANKING
SURVEY 2013 2013 2012 2011 2010 2009
Kenya Commercial
Bank 5,376 6,203 4,691 6,450 6,368
Equity Bank 3,521 631 1,294 2,988 3,064
Co-operative Bank
of Kenya 3,060 2,572 309 1,300 1,966
Standard Chartered
Bank 1,387 745 127 186 193
CFC Stanbic Bank 829 297 269 658 706
Barclays Bank of
Kenya 262 306 351 820 2,237
NIC Bank 1,142 468 70 62 386
Commercial Bank of
Africa 309 337 474 483 443
Diamond Trust 0 0 1 44 255
I&M Bank 345 145 209 435 597
Citibank 0 0 0 0 0
Chase Bank 540 168 107 153 166

59
Bank of Africa 1,089 554 318 299 -85
Bank of Baroda 109 153 55 117 563
National Bank of
Kenya 2,412 653 300 225 380
Prime Bank 48 115 225 163 146
Housing Finance 2,497 1,715 959 744 754
Imperial Bank 718 284 249 256 243
Ecobank 710 204 370 699 739
Family Bank 1,064 888 729 303
Bank of India 31 41 64 44 8
ABC Bank 346 205 74 39 99
Consolidated Bank 678 701 452 379 257
Equatorial
Commercial Bank 501 342 228 664 342
Gulf African Bank 498 211 419 110 14
Development Bank
of Kenya 530 636 789 468 495
GT Bank Kenya 49 89 163 360 256
Giro Commercial
Bank 286 67 31 65 54
Fidelity Commercial
Bank 506 569 235 351 116
Guardian Bank 113 72 46 490 490
Victoria Commercial
Bank 0 0 0 0 0
First Community
Bank 423 694 507 209 16
Habib A.G. Zurich -1 1 1 7 46
K-Rep Bank 226 368 373 476 678
Trans-National Bank 295 166 96 270 163
Paramount Universal
Bank 173 168 181 207 164
Habib Bank Ltd 242 260 4 4 7
Credit Bank 141 156 155 216 115
Oriental Commercial
Bank 36 56 25 31 76
Middle East Bank 525 1.80 15.70 1.75 4.16
Jamii Bora Bank 67 67 92 65 29
UBA Kenya Bank 0 0 0 0 0
Dubai Bank 794 280 125 191 117

60
PRICE ADJUSTMENT
change in price of commodities in Millions
BANKING SURVEY 2013
Tier I 2013 2012 2011 2010 2009
Kenya Commercial Bank 633 404 4,543 3,693 3,693
Equity Bank 1,358 3,464 3,280 2,651 1,462
Co-operative Bank of Kenya 158 159 150 152 132
Standard Chartered Bank 46 53 66 33 20
CFC Stanbic Bank 940 1,588 6,239 2,843 2,394
Barclays Bank of Kenya 43 115 92 90 107
Tier II
NIC Bank 1,133 1,302 1,560 1,372 1,102
Commercial Bank of Africa 5,291 4,482 2,453 1,787 1,788
Diamond Trust 2,323 1,907 1,532 1,153 792
I&M Bank 2,145 3,095 3,234 910 325
Citibank 0 0 0 0 0
Chase Bank 978 969 828 533 391
Bank of Africa 6 1,202 607 882 232
Bank of Baroda 18 32 7 18 6
National Bank of Kenya 88 6 11 10 4
Tier III
Prime Bank 1,168 863 1,009 574 760
Housing Finance 0 0 0 0 0
Imperial Bank 1,428 1,340 960 875 524
Ecobank 458 340 2 3 5
Family Bank 382 240 99 193 290
Bank of India 0 0 0 0
ABC Bank 226 40 191 86 93
Consolidated Bank 0 30 42 35 33
Equatorial Commercial Bank 167 62 42 75 56
Gulf African Bank 0 271 248 1,153 193
Development Bank of Kenya 518 342 229 243 279
GT Bank Kenya 147 23 80 97 80
Tier IV
Giro Commercial Bank 212 242 184 147 48
Fidelity Commercial Bank 154 164 68 73 88
Guardian Bank 305 180 150 96 96
Victoria Commercial Bank 108 13 13 16 56

61
First Community Bank 230 261 295 367 264
Habib A.G. Zurich 0 0 0 0 58
K-Rep Bank 49 75 39 57 40
Trans-National Bank 895 611 500 583 537
Paramount Universal Bank 325 262 147 156 164
Habib Bank Ltd 0 0 0 0 20
Credit Bank 212 241 146 127 56
Oriental Commercial Bank 259 175 121 233 21
Middle East Bank 197 192.00 167.00 128.95 118.79
Jamii Bora Bank 81 81 5 0 1
UBA Kenya Bank 47 0 0 0 0
Dubai Bank 242 466 92 128 105
Forward Contracts in 000
bank 2013 2012 2011 2010 2009
ABC Bank 238,714
113,243
90,487
99,497
95,762
Bank of Africa 538,117
324,929
438,750
324,978
229,176
Bank of Baroda 333,753
340,616
270,788
360,629
309,587
Bank of India 120,287
221,785
134,741
124,421
96,650
BARCLAYS BANK
4,376,308
4,443,530
2,335,124
1,313,287
1,356,770
CBA 878,432
671,134
416,219
648,789
338,109
CFC STANBIC 1,306,862
1,170,117
957,488
768,354
213,554
Chase Bank 561,349
122,371
241,800
130,767
49,546
Citibank N.A 2,211,723
2,921,897
1,477,433
1,054,212
1,019,744
City Finance Bank
10,130
73,800
93,894
16,400
57,740
Consolidated Bank
455,000
564,101
307,934
207,815
108,565
CO-OP BANK 1,085,308
2,124,266
2,262,491
1,122,455
700,512
Credit Bank 148,260
9,343
11,865
12,807
13,887
Devt Bank 215,785
222,408
122,172
101,154
134,688
Diamond Trust Bank
1,207,378
945,794
621,355
838,228
389,705
Dubai bank 19,162
18,523
36,066
44,535
4,471
ECOBANK
102,759
205,188
323,259
417,545
384,861
Equitorial bank

62
32,467 56,478 99,597 82,030 83,826
EQUITY BANK 3,406,601
2,844,213
2,193,951
2,090,349
1,106,772
Family Bank 108,980
113,379
45,822
62,994
41,814
Fidelity Bank 92,887
76,559
94,681
52,076
55,136
Fina Bank 319,432
212,791
157,449
44,795
48,544
First Community 91,079 33,333
118,765 202,799
22,593
Giro Bank 290,309
296,883
102,591
20,723
2,991
Guardian Bank 81,777
49,976
61,937
44,484
77,115
GulfAfican Bank 5,163
5,897
1,440
10,101
Habib bank 83,124
96,638
95,127
82,063
82,546
HABIB AG ZURICH
47,738
79,525
92,613
82,685
96,836
I & M Bank 737,517
568,022
645,383
159,755
346,013
Imperial Bank Ltd 410,700
348,968
300,178
202,658
117,668
KCB Bank 3,336,068
3,251,667
1,955,722
1,091,736
1,722,652
K-Rep 6,071
9,333
1,566
629
36
MIDDLE EAST 142,163
135,537
11,925
102,868
64,014
National Bank 678,879 800,018 709,358
616,536
710,201
NIC Bank 1,055,530
662,219
1,288,743
723,698
574,112
Oriental Bank 34,058
16,253
22,771
5,415
1,789
Paramount Univ Bank
49,518
55,259
6,079
11,677
2,196
Prime Bank 352,817
415,879
213,391
410,513
308,518
Southern Credit 5,646
6,783
5,423
3,045
9,598
Stan-Chart 3,305,842
2,378,383
1,183,173
1,750,400
653,370
Trans National 184,383
211,907
108,015
205,200
306,125
Victoria Bank 144,957
5,332
5,648
2,483
2,845

63
Cross Currency Swap in 000
Bank 2013 2012 2011 2010 2009
ABC Bank 311,619
414,990
211,982
112,662
155,833
Bank of Africa
3,150,823
1,233,239
1,547,501
1,451,970
1,036,901
Bank of Baroda 2,311,838 2,213,358 1,907,810
1,113,714
811,935
Bank of India 305,056
238,012
614,434
589,432
886,665
BARCLAYS BANK
30,501,743
20,591,373
25,446,832
20,417,715
11,489,026
CBA 8,904,576
9,028,179
4,321,329
2,311,719
2,384,145
CFC STANBIC 12,142,483
13,393,489
10,476,651
6,391,138
2,251,405
Chase Bank 2,222,179
1,982,854
377,344
223,565
542,536
Citibank N.A 7,815,631
4,295,863
12,309,910
5,020,561
4,392,993
City Finance Bank
174
984
5,192
218
10,320
Consolidated Bank
341,140
752,223
410,587
642,098
775,434
CO-OP BANK 13,113,744
14,165,688
10,181,988
8,103,274
7,194,015
Credit Bank 601,976
124,575
333,000
197,615
549,516
Devt Bank 200,476
121,077
289,644
153,844
225,134
Diamond Trust Bank
4,276,503
6,561,059
5,253,807
4,213,637
3,192,940
Dubai bank 154,943
113,648
108,797
204,667
209,578
ECOBANK 367,927
466,917
143,465
150,606
648,276
Equitorial bank 328,912
863,743
127,966
370,700
510,156
EQUITY BANK 9,542,135
8,558,950
10,218,602
9,573,799
11,143,596
Family Bank 130,678
183,845
909,621
499,289
241,943
Fidelity Bank 384,954
874,689
610,834
276,823
684,898
Fina Bank 2,125,909
1,317,054
1,437,932
1,129,727
123,139
First Community -
1,438
925
Giro Bank 441,256
917,767
345,445
363,009
398,845
Guardian Bank 929,037
213,301
613,583
789,978
495,486
GulfAfican Bank 546,086 555,076
436,654
114,684
15,196
Habib bank 416,576
885,034
683,621
275,198
339,456
HABIB AG ZURICH
631,789
100,335
348,432
291,345
144,712

64
I & M Bank 8,050,022
6,590,696
4,565,717
3,469,673
3,262,018
Imperial Bank Ltd 2,114,267
1,465,290
2,113,570
1,093,543
107,355
KCB Bank 22,248,357
14,335,556
11,774,296
5,542,314
5,500,203
K-Rep 8,095
7,777
2,089
839
48
MIDDLE EAST 288,445
738,278
256,743
382,456
535,132
National Bank 2,205,003
2,054,155
1,275,397
1,090,505
906,782
NIC Bank 9,074,040
6,282,692
4,148,324
5,101,598
4,483,483
Oriental Bank 541,123
216,716
220,034
188,745
238,521
Paramount Univ Bank
655,756
701,213
810,656
223,500
292,832
Prime Bank 704,233
211,721
338,559
290,174
313,578
Stan-Chart 20,409,789
15,504,511
12,708,982
12,633,866
11,637,826
Trans National 584,490
158,766
520,154
693,321
216,622
Victoria Bank 906,609
107,109
412,197
446,645
510,793
Options in 000
Bank 2013 2012 2011 2010 2009
ABC Bank 20,334 26,833 23,469 22,159 27,545
Bank of Africa 88,939 58,168 43,750 29,948 68,077
Bank of Baroda 20,717 23,376 14,168 15,250 14,136
Bank of India 5,337 4,164 10,751 10,315 15,516
BARCLAYS BANK 878,051 1,034,902 781,956 731,002 855,796
CBA 483,008 399,314 384,511 255,084 212,225
CFC STANBIC 249,345 163,605 334,139 159,492 294,959
Chase Bank 3,148 52,198 48,634 39,123 36,940
Citibank N.A 27,554 517,760 517,343 359,827 512,737
City Finance Bank 304 1,721 9,086 382 18,059
Consolidated Bank 1,996 13,163 7,184 4,235 10,319
CO-OP BANK 399,053 289,955 144,480 155,729 164,527
Credit Bank 345,941 21,799 3,046 4,988 11,404
Devt Bank 36,832 5,618 5,068 2,692 3,939
Diamond Trust Bank 483,881 106,853 211,162 197,865 182,645
Dubai bank 2,710 19,886 11,154 10,581 11,666
ECOBANK 6,438 12,105 25,605 17,605 11,343
Equitorial bank 5,756 15,115 22,393 6,737 8,927
EQUITY BANK 948,735 103,163 452,553 154,148 251,468
Family Bank 2,286 3,217 8,918 5,986 4,233
Fidelity Bank 6,735 15,305 10,689 4,844 11,984

65
Fina Bank 35,341 29,845 47,382 34,522 19,936
First Community 1,931 2,517 4,946 6,532 8,118
Giro Bank 7,722 16,059 6,045 6,353 6,979
Guardian Bank 50,814 23,276 18,520 17,462 26,601
GulfAfican Bank 9,713 29,092 14,140 43,569
Habib bank 7,289 16,488 11,964 4,814 5,940
HABIB AG ZURICH 13,055 17,557 6,097 8,598 11,283
I & M Bank 87,539 158,718 72,560 79,428 91,031
Imperial Bank Ltd 24,967 114,258 23,748 6,201 41,225
KCB Bank 584,624 587,223 949,018 774,050 702,856
K-Rep 14,166 17,110 3,655 1,468 85
MIDDLE EAST 5,047 12,919 4,492 6,692 9,365
National Bank 8,756 94,772 136,993 146,195 138,134
NIC Bank 129,571 141,712 207,067 175,296 128,595
Oriental Bank 9,469 37,925 2,001 3,302 4,174
Paramount Univ Bank 12,475 12,272 14,185 3,912 5,125
Prime Bank 123,240 37,050 24,246 22,530 19,874
Southern Credit 13,173 16,595 12,653 7,105 22,162
Stan-Chart 713,631 882,895 740,718 884,266 892,196
Trans National 10,227 27,784 16,034 24,133 34,291
Victoria Bank 36,156 12,441 9,084 9,912 6,637
Appendix II: Table 4.2 - Correlation Matrix
Options
Forward
Contract
s
Cross
Currenc
y Swaps
Leading
and
Lagging
Price
Adjustment
s
Netting
ABC Bank -0.578 .864* -0.316 0.216 0.082 0.080
0.307 0.059 0.605 0.212 0.101 0.293
Bank of Africa -0.696 0.339 -0.104 0.165* 0.141 0.111
0.192 0.577 0.867 0.091 0.120 0.115
Bank of Baroda -0.669 -.924** -0.642 0.137 0.153* 0.090*
0.217 0.025 0.243 0.137 0.090 0.069
Bank of India -0.044 -0.642 .935** 0.155 0.115* 0.111
0.943 0.243 0.02 0.476 0.083 0.139
Barclays Bank -0.366 -0.486 -0.666 0.353 0.526 0.312
0.545 0.406 0.22 0.101 0.102 0.514
CBA 0.57 -0.006 -0.799 0.420* 0.525 0.247
0.316 0.992 0.105 0.075 0.136 0.147
CFC STANBIC -0.012 -0.094 -0.202 0.081 0.024 0.025
0.985 0.881 0.745 0.383 0.454 0.232
Chase Bank -0.791 0.444 -0.202 0.184* 0.133* 0.112
0.111 0.454 0.745 0.059 0.067 0.146
Citibank N.A -0.052 0.265 -0.5 0.094* 0.118* 0.173
0.934 0.666 0.391 0.077 0.092 0.157

66
City Finance Bank -0.702 0.383 -0.603 0.168** 0.127** 0.109**
0.186 0.525 0.282 0.038 0.039 0.015
Consolidated Bank .887** 0.272 -0.005 0.217 0.147 0.135
0.045 0.658 0.994 0.160 0.102 0.127
CO-OP BANK .911** -0.003 0.341 0.304 0.069 0.244*
0.032 0.996 0.574 0.440 0.228 0.098
Credit Bank 0.374 -0.568 -0.745 0.120 0.109*** 0.127**
*
0.535 0.318 0.149 0.671 0.005 0.007
Development Bank -.908** -0.091 -.897** 0.171* 0.218 0.242
0.033 0.884 0.039 0.068 0.137 0.182
Diamond Trust
Bank
-0.003 0.651 -0.167 0.164 0.093 0.130
0.996 0.234 0.788 0.159 0.117 0.110
Dubai bank .986*** -.966*** -0.277 0.103**
*
0.104*** 0.069**
*
0.002 0.008 0.652 0.003 0.007 0.001
Ecobank -0.05 -.829* 0.29 0.458* 0.353 0.028*
0.937 0.083 0.635 0.086 0.113 0.100
Equity Bank 0.499 -0.331 -0.691 0.205 0.124** 0.276*
0.392 0.587 0.196 0.121 0.030 0.054
Equitorial bank 0.4 -0.363 -0.54 0.185 0.200 0.013
0.504 0.549 0.347 0.206 0.218 0.118
Family Bank 0.496 -0.552 0.654 0.008 0.013 0.320
0.395 0.335 0.231 0.198 0.147 0.084
Fidelity Bank -0.086 0.562 0.075 0.277 0.381*** 0.168**
0.89 0.324 0.904 0.296 0.009 0.011
Fina Bank -0.367 0.439 0.555 0.315 0.700 0.329
0.544 0.459 0.331 0.908 0.908 0.661
First Community -0.636 0.418 -.901*** 0.327 0.318 0.703
0.249 0.484 0 0.356 0.247 0.551
Giro Bank -.930** .878** -0.736 0.650 0.923 0.944
0.022 0.05 0.156 0.479 0.411 0.441
Guardian Bank 0.545 -0.534 -0.415 0.337 0.268 0.077
0.342 0.354 0.487 0.781 0.404 0.202
GulfAfican Bank 0.115 -0.883 -0.682 0.471** 0.383* 0.506
0.885 0.117 0.205 0.045 0.063 0.292
Habib bank -0.041 0.641 -0.269 0.899 0.685 0.872
0.948 0.244 0.662 0.106 0.629 1.161
Habib AG Zurich -0.174 0.498 -0.501 0.300 0.102 0.411
0.779 0.393 0.39 0.669** 0.705 0.331
I & M Bank -0.162 0.512 0.27 0.014 0.463 0.259
0.794 0.378 0.66 0.886 0.532 0.510
KCB Bank -.854* -0.104 0.505 0.855 0.200 0.741
0.066 0.868 0.385 0.897 0.173 0.686
K-Rep -.854** -0.104 0.505 0.394 0.201 0.320

67
0.066 0.868 0.385 0.819 0.490 0.775
MIDDLE EAST 0.722 0.312 -0.76 0.687**
*
0.460*** 0.415**
*
0.168 0.609 0.136 0.004 0.006 0.002
National Bank 0.722 0.312 -0.76 0.930 1.925 0.594
0.168 0.609 0.136 0.281 0.289 0.180
NIC Bank -.906** -0.646 0.651 0.761 0.174 0.888
0.034 0.238 0.234 0.921 0.404 0.526
Oriental Bank 0.431 0.539 -0.298 0.449 0.533 0.668
0.469 0.349 0.627 0.411 0.111 0.187
Paramount Bank -0.051 -0.546 0.294 0.150 0.581 0.413
0.935 0.341 0.631 0.222 0.955 0.899
Prime Bank 0.483 -0.344 -0.758 0.878* 0.285 0.809
0.41 0.571 0.137 0.085 0.177 0.788
United Bank of
Africa
0.435 0.416 0.116 0.868 0.597 0.706
0.565 0.584 0.265 0.612 0.965 0.701
Stan-Chart -.806* -0.71 -.895** 0.873 0.486 1.106
0.1 0.179 0.04 0.539 0.568 0.745
Trans National 0.243 -0.437 -.833* .202 0.488 0.415**
*
0.694 0.462 0.08 0.211 0.710 0.002
Victoria Bank 0.767 -0.341 -0.076 0.118**
*
0.941 0.741*
0.13 0.574 0.903 0.001 0.108 0.077
*. Correlation is significant at the 0.1 level (2-tailed).
**. Correlation is significant at the 0.05 level (2-tailed).
***. Correlation is significant at the 0.01 level (2-tailed).