Embed Size (px)
Citation preview

The Effect of First Language Perception
on the Discrimination of a Non-native Vowel Contrast: Investigating Individual Differences
Vita Kogan
ADVERTIMENT. La consulta d’aquesta tesi queda condicionada a l’acceptació de les següents condicions d'ús: La difusió d’aquesta tesi per mitjà del servei TDX (www.tdx.cat) i a través del Dipòsit Digital de la UB (diposit.ub.edu) ha estat autoritzada pels titulars dels drets de propietat intelꞏlectual únicament per a usos privats emmarcats en activitats d’investigació i docència. No s’autoritza la seva reproducció amb finalitats de lucre ni la seva difusió i posada a disposició des d’un lloc aliè al servei TDX ni al Dipòsit Digital de la UB. No s’autoritza la presentació del seu contingut en una finestra o marc aliè a TDX o al Dipòsit Digital de la UB (framing). Aquesta reserva de drets afecta tant al resum de presentació de la tesi com als seus continguts. En la utilització o cita de parts de la tesi és obligat indicar el nom de la persona autora. ADVERTENCIA. La consulta de esta tesis queda condicionada a la aceptación de las siguientes condiciones de uso: La difusión de esta tesis por medio del servicio TDR (www.tdx.cat) y a través del Repositorio Digital de la UB (diposit.ub.edu) ha sido autorizada por los titulares de los derechos de propiedad intelectual únicamente para usos privados enmarcados en actividades de investigación y docencia. No se autoriza su reproducción con finalidades de lucro ni su difusión y puesta a disposición desde un sitio ajeno al servicio TDR o al Repositorio Digital de la UB. No se autoriza la presentación de su contenido en una ventana o marco ajeno a TDR o al Repositorio Digital de la UB (framing). Esta reserva de derechos afecta tanto al resumen de presentación de la tesis como a sus contenidos. En la utilización o cita de partes de la tesis es obligado indicar el nombre de la persona autora. WARNING. On having consulted this thesis you’re accepting the following use conditions: Spreading this thesis by the TDX (www.tdx.cat) service and by the UB Digital Repository (diposit.ub.edu) has been authorized by the titular of the intellectual property rights only for private uses placed in investigation and teaching activities. Reproduction with lucrative aims is not authorized nor its spreading and availability from a site foreign to the TDX service or to the UB Digital Repository. Introducing its content in a window or frame foreign to the TDX service or to the UB Digital Repository is not authorized (framing). Those rights affect to the presentation summary of the thesis as well as to its contents. In the using or citation of parts of the thesis it’s obliged to indicate the name of the author.

The Effect of First Language Perception on the
Discrimination of a Non-native Vowel Contrast:
Investigating Individual Differences
Vita Kogan

Doctoral Dissertation
Doctoral Program in Cognitive Science and Language
The Effect of First Language Perception on the Discrimination of
a Non-native Vowel Contrast:
Investigating Individual Differences
by
Vita Kogan
Supervised by Dr. Joan C. Mora
2020


I, Vita V. Kogan, confirm that the work presented in the dissertation is my own.
Where information has been derived from other sources, I confirm that this has
been indicated in the dissertation.
Vita V. Kogan
Barcelona, January 2020

Dedication
This dissertation is dedicated to my husband, Ratko Jagodić. His guidance,
encouragement, and endless love have made this dissertation come true.

Acknowledgments This dissertation would not have seen the light of day without the help of many people. My deepest
gratitude goes to my supervisor, Dr. Joan C. Mora. His supervision, input, and support throughout
the course of my Ph.D. saved me from many intellectual dead ends while allowing me to be myself
and explore freely. Watching Joan Carles at work gave me more inspiration and insights into the
nature of research than any theoretical course or book would do.
I would also like to thank the members of my follow-up committee for their kind and
insightful comments, which helped considerably to improve this dissertation. Dr. Susanne
Reiteter's intellectual boldness pushed me to think outside the box and not to be afraid of asking
uncomfortable questions. I am also very grateful to Dr. Dan Dediu for inspiring me with his
research, answering a multitude of my questions, and guiding me through the layers of the
academic world. I have a collection of quotes from Dan that helped me to carry on with my Ph.D.
journey emotionally and intellectually.
I would like to express my sincere appreciation to the L2 Speech Research Group for their
care, important suggestions and assistance with my project from the moment it was born to the
final touches and arrangements. Thank you for the opportunity to meet many outstanding
researchers in the field and absorb their wisdom during thought-stimulating seminars and get-
together events.
I would like to thank my colleagues and friends I was lucky to meet during my studies at
the University of Barcelona: Sapna Sehgal, Marina Ruiz Tada, and Robert de Menezes. Special
thanks to Sapna: We cried together over cruel turns of statistical analysis and cursed the destiny
for insignificant p-s.

My deepest thanks go to my parents for doing their best to understand my research and
being supportive of it (although secretly wishing I was a lawyer).
Lastly, I wish to thank my husband Ratko Jagodić, who helped me discover endless sources
of strength and purpose within me and showed me so much beauty in the world. He celebrated my
every step, was never tired of listening about the vowels and mixed-effects models and supported
me tremendously throughout this exciting adventure.

i
Abstract
Adult language learners often experience difficulty acquiring a new sound system. Empirical
studies have shown that native phonetic categories function as a filter that removes specific
acoustic cues for non-native sounds and causes “a perceptual accent”. Not being able to perceive
contrastive segment categories that do not exist in learner’s native language result in production
problems and accented speech. Yet, some individuals are remarkably successful at the task of non-
native perception. Such instances demonstrate that perceptual ability is a subject of high
variability. Whereas native language (L1) background has been the focus of much second language
acquisition research to explain such variability, little attention has been paid to the role of
individual differences within the same L1 perception. This dissertation seeks to fill this gap and
investigate how individual differences in native perception affect the degree of perceived
dissimilarity between two members of a novel contrast that does not exist in learners’ L1. We
argue that not only individuals with various L1s are equipped differently for the task of non-native
perception, but also individuals with the same L1 vary in how their native phonological categories
are represented in the perceptual space. Such variability is observable in measures of compactness
of L1 phonetic categories, and its effects on non-native perception can be assessed by relating the
degree of compactness to the perceived dissimilarity between novel contrasting sounds. We
hypothesized that compact L1 categories give an initial advantage in distinguishing non-native
contrasts.
Sixty-eight Spanish monolinguals participated in the present study. The degree of
compactness of their native category /i/ was measured through a goodness-of-fit rating task, where

ii
participants listened to synthesized variants of the Spanish /i/ vowel (differing in F1, F2 or both)
and rated them as either good or bad exemplars of their internal representation of the category /i/
on an intuitive scale. These ratings provided an individual /i/ compactness index for each
participant that was related to the individual perceived dissimilarity score for the novel Russian
contrast /i - ɨ/. The results obtained confirmed the hypothesis. Even though L1-based individual
differences in perception were small, compactness of the L1 category /i/ contributed significantly
to the participants’ ability to perceive the acoustic distance between the Russian /i/ and /ɨ/. These
findings suggest that having more compact vowel categories might facilitate the process of
category formation for unfamiliar sounds.
Keywords: individual differences, phonetic ability, speech perception, phonetic category
compactness.

iii
Resumen
Los estudiantes adultos de idiomas a menudo experimentan dificultades para adquirir un nuevo
sistema fonológico. Los estudios empíricos han demostrado que las categorías fonéticas nativas
funcionan como un filtro que elimina las señales acústicas específicas de los sonidos no nativos y
causan "un acento perceptivo". La impossibilidad de percibir categorías segmentales contrastivas
que no existen en el idioma nativo del aprendiz correctamente ocasiona problemas en la producción
de los fonemas conducentes a la presencia de acento extranjero en el habla. Sin embargo, algunos
individuos son capaces de percibir fonemas no-nativos con notable éxito. Tales casos demuestran
la gran variabilidad entre sujetos en cuanto a su capacidad perceptiva para los sonidos del lenguaje.
Dicha variabilidad se ha investigado extensamente a través de numerosos estudios que han
investigado el factor de la lengua nativa (L1) como principal causa de los problemas de percepción
y producción en una segunda lengua. No obstante, se ha prestado poca atención al papel potencial
de las diferencias individuales en la percepción de la L1. Esta tesis pretende abordar esta cuestión
empírica investigando hasta qué punto las diferencias individuales entre sujetos en la percepción
de su lengua nativa afectan el grado de disimilitud perceptiva entre los miembros de un nuevo
contraste fonológico inexistente en la L1 de los aprendices. Nuestra hipótesis plantea la idea de
que no sólo los individuos de primeras lenguas diferentes están preparados de diferente forma para
la percepción de los sonidos de una segunda lengua, sino que también los individuos que
comparten una misma L1 presentan variabilidad en cómo representan sus categorías fonológicas
en su espacio perceptivo, y ello puede también tener consecuencias para la percepción de los
sonidos de una lengua no nativa. Partimos de la base de que la variabilidad inter-sujetos en la
percepción de las categorias fonológicas nativas es observable a partir de medidas del grado de

iv
compactación de las categorías fonéticas en la L1. Los efectos del grado de compactación sobre la
percepción no nativa pueden evaluarse relacionando el grado de compactación de una categoría
fonológica nativa con el grado de disimilitud perceptiva observada en la percepción de contrastes
fonológicos al inicio del proceso de adquisción de una nueva lengua. Nuestra hipótesis es que
aquellos individuos que presentan un mayor grado de compactación de las categorías fonológicas
de la L1 obtienen una ventaja inicial en la distinción de contrastes fonológicos no nativos.
Sesenta y ocho monolingües de español participaron en el presente estudio. El grado de
compactación de su categoría nativa /i/ se midió a través de una tarea perceptiva donde los
participantes escucharon variantes sintetizadas de la vocal española /i/ que presentaban diferèncias
equidistantes en F1, F2 o ambos a la vez, y que calificaron en una escala intuitiva como buenos o
malos ejemplares de su representación interna de la categoría vocálica /i/. Esta tarea nos
proporcionó un índice individual del grado de compactación de la vocal /i/ para cada participante
que relacionamos con la medida de disimilitud perceptiva individual que cada participante obtuvo
para el contraste del ruso /i - ɨ/. Los resultados obtenidos confirmaron la hipótesis. Aunque las
diferencias individuales en la percepción de la vocal /i/ del español observadas fueron de pequeña
magnitud, el grado de compactación de /i/ contribuyó significativamente a la capacidad de los
participantes de percibir la distancia acústica entre los fonemas vocálicos del ruso /i/ y /ɨ/. Estos
resultados sugieren que tener categorías de vocales más compactas podría facilitar el proceso de
formación de categorías fonológicas en la adquisición inicial de una nueva lengua.
Palabras clave: diferencias individuales, adquisición de fonología, percepción del habla, grado de
compactación, categorísa fonéticas.

v
Table of Contents
ABSTRACT ...............................................................................................................................I
RESUMEN ..............................................................................................................................III
TABLE OF CONTENTS ........................................................................................................ V
LIST OF FIGURES ............................................................................................................. VIII
LIST OF TABLES .................................................................................................................. XI
CHAPTER 1 – INTRODUCTION ........................................................................................... 1
1.1 MOTIVATION FOR THE DISSERTATION ................................................................................. 1
1.2 OUTLINE OF THE DISSERTATION .......................................................................................... 3
1.3 PHONETIC TALENT IN L2 .................................................................................................... 3
1.3.1 Cognitive abilities and phonetic talent ........................................................................ 4
1.3.2 Affective factors and phonetic talent ......................................................................... 10
1.3.3 L1 influence and phonetic talent ............................................................................... 13
CHAPTER 2 – SPEECH PERCEPTION .............................................................................. 15
2.1 INTRODUCTION ................................................................................................................ 15
2.2 NATIVE SPEECH PERCEPTION ............................................................................................ 15
2.3 L2 SPEECH PERCEPTION .................................................................................................... 18
2.3.1 L2 speech perception models .................................................................................... 19
2.3.2 Individual differences and specific languages ........................................................... 25
2.4 RUSSIAN CONTRAST /I - Ɨ/ AND SPANISH /I/ ........................................................................ 28
2.5 SUMMARY ....................................................................................................................... 33
CHAPTER 3 – INDIVIDUAL DIFFERENCES IN L1 SPEECH PERCEPTION .............. 34
3.1 INTRODUCTION ................................................................................................................ 34
3.2 INDIVIDUAL DIFFERENCES IN NATIVE PERCEPTION ............................................................. 35
3.3 INTERNAL FACTORS THAT RESULT IN L1 VARIABILITY ....................................................... 37
3.3.1 The anatomy of speech sounds .................................................................................. 38
3.3.2 Individual differences in cognition............................................................................ 40
3.4 EXTERNAL FACTORS THAT RESULT IN L1 VARIABILITY ...................................................... 42
3.4.1 Regional dialects ...................................................................................................... 44
3.4.2 Social network size ................................................................................................... 45

vi
3.5 THE NOTION OF COMPACTNESS AND ITS EFFECTS ON L2 ..................................................... 48
3.6 SUMMARY ....................................................................................................................... 52
3.7 AIMS, RESEARCH QUESTIONS AND HYPOTHESES ................................................................ 53
CHAPTER 4 – METHODOLOGY........................................................................................ 55
4.1 COLLECTING DATA WITH PSYTOOLKIT AND TURKPRIME ................................................... 56
4.1.1 PsyToolkit ................................................................................................................ 56
4.1.2 TurkPrime ................................................................................................................ 57
4.2 PARTICIPANTS.................................................................................................................. 59
4.2.1 Spanish participants ................................................................................................. 59
4.2.2 Russian participants ................................................................................................. 60
4.3 INSTRUMENTS .................................................................................................................. 60
4.3.1 Questionnaire with the Big Five Inventory ................................................................ 60
4.3.2 Serial nonword recognition task ............................................................................... 61
4.3.3 Target sound recognition task .................................................................................. 63
4.3.4 Rated dissimilarity task ............................................................................................ 64
4.3.5 Goodness rating task ................................................................................................ 66
4.4 GENERAL PROCEDURE ...................................................................................................... 72
CHAPTER 5 – RESULTS ...................................................................................................... 74
5.1 OVERVIEW OF THE DATA .................................................................................................. 75
5.2 PERCEIVED DISSIMILARITY BETWEEN RUSSIAN /I/ AND /Ɨ/ AND RATED DISSIMILARITY TASK 78
5.3 BIOGRAPHICAL FACTORS AND THEIR CONTRIBUTION TO PERCEPTION OF A NON-NATIVE CONTRAST ............................................................................................................................. 80
5.4 PHONOLOGICAL AND ACOUSTIC MEMORY CAPACITIES ....................................................... 82
5.5 THE MEASURE OF CATEGORY COMPACTNESS ..................................................................... 84
5.6 THE RELATIONSHIPS BETWEEN PERCEIVED DISSIMILARITY IN L0 AND COMPACTNESS OF A NATIVE CATEGORY ................................................................................................................ 90
CHAPTER 6 – DISCUSSION .............................................................................................. 100
6.1 INDIVIDUAL DIFFERENCES IN NON-NATIVE PERCEPTION ................................................... 100
6.2 COGNITIVE AND PERSONALITY FACTORS ......................................................................... 105
6.3 INDIVIDUAL DIFFERENCES IN CATEGORY COMPACTNESS AND THEIR CONNECTION TO L0 PERCEPTION......................................................................................................................... 109
6.4 IMPLICATIONS AND FUTURE DIRECTIONS ......................................................................... 113
6.5 LIMITATIONS OF THE PRESENT STUDY ............................................................................. 115

vii
CHAPTER 7 – CONCLUSION ........................................................................................... 118
7.1 CONTRIBUTION OF THE DISSERTATION ............................................................................ 119
7.2 CONCLUDING REMARKS ................................................................................................. 120
REFERENCES ..................................................................................................................... 121
APPENDICES ...................................................................................................................... 151
APPENDIX A. INFORMATION ABOUT THE RUSSIAN PARTICIPANTS .......................................... 151
APPENDIX B. THE ONLINE CONSENT FORM ON PSYTOOLKIT.ORG ........................................... 152
APPENDIX C. QUESTIONNAIRE WITH THE BIG FIVE INVENTORY (BFI) ................................... 153
APPENDIX D. NONWORDS IN THE SERIAL NONWORD RECOGNITION TASK ............................... 155
APPENDIX E. NONWORDS IN THE TARGET SOUND RECOGNITION TASK ................................... 156
APPENDIX F. ACOUSTIC VALUES OF THE VARIANTS OF /I/ ...................................................... 158
APPENDIX G. MIXED-EFFECTS MODELS’ PARAMETERS .......................................................... 161

viii
List of Figures
Figure 1. An information processing model of speech perception and production. The boxes in
grey represent the standard model of phonological theory (Ramus et al., 2010, p. 313). ............ 16
Figure 2. The universal language timeline of speech-perception and speech-production
development (Kuhl, 2004, p. 832). ............................................................................................ 17
Figure 3. Spanish listeners A and B’s perception of a novel Russian vowel /ɨ/ and English /æ/.. 27
Figure 4. The vowel inventory of Spanish (in black: Martínez-Celdrán, Fernández-Planas, &
Carrera-Sabaté, 2003) and Russian (in red: Jones, 1953; Yanushevskaya, & Bunčić, 2015). ..... 29
Figure 5. Group (on the left) and individual (on the right) mean formant values for Spanish /e/ in
red and French /e, ɛ/ in blue in production (Kartushina & Frauenfelder, 2013, p. 2120). ........... 50
Figure 6. Vocalic spaces for Spanish, French and English languages (Meunier et al., 2003, p. 724-
725). ......................................................................................................................................... 51
Figure 7. The compactness of L1 vowel categories (in blue) affects the perception of a novel
contrast (in pink). The individual on the left is more likely to discriminate between Russian /i/
and /ɨ/ than an individual on the right. ....................................................................................... 54
Figure 8. Overview of the study design. .................................................................................... 56
Figure 9. Example of the experiment’s script written in PsyToolkit. ......................................... 57
Figure 10. Sample trials of “yes” (same) and “no” (different) two-item sequences in the target
sound recognition task. ............................................................................................................. 64
Figure 11. An intuitive rating scale (reproduced from Jilka, 2009). ........................................... 66
Figure 12. The 28 synthesized vowels that are distributed overall a mel-scaled F1*F2
psychoacoustic space with a prototype /i/ in the center. ............................................................. 68
ix
Figure 13. First step in calculating compactness: Participant A has a less compact category (15
variants) than Participant B (6 variants). ................................................................................... 70
Figure 14. Each variant has a different value from 10 to 50 based on its distance from the
prototypical Spanish /i/. ............................................................................................................ 71
Figure 15. The shape of the native category /i/ did not vary much from individual to individual
(subject 4 and 11 here) and resembled a sphere. ........................................................................ 72
Figure 16. Histograms and quantile-quantile plots of phonological memory, acoustic memory,
perceived dissimilarity and category compactness respectively. ................................................ 77
Figure 17. The Russian participants obtained significantly higher perceived dissimilarity ratings
for /i - ɨ/ than the Spanish participants. .................................................................................... 79
Figure 18. True monolinguals obtained higher Perceived Dissimilarity scores in comparison to
functional monolinguals. .......................................................................................................... 82
Figure 19. The distribution of residuals in the model with Acoustic Memory as a fixed effect and
Subject and Item as random effects. .......................................................................................... 84
Figure 20. Each variant has a different value from 10 to 50 based on its distance from the prototype.
................................................................................................................................................. 85
Figure 21. The size of the circles signifies the perceived psychoacoustic distance of a given variant
from a prototypical /i/, with smaller circles indicating smaller distance (perceived as a good
exemplar of /i/). ........................................................................................................................ 87
Figure 22. The smaller social network size is, the more compact the native category. ............... 88
Figure 23. Functional monolinguals have on average larger categories than true monolinguals. 89
Figure 24. Quantile-quantile plots for the logarithmically transformed perceived dissimilarity
scores in a rated dissimilarity task grouped by subject. ............................................................. 91

x
Figure 25. The relationships between Compactness and Perceived Dissimilarity (untransformed
scores). ..................................................................................................................................... 92
Figure 26. Participants with a small social network have higher Perceived Dissimilarity ratings in
comparison to participants with a medium or a large network. .................................................. 93
Figure 27. True monolinguals with a medium social network demonstrate higher Perceived
Dissimilarity than functional monolinguals with the same social network size. ......................... 95
Figure 28. Participants with poorer acoustic memory relied on compactness to differentiate
between /i/ and /ɨ/, whereas participants with greater acoustic memory were not affected by
compactness and “used” acoustic memory instead. ................................................................... 96
Figure 29. At the initial stage, the learning of multiple L2s “contaminates” a native phonetic
category with non-native variants (B). As learning progresses further, these variants are grouped
and identified as a new category (C). ...................................................................................... 104
Figure 30. The setup screen for the experiment with the acknowledgement of personal data being
collected and an option not to participate in the study. ............................................................ 152
Figure 31. The short version of the Big Five Inventory as it appeared during the experiment. . 154
Figure 32. The names of the orbits, alongside which variants are distributed. .......................... 158
Figure 33. Klatt’s parameters. ................................................................................................. 160

xi
List of Tables
Table 1. Characteristics of the Spanish participants. .................................................................. 59
Table 2. Summary of performance across all tasks. ................................................................... 76
Table 3. Standard multiple regression predicting Perceived Dissimilarity from biographical data.
................................................................................................................................................. 81
Table 4. Regression models with Perceived Dissimilarity as a dependent variable. ................... 97
Table 5. Results for the beta regression model with proportional Perceived Dissimilarity as a
dependent variable. ................................................................................................................... 98
Table 6. Information about the 16 Russian participants who served as a baseline in the rated
dissimilarity task. .................................................................................................................... 151
Table 7. Stimuli for the serial nonword recognition task (the Spanish CVC nonwords developed
using Syllabarium). ................................................................................................................. 155
Table 8. Stimuli for the target sound recognition task (the Spanish CV nonwords developed using
Syllabarium). .......................................................................................................................... 156
Table 9. F1 and F2 in mels and Hz of the 28 synthesized variants of /i/ and a prototypical /i/. . 158
Table 10. Regression models with Perceived Dissimilarity as a dependent variable. ............... 161
Table 11. Model 1: Perceived Dissimilarity ~ Compactness + (1|Subject) + (1|Item) .............. 162
Table 12. Model 2: Perceived Dissimilarity ~ Compactness + Social Network Size +
Compactness*Social Network Size + (1|Subject) + (1|Item) .................................................... 162
Table 13. Model 3: Perceived Dissimilarity ~ Compactness + Social Network Size + (1|Subject) +
(1|Item) ................................................................................................................................... 162

xii
Table 14. Model 4: Perceived Dissimilarity ~ Compactness + L2 Experience + (1|Subject) +
(1|Item) ................................................................................................................................... 162
Table 15. Model 5: Perceived Dissimilarity ~ Compactness + L2 Experience + Compactness *L2
Experience + (1|Subject) + (1|Item) ........................................................................................ 162
Table 16. Model 6: Perceived Dissimilarity ~ Compactness + L2 Experience* Social Network Size
+ (1|Subject) + (1|Item) ........................................................................................................... 163
Table 17. Model 7: Perceived Dissimilarity ~ Openness + Conscientiousness + Extraversion +
Agreeableness + Neuroticism + (1|Subject) + (1|Item) ............................................................ 163
Table 18. Model 8: Perceived Dissimilarity ~ Compactness + L2 Experience* Social Network Size
+ Phonological Sort-term Memory + Acoustic Memory + (1|Subject) + (1|Item) .................... 163
Table 19. Model 9: Perceived Dissimilarity ~ Compactness*Acoustic Memory + L2 Experience*
Social Network Size + (1|Subject) + (1|Item) .......................................................................... 164

1
Chapter 1 – Introduction
The limits of my language means the limits of my world.
–Ludwig Wittgenstein
1.1 Motivation for the dissertation
This dissertation reflects a scientific journey into the field of speech perception. It is widely
acknowledged that adult second language (L2) learners experience difficulty when acquiring non-
native sound systems. The proverbial struggle to avoid accented pronunciation, labeled by the
common use of the term “Joseph Conrad Phenomenon” (Reiterer et al., 2011), granted phonetic
skills a special status in second language acquisition (SLA) research. The situation, in which a
learner successfully acquires all other subsystems of a target language (e.g., syntax, morphology),
but still cannot manage accurate L2 pronunciation, is way too common. From the
neuropsychological perspective, there is a clear division between the substrates that are responsible
for the acquisition of “grammar” and “accent” (Schneiderman & Desmarais, 1988). The
acquisition of the latter is more difficult since it is a lower order function and cannot be easily
influenced by conscious learner’s efforts. Sociopsychological accounts of SLA also set the
phonetic aspect apart from other linguistic features by introducing the concept of “language ego”
(Guiora, 1980) that is more susceptible to the challenges of speech production than other linguistic
tasks. In short, the separation of pronunciation from other L2 skills has a long history and has been
supported by a number of experimental studies (e.g., Dogil & Reiterer, 2009; Neufeld, 1987).

Chapter 1. Introduction
2
As much as L2 pronunciation is important for native-like performance (unintelligible
speech has sociological consequences, such as obstructing communication and decelerating
integration into the community of native speakers) L2 perception has to be in place first to ensure
accurate production. Even though there is no consensus in the field on such a sequence of L2 sound
acquisition (L2 production following L2 perception), in our study we assume that difficulties with
L2 sound production have a perceptual basis, i.e. learners have “perceptual foreign accents”
(Escudero, 2005). For that reason, we prioritize the role of perception in the L2 acquisition process
and focus our study on learner’s ability to perceive non-native sounds, rather than to produce them.
Previous research has suggested that a native phonological system functions as a perceptual
filter that impedes the accurate processing of novel sounds (Best & Tyler, 2007; Flege, 1995). We
argue that not only individuals with various native languages (L1s) are equipped differently for
the task of L2 perception, but also individuals with the same L1 vary in how their native
phonological categories are represented in the perceptual space. Such variability is observable in
measures of compactness of L1 phonetic categories (category compactness in production:
Kartushina & Frauenfelder, 2014), and its effects on initial L2 perceptual learning can be assessed
by relating the degree of compactness to the discrimination accuracy of novel L2 contrasts. The
concept of compactness in relation to L1 phonetic categories and perception is a new source of
inter-individual variability that we would like to introduce to better understand individual
differences in L2 perception. Because of the ethereal nature of speech perception and
methodological difficulties associated with measuring it, but also because of the notion that
speakers (and listeners) of the same language vary minimally in the way they process their mother
tongue, only a handful of empirical studies investigated L1-based individual differences in
Chapter 1. Introduction
3
perception. This dissertation seeks to close this gap and to show how L1-based individual
differences contribute to the task of L2 phonological acquisition.
1.2 Outline of the dissertation
This chapter introduces the concept of phonetic talent and discusses individual differences in L2
phonological acquisition. The following chapter discusses speech processing mechanisms and
similarities and differences between L1 and L2 speech perception. Chapter 3 explores individual
differences in native perception, which come from anatomical biases and cognitive differences,
but also a linguistic environment. The notion of perceptual category compactness is also
introduced in this chapter in greater detail. Chapter 4 presents the methodology of the study: the
description of the perception and the cognitive tasks used. The results obtained can be found in
Chapter 5. Chapter 6 evaluates and discusses the results in the light of previous research findings,
suggests possible implications and presents the limitations of the study. Chapter 7 concludes this
dissertation by outlining its contribution to the field of SLA and proposing directions for future
research.
1.3 Phonetic talent in L2
Despite the numerous neuro- and sociopsychological reasons we briefly identified above, some
individuals still manage to achieve a near-native phonological proficiency (Moyer, 2014).
Certainly, external factors, such as age of onset of L2 learning, L2 exposure and L1/L2 use
constitute a stable source of inter-speaker variability, i.e. a various degree of success among L2
learners in perceiving and producing non-native sounds. The general trend is the more L2 input,
the better. However, even when only limited input is available, cases have been reported of learners

Chapter 1. Introduction
4
demonstrating exceptional outcomes in phonology (Bongaerts, Planken, & Schils, 1997; Ioup,
Boustagi, El Tigi, & Moselle, 1994). The term “phonetic talent” first appeared in Jilka’s research
(Jilka et la., 2007; Jilka, 2009) who defined the concept broadly as an individual skill to acquire
L2 phonetics and phonology and clearly separated it from other linguistic skills. Yet, the notion
that the phonetic talent or phonetic ability is an independent subcomponent of language aptitude
has a long history: half a century ago, Carroll (1981) coined the term “phonemic coding ability”
that he defined as the innate stable ability to recognize new sounds and store them in long-term
memory. Thus, from its origins the concept traditionally is connected primarily to the cognitive
perspective, i.e., phonetic talent as a combination of specific cognitive skills.
1.3.1 Cognitive abilities and phonetic talent
Research on the role of aptitude in L2 phonological acquisition has shown that a number of
cognitive abilities influence L2 phonological performance; the most researched one being
phonological short-term memory (Cervino-Povedano & Mora, 2015). This type of memory has
been found to be related to successful L2 phonological acquisition. Recent studies suggest that
greater phonological short-term memory capacity is related to higher L2 learners’ perceptual
accuracy. Other candidates that might play a role in L2 phonological processing are: acoustic
memory (Safronova & Mora, 2012), attentional control (Darcy, Park, & Yang, 2015, Safronova &
Mora, 2013), inhibition (Darcy, Mora, & Daidone, 2016), and musical ability (Coumel, Christiner
& Reiterer, 2019).
Carroll’s (1981) phonemic coding ability resembles closely the phonological loop, the sub-
component of working memory that Baddeley (1986) associated with phonological short-term
memory. Phonological short-term memory, the ability to hold phonological material in the short-
term store for about two seconds and to generate accurate phonological representations, seems to

Chapter 1. Introduction
5
play a central role in first and second language acquisition (L1: Baddeley, 1986; L2: Hummel,
2009; Kormos & Sáfár, 2008a). Brooks, Kempe, and Donache (2009) suggested that the
phonological short-term memory capacity could be a better predictor of L2 attainment than the
working memory capacity, non-verbal intelligence or prior language learning experience. In regard
to the L2 phonological development, phonological short-term memory has been shown to
influence the perception of L2 consonants (MacKay, Meador & Flege, 2001) and vowels (Cerviño-
Povedano & Mora, 2011) by facilitating the development of the target-like cue-weighting. A more
recent study by Cerviño-Povedano and Mora (2015) investigated the role of phonological short-
term memory in the weighting of spectral and duration cues in the perception of the English vowel
contrast /i: - ɪ/ by Spanish L2 learners of English. Predictably, Spanish L2 learners of English over-
relied on the duration (and not so much the spectral cues) in the categorization of /i: -
ɪ/. Interestingly, individuals with greater phonological short-term memory capacity demonstrated
higher stimuli categorization accuracy in comparison with the low phonological short-term
memory group. The authors concluded that phonological short-term memory is an important factor
in L2 phonological acquisition and should be taken into account in future speech perception
studies.
Besides phonological short-term memory, there is another memory component that might
be responsible for phonetic talent – acoustic memory. Acoustic memory is a memory system
identified in a variety of ways in the literature: echoic memory (Neisser, 1967), a sensory buffer
store (Atkinson & Shiffrin, 1968), or a pre-categorical acoustic storage (Crowder & Morton, 1969).
Acoustic memory is operationalized as an individual’s memory capacity to temporarily store non-
verbal speech-like acoustic information at a pre-categorical level, i.e. prior to phonological
encoding. Previous research has shown that acoustic memory plays a significant role in within-

Chapter 1. Introduction
6
category vowel discrimination (Cowan & Morse, 1986; Darwin & Baddeley, 1974; Safronova,
2016). Safronova (2016) argues that greater acoustic memory capacity provides the potential for
processing a larger amount of L2 speech input, which facilitates the detection of fine acoustic-
phonetic differences between sounds. In her recent study (Safronova, 2016), she found that
acoustic memory contributes significantly to the perception of cross-language phonetic distance.
Earlier, Safronova and Mora (2012) tested a group of Spanish/Catalan L2 learners on their ability
to perceive the English tense-lax vowel contrast /i: - ɪ/ and did not find the relationship between
acoustic memory and the discrimination ability. Yet, they observed that the acoustic memory
scores did not correlate with the phonological short-term memory measures suggesting that
different cognitive substrates underlay these skills. Ghaffarvand Mokari and Werner (2019)
confirmed this observation: in their study there was no significant relationship between
phonological short-term memory and acoustic memory. Contradictory results coming from
acoustic memory studies can be explained by the fact that acoustic memory and its connection to
L2 perception remains largely an under-researched area; more empirical data is necessary to
understand its precious functioning and architecture.
Recently, attention control has been investigated as a potential predictor of enhanced L2
phonological processing (Darcy, Park, & Yang, 2015; Mora & Mora-Plaza, 2019; Safronova &
Mora, 2013). Selective attention assists learners in choosing relevant cues in the linguistic input
and making phonemic distinctions, whereas attentional flexibility is necessary to rapidly shift
perceptual focus from one linguistic or phonetic dimension to another. Individuals with more
efficient attentional control might be better at detecting relevant phonological information, thereby
accelerating their perceptual learning. Safronova & Mora (2013) examined Spanish/Catalan L2
learners’ individual differences in attention control and learners’ ability to attend to native-like

Chapter 1. Introduction
7
cue-weighting in the perception of the L2 English lax-tense contrast. They reported a significant
difference between the high-attention control and the low- attention control groups’ performance.
The high-attention control participants were better at keeping the non-relevant acoustic
information (either vowel duration or voice quality) in the perceptual background in an attention
control task. The same participants demonstrated a superior ability to focus on the spectral
differences underlying the /i: - ɪ/ contrast in the discrimination tasks.
Darcy, Park, and Yang (2015) also investigated attention control, among other cognitive
skills, in relation to the phonological acquisition (Korean L2 learners of English). The authors used
an attention control task targeting voice identity for indexical information (male or female voice),
and a lexical dimension (word or non-word). At each trial, with respect to the item heard,
participants answered “yes” or “no” to either of two questions: Male voice? Word? There was no
significant effect of attention control on the variable of interest — the individual L2 phonological
acquisition score. The authors concluded that this cognitive skill might contribute to L2
phonological development as a part of a cognitive complex that also includes a working memory
ability and proceeding speed: when taken together, they are especially conducive to efficient
learning. Since phonological processing is a multifarious task requiring the recruitment of various
cognitive abilities, it would only make sense that no one single cognitive variable is responsible
for phonological processing. That being said, in the following study, Darcy, Mora, and Daidone
(2016) found a connection between attention and phonological development. In this study, greater
attention control was associated with more accurate performance in an ABX task, meaning that L2
learners with greater attention control skills were able to perceive the contrastive vocalic and
consonantal features better. In the same study, the authors investigated the role of inhibition in L2
speech perception. They found a positive correlation between the inhibition scores and ABX

Chapter 1. Introduction
8
accuracy. Inhibitory skills are important for deactivating (or inhibiting) the language-not-in-use,
which leads to more accurate L2 perception and production. A stronger separation between L1 and
L2 ensures that the cognitive pathways established for L1 are avoided and direct interaction with
the L2’s properties takes place, which would make L2 acquisition more similar to that of L1 and
potentially more successful.
Lev-Ari and Peperkamp (2013, 2014) also investigated individual differences in inhibition.
Their participants were late English-French bilinguals residing in France who performed a
retrieval-induced-inhibition task together with the tests that measured participants’ voice onset
time (VOT) in perception and production. The hypothesis was that lower inhibitory skill results in
the greater influence of the second language on the first. In other words, poorer inhibition leads to
greater co-activation of the competing linguist units, which leads to more L2-like representation.
The hypothesis was confirmed. In a production task, speakers with the lower inhibitory skill
demonstrated more French-like pronunciation of the English word-initial voiceless stops. In a
perception task, speakers with lower inhibitory skill demonstrated a shift between /d/ and /t/ in
English tokens to the lower, more French-like, VOT values. The authors concluded that inhibitory
skill plays a significant role in controlling the co-activation of competing phones in bilinguals’ two
languages.
Phonological short-term memory, acoustic memory, attention control, and inhibition have
been prominent candidates to explain the cognitive bases of phonetic talent. Yet, only phonological
short-term memory has been consistently linked to exceptional gains in L2 phonetics and
phonology. We included the measures of phonological short-term memory in the present study
together with acoustic memory to understand how the two are connected.

Chapter 1. Introduction
9
Another line of research (Christiner & Reiterer, 2013, Christiner, Rüdegger & Reiterer,
2018; Fonseca-Mora, Jara-Jiménez, & Gómez-Domínguez, 2015; Milovanov, 2009) advocates for
musical ability as a core component of phonetic talent. A number of studies indicate an overlap of
the neural resources between language and music (Seither-Preisler, Parncutt, & Schneider, 2014),
which explains why musical expertise leads to higher memorization and imitation ability of foreign
language material (Christiner & Reiterer, 2015). Marques, Moreno, Castro, and Besson (2007)
investigated the effects of musical expertise on pitch perception in an unfamiliar L2 and
demonstrated that adult musicians perceived pitch variation better than non-musicians. In another
study, Moreno and colleagues (2009) confirmed that musical training improves the perception and
production of the linguistic pitch. A series of studies conducted by Milovanov and colleagues
(Milovanov, Pietilä, Tervaniemi, & Esquef 2010; Milovanov, Huotilainen, Välimäki, Esquef &
Tervaniemi, 2008; Milovanov, Tervaniemi, Takio, & Hämäläinen, 2007) showed a robust
connection between greater musical aptitude and L2 pronunciation and perceptual discrimination.
Even though there seems to be an agreement on musical training being beneficial for the
acquisition of L2 phonology, not all musical training contributes the same way or to the same
linguistic skills. In their study, Christiner and Reiterer (2013) showed that singers outperform
instrumentalists in their ability to imitate unintelligible speech and foreign accents. Since speech
imitation relies on vocal-motor processes as well as audition, the vocal flexibility of singers
facilitates this task for them. Schneider, Sluming, Roberts, Bleeck, and Rupp (2005) went even
further and linked differences in auditory perception to the type of musical instrument their
subjects play or the type of voice (soprano vs. alto) they have. Depending on the neuroanatomical
structure of the auditory cortex, individuals can be assigned to various perceptual profiles with
each listening type perceiving pitch and timbre of a sound differently. A fine-grained measure for

Chapter 1. Introduction
10
musical expertise that accounts for various aspects of musicality might help establish further
connections with specific linguistic skills. Christiner, Rüdegger, and Reiterer (2018) tested how
singing and a sense of rhythm benefit the imitation of an unfamiliar language, Chinese and Tagalog
in their study. Results revealed that children with a high ability for singing discriminated tonal
differences of the Chinese language better, whereas children who excelled at the rhyme-related
tasks did better with the syllable-based Tagalog.
That being said, musicality might be in fact a byproduct of the functioning of phonological
short-term memory, the cognitive skill that we discussed above. For example, Williamson,
Baddeley, and Hitch (2010) suggest that there is a correspondence in the way verbal and musical
sounds are processed in phonological short-term memory.
1.3.2 Affective factors and phonetic talent
So far we have been discussing cognitive skills that previous research has associated with phonetic
talent. However, there is a number of non-cognitive factors that are also connected to the
acquisition of phonetic skills. For example, there is a body of research that investigates how
empathy, an emotional resonance that takes place in an individual when she engages in affective
communication, influences L2 perception and production. In the 1970s, Guiora and colleagues
suggested that individual differences in L2 pronunciation reflect the degree of empathic capacities
that people possess (Guiora, Paluszny, Beit-Hallahmi, Catford, Cooley, & Dull, 1975; Guiora,
Brannon, & Dull, 1972a; Guiora, Beit-Hallahmi, Brannon, Dull, & Scovel, 1972a). A more recent
study conducted by Rota and Reiterer (2009) examined empathy using the questionnaire that
explores sensitivity and concern (E-Skala: Leibetseder, Laireiter, Riepler, & Köller, 2001) in
relation to phonetic abilities in L2 pronunciation and perception. The significant correlations
obtained demonstrated that the theory of empathy in acquiring a foreign accent has convincing

Chapter 1. Introduction
11
grounds and must be investigated further. Another interesting development in the direction of
personality traits is the study done by Hu and Reiterer (2009), in which the authors administered
an exhaustive assessment of personality integrating the dispositional perspective of personality —
the perspective that is based on the idea that each individual’s personality consists of a consistent
pattern of dispositional qualities. The measures of personality included a self-report questionnaire
based on the Five-Factor Model (Costa & McCrae 1992), a behavioral inhibition and behavioral
activation scale test (BIS/BAS: Carver & White, 1994), and several more specific measures:
empathy with E-Scale (Leibetseder et al. 2001), tendencies to experience positive and negative
affects with Positive and Negative Affect Schedule (PANAS: Watson, Clark & Tellegen,1988)
and state aspects of anxiety with State-Trait Anxiety Inventory (Spielberger, 1983). The results
showed that the participants who experience more positive affects, tend to be more agreeable and
empathetic and less conscientious, also possess a greater degree of phonetic talent. Certainly, more
specific investigations are needed to clarify the nature of the relationships between the personality
measures and the phonetic-articulatory aspect of L2 aptitude. Yet, this study demonstrates that
some personality traits might indeed influence learning outcomes in the acquisition of L2 sound
systems.
Even though it is not relevant to the present study (our participant were naive listeners of
a novel language that they never learned before and not L2 learners), a few words must be said
about motivation, since it consistently correlates with all aspects of SLA (Lewandowski, 2012)
and the picture would not be complete without this important concept. A common concern is how
to define or capture motivation. The most influential framework comes from Gardner and Lambert
(1972) who differentiate between instrumental and integrative motivation with the former defined
as a more pragmatic, goal-oriented type and the later — the motivation to connect with people or

Chapter 1. Introduction
12
culture. Gardner and Lambert (1972) have argued that integrative motivation has a stronger
influence on L2 proficiency, especially the phonetic component since learners seek to become
undisguisable from native speakers. Flege (1995) confirmed this finding reporting integrative
motivation as a significant variable for predicting accented pronunciation. Moyer (1999) showed
a strong correlation between the degree of L2 accent and the factor of professional motivation as
well. A word of caution comes from Dörnyei (2010) who observed that motivation is a
continuously changing construct that never remains stable or context-independent, thus, it might
be premature to make conclusions based on the measures of motivation extracted at a specific
moment of a learning trajectory.
From a process-oriented perspective, several scientists have proposed that, rather than
being interpreted as an innate, genetically determined predisposition, phonetic talent should be
seen as a competence dynamically emerging from the interaction between speaker-specific
linguistic, cognitive and psychological determinants and individual experiences (Delvaux, Huet,
Piccaluga, & Harmegnies, 2014). Attempts to separate phonetic talent as a neurobiologically
grounded individual skill from other interacting variables, such as L2 proficiency or motivation
that contribute to language development have been rather challenging (Jilka, 2009). Instead,
Delvaux and colleagues (2014) propose to focus on a more direct and pragmatic concept of
phonetic compliance that encompasses the “here and now” speaker-specific phonetic ability to
produce unfamiliar speech sounds as it is revealed by the speaker’s actual behavior in specific
tasks. Even though it is hard to separate between innate phonetic talent and L2-learning
competence or skill, there are many studies that strive to at least approximate the notion of phonetic
talent through a “combination of many different tests” (Jilka, 2009, p. 41). Whether phonetic talent
is influenced by nurture or reflects an inherent predisposition remains a matter of unresolved

Chapter 1. Introduction
13
debate. In either case, innate or not, phonetic talent should not be seen as a “monolithic” construct.
The studies mentioned above imply that many constituent components contribute to phonetic
talent.
1.3.3 L1 influence and phonetic talent
In the present study, we support the componential view and define phonetic talent as a complex
interplay between cognitive (especially memory-related), psychological (especially personality-
related) and linguistic (especially L1) factors. We consider the latter particularly important since
every language learner is already an expert in at least one language – her mother tongue. According
to various speech models (discussed in greater detail in the following chapter), the phonetic
distance between L1 and L2 predicts an L2 learning trajectory. Some accounts argue that
difficulties arise when the L2 sound system is very dissimilar to the L1 phonemic inventory (e.g.,
Lado, 1957); other accounts support the opposite view and argue that it is the similarity between
L1 and L2 sounds that create a perceptual challenge (e.g., Flege, 1995, 2002, 2003). In any case,
it seems that native phonetic categories function as a filter that removes specific acoustic properties
of non-native sounds. Yet, the exact mechanisms underlying this process remain largely unclear.
Even though a large body of research has been dedicated to investigating L1-L2 interaction, the
empirical results do not always match the models’ predictions or even show the opposite (e.g.,
Zobl, 1980). Instead, we propose to focus on individual differences in the same native language
that might explain why some individuals perceive and produce novel sounds effortlessly regardless
of the language they speak as L1.
In sum, second language acquisition studies single out phonetic talent or phonetic ability
as an independent aptitude phenomenon and define it as a multicomponent entity. This chapter
attempted to briefly describe the complex nature of phonetic talent to provide a better

Chapter 1. Introduction
14
understanding of the concept and how it is defined by various accounts. In the present study, we
focused on one specific realization of phonetic ability – the perception of an acoustic distance
between a pair of contrasting non-native sounds. We focused on a few factors, which, as we
believe, contribute to this ability and which previous research has identified most saliently as
contributing to phonetic talent: phonological short-term memory and acoustic short-term memory,
personality traits, and individual differences in L1 speech perception.

15
Chapter 2 – Speech perception
2.1 Introduction
The process of listening is highly complex: there are several processing stages and mechanisms
involved from perceiving an acoustic wave to building a mental representation of what has been
said. Before looking at L2 speech perception, this chapter will briefly explain how speech
processing takes place generally, i.e., the basic components and the processing mechanisms
involved, and will then evoke some similarities and differences between L1 and L2 speech
perception. We will also take a look at the vocalic inventory of Russian, in particular, the contrast
/i- ɨ/ that we used in the rated dissimilarity task to assess L0 perception. The chapter will be
organized in three parts. First, we will describe the general architecture with the basic components
required for speech processing in a language. Second, we will present the most prominent L2
speech acquisition models juxtaposing the feature-based and exemplar-based frameworks. Finally,
the third part is dedicated to the perception of the Russian contrast /i - ɨ/ and the difficulties that it
causes for naïve listeners and L2 learners, whose native language lacks this contrast.
2.2 Native speech perception
Speech perception, i.e. mapping the speech signal to meaningful linguistic units, entails a complex
decoding task. In real time, listeners have to cope with the acoustic effects of coarticulation,
prosodic structures, background noise and talkers’ idiolects that alter speech sounds (the problem
known as the lack of invariance in perception) should make word recognition very challenging,
yet, it is not the case in L1. In fact, listeners are remarkably attuned to the lack of invariance and

Chapter 2. Speech perception
16
an average 2-year-old is capable of parsing acoustic speech signals without much effort. To explain
how listeners achieve reliable comprehension given the lack of one-to-one mapping between the
acoustic signal and individual speech sounds, most of the existing speech perception models
assume an intermediate level of processing, often referred to in the literature as prelexical or
sublexical coding (Figure 1). This intermediate level in the speech perception system normalizes
the signal and abstracts the phonetic code that can then be used for lexical access. It is yet to be
determined what is the nature of this code; among the most prominent candidates are phonemes
(Norris, 1994), syllables (Massaro & Simpson, 2014), acoustic-phonetic features (Stevens, 2002),
articulatory gestures (Liberman & Mattingly, 1985), and context-sensitive allophones (Luce,
Goldinger, Auer, & Vitevitch, 2000). There is also no agreement on whether speech perception
depends on a general auditory ability (Brown, 1998; Hume & Johnson, 2001) and, thus, the
perceptual mapping is an automatic result of the human auditory system, or it triggers different
mechanisms than those of other auditory stimuli and calls on special processes (Escudero, 2005).
Figure 1. An information processing model of speech perception and production. The boxes in grey represent the standard model of phonological theory (Ramus et al., 2010, p. 313).
What we do know is that speech perception machinery becomes quickly attuned to best

Chapter 2. Speech perception
17
handle the acoustic-phonetic properties of a specific linguistic environment. Kuhl (2000) claims
that “no speaker of any language perceives acoustic reality” (p. 11852), i.e., perception is always
transformed by the language-specific knowledge that guides listener’s discrimination between
tokens. The process of language attuning takes place early on, with some accounts stating that
interactions between neural biases and environmental shaping may be at work as early as in utero
(Jardri et al., 2012; Morokuma et al., 2004). The data from near-infrared spectroscopy studies show
an early neural sensitivity to configurations of auditory stimuli that are often heard in speech
(Gervain, Macagno, Cogoi, Peña, & Mehler, 2008). This neural sensitivity further contributes to a
complex developmental phenomenon called perceptual tuning, that is the narrowing of perception
of speech sounds over the first year of life (see Figure 2, but also: Eimas, Siqueland, Jusczyk, &
Vigorito, 1971; Kuhl et al., 2008).
Figure 2. The universal language timeline of speech-perception and speech-production development (Kuhl, 2004, p. 832).
There are studies that demonstrate that due to prenatal experience, neonates already have
Chapter 2. Speech perception
18
a preference for the prosodic pattern of their native tongue (Byers-Heinlein, Burns, & Werker,
2010). Initially capable to discriminate many minimally contrastive phonemes, infants rapidly
learn regularities of linguistic input they are engaged with (statistical learning: Saffran, 2003) and
become more adept at discriminating only those phonemes that are relevant to their native language
(Werker & Tees, 1984). For example, at the age of eight months, monolingual Japanese infants
are able to distinguish between English /r/ and /l/; however, they lose this ability by 10-12 months
of age. Thus, early in development, learners commit the brain’s neural networks to patterns that
reflect specific linguistic input. Later in life, this initial coding of native-language patterns
interferes with the learning of new patterns, i.e., new languages. Basically, the native phonological
system functions as a mental filter that impedes accurate perception of foreign sounds making the
acquisition of L2 phonology a challenging task for an adult learner (Best, 1995; Escudero, 2005;
Flege, 1995).
2.3 L2 speech perception
Initial L1 exposure early in life results in physical changes in neural anatomy; these changes are
necessary to support the statistical and perceptual properties of the linguistic input in one’s
immediate environment (Kuhl, 2004). The concept of neural commitment that supports L1
learning and constrains future learning could explain the issue of a “critical” or “sensitive” period
for second language acquisition (Lenneberg, 1967). However, in contrast to older accounts, recent
studies emphasize the primary role of experience and not simply time in driving phonetic learning
and L2 perception. As native language speech perception improves as a result of L1 experience,
non-native speech perception declines as it is represented by uncommitted neural circuitry (Kuhl
et al., 2008). L1 experience shapes attentional networks that interfere with phonetic learning of a

Chapter 2. Speech perception
19
new language later in life (Flege, 1995; Kuhl, 2004; Kuhl et al., 2008). For example, as mentioned
above, Japanese adults notoriously struggle with the English /r - l/ categorization, assumedly,
because they are most sensitive to the acoustic cue, F2, that is irrelevant for this contrast (Iverson
et al., 2003). This does not mean though that adults permanently lose the perceptual sensitivity
necessary to distinguish non-native speech sounds. Early experiments by Pisoni, Lively and Logan
(1994) on voicing perception demonstrate that native English listeners can reliably perceive a
difference in the prevoicing region of the VOT continuum after a very short training and can
transfer their knowledge to new stimuli with a different place of articulation. These findings
indicate that the underlying sensory-perceptual mechanisms have not been permanently modified
or lost due to prior linguistic experience. More likely, the difficulty in distinguishing non-native
phonemes depends on the degree to which the native and non-native sound inventories differ (Best,
1995; Flege, 1995). Based on this assumption, the L2 acquisition models predict various scenarios:
some argue that it is the relative dissimilarity of specific L1-L2 constellations that produce L2
learning difficulties and some support the opposite view. Here we discuss L2 models that focus on
L2 speech perception at a segmental level, without addressing the overall accent or the higher-
level prosodic structures.
2.3.1 L2 speech perception models
Before taking a closer look at the existing L2 speech perception models, it is important to clarify
the difference between feature-based and exemplar-based theories of phonological acquisition.
Feature theories describe and categorize speech sound categories through a set of distinctive
features (Chomsky & Halle, 1968; Jakobson, Fant, & Halle, 1969). Relevant articulatory or
acoustic features are extracted from an acoustic signal and then translated into an abstract category
that is defined by these features. For example, the vowel /i/ is defined by the features [+high], [-

Chapter 2. Speech perception
20
back], [-round] and [+tense]. When a listener hears /i/, these features are abstracted from the
acoustic cues (the formant values and the fundamental frequencies) by the perceptual system. An
alternative approach, exemplar-based theories define each sound as a sum total of all tokens of the
sound, or exemplars, that the person has heard with all its acoustic, lexical, social and contextual
information retained (Goldinger, 1996; Morgan et al., 2001). Thus, speech perception consists of
comparing each sound to a collection of stored exemplars for each category and assigning the
sound in question to the category with the greatest collection of tokens most similar to it (Johnson,
1997). Both frameworks can theoretically coexist (Goldinger, 2000) leaving open the question of
which memory representation is primary in speech perception. For example, Ettinger and Johnson
(2009) suggest that exemplar-based representations are used for “lower-level tasks”, i.e., sound
discrimination and speaker normalization, and featural contrasts best account for the higher-order
patterning of language.
Feature theory is represented by three perception models that constitute the most influential
research body up till now and aim to explain both L1 and L2 speech perception and the connection
between them. These models will be reviewed below in chronological order with the Native
Language Magnet Theory (NLM: Kuhl, 1993; Kuhl et al., 2008) discussed first, followed by the
Perceptual Assimilation Model-L2 (PAM: Best, 1993, 1994, 1995; also PAM-L2: Best & Tylor,
2007) and the Speech Learning Model (SLM: Flege, 1995, 2002). The models based on feature
theory assume that in the course of L1 development articulatory or acoustic features are extracted
from the acoustic signal to identify relevant phonetic categories. In terms of L2 perception, the
models presuppose that previous linguistic experience has a direct effect on the initial state of L2
sound perception. Thus, the discrimination between non-native sounds is facilitated if the same
feature is present in one’s native language. Depending on the model, this feature can be articulatory

Chapter 2. Speech perception
21
or acoustic in nature (see individual models’ description below). That being said, adult L2 learners
have life-long access to development and are in theory capable of approximating near-native
performance.
The Native Language Magnet Theory (NLM and NLM-e: Kuhl, 1993; Kuhl et al., 2008) is
perhaps the most complete proposal for speech perception as it explicitly refers to the mechanisms
underlying the learning of language-specific perception and puts forward a body of evidence
showing that infants acquire sophisticated information from the signal through the detection of the
distributional and probabilistic properties of the ambient language (Kuhl, 1993; Kuhl et al., 2008).
NLM argues that sound perception is the result of a complex neural mapping that forms abstract
phonetic categories stored in memory. Perceptual mapping is driven by earlier linguistic
experience and is, thus, language-specific, i.e. no speaker of any language perceives acoustic
reality as it is (Iverson & Kuhl, 1995; Iverson & Kuhl, 1996). Within the first year of life,
stimulated by social interaction, infants employ categorization, statistical processing, and
perceptual warping of acoustic dimensions, all of which results in the emergence of perceptual
representations.
L1-specific sound mapping is supported by committed neural structures. This commitment
interferes with the creation of new mappings and leads to deficient L2 perception. The perceptual
magnet effect, when L1 sound categories (or rather their prototypes) act as attractors for newly
perceived tokens, prevents learners from perceiving incoming speech objectively. The closer a
speech token is to an L1 category prototype or a magnet, the harder it is to perceive — the
phenomenon is called “a gravitational pull”. In order to improve nonnative perception, L2 learners
have to create new mappings, which could be more challenging with age due to the loss of neural
plasticity. Once a new perceptual system has been formed, the L1 and L2 systems can coexist with

Chapter 2. Speech perception
22
minimal interference, as two distinct regions of the brain are responsible for processing native and
non-native languages.
Unlike the NLM that claims that perceptual representations are stored in memory, the
Perceptual Assimilation Model (PAM and PAM-L2: Best, 1993, 1994, 1995; Best & Tylor,
2007) is based on the ecological approach to speech perception (direct realism: Best, 1984) and
proposes that listeners extract the invariants of articulatory gestures directly. A child detects and
learns to hear high-level articulatory gestures that discriminate sound contrasts in her native
language — this process gradually facilitates L1 perception. Next, L1-specific high-level features
and categories are used in new language environments. Since non-native environments often lack
familiar gestural features, beginner listeners assimilate L2 sounds to those native sounds that they
perceive as most similar. If an L2 contrast is perceptually assimilated to different native categories
(two-category assimilation), discrimination is predicted to be excellent. Whereas if contrasting L2
sounds are assimilated to the same L1 category (single category assimilation), the discrimination
will be likely poor. The situation, in which one member of the L2 contrast is assimilated as a good
version and the other as a poor version of a native category, is called category-goodness
assimilation. In this case, the perceptual difficulty depends on the degree of difference in category
goodness between the two L2 phones. It could be also that one L2 phone is categorized while the
other is not – the assimilation pattern that is called uncategorized-categorized and discriminated
quite well. Lastly, both L2 phones might be uncategorized (uncategorized-uncategorized
assimilation), which might be difficult or easy to discriminate, depending on the phonetic and
auditory similarities between the L2 phones. Over time, exposure to L2 input might lead to splitting
of native categories and reorganization of assimilation patterns making them more native-like.
The Speech Learning Model (SLM: Flege, 1995, 2002) shares much in common with the

Chapter 2. Speech perception
23
NLM in terms of the development of auditory perception by the means of categorization and
accounts for both L2 perception and L2 production. According to the SLM, abstract phonetic
categories are identified based on the phonetic features discriminated in the speech signal. This
mechanism — detecting and classifying featural patterns in the input — guides the process of
category formation and, consequently, the learning of L1 perception. The SLM claims that the
difficulty in acquiring L2 sounds comes from the learner’s tendency to relate new sounds to the
existing positional allophones — a process called “equivalence classification”. Because of
equivalence classification, L2 sound features and properties get filtered out by L1 phonology.
Since the model presupposes that “the mechanisms and processes used in learning L1 sound
system remain intact over the life span” (Flege, 1995, p. 239), in theory, adults retain the capacity
to learn an accurate perception of new L2 properties. As long as a learner is capable of perceiving
the phonetic differences between L2 sounds (or between L2 and L1 sounds), she can create new
categories. It is predicted that it will be more difficult to perceive L2 sounds in a native-like manner
if they are similar to L1 sounds. In this case, a novel sound will be merged with a preexisting native
sound (“perceptual equivalence”), and this single category will be used for L2 perception.
However, in contrast to the NLM that assumes different neural circuitries for L1 and L2, the SLM
suggests a common phonological space for both systems, which means that newly formed phonetic
categories will trigger boundary adjustments for the preexisting L1 categories.
All three models predict that it is the similarity between L1 and L2 sounds (and not
differences as some models postulate: e.g., Lado, 1957) that interferes with the accurate perception
of non-native contrasts: in this sense, NLM's gravitational pull, PAM's assimilation, and SLM's
equivalence classification are essentially the same phenomenon. It must be noted that the above-
mentioned models do not explain individual variability in non-native perception. It is assumed that

Chapter 2. Speech perception
24
all listeners with a shared L1 map non-native categories into native ones in a similar manner. For
example, according to PAM’s predictions, it would be universally challenging for all listeners to
perceive a non-native contrast if it is represented as a single category in their L1. However, often
individuals demonstrate different perceptual assimilation patterns. Mayr and Escudero (2010)
investigated whether native English learners of German vary systematically from each other in the
way they map L2 sounds to native categories. They demonstrated that even at the initial stage of
L2 acquisition there is substantial variability among learners: some individuals perceived the
vowel German contrast in terms of a single native category, whereas other individuals perceived
the same contrast as two or more native categories. The authors suggested that, among other
factors, L1 accentual properties might influence non-native perception. Flege (2016) also observed
that individuals might vary in their L1 phonetic categories, which leads to differences in L1-L2
mappings. He suggested that individual subjects and not groups should be considered as primary
units of research analysis. Yet, the models we described above treat listeners’ L1 as a homogeneous
entity, assuming that the same native language triggers the same assimilation patterns. These
models need to be extended to account for individual variability found within populations with
similar profiles. Exemplar-based theories might offer a suitable framework for such an extension.
In contrast to feature-based theories, exemplar-based theories interpret L1 speech
perception in a fundamentally different manner. Phonetic categories are defined as clusters of
experienced instances of speech sounds or exemplars. Because individuals process and store
speech sounds together with the acoustic, lexical, and social contexts, in which the sounds occur,
phonetic categories are not abstract invariant entities, but rather clusters of specific tokens
(Coleman, 2002; Ettlinger & Johnson, 2009). Since phonetic categories are a result of the interplay
between an individual's cognitive, affective and social experiences, speakers of the same L end up

Chapter 2. Speech perception
25
having slightly dissimilar L1 phonetic inventories that lead to slightly dissimilar perceptual
profiles. Thus, the subsequent L0/L2 speech perception would depend on: 1) the perceptual
similarity of a new exemplar to the existing cluster of exemplars; 2) the presence of neighboring,
competing clusters of exemplars; and 3) the density of the clusters, with more exemplars in a
cluster attracting new tokens more strongly (Anderson, Morgan, & White, 2003). In this regard,
exemplar-based theories support feature-based theories demonstrating that non-native languages
are perceived through the lens of L1. However, exemplar-based theories do not treat L1 as a
homogeneous entity and attempt to explain how individual differences in L1 influence L2
perception.
It must be noted that the studies that test the assumptions of exemplar-based modeling are
relatively new, and there are no L2 speech perception models that support the exemplar-based
approach. Therefore, in this dissertation, we consider exemplar-based theories only as an extension
for existing L2 speech models since it is the only account that explains individual differences in
native perception.
2.3.2 Individual differences and specific languages
As discussed in Chapter 1, some adult learners exhibit learning patterns that do not go along with
the developmental trajectory predicted by the existing L2 speech models. Despite the powerful
influence of a native sound inventory, some individuals manage to achieve a near-native phonetic
and phonological proficiency even when they acquire a language later in life (Ioup et al., 1994;
Bongaerts, Planken, & Schils, 1995). On the other hand, some individuals persist listening and
speaking with a heavy foreign accent, even when other aspects of the language are mastered – the
so-called “Joseph Conrad Phenomenon” (Reiterer et al., 2011).

Chapter 2. Speech perception
26
Taken together, psycholinguistic studies on phonetic talent and L1/L2 speech perception
resemble a two-sided street. On the one hand, there is a research paradigm that focuses on
individual differences without taking into consideration L1-L2 phonetic distance (the acoustic and
articulatory similarities between L1 and L2 sounds) under the assumption that gifted listeners will
succeed with any language. On the other hand, some studies investigate cross-language perception
with specific language pairs, while analyzing group results and not individual assimilation
patterns. Whereas each of the approaches sheds light on L2 acquisition, both approaches should
be taken into consideration when investigating how non-native sound inventories interact with
individual differences.
Concerning general language learning, MacWhinney (1995) suggested that language
aptitude or ability might vary across languages: an individual might succeed in learning one
foreign language, but not another. He distinguished between several learning patterns, according
to which the learning outcome depended on learner’s ability and a specific language, but most
importantly – on the interaction between the two. Depending on the nature of the learning ability
(“learner’s strengths and weaknesses across a wide array of tasks”, p. 2) and the linguistic
properties that a given language has (e.g., opaque orthography, a complex inflectional system,
conceptual complexity), a learner can succeed in language A and fail in language B.
The phonetic ability might also depend on a specific L2 that a listener has been exposed
to. It is most likely that existing L1 categories vary across individuals as a result of different
linguistic backgrounds and processing mechanisms (as exemplar-based theories describe). This
means that for the same novel sound at least two scenarios exist: with the novel sound falling
within an L1 category or not. Below a Spanish listener A successfully discriminates between her
native /i/ and the novel Russian /ɨ/, whereas a Spanish listener B does not succeed in this task since

Chapter 2. Speech perception
27
the novel sound falls within her native category /i/ (Figure 3). The situation is reversed when the
same listeners are exposed to a novel English /æ/.
Figure 3. Spanish listeners A and B’s perception of a novel Russian vowel /ɨ/ and English /æ/.
The existing L2 perception models would predict that both Russian /ɨ/ and English /æ/
might posit a challenge for native speakers of Spanish since these sounds are acoustically and/or
articulatory similar to Spanish /i/ and /a/ respectively. The studies that investigate phonetic talent
would make a different prediction: according to these studies, a more talented listener should
succeed to the same extent with discriminating both /ɨ/ and /æ/, whereas a less talented listener
will struggle with both sounds. We propose an alternative perspective, according to which some

Chapter 2. Speech perception
28
listeners will struggle with some non-native sounds while succeeding with other non-native
sounds. The idiosyncratic pattern, in which an individual assimilates a non-native sound to her
native category would depend on an L1 perceptual profile, i.e., the properties of a native category
and how it is positioned in the psychoacoustic space. Because of the complex nature of such
interaction and the lack of previous research that would suggest appropriate methodology and
theoretical guidance, in this dissertation, we limited ourselves to exploring only one category
property that we believe contributes the most to non-native perception, that is L1 category size or
compactness. We looked at the effects of compactness of the Spanish category /i/ on distinguishing
a novel Russian contrast /i - ɨ /. The following section discusses the proposed contrast in greater
detail.
2.4 Russian contrast /i - ɨ/ and Spanish /i/
In the present study, we investigated how well native Spanish listeners perceive the distance
between two members of the novel Russian contrast /i - ɨ/, which does not exist in Spanish. The
Spanish and Russian vowel inventories share the following five vowels: /i/, /u/, /e/, /o/, /a/, but not
/ɨ/ that only exists in Russian (Figure 4). It must be noted that some accounts treat Russian /i/ and
/ɨ/ as two allophones of the same phoneme /i/ since these vowels occur in near-complementing
distribution: /i/ is used after palatalized consonants and /ɨ/ is used after non-palatalized consonants
(Farina, 1991; Cubberley, 2002). In the present study, we followed the latest description of the
Russian vowel inventory that distinguishes between /i/ and /ɨ/ (Yanushevskaya & Bunčić, 2015).

Chapter 2. Speech perception
29
Figure 4. The vowel inventory of Spanish (in black: Martínez-Celdrán, Fernández-Planas, & Carrera-Sabaté, 2003) and Russian (in red: Jones, 1953; Yanushevskaya, & Bunčić, 2015).
This study focuses on the perception of vowels and not consonants because vowels are
produced with higher intensity, longer duration, and more acoustic dimensions than consonants.
These characteristics allow for the detection of the subtle perceptual differences and ensure that
these differences are robust. Best, Halle, Bohn, and Faber (2003) also observe that vowels are
much fewer in number, which makes them more variable than consonants among languages and
dialects. Since we investigate individual differences, we assumed it would be also easier to observe
individual variability in vowel perception, than consonant perception. We also assumed it would
be easier to observe individual variability in vowel perception in a language with a small vowel
inventory. Previous research in production has shown that vowel system size could affect vowel
variability, with fewer vowels (a less crowded vowel space) imposing more vowel variability
(Recasens & Espinosa, 2006). For that reason, Spanish was selected as L1 in this study.

Chapter 2. Speech perception
30
There are several reasons why the Russian contrast /i - ɨ/ was selected to test participants'
non-native perception. First of all, L2 learners of Russian whose native language does not have
the above-mentioned contrast almost universally struggle with it in both perception and production
(Andreyushina, 2014; Shutova & Orehova, 2018). Spanish learners are not an exception: even at
the higher levels of language proficiency, both Russian /i/ and /ɨ/ are often assimilated to single
Spanish /i/ (Klimova, Yurchenko, Cherkashina & Kulik, 2017). This observation goes along with
the theoretical explanations offered by the L2 perception models that predict difficulty with non-
native sounds that are similar to L1. Russian /ɨ/ is acoustically very similar to Spanish /i/ (Figure
4), yet it is a distinct phoneme in Russian that is used contrastively with /i/. According to the Native
Language Magnet Theory (NLM and NLM-e: Kuhl, 1993; Kuhl et al., 2008), the closer a novel
sound is to an L1 category acoustically, the harder it is to perceive it. When listening to Russian
/ɨ/ Spanish listeners experience “a gravitational pull”, i.e., their native category /i/ acts as a magnet
for a novel sound /ɨ/ preventing its accurate perception.
According to the Perceptual Assimilation Model (PAM and PAM-L2: Best, 1993, 1994,
1995; Best & Tylor, 2007), the problem lays in the proximity between the articulatory gestures
required for the production (and therefore, for the perception) of /i/ and /ɨ/. Russian /i/ is a high
front unrounded vowel that is very similar to Spanish /i/, and, thus, virtually indistinguishable from
it, i.e. “a good exemplar” of Spanish /i/. In this case, PAM predicts no further perceptual learning
for Russian /i/. However, Russian /ɨ/ is a high central unrounded vowel – the category that Spanish
lacks. Most likely, Russian /ɨ/ would be perceived as deviant with respect to Spanish /i/, the closest
corresponding L1 phonetic category. When one member of the L2 contrast is perceived as a good
exemplar of a given L1 and the other member – as a deviant exemplar of L1, the type of
assimilation is called category-goodness assimilation. The discrimination is predicted to be hard

Chapter 2. Speech perception
31
or difficult depending on the phonetic and auditory similarity between the L2 sounds, but usually,
a listener is able to perceive a considerable difference between the two. The other PAM scenario,
single category assimilation, describes the situation when both L2 categories are perceived as
equally good or poor exemplars of the same L1 category. In this case, the discrimination is
predicted to be poor as both L2 sounds are merged with the given L1 category. Klimova,
Yurchenko, Cherkashina, and Kulik (2017) report the singular category assimilation pattern for
Russian /i - ɨ/ by Spanish learners. There is only a handful of studies that investigated the
acquisition of Russian phonetics and phonology by Spanish learners, with no studies reporting the
details of the assimilation patterns for the Russian /i - ɨ/ contrast by Spanish listeners. Several
patterns might be possible as Russian vowels vary greatly as a function of the lexical stress and
consonantal context. In some situations, the perceived distance between Russian /i/ and /ɨ/ could
be greater allowing for category-goodness assimilation; in other situations, the perceived distance
could be minimal calling for single category assimilation.
The Speech Learning Model claims that the difficulty in acquiring L2 sounds comes from
the learner’s tendency to relate new sounds to the existing positional allophones — a process called
“equivalence classification”. In our case, equivalence classification ensures that the key feature
that distinguishes Spanish /i/ from Russian /ɨ/, [-+back], gets filtered out, resulting in perceptual
equivalence between /i/ and /ɨ/.
The acoustic and articulatory proximity of /ɨ/ to /i/ could be the reason why /ɨ/ is not
commonly present across languages: only 16% of 2186 languages reported in PHOIBLE
repository of the phonological inventory data have /ɨ/ as an independent phoneme. In comparison,
92% of 2779 languages reported in PHOIBLE have /i/ as an independent phoneme (Moran, &
McCloy, 2019).

Chapter 2. Speech perception
32
The second reason for choosing the Russian contrast /i - ɨ/ to test L0 perception had to do
with the fact that the Russian language is not frequently spoken or taught in Spain, and we were,
therefore, able to ensure that our participants did not have any previous experience with the target
vowels. At the same time, both Russian and Spanish are similar in the way they use vowel duration
across various contexts: e.g., in both languages vowels are longer before voiced than before
voiceless consonants (Kondaurova & Francis, 2008), which would ensure that the participants
would not get distracted by irrelevant acoustic cues, i.e., focus on the qualitative (spectral) and not
quantitative (duration) differences between the sounds. Lastly, we are not aware of other studies
that investigated the perception of Russian sounds by Spanish listeners. Moving away from the
celebrated tense-lax English contrast /i - ɪ/ and introducing a less-researched vocalic pair has been
viewed as a contribution to the studies on the acquisition of the Russian phonology.
The Spanish /i/ was chosen for use in this study because it is one of the three-point vowels
(/i/, /a/, and /u/) that are at the articulatory and acoustic extremes of the vowel space (Jakobson,
Fant, & Halle, 969), which makes it more stable and less susceptible to changes within an
individual psychoacoustic space. It is important to take such intra-individual variability into
consideration since previous research has shown that speech perception is affected by a number of
intra-individual factors: e.g., the levels of various hormones in the body (Sao, & Jain, 2016) or
time of the day (Veneman, Gordon-Salant, Matthews, & Dubno, 2013). These and other factors
trigger fluctuations in the central auditory processing and psychoacoustic capabilities of an
individual. For that reason, the "point" vowels (/i/, /a/, and /u/) are more reliable for perceptual
experiments.

Chapter 2. Speech perception
33
2.5 Summary
This chapter has discussed the nature of speech perception and the theoretical models that explain
how L1 perception affects the processing of non-native sounds. These models suggest that listeners
become attuned to specific acoustic-phonetic properties of their native language early on. Once
the native sound system is in place, it is difficult to modify it (although not impossible). Listeners’
L1 functions as a filter and impedes accurate perception of novel sounds, which tend to be mapped
to the existing native categories; this process is labeled by different models as gravitation pull,
category assimilation, or equivalence classification. The described models treat L1 as a
homogeneous entity and do not differentiate between individual differences within the same
language. Exemplar-based theories also emphasize listeners’ reliance on the L1 established
phonetic representations that shape L2 speech perception, but they challenge the idea of L1
convergent on the same L1 phonetic representations. According to exemplar-based theories,
phonetic category development is guided by the distributional nature of the input, which is
processed and stored in memory with intricate phonetic details. As a result, idiosyncratically-
shaped native sound categories vary across individuals, even within the same L1 community. L1-
based variability is manifested in various degrees of perceptual sensitivity towards novel sounds
affecting non-native speech perception. This previously unaccounted-for systematic source of
individual variability might be responsible for some individuals' success in discriminating non-
native contrasts, perceptually "invisible" for others, and for the bases of phonetic talent.

34
Chapter 3 – Individual differences in
L1 speech perception
3.1 Introduction
In recent years, linguistics has been undergoing a theoretical shift: once influential, mentalist
theories that emphasize invariable structures, are rapidly getting replaced by usage-based
approaches to language acquisition. Cognitive science gave birth to the idea that linguistic
knowledge is shaped by language use and that speakers learn the language by subconsciously
analyzing and storing a vast amount of information about co-occurrent frequencies of words and
structures (Ellis, 2006; Langacker, 1987). Theories of categorization such as prototype and
exemplar-based theories describe linguistic categories as having probabilistic structures and
ambiguous boundaries (Johnson, 1996; Pierrehumbert, 2001). From the social perspective,
linguistic categories emerge as a result of the alignment between a speaker and a listener
(Goldinger, 2007; Lev-Ari, 2017, 2018).
This recent theoretical shift introduces a new approach to speech processing and
categorical perception of speech in particular (a phenomenon of perception, in which continuous
stimuli are sorted into discrete categories: Liberman, Harris, Hoffman, & Griffith, 1957).
Traditional accounts hold that listeners strip the acoustic signal of all extraneous noise and pay
attention only to higher-level categorical phonetic information. In other words, the mental
representations are simple and the mapping is complex – this approach assumes minimal inter-
listener variability. However, the normalization required for processing at this level is still not

Chapter 3. Individual differences in L1 speech perception
35
specified by previous research: we do not know how and what kind of variability has to be removed
in order to normalize the input at the prelexical level. Contrary to this approach, another line of
research argues that listeners do attend to lower-level phonetic detail, such as speaker identity or
speaker rate when processing speech (e.g., Goldinger, Pisoni, & Logan, 1991; Dellwo, Pellegrino,
He, & Kathiresan, 2019). According to this view, the mental representations are complex — they
constitute a myriad of acoustic forms stored in perceptual space, and the mapping is simple. This
approach assumes substantial inter-listener variability in speech perception.
Because of the early emphasis in the field on the abstract nature of phonetic categories,
individual differences in speech perception have been largely ignored. Only recently, the field of
psycholinguistics, and psychophonetics, in particular, turned its attention to systematic sources of
inter-listener variability in L1 perception (Yu & Zellou, 2018; Zellou, 2017). In this chapter, we
review recent research and identify the possible causes of such variability. Thus, the chapter is
structured as follow: first, it introduces the concept of individual differences in native perception;
next, it provides an overview of the internal and external factors that might be responsible for such
differences; and finally, the concept of category compactness in L1 perception is introduced.
Below we will discuss variability in both perception and production, assuming a direct connection
between the two.
3.2 Individual differences in native perception
Each individual acquires the phonetic patterns of their speech community using their idiosyncratic
physiological and cognitive characteristics that, in turn, influence perceptual representations and
shape how each listener experiences incoming speech. Listeners within a single speech community
might, in fact, have different perceptual representations for the same phonological units. The

Chapter 3. Individual differences in L1 speech perception
36
differences among native speakers have not been considered seriously, mostly due to the SLA
research focus on the idealized speaker/listener and abstract invariants. However, recent studies
have examined the way native speakers and listeners use and comprehend their native language.
For example, Zellou (2017) demonstrated that native speakers of American English use different
patterns of perceptual compensation for nasal coarticulation. Assuming the gestural nature of
speech representations, Zellou suggests that the sound representations of each individual differ
from those of the community due to idiosyncratic articulatory anatomy (e.g., vocal tract
architecture). Listeners use their individual phonetic knowledge of coarticulation and its acoustic
consequences to determine how much acoustic variation in speech should be parsed, which results
in dissimilar listener-specific expectations. This approach implies that there is a connection
between production and perception, although Zellou observes that this connection is not as
straightforward as we would expect (“I produce what I hear”). The production-perception loop is
rather complex and multifaceted, i.e. might involve a range of cognitive processes, not necessarily
language-specific, but also domain-general (e.g., Sonderegger & Yu, 2010).
Inter-speaker variability in nasal phonation in production has been widely used in forensic
phonetics for speaker identification purposes. For example, Su, Li, and Fu (1974) demonstrated
how the coarticulation between [m] and the following vowel context can be used as a reliable
acoustic cue for identifying speakers. In forensic phonetics, nasal consonants and nasal-plus-vowel
sequences are viewed as one of the most consistent speaker-specific characteristics or idiolectic
staples because their production relies on the shape, size, and rigidity of the nasal cavity, which
cannot be easily altered (Nolan, 1983; Rose, 2002). Such variability in the speaker’s anatomy is
an example of the “organic” source of inter-speaker differences, as opposed to the “learned”
differences that constitute dialectal traits and sociolects. Numerous studies in forensic phonetics

Chapter 3. Individual differences in L1 speech perception
37
and sociophonetics have demonstrated that even though two individuals may be similar in terms
of nature and nurture, they still exhibit differences in the native phonetic patterns they use. For
example, Nolan and Oh (1996) reported differences in the realization of the sounds [r] and [l] in
identical twins. A more recent study by Loakes (2006) investigated the variability in the degree of
frication of [k] and [p] in identical twins with a similar conclusion.
Although forensic phonetics has accumulated a large number of studies that demonstrate
variability within the same speech community, these studies have shed little light on differences
in L1 perception. In the present study, we assume that production and perception utilize the same
representational structures, and thus individual differences in production are reflected in individual
differences in perception, and vice versa. Here we use the term individual differences and
individual variability to refer to differences in how phonetic categories are represented in both
perception and production across speakers of the same language: it includes category size
(compactness), category boundaries and the internal structure of categories (distribution of sound
invariants in their relation to a prototype).
Below we discuss how native perception and production are shaped by anatomical and
cognitive individual differences and linguistic experiences. We differentiate between internal and
external factors that affect L1 variability (as seen above, they are often labeled as “organic” and
“learned” factors): internal factors refer to the anatomical architecture and cognitive processes that
support the way individuals process, acquire and use language, whereas external factors have to
do with sociocultural and environmental factors that affect language.
3.3 Internal factors that result in L1 variability
In the following paragraphs, we discuss how anatomical and cognitive architecture affect

Chapter 3. Individual differences in L1 speech perception
38
individual differences in sound perception and production. We will first review previous research
on language-related functional anatomy and how it affects the production-perception loop,
followed by the review of the cognitive factors.
3.3.1 The anatomy of speech sounds
Individuals vary in systematic ways in their physiological and biomechanical parameters: larynx
morphology, vocal tract geometry, palatal shape, and tongue muscles are among the properties that
might be responsible for inter-speaker variability. Such variability, in addition to other factors that
drive language change, might be responsible for the diversity observed in sound systems around
the globe (Brosnahan, 1961). Even though the normal variability of a human articulatory apparatus
does not prevent an individual from speaking intelligibly, it does not mean that the speech
produced is identical to that of all other speakers. Tiede, Gracco, Shiller, Espy-Wilson, and Boyce
(2005) investigated speaker preferences for different tongue shapes in the production of American
English /r/ in relation to palatal morphology and demonstrated that such preferences have acoustic
consequences in some contexts. Winkler, Fuchs, and Perrier (2006) showed relationships between
speaker-specific vocal tract geometries and their articulatory vowel space. Their results indicate
that speakers with longer pharynxes have larger degrees of freedom in the vertical direction and
produce larger displacements between low back and high front vowels than speakers with shorter
pharynxes.
The differences in production influenced by vocal tract morphology might affect speech
perception as well. The Motor Theory of speech perception (Liberman & Mattingly, 1989;
Liberman & Mattingly, 1985; Liberman, Cooper, Shankweiler, & Studdert-Kennedy, 1967)
proposes that humans perceive speech sounds as the intended vocal tract gestures of the speaker
and assumes that the production and the perception of speech share the same neural processes and

Chapter 3. Individual differences in L1 speech perception
39
representations. The discovery of a class of mirror neurons in monkeys and humans (Gallese,
Fadiga, Fogassi, & Rizzolatti, 1996; Rizzolatti, Fadiga, Gallese, & Fogassi, 1996) — the neurons
that respond both when an action is performed and when it is seen — confirms the link between
the sender and the receiver that Liberman postulated (Meister, Wilson, Deblieck, Wu, & Iacoboni,
2007; Pulvermuller et al., 2006). In their study, Meister and colleagues (2007) proposed that the
listener perceives speech by simulating the articulatory gestures of the speaker. They applied
repetitive transcranial magnetic stimulation to the premotor cortex to disrupt participants’ ability
to perform a phonetic discrimination task and showed that such a disruption impairs speech
perception as well. Another study by Wilson, Saygin, Sereno, and Iacoboni, (2004) examined
whether passive listening of meaningless monosyllables activates the motor areas involved in
speech production. The researchers concluded that speech perception employs the motor system
in a process of auditory-to-articulatory mapping. Lastly, a recent study by Lüttke, Pérez-Bellido,
and de Lange (2018) on the rapid recalibration of speech perception after experiencing the McGurk
effect provides one more piece of evidence to support a strong connection between articulatory
gestures and auditory processing. The McGurk effect is a perceptual illusion that occurs when
conflicting auditory (/aba/) and visual (/aga/) inputs are presented together, which leads to a
different percept (/ada/). In Lüttke, Pérez-Bellido, and de Lange's study (2018), the ambiguous
visual input resulted in a subsequent recalibration of the phonetic boundaries and affected how the
syllable /aba/ was later categorized. Based on these and other recent findings, variability in L1
production due to individual articulatory constraints might lead to variability in L1 perception as
well. This connection is important for the present study that investigates the effects of individual
differences in L1 perception and how they influence non-native speech perception.

Chapter 3. Individual differences in L1 speech perception
40
3.3.2 Individual differences in cognition
Previous studies have identified that the process of transforming the auditory signal into accurate
phonological representations is modulated by higher-level cognitive processes, such as attention
and phonological short-term memory. For example, when attentional resources are reduced, as,
during a dual task when cognitive load is present, a detailed phonetic analysis is compromised
(Mattys & Wiget, 2011). On the other hand, engaging the attentional focus by intensifying the
signal improves perceptual sensitivity (Francis & Nusbaum, 2002). Conboy, Sommerville, and
Kuhl (2008) argue that attentional abilities support fine-tuning perceptual representations during
the first year of life. Contrarily, a pathological lack of attention can lead to developmental disorders
such as dyslexia, characterized by unstable and variant phonemic representations (Ruffino et al.,
2010). Thus, individual differences in attention control might lead to individual differences in L1
perception and affect the properties of phonological representations.
Not only paying attention but also inhibiting it (the cognitive ability called inhibitory control)
is an important ability for phonological acquisition. Lev-Ari and Peperkamp (2014) examined
whether there is a relationship between French speakers’ inhibitory control and their perception of
voiced stops in words that have a voicing neighbor. Inhibitory control might be responsible for
disengaging from a previous stimulus to process the rapidly successive one. This alternation
between engaging and disengaging attentional resources enables a listener to capture every single
stimulus of the acoustic signal. Deficiencies in this mechanism may result in impoverished sensory
analysis and lead to degraded phonological representations. Lev-Ari and Peperkamp (2014) found
that inhibitory control is responsible for enhanced perception. They also concluded that the type
of inhibition that the listeners in their study used relied on the domain-general and not language-
specific mechanisms, as demonstrated by the performance on the Simon task (the Simon task

Chapter 3. Individual differences in L1 speech perception
41
measures inhibitory control with visual stimuli). A growing number of neuroimaging studies also
confirmed the domain-general nature of the inhibitory control network that operates in speech
processing: it seems there are similarities between the cortical circuitries engaged in auditory and
visual attention switching. Ou and Law (2017) came to the same conclusion by investigating the
neural responses (event-related potentials or ERPs) to two Cantonese rising tones among typically
developed native speakers. They argued that it is the individual differences in domain-general
attention control that affect the quality of perceptual representations by regulating how listeners
encode and represent acoustic cues in the signal. Individuals with better attention control were
proposed to have more distinctive tonal representations, and vice versa: less optimal attention skills
led to less distinctive representations. These results are compatible with other studies that claim
that perceptual sensitivity to speech sounds is modulated by domain-general attention that is not
specific to language processing only (Diza, Baus, Escera, Costa, & Sebastián-Gallés, 2008; Jesse
& Janse, 2012).
Previous studies have demonstrated that phonological short-term memory also plays a role
in speech processing affecting the quality of phonological representations (Burgess & Hitch, 2005;
Gupta, 2003; Jacquemot & Scott, 2006: Majerus & Lorent, 2009). As we explained in Chapter 1,
phonological short-term memory consists of transient storage and an active subvocal rehearsal
component (Baddeley, 1986; Gathercole, 1999). The transient storage stores the most recent
auditory speech item in its sensory form, i.e., preserving its physical features. An active subvocal
rehearsal component refreshes and maintains the information derived from the signal for further
perceptual analysis and segmentation. Individual differences in phonological short-term memory
lead to variable ability to keep relevant information active in memory, and therefore, to decode it
accurately. Individuals with the greater phonological short-term memory capacity might be more

Chapter 3. Individual differences in L1 speech perception
42
successful in processing relevant cues in an acoustic signal, resulting in more precise
representations in comparison to individuals with the poorer phonological short-term memory
ability (Aliaga-Garcia, Mora, & Cerviño-Povedano, 2011). The relationship between phonological
short-term memory and speech processing is especially pronounced in situations where damage or
innate deficits in phonological short-term memory (as in Down syndrome or dyslexia) impair the
performance in the phonological analysis (Jacquemot, Dupoux, Odile, & Bachoud-Levi, 2006;
Jarrold, Thorn, & Stephens, 2009).
There are other less researched cognitive skills, such as information integration, cue
weighting, and cognitive processing styles, that might play a role in L1 perceptual variability
(Kong & Edwards, 2016; Yu, 2013). The studies that investigate these skills represent the growing
interest in a systematic heterogeneity among individuals in L1 perception. However, more research
is needed to make conclusive inferences based on these studies. Many open questions remain
unanswered. In their recent review of the studies on individual differences in L1 phonological
processing, Yu and Zellou (2018) concluded that “individual variability [in cognition] highlights
the fact that the shared linguistic system is more complex and adaptive than group-level means can
reveal” (p. 6.14). The study of the cognitive sources of individual variability not only allows us to
understand the fundamental mechanisms involved in native speech processing but also how these
mechanisms shape the perception of novel sounds. The present study aims at catalyzing more
research to address this question.
3.4 External factors that result in L1 variability
Inter-speaker variability in speech production and perception not only correlates with cognitive
and anatomical (internal) factors, but also with environmental and sociocultural (external) factors
Chapter 3. Individual differences in L1 speech perception
43
such as speaker gender (as a sociocultural construct), geographical origin, social class, and group
affiliation. Often, there is no clear division between a socially-constructed behavior (e.g., learned
patterns of phonetic realization that is characteristic of a particular gender: Lee, Hewlett, & Nairn,
1995) and biological differences (e.g., physical variability between speakers of different sexes:
Laver, 1980). At other times, variability is determined by social factors alone: e.g., rhotic accents
in the English indexing class (Wells, 1982).
From the exemplar-based perspective, sociophonetic variability in speech perception is the
result of continued exposure to a community of speakers with specific characteristics, which are
retained in the exemplars. Since no two individuals can possibly interact with identical populations
of speakers at all times, there is variability in the distribution of the remembered exemplars within
the cognitive space (Johnson, 1997). For example, depending on what kind of linguistic experience
an individual has undergone, there will be categories with a large or limited representation of
tokens. The time frame also matters since exemplars of newly stored experiences have a higher
activation level than exemplars of temporally remote experiences. The idiosyncratic inner
organization of categories plays a crucial role in the classification process of new tokens: the
labeling process not only depends on the similarity between a new token and a stored exemplar
but also on the activation strength of this exemplar. As perception and production rely on the same
pool of exemplars (Pierrehumbert, 2001), the most frequent and recent exemplar is then recovered
for production. This goes along with the research on adaptation processes in dialogue: for example,
Pickering and Garrod (2004, 2006) showed that patterns that are heard frequently and recently
guide the consequent production. Thus, speakers adapt and update their speech patterns as a
function of the social roles and contexts that they experience. In other words, individual language
experiences that are influenced by socio-environmental factors explain the inter-speaker variability
Chapter 3. Individual differences in L1 speech perception
44
in production and perception.
3.4.1 Regional dialects
Because of the challenges associated with experimental design and the indirect ethereal nature of
perception, sociophonetic variability in perception has been studied far less than in speech
production. Yet, a number of studies have investigated how individuals differ in this regard (e.g.,
Clopper & Pisoni, 2004; Evans & Iverson, 2004). Most commonly such studies are dialectal
variation experiments focusing on the description of dialects, attitudes towards dialects and the
perception of vowel mergers across dialects. In Clopper and Pisoni’s (2004) study listeners had to
categorize American English talkers by region. The results showed that perceptual similarity
between a speaker’s dialect and a listener’s dialect played a role in this task. A number of studies
on merged vowels also demonstrated perceptual biases in listeners of different dialects. Generally,
speakers of merged dialects (e.g., the pin-pen merger in the U.S.) struggle to discriminate between
the vowels of the target contrast (Bowie, 2001; Evans & Iverson, 2004). In Lengeris’ study (2016),
speakers of the standard variety of Greek and two regional dialects also showed dialect-induced
differences in the positioning of vowels in the perceptual space. In yet another study, Escudero,
Simon, and Mitterer (2012) examined the perception of native speakers of Dutch spoken in North
Holland (the Netherlands) and in East- and West-Flanders (Belgium) and found that the two
listener groups differed in how they classified non-native English /æ/ and /ɛ/. The North Holland
listeners classified the English /ɛ/ more accurately than /æ/, while the Flemish listeners had a 61%
correct classification for both vowels. Escudero, Simon, and Mitterer (2012) explained it by
dialectal variation in the acoustic properties of the Dutch /ɛ/ that leads to differences in perception
of non-native vowels. They argued that the exact acoustic vowel properties in L1 can predict how
vowels of a non-native variety will be perceived. The latter finding is highly relevant to our study:
Chapter 3. Individual differences in L1 speech perception
45
if native dialects influence second-language vowel perception then idiolects (individual dialects)
might lead to variable non-native perception as well.
3.4.2 Social network size
Even though phonetic learning early in life results in a relatively stable specialized sound
inventory, this does not mean that native categories cannot change once they are learned.
Systematic shifts in production — for the language community as a whole (Labov, 1994) and for
individual speakers (Pardo, Gibbons, Suppes, & Krauss, 2012) require adult listeners to adjust the
category boundaries and the internal structure of a phonetic category. In the perceptual learning
experiments done by Miller and colleagues, the listeners were able to shift the voicing boundary
(voice onset time or VOT) and relabeled the particular category exemplars as the “best” ones
(longer or shorter VOT) to accommodate speaker-specific phonetic detail, i.e. speaker differences
in VOT (Volaitis & Miller, 1992; Theodore & Miller, 2010). In Chang’s (2013) study novice L2
learners demonstrated systematic phonetic changes in their L1 production – the “phonetic shift” –
after just a short exposure to a novel sound system. From the literature on perceptual learning in
speech we also know that listeners can use lexical information to adjust the category boundaries
between individual speech sounds to include a new member into an established phonetic category
(e.g., Norris, McQueen, & Cutler, 2003; Sumner, 2011). Such learning is long-lasting (Eisner &
McQueen, 2006) and generalizes to novel utterances (Kraljic & Samuel, 2006; Hay, Drager &
Warren, 2010).
There is a sizable body of evidence that demonstrates that listeners constantly update their
priors to match environment-specific statistics: when the statistics of the environment change, so
do the representations (Jaeger & Snider, 2013; Chang, Dell, & Bock, 2006). In a series of studies,
Lev-Ari (2016, 2017, 2018) showed that listeners are not only sensitive to the raw frequency of a
Chapter 3. Individual differences in L1 speech perception
46
certain behavior, but also to the number of sources that exhibit it. She argues that the weight
ascribed to each source decreases with the increasing number of sources, i.e., the more sources we
have the less informative each of them is. People who have fewer interlocutors assign greater
weight to each person they encounter, and therefore, have more malleable phonological
representations. For example, individuals with small social networks are more likely to change
their perceptual boundary between /d/ and /t/ following exposure to a speaker with atypical
productions (Lev-Ari, 2017). Thus, social network size modulates how susceptible individuals are
to the influence of each interlocutor. This variable leads to fundamental differences in the
boundaries of phonetic categories between the listeners that live in urban areas (a larger social
network) and the listeners that reside in less populated locations (a smaller social network).
According to Lev-Ari, the latter group would be more flexible in altering the location of the
category boundary when confronted with a novel token. However, Theodore, Myers, and Loibao
(2015) observe that not any novel token would cause boundary adjustments. They presented their
participants with an unambiguous, well-defined category member and found that even though the
participants robustly reorganized the internal structure of their category (i.e., established a new
category prototype), they have not modified the category boundary. The authors concluded that
the nature of stimuli matters and listeners adjust the boundaries only when they have to resolve
ambiguity in the signal. Another explanation of why listeners might be overcautious in adjusting
their phonological representations is that such adjustments do not take place overnight. It is more
likely that longer exposure to a particular speaker or accent is needed for noticeable changes to
occur. For example, listeners from northern England in Evans and Iverson’s study (2004)
consistently used their native northern vowel categories when listening to SSBE (Standard
Southern British English), even though they received regular exposure to SSBE through the media.

Chapter 3. Individual differences in L1 speech perception
47
Their compatriots from the north, who had been living in London for one year and had been
exposed to SSBE for longer and more consistently, demonstrated a different pattern: they adjusted
their best exemplar locations to match the southern prototypes. The authors concluded that
although the adaptation to accent patterns does take place, it may require a longer experience with
the speakers of that accent. But once perceptual recalibration takes place, it seems to last (Eisner
& McQueen, 2006).
It is not only regional accents that influence native perception. Listeners adjust category
boundaries differently in response to male and female speech. Strand and Johnson (1996) asked
participants to identify tokens from a synthesized continuum between /ʃ/ and /s/. Participants were
more likely to have a higher perceptual boundary between the phonemes when the stimuli were
paired with a photograph of a female face. Speaker age is another factor that affects individual
perception. For example, participants in Drager’s (2005) study tended to shift a perceptual
boundary between /e/ and /æ/, when the voice sounded younger. In another study, Hay, Warren,
and Drager (2010) not only manipulated the speaker age, but her social status as well, and
concluded that social characteristics of a speaker can systematically influence the perception.
To summarize, recent research suggests that not only during the first year but also later in
life the listeners continue developing perceptual biases towards the acoustic properties of the
speech in their environment. The characteristics of the social network continuously influence the
nature of the input listeners receive, and consequently, their speech perception. The idiosyncratic
combination of factors such as L1 community demographics and density, geographical location
and perceiver’s social status, together contributes to a relatively stable perceptual idiolect that is
manifested in the preferences for specific sound prototypes (a higher density of exemplars in
particular areas within a category: Johnson, 1997; Pierrehumbert, 2001). Even though individual

Chapter 3. Individual differences in L1 speech perception
48
differences in native perception might be small — ultimately all listeners of the same L1
understand each other well most of the time — they might play an important role when a new
language has to be learned. From studies in language evolution we know that small individual
differences or weak biases should not be dismissed, as they might have an impact on the larger
timescale, i.e., they get amplified through multiple repetitions (bias amplification: Kirby,
Dowman, & Griffiths 2007; Dediu, 2011). In this regard we can refer to an individual’s L2 journey
as one person’s language evolution: small differences in native perception, not easily observable
in their “static” state, get amplified by the repeated language use creating robust emergent
patterning that affects non-native perception. Thus, small L1-based individual differences might
be a systematic source of variability in L2 perception and partially explain outstanding gains in L2
phonetics and phonology (i.e., phonetic talent).
3.5 The notion of compactness and its effects on L2
As we observed earlier, native inter-speaker variability has not been a prevalent topic within
language acquisition research. It has been assumed that native speakers have uniform performance
in L1 acquisition, which led to further claims about a critical period and the fundamental difference
between L1 and L2 acquisition (e.g., Andringa, 2014). However, a large body of evidence that has
accumulated in the past decade challenges the notion of a uniform native speaker competence. We
now know that native speakers vary considerably, even in the domain of phonology, which
depends on lower-level functions, forms early in life and, therefore, is harder to modify than other
linguistic subsystems (e.g., morphosyntax). This L1-based variability comes from the differences
in the quality and quantity of the input and in the ways it is processed — that it is, although not to
the same extent, triggered by the same factors as variability we observe in L2 acquisition.

Chapter 3. Individual differences in L1 speech perception
49
One way to measure L1-based differences in perception is to look at the distribution
(compactness) of tokens within a given perceptual category. A measure of category compactness
has been used before in production studies with vowels; it has been referred to as category
compactness (Kartushina & Frauenfelder, 2013, 2014), but also – the degree of variability of a
vowel (Recasens, & Espinosa, 2006, 2009) or the size of a vowel space (Meunier, Frenck-Mestre,
Lelekov-Boissard & Le Besnerais, 2003). For example, Kartushina and Frauenfelder (2013) define
compactness in production as “the amount of variation observed for the production of the same
sound by the same speaker” (p. 2119). They used the concept of compactness to describe the
distribution of the phonetic realizations for an L1 vowel and then related individual compactness
indices to the perceptual accuracy of similar L2 vowels. Their hypothesis stated that speakers with
broadly distributed categories were less successful at perceiving L2 vowels than speakers with
more compact categories. To obtain the category compactness index, Kartushina and Frauenfelder
(2013) collected and analyzed reading data, from which the vowels of interest were extracted and
the first two formants (F1 and F2) were measured for each participant. Using the formula for the
area of the ellipse A = xyπ (the distribution of the produced tokens was assumed to be elliptical),
where x was the F1 standard deviation and y was the F2 standard deviation, the authors were able
to visualize the acoustic space that corresponded to an individual’s compactness index (Figure 5).
The results of this study showed that L1 compactness in production predicts L2 perception of the
acoustically similar vowels. Kartushina and Frauenfelder (2013) emphasized the importance of
using individual rather than group data to account for differences in L1 phonological space.

Chapter 3. Individual differences in L1 speech perception
50
Figure 5. Group (on the left) and individual (on the right) mean formant values for Spanish /e/ in red and French /e, ɛ/ in blue in production (Kartushina & Frauenfelder, 2013, p. 2120).
In the follow-up study (Kartushina and Frauenfelder, 2014), the authors calculated the global
compactness index for all native vowels to predict L2 production performance. They found
significant effects of L1 compactness on L2 accuracy in production.
A similar study by Meunier, Frenck-Mestre, Lelekov-Boissard and Le Besnerais (2003)
focused on differences in category compactness between languages, not individuals and compared
the acoustic-articulatory spaces of French (10-12 vowels), English (13-15 vowels), and Spanish (5
vowels). They concluded that the Spanish and French spaces showed little to no overlap between
categories (tighter, more compact categories overall), whereas in English, certain vowel categories
were completely contained within the space of other vowels (see Figure 6). When faced with a
categorization task, in which the participants had to transcribe native and foreign vowels, the
English speakers struggled the most, unlike the Spanish and French speakers who did not find the
task difficult. The authors argued that the density of the L1 vowel system (and the size of phonetic
categories that depends on the density) may play a role in L2 perception.

Chapter 3. Individual differences in L1 speech perception
51
Figure 6. Vocalic spaces for Spanish, French and English languages (Meunier et al., 2003, p. 724-725).
The concept of category compactness in production can be used in perception as well. This
idea has been introduced in the DIVA model (Guenther, 1995; Guenther, Hampson, & Johnson,
1998). In this model, the goals for articulatory movements to produce specific vowels are regions
in multidimensional auditory-temporal space: the amount of separation among the regions for
different vowels and the region size determine the degree of clarity, with which a vowel is
perceived. According to DIVA, individuals whoso auditory regions for different vowels are
smaller and spaced further apart perceive greater acoustic details in comparison to individuals
whose auditory regions overlap. Perkell et al. (2004) used DIVA to test a link between native
production and perception within individual speakers. They concluded that a distinct and compact
production of similar contrastive vowels, such as [ɪ] and [i], predict accurate discrimination of
these vowels. In other words, compact categories in perception would result in compact categories
in production, and vice versa, since both types of categories rely on the same auditory goal regions.
Building on previous research, the present study aims to further explore the concept of
category compactness in L1 perception by measuring the distribution of a vowel category in the
psychoacoustic space. Using Kartushina and Frauenfelder’s (2013) definition for compactness in
production, we describe category compactness in perception as the amount of variation observed

Chapter 3. Individual differences in L1 speech perception
52
for the perception of the same sound by the same speaker. Because in our study we are avoiding
production measures altogether, we are obtaining a more direct representation of a perceptual
category that is not influenced by articulatory skills. To our knowledge, there is currently no report
in the literature of a preceding attempt to study category compactness in perception in its relation
to L2 phonological acquisition. We also hope to contribute to a growing body of research on L1-
based individual differences in perception that might not only explain so-called phonetic talent but
shed light on other puzzling perceptual phenomena such as speech perception deficits, when
information transmission of phonetic features is impaired.
3.6 Summary
In this chapter, we discussed individual differences in the same native language production and
perception (demonstrating that they are connected) and how they change during the lifespan. The
notion that variability in perception is the result of the interaction between the internal or "organic"
differences of an individual (such as the anatomy of articulatory apparatus and cognitive
functioning) and the external or "learned" factors (found in the environment) has been the
inspiration and the leitmotif of the present study. As an individual engages in communication, she
dynamically con-constructs her perceptual reality that changes constantly in response to an
individual's unique characteristics, but also in response to the emerging socio-cultural context. We
are aware of the fact that most likely individual differences in native perception are minimal –
otherwise, communicating in the same language would be no different from speaking different
languages to each other – yet, we believe that even small individual differences might play an
important role when a novel sound system is introduced. A number of studies already demonstrated
that individual differences in L1 production measured by the degree of compactness of phonetic

Chapter 3. Individual differences in L1 speech perception
53
categories influence the initial stage of L2 perceptual learning. The goal of the present study is to
test the same hypothesis for non-native perception.
3.7 Aims, research questions and hypotheses
This dissertation aims at investigating one aspect of non-native phonetic ability in perception,
specifically the ability to perceive the acoustic distance between two non-native sounds. In the
present study, we looked at how individual differences in native perception affect the degree of
perceived dissimilarity of a novel (L0) vowel contrast. We hypothesized that not only individuals’
various L1s contribute differently to the task of L0 perception, but also individuals with the same
L1 perceive novel sounds with a high degree of variability. The source of such variability is the
size of perceptual phonetic categories or category compactness that influences non-native
perception and can be assessed by relating the degree of compactness to the degree of perceived
dissimilarity of novel L0 contrasts. The following research questions were addressed:
1. To what extent do individuals with the same L1 vary in their perception as measured by the
category compactness of their phonetic categories?
2. To what extent does L1-based variability in category compactness influence the degree of
perceived dissimilarity between contrasting novel vowels?
We hypothesize that listeners with more compact phonetic categories will perceive the
acoustic distance between two contrasting L0 sounds better than listeners with less compact L1
categories (Figure 7).

Chapter 3. Individual differences in L1 speech perception
54
Figure 7. The compactness of L1 vowel categories (in blue) affects the perception of a novel contrast (in pink). The individual on the left is more likely to discriminate between Russian /i/ and /ɨ/ than an individual on the right.
In order to answer the research questions, we assessed participants’ ability to perceive a
distance between two L0 vowels and measured the size of their native vowel category. To take
into account the effects of cognitive skills on both L1 and L0 perception, we measured the
phonological short-term memory and acoustic memory capacities. Phonological short-term
memory has been consistently highlighted in the phonetic ability research and acoustic memory is
closely connected to it. We also collected participants’ personality measures and recorded their
linguistic background information. The next chapter will introduce the methodology and the tools
used.

55
Chapter 4 – Methodology
This chapter reports on the experiment investigating the relationship between the degree of
compactness of a native phonetic category in perception and perceived dissimilarity of an
unfamiliar (L0) contrast. The experiment design is summarized in Figure 8. The goal of the
experiment was threefold: first, to relate the measures of category compactness to the scores of an
L0 vowel perception task and to estimate the contribution of category compactness to variability
in perceived dissimilarity between two novel sounds; second, to explore the effects of acoustic and
phonological memory capacities, gender, age, the number of languages studied and spoken in the
family, and previous exposure to L0 on the degree of perceived dissimilarity of an L0 contrast;
and third, to examine whether individual differences in social network size and personality
contribute to L1 category compactness. There is no study in the literature to experimentally test
how native category compactness influences non-native perception, specifically, how naïve
listeners perceive the acoustic distance between two non-native contrasting vowels. Rather than
measuring category compactness in production, which has been done before for assessing
individual differences in L1 vowel compactness (e.g., Kartushina, & Frauenfelder, 2013), a
perceptual task using synthesized variants of a native category was employed – a goodness rating
task. In order to obtain representative data on how individuals define the size of their native vowel
category, twenty-eight variants of Spanish /i/ were used as perceptual stimuli. That way, it was
possible to evaluate the degree of category compactness for every individual, which was then
related to the measures of L0 perception. Before presenting the procedures, the decryption of every
task used will be provided.

Chapter 4. Methodology
56
Figure 8. Overview of the study design.
4.1 Collecting data with PsyToolkit and TurkPrime
The data collection was administered online to obtain a bigger sample size over a short period of
tim,. Online data collection also allowed us to connect to a specific population of participants,
which is the Spanish monolinguals from central Spain. Nowadays, it is a challenge to find
monolingual speakers in Europe, especially in bilingual Spanish-Catalan Barcelona and the
surrounding area. Because of these reasons, the decision to collect data online was made. The tools
that we used to accomplish this task and that are described below in detail were PsyToolkit and
TurkPrime.
4.1.1 PsyToolkit
PsyToolkit is a free web-based service designed for programming, running and analyzing

Chapter 4. Methodology
57
cognitive-psychological experiments and online surveys (Stoet, 2017). Based at the University of
Glasgow and supported by a grant from the Economic and Social Research Council (ESRC),
PsyToolkit allows online data collection, storage, analysis and retrieval (Figure 9). Once the
experiment is set up, the study’s URL is distributed among participants for online participation
and, after collection, the data is downloaded as a spreadsheet.
Figure 9. Example of the experiment’s script written in PsyToolkit.
4.1.2 TurkPrime
Although most behavioral researchers rely on undergraduate subject pools for their primary source
of research participants, this approach has a number of limitations, such as relatively small samples
and lack of representativeness (Henrich, Heine, & Norenzayan, 2010). TurkPrime is an Internet-
based research platform that facilitates the process of crowdsourcing data collection and is often
used as a participant recruitment tool in many disciplines in the social sciences (Litman, Robinson,
Abberbock, & Behav Res, 2017). TurkPrime uses proprietary algorithms to collect information
across time and to check for consistency. Participants who provide inconsistent information are
red-flagged and disqualified for taking part in studies. TurkPrime also uses cross-demographic

Chapter 4. Methodology
58
comparisons to validate the feasibility of online data collection approaches. Multiple data sources
are leveraged to provide a broad global network of respondents. By using digital fingerprinting
technology TurkPrime prevents duplicates within the same study or between studies and across
sample sources. To achieve sample representativeness, the sample demographics are matched to
the proportion that is reported in the latest census in terms of the distribution of gender, age,
ethnicity, region, and income.
TurkPrime participants are informed about available studies through a dashboard which
lists all studies for which participants are qualified. Respondents are given cash incentives
determined by supply/demand market forces. By using multiple attention-manipulation check
questions, TurkPrime ensures that the participants pay attention to the study’s details. Additionally,
participants who consistently pass attention-quality checks are given an overall higher rating,
which makes them eligible to take part in other studies. While this encourages high performance,
participants cannot complete any study more than once.
In this study, we used TurkPrime to target Spanish monolinguals located in Central Spain.
Before beginning, all participants were asked to provide critical information for the study, such as
proficiency in various L2 and familiarity with Russian to ensure that all participants were, in fact,
functional monolinguals (see definition below). Participants who did not provide consistent
responses to these questions were prevented from participating or excluded later on.
For the experiment, all participants reported using a personal laptop and a pair of
headphones. Participants were instructed to find a quiet room without distractions for one hour,
the approximate duration of the study. Before the experiment began, participants checked both
sound channels in their headphones and adjusted the sound appropriately.

Chapter 4. Methodology
59
4.2 Participants
4.2.1 Spanish participants
Of the 109 normal-hearing adults who took part, 91 completed all the tasks. A further 23
participants were excluded from the data analysis either because they did not fit the study’s criteria,
i.e. they were highly proficient in foreign languages, were not born in Spain, or had studied Russian
before, or because of abnormal data: unrealistic completion time (the experiment was finished in
less than 30 minutes) or deviant scores (e.g., unrealistic reaction times, zero scores).
The remaining 68 participants were European Spanish functional monolinguals without
any prior knowledge of Russian. According to Best and Tyler (2007), functional monolinguals are
those who were raised in monolingual homes without learning another language prior to attending
school. They have only a basic knowledge of English acquired at school (i.e., basic grammar
instruction), have not resided in an English-speaking country for more than a month, and use only
Spanish in their daily lives. All participants were screened for knowledge of languages other than
Spanish, by being presented with the appropriate warning and the questions (Appendix C). Eleven
participants reported being unable to speak any foreign language at the intermediate level of
proficiency. Fifty-seven participants reported basic knowledge of English that did not surpass the
intermediate level. Other languages that the participants indicated they were “familiar with”
included (here in the alphabetic order): Basque, Catalan, French, Galician, Italian and Valencian.
One participant mentioned studying German and Japanese briefly long ago, and another reported
a “very rudimentary” knowledge of Romanian.
Table 1. Characteristics of the Spanish participants.
Measure N M SD Min Max

Chapter 4. Methodology
60
Age 68 41 11 19 62*
Number of L2s studied 68 1 1 0 5
Number of L2s spoken in the family 68 1 1 0 3
* It was assumed that all participants were normal-hearing adults as they have been qualified by TurkPrime for experiments that involve listening.
4.2.2 Russian participants
The study also recruited a group of 16 native speakers of Russian to provide baseline data for the
L0 rated dissimilarity task that used the Russian vowels as stimuli. Recruited and screened online,
with the help of several social networks, principally Facebook, participants were informed about
the study’s purpose, experimental procedures, risks, and benefits. The volunteers gave oral consent
and were asked to fill in an anonymous linguistic background questionnaire, which was used to
control for language backgrounds, such as Russian-speaking parents, place of birth, residence, and
exposure to and use of other languages (see Appendix A). The participants were not paid. The data
from the Russian speakers (male = 6, female = 10, Mage = 24.2, range = 18-33) were further
analyzed and compared to the Spanish speakers’ performance.
4.3 Instruments
4.3.1 Questionnaire with the Big Five Inventory
To collect demographic and language history information a questionnaire was administered. The
questionnaire contained questions about demographic information, social network size, and
proficiency in various languages among family members (Appendix C). In addition, the
questionnaire included a brief test to evaluate five personality features: extraversion vs.
introversion, agreeableness vs. antagonism, conscientiousness vs. lack of direction, neuroticism
vs. emotional stability, openness vs. closedness to experience. The study used a short version of
Chapter 4. Methodology
61
the Spanish version of the NEO Five-Factor Inventory (FFI) (Costa & McCrae, 1992), a self-
reported measure of personality based on the Five-Factor Model, which was translated from the
original American NEO-FFI scale (Rodriguez-Fornells, Lorenzo-Seva, & Andres-Puevo, 2001).
This version contained 15 statements, each to be rated on a 5-point scale from “strongly agree” to
“strongly disagree”. The information was analyzed with respect to the data collected from other
tasks in the study.
4.3.2 Serial nonword recognition task
To measure phonological short-term memory, a serial nonword recognition task was used.
Phonological short-term memory is one of the domain-specific subsystems of working memory
responsible for processing verbal material (Baddeley, 1998). It comprises the phonological store,
which holds information for about two seconds, and the phonological loop, which refreshes
decaying information over time by an articulatory rehearsal process. The phonological short-term
memory capacity has a limited span, which can be measured by the serial recall: numbers or words.
In this experiment, phonological short-term memory was assessed through a serial nonword
recognition task following the procedure described in Cerviño-Povedano and Mora (2011). The
only difference between theirs and this study is that we used Spanish nonwords instead of Catalan
nonwords. Compared to nonword repetition, a serial nonword recognition task is a better measure
of the phonological short-term memory capacity since the articulatory constraints are avoided
(Cerviño-Povedano & Mora, 2011; Cerviño-Povedano & Mora, 2015).
Participants heard 24 pairs of nonword sequences blocked by item length. There were three
blocks with five-, six- and seven-item sequences presented to the participants in this order
(Appendix D). Each block consisted of eight trails presented randomly: four identical sequence
pairs (e.g., NW1, NW2, NW3, NW4, NW5 – NW1, NW2, NW3, NW4, NW5) and four different

Chapter 4. Methodology
62
sequence pairs (e.g. NW1, NW2, NW3, NW4, NW5 – NW1, NW3, NW2, NW4, NW5). The inter-
stimulus interval between the nonwords within a trial was 300 ms; the inter-stimulus interval
between the trials was 100 ms.
The nonwords were developed using Syllabarium, an online application for deriving
complete statistics for Spanish syllables (Duñabeitia, Cholin, Corral, Perea, & Carreiras, 2010).
The Syllabarium corpora are based on the Spanish B-PAL (Davis & Perea, 2005) and composed
of 31491 words in their lemmatized form. Only the CVC syllables of high frequency were selected
(equal to or greater than 1000 on the frequency index). The selected 160 syllables were recorded
by a native female speaker of European Spanish as a part of a carrier sentence “Yo digo _ / Yo
digo _ una vez”. The recorded CVC nonwords were extracted from the sentences and processed
in Praat1 (Boersma & Weenink, 2013) to normalize for peak amplitude (70dB) and to remove low-
frequency noise. The nonword duration values were normalized with respect to length, which was
determined by taking the average length of all nonword stimuli (650 ms). The best tokens were
selected on the basis of auditory judgments and acoustic measurements. Every trial contained a
variety of vowels and consonantal contexts.
Example of the same sequence:
bul tad som fes sil
bul tad som fes sil
Example of a different sequence (the 3rd and the 4th nonwords are switched):
bul tad som fes sil
bul tad fes som sil
1 Software that scientifically analyzes speech in phonetics.

Chapter 4. Methodology
63
Participants were asked to listen to the pairs of sequences and after each trial decide whether the
order of the nonwords in the sequences was the same or different. In this task, a weighted score
was obtained by assigning five, six and seven points to the correct responses of five-, six- and
seven-item sequences with a maximum score of 144 points.
4.3.3 Target sound recognition task
To test acoustic short-term memory, which we defined as the ability to process and store the
acoustic properties of speech stimuli at the pre-phonological level, we used a target sound
recognition task (Li, Cowan, & Saults, 2013; Safranova & Mora, 2012). In this task, participants
have to judge if a target speech-like sound is a member of the previously heard sequence or not.
The stimuli consisted of 101 Spanish CV syllables (Appendix E) recorded in the same
manner as the nonwords in the serial nonword recognition task (see above). The CV syllables were
manipulated through frequency rotation (speech rotation: Scott, Rosen, Beaman, Davis, & Wise
2009) and varied in length from 180 ms to 240 ms. This technique preserves the acoustic
complexity of the stimuli while making it impossible to encode phonologically.
The stimuli were presented in three blocks of two-, three- and four-item sequences. Each
sequence was followed by 3000 ms silence and a target sound afterward, which could be the same
or different from the sequence items (Figure 10). Each block contained eight trials in a randomized
order. The participants were asked to listen to each sequence and the following sound and judge
whether or not the target sound was included in the previously presented sequence.
A weighted score was computed by assigning scores of two, three and four points to the
correct responses of two-, three- and four-item sequences, respectively, with a maximum score of
72 points.

Chapter 4. Methodology
64
Figure 10. Sample trials of “yes” (same) and “no” (different) two-item sequences in the target sound recognition task.
4.3.4 Rated dissimilarity task
A rated dissimilarity task was designed to assess the degree of perceived dissimilarity between two
contrasting vowels in a novel contrast. A rated dissimilarity task has been widely used in previous
non-native speech research (Flege, Munro, & Fox, 1994; Cebrian, Mora, & Aliaga-Garcia, 2011).
In this task, participants have to decide if two sounds are the same or different and if different – to
assess the difference on a rating scale.
The vowel contrast that we used in a rated dissimilarity task was Russian /i - ɨ/. In addition,
the following distractors were randomly included in the task: /a - i/, /o - a/, /i - e/, /e - o/, /a - u/, /ɨ
- e/, /o - u/, /u - ɨ /. Two female and two male native speakers of the Central Russian dialect from
Moscow recorded the target vowel contrasts in a /bVt/ context as part of a carrier sentence “Я
сказал(а) _ / Я сказал(а) _ опять”. The stimuli were digitally recorded (Praat and Edirol UA-25
USB Audio Capture device) in a soundproof booth at a sampling rate of 44.1 kHz with a 16-bit
resolution on a mono channel in the Phonetics Laboratory at the University of Barcelona. The
selected tokens were extracted from the sentences and processed using Praat to normalize for pitch

Chapter 4. Methodology
65
and amplitude. The word-final /t/ release burst was removed, and the offset of the spliced portion
occurred when the amplitude of the vowel waveform began to decrement with the exact cut at a
zero crossing. The original duration values of the tokens were preserved to make vowels sound as
natural as possible and ranged from 310-370 ms. The best tokens per speaker were selected on the
basis of auditory judgments and acoustic measurements. Each sound category was represented by
at least five tokens to encourage participants to respond in a general rather than in a token-specific
manner.
The stimuli were organized into trials where each token A and B within a pair were spoken
by the same or different individual(s) and presented with an inter-stimulus interval of 700 ms.
Participants were tested on their ability to detect acoustic differences between the tokens. To avoid
presentation order effects due to perceptual asymmetry such peripherality (the distance between
sounds is perceived better when a less peripheral vowel goes first; Polka & Bohn, 1996) and
nativeness (the distance between sounds is perceived better when a native or a native-like sound
goes first; Ettlinger & Johnson, 2010), the token order within a pair was counterbalanced. The four
test blocks consisted of eight change (/i - ɨ/ or /ɨ - i/) and eight no-change (/i - i/) trials in a
randomized order per block; eight distractor trials were randomly included in each block, with the
total number of tokens equal to ninety-six.
Participants were told that they would hear two vowels that might (or might not) sound
familiar and that their task was to decide whether the vowels sounded the same or not. Participants
were asked to assess the difference between two vowels by marking the degree of mismatch on an
intuitive rating scale (Jilka, 2009): the representation of the difference between two sounds
corresponded to the least-to-most intensity of the red color (Figure 11).

Chapter 4. Methodology
66
Figure 11. An intuitive rating scale (reproduced from Jilka, 2009).
Participants were instructed to respond by clicking a mouse or a touch panel alongside the
scale and given 3000 ms to respond. The next trial came immediately after the response or after
3000 ms if no response was given. To familiarize participants with the procedure, the task started
with a four-trial practice block with no visual feedback provided. The experiment began after the
participants had completed the practice block.
For computational purposes, the intuitive scale used in this task was divided into ten
segments, with 1 indicating “similar” and 10 – “different”. Thus, an average numerical response
from 1-10 to the target contrast /i - ɨ/ (or /ɨ - i) was calculated for every individual. For example, a
score of 1 would represent a poorly perceived distance between the contrasting sounds (/i - ɨ/
appear to sound the same) and the score of 10 would represent a perfectly perceived distance (/i -
ɨ/ appear to sound different).
4.3.5 Goodness rating task
To map the perceptual space underlying the native Spanish vowel /i/ in each participant, we
employed a goodness rating task. In this task, the perceptual stimuli varied in quantifiable steps to
examine how listeners differ in the way they define the size or compactness of their native
category. The task was developed to measure the number and the distance of the variants labeled
by participants as good exemplars of /i/.
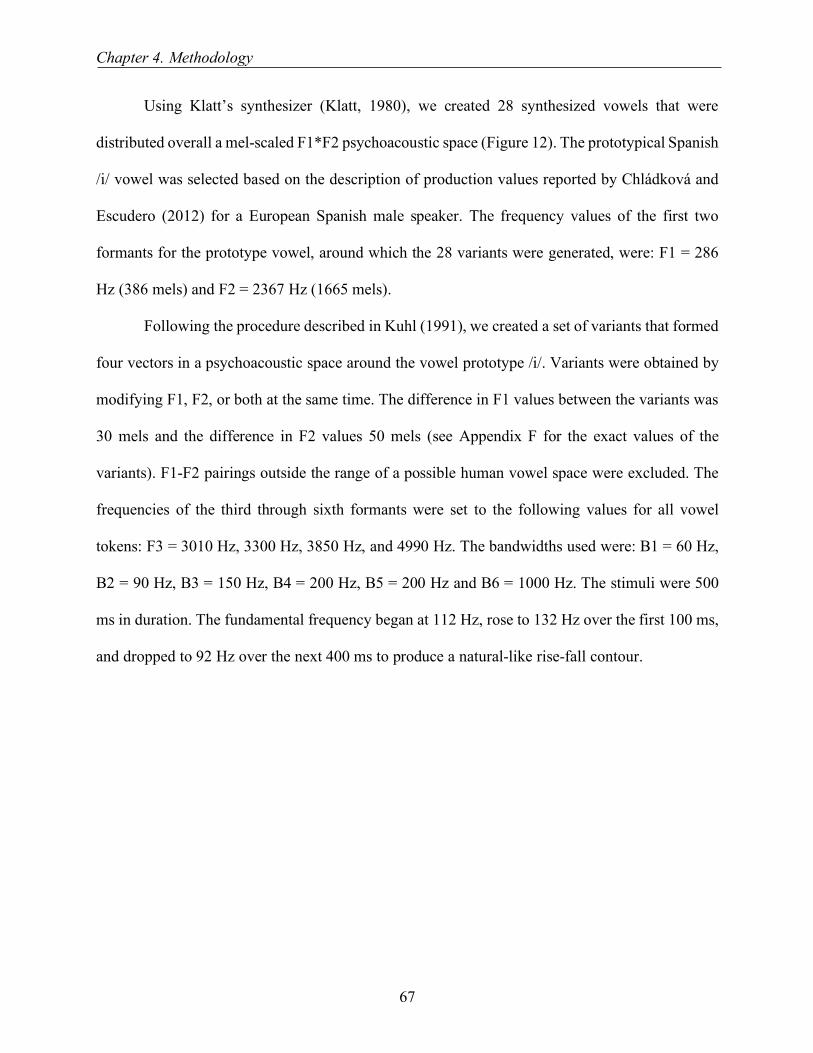
Chapter 4. Methodology
67
Using Klatt’s synthesizer (Klatt, 1980), we created 28 synthesized vowels that were
distributed overall a mel-scaled F1*F2 psychoacoustic space (Figure 12). The prototypical Spanish
/i/ vowel was selected based on the description of production values reported by Chládková and
Escudero (2012) for a European Spanish male speaker. The frequency values of the first two
formants for the prototype vowel, around which the 28 variants were generated, were: F1 = 286
Hz (386 mels) and F2 = 2367 Hz (1665 mels).
Following the procedure described in Kuhl (1991), we created a set of variants that formed
four vectors in a psychoacoustic space around the vowel prototype /i/. Variants were obtained by
modifying F1, F2, or both at the same time. The difference in F1 values between the variants was
30 mels and the difference in F2 values 50 mels (see Appendix F for the exact values of the
variants). F1-F2 pairings outside the range of a possible human vowel space were excluded. The
frequencies of the third through sixth formants were set to the following values for all vowel
tokens: F3 = 3010 Hz, 3300 Hz, 3850 Hz, and 4990 Hz. The bandwidths used were: B1 = 60 Hz,
B2 = 90 Hz, B3 = 150 Hz, B4 = 200 Hz, B5 = 200 Hz and B6 = 1000 Hz. The stimuli were 500
ms in duration. The fundamental frequency began at 112 Hz, rose to 132 Hz over the first 100 ms,
and dropped to 92 Hz over the next 400 ms to produce a natural-like rise-fall contour.

Chapter 4. Methodology
68
Figure 12. The 28 synthesized vowels that are distributed overall a mel-scaled F1*F2 psychoacoustic space with a prototype /i/ in the center.
The participants were presented with one variant at a time and had to decide how well it
matched their native /i/ category. They were asked to rate each variant by marking the degree of
mismatch between the variant and /i/ on an intuitive rating scale (Figure 11): the left edge of the
scale (“Similar”) was associated with a good exemplar of their inner category /i/ and the right edge
of the scale (“Diferente”) signified a poor exemplar. Participants were instructed to estimate the
goodness of fit between the variant they heard and their own internal representation of /i/ as in the
Spanish word “sin” (without). No reference for a good exemplar of the Spanish vowel /i/ was
provided. We encouraged the participants not to limit themselves to the two extreme ends of the
scale and to use the intermediate values when appropriate. To ensure task reliability each
participant had to rate each variant four times for a total number of 112 trials. i.e., four blocks of

Chapter 4. Methodology
69
28 trials presented randomly. This optimal number of blocks was determined during the piloting
stage of the study: the tedious nature of the task prevented many participants to complete it if the
number of blocks exceeded four. The practice block was also presented at the beginning of the
task and consisted of four trials.
To calculate the compactness index of the Spanish vowel /i/ for each individual, we
followed several steps. First, we counted the number of variants consistently selected as good
exemplars of a native category, with the rating goodness greater than 5 (since the intuitive scale
had 10 divisions, we selected the median value). The maximum number of variants to select was
28, which included all possible variants of /i/. We only counted the variants that were selected as
good exemplars consistently, i.e. out of the four times the variant was presented, it was rated higher
than 5 at least three times. Otherwise, we assumed the rating was not reliable (e.g., a participant
rated a variant as a good exemplar of /i/ only on one or two occasions) and did not count that
variant. Such calculating procedure was necessary because of the nature of the task: perceptual
judgments (particularly when collected online) tend to fluctuate. Ensuring that the variant was
rated as a good exemplar of a native category consistently would make this task more reliable.
Thus, at this step, the compactness index of 6 would indicate a rather compact phonetic category;
i.e., fewer variants are selected as good exemplars of this category (Figure 13). On the other hand,
the compactness index of 15 would signify a large/less compact phonetic category; i.e., more
variants are selected as good exemplars of /i/.

Chapter 4. Methodology
70
Figure 13. First step in calculating compactness: Participant A has a less compact category (15 variants) than Participant B (6 variants).
The next step in calculating the compactness index was to assign different values to the
variants based on their distance from the prototypical /i/. This step was necessary to account for
the situations when fewer variants selected further from the center. For example, because a
participant selected only 6 variants, her phonetic category can be defined as compact. However, if
these variants are far from the prototypical /i/, such category cannot be counted as compact. To
take this structural layer into consideration, each variant was assigned a value from 10 to 50 based
on how many steps away it was located from the prototype (Figure 14). In this way, the final
weighted score that represented the compactness index was the sum of the values of the selected
variants added, with the maximum score equal to 690 (calculated as follows:
8*10+8*20+6*30+3*40+3*50=690). In our previous example (Figure 13), the participant A

Chapter 4. Methodology
71
would have the compactness index equal to 210 (calculated as follows: 8*10+5*20+1*30=210)
and the participant B – 50 (calculated as follows: 5*10=50).
Figure 14. Each variant has a different value from 10 to 50 based on its distance from the prototypical Spanish /i/.
Another concern in calculating the compactness index was the shape of a phonetic
category: a category elongated along one dimension — e.g., along F1 — could affect the
perception of a non-native contrast with particular acoustic characteristics. However, as we were
processing the data, none of the participants demonstrated a category that would be large in
diameter alongside only one dimension, as often observed in production. Participants tended to
have perceptual categories shaped as a more or less balanced sphere (Figure 15).

Chapter 4. Methodology
72
Figure 15. The shape of the native category /i/ did not vary much from individual to individual (subject 4 and 11 here) and resembled a sphere.
4.4 General procedure
All participants were informed about the main purpose of the research, procedures, and risks as
well as its potential benefits. They voluntarily agreed to participate, signed a consent form
(Appendix B) and received monetary compensation for their participation (except for the Russian
participants who were not compensated for their participation, since they only took part in the rated
dissimilarity task). First, all participants were asked to fill in a questionnaire about their
demographics (Appendix C). This was followed by a short version of the Big Five Inventory (BFI)
that measures personality according to five factors or dimensions (Goldberg, 1993). Third, the
participants were asked to perform two speech perceptions tasks: a rated dissimilarity task that
assessed their ability to discriminate between contrasting L0 sounds and a goodness-of-fit task, in
which they judged if a synthesized variant was a close approximant of their native vowel. Finally,
participants performed a battery of cognitive tasks measuring phonological short-term memory
and acoustic short-term memory. All participants reported having no speech or hearing disorders;

Chapter 4. Methodology
73
as well as screened for normal hearing by TurkPrime. Data from 68 participants (male = 39, female
= 27, Mage = 41 years, range = 19-65 years, SD = 11) were considered valid in the statistical
analyses.
The experimental design consisted of a single testing session conducted in Spanish on the
same day to promote the activation of a single language. The testing session’s estimated duration
was one hour. After a short screening session to confirm proficiency in one language only —
Spanish — the participants were briefed on the study’s purpose and procedure. Following this,
each participant received a URL to the experiment’s website on PsyToolkit platform. On entering
the website, participants were taken to an information sheet and informed-consent screens. They
were also required to declare the type/model of technology/device they were using to perform the
tasks with headphones and computer models. Participants were not allowed to use mobile phones
to complete the experiment. Before beginning the audio portion of the experiment, participants
were prompted to check the sounds in the right and the left channels of their headphones to ensure
that the volume was at a comfortable level. After a short survey to collect demographics and
language history, participants had to complete the Big Five Inventory. Two memory and two
perception tasks with multiple opportunities to take breaks followed as depicted in Figure 8. At
the end of the experiment, each participant received an automatically-generated individual code
that they used to received compensation.

74
Chapter 5 – Results
This chapter provides a description of the data analysis and reports the results obtained regarding
the relationship between individual differences in L1 perception, specifically, the compactness
index of a native phonetic category /i/, and the degree of perceived dissimilarity between two novel
contrasting sounds /i/ and /ɨ/. In addition, in order to control for factors that in previous research
have been identified as strong predictors of non-native perceptual sensitivity, i.e., phonological
short-term memory, acoustic short-term memory, and personality, we analyzed the relationship
between these variables and the perceived dissimilarity rating scores. At last, we explored the
relationships between the measure of category compactness and social network size.
The first section of the chapter (5.1) is devoted to exploratory analysis: the descriptive
statistics for each task and checking the distribution of the main variables. In the second section
(5.2), we examine the rated dissimilarity task in greater detail: we check if the task measures the
degree of perceived dissimilarity between Russian /i/ and /ɨ/, as anticipated, and we compare the
resulting dissimilarity scores to the baseline data, i.e., to the scores obtained by Russian speakers
on the same task. The contribution of the factors such as gender, age, exposure to Russian, the
number of foreign languages studied, and previous formal phonetic training are reported in section
5.3. In the following section (5.4), we focus on the contribution of phonological short-term
memory and acoustic short-term memory to the degree of perceived dissimilarity. Using a series
of correlation and regression analyses we first check whether the memory tasks used in this study
worked as anticipated and then explore the relationships between phonological and acoustic
memory and perceived dissimilarity. Section 5.5 presents the results of the L1 perception task that

Chapter 5. Results
75
we used to obtain a measure of participants’ /i/ category compactness and describes how these
measures relate to memory and social network size. The last section (5.6) introduces the analysis
regarding the key question of the study: the effects of category compactness on the degree of
perceived dissimilarity between the two Russian vowels. The research questions are answered and
the predicted hypotheses are verified by reporting the results of a series of regression analyses. We
used linear mixed-effects models where appropriate to better account for the distribution of the
dependent variable, in particular, for the issue of non-independent observations characterized by
grouping (repeated measurements within subjects and within items), which often leads to increased
type I errors, i.e., erroneous significant results (Hurlbert, 1984; Baayen, Davidson, & Bates, 2008).
All statistical analyses were performed using RStudio 0.99.486. An alpha level of .05 was
used as a significance criterion in the present study.
5.1 Overview of the data
As described in Chapter 4, all participants had to complete a survey and the Big Five Inventory,
followed by two memory and two perception tasks. The descriptive statistics across all four tasks
are summarized in Table 2, with the measures of central tendency (mean and median) specifying
the values that tend to be the most typical and the measures of dispersion (minimum, maximum
and standard deviation or SD) showing how variable the data are.

Chapter 5. Results
76
Table 2. Summary of performance across all tasks.
Task Scoring
(max)
n min max mean median SD (IQR)
Serial Nonword Recognition
Task
144 68 22.00
137.00
86.65 84.50
24.07
(30.5)
Target Sound Recognition
Task
72 68 16.00 72.00 54.24 54.00 10.54
(14.25)
Rated Dissimilarity Task 10 68 4.69 9.94
8.39
8.80
1.26
(1.52)
Goodness Rating Task 690 68 80.00 560.00 313.51 305.00 100.37
(145)
Visual inspection of the distribution of scores for each variable (Figure 16) revealed that
the phonological short-term memory scores and the category compactness scores were distributed
normally. The distribution of the acoustic memory scores had a slight negative skew (-0.73), i.e.,
there were several extremely low scores. Further examination with the help of a box plot showed
a single outlier that was preserved since the departure from normality was not severe (the Shapiro-
Wilk test: W = 0.96, p = .03). Since the Shapiro-Wilk test is influenced by the sample size, i.e., if
the number of observations is high there is a bigger chance to detect deviations from normality,
hereinafter we relied on the quantile-quantile plot examination in determining normality
(Levshina, 2015). Another variable that did not form a normal distribution was perceived
dissimilarity: the deviation from normality was severe: W = 0.90, p < .001. The negative skew of
-1.01 reflected the fact that most of the participants nearly excelled in discriminating between L0

Chapter 5. Results
77
sounds /i/ and /ɨ/ on the rated dissimilarity task. The two outlier scores detected with the help of a
box plot equated to 4.69 and 5.19 (10 was a maximum score on this task) and were preserved since
they did not represent a sampling or coding error. After a reverse logarithmic transformation
(log10(K + 1 - X), where K is the highest value of the variable X, the perceived dissimilarity scores
appeared significantly normal (W = 0.97, p = .102). Since applying non-linear data transformation
is a controversial issue in statistics (Field, Miles, & Field, 2012; Coupé, 2018), in the final section
of this chapter we supplemented ordinary linear regression analysis with the use of the generalized
linear regression to confirm our findings. The generalized linear regression allows a response
variable to have an error distribution other than normal.
Figure 16. Histograms and quantile-quantile plots of phonological memory, acoustic memory, perceived dissimilarity and category compactness respectively.

Chapter 5. Results
78
5.2 Perceived dissimilarity between Russian /i/ and /ɨ/ and
rated dissimilarity task
Our study investigated individual differences in naïve perception of a non-native contrast. In order
to measure the degree of perceived dissimilarity between L0 Russian /i/ and /ɨ/, we used a rated
dissimilarity task. As we described in Chapter 4, in this task participants had to assess the
difference between Russian /i/ and /ɨ/ by marking the degree of mismatch on an intuitive rating
scale. During statistical analysis, for computational purposes, the intuitive scale was divided into
ten equal sectors with 1 representing poorly perceived acoustic distance and 10 representing
perfectly perceived acoustic distance . For each participant, we calculated an average response
value across all instances of the contrast /i - ɨ/. As was mentioned earlier, participants obtained
unexpectedly high dissimilarity rating scores for the Russian /i - ɨ/ contrast with a mean of 8.39
(min = 4.69, max = 9.94, SD = 1.26). It must be noted that the complexity of this task was increased
twice during the piloting stage of the study: at first, the inter-stimulus interval between the two
vowels was raised from the 300 ms to 700 ms; second, both male and female speakers were used
to voice the two vowels within a contrast. Yet, even after these manipulations, during the real
study, the majority of the participants showed a high level of accuracy in the perception of the non-
native contrast /i-/ɨ/. The ceiling effect could be explained by the fact that the participants did not
have to handle the contextual complexity that accompanies speech processing in real life:
background noise, coarticulation, speaker’s variability, etc. That being said, when compared to the
Russian participants, the Spanish listeners were considerably outperformed (Figure 17): the
difference between the two groups was significant, as confirmed by an independent one-tailed
version of the Wilcoxon test: W = 923, p < .001. Thus, even though the Spanish participants
demonstrated unexpectedly high perceived dissimilarity ratings, the Russian controls obtained

Chapter 5. Results
79
significantly higher dissimilarity ratings than the experimental Spanish participants (median =
9.86, SD = 0.57).
Figure 17. The Russian participants obtained significantly higher perceived dissimilarity ratings for /i - ɨ/ than the Spanish participants.
Further examination of the rated dissimilarity task scores showed that overall the task
assessed the degree of perceived dissimilarity between contrasting L0 sounds as expected.
Participants were consistent in measuring perceived dissimilarity between Russian /i/ and /ɨ/ across
multiple instances of this contrast with the average intra-speaker variation of 1.81 points. The type
of the contrast (same vs. different) functioned in an intended manner: participants responded to the
same contrast /i - i/ in a significantly different way, when compared to their responses to a different
contrast /i - ɨ/ as (the Wilcoxon signed-rank test: W = 21572, p < .001). The differences between
the female and male start (which speaker, a man or a woman, voiced the first vowel in the contrast)
did not affect participants’ responses (W = 5248.5, p = .10). According to previous research,

Chapter 5. Results
80
peripherality (Polka & Bohn, 1996) and nativeness (Ettlinger & Johnson, 2010) could cause certain
asymmetries in vowel perception facilitating the discrimination of a vowel change presented in
one direction, but not another: from the less peripheral vowel to the more peripheral vowel and
from a native vowel to a non-native vowel. We did not find such presentation ordering effects in
our study: the participants’ responses were not affected by which vowel came first in the contrast
— more peripheral native-like /i/ or less peripheral non-native /ɨ/ (W = 5346.5, p = .47). There was
also a significant difference between participants’ response to /i - ɨ/ contrast and the distractor
contrasts /a - i/, /o - a/, /i - e/, /e - o/, /a - u/, /ɨ - e/, /o - u/, and /u - ɨ / – the distance between two
members of a distractor contrast was perceived as larger than the distance between /i/ and /ɨ/ (the
Wilcoxon signed-rank test: W = 673, p < .01).
5.3 Biographical factors and their contribution to perception
of a non-native contrast
To measure the contribution of factors related to participants’ biographical information to the
perceived dissimilarity between Russian /i/ and /ɨ/ obtained through the dissimilarity rating task
we performed a standard multiple regression analysis between the dependent variable (the
logarithmically transformed Perceived Dissimilarity scores) and the independent variables:
Gender, Age, foreign languages experience (L2 Experience), presence of the foreign languages
spoken in the family (Family L2s), Exposure to Russian and Phonetic Training. Assumptions were
tested by examining normal probability plots of residuals and scatter diagrams of residuals versus
predicted residuals. No violation of normality, linearity, or homoscedasticity of residuals was
detected. The variables were not related to each other; the variance inflation factor (VIF-scores)
for each predictor did not exceed 5. In addition, the box plots revealed no evidence of outliers.

Chapter 5. Results
81
Regression analysis indicated that none of the factors contribute to Perceived Dissimilarity at the
significant level, F(6, 61) = 1.26, p = .29. R² for the model was 0.11, and the adjusted R² was 0.023.
Table 3 displays the unstandardized regression coefficients (B), standard error (SE), standardized
regression coefficients (b) and p-value for each variable.
Table 3. Standard multiple regression predicting Perceived Dissimilarity from biographical data.
Predictor B SE b p
Gender 0.03 0.05 0.08 .54
Age -0.001 0.003 -0.05 .71
L2 Experience -0.10 0.07 -0.19 .18
Family L2s -0.05 0.06 -0.12 .38
Exposure to Russian 0.07 0.06 0.13 .30
Phonetic Training 0.004 0.06 0.01 .94
Even though previous L2 Experience did not contribute to the Perceived Dissimilarity
scores at a significant level (p = .71), the predictor was close to significance. When true
monolinguals (the participants who reported not studying any foreign languages in the past) were
compared to functional monolinguals (the participants who reported studying one to five foreign
languages in the past without achieving the intermediate level of proficiency), an independent two-
tailed Wilcoxon test revealed significant differences between the groups (W = 193, p = .04). Figure
18 shows that the experience of studying foreign languages in the past influenced Perceived
Dissimilarity negatively. We will come back to this seemingly counterintuitive finding in the
Discussion chapter.

Chapter 5. Results
82
Figure 18. True monolinguals obtained higher Perceived Dissimilarity scores in comparison to functional monolinguals.
5.4 Phonological and acoustic memory capacities
Previous research has shown that the phonological short-term memory capacity and acoustic
memory capacity play an important role in non-native speech perception. The two tasks that we
developed to measure these types of memory were a serial nonword recognition task and a target
sound recognition task respectively. In Chapter 4 we explained that both tasks consisted of three
consequent blocks with each block using longer sequences than the previous one. The expectations
were that participants will experience greater difficulty as they progress from block one to block
two and to block three. To ensure that it was the case and that the tasks worked as expected, we
fitted a series of mixed-effects models with Accuracy scores as a dependent variable and Subject
(a random effect) and Sequence Length (a fixed effect) as predictors. In the phonological short-

Chapter 5. Results
83
term memory task, the increasing Sequence Length lowered Accuracy by 7.6 points when the
length increased from the five-word sequences to the six-word sequences and by 10.7 points when
the length increased from the six-word sequences to the seven-word sequences. When compared
to the null model (without the effect in question, i.e., Sequence Length) with the likelihood ratio
test, the result revealed a significant effect of Sequence Length (χ2(5)=13.72, p = .001). In the case
of acoustic memory, Sequence Length affected Accuracy significantly as well ((χ2(5)=11.62, p <
.001) lowering Accuracy by 6.4 points when Sequence Length increased from the two-word
sequences to the three-word sequences and by 3.7 points when Sequence Length increased from
the three-word sequences to the four-word sequences. Also, in the acoustic memory task, the length
of individual sounds (rotated CV syllables) within the sequence had no effect on participants’
performance, as confirmed by (a simple linear regression with sound length as a predictor (p =
.92). These results suggest that the increased Sequence Length placed demands on the participants’
phonological short-term memory and acoustic memory capacities and the tasks assessed these
cognitive skills as expected. No violation of normality, linearity, or homoscedasticity of residuals
was detected.
In order to explore the relationships between phonological short-term memory and acoustic
memory and the degree of perceived dissimilarity, we fitted a series of mixed-effects models to
the data. The preliminary correlational analysis suggested that there was no significant relationship
between the two types of memory (Pearson's r = 0.008, p = .95).
In the first step, we fitted a mixed-effects model with logarithmically transformed
Perceived Dissimilarity as a dependent variable and Phonological Short-term Memory as an
independent variable (fixed effects), as well two random-effects to allow for by-Subject and by-
Item adjustments to the intercept. The effect of Phonological Short-Term Memory did not reach

Chapter 5. Results
84
significance (p = .16). We included Acoustic Memory as a second fixed effect in the consequent
step and it significantly improved the fit (χ2(1) = 6.40, p = .01) boosting Perceived Dissimilarity
by about 0.04 points (or -0.005 points – unlogged value). Taking Phonological Short-term Memory
out of the model did not affect the fit significantly (χ2(1) = 2.16, p = .14), from which we concluded
that it is Acoustic Memory and not Phonological Short-Term Memory that influenced participants’
performance on the rated dissimilarity task. The model that consisted of Acoustic Memory alone
as a fixed effect confirmed this assumption (B = -0.005, p = .01). For this model, the visual tests
of the assumptions showed some deviation from normality, but it was not severe (Figure 19).
Figure 19. The distribution of residuals in the model with Acoustic Memory as a fixed effect and Subject and Item as random effects.
5.5 The measure of category compactness
To map the perceptual space underlying the native Spanish category /i/ in each participant, we
used a goodness rating task, in which participants rated 28 synthesized variants of /i/ four times in
terms of variants’ distance from a prototypical Spanish /i/. The variants that were rated as good

Chapter 5. Results
85
exemplars (higher than 5) at least three times formed a perceptual category /i/ for each participant:
the more variants a participant rated as good exemplars, the larger her perceptual category was.
Because the variants were located at an unequal distance from the prototypical /i/, they were also
assigned values from 10 to 50 based on their distance from the prototype (Figure 20). Thus, the
compactness index represented the weighted score of all variants selected as good exemplars, with
the maximum of 690.
Figure 20. Each variant has a different value from 10 to 50 based on its distance from the prototype.
The resulting scores from the goodness rating task formed a normal distribution as
confirmed by the Shapiro-Wilk test (W = 0.99, p = .59) with a slight positive skew (0.05) and no
extreme values as detected by the box plot. Figure 6 shows that the histogram for the compactness
scores resembled a bimodal distribution, yet, Hartigans’ dip test confirmed unimodality (D = 0.04,

Chapter 5. Results
86
p = .42). Participants on average varied in their compactness index by 100.37 points with the
maximum result of 560 and the minimum of 80 (Table 2).
Since each participant responded four times to each variant, we collected four sets of
responses that we used to calculate intra-rater (intra-subject reliability). We used Cohen’s kappa
statistics for this purpose since it is suitable for calculating both inter- and intra-rater reliability
and can be used with more than two raters or datasets (sometimes also called Fleiss’ kappa:
Falotico, & Quatto, 2015). The average Cohen’s kappa across 90 participants who completed the
rated dissimilarity task was 0.37 (SD = 0.16), which is very close to Cohen’s suggested
interpretation that a score of 0.4 might be acceptable. Considering the nature of the test
(perception) and the study design (online data collection) we concluded that in general participants
were responding to the stimuli consistently. Another way to ensure that the task worked
appropriately was to look at the average response rate per variant: we would expect lower scores
to be assigned to the variants located closer to the prototype (similar to /i/) and higher scores — to
the variants located further from the prototype (different from /i/). That was indeed the case: the
variants further away from the referent vowel were perceived as less similar. Figure 21 shows that
participants demonstrated remarkable perceptual sensitivity when judging each variant’s distance
from its prototype: when checked with a help of a simple linear regression, the effect of distance
was highly significant (R² = 0.58, p < .001). Participants were more sensitive to the differences in
F1 (the average perceptual distance between the variants was 0.67 point, SD = 0.56) than to the
differences in F2 (the average perceptual distance between the variants was 0.51 point, SD = 0.46).
As expected, when both formants were manipulated, the distance between the variants was
perceived as the greatest (the average perceptual distance between the variants alongside the
diagonal vectors was 0.74 point, SD = 0.58).

Chapter 5. Results
87
Figure 21. The size of the circles signifies the perceived psychoacoustic distance of a given variant from a prototypical /i/, with smaller circles indicating smaller distance (perceived as a good exemplar of /i/).
In Chapter 3 we identified several internal and external factors potentially responsible for
individual differences in native perception, with phonological short-term memory and social
network size (i.e., how many people a person communicates to on a weekly basis) leading the list.
To explore the effects of these variables on category compactness, we fitted a linear model with
Compactness as a dependent variable and Phonological Short-Term Memory and Social Network
Size as predictors. Visual inspection of residual plots did not reveal any severe deviations from the
assumptions of normality, linearity, and homoscedasticity. Although Phonological Short-Term

Chapter 5. Results
88
Memory did not reach the significance level, the correlation between Phonological Short-Term
Memory and Compactness was negative (r = - 0.06, p = .61) pointing to a directional pattern we
expected: participants with the greater phonological short-term memory capacity tended to have
more compact categories (Figure 22). Yet, we have to acknowledge that no meaningful
conclusions can be made based on such a low coefficient and insignificant p. On the other hand,
Social Network Size affected Compactness significantly (R² = 0.17, p = .008) lowering it by about
68 points when participants reported a medium size network (5 to 10 people) and by about 93
points when participants reported a small size network (1 to 5 people). Since Social Network Size
is a categorical variable, a large size network served as the base level, to which the medium and
small size network scores were compared.
Figure 22. The smaller social network size is, the more compact the native category.

Chapter 5. Results
89
This finding seems to go along with the results of Lev-Ari’s study (2017) that examined whether
having increased input variability (a larger network) effects native speech perception. She found
that when the input comes from a large network, learners form larger categories and vice versa.
We will discuss these findings further in the following chapter.
L2 experience did not contribute to Compactness at the significant level ((R² = 0.031, p =
.15), but the direction of the trend was intriguing, with true monolinguals tended to have slightly
more compact categories in comparison to functional monolinguals (Figure 23).
Figure 23. Functional monolinguals have on average larger categories than true monolinguals.

Chapter 5. Results
90
5.6 The relationships between perceived dissimilarity in L0
and compactness of a native category
From the previous section, in which the measure of category compactness was statistically
analyzed, we know that the compactness index varied across individuals. To assess the effects of
this variability on the degree of perceived dissimilarity between contrasting L0 sounds (Russian
/i/ and /ɨ/), we fitted a series of mixed-effects models (Table 4; Appendix G). Before fitting the
models to the data, we inspected quantile-quantile plots for each subject that demonstrated log-
transformed perceived dissimilarity scores from the rated dissimilarity task (Figure 24). Recall that
because we used the reverse score transformation to correct a negative skew, the interpretation of
the variable is reversed: big scores have become small and small scores have become big (Field,
Miles, & Field, 2012).

Chapter 5. Results
91
Figure 24. Quantile-quantile plots for the logarithmically transformed perceived dissimilarity scores in a rated dissimilarity task grouped by subject.
As can be seen in Figure 24, most of the score sets have thick right tails indicating outliers,
which were preserved since none of them were suspect for experimental reasons. In fact,
considering the online mode of data collection, we would expect a higher degree of intra-subject
variability, i.e., how consistently each participant was performing on the rated dissimilarity task.
The average standard deviation on the rated dissimilarity task was 1.81 points. Removing data
points with more than two or three standard deviations away from the mean would imply
unnecessary and unjustified data trimming (Baayen, 2008). Another way to address intra-subject
variability would be to remove the participants with the greatest standard deviation values. Two
of such participants, number 6 (SD = 4.28) and 56 (SD = 3.95), were identified and removed. This
alteration did not improve the fit of the following regression model, thus, for the more ecological
approach, the original number of data points was used.
We began our analysis by examining the effect of the main variable of interest —
Compactness, on Perceived Dissimilarity. Figure 25 shows a negative linear relationship between
Compactness and Perceived Dissimilarity (untransformed scores here): as the size of a category
increases, the ability to perceive dissimilarity between two contrasting L0 sounds decreases.

Chapter 5. Results
92
Figure 25. The relationships between Compactness and Perceived Dissimilarity (untransformed scores).
A mixed-effects model with Compactness as a fixed effect and Subject and Item as random
effects showed that Compactness affected Perceived Dissimilarity at a border significance level
(χ2(5) = 3.84, p = .05), decreasing it by about 0.003 points (or 0.0004446 points – unlogged value;
Appendix G, Table 11). When we allowed the slope of the effect of Compactness to vary across
subjects, the model did not improve: it seemed that all subjects were influenced by this measure in
a similar way (χ2(7) = 0.83, p = .66).
In the previous section, we reported significant relationships between Compactness and
Social Network Size: participants with a smaller network tended to have more compact categories.
To test if the effect of Compactness might be different for participants with different network sizes
we included Social Network Size as a predictor, together with an interaction of Social Network Size
by Compactness (Appendix G, Table 12). The interaction of Social Network Size by Compactness

Chapter 5. Results
93
did not come significant meaning that the effect of Compactness did not vary across small, medium
and large network groups: all groups showed the same pattern of the relationship between
Compactness and Perceived Dissimilarity. However, the effect of Social Network Size alone (when
the interaction term was taken from the model; Appendix G, Table 13) came close to significance:
participants with a small network tended to cope better with a novel vowel contrast than
participants with a large network (p = .06) (Figure 26).
Figure 26. Participants with a small social network have higher Perceived Dissimilarity ratings in comparison to participants with a medium or a large network.
Recall that L2 Experience came close to significance when we used standard multiple
regression analysis with Perceived Dissimilarity as a dependent variable. In subsequent analysis,
the difference between true monolinguals and functional monolinguals was significant when
measured with an independent two-tailed Wilcoxon test (W = 193, p = .04). However, in

Chapter 5. Results
94
combination with Compactness there was no effect of L2 Experience as another fixed effect in our
model (χ2(7) = 2.79, p = .25; Appendix G, Table 14). Even though L2 Experience did not seem to
show a direct significant effect on Compactness, L2 Experience might influence Compactness
indirectly: Compactness could be the link connecting Perceived Dissimilarity with L2 Experience.
We observed that true monolinguals tend to have more compact categories, which might explain
their superior performance on a rated dissimilarity task that measured Perceived Dissimilarity. The
opposite could be also true: functional monolinguals tend to have larger L1 categories, and this
interferes with their ability to differentiate a novel contrast.
The interaction term between Compactness and L2 Experience did not show significance
(χ2(9) = 3.56, p = .47; Appendix G, Table 15). Another interaction term introduced in the model
was between L2 Experience and Social Network Size (Appendix G, Table 16). This time, true
monolinguals with a medium social network significantly outperformed functional monolinguals
with the same network size: p = .02 (Figure 27). It seems that having no previous language-learning
experience benefited the participants with a medium network size by enhancing their non-native
perception significantly. There was no difference between true monolinguals and functional
monolinguals with large and small social networks. One explanation is that an unsystematic and
brief exposure to a highly variant input (a larger network of interlocutors and superficial
familiarity with foreign languages) results in larger categories, i.e., categories that are
“contaminated” with a greater number of variants. Large categories make it more difficult to
identify a new token as a member of a new category. Unfortunately, in our study, we only had 11
true monolinguals and 57 functional monolinguals, which makes a fair comparison less reliable
statistically.
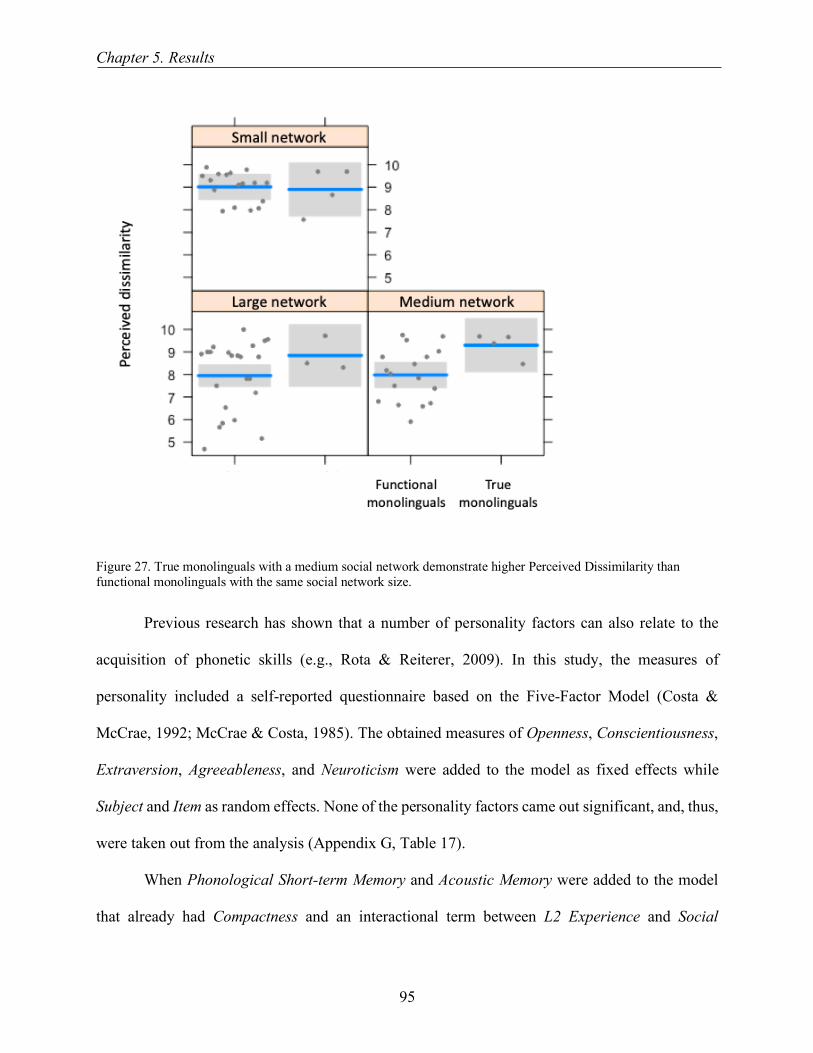
Chapter 5. Results
95
Figure 27. True monolinguals with a medium social network demonstrate higher Perceived Dissimilarity than functional monolinguals with the same social network size.
Previous research has shown that a number of personality factors can also relate to the
acquisition of phonetic skills (e.g., Rota & Reiterer, 2009). In this study, the measures of
personality included a self-reported questionnaire based on the Five-Factor Model (Costa &
McCrae, 1992; McCrae & Costa, 1985). The obtained measures of Openness, Conscientiousness,
Extraversion, Agreeableness, and Neuroticism were added to the model as fixed effects while
Subject and Item as random effects. None of the personality factors came out significant, and, thus,
were taken out from the analysis (Appendix G, Table 17).
When Phonological Short-term Memory and Acoustic Memory were added to the model
that already had Compactness and an interactional term between L2 Experience and Social

Chapter 5. Results
96
Network Size, the model improved significantly (χ2(15) = 10.12, p = .006; Appendix G, Table 18).
Significant effects were obtained for Acoustic Memory (b = 0.04 or unlogged - 0.0057, p = .006),
but not for Phonological Short-term Memory (b = -0.003 or unlogged 0.0011, p = .26). The
interaction between Acoustic Memory and Compactness reached moderate significance (p = .063;
Appendix G, Table 19) indicating that the effect of Compactness tended to vary depending on the
acoustic memory capacity: participants with the lower acoustic memory capacity relied heavily on
the size of their native category to differentiate between L0 sounds /i/ and /ɨ/, whereas participants
with the greater acoustic memory capacity were not affected by Compactness (Figure 28).
Figure 28. Participants with poorer acoustic memory relied on compactness to differentiate between /i/ and /ɨ/, whereas participants with greater acoustic memory were not affected by compactness and “used” acoustic memory instead.
Thus, our most successful model that explained the variance in Perceived Dissimilarity
included two interaction terms: between Compactness and Acoustic Memory and between L2
Experience and Social Network Size.

Chapter 5. Results
97
Table 4. Regression models with Perceived Dissimilarity as a dependent variable.
Regression model
Predictors: Fixed effects + (1|Random effect)
1 Compactness + (1|Subject) + (1|Item)
2 Compactness + Social Network Size + Compactness*Social Network Size + (1|Subject) + (1|Item)
3 Compactness + Social Network Size + (1|Subject) + (1|Item)
4 Compactness + L2 Experience (1|Subject) + (1|Item)
5 Compactness + L2 Experience + Compactness *L2 Experience + (1|Subject) + (1|Item)
6 Compactness + L2 Experience* Social Network Size + (1|Subject) + (1|Item)
7 Openness + Conscientiousness + Extraversion + Agreeableness + Neuroticism + (1|Subject) + (1|Item)
8 Compactness + L2 Experience* Social Network Size + Phonological Sort-term Memory + Acoustic Memory + (1|Subject) + (1|Item)
9 Compactness*Acoustic Memory + L2 Experience* Social Network Size + (1|Subject) + (1|Item)
*interaction
Lastly, we checked whether including random effects — Subject and Item — was justified
by comparing the final model with the model without random effects. Both random effects had a
significant contribution to make to the model (p < .001). In fact, this linguistically uninteresting
model with Subject and Item as the only predictors captured 99% of the variance in Perceived
Dissimilarity. The fixed predictors only explained 1% of the overall variance. This is often the
case when the fixed-effects structure of the models is used: most of the variance is typically
accounted for by the variability among subjects and items (Baayen, 2008).

Chapter 5. Results
98
Even though the final model rendered the best characteristics in terms of AIC, BIC and p-
values, the inspection of the residuals showed that there was strong heteroscedasticity of the
residuals and a visually clear, although moderate, departure from normality. Even though mixed-
effects models are robust to a certain degree of non-normality (Coupé, 2018), the conclusions from
the final model should be reported with caution. To confirm if the same predictors would remain
significant, we used a beta regression model, a type of a generalized linear regression that does not
assume normality and linearity of residuals. This model also works well for a rating scale as a
dependent variable, as it is in our case, and does not require a logarithmic transformation of a
dependent variable, which remains a controversial issue in the field (Field, Miles, & Field, 2012;
Coupé, 2018). However, in order to use beta regression, the dependent variable must vary between
0 and 1 with no observation equal to zero an/or one. Thus, first, we had to create a proportional
variable of Perceived Dissimilarity, and, then, we used two interaction terms for the formula: 1)
Compactness and Acoustic memory, and 2) L2 Experience and Social Network Size. Compactness
alone and the Compactness and Acoustic memory interaction came significant with pseudo-R²
equal to 0.32 (Table 5). Thus, we were able to confirm the main finding, i.e., the role of category
compactness in perceived dissimilarity of a novel contrast. We provide interpretation and further
discussion of our findings in the following chapter.
Table 5. Results for the beta regression model with proportional Perceived Dissimilarity as a dependent variable.
Predictor B SE p
Intercept -4.491 0.02301 0.0002
Compactness -0.0001588 0.00006482 0.0143*
Acoustic Memory -0.0006156 0.0004079 0.1313

Chapter 5. Results
99
Social Network Size: Medium -0.001352 0.003239 0.6765
Social Network Size: Small 0.006435 0.003334 0.0536
L2 Experience: No 0.006495 0.005938 0.2741
Compactness*Acoustic Memory 0.000002691 0.000001175 0.0220*
Social Network Size: Medium* L2 Experience:
No
0.005559 0.007962 0.4851
Social Network Size: Small* L2 Experience:
No
-0.006637 0.007967 0.4048

100
Chapter 6 – Discussion
6.1 Individual differences in non-native perception
In the past decades, exceptional L2 phonetic performance has been investigated from a number of
different angles, showing significant correlations with cognitive skills, musicality, personality,
motivation, and L1 background. The reason is evident: assuming comparable learning conditions,
adult learners vary greatly in their ability to acquire foreign sound systems. In this dissertation, we
investigated non-native perception, in particular — the ability to distinguish between novel sounds,
and how individuals differ in this regard. Our results showed that some individuals are more
successful than others when dealing with sound contrasts that do not occur in their native language.
Even though the majority of the Spanish participants in our study demonstrated high accuracy in
differentiating between Russian /i/ and /ɨ/, their performance differed significantly from Russian
speakers’ performance on the same task. The observed difference between the Spanish and Russian
participants suggests that the Spanish participants’ perception was influenced by the differences
between their native phonological system and that of Russian. This goes along with previous L2
speech perception research that predicts difficulties in perception when the sound inventory in L1
and L2 are very different (Best & Tyler, 2007; Flege, 1995; van Leussen & Escudero, 2015). The
Spanish participants also showed significantly lower perceived dissimilarity of the novel /i - ɨ/
contrast in comparison to the Russian distractor contrasts in the task: /a - i/, /o - a/, /i - e/, /e - o/,
/a - u/, /ɨ - e/, /o - u/, /u - ɨ /. It is not simply the absence of /ɨ/ that caused Spanish listeners to
struggle with /i - ɨ/ contrast on the rated dissimilarity task, it is the proximity of /ɨ/ to /i/. Both
Russian vowels occupy more or less the same perceptual space where Spanish has a single category
Chapter 6. Discussion
101
/i/.
The rated dissimilarity task to assess participants’ perception of an L0 phonological
contrast was designed to tap the pre-phonological level of speech perception since our Spanish
participants did not have an established phonetic category for either Russian /i/ or /ɨ/. Despite the
lack of these phonemes in their L1, some participants perceived /i/ or /ɨ as distinct sounds (reflected
by the greater perceived dissimilarity ratings) and some participants perceived little or no acoustic
distance between /i/ and /ɨ/. To investigate such inter-individual variability, first, we looked at the
information about participants’ gender, age, foreign language experience, the number of foreign
languages spoken in a family, exposure to Russian, and formal training in phonetics. In the present
study, among the factors listed above, only foreign language experience moderately related to the
measure of L0 perception, affecting it negatively: the more languages an individual learned in the
past, the poorer was her ability to perceive dissimilarity between two non-native vowels. Notice,
that all participants were considered to be monolinguals since none of them reported speaking a
foreign language at a level higher than intermediate. Yet, the difference in L0 perception between
the true monolinguals (individuals who reported speaking no foreign languages) and the functional
monolinguals (individuals who had studied foreign languages before but reported not being able
to hold a conversation in any of them) was significant: true monolinguals were more successful at
distinguishing between Russian /i/ and /ɨ/ than functional monolinguals. This significant difference
points to a seemingly counterintuitive assumption: having previous exposure to foreign languages
does not result in better non-native perception. Studies that have investigated the effects of
previous language experience on non-native phonological awareness, i.e., explicit and implicit
knowledge about the sound structure of the language (also known as phonological sensitivity:
Cunningham & Carroll, 2015; Kivistö de Souza, 2015) that might result in enhanced non-native

Chapter 6. Discussion
102
perceptual sensitivity, have shown mixed results. Previous L2 experience does not always
guarantee enhanced non-native perception (Kennedy, 2012; Kennedy & Trofimovich, 2010;
Venkatagiri & Levis, 2007). The amount of language exposure necessary to develop non-native
phonological awareness might be important in this regard. Shoemaker (2014) compared third-year
English majors with first-year English majors — the number of years showed significant effects
on L2 phonological awareness. It should be noted that the studies mentioned above investigated
the effects of L2 exposure on phonological awareness in the same L2, i.e., language-specific
phonological awareness (e.g., exposure to English influencing phonological awareness in English).
In our case, the participants with prior L2 experience in various L2s were exposed to a novel vowel
contrast in a language they have never studied before. Thus, the situation resembles that of L3
acquisition, rather than L2 acquisition. Studies on the effects of L2 experience in L3 perception
report that general experience in learning a foreign language gives a global advantage in
phonological perception (Chang, 2013), even though previously acquired languages create more
opportunities for linguistic interference (Onishi, 2016; Wrembel, 2010). It would be reasonable to
expect the learning of foreign languages have equipped our functional monolinguals with
improved phonological awareness and/or perception — yet, our study did not provide supporting
evidence for this. A certain level of L2 proficiency might be necessary for previous language
learning to have a beneficial effect on further (L3) perceptual learning.
We would like to suggest the following interpretation of the finding discussed above. The
previous L2 learning experience of functional monolinguals might have enlarged their native
perceptual categories. Since the functional monolinguals on our study never continued learning
their L2s and, thus, never reached a proficiency level higher than intermediate, the process of
category split (the division of a single native category that handles both instances of a non-native

Chapter 6. Discussion
103
contrast into two new categories; Mayr & Escudero, 2010) never took place leaving our functional
monolinguals with slightly larger native categories. In other words, their previous L2 experience
resulted in the “looser” or less compact native category /i/, which included more “deviant” variants
of /i/ (more various allophones of /i/), than the same category of the true monolinguals who had
no previous experience with other languages and, thus, preserved more compact categories (Figure
29). According to exemplar theory (Pierrehumbert, 2001), variability is essential for defining
category boundaries and size, e.g., which tokens are not /i/. It is critical for a learner to hear a
variety of exemplars in order to define the psychoacoustic space occupied by a particular phonetic
category. Limited input in a foreign language might be responsible for including too many
noncontrastive (or perceived as noncontrastive) variants into a native category, which might
impede the processing of other novel sounds. Lev-Ari’s (2017) computational simulations also
offer some insights into the mechanisms underlying the effects of limited L2 proficiency on initial
perceptual learning. She demonstrates that at the onset of L2 acquisition learners fail to attend to
relevant acoustic dimensions, this hinders the acquisition of novel phonetic categories. At the
early stage of learning, there is a tendency towards forming large categories, each comprised of
several non-native categories, and only later, with an increased amount of input, large categories
may be split into two or several smaller categories. Thus, the amount and quality of input matter
when novel phonetic categories are formed. In this sense, although somewhat counterintuitively,
when compared to functional monolinguals, true monolinguals enjoy a perceptual advantage for
distinguishing a novel contrast since their native categories have not been “contaminated” with
irrelevant variants.

Chapter 6. Discussion
104
Figure 29. At the initial stage, the learning of multiple L2s “contaminates” a native phonetic category with non-native variants (B). As learning progresses further, these variants are grouped and identified as a new category (C).
Following this logic, we would expect a significant difference between true monolinguals
and functional monolinguals in terms of category compactness: true monolinguals should have
significantly more compact categories than functional monolinguals. Even though such a trend
was detected in the present study, it has not reached significance. Since the effect of previous L2
experience on category compactness was not the focus of this study, we did not target specific
populations of participants in this regard, i.e., a balanced group of functional and true
monolinguals. Therefore, we only had 11 true monolinguals, which made the comparison to
functional monolinguals (57 participants) a statistically challenging task. Besides, considering how
much exposure to English through the Internet and media the speakers of other languages have
nowadays, recruiting true monolinguals might be a hopeless task. Yet, we are intrigued about the
trend towards less compact native categories as a function of limited L2 learning. Understanding

Chapter 6. Discussion
105
how a native sound system is affected by L2 phonetic and phonological acquisition at different
stages of the process is of great theoretical and practical importance.
6.2 Cognitive and personality factors
Recent research has shown that phonological short-term memory and acoustic memory contribute
to listeners’ success in perceiving acoustic differences between novel sounds. In the present study,
we did not find a connection between phonological short-term memory and acoustic memory
indicating that they are autonomous concepts that contribute to non-native perception
independently from each other. Our results confirmed a significant effect of acoustic memory, but
not phonological short-term memory on Spanish listeners’ degree of perceived distance between
Russian (L0) /i/ and /ɨ/, more specifically listeners obtaining higher scores in the acoustic memory
task were found to perceive a larger perceptual distance between the target vowels. This finding
points to the fact that, when perceiving the distance between novel /i/ and /ɨ/, the participants relied
on their ability to detect a physical (auditory) difference between a pair of stimuli, rather than
judging the two sounds as instances of different categories. Acoustic memory supports a perceptual
system in encoding acoustic detail at the pre-categorical level when it is necessary to recognize
differences between the sounds which are not two instances of two distinctive categories. Since
none of our participants were familiar with Russian, their vowel inventory lacked a phonetic
category /ɨ/, which made it difficult to distinguish between /ɨ/ and /i/ based on the category-relevant
dimensions. It comes as no surprise that the participants used auditory-based judgments, rather
than judgments based on the comparison of the phonetic codes. If they had more experience with
Russian, they might have employed phonological short-term memory to the same extent as
acoustic memory, if not greater.

Chapter 6. Discussion
106
The facilitating effect of acoustic memory on the degree of perceived dissimilarity was not
the same for all participants. The interaction between acoustic memory and compactness found in
our study suggested that there were two fundamentally different perceptual patterns involved.
Whereas participants with greater acoustic memory were barely influenced by the effects of
compactness, participants with poorer acoustic memory relied heavily on category compactness in
discriminating between two novel sounds. Since perceptual compactness is a relatively new
concept, the interplay between memory and compactness has not been researched thoroughly yet.
Thus, we can only hypothesize that there could be a number of specific compensatory perceptual
patterns that individuals employ in order to reach optimal perception. It is quite likely that having
a deficiency in one cognitive structure that supports perception, e.g., reduced acoustic memory
storage, a listener has to rely on another structure, e.g., category compactness, in order to reach a
better perceptual resolution. A similar idea of two compensatory strategies for linguistic processing
was proposed by Skehan (1998) within his cognitive theory of L2 learning. He suggested that there
are two populations of learners, memory-oriented and analysis-oriented. According to this
classification, high memory learners do not use a complex analytic system to make a hypothesis
about a new language, rather they store a wide range of linguistic exemplars in their memory
systems to be used later on. On the other end of Skehan’s scale are analytical learners that regularly
engage in structuring and systematization of incoming linguistic stimuli to fit it into an abstract
model. Kormos (1999) supported Skehan’s theory explaining it by finite attentional resources
being allocated to the task: some learners pay more attention to storing the input and some learners
– to analyzing and monitoring it. That could be the case with our participants as well: listeners
with greater acoustic memory benefit from storing larger chunks of acoustic input and processing
it for longer, thus, achieving better non-native perception irrelevantly of the size of their native

Chapter 6. Discussion
107
categories. In our study, there was no connection between the degree of perceived dissimilarity
and compactness for the group of listeners with greater acoustic memory capacity. In other words,
the performance of the greater acoustic memory group in the rated dissimilarity task was not
affected by compactness of their native category /i/. On the other hand, the group of listeners with
the poorer acoustic memory capacity was significantly affected by compactness when trying to
discriminate between L0 sounds. In Skehan’s terminology, this group of listeners would belong to
the analysis-oriented (as opposed to memory-oriented) listeners that have to employ analytical
skills (as oppose to memory capacity) to process novel linguistic stimuli. Since we have not
measured analytical skills in our study, it is hard to draw a connection between the analytical skills
and increased category compactness. We can hypothesize that listeners with poorer acoustic
memory might have superior analytic skills (as Skehan describes) that help them to identify a novel
variant more efficiently, which leads to more compact native categories. Guenther (1995)
suggested that compact categories in perception might be the result of an increased rejection rate
for poorly produced sound tokens of a phoneme. It could be that more analytical listeners are
striker judges when evaluating new variants of their native phonemes and, thus, they reject more
tokens as a result.
We did not observe a relationship between L0 perception and personality. One explanation
for such results is that it is hard to find an appropriate level of analysis for both constructs
(Furnham, 1990; Dörnyei, 2014). The multiplicity of theories in the field of personality and the
complexity of selecting the appropriate measurements and instruments make interpretation of the
findings a dubious undertaking (Dörnyei, 2014, 2010). In our study, due to testing time limitations,
we used the short version of the Spanish NEO Five-Factor Inventory (FFI) (Costa & McCrae,
1992), a self-reported measure of personality based on the Five-Factor Model. Even though Lang,

Chapter 6. Discussion
108
John, Lüdtke, Schupp, and Wagner (2011) suggested strong robustness of a 15-item inventory in
all modalities, for future studies, we would suggest employing the full version of the FFI inventory
and, if the time permits, more than one instrument to capture the personality traits accurately.
Another explanation for the insignificant effects of personality on perception could be the level of
linguistic analysis that we used in this study. Previous research has suggested connections between
personality and pronunciation (Guiora, 1979; Hu & Reiterer, 2009), fluency (Dewaele & Furnham,
1999), communication competence (Verhoeven & Vermeer, 2002), listening, speaking (MacIntyre
& Gardner, 1991), and foreign-language academic achievement (Onwuegbuzie, Bailey & Daley,
2000). However, in our study, we measured the ability to perceive an acoustic distance between
two novel sounds, which is a low-level processing mechanism that might not be connected to
personality in its classical depositional sense (the trait and type approach: Costa & McCrae, 1992).
If we have defined the construct of personality through the biological standpoint that bases all
psychological phenomena in the neural-biological systems (Canli, 2004; Gray et al., 2005; Wright,
Feczko, Dickerson, & Williams, 2007) and measured it with the brain imaging methods (which
provide the chance to directly map brain anatomy and functioning) the outcomes could have been
different.
Since personality was not the primary focus of the present study, we did not have research
questions associated with it directly and used the personality data to ensure that neither openness,
conscientiousness, extroversion, agreeableness, or neuroticism influenced the judgments on the
rated dissimilarity task. We concluded that the performance on the rated dissimilarity task was not
affected by inter-subject personality differences.

Chapter 6. Discussion
109
6.3 Individual differences in category compactness and their
connection to L0 perception
The purpose of the present study was to investigate whether individual differences in L1 perception
are large enough to influence L0 perception. Even though adults seem to process native speech
flawlessly despite a highly variant phonetic input, they do not cope equally well with speech
perception, when non-native sounds have to be processed. We hypothesized that individual
differences in L1 perception might partially explain variable outcomes in L2 phonetics and
phonology. There are a number of reasons to take L1-based variability into consideration. One
such reason is that people learn their first language from their environment via statistical learning
(Saffran, Aslin, & Newport, 1996), which ensures that they use a language variety prevailing in
their community. Thus, the number and quality of L1 phonological categories are affected by the
input received. For example, in their study, Maye, Werker, and Gerken (2002) showed that infants
develop two categories if they are exposed to the bi-modal distribution of phonemes (/d/ vs /t/) and
one category if the distribution is uniform. Since no two listeners received the same input
throughout their life, there are likely to be differences in how individuals develop L1 perceptual
categories, which may vary from individual to individual within the same L1.
In the present study we observed that when the input came from a larger network, it resulted
in larger categories. In her recent study, Lev-Ari (2017) investigated whether individuals who
regularly interact with more people were better at L1 speech perception. She measured the
robustness of participants’ vowel representations and found that participants with a larger social
network correctly transcribed more vowels embedded in noise than less socially active listeners.
It seems that a greater level of variability in the input (in this case, multiple speakers in the
network) had a faciliatory effect on L1 phonological acquisition. The infants from Rost and

Chapter 6. Discussion
110
McMurray’s (2009) study benefited more from exposure to 18 speakers than to a single speaker
when listening to a /buk-puk/ minimal pair. Sumner (2011) confirmed this line of argument
demonstrating that listening to multiple tokens produced by a speaker accelerates learning as
opposed to listening to a single token produced the same number of times by the same speaker.
Our results reconcile these observations. It seems plausible that L1 perception is better when
categories are built through exposure to more exemplars (more robust categories) since it allows a
listener to cope with a greater degree of variance. The question addressed by the current study was:
To what extent does L1-based variability in category compactness influence the degree of
perceived dissimilarity of a novel vowel contrast? Our results indicated that when non-native
perception is involved, individuals with large categories benefit the least. The reason could be
simply quantitative in nature: one large native category might contain two small non-native
categories inside it making L0 perception difficult. Best’s Perceptual Assimilation Model (e.g.,
Best 1995) postulates that the difficulty associated with listening to non-native sounds, depends
on phonetic-articulatory similarities between L1 and non-L1 sounds. According to this model, the
situation when two foreign sounds are assimilated to one phoneme in the native language is labeled
as single-category assimilation (SC). The SC contrast is predicted to be difficult since two sounds
are either equally different from or similar to the native sound. Another PAM assimilation pattern,
category-goodness assimilation, involves two non-native contrasting sounds representing one
good and one poor exemplar of a given L1 category. In this case, the distance between the non-
native sounds should be distinguished better than with single-category assimilation. It seems that
in our study listeners with a large Spanish category /i/ showed a tendency towards single-category
assimilation: they perceived a small or no distance between Russian /i/ and /ɨ/ as if they assimilated
both L0 sounds to the same Spanish category /i/. On the other hand, listeners with a compact

Chapter 6. Discussion
111
Spanish category /i/ showed category-goodness assimilation: they perceived a larger distance
between Russian /i/ and /ɨ/, as if they judged one member of this contrast as a good exemplar of
their native /i/ and the other member (most likely Russian /ɨ/) as a poor or deviant exemplar of
Spanish /i/. Thus, we argue, individuals might have different perceptual assimilation patterns in
L1/L0, based on the size of their native phonetic categories.
Another explanation for larger categories causing difficulty in non-native perception is
mediated by the concept of social network size mentioned earlier. Lev-Ari (2018) shows that
people with smaller social networks tend to assign greater weight to each person they encounter,
and therefore, they are more susceptible to each person’s influence. It could be that in our study
listeners with compact categories (who also had smaller social networks) weighted input
differently from listeners with large categories (and large social networks). Could it be that
listeners with smaller social networks were less likely to generalize and would rather create a new
category for an atypical sound? Previous research on linguistic diffusion (the process of passing
new linguistic forms among adults) has suggested that people with smaller social networks are
indeed better in spotting and propagating the innovation, thus, driving linguistic change (Bakshy,
Rosenn, Marlow, & Adamic, 2012). Listeners with a smaller social network and a smaller
collection of tokens might perceive every incoming token with greater attention, which would
result in deeper processing, as opposed to listeners who are “desensitized” by a large collection of
tokens in their category. On the one hand, such a desensitizing effect helps listeners to cope with
variability in the speech input (the so-called lack of invariance phenomenon). On the other hand,
it prevents a listener from identifying a new token as an instance of a novel category.
It must be noted that several previous studies that have investigated the effects of individual
differences in L1 perception on non-native perception failed to find the connection. One such study

Chapter 6. Discussion
112
by Langeris and Hazan (2010) looked at how individuals from the same L1 background (Greek)
vary in their ability to learn to perceive an L2 contrast (English). They found no evidence of the
relationship between individual L1 profiles on non-native perception and how flexible individuals
were in learning new categories as a function of L1-based differences. It could be that L1-based
differences only play a role at the initial stage of perceptual learning and later, as the learning
progresses, other factors take over (e.g., phonological short-term memory, motivation). In Lengeris
and Hazan’s study, all participants had 10 to 12 years of English instruction with the language
proficiency level described as “moderately high”. It could be also that L1-based individual
differences in perception, specifically, category compactness, affect individuals differently. As we
observed before, individuals with greater acoustic memory were not affected by compactness when
distinguishing between two novel sounds. On the other hand, individuals with poorer acoustic
memory relied heavily on category compactness in the rated dissimilarity task.
In our study, the effect of compactness on non-native perception was small yet significant.
Nevertheless, from the studies on the cultural evolution of language, we know that given enough
time, a weak bias acting on learning can have strong cumulative effects called “bias amplification”
(Dediu, 2011; Kirby et al., 2007; Thompson, Kirby, & Smith, 2016). On a larger timescale (e.g.,
years of learning a second language), category compactness might have a substantial impact on
the acquisition of L2 phonetics and phonology. A longitudinal study that observes learners with
various degrees of category compactness acquiring a novel language would offer an interesting
insight into the role of perceptual compactness in shaping L2 perceptual learning.

Chapter 6. Discussion
113
6.4 Implications and future directions
The ability to discern subtle phonetic differences, either due to category compactness or other
factors, provides an advantage in the acquisition of L2 phonetics and phonology. The next question
to ask is whether the improved L2 perception benefits other aspects of second language acquisition.
We hypothesize that exceptional phonetic abilities lead to more efficient use of the mechanisms
responsible for speech perception and production in general. Evidence from fMRI/MRI studies
shows that having phonetic talent reshapes brain anatomy improving performances in the
“language network” (Rota, 2009). In a series of studies, Kachlicka, Saito, and Tierney (2019)
propose that individual differences in neurocognitive functioning related to auditory processing
can explain variability in the rate and ultimate attainment of L2 acquisition overall. They argue
that precise audition can predict advanced L2 phonological, but also L2 lexical and grammatical
skills. Thus, enhanced auditory processing might be a gate into language-learning.
In our study, we focused on one particular aspect of L0 speech perception, which is the
degree of perceived dissimilarity of a novel vowel contrast. We hypothesized that, aside from other
factors that contribute to non-native perception, category compactness plays an important role in
distinguishing between two contrasting L0 sounds. Our results raised a number of new questions.
For example, do all phonetic categories within one individual’s vowel space have the same
compactness index? In our study, due to time and resource constraints, we only measured one
native category. However, if we follow the assumption of exemplar theory about the structure of
a cognitive map for perception, we would see that the size of any particular category depends on
frequency effects, i.e., how often particular exemplars are encountered. More frequent categories
will have more tokens and less frequent categories fewer tokens (Pierrehumbert, 2001). For
example, the Spanish categories /e/ and /a/ occur 13% and 11% of the time respectively (these
Chapter 6. Discussion
114
numbers could be slightly different depending on the size and genre of the text: Version 18.2.17;
WordCreator, 2019), which could mean that these categories on average are larger than the Spanish
category /i/ (5%). High-frequency categories that are represented by more numerous exemplars
would also have a higher activation level and, thus, a greater labeling power, i.e. recruiting more
newly encountered tokens.
Another question is what would be the benefit of describing individual vowel profiles (the
size and shape of each L1 category). Could we use it for more accurate predictions of the learning
outcomes for specific languages? In our study, we measured the size of the Spanish category /i/
under the assumption that individuals with larger categories would struggle to discriminate
between various allophones of /i/. Based on this assumption, we can predict that learning languages
where several (more than one) allophones of /i/ are labeled as distinct phonetic categories will be
a challenge. In this regard, Russian that has a /i - ɨ/ contrast or English that has a /i - ɪ/ contrast
would be difficult, but not Japanese, as there are no contrasts in the high front area of the vowel
space. Acquiring similar measures for other vowels (and possibly consonants, e.g., based on
individual VOT, etc.) would allow for building individual psychoacoustic profiles and determining
a so-called language match for every individual, i.e., the easiest language to learn in terms of
phonetics. In the situation, when a learner has a choice of a foreign language to acquire (e.g.,
academic or military settings), measuring a phonetic distance between an individual’s
psychoacoustic profile and a specific language might serve as a useful guide for optimal L2
selection. Existing language aptitude tests (Hi-LAB: Doughty et al., 2010, etc.; CANAL-F:
Grigorenko, Sternberg, & Ehrman, 2000; DLAB: Peterson & Al-Haik, 1976) do not make
predictions for specific languages. Aptitude research has been concerned with the effects of
individual differences in learning a foreign language, where a foreign language is a uniform

Chapter 6. Discussion
115
phenomenon, i.e. any language, regardless of its phonetic and other linguistic properties.
Accounting for idiosyncratic learner-language interactions might bring aptitude testing to a new
level.
Other questions we would like to see answered in the future include: How does category
compactness affect L1 phonetic aptitude, i.e., aptitude for learning phonetics and phonology of a
native language (Trecca, Bleses, Højen, Madsen, & Christiansen, 2020)? What is the connection
between less compact categories and phonetic disabilities (e.g., dyslexia)? How is the bilingual
vowel space different from the monolingual vowel space in terms of category compactness? What
does the polyglots’ and gifted learners' vowel space look like? In other words, the present study
offers fruitful opportunities for investigating a wide range of phenomena through the lenses of
category compactness.
6.5 Limitations of the present study
The present study has some limitations that should be taken into account when interpreting the
findings. The first and most important limitation concerns the design of the goodness rating task
and the rated dissimilarity task. As we mentioned above, an ideal scenario for the goodness rating
task would include measuring all native vowel categories in an individual’s perceptual space. We
have not been able to do so due to limited time and funding resources: measuring all five vowels
with a goodness rating task would include several sessions with the same participants. It is not
recommended to administer a goodness rating task for all vowels in one sitting because of the
monotonous nature of the task requiring considerable attentional resources and a willingness to
maintain the performance. The alternative solution would be to design this task in a way that is
less demanding for participants, such as including gamified elements. Measuring all five vowels

Chapter 6. Discussion
116
is not only important for understanding how phonetics categories vary within a single perceptual
space but also for relating the categories and their size to the size of the perceptual space itself.
The second limitation is the subjective nature of the intuitive rating scale used in the
goodness rating task. As any self-reported measure, such a scale might not be able to capture the
small perceptual differences that we hoped to observe. Instead, future research may employ
electrophysiological measurements of perception. By measuring mismatch negativity (MMN)
brain responses to deviant sounds (in our case, the synthesized variants of /i/), it is possible to
determine with a higher degree of accuracy if neural discrimination of these sounds is better or
worse in comparison to the prototypical native sound. Generally speaking, when processing
unfamiliar sounds, the brain’s response exhibits a lower MMN amplitude as compared to
prototypical sounds (Näätänen et al., 1997). By calculating a difference between the MMN
amplitude peaks of a deviant token and a prototype, we can measure the degree of perceptual
recognition for each deviant with greater accuracy. Such a pre-attentive measure of perception
would allow calculating the category compactness index more precisely since it would give direct
access to an individual's low-level processing mechanisms.
To measure L0 perception, we employed a rated dissimilarity task. Since the task does not
measure the perception of everyday speech, in which listeners have to recognize words and larger
units embedded in noise and produced by many speakers, certain interpretive challenges might
arise. To ensure higher ecological validity, it would be better to supplement phoneme
discrimination tests with other measures.
Last but not least in relation to measuring perception: as individual perceptual measures
fluctuate depending on many factors, such as time of the day or the hormone level, it would be
beneficial to repeat the same tests several times.

Chapter 6. Discussion
117
A word of caution needs to be said about collecting data with crowdsourcing online
platforms. Even though multiple measures were taken to ensure the validity and reliability of the
data collected, online platforms remain a novel recruiting tool in behavioral research.
Finally, in the present study we have not explored the possibilities that a longitudinal design
might offer. Following the participants as they acquire Russian over time would allow us to
observe how category compactness evolves with growing proficiency and what factors influence
this process.

118
Chapter 7 – Conclusion
In this dissertation, we aimed to shed light on individual differences in native perception and how
they influence non-native speech perception. L1-based individual differences is a relatively new
topic that has been explored previously in other linguistics domains (e.g., morphosyntax), but not
so much in phonetics and phonology and in relation to to L2 acquisition. In order to understand
how individuals differ in the way their native phonetic categories are represented in perceptual
space, we measured compactness of one such category. Then, we related this measure to the degree
of perceived dissimilarity of a novel L0 contrast. Sixty-eight Spanish monolinguals participated in
the present study. The compactness index of their vowel category /i/ was measured. Our
participants were also assessed on their ability to perceive a distance between the members of a
novel Russian contrast /i - ɨ/, as well as on several cognitive skills and personality traits.
Overall, the results obtained indicate an important role of category compactness in relation
to L0 perception. We observed small but significant L1-based individual differences in perception,
and these differences were shown to result in better perceptual discrimination of an acoustic
distance between two novel sounds suggesting that L1-based category compactness contributes to
non-native perception. This dissertation makes several important contributions to the current
knowledge about L2 speech perception and L2 phonological acquisition. This chapter concludes
the present dissertation by outlining the key findings and their potential contribution to the field of
SLA.

Chapter 7. Conclusion
119
7.1 Contribution of the dissertation
It is widely assumed that all native speakers of a shared language have more or less the same
phonetic and phonological knowledge of their mother tongue. However, this is very much an
assumption and not an empirical fact. Considering the theoretical and practical significance of
individual differences in L1 competence, there is surprisingly little research concerning this issue.
Very few studies have been conducted to support the claim that there are considerable individual
differences in L1, especially with regard to L1 phonetics and phonology (Mayr & Escudero, 2010;
Zellou, 2017). In this dissertation, we investigated individual differences in the size of native
phonetic categories or category compactness. To our knowledge it is one of the first attempts to
measure category compactness in perception, not only because it is widely assumed that perception
is less variable than production, but also because of the ethereal nature of perception, measuring
which posits a substantial methodological challenge. Our second aim was to determine whether
individual differences in L1 category compactness lead to variability in L2 perception. Again, we
are only aware of a handful of studies that related these measures. In particular, we wanted to
contribute to the research line that investigates L2 phonetic ability or phonetic talent appending
L1-based individual differences to the list of potential contributors.
This dissertation confirms our hypothesis that some individuals have a considerable
advantage processing novel sounds due to L1 category compactness. Furthermore, our experiment
revealed that acoustic memory supports L2 perception, when native categories are not compact.
This finding revitalizes a long-forgotten discussion about cognitive learning styles. We also came
to a seemingly counterintuitive conclusion that exceling in native perception (that is signified by
larger categories formed as a result of variable linguistic environment: e.g., larger social network
size and/or brief exposure to other languages) might impede L0 perception. Although a surprising
Chapter 7. Conclusion
120
finding, it confirms NLM and NLM-e models’ predictions that L1 experience sharpens L1
perception but interferes with L1 learning (Kuhl et al., 2006; Kuhl et al., 2008).
7.2 Concluding remarks
At the beginning of this dissertation, we introduced Ludwig Wittgenstein’s saying that the limits
of one’s language signify the limits of one’s world. Even though a limitation of any kind is
generally perceived as a negative concept, in this dissertation we discuss how limits can lead to a
better understanding of otherness and building a new world around it. Trying to assimilate objects
and experiences to our inner conceptual map often leads to labeling these objects and experiences
as deviant or poorer versions of the concepts we already have. However, recognizing an object as
an essentially different and new category helps to preserve its identity without further expectations
for it to resemble something else. Our findings show that compact phonetic categories might
facilitate the discrimination of novel categories. In this sense, the limits of our language define our
world, at the same time helping us to recognize and build new worlds around us.

121
References
Aliaga-García, C., Mora, J. C., & Cerviño-Povedano, E. (2011). L2 speech learning in adulthood
and phonological short-term memory. Poznań Studies in Contemporary Linguistics
PSiCL, 47, 1.
Anderson, J. L., Morgan, J. L., & White, K. S. (2003). A statistical basis for speech sound
discrimination. Language and Speech, 46(2-3), 155-182.
Andreyushina, E. A. (2014). Filologicheskie nauki. Voprosy teorii i praktiki. Chast 2—
Philological Sciences. Issues of Theory and Practice. Part 2.
Andringa, S. (2014). The use of native speaker norms in critical period hypothesis
research. Studies in Second Language Acquisition, 36(3), 565-596.
Atkinson, R. C., & Shiffrin, R. M. (1968). Human memory: A proposed system and its control
processes. In K. W. Spence, & J. T. Spence (Eds.), The psychology of learning and
motivation: Advances in research and theory (Vol. 2, pp. 89-195). New York: Academic
Press.
Baddeley, A. (1986). Working memory. Oxford, England: Oxford University Press.
Baddeley, A. (1998). Recent developments in working memory. Current Opinion in
Neurobiology, 8(2), 234-238.
Bakshy, E., Rosenn, I., Marlow, C., & Adamic, L. (2012, April). The role of social networks in
information diffusion. In Proceedings of the 21st international conference on World Wide
Web, 519-528.

References
122
Baayen, R. H. (2008). Analyzing linguistic data: A practical introduction to statistics using
R. Cambridge: Cambridge University Press.
Baayen, R. H., Davidson, D. J., & Bates, D. M. (2008). Mixed-effects modeling with crossed
random effects for subjects and items. Journal of Memory and Language, 59(4), 390-412.
Best, C. T. (1984). Discovering Messages in the Medium. In H. E. Fitzgerald, B. M. Lester, M. W.
Yogman (Eds.), Theory and research in behavioral pediatrics (pp. 97-145). Springer,
Boston, MA.
Best C.T. (1993) Emergence of language-specific constraints in perception of non-native speech:
A window on early phonological development. In B. de Boysson-Bardies, S. de Schonen,
P. Jusczyk., P. McNeilage P., & L. Morton (Eds.) Developmental neurocognition: Speech
and face processing in the first year of life (pp. 289-304). Springer, Dordrecht.
Best, C. T. (1994). The emergence of native-language phonological influences in infants: A
perceptual assimilation model. The Development of Speech Perception: The Transition
from Speech Sounds to Spoken Words, 167(224), 233-277.
Best, C. T. (1995). A direct realist view of cross-language speech perception. Speech Perception
and Linguistic Experience, 171-206.
Best, C. T., Halle, P., Bohn, O. S., & Faber, A. (2003, August). Cross-language perception of
nonnative vowels: Phonological and phonetic effects of listeners’ native languages.
In Proceedings of the 15th international congress of phonetic sciences (Vol. 28892892).
Barcelona, Spain: Causal Productions.
Best, C. T., & Tyler, M. D. (2007). Non-native and second-language speech perception:
Commonalities and complementarities. In M. J. Munro, & O.-S. Bohn (Eds.), Second

References
123
language speech learning: The role of language experience in speech perception and
production (pp. 13-34). Amsterdam: John Benjamins.
Boersma, P., & Weenink, D. (2013). Praat: doing phonetics by computer [Computer program].
Version 5.3. 51. Online: http://www. praat. org/retrieved, last viewed on, 12.
Bongaerts, T., van Summeren, C., Planken, B., & Schils, E. (1997). Age and ultimate attainment
in the pronunciation of a foreign language. Studies in Second Language Acquisition, 447-
465.
Bowie, D. (2001). Dialect contact and dialect change: The effect of near-mergers. University of
Pennsylvania Working Papers in Linguistics, 7(3), 3.
Brooks, P. J., Kempe, V., & Donachie, A. (2009, November). Individual differences in adult
foreign language learning. Paper presented at the 50th Annual Meeting of The Psychonomic
Society, Boston, MA.
Brosnahan, L. F. (1961). Language and evolution. Lingua, 9, 225-236.
Brown, C. A. (1998). The role of the L1 grammar in the L2 acquisition of segmental
structure. Second Language Research, 14(2), 136-193.
Burgess, N., & Hitch, G. (2005). Computational models of working memory: putting long-term
memory into context. Trends in Cognitive Sciences, 9(11), 535-541.
Byers-Heinlein, K., Burns, T. C., & Werker, J. F. (2010). The roots of bilingualism in
newborns. Psychological Science, 21(3), 343-348.
Canli, T. (2004). Functional brain mapping of extraversion and neuroticism: Learning from
individual differences in emotion processing. Journal of Personality, 72(6), 1105–1132.

References
124
Carroll, J. B. (1981). Twenty-five years of research on foreign language aptitude. In K.C. Diller,
(Ed.), Individual differences, and universals in language learning aptitude (pp. 119-
154). Rowley, MA: Newbury House.
Carver, C.S., & White, T.L. (1994). Behavioral inhibition, behavioral activation, and affective
responses to impending reward and punishment: the BIS/BAS scales. Journal of
Personality and Social Psychology, 67, 319–333.
Cebrian, J. Mora, J. C., & Aliaga-Garcia, C. (2011) Assessing cross-linguistic similarity by means
of rated discrimination and perceptual assimilation tasks. In K. Dziubalska-Kołaczyk, M.
Wrembel, & M. Kul (Eds.), Achievements and perspectives in the acquisition of second
language speech: New Sounds 2010, Volume I (pp. 41-52). Frankfurt am Main: Peter Lang.
Cerviño-Povedano, E., & Mora, J.C. (2011). Investigating Catalan learners of English over-
reliance on duration: Vowel cue weighting and phonological short-term memory. K.
Dziubalska-Kołaczyk, M. Wrembel, & M. Kul, (Eds.), Achievements and perspectives in
the acquisition of second language speech: New Sounds 2010 (pp. 53-64). Bern: Peter
Lang.
Cerviño-Povedano, E., & Mora, J. C. (2015). Spanish EFLs’ identification of /i:-I/ and
phonological short-term memory. In N. Jiménez Carra, E. Calvo, N. Fernández-Quesada,
A.M. López Márquez, A. Stender (Eds.), Proceedings of the 32nd International
Conference of the Spanish Association of Applied Linguistics (AESLA): Language
Industries and Social Change. Procedia - Social and Behavioral Sciences 173, 18-23.
Chang, C. B. (2013). A novelty effect in phonetic drift of the native language. Journal of
Phonetics, 41(6), 520-533.

References
125
Chang, F., Dell, G. S., & Bock, K. (2006). Becoming syntactic. Psychological Review, 113(2),
234.
Chládková, K., & Escudero, P. (2012). Comparing vowel perception and production in Spanish
and Portuguese: European versus Latin American dialects. The Journal of the Acoustical
Society of America, 131(2), EL119-EL125.
Christiner, M., Rüdegger, S., & Reiterer, S. M. (2018). Sing Chinese and tap Tagalog? Predicting
individual differences in musical and phonetic aptitude using language families differing
by sound-typology. International Journal of Multilingualism, 15(4), 455-471.
Christiner, M., & Reiterer, S. M. (2015). A Mozart is not a Pavarotti: Singers outperform
instrumentalists on foreign accent imitation. Frontiers in Human Neuroscience, 9, 482.
Chomsky, N., & Halle, M. (1968). The sound pattern of English. Harper & Row, Publishers New
York, Evanston, and London.
Clopper, C. G., & Pisoni, D. B. (2004). Some acoustic cues for the perceptual categorization of
American English regional dialects. Journal of Phonetics, 32(1), 111-140.
Coleman, J. (2002). Phonetic representations in the mental lexicon. In J. Durand, & B. Laks,
(Eds.), Phonetics, phonology and cognition (pp. 96–130). Oxford: Oxford University
Press.
Conboy, B. T., Sommerville, J. A., & Kuhl, P. K. (2008). Cognitive control factors in speech
perception at 11 months. Developmental Psychology, 44(5), 1505.
Costa, P. T., & McCrae, R. R. (1992). Revised NEO Personality Inventory (NEO PI-R) and NEO
Five-Factor Inventory. Professional Manual. Odessa, FL: Psychological Assessment
Resources.

References
126
Coumel, M., Christiner, M., & Reiterer, S. M. (2019). Second language accent faking ability
depends on musical abilities, not on working memory. Frontiers in Psychology, 10.
Coupé, C. (2018). Modeling linguistic variables with regression models: Addressing non-Gaussian
distributions, non-independent observations, and non-linear predictors with random effects
and generalized additive models for location, scale, and shape. Frontiers in Psychology, 9,
513.
Cowan, N., & Morse, P. A. (1986). The use of auditory and phonetic memory in vowel
discrimination. The Journal of the Acoustical Society of America, 79(2), 500–507.
Crowder, R. G., & Morton, J. (1969). Precategorical acoustic storage (PAS). Perception &
Psychophysics, 5(6), 365-373.
Cubberley, P. (2002). Russian: A linguistic introduction. Cambridge: Cambridge University Press.
Cunningham, A., Carroll, J. (2015). Early predictors of phonological and morphological awareness
and the link with reading: Evidence from children with different patterns of early
deficit. Applied Psycholinguistics, 36, 509-531.
Darcy, I., Mora, J. C., & Daidone, D. (2016). The role of inhibitory control in second language
phonological processing. Language Learning, 66(4), 741-773.
Darcy, I., Park, H., & Yang, C. L. (2015). Individual differences in L2 acquisition of English
phonology: The relation between cognitive abilities and phonological processing. Learning
and Individual Differences, 40, 63-72.
Darwin, C. J., & Baddeley, A. D. (1974). Acoustic memory and the perception of speech. Cognitive
Psychology, 6(1), 41–60.

References
127
Davis, C. J., & Perea, M. (2005). BuscaPalabras: A program for deriving orthographic and
phonological neighborhood statistics and other psycholinguistic indices in
Spanish. Behavior Research Methods, 37(4), 665-671.
Dediu, D. (2011). Are languages really independent from genes? If not, what would a genetic bias
affecting language diversity look like? Human Biology, 83(2), 279-297.
Delvaux, V., Huet, K., Piccaluga, M., & Harmegnies, B. (2014). Phonetic compliance: a proof-of-
concept study. Frontiers in Psychology, 5, 1375.
Dellwo, V., Pellegrino, E., He, L., Kathiresan, T. (2019). The dynamics of indexical information
in speech: Can recognizability be controlled by the speaker? Acta Universitatis
Carolinae. Prague Studies in English, 2019(2), 57-75.
Dewaele, J. M., & Furnham, A. (1999). Extraversion: The unloved variable in applied linguistic
research. Language Learning, 49(3), 509–544.
Díaz, B., Baus, C., Escera, C., Costa, A., & Sebastián-Gallés, N. (2008). Brain Potentials to Native
Phoneme Discrimination Reveal the Origin of Individual Differences in Learning the
Sounds of a Second Language. In Proceedings of the National Academy of Sciences of the
United States of America, 105(42), 16083-16088.
Dogil, G., & Reiterer, S. M. (2009). Language talent and brain activity (Vol. 1). Berlin and New
York: Walter de Gruyter.
Dörnyei, Z. (2010). Researching motivation: From integrativeness to the ideal L2 self. Introducing
Applied Linguistics: Concepts and Skills, 3(5), 74-83.
Dörnyei, Z. (2014). The psychology of the language learner: Individual differences in second
language acquisition. Routledge.

References
128
Doughty, C. J., Campbell, S. G., Mislevy, M. A., Bunting, M. F., Bowles, A. R., & Koeth, J. T.
(2010). Predicting near-native ability: The factor structure and reliability of Hi-LAB. In K.
Y. Lee, M. Bowles, R. Foote, S. Perpiñán, & R. Bhatt (Eds.), Selected proceedings of the
2008 second language research forum (pp. 10-31). Somerville, MA: Cascadilla
Proceedings Project.
Drager, K. (2005). The influence of social characteristics on speech perception (Unpublished
master's thesis). University of Canterbury, Christchurch.
Duñabeitia, J. A., Cholin, J., Corral, J., Perea, M., & Carreiras, M. (2010). SYLLABARIUM: An
online application for deriving complete statistics for Basque and Spanish orthographic
syllables. Behavior Research Methods, 42(1), 118-125.
Eimas, P. D., Siqueland, E. R., Jusczyk, P., & Vigorito, J. (1971). Speech perception in
infants. Science, 171(3968), 303-306.
Eisner, F., & McQueen, J. M. (2006). Perceptual learning in speech: Stability over time. The
Journal of the Acoustical Society of America, 119(4), 1950-1953.
Ellis, N. C. (2006). Language acquisition as rational contingency learning. Applied
linguistics, 27(1), 1-24.
Ettlinger, M., & Johnson, K. (2009). Vowel discrimination by English, French and Turkish
speakers: Evidence for an exemplar-based approach to speech
perception. Phonetica, 66(4), 222-242.
Escudero, P. (2005). Linguistic perception and second language acquisition: Explaining the
attainment of optimal phonological categorization. LOT Dissertation Series 113, Utrecht
University.

References
129
Escudero, P., Simon, E., & Mitterer, H. (2012). The perception of English front vowels by North
Holland and Flemish listeners: Acoustic similarity predicts and explains cross-linguistic
and L2 perception. Journal of Phonetics, 40(2), 280-288.
Evans, B. G., & Iverson, P. (2004). Vowel normalization for accent: An investigation of best
exemplar locations in northern and southern British English sentences. The Journal of the
Acoustical Society of America, 115(1), 352-361.
Falotico, R., & Quatto, P. (2015). Fleiss’ kappa statistic without paradoxes. Quality &
Quantity, 49(2), 463-470.
Farina, D. M. (1991). Palatalization and jers in modern Russian phonology: An underspecification
approach (Doctoral dissertation). Retrieved from http://hdl.handle.net/2142/20249.
(AAI9136589).
Field, A., Miles, J., & Field, Z. (2012). Discovering statistics using R. Sage publications.
Flege, J. E. (1995). Second language speech learning: Theory, findings, and problems. In W.
Strange (Ed.), Speech perception and linguistic experience: Issues in cross-language
research (pp. 233-277). Baltimore, MA: York Press.
Flege, J. E. (2002). Interactions between the native and second-language phonetic systems. In P.
Burmeister, T. Piske, & A. Rohde (Eds.), An integrated view of language development:
Papers in honor of Henning Wode (pp. 217-244). Trier: Wissenschaftlicher Verlag.
Flege, J. E. (2003). Assessing constraints on second-language segmental production and
perception. Phonetics and Phonology in Language Comprehension and Production:
Differences and Similarities, 6, 319-355.

References
130
Flege, J. E. (2016, June). The role of phonetic category formation in second language speech
acquisition. Paper presented at the 8th International Conference on Second Language
Speech, Aarhus University, Denmark.
Flege, J. E., Munro, M. J., & Fox, R. A. (1994). Auditory and categorical effects on cross-language
vowel perception. The Journal of the Acoustical Society of America, 95(6), 3623-3641.
Fonseca-Mora, M. C., Jara-Jiménez, P., & Gómez-Domínguez, M. (2015). Musical plus
phonological input for young foreign language readers. Frontiers in Psychology, 6, 286.
Francis, A. L., & Nusbaum, H. C. (2002). Selective attention and the acquisition of new phonetic
categories. Journal of Experimental Psychology: Human Perception and
Performance, 28(2), 349.
Furnham, A. (1990). Language and personality. In H. Giles, & W.P. Robinson (Eds.), Handbook
of language and social psychology (p. 73–95). John Wiley & Sons.
Gallese, V., Fadiga, L., Fogassi, L., & Rizzolatti, G. (1996). Action recognition in the premotor
cortex. Brain, 119(2), 593-609.
Gathercole, S. E. (1999). Cognitive approaches to the development of short-term memory. Trends
in Cognitive Sciences, 3(11), 410-419.
Gardner, R. C., & Lambert, W. E. (1972). Attitudes and motivation in second-language learning.
Massachusetts: Newbury House Publishers.
Gervain, J., Macagno, F., Cogoi, S., Peña, M., & Mehler, J. (2008). The neonate brain detects
speech structure. In Proceedings of the National Academy of Sciences, 105(37), 14222-
14227.
Ghaffarvand Mokari, P., & Werner, S. (2019). On the role of cognitive abilities in second language
vowel learning. Language and Speech, 62(2), 260-280.

References
131
Goldberg, L. R. (1993). The structure of phenotypic personality traits. American
psychologist, 48(1), 26.
Goldinger, S. D. (1996). Words and voices: episodic traces in spoken word identification and
recognition memory. Journal of Experimental Psychology: Learning, Memory, and
Cognition, 22(5), 1166.
Goldinger, S. D. (2007). A complementary-systems approach to abstract and episodic speech
perception. In Proceedings of the 16th international congress of phonetic sciences, 49-54.
Goldinger, S. D., Pisoni, D. B., & Logan, J. S. (1991). On the nature of talker variability effects
on recall of spoken word lists. Journal of Experimental Psychology: Learning, Memory,
and Cognition, 17(1), 152.
Gray, J.A., Burgess, G.C., Schaefer, A., Yarkoni, T., Larsen, R.J., & Braver, T.S. (2005). Affective
personality differences in neural processing efficiency confirmed using fMRI. Cognitive,
Affective, and Behavioral Neuroscience, 5(2), 182–190.
Grigornko, E. L., Sternberg, R. J., & Ehrman, M. E. (2000). A theory-based approach to the
measurement of foreign language learning ability: The Canal-F theory and test. The
Modern Language Journal, 84(3), 390-405.
Guenther, F. H. (1995). Speech sound acquisition, coarticulation, and rate effects in a neural
network model of speech production. Psychological Review, 102(3), 594.
Guenther, F. H., Hampson, M., & Johnson, D. (1998). A theoretical investigation of reference
frames for the planning of speech movements. Psychological Review, 105(4), 611.
Guiora, A.Z. (1979). Personality and language behavior: A restatement. Language Learning,
29(1), 193–204.

References
132
Guiora, A.Z., Acton, W.R., Erard, R., & Strickland, F.W. (1980). The effects of Benzodiazepine
(Valium) on the permeability of language ego boundaries. Language Learning, 30, 351–
63.
Guiora, A.Z., Beit-Hallahmi, B., Brannon, R.C., Dull, C.Y., & Scovel, T.S. (1972). The effects of
experimentally induced changes in ego states on pronunciation ability in a second
language: an exploratory study. Comprehensive Psychiatry, 13(5), 421-8.
Guiora, A., Brannon, R. & Dull, C. (1972a). Empathy and second language learning. Language
Learning, 22, 111–130.
Guiora, A. Z., Paluszny, M., Beit-Hallahmi, B., Catford, J. C., Cooley, R. E., & Dull, C. Y. (1975).
Language and person studies in language behavior. Language Learning, 25(1), 43-61.
Gupta, P. (2003). Examining the relationship between word learning, nonword repetition, and
immediate serial recall in adults. The Quarterly Journal of Experimental Psychology
Section A, 56(7), 1213-1236.
Hay, J., Drager, K., & Warren, P. (2010). Short-term exposure to one dialect affects processing of
another. Language and Speech, 53(4), 447-471.
Henrich, J., Heine, S. J., & Norenzayan, A. (2010). Most people are not
WEIRD. Nature, 466(7302), 29.
Hu, X., & Reiterer, S. (2009). Personality and pronunciation talent in second language acquisition.
In G. Dogil & S. Reiterer (Eds.), Language talent and brain activity (pp. 97-130). Berlin
and New York: Mouton de Gruyter.
Hume, E., & Johnson, K. (2001). The role of speech perception in phonology. Brill.
Hummel, K. M. (2009). Aptitude, phonological memory, and second language proficiency in
nonnovice adult learners. Applied Psycholinguistics, 30(02), 225-249.

References
133
Hurlbert, S. H. (1984). Pseudoreplication and the design of ecological field
experiments. Ecological Monographs, 54(2), 187-211.
Ioup, G., Boustagui, E., El Tigi, M., & Moselle, M. (1994). Reexamining the critical period
hypothesis: A case study of successful adult SLA in a naturalistic environment. Studies in
Second Language Acquisition, 16(1), 73-98.
Iverson, P., & Kuhl, P. K. (1995). Mapping the perceptual magnet effect for speech using signal
detection theory and multidimensional scaling. The Journal of the Acoustical Society of
America, 97(1), 553-562.
Iverson, P., & Kuhl, P. K. (1996). Influences of phonetic identification and category goodness on
American listeners’ perception of /r/ and /l/. The Journal of the Acoustical Society of
America, 99(2), 1130-1140.
Iverson, P., Kuhl, P. K., Akahane-Yamada, R., Diesch, E., Tohkura, Y. I., Kettermann, A., &
Siebert, C. (2003). A perceptual interference account of acquisition difficulties for non-
native phonemes. Cognition, 87(1), B47-B57.
Jacquemot, C., Dupoux, E., Decouche, O., & Bachoud-Lévi, A. C. (2006). Misperception in
sentences but not in words: Speech perception and the phonological buffer. Cognitive
Neuropsychology, 23(6), 949-971.
Jacquemot, C., & Scott, S. K. (2006). What is the relationship between phonological short-term
memory and speech processing? Trends in Cognitive Sciences, 10(11), 480-486.
Jaeger, T. F., & Snider, N. E. (2013). Alignment as a consequence of expectation adaptation:
Syntactic priming is affected by the prime’s prediction error given both prior and recent
experience. Cognition, 127(1), 57-83.

References
134
Jakobson, R., Fant, C. G., & Halle, M. (1969). Preliminaries to speech analysis: The distinctive
features and their correlates. Cambridge, MA: MIT Press.
Jardri, R., Houfflin-Debarge, V., Delion, P., Pruvo, J. P., Thomas, P., & Pins, D. (2012). Assessing
fetal response to maternal speech using a noninvasive functional brain imaging
technique. International Journal of Developmental Neuroscience, 30(2), 159-161.
Jarrold, C., Thorn, A. S., & Stephens, E. (2009). The relationships among verbal short-term
memory, phonological awareness, and new word learning: Evidence from typical
development and Down syndrome. Journal of Eexperimental Child Psychology, 102(2),
196-218.
Jesse, A., & Janse, E. (2012). Audiovisual benefit for recognition of speech presented with single-
talker noise in older listeners. Language and Cognitive Processes, 27(7–8), 1167– 1191.
Jilka, M. (2009). Assessment of phonetic ability. In G. Dogil & S. Reiterer. (Eds.), Language talent
and brain activity (pp. 17-66). Berlin: Mouton De Gruyter.
Jilka, M., Anufryk, V., Baumotte, H., Lewandowska, N., Rota, G., & Reiterer, S. (2007). Assessing
individual talent in second language production and perception. In Proceedings of the 5th
ISALSS (Florianópolis), 243–258.
Johnson, K. (2007). Decisions and mechanisms in exemplar-based phonology. Experimental
Approaches to Phonology, 25-40.
Kachlicka, M., Saito, K., & Tierney, A. (2019). Successful second language learning is tied to
robust domain-general auditory processing and stable neural representation of
sound. Brain and language, 192, 15-24.

References
135
Kartushina, N., & Frauenfelder, U. H. (2013). On the role of L1 speech production in L2
perception: Evidence from Spanish learners of French. In Proceedings of the 14th
Interspeech Conference, 2118-2122.
Kartushina, N., & Frauenfelder, U. H. (2014). On the effects of L2 perception and of individual
differences in L1 production on L2 pronunciation. Frontiers in Psychology, 5, 1246.
Kennedy, S. (2012). Exploring the relationship between language awareness and second language
use. TESOL Quarterly, 46(2), 398-408.
Kennedy, S., & Trofimovich, P. (2010). Language awareness and second language pronunciation:
A classroom study. Language Awareness, 19(3), 171-185.
Kirby, S., Dowman, M., & Griffiths, T. L. (2007). Innateness and culture in the evolution of
language. In Proceedings of the National Academy of Sciences, 104(12), 5241-5245.
Kivistö de Souza, H. (2015). Phonological awareness and pronunciation in a second language
(Unpublished doctoral dissertation). Universitat de Barcelona, Barcelona, Spain.
Klatt, D. H. (1980). Software for a cascade/parallel formant synthesizer. The Journal of the
Acoustical Society of America, 67(3), 971-995.
Климова, Ю. А., Юрченко, Н. В., Черкашина, О. М., & Кулик, С. С. (2017).
Сопоставительный анализ фонологических систем русского и испанского языков (в
целях обучения испаноговорящих студентов русскому произношению). Казанский
Педагогический Журнал, 6(125).
Kondaurova, M. V., & Francis, A. L. (2008). The relationship between native allophonic
experience with vowel duration and perception of the English tense/lax vowel contrast by
Spanish and Russian listeners. The Journal of the Acoustical Society of America, 124(6),
3959-3971.

References
136
Kong, E. J., & Edwards, J. (2016). Individual differences in categorical perception of speech: Cue
weighting and executive function. Journal of Phonetics, 59, 40-57.
Kormos, J. (1999). The effect of speaker variables on the self-correction behavior of L2
learners. System, 27, 207–221.
Kormos, J., & Sáfár, A. (2008a). Phonological short-term memory, working memory and foreign-
language performance in intensive language learning. Bilingualism: Language and
Cognition, 11(02), 261-271.
Kraljic, T., & Samuel, A. G. (2006). Generalization in perceptual learning for
speech. Psychonomic Bulletin & Review, 13(2), 262-268.
Kuhl, P. K. (1991). Human adults and human infants show a “perceptual magnet effect” for the
prototypes of speech categories, monkeys do not. Perception & Psychophysics, 50(2), 93-
107.
Kuhl P. K. (1993). Innate predispositions and the effects of experience in speech perception: The
Native Language Magnet Theory. In B. de Boysson-Bardies, S. de Schonen, P. Jusczyk, P.
McNeilage, J. Morton (Eds.), Developmental neurocognition: Speech and face processing
in the first year of life (pp. 259-274). Springer, Dordrecht.
Kuhl, P. K. (2000). A new view of language acquisition. In Proceedings of the National Academy
of Sciences, 97(22), 11850-11857.
Kuhl, P. K. (2004). Early language acquisition: cracking the speech code. Nature Reviews
Neuroscience, 5(11), 831.
Kuhl, P. K., Conboy, B. T., Coffey-Corina, S., Padden, D., Rivera-Gaxiola, M., & Nelson, T.
(2008). Phonetic learning as a pathway to language: new data and native language magnet

References
137
theory expanded (NLM-e). Philosophical Transactions of the Royal Society B: Biological
Sciences, 363(1493), 979-1000.
Kuhl, P. K., Stevens, E., Hayashi, A., Deguchi, T., Kiritani, S. & Iverson, P. (2006). Infants show
a facilitation effect for native language phonetic percepti on between 6 and 12
months. Developmental Science, 9, 13-21.
Labov, W. (1994). Principles of language change: Internal factors. Oxford: Blackwell.
Lado, R. (1957). Linguistics across cultures. Ann Arbor, MI: University of Michigan Press.
Lang, F. R., John, D., Lüdtke, O., Schupp, J., & Wagner, G. G. (2011). Short assessment of the
Big Five: Robust across survey methods except telephone interviewing. Behavior
Research Methods, 43(2), 548-567.
Langacker, R. W. (1987). Foundations of cognitive grammar: Theoretical prerequisites (Vol. 1).
Stanford university press.
Laver, J. (1980). The phonetic description of voice quality. Cambridge: Cambridge University
Press.
Lee, A., Hewlett, N., & Nairn, M. (1995). Voice and gender in children. Language and Gender:
Interdisciplinary Perspectives, 194-204.
Leibetseder, M., Laireiter, A.R., Riepler, A., & Köller, T. (2001). E-Skala: Fragebogen zur
Erfassung von Empathie – Beschreibung undpsychometrische Eigenschaften. [E-Scale:
Questionnaire for the Assessment of Empathy – Description and Psychometric Properties.]
Zeit-schrift für Differentielle und Diagnostische Psychologie, 22(1), 70–85.
Lengeris, A. (2016). Comparison of perception-production vowel spaces for speakers of Standard
Modern Greek and two regional dialects. The Journal of the Acoustical Society of
America, 140(4).Lengeris, A., & Hazan, V. (2010). The effect of native vowel processing

References
138
ability and frequency discrimination acuity on the phonetic training of English vowels for
native speakers of Greek. The Journal of the Acoustical Society of America, 128(6), 3757-
3768.
Lenneberg, E. (1967). Biological foundations of language. New York: John Wiley.
Lev-Ari, S. (2016). How the size of our social network influences our semantic skills. Cognitive
Science, 40(8), 2050-2064.
Lev-Ari, S. (2017). Talking to fewer people leads to having more malleable linguistic
representations. PloS one, 12(8), e0183593.
Lev-Ari, S. (2018). The influence of social network size on speech perception. Quarterly Journal
of Experimental Psychology, 71(10), 2249-2260.
Lev-Ari, S., & Peperkamp, S. (2013). Low inhibitory skill leads to non-native perception and
production in bilinguals’ native language. Journal of Phonetics, 41(5), 320-331.
Lev-Ari, S., & Peperkamp, S. (2014). The influence of inhibitory skill on phonological
representations in production and perception. Journal of Phonetics, 47, 36-46.
Levshina, N. (2015). How to do linguistics with R: Data exploration and statistical analysis. John
Benjamins Publishing Company.
Leussen, V., & Escudero, P. (2015). Learning to perceive and recognize a second language: the
L2LP model revised. Frontiers in Psychology, 6, 1000.
Lewandowski, N. (2012). Talent in nonnative phonetic convergence (Doctoral dissertation).
Retrieved from Publication Server of the University of Stuttgart (http://nbn-
resolving.de/urn:nbn:de:bsz:93-opus-74023).
Li, D., Cowan, N., & Saults, J. S. (2013). Estimating working memory capacity for lists of
nonverbal sounds. Attention, Perception, & Psychophysics, 75(1), 145-160.

References
139
Liberman, A. M., Cooper, F. S., Shankweiler, D. P., & Studdert-Kennedy, M. (1967). Perception
of the speech code. Psychological Review, 74(6), 431.
Liberman, A. M., Harris, K. S., Hoffman, H. S., & Griffith, B. C. (1957). The discrimination of
speech sounds within and across phoneme boundaries. Journal of Experimental
Psychology, 54(5), 358.
Liberman, A. M., & Mattingly, I. G. (1985). The motor theory of speech perception
revised. Cognition, 21(1), 1-36.
Liberman, A. M., & Mattingly, I. G. (1989). A specialization for speech
perception. Science, 243(4890), 489-494.
Litman, L., Robinson, J., & Abberbock, T. (2017). TurkPrime. com: A versatile crowdsourcing
data acquisition platform for the behavioral sciences. Behavior Research Methods, 49(2),
433-442.
Loakes, D. (2008). A forensic phonetic investigation into the speech patterns of identical and non-
identical twins. International Journal of Speech Language and the Law, 15(1), 97-100.
Luce, P. A., Goldinger, S. D., Auer, E. T., & Vitevitch, M. S. (2000). Phonetic priming,
neighborhood activation, and PARSYN. Perception & Psychophysics, 62(3), 615-625.
Lüttke, C. S., Pérez-Bellido, A., & de Lange, F. P. (2018). Rapid recalibration of speech perception
after experiencing the McGurk illusion. Royal Society Open Science, 5(3), 170909.
McCrae, R. R., & Costa, P. T. (1985). Updating Norman's “adequacy taxonomy": Intelligence and
personality dimensions in natural language and in questionnaires. Journal of Personality
and Social Psychology, 49(3), 710.
MacIntyre, P.D., & Gardner, R.C. (1991). Methods and results in the study of anxiety in language
learning: A review of literature. Language Learning, 41(1), 85–117

References
140
MacKay, I. R., Meador, D., & Flege, J. E. (2001). The identification of English consonants by
native speakers of Italian. Phonetica, 58(1-2), 103-125.
MacWhinney, B. (1995). Language-specific prediction in foreign language learning. Language
Testing, 12(3), 292-320.
Majerus, S., & Lorent, J. (2009). Is phonological short-term memory related to phonological
analysis stages in auditory sentence processing? European Journal of Cognitive
Psychology, 21(8), 1200-1225.
Mattys, S. L., & Wiget, L. (2011). Effects of cognitive load on speech recognition. Journal of
Memory and Language, 65(2), 145-160.
Marques, C., Moreno, S., Luís Castro, S., & Besson, M. (2007). Musicians detect pitch violation
in a foreign language better than nonmusicians: behavioral and electrophysiological
evidence. Journal of Cognitive Neuroscience, 19(9), 1453-1463.
Martínez-Celdrán, E., Fernández-Planas, A. M., & Carrera-Sabaté, J. (2003). Castilian
Spanish. Journal of the International Phonetic Association, 33(2), 255-259.
Massaro, D. W., & Simpson, J. A. (2014). Speech perception by ear and eye: A paradigm for
psychological inquiry. Psychology Press.
Maye, J., Werker, J. F., & Gerken, L. (2002). Infant sensitivity to distributional information can
affect phonetic discrimination. Cognition, 82(3), B101-B111.
Meister, I. G., Wilson, S. M., Deblieck, C., Wu, A. D., & Iacoboni, M. (2007). The essential role
Meunier, C., Frenck-Mestre, C., Lelekov-Boissard, T., & Le Besnerais, M. (2003). Production and
perception of vowels: does the density of the system play a role?. In Proceedings of
International Congress of Phonetic Sciences (ICPhS), 723-726.

References
141
Milovanov, R. (2009). Musical aptitude and foreign language learning skills: Neural and
behavioral evidence about their connections. In Proceedings of the 7th triennial conference
of European society for the cognitive sciences of music (ESCOM 2009), 338– 342.
Milovanov, R., Huotilainen, M., Välimäki, V., Esquef, P. A., & Tervaniemi, M. (2008). Musical
aptitude and second language pronunciation skills in school-aged children: Neural and
behavioral evidence. Brain Research, 1194, 81-89.
Milovanov, R., Pietilä, P., Tervaniemi, M., & Esquef, P. A. (2010). Foreign language
pronunciation skills and musical aptitude: A study of Finnish adults with higher
education. Learning and Individual Differences, 20(1), 56-60.
Milovanov, R., Tervaniemi, M., Takio, F., & Hämäläinen, H. (2007). Modification of dichotic
listening (DL) performance by musico-linguistic abilities and age. Brain Research, 1156,
168-173.
Mora, J. C. & Mora-Plaza, I. (2019). Contributions of cognitive attention control to L2 speech
learning. In A. M. Nyvad., M. Hejná, A. Højen, A.B. Jespersen, & M. H. Sørensen (Eds.), A
sound approach to language matters - InhHonor of Ocke-Schwen Bohn (477-499). Dept.
of English, School of Communication & Culture, Aarhus University, Denmark.
Moran, S., & McCloy, D. (2019). PHOIBLE 2.0. [phonological inventory data]. Jena: Max Planck
Institute for the Science of Human History. (Available online at http://phoible.org,
Accessed on 2020-01-04).
Moreno, S., Marques, C., Santos, A., Santos, M., Castro, S. L., & Besson, M. (2008). Musical
training influences linguistic abilities in 8-year-old children: more evidence for brain
plasticity. Cerebral Cortex, 19(3), 712-723.

References
142
Morgan, J. L., Singh, L., Bortfeld, H., Rathbun, K., & White, K. (2001). Effects of speech and
sentence position on infant word recognition. In Boston University Conference on
Language Development, Boston, MA.
Morokuma, S., Fukushima, K., Kawai, N., Tomonaga, M., Satoh, S., & Nakano, H. (2004). Fetal
habituation correlates with functional brain development. Behavioural Brain
Research, 153(2), 459-463.
Moyer, A. (1999). Ultimate attainment in L2 phonology: The critical factors of age, motivation,
and instruction. Studies in Second Language Acquisition, 21(1), 81-108.
Moyer, A. (2014). Exceptional outcomes in L2 phonology: The critical factors of learner
engagement and self-regulation. Applied Linguistics, 35(4), 418-440.
Näätäneiv, R., Lehtokoski, A., Lennest, M., Luuki, A., Alliki, J., Sinkkonen, J., and Alho, K.
(1997). Language-specific phoneme representations revealed by electric and magnetic
brain responses. Nature, 385, 432-434.
Neisser, (1967). Cognitive psychology. New York: Appleton-Century-Crofts.
Neufeld, G. (1987). On the acquisition of prosodic and articulatory features in adult language
learning. In G. Ioup, & S. Weinberger (Eds.), Interlanguage Phonology (321–332).
Cambridge, MA: Newbury House.
Nolan, F. (1983). The phonetic bases of speaker recognition. Cambridge: CUP.
Nolan, F., & Oh, T. (1996). Identical twins, different voices. International Journal of Speech,
Language and the Law, 3(1), 39-49.
Norris, D. (1994). Shortlist: A connectionist model of continuous speech
recognition. Cognition, 52(3), 189-234.

References
143
Norris, D., McQueen, J. M., & Cutler, A. (2003). Perceptual learning in speech. Cognitive
Psychology, 47(2), 204-238.
Onishi, H. (2016). The effects of L2 experience on L3 perception. International Journal of
Multilingualism, 13(4), 459-475.
Onwuegbuzie, A. J., Bailey, P. and Daley, C. E. (1999). Factors associated with foreign language
anxiety. Applied Psycholinguistics, 20(2), 217-239.
Ou, J., & Law, S. P. (2017). Cognitive basis of individual differences in speech perception,
production and representations: The role of domain general attentional
switching. Attention, Perception, & Psychophysics, 79(3), 945-963.
Pardo, J. S., Gibbons, R., Suppes, A., & Krauss, R. M. (2012). Phonetic convergence in college
roommates. Journal of Phonetics, 40(1), 190-197.
Perkell, J. S., Guenther, F. H., Lane, H., Matthies, M. L., Stockmann, E., Tiede, M., & Zandipour,
M. (2004). The distinctness of speakers’ productions of vowel contrasts is related to their
discrimination of the contrasts. The Journal of the Acoustical Society of America, 116(4),
2338-2344.
Petersen, C. R., & Al-Haik, A. R. (1976). The development of the Defense Language Aptitude
Battery Dlab. Educational and Psychological Measurement, 36(2), 369-380.
Pierrehumbert, J. B. (2001). Exemplar dynamics: Word frequency, lenition and
contrast. Typological Studies in Language, 45, 137-158.
Pickering, M. J., & Garrod, S. (2004). Toward a mechanistic psychology of dialogue. Behavioral
and Brain Aciences, 27(2), 169-190.
Pickering, M. J., & Garrod, S. (2006). Alignment as the basis for successful
communication. Research on Language and Computation, 4(2-3), 203-228.

References
144
Pisoni, D. B., Lively, S. E., & Logan, J. S. (1994). Perceptual learning of nonnative speech
contrasts: Implications for theories of speech perception. In J. C. Goodman & H. C.
Nusbaum (Eds.), The development of speech perception: The transition from speech
sounds to spoken words (pp. 121–166). The MIT Press.
Polka, L., & Bohn, O. S. (1996). A cross-language comparison of vowel perception in English-
learning and German-learning infants. The Journal of the Acoustical Society of
America, 100(1), 577-592.
Pulvermüller, F., Huss, M., Kherif, F., del Prado Martin, F. M., Hauk, O., & Shtyrov, Y. (2006).
Motor cortex maps articulatory features of speech sounds. Proceedings of the National
Academy of Sciences, 103(20), 7865-7870.
Ramus, F., Peperkamp, S., Christophe, A., Jacquemot, C., Kouider, S., & Dupoux, E. (2010). A
psycholinguistic perspective on the acquisition of phonology. Laboratory
phonology, 10(3), 311-340.
Recasens, D., & Espinosa, A. (2006). Dispersion and variability of Catalan vowels. Speech
communication, 48(6), 645-666.
Recasens, D., & Espinosa, A. (2009). Dispersion and variability in Catalan five and six peripheral
vowel systems. Speech Communication, 51(3), 240-258.
Reiterer, S. M., Hu, X., Erb, M., Rota, G., Nardo, D., Grodd, W., ... & Ackermann, H. (2011).
Individual differences in audio-vocal speech imitation aptitude in late bilinguals: functional
neuroimaging and brain morphology. Frontiers in psychology, 2, 271.
Rizzolatti, G., Fadiga, L., Gallese, V., & Fogassi, L. (1996). Premotor cortex and the recognition
of motor actions. Cognitive Brain Research, 3(2), 131-141.

References
145
Rodríguez-Fornells, A., Lorenzo-Seva, U., & Andrés-Pueyo, A. (2001).Psychometric properties
of the Spanish adaptation of the Five Factor Personality Inventory. European Journal of
Psychological Assessment, 17(2), 145-153.
Rose, P. (2002). Forensic speaker identification. cRc Press.
Rost, G. C., & McMurray, B. (2009). Speaker variability augments phonological processing in
early word learning. Developmental Science, 12(2), 339-349.
Rota, G., & Reiterer, S. (2009). Cognitive aspects of pronunciation talent. In G. Dogil & S. Reiterer
(Eds.), Language talent and brain activity (67-96). Berlin and New York: Mounton de
Gruyter.
Ruffino, M., Trussardi, A. N., Gori, S., Finzi, A., Giovagnoli, S., Menghini, D., Benassi, M.,
Molteni, M., Bolzani, R., Vicari, S., & Facoetti, A. (2010). Attentional engagement deficits
in dyslexic children. Neuropsychologia, 48(13), 3793–3801.
Saffran, J. R. (2003). Statistical language learning: Mechanisms and constraints. Current
Directions in Psychological Science, 12(4), 110-114.
Saffran, J. R., Aslin, R. N., & Newport, E. L. (1996). Statistical learning by 8-month-old
infants. Science, 274(5294), 1926-1928.
Safronova, E. (2016). The role of cognitive ability in the acquisition of second language perceptual
phonological competence (Doctoral Dissertation). Retrieved from
https://www.tesisenred.net/bitstream/handle/10803/401326/ELENA_SAFRONOVA_Ph
D_THESIS.pdf?sequence=1&isAllowed=y
Safronova, E., & Mora, J. C. (2012). Acoustic and phonological memory in L2 vowel perception.
In S. Martín Alegre, M. Moyer, E. Pladevall and S. Tubau (Eds.). At a time of crisis:

References
146
English and American studies in Spain. Departament de Filologia Anglesa i de
Germanística, Universitat Autònoma de Barcelona/AEDEAN.
Safronova, E., & Mora, J. C. (2013). Attention control in L2 phonological acquisition. In A. Llanes
Baró, L. Astrid Ciro, L. Gallego Balsá, & R. M. Mateus Serra (Eds). Applied linguistics in
the age of globalization (pp. 109-114). Lleida: Edicions de la Universitat de Lleida.
Sao, T., & Jain, C. (2016). Effects of hormonal changes in temporal perception, speech perception
in noise and auditory working memory in females. Hearing, Balance would and
Communication, 14(2), 94-100.
Schneider, P., Sluming, V., Roberts, N., Bleeck, S., & Rupp, A. (2005). Structural, functional, and
perceptual differences in Heschl's gyrus and musical instrument preference. Annals of the
New York Academy of Sciences, 1060(1), 387-394.
Schneiderman, E., & Desmarais, C. (1988). A neuropsychological substrate for talent in second-
language acquisition. In L. Obler, & D. Fein (Eds.), The exceptional brain: The
neuropsychology of talent and special abilities (103–126). New York. Guild-ford.
Scott, S. K., Rosen, S., Beaman, C. P., Davis, J. P., & Wise, R. J. S. (2009). The neural processing
of masked speech: Evidence for different mechanisms in the left and right temporal lobes.
Journal of Acoustic Society of America, 125(3), 1737-1743.
Seither-Preisler, A., Parncutt, R., & Schneider, P. (2014). Size and synchronization of auditory
cortex promotes musical, literacy, and attentional skills in children. Journal of
Neuroscience, 34(33), 10937-10949.
Shoemaker, E. (2014). The exploitation of subphonemic acoustic detail in L2 speech
segmentation. Studies in Second Language Acquisition, 36(4), 709-731.

References
147
Shutova, M. N., & Orekhova, I. A. (2018). Phonetics in teaching Russian as a foreign
language. Russian Language Studies, 16(3), 261-278.
Sonderegger, M., & Yu, A. (2010). A rational account of perceptual compensation for
coarticulation. In Proceedings of the Annual Meeting of the Cognitive Science
Society (Vol. 32, No. 32).
Skehan, P. (1998). A cognitive approach to language learning. Oxford: Oxford University Press.
Spielberger, C. D., & Gorsuch, R. L. (1983). State-trait anxiety inventory for adults: Manual,
instrument, and scoring guide. Mind Garden, Incorporated.
Stevens, K. N. (2002). Toward a model for lexical access based on acoustic landmarks and
distinctive features. The Journal of the Acoustical Society of America, 111(4), 1872-1891.
Stoet, G. (2017). PsyToolkit: A novel web-based method for running online questionnaires and
reaction-time experiments. Teaching of Psychology, 44(1), 24-31.
Strand, E. A., & Johnson, K. (1996, October). Gradient and visual speaker normalization in the
perception of fricatives. In KONVENS, 14-26.
Su, L. S., Li, K. P., & Fu, K. S. (1974). Identification of speakers by use of nasal coarticulation. The
Journal of the Acoustical Society of America, 56(6), 1876-1883.
Sumner, M. (2011). The role of variation in the perception of accented speech. Cognition, 119(1),
131-136.
Tiede, M. K., Gracco, V. L., Shiller, D. M., Espy-Wilson, C., & Boyce, S. E. (2005). Perturbed
palatal shape and North American English/r/production. The Journal of the Acoustical
Society of America, 117(4), 2568-2569.
Theodore, R. M., & Miller, J. L. (2010). Characteristics of listener sensitivity to talker-specific
phonetic detail. The Journal of the Acoustical Society of America, 128(4), 2090-2099.

References
148
Theodore, R. M., Myers, E. B., & Lomibao, J. A. (2015). Talker-specific influences on phonetic
category structure. The Journal of the Acoustical Society of America, 138(2), 1068-1078.
Thompson, B., Kirby, S., & Smith, K. (2016). Culture shapes the evolution of
cognition. Proceedings of the National Academy of Sciences, 113(16), 4530-4535.
Trecca, F., Bleses, D., Højen, A., Madsen, T.O. & Christiansen, M.H. (2020). When too many
vowels impede language processing. An eye-tracking study of Danish-learning
children. Language and Speech. https://doi.org/10.1177/0023830919893390 [E-pub ahead
of print]
Yanushevskaya, I., & Bunčić, D. (2015). Russian. Journal of the International Phonetic
Association, 45(2), 221-228.
Yu, A. C. (2013). Socio-cognitive processing and the actuation of sound change. Origins of Sound
Change: Approaches to Phonologisation, 201-227.
Yu, A. C., & Zellou, G. (2019). Individual differences in language processing: Phonology. Annual
Review of Linguistics, 5, 131-150.
Veneman, C. E., Gordon-Salant, S., Matthews, L. J., & Dubno, J. R. (2013). Age and measurement
time-of-day effects on speech recognition in noise. Ear and Hearing, 34(3), 288.
Venkatagiri, H. S., & Levis, J. M. (2007). Phonological awareness and speech comprehensibility:
An exploratory study. Language Awareness, 16(4), 263-277.
Verhoeven, L., & Vermeer, A. (2002). Communicative competence and personality dimensions in
first and second language learners. Applied Psycholinguistics, 23(3), 361–374.
Volaitis, L. E., & Miller, J. L. (1992). Phonetic prototypes: Influence of place of articulation and
speaking rate on the internal structure of voicing categories. The Journal of the Acoustical
Society of America, 92(2), 723-735.

References
149
Watson, D., Clark, L. A., & Tellegen, A. (1988). Development and validation of brief measures of
positive and negative affect: the PANAS scales. Journal of Personality and Social
Psychology, 54(6), 1063.
Wells, J. C. (1982). Accents of English: Volume 3: Beyond the British Isles. Cambridge University
Press.
Werker, J. F., & Tees, R. C. (1984). Cross-language speech perception: Evidence for perceptual
reorganization during the first year of life. Infant Behavior and Development, 7(1), 49-63.
Williamson, V. J., Baddeley, A. D., & Hitch, G. J. (2010). Musicians' and nonmusicians' short-
term memory for verbal and musical sequences: Comparing phonological similarity and
pitch proximity. Memory & Cognition, 38(2), 163-175.
Wilson, S. M., Saygin, A. P., Sereno, M. I., & Iacoboni, M. (2004). Listening to speech activates
motor areas involved in speech production. Nature Neuroscience, 7(7), 701.
Winkler, R., Fuchs, S., & Perrier, P. (2006). The relation between differences in vocal tract
geometry and articulatory control strategies in the production of French vowels: Evidence
from MRI and modelling. In Proceedings of the International Seminar on Speech
Production, 509-516.
WordCreator. (2019). Stefan Trost Media [Software]. Retrieved
from https://www.sttmedia.com/wordcreator
Wrembel, M. (2010). L2-accented speech in L3 production. International Journal of
Multilingualism, 7(1), 75-90.
Wright, C.I., Feczko, E., Dickerson, B., & Williams, D. (2007). Neuroanatomical correlates of
personality in the elderly. NeuroImage, 35, 263–272.

References
150
Zellou, G. (2017). Individual differences in the production of nasal coarticulation and perceptual
compensation. Journal of Phonetics, 61, 13-29.
Zobl, H. (1980). The formal and developmental selectivity of LI influence on L2
acquisition. Language Learning, 30(1), 43-57.

151
Appendices
Appendix A. Information about the Russian participants
Table 6. Information about the 16 Russian participants who served as a baseline in the rated dissimilarity task.
Participant Russian-speaking parents
Place of birth Current residency
Other languages spoken
1 Yes Moscow Moscow English 2 Yes Yekaterinburg Yekaterinburg English 3 Yes Yekaterinburg Yekaterinburg English 4 Yes Yekaterinburg Yekaterinburg English 5 Yes Yekaterinburg Yekaterinburg None 6 Yes Moscow Moscow English 7 Yes Gelendzhik Krasnodar English 8 Yes Novosibirsk Yakutsk English 9 Yes Moscow Moscow English
10 Yes Moscow Moscow English 11 Yes St. Petersburg Moscow English 12 Yes Yekaterinburg Moscow English 13 Yes Khabarovsk Khabarovsk English 14 Yes Yekaterinburg Yekaterinburg English 15 Yes Moscow Moscow English, French 16 Yes Moscow Moscow English, French,
Italian

Appendices
152
Appendix B. The online consent form on PsyToolkit.org
Figure 30. The setup screen for the experiment with the acknowledgement of personal data being collected and an option not to participate in the study.

Appendices
153
Appendix C. Questionnaire with the Big Five Inventory (BFI)
ENCUESTA
1. ¿Cuál es tu género?
o Masculino o Femenino o Otro
2. ¿Eres hablante nativo de español europeo? o Sí o No o Soy bilingüe
3. ¿De qué parte de España eres?
4. ¿Qué edad tienes? 5. ¿Qué otros idiomas hablas a un nivel intermedio o superior?
6. ¿Qué idiomas hablan con fluidez tus padres / abuelos / otros parientes cercanos? 7. ¿Has estudiado ruso alguna vez?
8. ¿Escuchas hablar en ruso con frecuencia (en televisión, amigos o vecinos, etc.)? 9. ¿Alguna vez has estudiado lingüística y/o fonética/fonología?
o Sí o No
10. ¿Con cuántas personas en promedio hablas a diario? o 1-5 o 5-10 o Mas de 10
11. ¿Qué tipo de computadora y auriculares estás usando en este momento?
TEST DE PERSONALIDAD

Appendices
154
Figure 31. The short version of the Big Five Inventory as it appeared during the experiment.

Appendices
155
Appendix D. Nonwords in the serial nonword recognition task
Table 7. Stimuli for the serial nonword recognition task (the Spanish CVC nonwords developed using Syllabarium).
Practice block 1 ner tas bol til 2 rrac cen mun bil 3 rus bir nom len
5-item length sequences
1 far gos tud nen sig 2 rer jar ton fir pun 3 sos mir gus dal tem 4 din ted sun gal jos 5 nal fen pol rin nun 6 bul tad som fes sil 7 ler tus tin ran bos 8 pec jun lon lis cas 6-item length sequences 9 cel mon cur sas tir fon 10 nin tes bor lir pal jus 11 cum ges lan sol fer tis 12 ris mag col fun ces tur 13 sar mer fil pul cal ron 14 pen rir gun lam rer for 15 ros dul nis des rac sul 16 ral chis lec tun bom lar 7-item length sequences 17 dor ban cin fut nir jer cor 18 fec duc pos cir pel can jor 19 sis cul dum bal dic cos ren 20 lor cam jem das gis mul sec 21 dac bun lim nes sor lud gan 22 jes tar bas tel lum mor gir 23 tum pes lin mos bur nar gon 24 pis gor Tam bel nor dus fis Note: Items in bold are transposed items.

Appendices
156
Appendix E. Nonwords in the target sound recognition task
Table 8. Stimuli for the target sound recognition task (the Spanish CV nonwords developed using Syllabarium).
Practice block 1 fe ro ro 2 pa ni su 2-item sequences 1 ya lu ya 2 je do do 3 si ta si 4 gu fe fe 5 so be chi 6 na cu θi 7 po cha le 8 di fu no 3-item sequences 9 bu ja ñu bu 10 to de rra de 11 fi ga ru ru 12 fo rri tu fo 13 ye mi da go 14 ro pe ni ju 15 mu rro bi ra 16 la se lo ti 4-item sequences 17 cho pi θe pa cho 18 jo me chu fa me 19 te bo nu θa nu 20 ke ma li rru rru 21 mo che ca yu θa 22 ne ña yo ji su 23 ño ki sa du rre 24 θo re ba ri θu
Note: Items in bold are the same items.
# rotation script for Praat
# low-pass filtered rotated version
# ==================================================================== # rotation script for Praat # low-pass filtered rotated version

Appendices
157
# ==================================================================== form Rotate Sound real Rotation_frequency 2000 word Name_of_new_sound rotated endform Copy... temp d = Get total duration sf = Get sampling frequency Create Sound from formula... sine Mono 0 d sf 1/2*sin(2*pi*rotation_frequency*x) select Sound temp Formula... self * Sound_sine[col] select Sound temp Filter (pass Hann band)... 0 3800 20 Rename: name_of_new_sound$ select Sound temp plus Sound sine Remove

Appendices
158
Appendix F. Acoustic values of the variants of /i/
Figure 32. The names of the orbits, alongside which variants are distributed.
Table 9. F1 and F2 in mels and Hz of the 28 synthesized variants of /i/ and a prototypical /i/.
F1 (mels) F2 (mels) F1 (Hz) F2 (Hz) Prototype /i/ 386 1665 285.9 2367 Vertical orbit 386 1715 285.9 2506.1
386 1765 285.9 2651.6 386 1815 285.9 2803.6 386 1615 285.9 2233.9 386 1565 285.9 2106.6 386 1515 285.9 1984.8 386 1465 285.9 1868.3 386 1415 285.9 1756.8
Horizontal orbit 416 1665 313 2367 446 1665 340 2367 476 1665 367 2367 506 1665 397 2367

Appendices
159
536 1665 426 2367 356 1665 260 2367 326 1665 235 2367 296 1665 210 2367
Diagonal orbit 1 356 1715 260 2506.1 326 1765 234.8 2651.6 416 1615 312.5 2233.9 446 1565 339.8 2106.6 476 1515 367.9 1984.8 506 1465 396.7 1868.3 536 1415 426.3 1756.8
Diagonal orbit 2 416 1715 312.5 2506.1 446 1765 339.8 2651.6 476 1815 367.9 2803.6 356 1615 260 2233.9 326 1565 234.8 2106.6

Appendices
160
Figure 33. Klatt’s parameters.

Appendices
161
Appendix G. Mixed-effects models’ parameters
The results for the analysis of the role of various factors on Perceived Dissimilarity. Recall that
we used the reverse score transformation for Perceived Dissimilarity scores, thus, the
interpretation of the variable is reversed: positive values have become negative, and vice versa.
Table 10. Regression models with Perceived Dissimilarity as a dependent variable.
Regression model
Predictors: Fixed effects + (1|Random effect)
1 Compactness + (1|Subject) + (1|Item)
2 Compactness + Social Network Size + Compactness*Social Network Size + (1|Subject) + (1|Item)
3 Compactness + Social Network Size + (1|Subject) + (1|Item)
4 Compactness + L2 Experience (1|Subject) + (1|Item)
5 Compactness + L2 Experience + Compactness *L2 Experience + (1|Subject) + (1|Item)
6 Compactness + L2 Experience* Social Network Size + (1|Subject) + (1|Item)
7 Openness + Conscientiousness + Extraversion + Agreeableness + Neuroticism + (1|Subject) + (1|Item)
8 Compactness + L2 Experience* Social Network Size + Phonological Sort-term Memory + Acoustic Memory + (1|Subject) + (1|Item)
9 Compactness*Acoustic Memory + L2 Experience* Social Network Size + (1|Subject) + (1|Item)

Appendices
162
Table 11. Model 1: Perceived Dissimilarity ~ Compactness + (1|Subject) + (1|Item)
Predictor b SE t-Value
Intercept 0.1447101 0.0759921 1.904
Compactness 0.0004446 0.0002266 1.962
Table 12. Model 2: Perceived Dissimilarity ~ Compactness + Social Network Size + Compactness*Social Network Size + (1|Subject) + (1|Item)
Predictor b SE t-Value
Intercept 0.1872 0.1388 1.348
Compactness 0.0003979 0.0003669 1.085
Social Network Size: Medium 0.006886 0.1856 0.037
Social Network Size: Small 0.03449 0.2107 0.164
Compactness* Social Network Size: Medium 0.00001469 0.0005441 0.027
Compactness* Social Network Size: Small -0.0004974 0.0006736 -0.738
Table 13. Model 3: Perceived Dissimilarity ~ Compactness + Social Network Size + (1|Subject) + (1|Item)
Predictor b SE t-Value
Intercept 0.2189665 0.0958907 2.284
Compactness 0.0003103 0.0002417 1.284
Social Network Size: Medium 0.0049896 0.0560605 0.089
Social Network Size: Small -0.1091217 0.0576741 -1.892
Table 14. Model 4: Perceived Dissimilarity ~ Compactness + L2 Experience + (1|Subject) + (1|Item)
Predictor b SE t-Value
Intercept 0.1817932 0.0783236 2.321
Compactness 0.0003788 0.0002272 1.667
L2 Experience: No -0.1016615 0.0614717 -1.654
Table 15. Model 5: Perceived Dissimilarity ~ Compactness + L2 Experience + Compactness *L2 Experience + (1|Subject) + (1|Item)
Predictor b SE t-Value

Appendices
163
Intercept 0.1821 0.08553 2.129
Compactness 0.0003778 0.0002510 1.506
L2 Experience: No -0.1032 0.1834 -0.563
Compactness* L2 Experience: No 0.000005635 0.0006130 0.009
Table 16. Model 6: Perceived Dissimilarity ~ Compactness + L2 Experience* Social Network Size + (1|Subject) + (1|Item)
Predictor b SE t-Value
Intercept 0.1758850 0.1042815 1.687
Compactness 0.0002193 0.0002381 0.921
Social Network Size: Medium 0.2048419 0.0953843 2.148
Social Network Size: Small -0.0438336 0.1024117 -0.428
L2 Experience: No -0.0307305 0.1185209 -0.259
Social Network Size: Medium* L2 Experience:
No
-0.2692435 0.1633702 -1.648
Social Network Size: Small* L2 Experience:
No
0.0494521 0.1666693 0.297
Table 17. Model 7: Perceived Dissimilarity ~ Openness + Conscientiousness + Extraversion + Agreeableness + Neuroticism + (1|Subject) + (1|Item)
Predictor b SE t-Value
Intercept 0.37105 0.19935 1.861
Openness -0.03401 0.02855 -1.191
Conscientiousness -0.02432 0.03489 -0.697
Extraversion -0.00562 0.03734 -0.151
Agreeableness 0.00538 0.03422 0.157
Neuroticism 0.04608 0.03323 1.387
Table 18. Model 8: Perceived Dissimilarity ~ Compactness + L2 Experience* Social Network Size + Phonological Sort-term Memory + Acoustic Memory + (1|Subject) + (1|Item)
Predictor b SE t-Value
Intercept 0.3548637 0.1788617 1.984

Appendices
164
Compactness 0.0002125 0.0002273 0.935
Social Network Size: Medium 0.2435400 0.0909702 2.677
Social Network Size: Small 0.0209130 0.1004226 0.208
L2 Experience: No 0.0386289 0.1186641 0.326
Phonological Sort-term Memory 0.0010699 0.0009308 1.149
Acoustic Memory -0.0056986 0.0020104 -2.835
Social Network Size: Medium* L2
Experience: No
-0.3356865 0.1561287 -2.150
Social Network Size: Small* L2 Experience:
No
-0.0241417 0.1609027 -0.150
Table 19. Model 9: Perceived Dissimilarity ~ Compactness*Acoustic Memory + L2 Experience* Social Network Size + (1|Subject) + (1|Item)
Predictor b SE t-Value
Intercept -0.2702 0.418 -0.646
Compactness 0.002308 0.001146 2.014
Acoustic Memory 0.007762 0.00731 1.062
Social Network Size: Medium 0.2461 0.08919 2.760
Social Network Size: Small 0.003302 0.09589 0.034
L2 Experience: No 0.01592 0.1107 0.144
Compactness*Acoustic Memory -0.00003982 0.00002101 -1.895
Social Network Size: Medium* L2 Experience:
No
-0.3302 0.1532 -2.156
Social Network Size: Small* L2 Experience:
No
-0.002672 0.1551 -0.017


![p Simple Beginners Realia [Deduction, Perception Language]](https://img.dokumen.tips/doc/110x75/577c77c51a28abe0548d6cf7/p-simple-beginners-realia-deduction-perception-language.jpg)