Embed Size (px)
Citation preview

The Effect of Fair Value Accounting Choice
On the Ability to Raise Debt
Massimiliano Bonacchi University of Naples “Parthenope”
Antonio Marra
SDA Bocconi School of Management Bocconi University
Ron Shalev*
Stern School of Business New York University
This DRAFT: December 2014 *Corresponding Author: Ron Shalev ([email protected])
Acknowledgements We are grateful to Andrea Toselli (EFRAG TEG Member and Technical Partner in PwC Italy) for helpful comments and suggestions on key issues of the topic. We also thank Elia Ferracuti and Palmira Piedepalumbo for excellent research assistance. We have received helpful comments and suggestions from Matthew Cedergren, Seil Kim, Pepa Kraft, Marco Mattei, Joshua Ronen, Paul Zarowin, and workshop participants at NYU Stern and the University of Padua.
1

The Effect of Fair Value Accounting Choice
On the Ability to Raise Debt
ABSTRACT: We analyze a choice that parent firms face under IFRS: whether to account a business combination under a common control (BCUCC) at fair value or at the historical cost, to provide evidence on the effect that fair value choice may have on firms’ ability to issue debt. A BCUCC is a merger of two entities owned by the same parent firm. Although most of BCUCCs do not materially change parent firm’s fundamentals, they can reduce accounting leverage of the parent firm if recorded at fair value. We find that parent firms are more likely record BCUCCs at fair value when their pre-BCUCC leverage is high and when they have net worth covenants on their debt. Using a propensity score to match firms that used fair value to account for a BCUCC with similar firms that did not conduct a BCUCC, we find that the former are more likely to issue new public debt following the BCUCC. Keywords: Accounting choices; fair value accounting; balance sheet leverage; indebtedness.
2

The Effect of Fair Value Accounting Choice on the Ability to Raise Debt
I. INTRODUCTION
This study explores whether an accounting choice to use fair value to record non-
financial assets affects a firm’s ability to lever. To that end we exploit a unique transaction—a
business combination under a common control (BCUCC). A BCUCC is a merger of two entities
that were owned pre-merger by the same parent company in which the parent firm remains in
control post-merger of the merged entity.1 While U.S. GAAP requires parent firms to record
these transactions at the historical cost on the parent balance sheet, IFRS 3 is silent on the
accounting choice and allows firms to use a consistent policy to record such transactions (IAS
8.10). In practice, parent firms choose between two methods: (1) the acquisition method, which
is consistent with fair value accounting and, (2) carrying the target’s book values on the parent
balance sheet, which is consistent with historical cost accounting. Under the acquisition method
the parent firm performs a purchase price allocation of the target’s assets and liabilities, which
are then recorded at fair values. The purchase price allocation typically involves recording
intangible assets not previously recorded on the parent firm balance sheet and stepping up
assets’ values to the fair values. The likely outcome of choosing this method would be an
increase in the book value of the parent firm and reduction in the accounting leverage. Thus,
while a BCUCC has likely little economic effect on the parent company or its fundamentals, the
outcome could change a parent firm’s balance sheet.
1 Paragraph B1 of IFRS 3 Business Combinations describes a business combination under common control as: “a business combination in which all of the combining entities or businesses are ultimately controlled by the same party or parties both before and after the business combination, and that control is not transitory”. Business combinations under common control are excluded from the scope of IFRS 3.
3
Accounting literature has established the connection between accounting choices and
firms’ debt contracts. Beatty, Ramesh, and Weber (2002) highlight the cost that borrowers bear
for accounting flexibility in debt contracts. Firms’ accounting quality has also been shown to be
important in a public debt setting (Easton, Monahan, and Vasvari 2009). Extant literature
suggests that firms consider the effect on their debt contracts when deciding upon an accounting
choice (Beatty and Weber 2003) and that firms are willing to exploit accounting choices to avert
a negative outcome such a debt covenant violation (DeFond and Jiambalvo 1994; Sweeney
1994). One specific accounting choice that is of particular interest to our study is the use of fair
value to measure the value of assets on the balance sheet.
Because U.S. GAAP does not allow firms to use fair value to measure non-financial
assets, most research on the relation between the fair value choice and firms’ preferences
regarding leverage and changes in leverage is focused on countries that allow using fair value.
Aboody, Barth, and Kasznik (1999) analyze upward revaluations of fixed assets in U.K.
companies and find that while the revaluations are associated with future performance, the
association is much weaker in firms with high debt-to-equity ratio. The authors interpret their
results as suggesting that when firms have an incentive to window dress their balance sheets,
they tend to be opportunistic in applying the option to use fair value to step up their reported
value of assets. In another study based in the U.K., Muller (1999) tests firms’ choice on whether
to capitalize acquired brand names or to write them off immediately to equity. He tests a
leverage hypothesis that firms will tend to capitalize brand names when leverage is high, but
finds no support for the hypothesis. Finally, in a merger and acquisitions (M&A) setting,
Aboody, Kasznik, and Williams (2000) provide evidence of a positive association between
firms’ debt-to-equity ratio and the choice to use the purchase method, not the pooling of interest
4

method to account for acquisitions. Acquisitions under common control provide us with a
unique setting to extend this literature by exploring the effect of the choice to use fair value
accounting to evaluate multiple firm assets on firms’ ability to raise debt. Unlike the common
M&A setting, in which the acquisition may affect the acquiring firm’s fundamentals, the
transaction is not likely to have a meaningful economic effect on the parent of the two merging
subsidiaries in a merger under common control.
Contrary to the above-mentioned papers that largely suggest that firms opportunistically
choose fair value accounting to reduce accounting leverage, a recent study by Christensen and
Nikolaev (2013) provides evidence that the choice to use fair value accounting, in the context of
firm leverage, is an outcome of a firm’s cost efficiency calculation. The authors investigate
firms’ choice under IFRS to commit either to fair value accounting or to historical cost
accounting under certain IFRS standards. Because IFRS objects to situations in which firms
make fair value accounting choices on an ad-hoc basis—and requires firms to develop a policy
with regard to fair value option—this choice is less likely opportunistic. The authors find that
firms that rely more heavily on debt financing tend to commit to use fair value over historical
cost accounting. The authors offer the following explanation: highly levered firms are required
to provide fair value measurement to lenders as part of loan transactions and therefore find it
less costly to reliably estimate, record, and report fair value of non-financial assets on financial
statements.
In this study we add to the above literature by studying whether firms under IFRS can
opportunistically exploit the choice to use fair value in order to reduce accounting leverage in
such a way that allows them to subsequently increase economic leverage without increasing
their capacity to service debt.
5

We identify a sample of European parent firms, of which two subsidiaries of the same
parent went through a business combination and conduct the following analyses:2 We start by
validating our two working assumptions: (1) use of the acquisition method for a BCUCC indeed
results in a decrease in balance sheet leverage. We find that firms that use the acquisition
method experience a large drop in accounting leverage immediately following the BCUCC (the
ratio of debt to equity drops from 64.8% to 49.2% at the median level). A regression analysis
suggests that the change in leverage is explained by the choice of accounting method to record
the BCUCC; (2) a BCUCC does not constitute a material change to parent firms’ fundamentals.
We find that abnormal announcement-day returns are not statistically different from zero for
both fair-value BCUCC parent firms and historical-cost BCUCC parent firms. We also find no
difference in long-term stock performance based on the BCUCC accounting choice.
Next we investigate the leverage hypothesis formalized in Muller (1999). Specifically,
we test whether the likelihood of a parent firm of two merged subsidiaries to choose the
acquisition method to account for the merger rather than the historical cost increases with the
parent firm’s leverage and find that the likelihood of choosing the acquisition method increases
with a firm’s leverage. In that context we also test whether the risk of violating net worth
covenants also drives the choice of a method to record the BCUCC. We focus on net worth
covenants because a purchase price allocation in many cases results in the recording of a
previously unrecorded intangible asset. The newly recorded intangible assets would help a firm
avoid a covenant violation only if these assets are not excluded from the covenant computation.
Net worth covenants do not exclude intangible assets from the covenant computation. We
predict and find that firms with a net worth covenant on their debt are more likely to choose the
acquisition method over the historical cost method.
2 We use the terms “merger and acquisitions” and “business combination” interchangeably.
6

Finally, we test whether accounting a BCUCC at fair value has a real effect on the
public debt market. Because bank debt is largely relationship-based, especially in Europe (Boot
2000; Boot and Thakor 2000), the landing bank likely possesses private information on a
borrower. Thus, window dressing of the balance sheet, while possibly helping to avoid technical
violations of net worth covenants, is likely to be less effective in a bid to raise new debt. Public
debt investors, however, are less likely than banks to fully undo the effect of the BCUCC on a
firm’s balance sheet leverage. Therefore, we focus on the issuance of new public debt and test
the likelihood of firms that record the BCUCC at fair value to issue new bonds following the
merger. Using a propensity score-matching (PSM) technique, we match firms based on the
balance sheet pre-BCUCC leverage and other firm characteristics and identify a control sample
of firms that did not conduct a BCUCC. Analysis of the treatment and the control groups
suggests that a treated firm is more likely than a control group firm to issue new bonds in each
of the four quarters subsequent to the BCUCC. The marginal effect of a fair value BCUCC on
the likelihood of issuing new public debt is of 9.6% at the first quarter following the BCUCC
and of 18.6% in the four quarters following the BCUCC.
Taken together, our results suggest that firms make an accounting choice to use fair
value in order to window dress their balance sheet when they are highly levered and will use the
window-dressed balance sheet to increase their economic leverage without necessarily
increasing their capacity to pay debt.
Our study contributes to the existing literature in the following ways. First, it provides
evidence that reported balance sheet values, holding the economic value of the net assets
constant, may affect firms’ ability to raise new public debt in the market. Thus, firms’
accounting choices can affect firms’ ability to lever. Second, it suggests that even in the context
7

of IFRS, firms may be opportunistic in making a fair value choice when the type of transaction
necessitates a commitment that is less binding. Finally, we provide additional evidence that
firms consider their balance sheet leverage and the risk of violating debt covenants when
making an accounting choice of whether to use fair value when this choice is allowed.
The remainder of the paper proceeds as follows. In Section 2, we review related literature
and develop testable hypotheses. In Section 3, we discuss the sample selection process and
descriptive statistics of the BCUCC population. In Section 4, we present our modeling and the
related empirical results. We conclude in section 5.
II. INSTITUTIONAL BACKGROUND, RELATED RESEARCH, AND HYPOTHESES
DEVELOPMENT
BCUCC and IFRS
A business combination under common control (BCUCC) is a transaction in which all of
the combining entities or businesses are ultimately controlled by the same parent firm before
and after the transaction. BCUCCs represent a broad spectrum of transactions motivated by a
range of different business purposes (e.g., as part of a reorganization or rationalization or in
preparation for a sale of part of a group). In most cases the decision to engage in a BCUCC is
the internal decision of a parent firm and there is no observable market price available for the
transaction. For example, the “transaction price” may include a contribution or distribution
from/to the parent entity. Figure 1 provides an illustration of possible structures of business
combinations under common control.
While U.S. GAAP and IFRS issued identical standards for business combinations
conducted at arm’s length between two transacting parties, BCUCCs are scoped out of the
8

unified standard. U.S. GAAP requires parent firms to record BCUCCs at historical cost and thus
entails no change in firms’ financials as a result of the combination (ASC 805-50-30-05). IFRS
is currently silent on the treatment of BCUCCs. Firms are allowed to decide how to account for
a BCUCC provided they develop a system that will consistently apply the same accounting
method to similar transactions over time. Unlike the fair value option in other IFRS standards,
such as IAS 16–Property Plant and Equipment, and IAS 40–Investment Property in which
similar transactions occur frequently and hence commitment to a consistent accounting method
can be binding, BCUCCs are very infrequent and unique so that each such transaction
practically involves an ad-hoc decision on the accounting method. This situation is viewed by
the International Accounting Standards Board (IASB) as undesirable and thus in 2007 the board
started a project on BCUCCs. The project was put on hold in 2009 and subsequently received
high priority in 2012. The purpose of the project is to find commonalities in BCUCC
transactions to enable the IASB to arrive at a consistent policy. To date no policy has emerged.
Throughout our sample period, two methods are most often chosen to account for business
combinations between entities under common control: the acquisition method, which entails
evaluating a target’s assets at fair value through a purchase price allocation process; and the
predecessor values method, which entails using the historical cost of a target’s net assets that are
recorded on the parent balance sheet. While the former method is likely to increase the value of
a target’s net assets on the parent balance sheet, the latter method does not practically affect the
parent firm balance sheet.
Accounting choices and firm debt
Fields, Lys, and Vincent (2001) define accounting choice as,
“Any decision whose primary purpose is to influence (either in form or substance) the output of the accounting system in a particular way.”
9

In the context of this study, the choice allowed by the IFRS to account for BCUCCs
using the acquisition method effectively allows the parent firm to record multiple assets at fair
value—i.e., to step up the value of recorded assets and record previously unrecorded intangible
assets on the balance sheet. The likely outcome of the fair value choice is an increase in the
value of net assets on the balance sheet and a decrease in accounting leverage, thus helping the
firm avoid technical violations of net worth covenants.
The effort to avoid debt-covenant violations stems from the cost associated with
technical defaults. Beneish and Press (1993) compile a sample of firms that went through a
large-enough technical default and estimate the cost of renegotiating to refinance and restructure
the debt at 0.37% of a firm’s market equity value. Beatty et al. (2002) provide evidence that
borrowers are willing to pay an additional charge in order to retain flexibility in debt contracts
with regard to accounting changes. The authors estimate that for borrowers, the extra cost for
not excluding voluntary and mandatory accounting changes from the covenant calculation at 84
basis points for voluntary changes and 71 points for mandatory changes.
Several studies document firms’ endeavors not to violate debt covenants through
accounting choices made to circumvent debt contract limitations on dividend payments and to
reduce interest rates. DeFond and Jiambalvo (1994) compile a sample of 94 firms that report a
debt-covenant violation and show that these firms use accounting choices to increase earnings
through accruals in the year leading, to the year of, the covenant violation. Sweeney (1994)
compiles a sample of 130 firms that violated covenants and finds that firms respond with
income-increasing accounting changes to the approaching default. The strength of the response
10

is an increasing function of the cost of default and the flexibility allowed to the firm in the debt
contract.
In the context of the fair value accounting choice, academic literature generally suggests
that managers make the fair value choice when they want to reduce balance sheet leverage.
Easton, Eddey, and Harris (1993) survey Australian firm managers on the incentive to revalue
tangible long-lived assets and suggest that the need to maintain low debt-to-equity ratio is an
important factor in the decision to revalue long-lived assets. Aboody et al. (1999) analyze
upward revaluations of fixed assets in the U.K. and find a positive association with firm
performance. They also predict and find that the relation between upward revaluation and future
performance is weaker in the firms with high debt-to-equity ratio, which suggests that while in
general firms use an upward revaluation of fixed assets to convey information to investors, the
incentive to window dress balance sheet leverage also plays a role in the decision to revalue
fixed assets. Courtenay and Cahan (2004) provide similar evidence based on New Zealand firms
and capital markets. Further corroboration of the relation between revaluation of fixed assets
and firms’ leverage is provided by Missonier-Piera (2007) who, focusing on Swiss firms,
provides evidence on a positive association between revaluation of fixed assets and firms’
leverage. Finally in the specific context of business combinations, Aboody et al. (2000) analyze
U.S. firms’ accounting choices to use either the purchase method (similar to the current
acquisition method) or the pooling of interest method (essentially the historical cost) in business
combinations. They argue that firms that are closer to violating debt covenants are more likely
to use the purchase method rather than the pooling method. Empirically, the authors proxy for
closeness to violating debt covenants using debt-to-equity ratio and find that firms are more
likely to choose the purchase method when the debt-to-equity ratio is high. Against the evidence
11

of a positive association between a firm’s choice to use the fair value option to revalue assets
and firm leverage, Muller (1999) does not find support for the “leverage” hypothesis. The
author analyzes U.K. firms’ choices on whether to record purchased brand names on the balance
sheet or to write them off immediately. He finds that the choice is not associated with firms’
debt-to-equity ratio.
Finally, a recent study by Christensen and Nikolaev (2013) exploits the setting of IFRS
“fair value choice,” in which a firm can use either fair value or historical cost to account for
certain long-lived assets and investment under IAS 16–Property Plant and Equipment and IAS
40–Investment Property respectively. These standards allow firms to take a fair value option
with regards to assets covered under the standard. Firm are required, however, that the choice
not be ad-hoc and that they will consistently apply the same method over time. Thus, the
requirement that managers commit to sticking with one accounting method makes it less likely
that the choice is subject to managerial opportunism. The authors find that firms will generally
be more inclined to commit to use the fair value of more liquid assets. In the context of debt
financing, the authors find that firms that rely more heavily on debt financing are more likely to
choose fair value to account for some of their assets. They explain their finding with lenders’
demand for fair value measurement of borrowers’ assets, thus making it less costly for debt-
financed firms to reliably estimate and report the fair value of non-financial assets on financial
reports.
Though IASB mandates that, in regard to a BCUCC, the approach to fair value choice
be consistent over time, in practice the choice made on a BCUCC is ad hoc because firms’
reorganizations, which are the essence of BCUCCs, are typically complicated and infrequent
and thus could be distinguished one from another relatively easily to make a commitment less
12

binding. As most empirical evidence points to firms exploiting opportunities to use fair value to
increase the value of assets on the balance sheet when the balance sheet leverage is high, we
formalize our first testable hypothesis as follows:
H1a: The likelihood of a parent firm to record a BCUCC using the acquisition method
rather than the historical cost method increases with firm leverage.
We also hypothesize that the costs of technical violations of debt covenants may drive
firms to make accounting choices that can avert the risk of violating a covenant. The covenant
that is most obviously affected by the accounting choice for a BCUCC is a net worth covenant.
Whereas intangible assets are excluded from the covenant computations of tangible net worth
covenants, thus neutralizing the effect of any increase in intangible assets through the purchase
price allocation, they are not excluded from net worth covenants. Therefore, the follow-up to the
first hypothesis is:
H1b: The likelihood of a parent firm to record a BCUCC using the acquisition method
rather than the historical cost method increases in firms with net worth covenants on their loans.
So far we have focused on the accounting choice to use fair value accounting to record a
BCUCC. Our conjecture is that firms would want to window dress their balance sheet when
incentivized by debt contracting. The next step is to investigate whether the change in the parent
firm balance sheet following a fair-value BCUCC is associated with the issuance of new public
debt. Our interest is to provide evidence on whether firms can increase their economic
indebtedness without fundamentally increasing their ability to service the debt. In Europe,
because more bank loans are relationship-based than in the U.S. (Boot, 2000; Boot and Thakor,
2000), the quality of information banks possess on borrowers is relatively high and thus
increases the likelihood of banks undoing the effect of the fair-value BCUCC on firms’ balance
13

sheet. Under relationship banking, balance sheet window dressing may still help firms avoid
technical violations of current net worth covenants, but may prove less effective in raising new
bank debt. Window dressing of balance sheet leverage, by contrast, may prove more effective
when issuing public debt where information asymmetries are greater and monitoring is weaker
than in relationship banking. Therefore, we focus on new public debt issuance and predict that
we are likely to observe more bond issuance from firms that have gone through a fair-value
BCUCC relative to comparable firms that did not go through a BCUCC. Hence our second
testable hypothesis is as follows:
H2: Parent firms that used the acquisition method to record a BCUCC are more likely
to issue new public debt in the period following the BCUCC than comparable firms who did not
perform a BCUCC.
III. SAMPLE SELECTION AND DESCRIPTIVE STATISTICS
Sample selection
To identify business combinations under common control (BCUCC), we start with an SDC
database and select acquisitions that satisfy the following requirements: (1) the acquirer has
obtained control over the target in the transaction; (2) the acquirer and target have the same
immediate or ultimate parent company, and (3) the parent company is incorporated and
headquartered within the European Union nations. Our sample period begins in 2005, as it is the
first year in which IFRS was mandatory for the consolidated financial statements of all listed
firms in Europe.3 We drop the sample transactions in which the acquirer, seller, or parent is a
financial institution. To avoid confounding effects, both in the economics of the BCUCC and
3 Christensen, Hail, and Leuz (2013) provide a list of countries shown in Table 1 with relative dates when IFRS reporting becomes mandatory.
14

the accounting classification to acquisition method or historical cost, we drop the sample
transactions in which the parent (or group) was involved in more than one acquisition during the
reporting period. We require parent firms in the sample to have financial and stock price data
available from Compustat Global. After restricting the sample to include only parent firms with
financial and stock price data available, the sample size drops to 421 business combinations
under common control.
Next we classify the business combinations in the sample to acquisition method (fair value)
and historical cost. We use the change in goodwill at the parent firm to identify whether fair
value (acquisition method) was used to account for the BCUCC. Transactions in which the
parent firm reports an increase in goodwill in the BCUCC quarter, 147 in total, are classified as
acquisition method. Transactions in which the parent firm reports no change in goodwill, 83 in
total, are classified as historical cost. The remaining transactions are such that goodwill on the
parent firm balance sheet decreased in the BCUCC quarter. Goodwill impairment on the parent
firm balance sheet can be related to the BCUCC, if the transaction price in the BCUCC is lower
than the carrying value of the target net assets on the parent balance sheet. In that case, both
accounting methods would lead to a similar outcome. The goodwill impairment could also be
unrelated to the BCUCC. In either case, there is no effective way to identify the methods used
to account for the BCUCC. Therefore, we eliminate these transactions from the sample. The
final number of observations used in the analysis is 230. Table 1 reports the sample selection
process in detail.
Descriptive statistics
Table 2, panel A reports a sample breakdown for fair-value BCUCCs and historical-cost
BCUCCs by fiscal year. While the portion of firms within a sample year that choose the
15

acquisition method to account for a BCUCC ranges from 41.94% in 2012 to 79.31% in 2009,
there is no clear clustering across specific years. Table 2, panel B reports industry distribution
using the Fama-French 12-industry classification. The portion of BCUCCs with the fair value
accounting choice ranges from 50% in Energy, Oil, Gas, and Coal Extraction to a high of
84.62% in Chemicals and Allied Products with no clear clustering across industries. Finally,
panel C reports a sample distribution by country of incorporation. The number of BCUCCs
ranges from 1 in Luxemburg to 25 in Germany.
Table 3 reports descriptive statistics of the sample firms, broken down by BCUCC
accounting choice. There is no statistically significant difference between the two groups in
terms of parent firm size, book value, and market-to-book ratio. Firms that use fair value are ex-
ante more profitable in terms of mean return on assets (ROA), but there is no significant
difference for the median ROA. In addition, there is no significant difference between the two
groups in the proportion of BCUCCs in which the parent firm does not fully own the acquirer,
the target, or the immediate parent of the target (MINORITY). With regards to the variables of
interest, firms that choose the acquisition method to account for a BCUCC are ex-ante more
levered with mean (median) pre-combination debt-to-equity ratio (D/E_pre) of 67.2% (64.8)
compared with 54.1% (47.0) for firms that elected to account for a BCUCC using the historical
cost of target net assets. The difference between the means and the medians is significant at the
1% level. Measuring leverage as the debt-to-assets ratio instead of debt-to-equity yields a
similar relation. Further, the post-BCUCC debt-to-equity ratio exhibits a sharp decline for
parent firms that accounted for the BCUCC using fair value when compared to the pre-BCUCC
debt-to-equity ratio with a mean of 58.7% (compared with 67.2 pre-BCUCC) and median of
49.02% (compared with 64.8% pre-BCUCC). Firms that elected to account for the BCUCC
16

using the target’s historical cost of net assets do not exhibit a similar decline. Finally, a larger
portion of the firms that use fair value to account for the BCUCC had a net worth covenant
associated with their bank debt (38.1%) than the firms that use historical cost (24.1%). The
statistics provide preliminary evidence in support of the leverage hypothesis and in line with our
predictions in H1.
IV. RESEARCH DESIGN AND EMPIRICAL FINDINGS
Validity Tests
Two assumptions underlie the analyses conducted in this study. The first assumption is
that accounting for BCUCCs using the acquisition method reduces parent firms’ balance-sheet
leverage and that the reduction is larger than for a BCUCC accounted at the historical cost
method. The second assumption is that a BCUCC does not constitute a material change in a
parent firm’s fundamentals. In this section we validate both assumptions.
BCUCC Reduces Accounting Leverage
We validate our first maintained assumption that the choice to account for a BCUCC
using the acquisition method rather than the historical cost indeed results in a reduction in the
parent firm balance-sheet leverage. It is not ex-ante certain the fair value choice would lead to a
lower accounting leverage. A fair-value BCUCC involves an assessment of a group of assets
and liabilities at fair value. When, for example, the value of target debt on a parent’s balance
sheet was previously recorded at values significantly lower than the fair value or when the
parent firm delayed recording write downs of its assets, the balance sheet leverage could
actually increase. If parent firms really have reducing leverage in mind when they make the
17

accounting choice of fair value to record BCUCC, this choice should actually result in lower
accounting leverage post-BCUCC.
To test this we estimate the following OLS regression:
where LEVERAGE_CH is the change in leverage measured alternatively as the change in debt-
to-equity ratio between post-BCUCC and pre-BCUCC (post-BCUCC debt-to-equity ratio minus
pre-BCUCC debt-to-equity ratio) and the change in debt-to-assets ratio between post-BCUCC
and pre-BCUCC. FV_BCUCC is an indicator variable that takes the value of 1 for a BCUCC
carried out using the acquisition method and zero otherwise. We include the same control
variables that are included and described in detail in the main analysis section.4 Results reported
in Table 4 validate our maintained assumption that the change in leverage is negatively
associated with the choice to account a BCUCC using the acquisition method (debt-to-equity
ratio: coefficient= -0.141; z-stat= -2.63; debt-to-assets ratio: coefficient= -0.068; z-stat= -2.87).
Economically, the choice of fair value to account for a BCUCC results in an average drop of
14.1% in firms’ debt-to-equity ratio and in a 6.8% drop in the debt-to-assets ratio. The results
suggest that the choice to account for a BCUCC using fair value results in a significant drop in
the parent firm accounting leverage.
BCUCC Accounting Choice is not Value Relevant
Extant accounting literature suggests that fair value accounting is value relevant (See
Barth, Beaver and Landsman, 2001, for a review of the literature). Specific to asset revaluation,
Aboody et al. (1999) find that asset revaluations are informative about future firm performance.
Thus, an argument could be made that in the choice of whether to use fair value or historical
4 We only exlude the level of goodwill. The inclusion of this variable does not change results.
𝐿𝐸𝑉𝐸𝑅𝐴𝐺𝐸_𝐶𝐻𝑖 = 𝛽0 + 𝛽1𝐹𝑉_𝐵𝐶𝑈𝐶𝐶𝑖 + 𝛽2−7𝐶𝑂𝑁𝑇𝑅𝑂𝐿𝑆𝑖,𝑡−1 + 𝜀𝑖 , (1)
18

cost to record a BCUCC, managers convey their private information of whether the BCUCC is
expected to create value or not. To alleviate this concern, we conduct several return analyses
that compare fair-value choice parent firms and historical-cost choice parent firms. Specifically,
we perform the following analyses: (1) We compare the average announcement day returns5 of
the two BCUCC groups. We find no statistically significant difference between them. The mean
(median) market adjusted return is 0.1% (0.3%) for the fair-value BCUCC and 0.5% (0.3%) for
the historical cost BCUCC. (2) We follow Aboody et al. (1999) and test whether there are
significant differences in the long-term stock performance between the fair-value BCUCC
parent firms and the historical-cost BCUCC parent firms. Specifically we estimate the following
regression:
We measure the variables in this analysis following Aboody et al. (1999). 𝑅𝐸𝑇𝑈𝑅𝑁𝑖 is
measured as a firm’s stock return in the year starting six months before the BCUCC
announcement. 𝐹𝑉_𝐵𝐶𝑈𝐶𝐶𝑖 is an indicator variable that takes the value of 1 for a BCUCC
carried out using the acquisition method (fair value) and zero otherwise. 𝐸𝐵𝐼𝑇𝐷𝐴𝑖 is parent
firm earnings before depreciation, amortization and interest deflated by the firm market value of
equity in the year starting six months before the BCUCC announcement, and 𝐸𝐵𝐼𝑇𝐷𝐴_𝐶𝐻𝑖 is
the change in 𝐸𝐵𝐼𝑇𝐷𝐴𝑖 from a year leading to the BCUCC to the year following the BCUCC.
We control for industry, country, and year fixed effects.
Table 5 reports the results. We compare fair-value BCUCC parent firms’ performance to
both the Compustat Global universe and to historical-cost parent firms. Column 1 reports the
results for a sample that includes the entire Compustat Global universe. Column 2 reports
5 Results untabulated.
𝑅𝐸𝑇𝑈𝑅𝑁𝑖 = 𝛽0 + 𝛽1𝐹𝑉_𝐵𝐶𝑈𝐶𝐶𝑖 + 𝛽2𝐸𝐵𝐼𝑇𝐷𝐴𝑖 + 𝛽3𝐸𝐵𝐼𝑇𝐷𝐴_𝐶𝐻𝑖 + 𝜀𝑖 . (2)
19

results only for the firms that performed a BCUCC. Both analyses provide consistent evidence
of no statistically significant difference in the long-term returns between firms that performed a
fair-value BCUCC and both firms that performed a historical-cost BCUCC and the entire
universe of Compustat Global firms. In columns 3 and 4 we repeat the analysis of columns 1
and 2 but measure returns following the Fama-French (1993) three-factor model abnormal
returns. Results are qualitatively similar.
The choice of accounting method and the effect on balance sheet leverage
To test the predictions in H1a and H1b that the likelihood of a choice to account for a
BCUCC using the acquisition method increases with the parent firm’s pre-BCUCC leverage and
with the existence of net worth covenants in the parent company bank debt, we estimate the
following logistic regression:
where 𝐹𝑉_𝐵𝐶𝑈𝐶𝐶 is an indicator variable that takes the value of 1 for a BCUCC carried out
using the acquisition method and zero otherwise. The independent variables in the regression
are measured when applicable at the quarter prior to the BCUCC. The variables of interest are
the following: LEVERAGE_pre is a parent firm’s leverage before the BCUCC. It is measured
alternatively as the parent firm’s total book value of debt scaled by the book value of equity or
as the parent firm’s total book value of debt scaled by total assets. COVENANT is an indicator
variable that takes the value of 1 if the parent firm discloses a net worth covenant in the
financial statements footnotes and zero otherwise.6
6 Information on the presence of a net worth-debt covenant is handcollected from the listed parent financial statements in the quarter before the BCUCC took place.
𝐹𝑉_𝐵𝐶𝑈𝐶𝐶𝑖 = 𝛽0 + 𝛽1𝐿𝐸𝑉𝐸𝑅𝐴𝐺𝐸_𝑝𝑟𝑒𝑖 + 𝛽2𝐶𝑂𝑉𝐸𝑁𝐴𝑁𝑇𝑖 + 𝛽3_9𝐶𝑂𝑁𝑇𝑅𝑂𝐿𝑆𝑖,𝑡−1 + 𝜀𝑖 , (3)
20

We include the following control variables in the analysis: firm size (SIZE), firm
market-to-book ratio (MTB), the BCUCC method of payment (CASH), the level of goodwill at
the parent firms (GDW), parent firm performance (ROA), the change in the level capital
expenditure at the parent firm from before to after the BCUCC (CAPEX_CH), and whether the
parent company own 100% of the shares in both merging subsidiaries (MINORITY). SIZE is
measured as the natural logarithm of the parent firm total assets. MTB is measured as the ratio
of the firm market value of equity to its book value of equity. CASH is measured as the cash
percentage of the total consideration paid. We include this variable as the acquisition financing
that may affect the choice of accounting method. GDW is measured as the goodwill on the
parent firm’s balance sheet scaled by the total assets. The level of goodwill on the balance sheet
of the parent firm may affect its willingness to record more goodwill and thus also the choice of
accounting method to record the BCUCC. ROA is measured as income before extraordinary
items scaled by total assets, which is a commonly used measure to control for firm performance.
Parent firm performance may affect the need to issue more debt as well as the probability of
avoiding covenant violations and thus affect the choice of accounting for the BCUCC.
CAPEX_CH is measured as the difference between averages over four fiscal quarters of post-
BCUCC quarterly-cash flow statement reported-capital expenditure and the pre-BCUCC capital
expenditure. We control for change in the capital expenditure to account for firms’ need of cash
for investment. Greater need for cash is likely to be positively associated with the need to
window dress the balance sheet in order to help in raising debt. MINORITY is an indicator
variable that takes the value 1 if the parent firm is not a sole owner throughout the chain of
ownership in both the acquirer and the target in the BCUCC and zero otherwise. We control for
the existence of a minority interest in one of the transaction parties because such an existence
21

could affect the transaction terms and ultimately the accounting choice for the BCUCC. In all
analyses we include year, industry, and country of incorporation fixed effects.
Results are reported in Table 6. Column 1 reports results for pre-BCUCC debt-to-equity
ratio as the explanatory variable, column 2 reports results for pre-BCUCC debt-to-total assets
ratio as the explanatory variable, column 3 reports results for the existence of a net worth
covenant as the explanatory variable and columns 4 and 5 report results for regressions that
include both explanatory variables (where debt-to-equity and debt-to-assets alternatively
measure leverage). Regression analyses provide results consistent with the empirical predictions
in H1a and H1b. Both coefficients on LEVERAGE_ pre (debt-to-equity ratio: coefficient=3.509,
z-stat=2.87, debt-to-assets ratio: coefficient=1.368, z-stat=2.51) and COVENANT (column 3:
coefficient=1.026, z-stat=2.29) are positive and significant. These results suggest that when
making the choice of whether to use the acquisition method or the historical cost of a target’s
net assets, managers consider the balance sheet leverage and whether the choice would affect
the likelihood of violating debt covenants.
Fair-value BCUCC and the ability to raise public debt
In this section we test whether parent firms of subsidiaries that engaged in BCUCCs and
chose to conduct a purchase price allocation to step up the value of net assets actually take
advantage of the decrease in balance sheet leverage and issue more debt. The purpose of this
analysis is to investigate whether the accounting choice for a BCUCC has a real measurable
effect. In order to test whether the change in balance sheet results with the issuing of more
public debt, we match our sample of firms, which conducted fair-value BCUCCs, with a sample
of firms with similar pre-BCUCC characteristics. For each parent firm that conducted a fair-
value BCUCC we identify a matched firm based on characteristics described below. We then
22

pool the two groups of firms and perform our analysis. To identify a matching firm to each firm
in the fair-value BCUCC subsample (treatment group) we apply a propensity score-matching
(PSM) procedure developed by Rosenbaum and Rubin (1983), extended by Heckman, Ichimura,
and Todd (1997), and introduced to the accounting literature by Armstrong, Jagolinzer, and
Larcker (2010). Specifically, we estimate the following logit regression:
𝐹𝑉_𝐵𝐶𝑈𝐶𝐶𝑖 = 𝛽0 + 𝛽1𝐿𝐸𝑉𝐸𝑅𝐴𝐺𝐸_𝑝𝑟𝑒𝑖 + 𝛽2𝑆𝐼𝑍𝐸𝑖 + 𝛽3𝑀𝑇𝐵𝑖 + 𝛽4𝐶𝐴𝑃𝐸𝑋_𝐶𝐻𝑖 + 𝛽5𝑅𝐸𝑆𝐸𝐴𝑅𝐶𝐻𝑖 + 𝛽6𝐸𝐵𝐼𝑇𝐷𝐴_𝐶𝐻𝑖 + 𝜀𝑖 ,
(4)
where FV_BCUCC is an indicator variable equal to 1 if a parent firm accounted for a BCUCC
using the acquisition method and zero otherwise. LEVERAGE_pre is a firm’s leverage before
the BCUCC. It is measured alternatively as the parent firm’s total book value of debt scaled by
the book value of equity or as the parent firm’s total book value of debt deflated by total assets.
SIZE is the natural logarithm of the parent firm’s total assets. MTB is the ratio of the firm’s
market value of equity to its book value of equity. CAPEX_CH is the change in capital
expenditure from pre-BCUCC to post-BCUCC. RESEARCH is the ratio of research expense to
sales at the parent company. Research expense gives rise to unrecognized intangible assets off
the firm’s balance sheet. These assets are likely to be recorded if fair value is chosen. The
ability to record previously unrecorded intangible assets may affect the BCUCC accounting
choice. Ideally, research should be measured at the acquisition target-firm level. Since financial
data on subsidiaries is not available, we use data at the parent-firm level. 𝐸𝐵𝐼𝑇𝐷𝐴_𝐶𝐻𝑖 is the
change in operating income before depreciation and amortization deflated by the parent market
value of equity. We include this variable as a proxy for parent firm performance to account for
the possibility that despite our described above validity test results Aboody et al. (1999),
23

evidence on the value relevance of fair value revaluation holds for our treatment firms.7 We also
include industry, country, and year fixed effects. We use a one-to-one nearest-neighbor
matching without replacement (Heckman et al. 1997), restricting the attention to a falling
propensity score in the common support for both groups (Smith and Todd 2005).8 By using the
predicted probabilities —propensity scores—from the logistic regression, we then match each
fair-value BCUCC observation with the observation from the control group, which minimizes
the absolute value of the difference between propensity scores.9 In order to avoid matched pairs
with significant differences in the propensity score, we also impose a tolerance level on the
maximum propensity score distance smaller than 0.5% (caliper). Table 7 reports the propensity-
score estimation results based on a pool of 150,329 observations.10 Panel A of Table 7 reports
results of the PSM regression and panel B of Table 7 reports descriptive statistics of the
treatment firms and control firms with respect to matching variables. Reported statistics suggest
that the matching process results in a control group of firms that is very similar to the treatment
group in all the important respects (i.e., size, leverage, fixed-asset investment plans, research
expense, changes in EBITDA, industry, country, and year).
We then pool the matched firms produced by the PSM process with the firms that
conduct fair-value BCUCC and test whether the likelihood of issuing new public debt is
different between the two groups. H2 predicts that firms that conducted fair-value BCUCCs are
more likely than the matched firms to issue new public debt in the period shortly following the
7 Results are qualitatively similar if we do not match based on this variable. 8 The common support condition drops observations in which the propensity score is smaller than the minimum and larger than the maximum in the opposite group. This restriction rules out the phenomenon of perfect predictability; i.e., it ensure that firms with the same X values have positive propabilities of being both treated or not. 9 We also use additional PSM modeling, with unchanged results (see for details sensitivity and robustness check section). 10 We report results only for the debt-to-equity measure of leverage. Results are qualitativly similar when we use debt to assets.
24

BCUCC. We start with a univariate comparison of a proportion of firms that issued new bonds
in the four fiscal quarters immediately following the BCUCC between the two groups—the fair-
value BCUCC firms and the subsample of matched firms. Because issuing new debt could also
serve to replace old debt that was paid, without effectively increasing indebtedness, we require
that a firm’s debt level increase following the new debt issuance. Table 8, panel A reports
results. In the quarter immediately following the BCUCC, 13% of the fair-value BCUCC firms
issued new public debt compared with 4.1% of the control firms. The difference persists for
three additional quarters in which the cumulative proportion of firms issuing new public debt is
21.9% for fair-value BCUCCs and 7.5% for the matched sample. All differences are statistically
significant at the 1% level. These differences suggest that firms that conduct fair-value
BCUCCs are more likely than similar firms that did not conduct fair-value BCUCCs to issue
new bonds in the periods following the BCUCC.
Next, we use a regression analysis to test whether controlling for additional factors can
change the inference drawn from the univariate analysis. To that end, we estimate the following
logistic regression:
𝐼𝑆𝑆𝑈𝐸𝑖,𝑡+1_𝑡+4 = 𝛽0 + 𝛽1𝐹𝑉_𝑖 + 𝛽2𝑆𝐼𝑍𝐸𝑖,𝑡−1 + 𝛽3𝐿𝐸𝑉𝐸𝑅𝐴𝐺𝐸_𝑝𝑟𝑒𝑖,𝑡 + 𝛽4𝐶𝐴𝑃𝐸𝑋_𝐶𝐻𝑖 + 𝛽5𝑅𝐸𝑆𝐸𝐴𝑅𝐶𝐻𝑖,𝑡−1 + 𝛽6𝐸𝐵𝐼𝑇𝐷𝐴_𝐶𝐻𝑖 + 𝜀𝑖 ,
(5)
where ISSUE is an indicator variable that takes the value of 1 if a sample firm satisfies the two
following conditions: (1) The firm issues new debt in the four quarters post-BCUCC, and (2)
the levels of debt on the firm’s balance sheet increased following the debt issuance and zero
otherwise. FV_BCUCC is an indicator variable that takes the value of 1 for a parent firm that
recorded a BCUCC using the acquisition method and zero otherwise. SIZE is the natural
logarithm of a firm’s total assets. LEVERAGE_pre is a firm’s leverage before the BCUCC.
CAPEX_CH is the change in capital expenditure from pre-BCUCC to post-BCUCC.
25

RESEARCH is the ratio of research expense to sales at the parent company. 𝐸𝐵𝐼𝑇𝐷𝐴_𝐶𝐻𝑖 is the
change in operating income before depreciation and amortization deflated by parent market
value of equity. Results are reported in Table 8, panel B, column 1 reports results for a new
bond issuance in the first quarter following the BCUCC and columns 2 (3 and 4) reports results
for the first two (three and four) quarters following the BCUCC. Consistent with H2, as well as
with evidence from the univariate analysis, firms that engage in fair-value BCUCCs are more
likely to issue new public debt following the BCUCC. The coefficient on FV_BCUCC is
positive and significant at the 1% level across all regressions. Economically, the effect of a fair
value BCUCC is no trivial. The marginal effect of a fair value BCUCC on the likelihood of
issuing new public debt is of 9.6% at the first quarter following the BCUCC and of 18.6% in the
four quarters following the BCUCC. These results suggest that parent firms take advantage of
the “face lifted” balance sheet and issue new public debt following a fair-value BCUCC. One
can also infer from these results that fair value accounting choices could help firms increase the
capacity of indebtedness without a real change in their capacity to service the debt.
Sensitivity tests and robustness checks
In principle, one cannot rule out the possibility that our results are not the outcome of a
firm’s accounting choice to use fair values to account for the BCUCC but of the BCUCC
proper. For example, one may argue that a BCUCC makes the structure of a conglomerate more
compact and thus less opaque and easier for potential bondholders to understand, which thus
reduces the cost of borrowing and prompts firms to issue more public debt. Therefore, in this
section we conduct a “placebo” (falsification) test. Specifically, we examine whether parent
firms that conduct a BCUCC but choose to account it at the historical cost of the target net
assets recorded on their balance sheet, instead of at fair value, exhibit an increase in public debt
26

issuance similar to the one observed in fair-value BCUCC firms when compared to a matched
sample of firms. Angrist and Krueger (1999) explain that this test refers to testable predictions
for groups in which the treatment effect (an increase in public debt issuance) is expected to be
absent because the treatment (using fair value to account for the BCUCC) does not exist.
We follow the same steps applied in the analysis performed on the firms that account for
a BCUCC using the acquisition method: we first identify matched control firms to the treatment
sample firms (firms that account for BCUCC using the historical cost) and then test whether
there is a difference between the two groups.
Table 9 panels A and B report the logistic propensity-score regression to identify the
matched firms and statistics of the treatment and the control groups. Reported statistics suggest
that the matching process results in a control group of firms that is very similar to the treatment
group in the important respects. Table 10, panels A and B report results for analyses similar to
Table 8 but for firms that used a target’s historical cost to account for a BCUCC. Across both
analyses (univariate and regression) we observe no difference between the treatment firms and
the matched firms, suggesting that the increase in debt issuance is not likely an outcome of the
decision to conduct a BCUCC per-se.
We also perform an additional set of robustness tests. First, following Armstrong et al.
(2010), we alter the PSM algorithm to require matches from firms with the same industry year,
where industries are defined according to the Fama-French 12-industry classification (results
untabulated). This procedure produces fewer matches but does not alter our inferences. Second,
in the propensity score-matching procedure we also use capital expenditures (CAPEX) levels
instead of their changes. Third, in measuring new debt issues (ISSUE_Q1 to Q4) we use
different specifications for this dependent variable (such as non-cumulative measures). Finally,
27

we exclude the countries of Switzerland and Turkey, which are not members of the European
Union, one by one and together from our sample and re-run our analyses. Results remain
qualitatively unchanged in all the additional specifications.
V. CONCLUSION
In this study we use a unique setting to investigate the effects of allowing firms the
choice to use fair value to reevaluate non-financial assets. While this choice is not liberally
permitted, especially in the U.S., recently evolving accounting is more tolerant to the idea. We
show that fair value choice can be used to window dress a balance sheet in a way that reduces
accounting leverage and avoids covenant violation, which in turn enables firms to accumulate
more debt. Taken together, the evidence provided in this study suggests that a firm’s fair value
accounting choice may have a real effect on borrowers and lenders in such way that can
increase corporate real indebtedness without increasing the firm’s ability to serve that debt.
Note that we do not attempt to make a normative statement on whether this effect is desirable or
not, however, evidence suggests that a fair value accounting choice could have a real effect on
firms’ economic indebtedness.
28

References Aboody, D., M. E. Barth, and R. Kasznik. 1999. Revaluations of fixed assets and future firm
performance: Evidence from the UK. Journal of Accounting and Economics 26 (1–3): 149-178.
Aboody, D., R. Kasznik, and M. Williams. 2000. Purchase versus pooling in stock-for-stock acquisitions: Why do firms care? Journal of Accounting and Economics 29 (3): 261-286.
Angrist, J. D., and A. B. Krueger. 1999. Empirical strategies in labor economics. In Handbook of Labor Economics, edited by C. A. Orley and C. David: Elsevier, 1277-1366.
Armstrong, C. S., A. D. Jagolinzer, and D. F. Larcker. 2010. Chief Executive Officer Equity Incentives and Accounting Irregularities. Journal of Accounting Research 48 (2): 225-271.
Barth, M. E., W. H. Beaver, and W. R. Landsman. 2001. The relevance of the value relevance literature for financial accounting standard setting: another view. Journal of Accounting and Economics 31 (1-3): 77-104.
Beatty, A., K. Ramesh, and J. Weber. 2002. The importance of accounting changes in debt contracts: the cost of flexibility in covenant calculations. Journal of Accounting and Economics 33 (2): 205-227.
Beatty, A., and J. Weber. 2003. The effects of debt contracting on voluntary accounting method changes. The Accounting Review 78 (1): 119-142.
Beneish, M. D., and E. Press. 1993. Costs of technical violation of accounting-based debt covenants. Accounting Review 68 (2): 233-257.
Boot, A. W., and A. V. Thakor. 2000. Can relationship banking survive competition? The Journal of Finance 55 (2): 679-713.
Boot, A. W. A. 2000. Relationship Banking: What Do We Know? Journal of Financial Intermediation 9 (1): 7-25.
Christensen, H. B., L. Hail, and C. Leuz. 2013. Mandatory IFRS reporting and changes in enforcement. Journal of Accounting and Economics 56 (2–3): 147-177.
Christensen, H. B., and V. V. Nikolaev. 2013. Does fair value accounting for non-financial assets pass the market test? Review of Accounting Studies 18 (3): 734-775.
Courtenay, S. M., and S. F. Cahan. 2004. The impact of debt on market reactions to the revaluation of noncurrent assets. Pacific-Basin Finance Journal 12 (2): 219-243.
DeFond, M. L., and J. Jiambalvo. 1994. Debt covenant violation and manipulation of accruals. Journal of Accounting and Economics 17 (1–2): 145-176.
29

Easton, P. D., P. H. Eddey, and T. S. Harris. 1993. An investigation of revaluations of tangible long-lived assets. Journal of Accounting Research 31 (supplement): 1-38.
Easton, P. D., S. J. Monahan, and F. P. Vasvari. 2009. Initial Evidence on the Role of Accounting Earnings in the Bond Market. Journal of Accounting Research 47 (3): 721-766.
Fama, E. F., and K. R. French. 1993. Common risk factors in the returns on stocks and bonds. Journal of Financial Economics 33 (1): 3-56.
Fields, T. D., T. Z. Lys, and L. Vincent. 2001. Empirical research on accounting choice. Journal of Accounting and Economics 31 (1-3): 255-307.
Heckman, J. J., H. Ichimura, and P. E. Todd. 1997. Matching As An Econometric Evaluation Estimator: Evidence from Evaluating a Job Training Programme. The Review of Economic Studies 64 (4): 605-654.
Missonier-Piera, F. 2007. Motives for fixed-asset revaluation: An empirical analysis with Swiss data. The International Journal of Accounting 42 (2): 186-205.
Muller, K. A. 1999. An examination of the voluntary recognition of acquired brand names in the United Kingdom. Journal of Accounting and Economics 26 (1–3): 179-191.
Rosenbaum, P. R., and D. B. Rubin. 1983. The central role of the propensity score in observational studies for causal effects. Biometrika 70 (1): 41-55.
Smith, J., and P. Todd. 2005. Does matching overcome LaLonde's critique of nonexperimental estimators? Journal of Econometrics 125 (1–2): 305-353.
Sweeney, A. P. 1994. Debt-covenant violations and managers' accounting responses. Journal of Accounting and Economics 17 (3): 281-308.
30

APPENDIX A Variable Definitions
Variable Definitions ASSETS The book value of total assets. BVE The book value of equity at the end of the quarter before the BCUCC. HC_BCUCC An indicator variable that takes the value of 1 for a firm that accounted for
a BCUCC using the historical cost and 0 otherwise. CAPEX_CH Mean change in the cash capital expenditure before and after the
combination computed as: the average of four quarters cash capital expenditure on total assets post-BCUCC minus the average of four quarters cash capital expenditure on total assets before the combination. The BCUCC quarter is excluded.
CASH The percentage of cash of the total purchase price. COVENANT An indicator variable that takes the value of 1 if the firm has a net worth
covenant and 0 otherwise. EBITDA Earnings before interest, tax, depreciation, and amortization scaled by the
firm market value of equity. EBITDA_CH The change in EBITDA from the six months leading to the BCUCC to the
six months following the BCUCC. FV_BCUCC An indicator variable that takes the value of 1 for a firm that accounted for
a BCUCC using the acquisition method and 0 otherwise GDW Goodwill on the balance sheet as a percentage of ASSETS. HC_BCUCC An indicator variable that takes the value of 1 for a firm that accounted for
a BCUCC using the historical cost and 0 for a matched firm produced by the PSM procedure.
ISSUE_Qn An indicator variable that takes the value of 1 if the firm issues new public debt after the BCUCC.
LEVERAGE Either debt in current liabilities + long-term debt divided by book value of equity (D/E) or debt in current liabilities + long-term debt divided by total assets (D/TA).
LEVERAGE_CH The change in LEVERAGE, measured as LEVERAGE at the quarter-end after the BCUCC minus LEVERAGE at the quarter-end prior to the BCUCC.
LEVERAGE_pre Leverage before the BCUCC. MINORITY An indicator variable that takes the value of 1 if the parent firm does not
own 100% of the share of either the target or the acquirer. MTB The ratio of the market value of equity to the book value of equity at the
end of the quarter of the BCUCC MVE The ratio of the market value of equity to the book value of equity. RETURN The stock return measured from six months before the announcement date
to six months after the announcement date. ROA The return on assets, measured as earnings before extraordinary items
divided total assets at the beginning of the period. SIZE The natural logarithm of ASSETS.
31

FIG. 1. Examples of business combinations under common control.
Acquirer Ultimate Parent = Target Ultimate Parent Acquirer Ultimate Parent = Target Immediate Parent
Acquirer Immediate Parent = Target Ultimate Parent Acquirer Immediate Parent = Target Immediate Parent
32

TABLE 1. Sample Selection Procedure
BCUCC deals identification Acquisitions BCUCC involving European-listed firms between 2005 and 2012 3,882 (Less) BCUCC in which the acquirer, seller, or parent is a financial institution. (1,130) (Less) Buybacks (230) (Less) BCUCC in which parent (or group) is involved in another business combination during the same quarter.
(1,660)
BCUCC sample 862
(Less) Parent missing data on Compustat (441) (Less) Parent missing goodwill data (191) Final Sample 230
33

TABLE 2. Sample Distribution
Panel A: Accounting Treatment of BCUCCs
Accounting Treatment Acquisitions # %
Acquisition Method (Fair Value) 147 63.91 Historical Cost 83 36.09 TOTAL 230 100.0 Panel B: Fair-Value and Historical-Cost BCUCCs by Fiscal Year Fiscal Year
Fair Value (n = 147)
Historical Cost (n = 83)
# % # % 2005 11 55.00% 9 45.00% 2006 21 77.78% 6 22.22% 2007 24 70.59% 10 29.41% 2008 16 55.17% 13 44.83% 2009 23 79.31% 6 20.69% 2010 16 69.57% 7 30.43% 2011 23 62.16% 14 37.84% 2012 13 41.94% 18 58.06% TOTAL 147 83
Panel C: Fair-Value and Historical-Cost BCUCCs by the Fama-French 12-Industry Classification
Fama-French Industry Fair Value (n = 147)
Historical Cost (n = 83)
# % # % Non-Durables 15 62.50% 9 37.50% Durables 9 60.00% 6 40.00% Manufacturing 30 65.22% 16 34.78% Energy, Oil, Gas, and Coal Extraction 2 50.00% 2 50.00% Chemicals and Allied Products 11 84.62% 2 15.38% Business Equipment 21 72.41% 8 27.59% Telephone and Television 7 70.00% 3 30.00% Utilities 6 75.00% 2 25.00% Wholesale, Retail, and some Services 9 64.29% 5 35.71% Healthcare, Medical Equip, and Drugs 7 70.00% 3 30.00% Other 30 52.63% 27 47.37% TOTAL 147 83
34

Panel D: Fair-Value and Historical-Cost BCUCCs by Headquarter Countries COUNTRY
Fair Value (n = 147)
Historical Cost (n = 83)
# % # % Austria 3 60.00% 2 40.00% Belgium 6 66.67% 3 33.33% Denmark 7 63.64% 4 36.36% Finland 15 78.95% 4 21.05% France 18 50.00% 18 50.00% Germany 25 80.65% 6 19.35% Greece 1 50.00% 1 50.00% Italy 11 73.33% 4 26.67% Luxembourg 1 100.00% 0 0.00% Netherlands 7 70.00% 3 30.00% Norway 2 66.67% 1 33.33% Poland 9 75.00% 3 25.00% Portugal 6 75.00% 2 25.00% Spain 7 77.78% 2 22.22% Sweden 8 72.73% 3 27.27% Switzerland 8 50.00% 8 50.00% Turkey 3 33.33% 6 66.67% United Kingdom 10 43.48% 13 56.52% TOTAL 147 83
35

TABLE 3. Descriptive Statistics by Accounting Method
Fair Value (n = 147)
Historical Cost (n = 83) p-value
Variables Obs. Mean Median Obs. Mean Median t-test Wilcoxon MVE (€ mil.) 147 5,923.6 846.2 83 6,191.4 842.1 -267.8 4.120 BVE (€ mil.) 147 2,845.4 552.2 83 2,208.4 303.0 637.0 249.2 MTB 147 2.801 1.568 83 2.900 1.771 -0.098 -0.203 ASSETS (€ mil.) 147 8,828.7 2,167.9 83 6,926.2 1,064.8 1,902.5 1,103.1* ROA 147 0.045 0.022 83 0.015 0.018 0.030* 0.004 D/E_pre 147 0.672 0.648 83 0.541 0.470 0.131*** 0.178*** D/E_post 147 0.587 0.492 83 0.535 0.436 0.052 0.056 D/TA_pre 147 0.295 0.279 83 0.220 0.216 0.075*** 0.063*** D/TA_post 147 0.249 0.250 83 0.233 0.206 0.016 0.044 GDW 147 0.143 0.097 83 0.117 0.063 0.026* 0.034*** COVENANT 147 0.381 83 0.241 0.140** CASH (%) 147 19.686 0.000 83 22.626 0.000 -2.940 0.000 CAPEX_CH 147 0.185 0.000 83 0.203 -0.000 0.017 0.000 MINORITY 147 0.388 83 0.325 -0.062 MVE is the market value of equity measured as the closing price at fiscal quarter-end times the number of shares outstanding at fiscal quarter-end. BVE is the book value of equity. MTB is the ratio of the market value of equity to the book value of equity. ASSETS is the book value of total assets. ROA is return on assets measured as earnings before extraordinary items divided total assets at the beginning of the period. D/E_pre(post) is debt in current liabilities + long-term debt divided by book value of equity, measured as of the quarter prior (after) to the BCUCC. D/TA_pre(post) is the debt in current liabilities + long-term debt divided by total assets, measured as of the quarter prior (after) to the BCUCC. GDW is goodwill scaled by total assets on the parent firm balance sheet. COVENANT is an indicator variable that takes the value of 1 if the firm has a net worth covenant and 0 otherwise. CASH is the percentage of cash of the total consideration paid. CAPEX_CH is the average four quarters post-BCUCC cash capital expenditure deflated by total assets minus the average four quarters pre-BCUCC cash capital expenditure on total assets. MINORITY is an indicator variable that takes the value of 1 if the parent firm does not own 100% of the share of either the target or the acquirer. Control variables are measured where applicable, at the period before the BCUCC.
36

TABLE 4. Change in Leverage Following a BCUCC
𝐿𝐸𝑉𝐸𝑅𝐴𝐺𝐸_𝐶𝐻𝑖 = 𝛽0 + 𝛽1𝐹𝑉_𝐵𝐶𝑈𝐶𝐶𝑖 + 𝛽2𝑆𝐼𝑍𝐸𝑖 +𝛽3𝑀𝑇𝐵𝑖 + 𝛽4𝐶𝐴𝑆𝐻𝑖 + 𝛽5𝐶𝐴𝑃𝐸𝑋_𝐶𝐻𝑖+ 𝛽6𝑅𝑂𝐴𝑖+ 𝛽7𝑀𝐼𝑁𝑂𝑅𝐼𝑇𝑌𝑖 + 𝜀𝑖
Column 1 Column 2 Variables Prediction D/E D/TA Intercept
-0.065
(-0.48) 0.022
(0.50) FV_BCUCC -/+/-/+
-0.141***
(-2.63) -0.068***
(-2.87) SIZE ?
-0.004**
(-2.19) -0.005***
(-5.43) MTB ?
0.004
(0.65) 0.001
(0.72) CASH ?
-0.000
(-0.31) 0.001*
(1.71) CAPEX_CH ?
0.016
(0.88) -0.001
(0.13) ROA ?
0.243*
(1.85) 0.031*
(1.84) MINORITY ?
0.027
(0.60) 0.022
(0.51) Industry, Country, and Year Fixed Effects Yes Yes # of Observations 230 230 R-squared 0.182 0.167 This table reports results of an analysis of the change in leverage following a BCUCC. Column 1 (2) reports results for an analysis in which leverage is measured using pre-BCUCC debt-to-equity (debt to assets) ratio. Z-statistics are reported in parentheses ***, **, and * denote significance at the 1%, 5%, or 10% level, respectively. Reported p-values are based on two-tailed significance levels. The dependent variable is LEVERAGE_CH, change in LEVERAGE measured as LEVERAGE at the quarter end after the BCUCC minus LEVERAGE at the quarter end prior to the BCUCC; LEVERAGE is either debt in current liabilities + long-term debt divided by book value of equity (D/E) or debt in current liabilities + long-term debt divided by total assets (D/TA). The variable of interest is FV_BCUCC, an indicator variable equal to 1 if the firm engaged in a BCUCC carried out at fair value and 0 otherwise. We include the following controls: SIZE is the natural logarithm of total assets in the quarter end prior to the BCUCC; MTB is the ratio of the market value of equity to the book value of equity; CASH is the percentage of cash of the total consideration paid; CAPEX_CH is the average four quarters post-BCUCC cash capital expenditure deflated by total assets minus the average four quarters pre-BCUCC cash capital expenditure on total assets; ROA is return on assets measured as earnings before extraordinary items divided by total assets at the beginning of the period; MINORITY is an indicator variable that takes the value of 1 if the parent firm does not own 100% of the share of either the target or the acquirer. Control variables are measured where applicable, at the period before the BCUCC. All continuous variables are winsorized at 1%. Standard errors are clustered by firm and fiscal year.
37

This table reports results of an analysis of parent firms’ stock performance around the BCUCC. T-statistics are reported in parentheses ***, **, and * denote significance at the 1%, 5%, or 10% level, respectively. Reported p-values are based on two-tailed significance levels. Columns 1 and 3 report results for the full Compustat global sample. Columns 2 and 4 report results for the sample of firms that engaged in a BCUCC. Column 1 and 2 compute returns from six months before the announcement date to six months after the announcement, following Aboody et al (1999). Columns 3 and 4 compute returns from six months before the announcement date to six months after the announcement, using the Fama-French (1993) three factor model returns. The variable of interest is FV_BCUCC, an indicator variable equal to 1 if the firm engaged in a BCUCC carried out at fair value and 0 otherwise. We include the following controls: EBITDA is the earnings before interest, tax, depreciation, and amortization scaled by total assets reported in the six months following the BCUCC; EBITDA_CH is the change in EBITDA from the six months leading to the BCUCC to the six months following the BCUCC. Control variables are measured where applicable, at the period before the BCUCC. All continuous variables are winsorized at 1%, and the standard errors are allowed to cluster by firm.
𝑅𝐸𝑇𝑈𝑅𝑁𝑖 = 𝛽0 + 𝛽1𝐹𝑉_𝐵𝐶𝑈𝐶𝐶𝑖 + 𝛽2𝐸𝐵𝐼𝑇𝐷𝐴𝑖 + 𝛽3𝐸𝐵𝐼𝑇𝐷𝐴_𝐶𝐻𝑖 + 𝜀𝑖
TABLE 5. Are Fair-Value BCUCCs Value Relevant? A Validity Test
Aboody et al. (1999)
Fama-French (1993) Column 1
Column 2
Column 3
Column 4
Variables Full Sample
BCUCC Sample
Full Sample
BCUCC Sample
Intercept 0.084* 0.052 -0.287*** 0.077 (1.95) (0.18) (-5.21) (0.43) FV_BCUCC -0.045 -0.003 0.050 0.054
(-0.69) (-0.03) (1.20) (0.85) EBITDA 0.000*** 0.020** 0.000** 0.005**
(7.68) (2.35) (2.11) (2.12) EBITDA_CH 0.000*** 0.602*** 0.000*** 0.277***
(2.89) (3.41) (6.26) (3.46) Industry, Country, and Year Fixed Effects
Yes Yes Yes Yes
# of Observations 44,332 230 45,607 230 R-squared 0.218 0.375 0.112 0.225
38

TABLE 6. The Effect of Ex-Ante Leverage and the Existence of Net Worth Covenant on the Fair Value Accounting Choice 𝐹𝑉_𝐵𝐶𝑈𝐶𝐶𝑖 = 𝛽0 + 𝛽1𝐿𝐸𝑉𝐸𝑅𝐴𝐺𝐸_𝑝𝑟𝑒𝑖 + 𝛽2𝐶𝑂𝑉𝐸𝑁𝐴𝑁𝑇𝑖 + 𝛽3𝑆𝐼𝑍𝐸𝑖 + 𝛽4𝑀𝑇𝐵𝑖
+ 𝛽5𝐶𝐴𝑆𝐻𝑖 + + 𝛽6𝐺𝐷𝑊𝑖 + 𝛽7𝐶𝐴𝑃𝐸𝑋_𝐶𝐻𝑖+ 𝛽8𝑅𝑂𝐴𝑖+ 𝛽9𝑀𝐼𝑁𝑂𝑅𝐼𝑇𝑌𝑖 + 𝜀𝑖
LEVERAGE = D/E_pre D/TA_pre - D/E_pre D/TA_pre
Variables
Prediction Column 1
(HP1a) Column 2
(HP1a) Column 3
(HP1b) Column 4
(HP1a-1b) Column 5
(HP1a-1b) Intercept
-3.992***
(-3.71) -4.467***
(-3.86) -2.892***
(-2.82) -3.824***
(-3.55) -4.142***
(-3.594) LEVERAGE_pre +
3.509***
(2.87) 1.368**
(2.51) 3.771**
(2.95) 1.380**
(2.51) COVENANT +
1.026**
(2.29) 1.126**
(2.38) 1.044**
(2.25) SIZE ?
0.368***
(3.62) 0.395***
(3.84) 0.368***
(3.53) 0.341***
(3.30) 0.372***
(3.57) MTB ?
-0.008
(-0.23) -0.015
(-0.50) -0.024
(-0.66) -0.020
(-0.55) -0.025
(-0.88) CASH ?
-0.003
(-0.76) -0.004
(-0.91) -0.004
(-0.98) -0.003
(-0.75) -0.004
(-0.89) GDW ?
2.593*
(1.90) 3.079**
(2.19) 2.441*
(1.84) 2.150*
(1.87) 2.754**
(1.98) CAPEX_CH ?
0.174
(0.80) 0.156
(0.69) 0.197
(0.87) 0.178
(0.80) 0.161
(0.70) ROA ?
2.410**
(2.06) 2.195**
(2.00) 2.205**
(2.19) 2.706**
(2.28) 2.357**
(2.21) MINORITY
?
0.100 (0.27)
0.103 (0.27)
0.162 (0.43)
0.168 (0.44)
0.168 (0.42)
Industry, Country, and Year Fixed Effects Yes Yes Yes Yes Yes
# of Observations 230 230 230 230 230 Pseudo R-squared 0.259 0.256 0.249 0.280 0.275
39

This table reports results of an analysis of the effect of ex-ante leverage and the existence of a net worth covenant on a parent firm debt on the choice of accounting method for a BCUCCs. Column 1 reports results for leverage measured as debt to equity as the explanatory variable. Column 2 reports results for leverage measured as debt to assets as the explanatory variable. Column 3 reports results for the existence of a net worth covenant as the explanatory variable. Column 4 reports results for both leverage (debt to equity) and the existence of a net worth covenant as the explanatory variables. Column 5 reports results for both leverage (debt to assets) and the existence of a net worth covenant as the explanatory variables. Z-statistics are reported in parentheses ***, **, and * denote significance at the 1%, 5%, or 10% level, respectively. Reported p-values are based on two-tailed significance levels. The dependent variable is FV_BCUCC is an indicator variable equal to 1 if the firm engaged in a BCUCC carried out at fair value and 0 otherwise. The variables of interest are as follows: LEVERAGE_pre is a firm’s leverage before the BCUCC; LEVERAGE is either debt in current liabilities + long-term debt divided by book value of equity (D/E) or debt in current liabilities + long-term debt divided by total assets (D/TA); COVENANT is an indicator variable that takes the value of 1 if the firm has a net worth covenant and 0 otherwise. We include the following controls: SIZE is the natural logarithm of total assets in the quarter end prior to the BCUCC; MTB is the ratio of the market value of equity to the book value of equity, CASH is the percentage of cash of the total consideration paid. GDW is goodwill scaled by total assets on the parent firm balance sheet; CAPEX_CH is the average four quarters post-BCUCC cash capital expenditure deflated by total assets minus the average four quarters pre-BCUCC cash capital expenditure on total assets; ROA is return on assets measured as earnings before extraordinary items divided total assets at the beginning of the period; MINORITY is an indicator variable that takes the value of 1 if the parent firm does not own 100% of the share of either the target or the acquirer. Control variables are measured where applicable, at the period before the BCUCC. All continuous variables are winsorized at 1%. Standard errors are clustered by firm and fiscal year. .
40

TABLE 7. A Propensity Score-Matching Procedure for Fair Value Parent Firms Panel A: Logit Regression to Identify Matched Firms 𝐹𝑉_𝐵𝐶𝑈𝐶𝐶𝑖 = 𝛽0 + 𝛽1𝐿𝐸𝑉𝐸𝑅𝐴𝐺𝐸_𝑝𝑟𝑒𝑖 + 𝛽2𝑆𝐼𝑍𝐸𝑖 + 𝛽3𝑀𝑇𝐵𝑖 + 𝛽4𝐶𝐴𝑃𝐸𝑋_𝐶𝐻𝑖
+ 𝛽5𝑅𝐸𝑆𝐸𝐴𝑅𝐶𝐻𝑖 + 𝛽6𝐸𝐵𝐼𝑇𝐷𝐴_𝐶𝐻𝑖 + 𝜀𝑖 Variables Prediction FV_BCUCC
Intercept
-10.987*** (-22.39)
LEVERAGE_pre ? 1.289** (2.43)
SIZE ? 0.412*** (9.13)
MTB ? -0.000 (-0.51)
CAPEX_CH ? -0.010 (-0.77)
RESEARCH
? -0.002
(-0.21)
EBITDA_CH
? -0.002
(-0.01) Industry, Country, and Year Fixed Effects
Yes
# of Observations 150,329 Pseudo R-squared 0.114
41

Panel B: Descriptive Statistics of Treatment and Matched Firms
Panel A reports results of a logit regression to identify a matching firm to each firm that used the acquisition method to account for a BCUCC. Z-statistics are reported in parentheses ***, **, and * denote significance at the 1%, 5%, or 10% level, respectively. Reported p-values are based on two-tailed significance levels. Panel B reports descriptive statistics of the treatment group (fair-value BCUCC firms) and the control group produced by the PSM procedure. FV_BCUCC is an indicator variable equal to 1 if the firm engaged in a BCUCC carried out at FV and 0 otherwise. LEVERAGE_pre is debt in current liabilities + long-term debt divided by book value of equity (D/E). SIZE is the natural logarithm of total assets in the quarter end prior to the BCUCC. MTB is the ratio of the market value of equity to the book value of equity. CASH is the percentage of cash of the total consideration paid. CAPEX_CH is the average four quarters post-BCUCC cash capital expenditure deflated by total assets minus the average four quarters pre-BCUCC cash capital expenditure on total assets. RESEARCH is research expense scaled by the sales. EBITDA_CH is the change in earnings before interest, tax, depreciation, and amortization scaled by the market value of equity. Control variables are measured where applicable, at the period before the BCUCC. All continuous variables are winsorized at 1%. Standard errors are clustered by firm and fiscal year.
Treatment (n = 146) Matched (n = 146) P-Value of Diff. Obs. Mean Median Obs Mean Median t-test Wilcoxon
LEVERAGE_pre 146 0.669 0.643 146 0.701 0.600 -0.032 0.043 SIZE 146 7.589 7.700 146 7.623 7.853 0.034 0.153 MTB 146 2.801 1.568 146 2.486 1.506 0.315 0.062 CAPEX_CH 146 0.186 0.000 146 0.191 0.000 -0.005 0.000 RESEARCH 146 0.104 0.030 146 0.102 0.055 0.002 0.025 EBITDA_CH 146 0.012 -0.009 146 0.014 0.006 -0.002 0.003
42

TABLE 8. Post-BCUCC New Public Debt Issuance
Panel A: Univariate Analysis
Variables
Obs. Mean
Treatment
Obs. Mean
Control
DIFF T-
test
ISSUE_Q1 146 0.130 146 0.041 -0.089*** -2.74 ISSUE_Q2 146 0.171 146 0.048 -0.123*** -3.43 ISSUE_Q3 146 0.192 146 0.062 -0.130*** -3.40 ISSUE_Q4 146 0.219 146 0.075 -0.144*** -3.53
43

Panel B: Regression Analysis—The Likelihood of Post-BCUCC Public Debt Issuance (n=146 matched pairs)
𝐼𝑆𝑆𝑈𝐸𝑖,𝑡+1𝑡+4 = 𝛽0 + 𝛽1𝐹𝑉_𝐵𝐶𝑈𝐶𝐶𝑖 + 𝛽2𝑆𝐼𝑍𝐸𝑖 + 𝛽3𝐿𝐸𝑉𝐸𝑅𝐴𝐺𝐸𝑝𝑟𝑒𝑖 + 𝛽4𝐶𝐴𝑃𝐸𝑋𝐶𝐻𝑖
+ 𝛽5𝑅𝐸𝑆𝐸𝐴𝑅𝐶𝐻𝑖 + 𝛽6EBITDA_CH𝑖 + 𝜀𝑖 Column 1 Column 2 Column 3 Column 4 Variables Prediction ISSUE_Q1 ISSUE_Q2 ISSUE_Q3 ISSUE_Q4
Intercept
-6.940*** (-5.46)
-5.869*** (-5.58)
-6.497*** (-6.14)
-5.958*** (-6.23)
FV_BCUCC + 1.281*** (2.63)
1.428*** (3.12)
1.347*** (3.22)
1.297*** (3.37)
SIZE ? 0.395** (3.02)
0.308*** (2.79)
0.424*** (3.83)
0.398*** (3.91)
LEVERAGE_pre ? 0.355 (1.59)
0.301 (1.39)
0.262 (1.25)
0.189 (0.91)
CAPEX_CH ? 0.147 (1.24)
0.067 (0.52)
-0.010 (-0.07)
-0.005 (-0.04)
RESEARCH ? 0.632
(0.98) 0.411
(0.67) 0.484
(0.81) 0.380
(0.66)
EBITDA_CH ? 7.104 -0.317 -1.831 0.541 (0.84) (-0.04) (-0.24) (0.08)
# of Observations 292 292 292 292 Pseudo R-squared 0.149 0.126 0.155 0.141 Panel A reports differences in the frequency of new debt issues between the group of parent firms that used the acquisition method to account for BCUCC and the group of matched firms produced by the propensity-score matching. Panel B reports results of logistic regression analyses testing the likelihood of post-BCUCC new public debt issuance. Column 1 reports results for issuance at the first three months post-BCUCC quarter end. Column 2 reports results for issuance at the first six months post-BCUCC quarter end. Column 3 reports results for issuance at the first nine months post-BCUCC quarter end. Column 4 reports results for issuance at the first 12 months post-BCUCC quarter end. Z-statistics are reported in parentheses ***, **, and * denote significance at the 1%, 5%, or 10% level, respectively. Reported p-values are based on two-tailed significance levels. ISSUE_Q1 is an indicator variable if the firm issues new debt in t+1 (being t the quarter of the BCUCC) and total amount of long-term financial debt in t+1 increases relative to the quarter pre-BCUCC and 0 otherwise; ISSUE_Q2 is an indicator variable if the firm issues new debt either in t+1 or in t+2 and the total
44
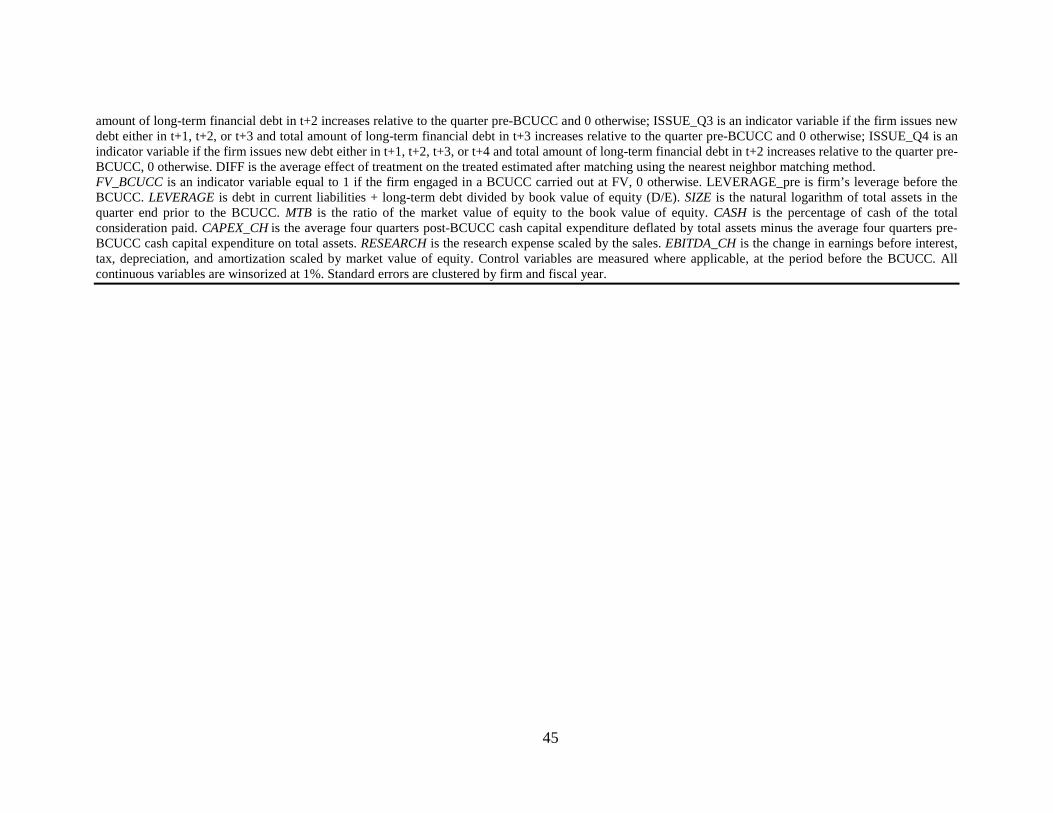
amount of long-term financial debt in t+2 increases relative to the quarter pre-BCUCC and 0 otherwise; ISSUE_Q3 is an indicator variable if the firm issues new debt either in t+1, t+2, or t+3 and total amount of long-term financial debt in t+3 increases relative to the quarter pre-BCUCC and 0 otherwise; ISSUE_Q4 is an indicator variable if the firm issues new debt either in t+1, t+2, t+3, or t+4 and total amount of long-term financial debt in t+2 increases relative to the quarter pre-BCUCC, 0 otherwise. DIFF is the average effect of treatment on the treated estimated after matching using the nearest neighbor matching method. FV_BCUCC is an indicator variable equal to 1 if the firm engaged in a BCUCC carried out at FV, 0 otherwise. LEVERAGE_pre is firm’s leverage before the BCUCC. LEVERAGE is debt in current liabilities + long-term debt divided by book value of equity (D/E). SIZE is the natural logarithm of total assets in the quarter end prior to the BCUCC. MTB is the ratio of the market value of equity to the book value of equity. CASH is the percentage of cash of the total consideration paid. CAPEX_CH is the average four quarters post-BCUCC cash capital expenditure deflated by total assets minus the average four quarters pre- BCUCC cash capital expenditure on total assets. RESEARCH is the research expense scaled by the sales. EBITDA_CH is the change in earnings before interest, tax, depreciation, and amortization scaled by market value of equity. Control variables are measured where applicable, at the period before the BCUCC. All continuous variables are winsorized at 1%. Standard errors are clustered by firm and fiscal year.
45

TABLE 9. A Propensity-Score Matching Procedure for Historical Cost Parent Firms
Panel A: Logit Regression to Identify Matched Firms 𝐻𝐶_𝐵𝐶𝑈𝐶𝐶𝑖 = 𝛽0 + 𝛽1𝐿𝐸𝑉𝐸𝑅𝐴𝐺𝐸_𝑝𝑟𝑒𝑖 + 𝛽2𝑆𝐼𝑍𝐸𝑖 + 𝛽3𝑀𝑇𝐵𝑖 + 𝛽4𝐶𝐴𝑃𝐸𝑋_𝐶𝐻𝑖
+ 𝛽5𝑅𝐸𝑆𝐸𝐴𝑅𝐶𝐻𝑖 + 𝛽6𝐸𝐵𝐼𝑇𝐷𝐴_𝐶𝐻𝑖 + 𝜀𝑖 Variables Prediction HC_BCUCC
Intercept
-8.896*** (-15.66)
LEVERAGE_pre ? -1.711** (-2.24)
SIZE ? 0.234*** (4.01)
MTB ? -0.000 (-0.34)
CAPEX_CH ? -0.018 (-0.88)
RESEARCH
? -0.001
(-0.09)
EBITDA_CH
? -0.001
(-0.21) Industry, Country, and Year Fixed Effects
Yes
# of Observations 145,086 Pseudo R-squared 0.082
46

Panel B: Descriptive Statistics of Treatment and Matched Firms
Panel A reports results of a logit regression to identify a matching firm to each firm that used the historical cost to account for a BCUCC. Z-statistics are reported in parentheses ***, **, and * denote significance at the 1%, 5%, or 10% level, respectively. Reported p-values are based on two-tailed significance levels. Panel B reports descriptive statistics of the treatment group (historical cost BCUCC firms) and the control group produced by the PSM procedure. HC_BCUCC is an indicator variable equal to 1 if the firm is engaged in a BCUCC carried out at historical cost and 0 otherwise. LEVERAGE_pre is a firm’s leverage before the BCUCC. LEVERAGE is debt in current liabilities + long-term debt divided by book value of equity (D/E). SIZE is the natural logarithm of total assets in the quarter end prior to the BCUCC. MTB is the ratio of the market value of equity to the book value of equity. CASH is the percentage of cash of the total consideration paid. CAPEX_CH is the average four quarters post- BCUCC cash capital expenditure deflated by total assets minus the average four quarters pre-BCUCC cash capital expenditure on total assets. RESEARCH is research expense scaled by the sales. EBITDA_CH is the change in earnings before interest, tax, depreciation, and amortization scaled by market value of equity. Control variables are measured where applicable, at the period before the BCUCC. All continuous variables are winsorized at 1%. Standard errors are clustered by firm and fiscal year.
Treatment (n = 146) Matched (n = 146) P-Value of Diff. Obs. Mean Median Obs Mean Median t-test Wilcoxon
LEVERAGE_pre 83 0.540 0.475 83 0.521 0.455 0.019 0.020 SIZE 83 6.851 6.937 83 6.685 6.571 -0.166 -0.366 MTB 83 0.183 0.020 83 0.169 0.031 0.014 0.011 CAPEX_CH 83 2,942 2.712 83 2.443 2.880 0.499 -0.188 RESEARCH 83 0.243 0.141 83 0.199 0.089 -0.043 -0.052 EBITDA_CH 83 0.035 0.010 83 0.037 0.019 -0.002 -0.009
47

TABLE 10. Post-BCUCC New Public Debt Issuance—A Placebo test
Panel A: Univariate Analysis
Variables
Obs.
Mean Treatment
Obs.
Mean Control
DIFF
t-test
ISSUE_Q1 83 0.012 83 0.012 0.000 0.000 ISSUE_Q2 83 0.036 83 0.060 0.024 0. 721 ISSUE_Q3 83 0.072 83 0.060 -0.012 -0.310 ISSUE_Q4 83 0.084 83 0.072 -0.012 -0.287
48

Panel B: Regression Analysis—The Likelihood of Post-BCUCC Public Debt Issuance (n=146 matched pairs) 𝐼𝑆𝑆𝑈𝐸𝑖,𝑡+1𝑡+4 = 𝛽0 + 𝛽1𝐻𝐶_𝐵𝐶𝑈𝐶𝐶𝑖 + 𝛽2𝑆𝐼𝑍𝐸𝑖 + 𝛽3𝐿𝐸𝑉𝐸𝑅𝐴𝐺𝐸𝑝𝑟𝑒𝑖 + 𝛽4𝐶𝐴𝑃𝐸𝑋𝐶𝐻𝑖
+ 𝛽5𝑅𝐸𝑆𝐸𝐴𝑅𝐶𝐻𝑖 + 𝛽6EBITDA_CH𝑖 + 𝜀𝑖 Column 1 Column 2 Column 3 Column 4 Variables Prediction ISSUE_Q1 ISSUE_Q2 ISSUE_Q3 ISSUE_Q4
Intercept
-9.575** (-2.40)
-10.467*** (-3.46)
-6.876*** (-3.68)
-6.835*** (-3.97)
HC_BCUCC + -1.121 (-0.70)
-0.393 (-0.47)
0.397 (0.59)
0.356 (0.57)
SIZE ? 0.693* (1.67)
0.997*** (3.10)
0.610*** (2.94)
0.610*** (3.19)
LEVERAGE_pre ? 0.258 (0.37)
-0.339 (-0.57)
-0.191 (-0.37)
-0.079 (-0.17)
CAPEX_CH ? 0.234 (0.49)
0.060 (0.18)
0.093 (0.33)
0.086 (0.33)
RESEARCH ? -1.747
(-0.43) -4.789
(-1.46) -5.937*
(-1.74) -4.302*
(-1.90)
EBITDA_CH ? 32.257* (1.92)
-27.096* (1.74)
18.126 (1.55)
16.750 (1.59)
# of Observations 164 164 164 164 Pseudo R-squared 0.242 0.334 0.233 0.222 Panel A reports differences in the frequency of new debt issues between the group of parent firms that used the acquisition method to account for BCUCCs and the group of matched firms produced by the propensity-score matching. Panel B reports results of logistic regression analyses testing the likelihood of post-BCUCC new public debt issuance. Column 1 reports results for issuance at the first three months post-BCUCC quarter end. Column 2 reports results for issuance at the first six months post-BCUCC quarter end. Column 3 reports results for issuance at the first nine months post-BCUCC quarter-end. Column 4 reports results for issuance at the first 12 months post-BCUCC quarter end. Z-statistics are reported in parentheses ***, **, and * denote significance at the 1%, 5%, or 10% level, respectively. Reported p-values are based on two-tailed significance levels. ISSUE_Q1 is an indicator variable if the firm issues new debt in t+1 (t being the quarter of the BCUCC) and total amount of long-term financial debt in t+1 increases relative to the quarter pre-BCUCC and 0 otherwise; ISSUE_Q2 is an indicator variable if the firm issues new debt either in t+1 or in t+2 and total amount of long-term financial debt in t+2 increases relative to the quarter pre-BCUCC and 0 otherwise; ISSUE_Q3 is an indicator variable if the firm issues new debt either in t+1, t+2, or t+3 and total amount of long-term financial debt in t+3 increases relative to the quarter pre-BCUCC and 0 otherwise; ISSUE_Q4 is an
49
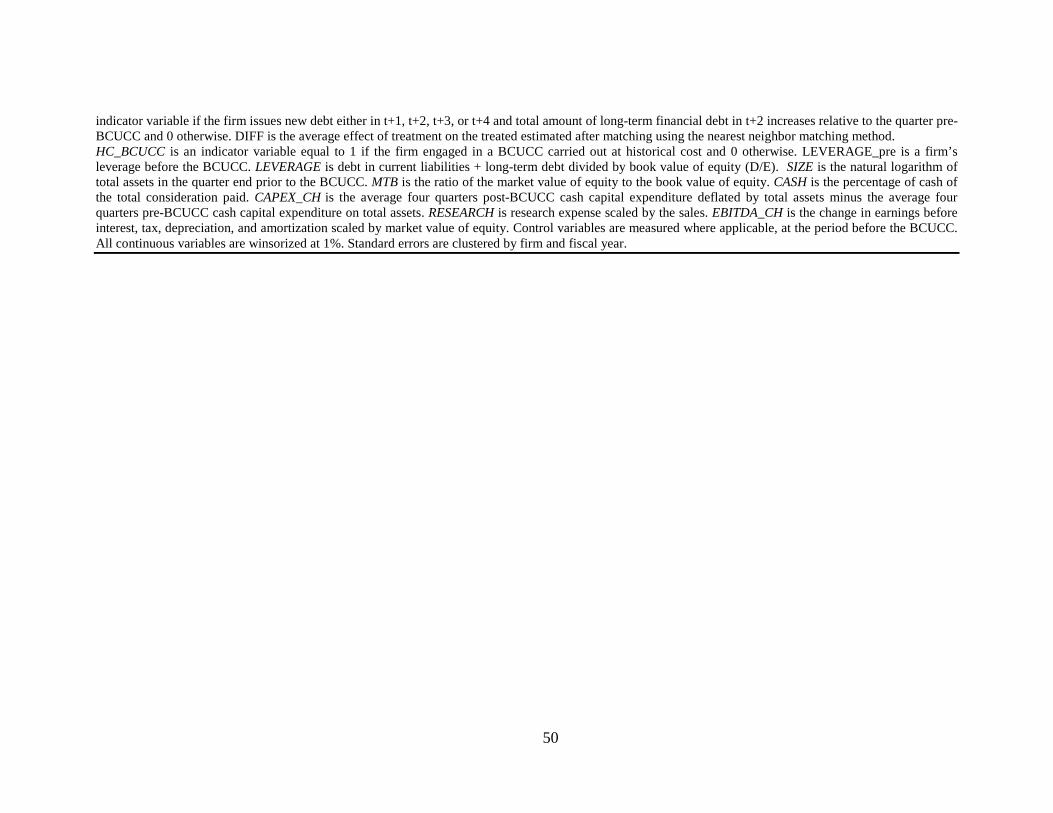
indicator variable if the firm issues new debt either in t+1, t+2, t+3, or t+4 and total amount of long-term financial debt in t+2 increases relative to the quarter pre-BCUCC and 0 otherwise. DIFF is the average effect of treatment on the treated estimated after matching using the nearest neighbor matching method. HC_BCUCC is an indicator variable equal to 1 if the firm engaged in a BCUCC carried out at historical cost and 0 otherwise. LEVERAGE_pre is a firm’s leverage before the BCUCC. LEVERAGE is debt in current liabilities + long-term debt divided by book value of equity (D/E). SIZE is the natural logarithm of total assets in the quarter end prior to the BCUCC. MTB is the ratio of the market value of equity to the book value of equity. CASH is the percentage of cash of the total consideration paid. CAPEX_CH is the average four quarters post-BCUCC cash capital expenditure deflated by total assets minus the average four quarters pre-BCUCC cash capital expenditure on total assets. RESEARCH is research expense scaled by the sales. EBITDA_CH is the change in earnings before interest, tax, depreciation, and amortization scaled by market value of equity. Control variables are measured where applicable, at the period before the BCUCC. All continuous variables are winsorized at 1%. Standard errors are clustered by firm and fiscal year.
50