Embed Size (px)
Citation preview

The Effect of Diversification Relatedness on Firm Performance
Brandon C. L. Morris,1 Stephen G. Fier,2 and Andre P. Liebenberg3
Abstract: This paper investigates the relationship between diversification relatednessand firm performance in the U.S. property‐liability insurance industry. While priorresearch has evaluated the effect of diversification on insurer performance, littleevidence exists regarding the relation between diversification strategy andperformance for diversified firms. Theory suggests that potential costs and benefitsare associated with related and unrelated forms of diversification and that these canvary along the relatedness continuum. We test for the net effect of diversificationstrategy and find that relatedness negatively impacts accounting performance. Thisrelatedness penalty is robust to corrections for potential endogeneity bias, it exists fornewly diversifying firms, and it has a differential effect on stock and mutual insurers.Finally, we find that related diversification is largely responsible for the diversificationpenalty found in prior research while unrelated diversification has no relation toaccounting performance.
INTRODUCTION
he coexistence of diversified and focused firms in the U.S. property‐liability (P/L) insurance industry has been a topic of empirical interest
over the past two decades, with studies commonly focused on explainingperformance differences across these two groups (e.g., Hoyt andTrieschmann, 1991; Liebenberg and Sommer, 2008; Elango, Ma, and Pope,2008; Cummins, Weiss, Xie, and Zi, 2010). Although firms have the abilityto select a strategy of diversification or focus, prior research largely ignoresthe fact that diversified insurers must also select a diversification strategyof either related or unrelated diversification. In other words, some diver‐sified firms offer products in relatively similar lines of business (related
1Contact author; Wright State University, [email protected] of Mississippi, [email protected] of Mississippi, [email protected]
T
125Journal of Insurance Issues, 2017, 40 (2): 125–158.Copyright © 2017 by the Western Risk and Insurance Association.All rights reserved.

126 MORRIS, FIER, AND LIEBENBERG
diversification) while others offer products across very dissimilar lines ofbusiness (unrelated diversification).4
Prior literature suggests that there are a number of important advan‐tages and disadvantages associated with related and unrelated diversifica‐tion strategies (e.g., Hill, Hitt, and Hoskisson, 1992; Palich, Cardinal, andMiller, 2000). The advantages of related diversification have been arguedto arise from the ability of firms to exploit economies of scope (Teece, 1982).However, inefficient resource sharing, resource overstretching, and over‐utilized management could lead to increased costs for firms employing arelated diversification strategy (e.g., Teece, 1982). Theory suggests thatunrelated diversifiers benefit from advantages stemming from efficientinternal governance economies (Williamson, 1985) and imperfectly corre‐lated income streams (Lewellen, 1971; Barney, 1997). The efficient internalgovernance argument implies that top management can address division‐level inefficiencies, terminate underperforming managers, and better allo‐cate capital than can outside investors. In this respect the individualdivisions can run more efficiently than comparable single‐division firms(Hill et al., 1992). Imperfectly correlated income streams may also helpreduce insurer risk, improve risk pooling, and reduce the negative effectsthe business cycle may have on primary income sources.5
This study investigates the relation between diversification strategyand financial performance. By focusing on diversification strategy, we arebetter able to distinguish which set of economic benefits equate with betterperformance. Using a unique line‐of‐business relatedness measure intro‐duced by Berry‐Stölzle, Liebenberg, Ruhland, and Sommer (2012, BLRS2012 hereafter), we test how diversification strategy affects the perfor‐mance of multi‐line P/L insurers. Our results indicate that insurers employ‐ing an unrelated diversification strategy exhibit stronger accounting perfor‐mance than insurers employing a more related diversification strategy. Thisfinding is confirmed in both univariate and multivariate settings. We alsotest whether this relatedness‐penalty is confined to stock or mutual insur‐ers. We find that the relatedness penalty is isolated to our subsample ofstock insurers, consistent with the managerial discretion hypothesis(Mayers and Smith, 1982). Finally, we examine newly diversified insurers
4A firm’s diversification “strategy” can encompass a broad set of actions that may be takenby a firm, and one component of that strategy includes the decision to diversify into relatedor unrelated lines of business. While we recognize that this term can refer to much broaderdecisions and activities, we use the term “strategy” throughout this study specifically todescribe the decision to employ either related or unrelated diversification. 5The concept of unrelated income streams reducing risk is commonly referred to as the coin‐surance effect (Lewellen, 1971).

DIVERSIFICATION RELATEDNESS AND FIRM PERFORMANCE 127
and find that those firms that enter highly related lines experience loweraccounting performance than firms that diversify into more unrelatedlines. Taken together, we find strong evidence that diversification strategyinfluences firm performance, where firms employing a strategy of unre‐lated diversification exhibit greater profitability relative to firms employ‐ing a strategy of related diversification.
The remainder of this article is organized as follows. First, we discussthe relevant literature as it relates to diversification, diversification strategy,and insurer financial performance. Next we present our hypotheses as wellas discuss the methodology and variables employed in the study. Empiricalresults follow, and then we conclude.
PRIOR LITERATURE
Diversification-Performance Relationship
Financial economists have been studying the implications of corporatediversification and diversification strategy for decades.6 Lang and Stulz(1994) and Berger and Ofek (1995, 1999) initially provided strong evidencethat firms operating in multiple industrial segments are penalized by amarket discount. However, researchers have posited that the finding of adiversification discount may be the result of irregularities in segment‐leveldata and that diversification may actually lead to a diversification premium(Villalonga, 2004). Furthermore, Hyland and Diltz (2002) and Campa andKedia (2002) argue that a priori firm characteristics, namely low growthopportunity and excess cash reserves, account for the diversification dis‐count identified by Berger and Ofek (1995). More recently, Santalo andBecerra (2008) find that the performance‐diversification relationship is nothomogeneous across industries, but that diversification is associated withpositive performance in industries dominated by diversified firms, andnegative in industries dominated by single segment firms.
The diversification literature related to P/L insurers appears to be moreunified in its assessment of a negative diversification‐performance rela‐tionship than the general finance literature. Hoyt and Trieschmann (1991)report that while both specialized and diversified firms outperform marketbenchmarks, specialized firms outperformed diversified firms from 1973to 1987. Tombs and Hoyt (1994) also report higher risk‐adjusted returns for
6Martin and Sayrak (2003) provide an overview of the diversification‐performance litera‐ture, noting three distinct “waves” of literature, with the first wave finding evidence of adiversification discount, the second wave questioning the existence of a diversification dis‐count, and the third wave providing evidence of a diversification premium.

128 MORRIS, FIER, AND LIEBENBERG
specialized insurers’ equities. More recently, Liebenberg and Sommer(2008) provide evidence of a performance penalty and market discountamong diversified P/L insurers. Elango et al. (2008) also identify a diversi‐fication‐performance penalty, but note that this relationship is nonlinear innature. Using data envelopment analysis (DEA), Cummins et al. (2010) findthat more‐focused firms are more efficient than diversified firms. Shim’s(2011) empirical results also suggest a performance disparity in product‐diversified firms, with more‐focused insurers outperforming product‐diversified insurers.7 Taken together, the literature suggests that diversifi‐cation generally has a negative impact on firm performance for firmsoperating in the U.S. P/L insurance industry.
Diversification Strategy–Performance Relationship
Potential benefits of related and unrelated diversification strategies
Firms that choose to diversify can select a strategy of related diversi‐fication or unrelated diversification. Prior literature suggests that firms willselect related diversification when the costs of producing separate outputsexceed the costs of joint production (i.e., economies of scope). For insurers,the benefits gained through economies of scope can be achieved byemploying a senior management team to make business decisions acrossmultiple segments, taking advantage of existing marketing channels (e.g.,multi‐policy sales and distribution), taking advantage of multi‐line adjus‐tors, combining underwriting and claims services across lines, transferringbrand name and reputation across products/services, or exploiting closelyrelated technologies (underwriting or actuarial). Alternatively, insurerscan select a strategy of unrelated diversification, which may provide someunique advantages of its own derived primarily from greater risk reduction(Barney, 1997). Portfolio theory suggests that overall risk can be reducedwith a collection of assets with imperfectly correlated values. In an insur‐ance setting, having uncorrelated premium and claim flows can improverisk pooling and stabilize profits across the business cycle (i.e., a coinsur‐ance effect). For example, an insurer can exploit unrelated diversificationwhen a business line is subject to market contractions by allocating humanresources and capital to business lines that may be unaffected by thecontraction.
7Berry‐Stölzle, Hoyt, and Wende (2013) examine the diversification‐performance relation‐ship across multiple countries and find that the relationship is also dependent on country‐specific factors such as capital market development, property rights protection, andcompetition.

DIVERSIFICATION RELATEDNESS AND FIRM PERFORMANCE 129
Potential costs of related and unrelated diversification strategies
Although firms will select a particular diversification strategy becauseof the potential benefits associated with that option, various costs linkedto related and unrelated diversification could limit or even dominate anypositive effect. For instance, while economies of scope may be derivedthrough the use of related diversification, such a strategy could also havea deleterious effect on firm performance as a result of inefficient resourcesharing, resource overstretching, and over‐utilized management (Teece,1982). For firms selecting an unrelated diversification strategy, there is thepossibility that limited synergies exist between the various segments of thefirm and that diseconomies of scope develop as the organization attemptsto manage the unrelated operations (Palepu, 1985). These firms may alsobe more vulnerable to external market changes, such as a decline indemand for their products and services (Pehrsson, 2006). Any of theseaforementioned outcomes could increase the costs incurred by the firm andultimately lead to a reduction in firm performance rather than enhanceperformance.
Empirical evidence on the net effect of related and unrelated diversification
While prior literature has recognized that firms may select differentdiversification strategies, evidence regarding the diversification strategy‐performance relation is mixed. Numerous studies have found support forthe superiority of related diversification over unrelated diversification(e.g., Rumelt, 1974, 1982; Christensen and Montgomery, 1981; Palepu, 1985;Bae, Kwon, and Lee, 2011). While there are many explanations as to whya strategy of relatedness is associated with better performance, most citethe creation of synergies as a result of efficient resource sharing (e.g., Teece,1980).
Although some previous studies have found a positive relationbetween relatedness and firm performance, other studies have reportedconflicting results. Teece (1982) suggests that firms that attempt to leveragethe same resources for an increased number of activities can experienceweaker performance due to congestion.8 Michel and Shaked’s (1984) evi‐dence suggests that firms diversifying in unrelated sectors are able to
8It is important to note that common resources include both physical assets and humancapacity. “For instance, if the common input is knowhow, …then the costs of accessing itmay increase if the simultaneous transfer of the information to a number of different appli‐cations is attempted. … Accordingly, as the demands for sharing knowhow increase, bottle‐necks in the form of over‐extended scientists, engineers, and managers can be anticipated.Congestion associated with accessing common inputs will thus clearly limit the amount ofdiversification which can be profitably engaged (Teece, 1982, page 53).”
130 MORRIS, FIER, AND LIEBENBERG
generate “statistically superior performance” over firms with more‐relatedbusiness segments. Fan and Lang (2000) report that firms with verticallyrelated segments are, on average, associated with lower value during the1980’s and 1990’s. The authors find that firm value is negatively associatedwith relatedness and they reject the notion that related diversificationalways improves firm value. Using perceptual survey data from top indus‐try executives as his basis for relatedness, Pehrsson (2006) identifies anegative relation between “high relatedness” and firm performance.
Finally, some empirical studies have found no significant relationbetween diversification strategy and performance after controlling forindustry characteristics, lagged performance, or using different related‐ness measures (e.g., Christensen and Montgomery, 1981; Hill et al., 1992).
While there is ample literature regarding the diversification‐perfor‐mance relationship in the U.S. insurance industry, little research existswhich explicitly focuses on the performance implications of diversificationstrategy within the P/L industry. To the best of our knowledge, Li andGreenwood (2004) is the only other study that empirically tests relatednessand performance in an insurance setting. Using a sample of 276 diversifiedCanadian insurers, the authors find that the extent of diversification is aninsignificant predictor of firm performance, but that market niche related‐ness is positively associated with performance.
HYPOTHESIS DEVELOPMENT
Diversification Strategy Hypothesis
The most common theoretical rationale supporting the dominance ofa related diversification strategy are the benefits derived from economiesof scope (e.g., Teece, 1982; Seth, 1990). Related diversifiers capture advan‐tages by sharing inputs in the production of several similar goods. How‐ever, costs may also arise from the use of a related strategy. Nayyar (1992)states that for a related strategy to enhance performance, business unitsmust efficiently communicate and cooperate in order to generate synergies.Bureaucratic distortions, intra‐firm competition for resources, problemsallocating joint costs, or technological inadequacies may reduce and/oreliminate the potential performance enhancing benefits of a related strat‐egy (Palich et al., 2000).
Unrelated strategies, on the other hand, may generate their ownfinancial synergies. One such advantage stems from portfolio theory,where benefits can arise from uncorrelated assets. In an insurance setting,uncorrelated lines of business could result in uncorrelated income streamsand uncorrelated losses. Insurers with uncorrelated income streams

DIVERSIFICATION RELATEDNESS AND FIRM PERFORMANCE 131
should also realize reduced cash flow risk, reduced regulatory risk, andlower insolvency risk. In addition to a reduction in operational risk, indus‐try‐wide shocks and catastrophic events will have a less severe impact onan unrelated book of business than a related book. While an unrelateddiversification strategy offers a number of benefits, such a strategy couldalso negatively impact the firm as the result of diseconomies of scope, alack of synergies between the different business segments, and an increasein operational complexity. Therefore, with theory supporting both argu‐ments, we offer our first hypothesis on the diversification strategy–perfor‐mance relationship in null form as follows:
H1: Diversification strategy will have no effect on the performance of diver‐sified firms.
Organizational Form Hypothesis
Within the population of P/L insurers there exists a variety of organi‐zational forms which are distinctly different from one another. The twomost common are stock insurers and mutual insurers, where stock insurersare owned by outside shareholders and mutual insurers are owned by thepolicyholders. Differences between these groups have been the subject ofmany empirical investigations.9 One primary difference is that stock insur‐ers have a stronger mechanism to control managerial opportunism thanmutual insurers (Mayers and Smith, 1981, 1982). Within stock insurers themarket for corporate control, equity‐based compensation, and shareholdermonitoring all contribute to controlling agency costs and aligning mana‐gerial and owner interests. Because these controls that are commonly inplace for stock insurers are not in place (or are not as influential) for mutualinsurers, it is argued that mutual insurers should limit the operationalfreedom of management (i.e., managerial discretion), while managers ofstock insurers should be afforded more discretion in pursuing possiblevalue‐maximizing projects (Mayers and Smith, 1982). It is reasonable toassume that firms pursuing a related diversification strategy are inherentlylimiting managerial discretion via choice of similar business lines, whereasfirms must allow managers more operational freedom when operatingwith an unrelated business strategy.
BLRS (2012) document a significant difference in the diversificationstrategies employed by mutual and stock insurers. They show that mutualinsurers exhibit significantly higher levels of related diversification (which
9For example, studies have examined differences between the two with regards to risk(Lamm‐Tennant and Starks, 1993), capital structure (Harrington and Niehaus, 2002) andefficiency (Cummins, Weiss, and Zi, 1999).

132 MORRIS, FIER, AND LIEBENBERG
requires less managerial discretion) than do stock insurers. Their findingsupports the notion that mutual insurers actively limit managerial scopeby choosing more‐related business lines, whereas stock insurers allowmanagers more operational freedom by way of greater unrelated diversi‐fication. What remains an open question is whether performance is affectedwhen mutual or stock insurers employ diversification strategies that areinconsistent with that particular organizational form’s need to controlmanagerial discretion. Given the findings of prior research, our second setof testable hypotheses are:
H2a: Mutual insurers that follow a related diversification strategy will out‐perform mutual insurers that follow an unrelated diversification strategy.
H2b: Stock insurers that follow an unrelated diversification strategy willoutperform stock insurers that follow a related strategy.
DATA AND METHODOLOGY
Sample Selection
Our initial sample includes all firms in the National Association ofInsurance Commissioners (NAIC) P/L Infopro database for the years 1995through 2014. Because diversification decisions are likely made at thegroup level, we aggregate affiliated insurers at the group level (Lamm‐Tennant and Starks, 1993; Berger, Cummins, Weiss, and Zi, 2000; Lieben‐berg and Sommer, 2008; BLRS, 2012). Since we are interested in determin‐ing the relation between diversification strategy and performance, we onlyfocus on diversified firms. As such, our first screen removes all monolineinsurers. Next, we exclude insurers that are under any regulatory scru‐tiny.10 Following Liebenberg and Sommer (2008), we also exclude groupswith substantial L/H premiums (at least 25 percent of total premiums) soas to focus on insurers that primarily emphasize the P/L lines of business.11
Firms that are not organized as either stocks or mutuals are also removed.We then remove any firms that have missing data, or report negative assets.
10The NAIC InfoPro database provides information regarding each firm’s regulatory statusin a given year. We remove firms with the following statuses: (1) firms in conservatorship,(2) firms that are being rehabilitated, (3) firms that are in permanent or temporary receiver‐ship, or (4) firms that are being liquidated or have been liquidated. This screen reduces oursample by 35 firm‐year observations.11While we include this additional screen in order to remain consistent with prior literature,we recognize that the life and health lines of business can affect diversification relatedness.As such, we re‐estimated all models after eliminating this screen and find results that arequalitatively and quantitatively similar those presented in this study.

DIVERSIFICATION RELATEDNESS AND FIRM PERFORMANCE 133
Finally, we exclude firms with fewer than the five years of historical datathat we require in order to compute our risk measure (Grace, 2004; Lieben‐berg and Sommer, 2008).
Our final sample consists of 891 unique P/L insurers, of which 388 areinsurance groups and 503 are unaffiliated insurers. Our initial sampleincluded years 1995 through 2014; however, because five years of historicaldata are required for the calculation of our risk measure, our sample periodis limited to 2000 through 2014. We report 7,901 insurer‐year observations,of which 3,607 are group‐year observations and 4,294 are unaffiliatedobservations. These data are used to test the following baseline model:
. (1)
Performance Measure Selection
Given that the primary objective of this study is to empirically test therelation between diversification strategy and firm performance, proxies forboth performance and diversification strategy must be selected. Of thevarious performance measures used in the insurance literature, the mostcommon is return on assets (ROA).12,13 However, high performance may be(in part) attributed to the risks associated with an insurer’s opportunity set.We therefore follow the prior literature (e.g., Lai and Limpaphayom, 2003;Liebenberg and Sommer, 2008) and use the standard deviation of ROA forthe past five years as a measure of risk in our models (SDROA5).
Diversification Strategy Measure
Historically, financial economists have found it difficult to objectivelymeasure relatedness for large samples (Fan and Lang, 2000). While SICcodes have commonly been used to measure relatedness,14 Fan and Lang(2000) argue that SIC classification is not suited to measure differencesbetween segments because they do not reveal relatedness types and thuscannot measure the degree to which segments are related.15 By focusing on
12See, for example, Grace (2004); Elango et al., (2008); Liebenberg and Sommer (2008); andMilidonis and Stathopoulos (2011).13Given that we are interested in differences between stocks and mutuals, we do not con‐sider a market‐based performance measure such as Tobin’s Q.14Morck, Shleifer, and Vishny (1990) and Berger and Ofek (1995) measure relatedness bycounting differing two‐, three‐, or four‐digit SIC coded segments.15Davis and Duhaime (1989), Nayyar (1992), and Villalonga (2004) also note limitationsusing SIC classifications.
Performance f Diversification Strategy Controls =

134 MORRIS, FIER, AND LIEBENBERG
the U.S. P/L industry, we are able to calculate a more objective measure ofrelatedness than what has been employed in prior studies.
We avoid the shortcomings of discrete measures of relatedness byusing a proxy developed by BLRS (2012) that assigns a relatedness scoreto each insurer based on their own book of business. BLRS (2012) calculaterelatedness scores based on the procedure followed by Bryce and Winter(2009).
In this paper, we use the static relatedness scores reported in theappendix of BLRS (2012).16 These scores, denoted, denote the degree towhich lines i and j are related. The scores are bounded between 0 and 1,with higher scores implying greater relatedness. For example, BLRS reporta relatedness score of 0.943 for Homeowners’ and Auto (implying highrelatedness between these lines) and a relatedness score of 0.201 for Home‐owners’ and Boiler and Machinery (implying low relatedness for theselines). The first step is to calculate how each line an insurer is participatingin is related to its remaining book of business:
(2)
where Rij is the relatedness score reported by BLRS (2012) and NPWkjt
represents net premiums written by insurer k in line j in year t. (WARkit)then represents the percentage of the firm’s premiums that are related toline i.
The next step is to average the firm’s individual relatedness scores(WARkit) using line participation as the weights, resulting in the firm‐levelweighted average relatedness measure, WARkit:
. (3)
The resulting score increases as insurers write more in related lines ofbusiness and decreases as premiums are written in more‐unrelated linesof business.17
Control Variables
Diversification Extent. While our focus is on the performance effects ofdiversification strategy, prior literature (e.g., Elango et al., 2008) has shownthat performance is related to diversification extent. We control for theperformance effect of diversification extent using the complement of the
16A detailed discussion of how the relatedness scores employed in this study are created ispresented in the Appendix of this paper.
WARkit
j i RijNPWkjt
i i NPWkjt----------------------------------------=
WARkt
iNPWkit WARkit
iNPWkit-----------------------------------------------------=

DIVERSIFICATION RELATEDNESS AND FIRM PERFORMANCE 135
Herfindahl‐Hirschman Index (HHI) of net premiums written across 24separate lines of business (LOBDIV).18 We define LOBDIV for firm k in yeart as:
(4)
where NPWkjt is firm k’s net premiums written in line j in year t. LOBDIV isincreasing in diversification and decreasing in concentration.
Size. Hardwick (1997) suggests that large insurers are likely to performbetter than small insurers because they can economize on unit costs asso‐ciated with product innovation and process improvement. Larger insurersmay also have lower insolvency risk, which Sommer (1996) argues cantranslate into higher prices ceteris paribus. Cummins and Nini (2002) relateinsurer size to market power, where one would expect larger insurers tofind greater revenue efficiencies than smaller insurers. Consistent with theextant literature we expect size to be positively related to performance. Wemeasure size as the natural logarithm of total assets (SIZE). Because weaggregate insurers at the group level, we follow BLRS (2012) and adjustgroup assets downward by the total intra‐group common and preferredstock holdings.19
Capitalization. Sommer (1996) provides evidence that safer insurers areable to command higher prices. We account for insurer capitalization inour models by including the ratio of policyholders’ surplus to total admit‐ted assets (CAPASSETS). If consumers are willing to pay greater premiums
17As an example of how the WAR measure is computed, consider a firm that operates inthree lines of business in a given year. The lines of business and their associated premiumsinclude Automobile ($500), Homeowners’ ($800), and Boiler and Machinery ($400). In orderto calculate the WAR measure, we first obtain the static relatedness scores from BLRS (2012)for each pairwise grouping:
We then create line‐specific relatedness scores, WARkit, which we calculate as:
Finally, we calculate the firm‐level weighted average relatedness score, WARkt:
The 0.539 relatedness score implies that nearly 54 percent of all other combinations are less related while 46 percent of other combinations are more related.
RAuto HO, 0.943 RAuto B&M,, 0.197 RHO B&M,, 0.201= = =
WARk Auto t,,.943 800 .197 400 +
800 400+-------------------------------------------------------- 0.694 WARk HO t,,, 0.613
and WARk B&M t,, 0.199=
,= = =
WARkt500 0.694 800 0.613 400 0.199 + +
1700------------------------------------------------------------------------------------------------ 0.539= =
LOBDIVkt 1NPWkjt
NPWkt--------------------
j 1=
24
–=

136 MORRIS, FIER, AND LIEBENBERG
to firms that exhibit greater levels of capitalization, we anticipate a positiverelationship between insurer capitalization and performance.
Ownership Structure. Our sample contains firms that are classified aseither stock insurers or mutual insurers. Agency theory suggests that self‐interested managers will maximize their utility at the expense of the firms’owners (Jensen and Meckling, 1976). The market for corporate controlaligns the owner‐manager conflict in stock insurers, while the mutual formaligns the interests of owners and policyholders (Mayers and Smith, 1981).The empirical evidence on the cost efficiency across organizational formsis mixed, where Cummins et al., (1999) find mutual insurers are less costefficient than stock insurers while Greene and Segal (2004) find no differ‐ence in cost efficiencies between the two forms. More recent literaturesuggests that stock insurers outperform mutual insurers when usingaccounting‐based performance measures (e.g., Liebenberg and Sommer,2008; Elango et al., 2008). We control for organizational form by includinga binary variable equal to 1 for mutual insurers (MUTUAL) and we antic‐ipate a negative relation between this variable and firm performance.
Geographic Diversification. We control for the effects of geographicdiversification on performance by including in our models the complement
18We follow the line of business convention as established by BLRS (2012). We use theUnderwriting and Investment Exhibit (Part 1B—Premiums Written) of an insurers’ annualstatutory filing as the basis of diversification and relatedness measures. Several lines are log‐ically combined in the following ways:1. Fire and Allied Lines is defined as the sum of “Fire” (line 1) and “Allied Lines” (line 2).2. Accident and Health is defined as the sum of “Group Accident and Health” (line 13),
“Credit Accident and Health” (line 14), and “Other Accident and Health” (line 15).3. Medical Malpractice is defined as the sum of “Medical Malpractice—Occurrence” (line
11.1) and “Medical Malpractice–Claims Made” (line 11.2).4. Products Liability is defined as the sum of “Products Liability—Occurrence” (line 18.1)
and “Products Liability—Claims Made” (line 18.2).5. Auto is defined as the sum of “Private Passenger Auto Liability” (line 19.1, 19.2),
“Commercial Auto Liability” (line 19.3, 19.4), and “Auto Physical Damage” (line 21).6. Reinsurance is defined as the sum of “Nonproportional Assumed Property” (line
30),“Nonproportional Assumed Liability” (line 31), and “Nonproportional AssumedFinancial Lines” (line 32).
The final 24 lines are as follows: Accident and Health, Aircraft, Auto, Boiler and Machinery,Burglary and Theft, Commercial Multi‐Peril, Credit, Earthquake, Farmowners’, FinancialGuaranty, Fidelity, Fire and Allied Lines, Homeowners, Inland Marine, International, Medi‐cal Malpractice, Mortgage Guaranty, Ocean Marine, Other, Other Liability, Products Liabil‐ity, Reinsurance, Surety, and Workers’ Compensation. 19Assets are adjusted in this manner to ensure that all intra‐group holdings are not doublecounted. For example, if insurers A and B are in a group, and Insurer B owns all of InsurerA’s stock, the group’s assets would effectively double count A’s assets if we did not adjust forB’s intra‐group holdings.

DIVERSIFICATION RELATEDNESS AND FIRM PERFORMANCE 137
of the geographic HHI, calculated using the proportion of direct premiumswritten across fifty U.S. states and the District of Columbia (GEODIV), asreported in Schedule T (Exhibit of Premiums Written) of the NAIC annualfilings. Specifically, GEODIV is calculated for insurer k writing business instate s in year t as:
(5)
where a value closer to 1 suggests a greater degree of diversification whilea value closer to 0 suggests a higher degree of concentration. Prior literature(e.g., Liebenberg and Sommer (2008) and Elango et al., (2008)) predicts anegative relation between our GEODIV variable and firm performance.
Industry Concentration. We follow Liebenberg and Sommer (2008) andmeasure industry concentration as follows:
(6)
where wkjt is the weight of premiums written by insurer k in line j in year tand HHIjt is an industry‐wide, line‐specific HHI that measures the relativecompetitiveness of each line. Insurers with smaller relative values forWCONC are writing in competitive lines of business, whereas larger valueswould indicate higher business concentration and less relative competi‐tion. We expect WCONC to be positively associated with performance.
Percent of Life/Health Business. While our focus is on the P/L insuranceindustry, there are some firms in the sample that also write life/health linesof business. Given that writing these lines of business would representadditional levels of diversification that would not otherwise be capturedin our model, we follow Liebenberg and Sommer (2008) and include avariable equal to the proportion of life/health premiums to total premiums(PCTLH).20
Group Membership. Prior literature suggests important differencesacross firms on the basis of group membership. Cummins and Sommer(1996) and Sommer (1996) argue that consumers should pay less to firmsthat are members of a group as the group can allow individual membersto fail. In other words, members of a group may be viewed by policyholdersas being more risky than single unaffiliated insurers. We include a group
20For the purpose of the PCTLH variable, the denominator is calculated as the sum of totalproperty‐liability premiums plus the total of life‐health premiums, as reported in the NAICLife‐Health InfoPro database.
GEODIVkt 1NPWkstNPWkt---------------------
2
s 1=
51
–=
WCONCkt wkjtj 1=
24
HHIjt=

138 MORRIS, FIER, AND LIEBENBERG
binary variable (GROUP) equal to 1 for all groups and expect a negativeand significant relation between our group variable and firm performance. Definitions and summary statistics are provided in Table 1.
Given that our dataset consists of repeated firm observations over afifteen‐year period, we follow Liebenberg and Sommer (2008) and Elangoet al. (2008) and employ a one‐way fixed‐effects model using time‐specificintercepts to test the relationship between diversification strategy and firmperformance. The use of time fixed effects allows us to control for time‐dependent variation in ROA. In addition to time fixed‐effects, we alsoinclude line‐of‐business and state dummy variables to account for perfor‐mance variation across lines and states. Because firm‐level clustering mayresult in inflated t‐statistics due to understated standard errors, we accountfor repeated firm observations in our analysis by clustering standard errorsat the firm level (Petersen, 2009). With the possible endogenous choice ofdiversification strategy based on concurrent profits, we use a number ofmethods to ensure consistent estimators. The first method we use to controlthis possible endogenous choice is to include once lagged relatednessscores as proxies for concurrent firm‐level relatedness (as employed byElango et al., 2008), presented in Equation (7) as:
(7)
We further address the endogeneity of WAR through the use of a two‐stage least squares approach.21 This approach requires the selection ofinstruments for WAR. We follow Campa and Kedia (2002) and Laeven andLevine (2007) and use exogenously determined industry and geographicvariables that are relevant in determining WAR but that do not identifywith firm‐level profitability. Our first instrument is the weighted averageof the proportion of premiums attributed to each line of business relativeto industry‐wide premiums in each line (WLINESIZEkt–1).
22 WLINESIZEkt–1
21Formal testing confirms that WARkt may suffer from endogeneity. The Durbin‐Wu‐Haus‐man test for endogeneity produced a significant test statistic (p = 0.008) when we includedthe residual in Equation (7) from regressing WAR on all exogenous variables plus instru‐mental variables from Equation (8).22We use line‐of‐business participation rates as the weights, where relative business line sizeis that business line’s total industry premiums divided by total industry premiums across all24 lines.
ROAkt 0 1WARkt or 1WARkt 1– 2LOBDIVkt3SIZEkt 4CAPASSETSkt 5GEODIVkt 6WCONCkt7PCTLHkt 8SDROA5kt 9MUTUALkt 10GROUPkt11–20Year fixed effectst 21–43Line controlskt44–94State controlskt kt.
+ ++ + + ++ + + ++ ++ +
=

DIVERSIFICATION RELATEDNESS AND FIRM PERFORMANCE 139
Table 1. Summary Statistics and Variable Definitions (N = 7,901)
Variable Definition Mean Median Min Max
WAR Weighted average relatedness, where values closer to 0 represent lower lev‐els of relatedness.
0.8502 0.9114 0.0912 0.9580
ROA Return on assets, calculated as the ratio of net income to total assets
0.01867 0.0241 –0.2270 0.1774
SDROA5 Standard deviation of ROA over the previous five years
0.0337 0.0247 0.0004 0.5903
SIZE Natural logarithm of total assets 18.5898 18.5180 12.9183 26.1376
LOBDIV One minus the line‐of‐business Her‐findahl‐Hirschman Index, calculated using premiums written in 24 distinct lines of business
0.5246 0.4482 0.0919 1.0000
CAPASSETS Ratio of total policyholders’ surplus to total assets
0.4215 0.4257 –14.1917 1.2753
GEODIV One minus the Herfindahl‐Hirschman Index based on geographic participa‐tion across 50 states in the U.S. and the District of Columbia
0.4022 0.3561 0.0000 1.0000
WCONC Sum of industry concentration scores multiplied by line‐specific participa‐tion
0.0601 0.0569 0.02237 0.4628
PCTLIFE Proportion of total premiums in life and health lines of business to total property‐liability and life‐health pre‐miums
0.0079 0.0000 0.0000 0.2499
MUTUAL Binary variable equal to 1 for mutual insurers, and 0 otherwise
0.5075 1.0000 0.0000 1.0000
GROUP Binary variable equal to 1 for insur‐ance groups, and 0 otherwise
0.4577 0.0000 0.0000 1.0000
Notes: The sample period covers 1995 through 2014. Five years of lagged consecutive data are required for the computation of SDROA5; thus our analyses begin in year 2000. All relevant variables are aggregated at the group level (Berger et al., 2000). Total assets are adjusted downward by total intra‐group holdings. ROA is trimmed at the 1% and 99% levels.

140 MORRIS, FIER, AND LIEBENBERG
captures the size of the firm’s markets in which they compete. BLRS (2012)use this variable as a proxy for business growth constraints, as firms thatoperate in relatively small industries may have to expand outside theirprimary line in order to grow. While this variable is related to WAR, itis unrelated to our measure of performance. Our second instrument isLocalWARkt–1, which represents the average relatedness scores across allinsurers domiciled in the same state as a given insurer. This measure issimilar in spirit to an instrument (W%SINGLE) used by Liebenberg andSommer (2008) that captures the prevalence of single‐line insurers in firms’lines of business. We expect aggregate state‐level diversification strategyto be correlated with insurer‐specific diversification decisions but not withan insurer’s accounting performance.23 We include these excluded instru‐ments, plus the vector of control variables from Equation (7) (denoted Xkt),in the first stage regression shown in Equation (8), which is given as:
. (8)
In each of our two‐stage models, we formally test these instrumentsusing the Wald test for instrument relevance and Sargan’s test for over‐identifying restrictions.24
EMPIRICAL RESULTS
Diversification Strategy Hypothesis
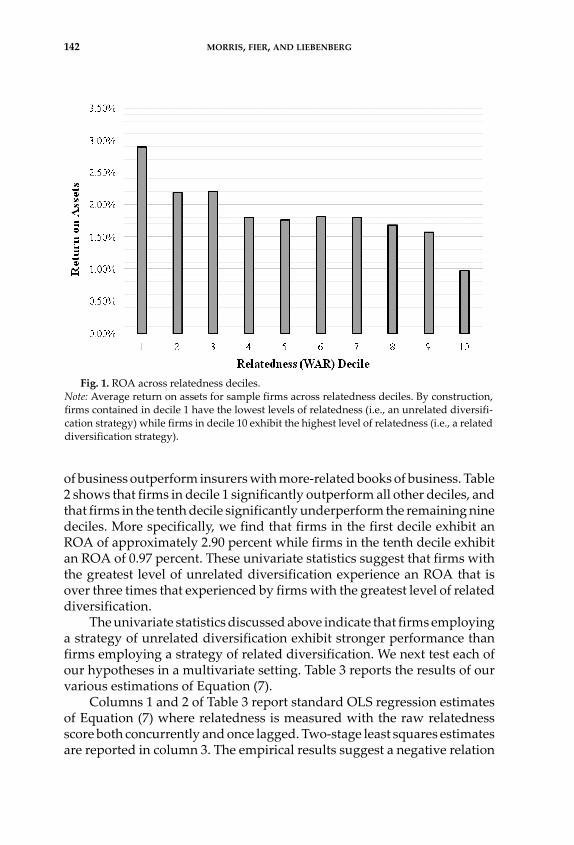
A univariate analysis of ROA across relatedness deciles is presentedin Table 2.
Figure 1 displays a graphical representation of ROA across deciles,where decile 1 contains firms with the lowest WAR scores (unrelateddiversification strategy) and decile 10 consists of firms with the highestWAR scores (related diversification strategy). The results of Table 2 andFigure 1 highlight an inverse relation between relatedness and perfor‐mance. On average, we find that insurers with relatively unrelated books
23See Santalo and Becerra (2008), Campa and Kedia (2002), and Laeven and Levine (2007) forexamples of industry‐level and geographic‐level instruments.24Instruments are tested by a Wald test of their joint significance after regressing WAR on theinstruments and control variables. Instrument validity is tested via the Sargan test for over‐identifying restrictions where the null hypothesis is that the instruments are uncorrelatedwith the errors. As demonstrated in Tables 3 and 4, the Wald statistic is statistically signifi‐cant and the statistic associated with the Sargan test is insignificant. These results indicatethat our instruments are both valid and relevant.
WARkt 0 1LocalWARkt 1– 2WLINESIZEkt 1– Xkt kt+ + + +=

DIVERSIFICATION RELATEDNESS AND FIRM PERFORMANCE 141
Table 2. P
airw
ise Comparison of ROA Across W
AR Deciles
Panel A: ROA by WAR decile
Unrelated Diversification Strategy
Related Diversification Strategy
D1
D2
D3
D4
D5
D6
D7
D8
D9
D10
ROA
2.90%
2.18%
2.20%
1.80%
1.76%
1.81%
1.81%
1.68%
1.57%
0.97%
Panel B: Pairwise ROA t‐tests (column minus row)
D1
D2
D3
D4
D5
D6
D7
D8
D9
D10
D1
–
D2
2.86***
–
D3
2.96***
0.03
–
D4
4.65***
1.64
1.66*
–
D5
5.09***
1.92*
1.94*
0.20
–
D6
4.70***
1.64
1.65*
–0.04
–0.25
–
D7
4.63***
1.62
1.64
–0.02
–0.22
0.02
–
D8
5.09***
2.11**
2.14**
0.51
0.34
0.56
0.53
–
D9
5.53***
2.57***
2.60***
0.99
0.85
1.05
1.01
0.48
–
D10
6.94***
4.36***
4.40***
3.02***
2.98***
3.11***
3.04***
2.57***
2.14***
–
Notes: T‐statistics are reported in Pan
el B. D
1–D10 are the weighted average relatedness deciles (WAR). Decile 1 contains firm
s with the most
unrelated books of business (i.e., WAR values closer to 0), w
hile Decile 10 contains firm
s with the most related books of business (i.e., WAR
values closer to 1). WAR m
easures the relatedness of firm‐level diversification. *, **, an
d *** denote statistical significan
ce at the 10 percent, 5
percent, and 1 percent levels, respectively.
142 MORRIS, FIER, AND LIEBENBERG
of business outperform insurers with more‐related books of business. Table2 shows that firms in decile 1 significantly outperform all other deciles, andthat firms in the tenth decile significantly underperform the remaining ninedeciles. More specifically, we find that firms in the first decile exhibit anROA of approximately 2.90 percent while firms in the tenth decile exhibitan ROA of 0.97 percent. These univariate statistics suggest that firms withthe greatest level of unrelated diversification experience an ROA that isover three times that experienced by firms with the greatest level of relateddiversification.
The univariate statistics discussed above indicate that firms employinga strategy of unrelated diversification exhibit stronger performance thanfirms employing a strategy of related diversification. We next test each ofour hypotheses in a multivariate setting. Table 3 reports the results of ourvarious estimations of Equation (7).
Columns 1 and 2 of Table 3 report standard OLS regression estimatesof Equation (7) where relatedness is measured with the raw relatednessscore both concurrently and once lagged. Two‐stage least squares estimatesare reported in column 3. The empirical results suggest a negative relation
Fig. 1. ROA across relatedness deciles.Note: Average return on assets for sample firms across relatedness deciles. By construction,firms contained in decile 1 have the lowest levels of relatedness (i.e., an unrelated diversifi‐cation strategy) while firms in decile 10 exhibit the highest level of relatedness (i.e., a relateddiversification strategy).

DIVERSIFICATION RELATEDNESS AND FIRM PERFORMANCE 143
Table 3. Diversification Relatedness and Firm Performance
Model OLS OLS 2SLS
WAR –0.046*** –0.130***
(0.008) (0.027)
WARt‐1 –0.037***
(0.008)
LOBDIV –0.009* –0.009* –0.010**
(0.005) (0.005) (0.005)
SIZE 0.006*** 0.006*** 0.006***
(0.001) (0.001) (0.001)
CAPASSETS 0.021** 0.021** 0.020**
(0.010) (0.010) (0.010)
GEODIV –0.008** –0.007* –0.010**
(0.004) (0.004) (0.004)
WCONC –0.014 –0.001 –0.075
(0.042) (0.041) (0.049)
PCTLH 0.051* 0.050* 0.063**
(0.028) (0.028) (0.029)
SDROA5 –0.125*** –0.123*** –0.112**
(0.042) (0.042) (0.045)
MUTUAL –0.005** –0.006*** –0.004*
(0.002) (0.002) (0.002)
GROUP –0.010*** –0.009*** –0.010***
(0.002) (0.002) (0.002)
Constant –0.041** –0.047*** 0.016
(0.018) (0.018) (0.025)
Instrument Relevance Test
Wald Statistic 410.40***
Instrument Validity Tests
Sargan Test 0.971
Observations 7,901 7,901 7,901
R‐squared 0.161 0.159 0.136
Table notes continue on next page

144 MORRIS, FIER, AND LIEBENBERG
exists between relatedness (WAR) and firm performance (ROA) across eachof the three model specifications. These results are consistent with theinitial univariate results and indicate that related diversification is, onaverage, negatively associated with firm performance. We therefore rejectHypothesis 1, and provide initial evidence that related diversificationreduces accounting performance among P/L insurers. These findings areconsistent with those of Michel and Shaked (1984), Fan and Lang (2000),and Pehrsson (2006).
Benefits to a related strategy depend on the ability of firms to createsynergies among similar resources (Teece, 1980). However, these benefitsrequire a high degree of managerial cooperation and communicationbetween business segments. Inefficiencies and other costs can manifestwhen firms attempt to leverage the same resources for an increased numberof activities, thus resulting in poorer performance (Teece, 1982). By con‐trast, the economic benefits of unrelated diversification are based on effi‐ciency gains due to strong internal systems that can allocate resources andshift risk to performing sectors (Williamson, 1985). These results indicatethat: (1) the costs associated with a related strategy outweigh the benefits,or (2) “flexibility” in resource allocation is more valuable than synergygains from core competencies.
Among the control variables, the coefficients on the SIZE variable arepositive and significant in each specification in Table 3. This finding isconsistent with the extant literature suggesting that larger firms can takeadvantage of economies of scale or lower insolvency risk (Sommer, 1996).
Notes: The sample period is 2000 through 2014. Coefficients in columns titled “OLS” areestimated by ordinary least squares regressions. Coefficients in the column titled “2SLS”are estimated using two‐stage least squares. When employing the 2SLS approach, thefirst‐stage regresses WAR on a set of excluded instruments (WLINESIZE and LocalWAR)and all other explanatory variables. Instruments are tested by a Wald test of their jointsignificance after regressing WAR on the instruments and controls. Instrument validityis tested via the Sargan test for overidentifying restrictions where the null hypothesis isthat the instruments are uncorrelated with the errors. Standard errors are presentedbelow coefficients in parentheses and are corrected for firm‐level clustering. All modelsinclude year, line of business, and state fixed effects. WAR measures the relatedness offirm‐level diversification. LOBDIV is the complement of the line of business Herfindahl‐Hirschman Index. SIZE is the natural logarithm of total admitted assets. CAPASSETS isthe ratio of policyholders’ surplus to total admitted assets. GEODIV is the complementof the Herfindahl‐Hirschman Index of premiums written across the 50 U.S. states as wellas in the District of Columbia. WCONC is a line‐weighted metric of industry concentra‐tion. PCTLH is the percentage of premiums collected in life and health lines. MUTUALis a binary variable equal to 1 for mutual insurers, 0 otherwise. GROUP is equal to 1 ifthe firm is an aggregated group, 0 if it is a single, unaffiliated insurer. SDROA5 is thestandard deviation of ROA over the past five years. *, **, and *** denote statisticalsignificance at the 10 percent, 5 percent, and 1 percent levels, respectively.

DIVERSIFICATION RELATEDNESS AND FIRM PERFORMANCE 145
The coefficient on the capitalization variable (CAPASSETS) is positive andsignificant across the three specifications, indicating that financial flexibil‐ity is associated with improved performance. We also find that geographicdiversification (GEODIV) has a negative and significant relation to firmperformance, which is consistent with prior research (Elango et al., 2008).We also report evidence that diversified mutual insurers underperformdiversified stock insurers across our sample period. Our findings alsoindicate that group‐affiliated insurers underperform relative to unaffili‐ated insurers. This negative relation may be due to lower costs of conglom‐eration, costs of managerial discretion, or inefficient resource sharingbetween affiliates. Overall, we reject Hypothesis 1, and find that firmsfollowing a related diversification strategy underperform those that followa more unrelated diversification strategy.
Organizational Form Hypothesis
Two primary organizational structures exist within the P/L insuranceindustry: mutual insurers and stock insurers. As noted previously, themanagement of a stock insurer will typically be granted greater managerialdiscretion than the management of a mutual insurer because of potentialagency costs (Mayers and Smith, 1982). For diversified firms, following amore related strategy is one method to limit the degree of managerialdiscretion within an organization,25 and this could likely lead to perfor‐mance gains for mutual insurers when compared to stock insurers who donot need to limit managerial discretion. In order to test the potentialrelations between managerial discretion, diversification strategy, and per‐formance, we re‐estimate Equation (7) with a specific focus on the stockand mutual organizational forms, the results of which are presented inTable 4.
The results reported in Table 4 are supportive of Hypothesis 2b andindicate that stock insurers following a more related strategy exhibitweaker profitability compared to stock insurers that follow a more unre‐lated diversification strategy. Both specifications (OLS and 2SLS) report anegative and significant coefficient on the WAR variable (columns 1 and 2)for the stock subsample. Alternatively, the results for the subsample ofmutual insurers (columns 3 and 4) suggest that related diversification isunrelated to firm profitability. Taken together, the results presented inTables 2 and 3 provide evidence of a relatedness‐performance relationshipthat is largely driven by stock insurers.
25A notion consistent with the findings of BLRS (2012), which finds that mutual insurerstend to use a related diversification strategy more than stock insurers.

146 MORRIS, FIER, AND LIEBENBERG
Table 4. Diversification Relatedness and Firm Performance across Organizational Forms
Stock Mutual
Model OLS 2SLS OLS 2SLS
WAR –0.043*** –0.128*** –0.028* –0.150
(0.010) (0.032) (0.016) (0.098)
LOBDIV –0.010 –0.011 –0.011 –0.014
(0.007) (0.007) (0.008) (0.009)
SIZE 0.004*** 0.005*** 0.010*** 0.010***
(0.001) (0.001) (0.001) (0.001)
CAPASSETS 0.017* 0.015* 0.061*** 0.063***
(0.009) (0.009) (0.007) (0.007)
GEODIV –0.014*** –0.017*** –0.007 –0.011
(0.005) (0.005) (0.005) (0.007)
WCONC –0.016 –0.084 –0.011 –0.056
(0.051) (0.060) (0.066) (0.077)
PCTLH 0.116*** 0.121*** –0.026 –0.014
(0.040) (0.042) (0.030) (0.034)
SDROA5 –0.172*** –0.156*** 0.055 0.072
(0.052) (0.054) (0.058) (0.063)
GROUP –0.010*** –0.010*** –0.012*** –0.015***
(0.003) (0.003) (0.003) (0.004)
Constant 0.001 0.045* –0.144*** –0.046
(0.021) (0.026) (0.022) (0.081)
Instrument Relevance
Wald Statistic 42.40*** 280.76***
Instrument Validity
Sargan Test 0.254 0.361
Observations 3,891 3,891 4,010 4,010
R‐squared 0.167 0.139 0.243 0.214
Notes: The sample period is 2000 through 2014. Coefficients in the columns titled “OLS”are estimated using ordinary least squares regressions. Coefficients in the columns titled“2SLS” are estimated using two‐stage least squares. When employing the 2SLSapproach, the first‐stage regresses WAR on a set of excluded instruments (WLINESIZEand LocalWAR) and all other explanatory variables. Instruments are tested by a Wald test
Table notes continue on next page

DIVERSIFICATION RELATEDNESS AND FIRM PERFORMANCE 147
ROBUSTNESS
Performance for Newly Diversified Insurers
To further validate our results, we explore profitability differencesamong newly diversifying firms. This subsample provides a unique settingthat allows us to empirically test the immediate impact that diversificationinto related and unrelated business lines has on overall firm profitability.While the prior results indicate that firms with greater levels of unrelateddiversification experience higher profitability, we contend that this resultshould be exhibited for newly diversified firms at the time they make theinitial decision to diversify. If the large‐sample results are indeed robust,then the firms that picked, as their new business line, an unrelated lineshould outperform the firms that selected lines that are closely related totheir original line of business. We model profitability consistent withEquation (7) and replace the WAR variable with variables that measure thechange in diversification strategy from year t–1 to year t. The first indepen‐dent variable of interest is the absolute change in WAR:
. (9)
For our sample of newly diversifying firms, the prior year’s relatednessscore is equal to 1 and the concurrent relatedness score isless than one, making any change in diversification strategy negative.26 Forease of interpretation, we use the absolute difference in WAR as the
26Note that a weighted‐average relatedness (WAR) score of 1 indicates that the insurer is notdiversified (i.e., the firm only writes one line of business).
WARkt WARkt WARkt 1––=
WARkt 1– 1=
of their joint significance after regressing WAR on the instruments and controls. Instru‐ment validity is tested via the Sargan test for overidentifying restrictions where the nullhypothesis is that the instruments are uncorrelated with the errors. Standard errors arepresented below coefficients in parentheses and are corrected for firm‐level clustering.All models include year, line of business, and state fixed effects. WAR measures therelatedness of firm‐level diversification. LOBDIV is the complement of the line of businessHerfindahl‐Hirschman Index. SIZE is the natural logarithm of total admitted assets.CAPASSETS is the ratio of policyholders’ surplus to total admitted assets. GEODIV is thecomplement of the Herfindahl‐Hirschman Index of premiums written across the 50 U.S.states as well as in the District of Columbia. WCONC is a line‐weighted metric of industryconcentration. PCTLH is the percentage of premiums collected in life and health lines.GROUP is equal to 1 if the firm is an aggregated group, 0 if it is a single, unaffiliatedinsurer. SDROA5 is the standard deviation of ROA over the past five years. *, **, and ***denote statistical significance at the 10 percent, 5 percent, and 1 percent levels,respectively.

148 MORRIS, FIER, AND LIEBENBERG
independent variable, where larger values equate to a more unrelatedstrategy. We expect to be positively related to performance; that is,firm profitability should increase with the level of unrelatedness betweenthe firm’s original line and its new business line. The second measure is aset of binary variables indicating which change‐quartile the firm belongsto. Firms with the smallest deviation from a value of 1, , are theomitted group. If the results are consistent with our initial findings, weanticipate that firms in the second, third and fourth quartiles
should have better performance rela‐tive to firms the first quartile. We identify 314 firms that changed theirdiversification status during our sample period, and the results of thisanalysis are presented in Table 5.
The results in Table 5 are consistent with the negative relatedness‐performance relationship reported previously in Tables 3 and 4. The coef‐ficient on is positive and statistically significant at the one percentlevel, which suggests that adding unrelated business lines is more profit‐able than adding lines that match the firm’s existing business. When weuse the change‐quartile indicators, we again find evidence that is consistentwith the previously reported results.
The second set of results presented in Table 5 indicates that firms inthe fourth change‐quartile experience a positive and signifi‐cantly greater level of performance relative to firms in the first changequartile. In other words, the firms that added the most‐unrelated lines ofbusiness experienced better performance than those firms that added a linesimilar to that which was previously written. These results suggest that,on average, firms in the largest change‐quartile were 6.8 percent moreprofitable than firms in the lowest change‐quartile. Overall, the resultspresented in Table 5 provide additional support for our previous findingsthat firms employing a related diversification strategy experience lowerperformance relative to firms employing an unrelated diversificationstrategy.
Diversification, Relatedness, and Performance
The previously discussed results suggest that related diversificationnegatively influences firm accounting performance, which adds to priorresearch that finds that diversified insurers incur a diversification penalty(Liebenberg and Sommer, 2008). However, one question that remains iswhether the negative relation between diversification and performanceis influenced by the type of diversification strategy employed by a givenfirm. While our results imply that a greater degree of relatedness results ina decline in performance, we have not directly tested the effects of relatedand unrelated diversification within a single model to parse out the
WAR
WARQ1
WARQ2 WARQ3 WARQ4,,
WARkt
WARQ4

DIVERSIFICATION RELATEDNESS AND FIRM PERFORMANCE 149
Table 5. Relatedness and Performance for Newly Diversifying Insurers
Model OLS OLS
ΔWAR 0.145***
(0.039)
ΔWARQ2 0.023
(0.020)
ΔWARQ3 0.024
(0.020)
ΔWARQ4 0.068***
(0.020)
LOBDIV 0.014 0.017
(0.035) (0.035)
SIZE –0.000 –0.000
(0.005) (0.005)
CAPASSETS 0.015 0.017
(0.011) (0.011)
GEODIV –0.014 –0.010
(0.019) (0.019)
WCONC –0.062 –0.013
(0.166) (0.164)
PCTLH 0.000 0.000
(0.000) (0.000)
SDROA5 –0.704*** –0.697***
(0.079) (0.080)
MUTUAL 0.033* 0.033*
(0.018) (0.018)
GROUP 0.013 0.012
(0.017) (0.017)
Constant 0.020 0.020
(0.076) (0.078)
Observations 314 314
R‐squared 0.487 0.502
Table notes continue on next page

150 MORRIS, FIER, AND LIEBENBERG
influence of each. In order to evaluate the influence of a related andunrelated strategy on firm performance, we first estimate a model identicalto that employed by Liebenberg and Sommer (2008) to ensure that ourresults are similar to theirs using their specification. The dependent vari‐able for the new model is accounting profitability (proxied by ROA) whilethe independent variable of interest is a binary variable, MULTLINE, equalto 1 for firms that operate in two or more lines of business (i.e., diversifiedfirms), and 0 otherwise. We then estimate a second model where theMULTLINE binary variable is replaced with a binary variable equal to 1 forfirms that are among the top 50 percent of WAR (RELATED) and anotherdichotomous variable equal to 1 for firms that are among the bottom 50percent of WAR (UNRELATED).27 Using this approach, we can more clearlyseparate the influence of related and unrelated diversification on firmperformance. The dataset used to estimate these models consists of diver‐sified and undiversified firms. Both models are estimated using ordinaryleast squares regression and standard errors are clustered at the firmlevel.28 The results from these estimations are provided in Table 6.
The first column in Table 6 presents the results from the baselinespecification following Liebenberg and Sommer (2008). Focusing first onthe independent variable of interest, the statistically significant and nega‐tive coefficient on the MULTLINE variable suggests that diversified firms
27The omitted group for this model consists of those firms that are undiversified. 28Although the line‐of‐business diversification (LOBDIV) variable was used in our priorempirical models, we exclude the LOBDIV variable from these models as the values for theLOBDIV and binary diversification variables are both equal to zero for undiversified firms.
.Notes: The sample period is 2000 through 2014. The sample consists of firms that weresingle‐line insurers in year t‐1 and added an additional line(s) in year t. Coefficients areestimated by ordinary least squares. ∆WAR represents the absolute change in the firm’sweighted average relatedness. The second specification compares the differences in ROAacross relatedness quartiles (∆WARq), where ∆WARQ1 (firms with the highest relatednesslevels) is the omitted group. Standard errors are presented below coefficients in paren‐theses and are corrected for firm‐level clustering. All models include year, line of business,and state fixed effects. LOBDIV is the complement of the line of business Herfindahl‐Hirschman Index. SIZE is the natural logarithm of total admitted assets. CAPASSETS isthe ratio of policyholders’ surplus to total admitted assets. GEODIV is the complementof the Herfindahl‐Hirschman Index of premiums written across the 50 U.S. states and theDistrict of Columbia. WCONC represents industry concentration. PCTLH is the percent‐age of premiums collected in life and health lines. MUTUAL is a binary variable equal to1 for mutual insurers, 0 otherwise. GROUP is equal to 1 if the firm is an aggregated group,0 if it is a single, unaffiliated insurer. SDROA5 is the standard deviation of ROA over thepast five years. *, **, and *** denote statistical significance at the 10 percent, 5 percent, and1 percent levels, respectively.

DIVERSIFICATION RELATEDNESS AND FIRM PERFORMANCE 151
have lower levels of profitability relative to undiversified firms. Specifi‐cally, the result indicates that, on average, diversified insurers performapproximately half a percent worse than undiversified firms. This findingis comparable to that of Liebenberg and Sommer (2008), who find thataccounting profitability for diversified firms is roughly one percent lowerthan that of undiversified firms. The results on the remaining controlvariables are largely similar to those presented in Liebenberg and Sommer(2008).
Given that we are able to confirm the findings of Liebenberg andSommer (2008) using our dataset, we next attempt to disentangle the effectsof related and unrelated diversification to determine if either strategy hasa greater influence on accounting performance.
The results of this alternative specification are provided in column 2of Table 6 and they suggest that the negative influence of diversificationmay largely be attributable to related diversification and not to unrelateddiversification. While the coefficient on the RELATED binary variable isnegative and statistically significant, the coefficient on the UNRELATEDbinary variable is not significantly different from zero.
These results imply that while there is not a statistically significantdifference between firms employing a more unrelated diversification strat‐egy and firms that are undiversified, firms that use a related strategyperform nearly one percent worse than undiversified firms. This suggeststhat the findings presented both in column 1 of Table 6 and in Liebenbergand Sommer (2008) may be due in part to diversification strategy, andresults previously reported in this study are largely influenced by relateddiversification. The fact that a negative relation between related diversifi‐cation and accounting performance exists may signal that the costs ofrelated diversification such as a greater correlation of earnings streamsexceeds benefits associated with scope economies.
CONCLUSION
This article investigates the relation between insurer diversificationstrategy and firm performance using a sample of diversified U.S. property‐liability insurers over a fifteen‐year period. Prior literature has evaluatedthe effect of diversification on insurer performance; however, there is anabsence of evidence on the effect of diversification strategy for firms thathave already made the diversification decision. We are the first to test thisrelationship using the relatedness measure developed by Berry‐Stölzle,Liebenberg, Ruhland, and Sommer (2012). Theory suggests that related

152 MORRIS, FIER, AND LIEBENBERG
Table 6. Disaggregating the Overall Diversification Effect into Related and Unrelated Diversification
Variables ROA ROA
MULTLINE –0.005*
(0.003)
RELATED –0.009***
(0.003)
UNRELATED –0.003
(0.003)
SIZE 0.004*** 0.005***
(0.001) (0.001)
CAPASSETS 0.018** 0.018**
(0.007) (0.007)
GEODIV –0.004 –0.004
(0.004) (0.004)
WCONC 0.015 0.013
(0.030) (0.030)
PCTLH 0.000* 0.001**
(0.000) (0.000)
SDROA5 –0.068*** –0.067***
(0.025) (0.025)
MUTUAL –0.006*** –0.006***
(0.002) (0.002)
GROUP –0.009*** –0.009***
(0.002) (0.002)
Constant –0.057*** –0.059***
(0.014) (0.014)
Observations 10,682 10,682
R‐squared 0.119 0.120
Notes: The sample period is 2000 through 2014. The sample consists of both diversifiedand non‐diversified firms. Coefficients are estimated by ordinary least squares. Standarderrors are presented below coefficients in parentheses and are corrected for firm‐levelclustering. All models include year, line of business, and state fixed effects. MULTLINEis a binary variable equal to 1 for firms with at least two lines of business, 0 otherwise.RELATED is a binary variable equal to 1 for diversified firms with above‐median WAR,0 otherwise. UNRELATED is a binary variable equal to 1 for diversified firms with below‐median WAR, 0 otherwise. SIZE is the natural logarithm of total admitted assets.CAPASSETS is the ratio of policyholders’ surplus to total admitted assets. GEODIV isthe complement of the Herfindahl‐Hirschman Index of premiums written across the 50U.S. states and the District of Columbia. WCONC represents industry concentration.
Table notes continue on next page

DIVERSIFICATION RELATEDNESS AND FIRM PERFORMANCE 153
diversifiers should benefit from economies of scope while unrelated diver‐sifiers should benefit from uncorrelated earnings streams.
The primary result of this study is that related diversification nega‐tively impacts accounting performance, ceteris paribus. We contend that thisresult indicates that either (1) the costs associated with a related strategyoutweigh the benefits, or (2) “flexibility” in resource allocation is morevaluable than synergy gains from core competencies. Given that BLRS(2012) find that mutual insurers tend to use a more related form of diver‐sification relative to stock insurers, we also hypothesized that the diversi‐fication strategy–performance relationship would be moderated by orga‐nizational form. Our results suggest that stock insurers suffer from arelatedness penalty while mutual insurers do not, which is consistent withdifferences in managerial discretion across organizational forms and withthe findings of BLRS (2012).
We also examine the immediate impact that diversification strategyhas on the profitability of firms that move from being a monoline insurerto a multiline insurer. The result of this additional robustness test confirmsour general results, where firms that selected more‐unrelated businesslines outperformed their counterparts that selected lines that are morerelated to their original line. Finally, we test the influence of both relatedand unrelated diversification on firm performance and document thatwhile diversified firms experience weaker performance relative to undi‐versified firms, the negative effect appears to largely be driven by firmsemploying a related diversification strategy. Overall, our results imply thatdiversification strategy plays an important role in the performance ofinsurers, and that the benefits of uncorrelated earnings and losses providea more substantial benefit than synergistic gains between similar productlines.
REFERENCES
Bae, S. C., T. H. Kwon, and J. W. Lee (2011) “Does Corporate Diversification byBusiness Groups Create Value? Evidence from Korean Chaebols,” Pacific‐BasinFinance Journal 19: 535–553.
Barney, J. B. (1997) Gaining and Sustaining Competitive Advantages, Addison‐Wesley.
PCTLH is the percentage of premiums collected in life and health lines. MUTUAL is abinary variable equal to 1 for mutual insurers, 0 otherwise. GROUP is equal to 1 if thefirm is an aggregated group, 0 if it is a single, unaffiliated insurer. SDROA5 is the standarddeviation of ROA over the past five years. *, **, and *** denote statistical significance atthe 10 percent, 5 percent, and 1 percent levels, respectively.

154 MORRIS, FIER, AND LIEBENBERG
Berger, A. N., J. D. Cummins, M. A. Weiss, and H. Zi (2000) “Conglomeration versusStrategic Focus: Evidence from the Insurance Industry,” Journal of FinancialIntermediation 9: 323–362.
Berger, P. G. and E. Ofek (1995) “Diversification’s Effect on Firm Value,” Journal ofFinancial Economics 37: 39–65.
Berger, P. G. and E. Ofek (1999) “Causes and Effects of Corporate RefocusingPrograms,” Review of Financial Studies 12(2): 311–345.
Berry‐Stölzle, T. R., A. P. Liebenberg, J. S. Ruhland, and D. W. Sommer (2012)“Determinants of Corporate Diversification: Evidence from the Property‐Liabil‐ity Insurance Industry,” Journal of Risk and Insurance 79: 381–413.
Berry‐Stölzle, T. R., R. E. Hoyt, and S. Wende (2013) “Capital Market Development,Competition, Property Rights, and the Value of Insurer Product‐Line Diversifi‐cation: A Cross‐Country Analysis,” Journal of Risk and Insurance 80: 423–459.
Bryce, D. J. and S. G. Winter (2009) “A General Interindustry Relatedness Index,”Management Science 55: 1570–1585.
Campa, J. M. and S. Kedia (2002) “Explaining the Diversification Discount,” TheJournal of Finance 57: 1731–1762.
Christensen, H. K. and C. A. Montgomery (1981) “Corporate Economic Perfor‐mance: Diversification Strategy versus Market Structure,” Strategic ManagementJournal 2: 327–343.
Cummins, J. D. and G. P. Nini (2002) “Optimal Capital Utilization by FinancialFirms: Evidence from the Property‐Liability Insurance Industry,” Journal ofFinancial Services Research 21: 15–53.
Cummins, J. D. and D. W. Sommer (1996) “Capital and Risk in Property‐LiabilityInsurance Markets,” Journal of Banking and Finance 20: 1069–1092.
Cummins, J. D., M. A. Weiss, X. Xie, and H. Zi (2010) “Economies of Scope inFinancial Services: A DEA Efficiency Analysis of the US Insurance Industry,”Journal of Banking and Finance 34: 1525–1539.
Cummins, J. D., M. A. Weiss, and H. Zi (1999) “Organizational Form and Efficiency:The Coexistence of Stock and Mutual Property‐Liability Insurers,” ManagementScience 45: 1254–1269.
Davis, R. and I. M. Duhaime (1989) “Business Level Data Disclosed Under FASBNo. 14: Effective Use in Strategic Management Research,” Academy of Manage‐ment Proceedings, Academy of Management.
Elango, B., Y‐L. Ma, and N. Pope (2008) “An Investigation into the Diversification‐Performance Relationship in the U.S. Property‐Liability Insurance Industry,”Journal of Risk and Insurance 75: 567–591.
Fan, J. P. H. and L. H. P. Lang (2000) “The Measurement of Relatedness: AnApplication to Corporate Diversification,” Journal of Business 73: 629–660.
Grace, E. (2004) “Contracting Incentives and Compensation for Property‐LiabilityInsurer Executives,” Journal of Risk and Insurance 71(2): 285–307.
Greene, W. and D. Segal (2004) “Profitability and Efficiency in the U.S. Life Insur‐ance Industry,” Journal of Productivity Analysis 21: 229–247.
Hardwick, P. (1997) “Measuring Cost Inefficiency in the UK Life Insurance Indus‐try,” Applied Financial Economics 7: 37–44.

DIVERSIFICATION RELATEDNESS AND FIRM PERFORMANCE 155
Harrington, S. E. and G. Niehaus (2002) “Capital Structure Decisions in the Insur‐ance Industry: Stocks versus Mutuals,” Journal of Financial Services Research 21:145–163.
Hill, C. W. L., M. A. Hitt, and R. E. Hoskisson (1992) “Cooperative versus Compet‐itive Structures in Related and Unrelated Diversified Firms,” Organization Sci‐ence 3: 501–521.
Hoyt, R. E. and J. S. Trieschmann (1991) “Risk/ Return Relationships for Life‐Health,Property‐Liability, and Diversified Insurers,” Journal of Risk and Insurance 58:322–330.
Hyland, D. C. and J. D. Diltz (2002) “Why Firms Diversify: An Empirical Examina‐tion,” Financial Management 31: 51–81.
Jensen, M. C. and W. H. Meckling (1976) “Theory of the Firm: Managerial Behavior,Agency Costs and Ownership Structure,” Journal of Financial Economics 3: 305–360.
Laeven, L. and R. Levine (2007) “Is There a Diversification Discount in FinancialConglomerates?” Journal of Financial Economics 85: 331–367.
Lai, G. C. and P. Limpaphayom (2003) “Organizational Structure and Performance:Evidence from the Nonlife Insurance Industry in Japan,” Journal of Risk andInsurance 70: 735–757.
Lamm‐Tennant, J. and L. T. Starks (1993) “Stock versus Mutual Ownership Struc‐tures: The Risk Implications,” The Journal of Business 66: 29–46.
Lang, L. H. P. and R. M. Stulz (1994) “Tobin’s Q, Corporate Diversification, andFirm Performance,” Journal of Political Economy 102(6): 1248.
Lewellen, W. G. (1971) “A Pure Financial Rationale for the Conglomerate Merger,”Journal of Finance 26: 521–537.
Li, S. X. and R. Greenwood (2004) “The Effect of Within‐Industry Diversificationon Firm Performance: Synergy Creation, Multi‐Market Contact and MarketStructuration,” Strategic Management Journal 25: 1131–1153.
Liebenberg, A. P. and D. W. Sommer (2008) “Effects of Corporate Diversification:Evidence from the Property‐Liability Insurance Industry,” Journal of Risk andInsurance 75: 893–919.
Martin, J. D. and A. Sayrak (2003) “Corporate Diversification and ShareholderValue: A Survey of Recent Literature,” Journal of Corporate Finance 9: 37–57.
Mayers, D. and C. W. Smith, Jr. (1981) “Contractual Provisions, OrganizationalStructure, and Conflict Control in Insurance Markets,” The Journal of Business,54: 407–434.
Mayers, D. and C. W. Smith, Jr. (1982) “On the Corporate Demand for Insurance,”The Journal of Business 55: 281–296.
Michel, A. and I. Shaked (1984) “Does Business Diversification Affect Perfor‐mance?” Financial Management 13: 18–25.
Milidonis, A. and K. Stathopoulos (2011) “Do U.S. Insurance Firms Offer the‘Wrong’ Incentives to Executives?” Journal of Risk and Insurance 78: 643–672.
Morck, R., A. Shleifer, and R. W. Vishny (1990) “Do Managerial Objectives DriveBad Acquisitions,” Journal of Finance 45: 31–48.
Nayyar, P. R. (1992) “On the Measurement of Corporate Diversification Strategy:Evidence from Large U.S. Service Firms,” Strategic Management Journal 13: 219–235.

156 MORRIS, FIER, AND LIEBENBERG
Palepu, K. (1985) “Diversification Strategy, Profit Performance and the EntropyMeasure,” Strategic Management Journal 6: 239–255.
Palich, L. E., L. B. Cardinal, and C. C. Miller (2000) “Curvilinearity in the Diversi‐fication‐Performance Linkage: An Examination of Over Three Decades ofResearch,” Strategic Management Journal 21: 155–174.
Pehrsson, A. (2006) “Business Relatedness and Performance: A Study of ManagerialPerceptions,” Strategic Management Journal 27: 265–282.
Petersen, M. A. (2009) “Estimating Standard Errors in Finance Panel Data Sets:Comparing Approaches,” Review of Financial Studies 22: 435–480.
Rumelt, R. P. (1974) “Strategy, Structure and Economic Performance,” Division ofResearch, Graduate School of Business Administration, Harvard University,Boston, MA.
Rumelt, R. P. (1982) “Diversification Strategy and Profitability,” Strategic Manage‐ment Journal 3: 359–369.
Santalo, J. and M. Becerra (2008) “Competition from Specialized Firms and theDiversification‐Performance Linkage,” The Journal of Finance 63: 851–883.
Seth, A. (1990) “Value Creation in Acquisitions: A Reexamination of PerformanceIssues,” Strategic Management Journal 11: 99–115.
Shim, J. (2011) “Mergers & Acquisitions, Diversification and Performance in theU.S. Property‐Liability Insurance Industry,” Journal of Financial Services Research39: 119–144.
Sommer, D. W. (1996) “The Impact of Firm Risk on Property‐Liability InsurancePrices,” Journal of Risk and Insurance 63: 501–514.
Teece, D. J. (1980) “Economies of Scope and the Scope of the Enterprise,” Journal ofEconomic Behavior and Organization 1: 223–247.
Teece, D. J. (1982) “Towards an Economic Theory of the Multiproduct Firm,” Journalof Economic Behavior and Organization 3: 39–63.
Tombs, J. W. and R. E. Hoyt (1994) “The Effect of Product‐Line Focus on InsurerStock Returns,” Proceedings of the International Insurance Society: 331–339.
Villalonga, B. (2004) “Diversification Discount or Premium? New Evidence fromthe Business Information Tracking Series,” Journal of Finance 59: 479–506.
Williamson, O. E. (1985) The Economic Institutions of Capitalism: Firms, Markets,Relational Contracting, Free Press.

DIVERSIFICATION RELATEDNESS AND FIRM PERFORMANCE 157
APPENDIX
Relatedness Score Computation
The following steps are taken in order to compute line‐of‐businessrelatedness scores:(1) Count the number of P/L insurers that write both line i and line j, where
the total number of insurers writing both lines in the industry isdenoted by Jij. Because the value of Jij likely also includes diversification
that is either random or the result of “managerial experimentation”(Teece et al., 1994), the value must be adjusted, such that:
, (1)
where
, (2)
and
(3)
where represents the expected number of insurers that write inboth lines i and j, ni represents the number of firms writing line ofbusiness i, nj represents the number of firms writing line of business j,and K represents the total number of insurers. Thus, is a standard‐ized measure of the number of firms writing both lines i and j aboveand beyond what would be expected due to randomness.
(2) As noted by Bryce and Winter (2009) and BLRS (2012), the computedrelatedness score represents the standardized number of firms writinglines i and j, but this number does not reflect the economic importance ofthe pairing for the average firm writing the two lines of business. Inorder to generate a value that accounts for the economic importanceof the pairing, one must first compute a distance matrix, which isgenerated by calculating the maximum relatedness score, , for eachcombination of lines i and j and subtract all relatedness scores from themaximum score, given as:
. (4)
ij
Jij ij–
ij-----------------=
ij
ninj
K----------=
ij2 ij 1
ni
K----–
K nj–
K 1–-------------- =
ij
ij
ij
max ij–

158 MORRIS, FIER, AND LIEBENBERG
This then results in a distance matrix where the values within each cellrepresent the distance between each pairing i and j from the mostcommon line‐of‐business pairing. Within the matrix cells, low valuessuggest higher levels of relatedness while higher values suggest lowerlevels of relatedness.
(3) After generating the distance matrix, each cell is weighted by theaverage of insurer premiums written associated with the combinationof lines i and j. The average industry weight, , is given as:
(5)
where is a binary variable equal to 1 if insurer k writes both businesslines i and j, and 0 otherwise. denotes total net premiums written inline i. Each cell in the distance matrix is then weighted as:
(6)
(4) After weighting each cell, one must then solve for the shortest pathdistance between each line-of-business pair in the weighted matrix inorder to generate scores even for those pairs that do not currentlyexist.29
(5) After solving for shortest path distances, the matrix is converted intoa similarities matrix so larger values represent greater levels ofrelatedness and smaller values represent lower levels of relatedness.This is done by subtracting each path score from the maximumdistance score.
(6) In order to improve ease of interpretation, the scores calculated in step5 are converted into percentile relatedness scores, Rij. By convertingthe values into percentile relatedness scores, the score identifies whereeach pair of lines lies in the distribution of all pairs. For instance, arelatedness score of .94 for two particular lines implies that 94 percentof all other line combinations are less related while 6 percent of otherline combinations are more related.
29 As described by BLRS (2012), this may be thought of as an attempt to determine the driv‐ing distance between two cities that are not directly connected by a road. If City A is con‐nected to City C by road X and City B is also connected to City C by road X, distance can bemeasured between cities A and B even if a direct link does not exist.
Sij
Sij
kmink NPWi NPWj, Iijk
kIijk------------------------------------------------------------------=
IijkNPWi
ij
ij
max ij–
Sij-------------------------------=