Embed Size (px)
Citation preview

© 2015 IJEDR | Volume 3, Issue 4 | ISSN: 2321-9939
IJEDR1504028 )www.ijedr.orgInternational Journal of Engineering Development and Research ( 190
The Effect of Confinement and Shear Connector on
the Ultimate Capacity of the Short Composite
Column 1Hadad Said Hadad, 2Mohammed Taha Nooman and 3Mostafa Mohammed Ahmed Mostafa
1 Professor, Housing and Building National Research Center, Cairo, Egypt 2 Dr., Al Azhar University, Faculty of Engineering, Cairo, Egypt
3 Demonstrator, Al Azhar University, Faculty of Engineering, Qena, Egypt
________________________________________________________________________________________________________
Abstract - In recent years, the use of encased steel concrete composite columns has been increased significantly in medium
or high-rise buildings. Most design codes and researches neglect effect of confinement and shear connectors. The study
represents a qualitative transition in the experimental and analytical investigations on shear connectors effectively at steel
concrete interfaces. The most studies in the field of shear connectors were devoted to composite beam and slab systems.
The aim of the present investigation is to assess experimentally the current methods and codes for evaluating the ultimate
load behavior of concrete encased steel short columns with the use of different stirrups ratio and shear connectors with
different shapes and sizes to provide resistance to slip at steel concrete interfaces. In the present study nine specimens
having a column cross section of (120x160) mm and a length of (800) mm were tested under axial loading. One specimen
was chosen to be control column; some specimens were chosen to be strengthened by horizontal stirrups with different
spacing (Ø6). The others specimens were chosen to be strengthened by horizontal shear connectors with different spacing
and types. The test results show that the decreasing in spacing of stirrups technique gives an increase in the load carrying
capacity up to (15 %) of the control ultimate capacity. However, using shear connectors system technique which made of
steel reinforcement bars and stud shear connectors welded to flange of steel shape encased concrete gives an increase in
the load carrying capacity up to (8.3%) of the control ultimate capacity. In addition, increasing numbers of horizontal
stirrups increases the load carrying capacity of the encased composite columns under axial load. The results suggest that
the effect of confinement and shear connectors should take in account for increasing the load carrying capacity, ductility
and stiffness for column subjected to axial loading.
Keywords - Composite columns; Concrete encased columns; Confinement; Shear connectors. ________________________________________________________________________________________________________
I. INTRODUCTION
For the past two decades, concrete encased steel columns are used in tall buildings. They have the rigidity and stiffness of
concrete, as well as, the strength and ductility of the steel section. They also reduce the cross sectional dimensions which in turn
makes them more slender and easy to erect. Composite columns can be classified as either hollow sections filled with concrete or
steel sections encased in concrete .The latter one is considered in this paper. It offers high strength, ductility, fire protection for the
steel section, and simplified beam to column connections. Different methods for the design of composite columns exist in codes
of practice [1–8] with neglecting the effect of confinement and shear connectors in most codes of practice. A composite column
may be treated in some methods as a steel column strengthened by concrete. On the other hand, it may be treated as a reinforced
concrete column with special reinforcement. Furthermore, the strength of a composite column may be evaluated as the sum of
strengths of both components, concrete and steel reinforcements. Existing code differences may be attributed to difference in
design philosophy; i.e., strain distribution and compatibility. This discrepancy is referring to the differences in allowable material
properties, limiting dimensions and safety factors [9–11].
The confinement of column by increasing horizontal stirrups number is one type of strengthening techniques to improve the
behavior of the load carrying capacity of columns. Shear connectors can be performed by means of welding of reinforcement bars
or studs in steel encased section to resist shear transfer at surface between steel and concrete. The present study deals with
studying effects of confinement and shear connectors in the rectangular composite encased concrete columns (CEC) under axial
loads using different stirrups numbers and shear connectors with different shapes and sizes.
K.Z. Soliman and others [12] investigated and evaluated the ultimate axial compression strength of the concrete encased steel
columns and also the concrete contribution to the ultimate axial load according to the available different codes. Therefore, the
encased steel sections were replaced with plastic pipes and wood shape S.I.B, instead of steel pipes and steel S.I.B sections .For
each specimen, the loads carried by the concrete portion, steel portion, and the composite section were determined according to
the available different codes [1–5] requirements. The used codes do not consider the confinement effect for predicting the ultimate
axial strength of the columns. The comparative of studies with the experimental results showed that the predicted results are
generally lower than the test results which means that the calculated column strengths using the five previous codes are
almost on the conservative side .However, the ECP-SC-LRFD-2012 formula led to the most conservative results. The ultimate
load and corresponding axial deformation of the tested columns varied depending on both the configuration of the lateral steel
reinforcement and the encased steel shape which are not considered in the available design codes. Mimoune [13] studied

© 2015 IJEDR | Volume 3, Issue 4 | ISSN: 2321-9939
IJEDR1504028 )www.ijedr.orgInternational Journal of Engineering Development and Research ( 191
theoretically the monotonic behavior of composite columns under axial load and he concluded that the obtained results showed a
difference between different codes of practice. It was also stated that, the confinement coefficients’ values need to be adjusted.
Paul and Samanta [14] assessed the axial capacity of a concrete encased steel short column by two different codes, the Euro
Code EC4 and the Load and Resistance Factor Design American Institute of Steel Construction AISC-LFRD code using a 3D
finite element model. They reported that the Euro Code EC4 method shows more accurate predictions of composite column
strength. However, neither EC4 nor AISC provisions explicitly consider any increase in the strength or ductility of concrete due to
transverse ties, i.e.; the confinement effect was not included so it is of importance to experimentally investigate the concrete
confinement effect on the concrete encased steel composite columns.
A. K. Samanta and A. Paul [15] presented the design assessment of concrete encased I-sections composite column based
approaches given in Eurocode, ACI Code, BS. Code and AISC-LRFD. This study includes comparison of various design
parameters and evaluation of design strength based on the procedures predicted in the various codes of practices .A practical
example has been assumed and calculation has been shown to evaluate their potentiality in understanding in predicting the
potentiality of various procedures. The obtained results based on the methods varies widely, because of the different design
considerations adopted by the different codes. As such, they have hardly considered the effect of confinement of the concrete due
to the presence of longitudinal reinforcements as well as lateral ties .
L. K. Al- Hadithy and others [16] used three types of shear connectors with four concrete grades for each type in fabricating
composite specimens. The twelve composite prototypes were subjected to push out test individually to examine their behavior by
measuring the slip values for each load incremental till failure, thus determining the resistance extent of each connectors type and
specifying the failure mode at interface. A nonlinear three dimensional finite element analysis was carried out on twelve
composite column segments using ANSYS computer program. Comparison of the experimental and theoretical results has shown
good agreement that verifies the accuracy of the finite element model based on the smeared crack model of concrete. Results
detected the development of the relative slip be at all ranges of the load-slip relationship at interface even with using effective
shear connection and /or high quality concrete. The headed studs revealed the highest slip resistance and ultimate load over the
channel and the L-shaped studs. The high strength concrete has also revealed the same superiority over the other three tested types
of concrete.
1.1 Brief description of the available design codes for composite columns
Different concepts for the design of composite columns exist in the available codes of practice [1–8], will be summarized
hereinafter:
1.1.1. ECP 203-2007 [1]
The design of composite columns is based on the limit state design method with loading factors and partial safety for materials.
The strength of a composite column is computed as for reinforced concrete members. Failure is defined in terms of a 0.002 strain
limit for any concrete layer. However, the slenderness and area parameters are modified for the presence of the steel section. Load
transfer should be provided by direct bearing at the connections. The load carried by the concrete shall not exceed the allowable
bearing stress to avoid overstressing of concrete. The main equations used in the analysis are mentioned below for this code:
Pu = 0.35 fcuAc+0.67 fyscAsc (Concrete portion) (1)
Pu = 0.35 fcuAc +0.67f yss Ass+ 0.67 fysc Asc (Composite section) (2)
1.1.2. ECP-Sc-LRFD-2012 [2]
It is based on limit state design with loading factors , partial safety for materials, modified yield stress, modified young’s modulus,
modified radius of gyration and numerical quantification. The design of composite columns is based on the design equations for
steel columns. However, the slenderness and area parameters are modified for the presence of concrete. Load transfer
should be provided by direct bearing at the connections. The load carried by the concrete shall not exceed the allowable bearing
stress to avoid overstressing of concrete. The main equations used in the analysis are mentioned below for this code:
Pu = 0.80AsFcr (Composite section) (3)
Fcr =0.648𝐹𝑦𝑚
𝜆2 for λ≥ 1.1 (4)
Fcr = (1 – 0.348 λ2)Fym for λ≤ 1.1; where λ=slenderness ratio (5)
Fym= Fy+0.7 Fyr * 𝐴𝑟
𝐴𝑠 +0.48 * fcu *
𝐴𝑐
𝐴𝑠 (6)
1.1.3. ACI-318-08 [3]
It uses the limit state design format with factors and capacity reduction factors. The strength of a composite column is computed
as for reinforced concrete members. Failure is defined in terms of a 0.002 strain limit for any concrete layer. The expression for
equivalent stiffness includes a creep factor, and cracked concrete stiffness is considered. Minimum eccentricities are specified to
cover construction tolerances .The main equations used in the analysis are mentioned below for this code:
Pn,max =0.80 [0.85fc,,(Ag-Ast)+fyAst] (Concrete portion) (7)
Pn,max= 0.85[0.85fc, (Ag-Ast )+ fyssAss+fyAst] (Composite section) (8)
1.1.4. AISC-LRFD-2010 [4]
The load and resistance factor design uses the limit state design method with loading factors and capacity reduction factors. The
design of composite columns is based on the design equations for steel columns. The slenderness and area parameters are

© 2015 IJEDR | Volume 3, Issue 4 | ISSN: 2321-9939
IJEDR1504028 )www.ijedr.orgInternational Journal of Engineering Development and Research ( 192
modified for the presence of concrete. Load transfer should be provided by direct bearing at the connections .The main equations
used in the analysis are mentioned below for this code:
Pno=[0.85Fc,Ac+Fy As+Fysr Asr] (Composite section) (9)
Pno = nominal axial compressive strength without consideration of length effects,
Pe=2 (EIeff ) / (KL)2 (10)
Pn=0.75× Pno × [0.658𝑃𝑛𝑜
𝑃𝑒 ] , if
𝑃𝑛𝑜
𝑃𝑒 ≤ 2.25 (11)
Pn=0.877 Pe , if 𝑃𝑛𝑜
𝑃𝑒 > 2.25 (12)
EIeff =EsIs+0.5EsIsr+C1 EcIc (13)
C1=0.1+2(𝐴𝑠
𝐴𝑠+𝐴𝑐) ≤ 0.3 (14)
LOAD TRANSFER
When the entire external force is applied directly to the concrete encasement or concrete fill, the force required to be transferred
to the steel, Vr′, shall be determined as follows:
Vr′ = Pr (FyAs /Pno) (15)
where: Pr= required external force applied to the composite member, kips (N), Vr′ = required shear force kips (N). It is necessary
to ensure that load is transferred from the concrete to the steel by Shear Connectors, Shear strength of a connector:
uscccsan FAEfAQ 5.0 , (16)
Where: Asa=cross-sectional area of steel headed stud, in.2 (mm2), Ec=modulus of elasticity of concrete ksi (MPa), Fu = specified
minimum tensile strength of a steel headed stud anchor, ksi (MPa)
1.1.5. BS 5400-Part 5 [5]
It is based on limit state design with loading factors and partial safety for materials. Reduced concrete properties are used to
account for the effect of creep and the use of the un-cracked concrete section in stiffness calculation. The slenderness parameter is
consistent with the design of steel columns as the method reduces to the bare steel column design when the concrete portion is
removed. The main equations used in the analysis are mentioned below for this code:
αc= 0.45×𝐴𝑐×𝐹𝑐𝑢
𝑁𝑢 (concrete contribution ratio) (17)
Nu = 0.91As fy+ 0.87Ar fry + 0.45Ac fcu (Short column) (18)
Nay= 0.85K1yNu if αc is not applicable (Composite column) (19)
1.1.6. Chinese code CECS159[6]
CECS159 to predict the ultimate section capacity of a CFST stub column The predicted ultimate member capacity is:
Npl = χ Nps ≤ Nps , Nps = Asf y/γs+ Asr f yr/γsr +Acfc´/γc (20)
Where γs=1.1 is the partial safety factor for structural steel , γsr =1.15 partial safety factor for steel reinforcement, the partial
safety factor for concrete γc is 1.4 and the cylinder compressive strength fc´ is replaced by prism compressive strength fck.
χ =1-0.65 𝜆2 for λ ≤0.215 (21)
χ = 1
2 𝜆2[(0.965+0.3λ+𝜆2)-√(0.965 + 0.3𝜆 + 𝜆2)2 − 4𝜆2] for λ > 0.215 (22)
where the non-dimensional slenderness λ is defined as:
λ=𝑙𝑒
𝜋 √
𝑓𝑦 𝐴𝑠+𝑓𝑐𝑘𝐴𝑐+𝑓𝑦𝑟𝐴𝑠𝑟
𝐸𝑠𝐼𝑠+𝐸𝑐𝐼𝑐+𝐸𝑠𝑟𝐼𝑠𝑟 (23)
1.1.7. Hong Kong code [7]
predicted ultimate section capacity is:
For fully encased and partially encased H sections:
N ps = As fy /γm1 + Asr fyr /γsr + 0.45 Ac fcu. (24)
For in filled rectangular hollow sections:
Nps = As fy/γm1+ Asr fyr/γsr+0.53 Ac fcu (25)
Where fcu is the cube compressive strength of concrete, γm1=1.1 is the partial safety factor for structural steel, γsr =1.15 partial
safety factor for steel reinforcement. The HKS approach is quite similar to the EC4 approach in predicting the member capacity of
a composite column, except that it replaces 1.0 by 0.8 and fc´ by fcu in calculating the nominal section capacity defined by this Eq.
Nu = f y /γm1 As+ f yr A sr+ v Ac fc´ (26)
Where v=1 for a CFST and v=.85 for encased column.
1.1.8. Eurocode4 [8]
The predicted ultimate section capacity of composite columns stub column is:
Nps = Asf y/γs+ Asr f yr /γ sr + v Ac fc´/γc (27)
Where γs=1.0 is the partial safety factor for structural steel, γsr =1.15 partial safety factor for steel reinforcement, γc = 1.5 the
partial safety factor for concrete, respectively, v=1 for a CFST and v =0.85 for encased column. The predicted ultimate member
capacity of a slender composite column is: Npl = χ Nps≤ Nps (28)
χ= 1
∅+√∅2−𝜆2 (29)

© 2015 IJEDR | Volume 3, Issue 4 | ISSN: 2321-9939
IJEDR1504028 )www.ijedr.orgInternational Journal of Engineering Development and Research ( 193
where χ is the reduction factor; λ is the non-dimensional slenderness;
ϕ=0.5[1+𝛼(λ-0.2)+𝜆2] (30) α is the imperfection factor for buckling curve given in Eurocode 3 (α=0.21) [10*]. Then on dimensional slenderness λ for the
bending plane is expressed as :
λ = √𝑁𝑢/𝑁𝑐𝑟 ≤ 2 (31)
Nu = f y As+ f yr Asr+ v Ac fc´ (32)
N cr =π2 (EI) eff / Le2 (33)
(EI)eff = EsIs+ EsrIsr+0.6 Ecm Ic (34) Where Nu is the nominal section capacity, v=1 for a CFST and v=0.85for encased column, Ncr= the elastic critical normal force,
(EI)eff =The effective flexural stiffness, Es = the elastic modulus of steel; Ecm = the secant modulus of elasticity for concrete.
II. EXPERIMENTAL PROGRAM
2.1. Characteristics of test specimens
Nine specimens encased steel composite concrete columns were designed to investigate the effect of the tested parameters which
are the concrete contribution, the concrete confinement using different stirrups ratio and shear connector as well as different types
of connectors diameter or spacing between connectors .Determination of the axial capacity portion for both steel and concrete
section is also investigated. The concrete compressive strength, fcu was 53.7 MPa for all columns. All columns had rectangular
cross section of size 120*160mm and were longitudinally reinforced by 4 bars of 10 mm diameter. With entire height 1100mm.
The tested columns are divided into two main groups according to spacing between stirrups and the shear connectors types,
diameters and numbers. Column C1 is considered as control specimens. The details of the tested specimens are illustrated in table
1 and fig. 1, 2.
Table 1: Shows the properties of tested composite column, fcu=53.7Mpa
Ass
mm2
Asr
mm2
Ac (net)
mm2
Shear
Connectors Steel sect. Stir.
Main.
RFT.
Diment.
(mm) Spes. No.
764 314.16 18436 ------ Steel
I.P.E No.8 5 ϕ6/m 4Ø10 120×160 1
764 314.16 18436 ------ Steel
I.P.E No.8 10 ϕ6/m 4Ø10 120×160 2
764 314.16 18436 ------ Steel
I.P.E No.8 15 ϕ6/m 4Ø10 120×160 3
764 314.16 18436 connector 5 ϕ 8/m Steel
I.P.E No.8 5 ϕ6/m 4Ø10 120×160 4
764 314.16 18436 connector 10 ϕ 8/m Steel
I.P.E No.8 5 ϕ6/m 4Ø10 120×160 5
764 314.16 18436 connector 5 Φ 10/m Steel
I.P.E No.8 5 ϕ6/m 4Ø10 120×160 6
764 314.16 18436 connector 10 Φ 10/m Steel
I.P.E No.8 5 ϕ6/m 4Ø10 120×160 7
764 314.16 18436 5 stud ϕ 10/m Steel
I.P.E No.8 5 ϕ6/m 4Ø10 120×160 8
764 314.16 18436 10 stud ϕ 10/m Steel
I.P.E No.8 5 ϕ6/m 4Ø10 120×160 9

© 2015 IJEDR | Volume 3, Issue 4 | ISSN: 2321-9939
IJEDR1504028 )www.ijedr.orgInternational Journal of Engineering Development and Research ( 194
Fig. 1: Details of the tested columns
© 2015 IJEDR | Volume 3, Issue 4 | ISSN: 2321-9939
IJEDR1504028 )www.ijedr.orgInternational Journal of Engineering Development and Research ( 195
Fig. 2: Column specimen dimension and reinforcement
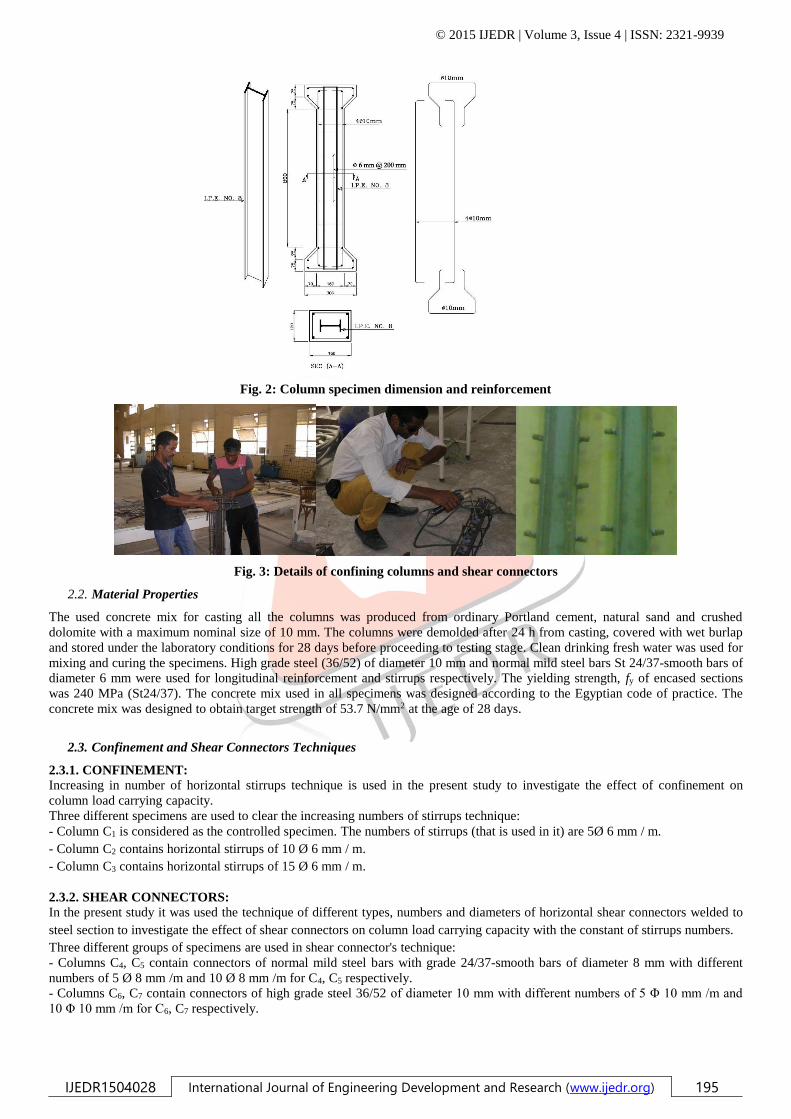
Fig. 3: Details of confining columns and shear connectors
2.2. Material Properties
The used concrete mix for casting all the columns was produced from ordinary Portland cement, natural sand and crushed
dolomite with a maximum nominal size of 10 mm. The columns were demolded after 24 h from casting, covered with wet burlap
and stored under the laboratory conditions for 28 days before proceeding to testing stage. Clean drinking fresh water was used for
mixing and curing the specimens. High grade steel (36/52) of diameter 10 mm and normal mild steel bars St 24/37-smooth bars of
diameter 6 mm were used for longitudinal reinforcement and stirrups respectively. The yielding strength, fy of encased sections
was 240 MPa (St24/37). The concrete mix used in all specimens was designed according to the Egyptian code of practice. The
concrete mix was designed to obtain target strength of 53.7 N/mm2 at the age of 28 days.
2.3. Confinement and Shear Connectors Techniques
2.3.1. CONFINEMENT:
Increasing in number of horizontal stirrups technique is used in the present study to investigate the effect of confinement on
column load carrying capacity.
Three different specimens are used to clear the increasing numbers of stirrups technique:
- Column C1 is considered as the controlled specimen. The numbers of stirrups (that is used in it) are 5Ø 6 mm / m.
- Column C2 contains horizontal stirrups of 10 Ø 6 mm / m.
- Column C3 contains horizontal stirrups of 15 Ø 6 mm / m.
2.3.2. SHEAR CONNECTORS:
In the present study it was used the technique of different types, numbers and diameters of horizontal shear connectors welded to
steel section to investigate the effect of shear connectors on column load carrying capacity with the constant of stirrups numbers.
Three different groups of specimens are used in shear connector's technique:
- Columns C4, C5 contain connectors of normal mild steel bars with grade 24/37-smooth bars of diameter 8 mm with different
numbers of 5 Ø 8 mm /m and 10 Ø 8 mm /m for C4, C5 respectively.
- Columns C6, C7 contain connectors of high grade steel 36/52 of diameter 10 mm with different numbers of 5 Φ 10 mm /m and
10 Φ 10 mm /m for C6, C7 respectively.

© 2015 IJEDR | Volume 3, Issue 4 | ISSN: 2321-9939
IJEDR1504028 )www.ijedr.orgInternational Journal of Engineering Development and Research ( 196
- Columns C8, C9 contain Stud's shear connectors of normal mild steel with grade 24/37-smooth bars of diameter 10 mm with
different numbers of 5 Ø 10 mm /m and 10 Ø 10 mm /m for C8, C9 respectively, as shown in fig. 1, fig. 3 and table 1.
2.4. STRAIN GAUGES and LVDTs
Five strain gauges have been used inside of mid height for all specimens, two were mounted on two vertical steel bars (BAR I)
and (BAR II), another one was mounted on the stirrup (BAR III), one was mounted on the web of steel section (BAR IV). And
one was mounted on the flange of steel section (BAR V). Two linear variable differential transducers (LVDT) have been used to
measure the columns deformations during loading. The gauge length was chosen at vertical direction (LVDT1) equal to 640 mm
to represent the axial deformation of the column and at horizontal direction (LVDT2) equal to130mm to represent the lateral
deformation of the column.
Fig. 4 shows the location of internal strain gauges and external LVDTs.
Fig. 4: Location of strain gauges and LVDTs.
2.5. Test Setup and Procedure
All column specimens were tested under static compression axial loads using the testing machine mounted on the material
laboratory of Al-Azhar University, which has an ultimate compressive load capacity of 2000kN. The data were collected
automatically by using a data acquisition system as shown in fig. 5 which represents the schematic diagram of the test setup. Prior
to the test, each column was centered at the machine head and an initial load was applied to ensure concentric loading. All the
columns were tested up to failure which was recognized when a sudden drop in the applied load was reached .This pattern of
gages allows for accurate axial strain measurements and traces any unintended eccentricity.
Fig. 5 Schematic diagram of the test setup for the tested columns.
800 mm

© 2015 IJEDR | Volume 3, Issue 4 | ISSN: 2321-9939
IJEDR1504028 )www.ijedr.orgInternational Journal of Engineering Development and Research ( 197
III. EXPERIMENTAL TEST RESULTS
Table 2 show experimental results of the tested columns that the ultimate load Pu, the corresponding deformation, the ductility
factor µ, poisons ratio ,toughness, stiffness and the column load carrying capacity as a percentage of control columns. Table 3
show the strain and forces in internal reinforcement and steel section.
Table 2: Experimental results of the tested columns.
Col
No. (kN) uP
Column.
Carrying
Capacity
(%) of
control
u
(mm)
f a
(mm) y
b
(mm) cµ
d
Modulus
of
toughnes
s
)2(N/mm
Stiffness(
)2N/mm
C1 975.5 100% 2.410 2.900 1.894 1.203 0.700 0.200 12872.98
C2 1003.38 103% 2.502 3.890 1.290 1.554 0.520 0.278 19182.83
C3 1118.3 115% 2.600 4.975 0.795 1.913 0.152 0.396 37672.43
C4 976.86 100.14% 1.500 1.755 0.920 1.170 0.144 0.122 22930.98
C5 980.66 100.53% 1.696 1.994 1.031 1.176 0.309 0.139 23886.68
C6 1056.42 108.3% 1.400 1.901 0.375 1.358 0.799 0.143 26409.21
C7 1056.42 108.3% 1.491 2.412 0.806 1.618 4.486 0.181 29345.29
C8 1046 107.23% 3.005 3.686 1.294 1.227 0.770 0.274 20408.55
C9 1047.58 107.4% 3.050 3.780 1.320 1.239 0.780 0.282 21494.90
a f is the deformation corresponding to a load equal to 75% of the ultimate load on the
descending branch of the load-deformation curve.
b y is the deformation corresponding to the intersection of the secant stiffness at a load equal to 75% of
the ultimate load and the tangent at the ultimate load.
c µ is the ductility factor = (f /u).
d is the poisons ratio = Lateral Strain (Ɛ laterally ) / Longitudinal Strain (Ɛ longitudinally
)
Modulus of toughness (N/mm2) = total area under stress strain curve till strain
corresponding to a stress equal to 75% of the ultimate stress on the descending
branch of the stress-strain curve.
Stiffness (N/mm2) is the slope of stress- strain curve in the elastic zone
It can be seen that increasing numbers of steel stirrups used in confining columns (C2, C3) gives an increase in the column load
carrying capacity, ductility, stiffness and modulus of toughness but decrease the Poisson's ratio of columns. However, the ultimate
load of columns with high strength bars (Φ10) shear connectors welded to flange steel sections (C6, C7) were higher than that of
columns with other types of shear connectors. Also, the ultimate load of columns with mild steel stud (ϕ10) welded to flange steel
sections (C8, C9) were higher than that of columns with smooth bars (mild steel(ϕ8)) welded to flange of steel sections. It is also
noted that increasing the number of shear connectors that used in columns with shear connectors from 5/m to 10/m led to increase
in the ductility factor, Poisson's ratio, modulus of toughness and stiffness for all types of shear connectors, as shown in table 2.
Table 3: Experimental strain and forces in internal reinforcement and steel section.
C o
l.
No
.
Strain
value
(x10-6) in
vertical
R.F.T(BA
RI),
(BARII)
Equiv.
force in
one
vertical
R.F.T
(KN)
Strain
value
(x10-6) in
stirrups
(BARIII
)
Equi
v.
force
in
stirru
ps
(KN)
Strain
value
(x10-6)
in web
(BARIV
)
Equiv.
force
in web
(KN)
Strain
value
(x10-6)
in flange
(BARV)
Equiv.
force
in one
flange
(KN)
Equiv.
force
in
concre
te(KN
)
C1 -2932.26 -48.59 440.82 2.63 -1577.50 -88.03 -1674.84 -88.26 516.57
C2 -2748.35 -45.55 830.46 4.95 -1580.57 -88.20 -1324.15 -69.78 593.43
C3 -2714.64 -44.99 1045.03 6.23 -1515.82 -84.59 -1292.08 -68.09 717.58
C4 -1804.89 -29.91 641.54 3.83 -1093.89 -61.04 -970.91 -51.17 693.84
C5 -1340.98 -22.22 1049.62 6.26 -1360.84 -75.94 -1350.78 -71.19 673.46
C6 -1873.56 -31.05 1111.82 6.63 -1530.52 -85.41 -1453.07 -76.58 693.66
C7 -2078.54 -34.45 1186.43 7.08 -1460.26 -81.49 -1978.02 -104.24 628.67
C8 -2247.04 -37.24 199.45 1.19 -2149.17 -119.93 -2149.17 -113.26 550.59
C9 -1553.50 -25.74 424.20 2.53 -1545.31 -86.24 -1603.55 -84.51 689.35

© 2015 IJEDR | Volume 3, Issue 4 | ISSN: 2321-9939
IJEDR1504028 )www.ijedr.orgInternational Journal of Engineering Development and Research ( 198
Table 3 shows the experimental strains and equivalent forces in all elements of tested columns (vertical reinforcement, horizontal
stirrups, steel section and concrete).
3.1. Crack pattern and mode of failure
During testing, the columns surfaces were observed in order to follow the development and the propagation of cracks. The
appearance of these cracks was always a sign that the column has attained the failure state. The failure mechanisms of the tested
columns without shear connector at the encased steel section were almost the same. The damage sequence for columns was as
follows: inclined cracks occurred at the upper or lower part of the column and with increasing of the applied load cracks became
wider and the cover started to spall off. Finally, crushing of concrete occurred followed by buckling of vertical steel
reinforcement. As in the samples with shear connector at the encased steel sections were happening distribution of cracks in most
high column, was clearly seen in the sample C7, Fig. 6 shows the crack patterns and the mode of failure of the tested columns.
Fig. 6: Failure patterns of the tested columns.

© 2015 IJEDR | Volume 3, Issue 4 | ISSN: 2321-9939
IJEDR1504028 )www.ijedr.orgInternational Journal of Engineering Development and Research ( 199
3.2. Load- deformation relationship:
Fig. 7 to 15 shows the axial load versus average concrete vertical and horizontal deformation for all the tested columns. The
curves start with a linear part. At stress levels near the ultimate stress of concrete, the curves start to bend indicating that the
concrete had cracked and the stirrups started their confining action.
Fig. 7: Load versus deformation for column (C1)
Fig. 8: Load versus deformation for column (C2) Fig. 9: Load versus deformation for column (C3)
Fig.10: Load versus deformation for column (C4) Fig. 11: Load versus deformation for column (C5)
Fig. 12: Load versus deformation for column (C6) Fig. 13: Load versus deformation for column (C7)

© 2015 IJEDR | Volume 3, Issue 4 | ISSN: 2321-9939
IJEDR1504028 )www.ijedr.orgInternational Journal of Engineering Development and Research ( 200
Fig. 14: Load versus deformation for column (C8) Fig. 15: Load versus deformation for column (C9)
3.3. Strains in steel reinforcement:
The strains in vertical reinforcement of the tested specimens reached yielding at the ultimate load. However the observations at
failure showed that the yielding of stirrups might have occurred. The measured steel strain is shown in fig. 16 a, b, c.
Fig. 16. a: Load versus steel strain for tested columns (C1:C3)
Fig. 16. b: Load versus steel strain for Fig. 16. c: Load versus steel strain for
tested columns (C4:C6) tested columns (C7:C9)
Based on all the previous measurements, it is obvious that the ultimate load, corresponding deformation and strains of steel for the
tested columns varied depending on both the configuration of the lateral steel reinforcement and the shear connectors welded in
encased steel shapes which are not considered in the available design codes.
IV. THEORETICAL EVALUATION OF THE EXPERIMENTAL RESULTS
This paper investigates and evaluates the ultimate axial compression strength of the concrete encased steel columns and also the
concrete contribution to the ultimate axial load according to the available different codes. For each specimen, the loads carried by
the concrete portion, steel portion, and the composite section were determined according to the available different codes [1–8]
requirements. All the partial factors of safety for materials and the resistance factors are set to unity. This will give an unbiased
comparison of the capacities predicted by the eight methods since each method has its own resistance factors which are used with
the corresponding load factors. The calculated capacities are presented in table 4 and compared to the experimental results as
shown in Table 5. The main equations used in the analysis are mentioned above for each code:

© 2015 IJEDR | Volume 3, Issue 4 | ISSN: 2321-9939
IJEDR1504028 )www.ijedr.orgInternational Journal of Engineering Development and Research ( 201
Table 4: Calculated axial capacities of the tested columns according to available codes Pcalc., Pu (EXP.), kN.
Col.
No.
Pu
(EXP.)
ECP203-
2007 [1]
ECPSC-
LRFD -
2012
[2]
ACI-318
[3]
AISC-
LRFD-
2010
[4]
BS540
0-5
[5]
Chines
e
code
CECS1
59 [6]
Hong
Kong
code [7]
Euro
code4
[8]
C1 975.50
54
5.1
31
56
2.1
42
82
4.2
2
60
4.1
71
0.7
6
78
1.9
1
68
5.1
2
70
9.5
8
C2 1003.38
C3 1118.30
C4 976.86
C5 980.66
C6 1056.42
C7 1056.42
C8 1046.00
C9 1047.58
Table 5: Comparison between calculated axial capacities of the tested columns and experimental results, (Pu
(EXP.)/Pcalc.)
Column
No.
ECP203-
2007 [1]
ECPSC-
LRFD -
2012 [2]
ACI-
318
[3]
AISC-
LRFD-
2010
[4]
BS5400-
5 [5]
Chinese
code
CECS159
[6]
Hong
Kong
code
[7]
Eurocode4
[8]
C1 1.789 1.735 1.184 1.615 1.372 1.248 1.424 1.375
C2 1.841 1.785 1.217 1.661 1.412 1.283 1.465 1.414
C3 2.051 1.989 1.357 1.851 1.573 1.430 1.632 1.576
C4 1.792 1.738 1.185 1.617 1.374 1.249 1.426 1.377
C5 1.799 1.745 1.190 1.623 1.380 1.254 1.431 1.382
C6 1.938 1.879 1.282 1.749 1.486 1.351 1.542 1.489
C7 1.938 1.879 1.282 1.749 1.486 1.351 1.542 1.489
C8 1.919 1.861 1.269 1.732 1.472 1.338 1.527 1.474
C9 1.922 1.864 1.271 1.734 1.474 1.340 1.529 1.476
Aver. 1.888 1.831 1.248 1.703 1.448 1.316 1.502 1.450
Table 6: Concrete contribution ratio due to the experimental results and available codes.
Colum
n
No.
Exp.
data
ECP
203-
2007
[1]
ECPS
C-
LRFD
-2012
[2]
ACI-
318
[3]
AISC-
LRFD-
2010 [4]
BS540
0-5 [5]
Chinese
code
CECS15
9 [6]
Hong
Kong
code
[7]
Eurocode4
[8]
C1 0.53 0.67 0.65 0.69 0.69 0.63 0.68 0.63 0.614
C2 0.59 0.67 0.65 0.69 0.69 0.63 0.68 0.63 0.614
C3 0.64 0.67 0.65 0.69 0.69 0.63 0.68 0.63 0.614
C4 0.71 0.67 0.65 0.69 0.69 0.63 0.68 0.63 0.614
C5 0.69 0.67 0.65 0.69 0.69 0.63 0.68 0.63 0.614
C6 0.66 0.67 0.65 0.69 0.69 0.63 0.68 0.63 0.614
C7 0.60 0.67 0.65 0.69 0.69 0.63 0.68 0.63 0.614
C8 0.53 0.67 0.65 0.69 0.69 0.63 0.68 0.63 0.614
C9 0.66 0.67 0.65 0.69 0.69 0.63 0.68 0.63 0.614
Referring to table 4, it is noticed that the calculated axial capacities of the first three specimens are the same as the used codes do
not considering the confinement effect for predicting the ultimate axial strength. So, to predict the effect of confinement one from
the following formulas can be used:
-The formula of Egyptian Code for FRP [17] that presents the following equation for the strength of confined columns:
f cuc = fcu [2.25 √1 + 9.875 𝑓𝑙
𝑓𝑐𝑢 -2.25
𝑓𝑙
𝑓𝑐𝑢 – 1.25 (35)
Where: fcuc =the compressive strength of confined concrete. fcu= the specified compressive strength of concrete.
-The formula of Mander et al. [18] that presents the following equation for the strength of confined columns:
f ′𝑐𝑐 = fco' (-1.254+ 2.254 √1 +
7.94 𝑓′𝑙
𝑓′𝑐0 -2
𝑓′𝑙
𝑓′𝑐0 ) (36)
Where: f 'cc = the compressive strength of confined concrete=, f 'co = the compressive strength of unconfined concrete= fc', f 'l =
the effective lateral confining stress=𝑓𝑙=𝑓𝑟.

© 2015 IJEDR | Volume 3, Issue 4 | ISSN: 2321-9939
IJEDR1504028 )www.ijedr.orgInternational Journal of Engineering Development and Research ( 202
-The formulas of O'Shea and Bridge [19] that:
fcc'=fc' [-1.228+2.172 √1 +7.46𝑓𝑟
𝑓𝑐′− 2
𝑓𝑟
𝑓𝑐′ ] for fc' ≤ 50 MPa (37)
fcc'=fc' [𝑓𝑟
0.558 √𝑓𝑐′+ 1]
1.25(1+0.062 𝑓𝑟
𝑓𝑐′
)(𝑓𝑐′)−0.21
for 80< fc'<100 Mpa (38)
Where fl is calculated according to the shape and strengthening system of cross-section we can calculate it as shown in fig. 17
f l *b *s =2Atie *f yt , f l = 2 𝐴𝑡𝑖𝑒 ∗𝑓 𝑦𝑡
𝑠 ∗𝑏 , (39)
Fig. 17: lateral pressure due to stirrups. Where: s = spacing between stirrups (ties).
Table 7 Compressive strength of confined concrete by stirrups and Pu (KN), ECP203-2007 [1]
Column
No. S (mm)
Confined
compressive
strength of
concrete
(Mpa) [17]
Pu
(KN),
ECP20
3-2007
[1]
Ultimate
column.
carrying
capacity(
%) of
control
Confined
compressiv
e strength
of concrete
(Mpa) [18]
Pu
(KN),
ECP203-
2007 [1]
Ultimate
column.
carrying
capacity(%)
of control
C1 200 59.92 585.264 100% 58.76 577.78 100%
C2 100 65.659 622.297 106.3% 63.5 608.37 105.3%
C3 66.67 70.995 656.728 112.2% 67.96 637.145 110.3%
C4: C9 200 59.92 585.264 100% 58.76 577.78 100%
Fig. 18: Experimental ultimate axial capacity versus number of stirrups for tested columns
Table 8: Load transfer due to the experimental results and available codes, KN
Column No. Exp. Data AISC-LRFD-2010 [4]
C1 264.56 296.089
C2 227.77 304.552
C3 220.77 339.433
C4 163.38 296.502
C5 218.31 297.655
C6 238.56 320.65
C7 289.97 320.65
C8 346.45 317.488
C9 255.25 317.967
900
950
1000
1050
1100
1150
1200
0 5 10 15 20
Ult
imat
e ax
ial
cap
acit
y o
f co
lum
ns
(KN
)
Number of stirrups /m

© 2015 IJEDR | Volume 3, Issue 4 | ISSN: 2321-9939
IJEDR1504028 )www.ijedr.orgInternational Journal of Engineering Development and Research ( 203
Referring to Table 5, the comparative studies with the experimental results show that the predicted results are generally lower
than the test results which mean that the calculated column strengths using the previous codes are almost on the conservative side.
ACI-318 [3] gives the closest prediction with an average of 24.8% lower than the test results and ECP203-2007 [1] gives the most
conservative results with an average of 88.8% lower than the test results. On the other hand, the calculated ratios of concrete
contribution ranged between 0.63 and 0.70 according to codes [1- 8], and it varied from 0.53 to 0.71 according to experimental
results, see Table 6. It is clear that considerable discrepancies exist between codes and the experimental data due to neglecting of
the stirrups confinement and the effect of shear connectors that welded to encased steel shape in these codes, where the calculated
concrete contribution of the specimens are the same as the used codes do not considering the effect of confinement and shear
connector. Also, it is noticed that the enhancement of the experimental concrete contribution of columns due to the confinement
effect and presence of shear connectors.
Table 7 shows enhancement of the theoretical ultimate axial capacity of columns with taking into consideration the effect of the
confinement. Also, it can be seen that increasing the stirrups from 5 Ø 6 mm / m to 10 Ø 6 mm / m and from 10 Ø 6 mm / m to 15
Ø 6mm / m increase the ultimate column carrying capacity by (5 – 6) % approximately.
Table 8 shows the values of a compression between the theoretical and experimental shear transfer between concrete and steel
shapes. This force transfer by shear connectors in the columns with shear connectors. Referring to fig. 18, the experimental
ultimate axial capacity versus number of stirrups for tested confined columns. It can be seen that the ultimate load of C2 was
2.86% higher than that of C1 and the ultimate load of C3 was 11.45% higher than that of C2.
V. CONCLUSIONS
From the present study, the followings have been concluded:
1. A non-negligible difference between the available codes of practice and the experimental results is shown. The introduction of
confinement coefficients and shear connectors has an influence on the ultimate calculated axial loads.
2. The calculated column strengths using the available previous codes are found to be mostly conservative when compared with
the experimentally obtained test results. ACI-318 [3] gives the closest prediction with an average of 24.8% lower than the test
results and ECP203-2007 [1] gives the most conservative results with an average of 88.8% lower than the test results.
3. The values of confinement coefficients need to be adjusted in the used codes as they neglect the increase in strength, ductility
and stiffness of columns due to transverse ties.
4. The obtained results show that the Increasing numbers of steel stirrups used in confining columns gives an increase in the load
carrying capacity of columns. Where, it was noted that when the number of stirrups increased from 5 ø 6 mm/m to 15 ø 6 mm/m
the maximum experimental load of column increased about (15%).
5. The adding of shear connectors inside the columns welding in the flange of steel sections increased the column carrying
capacity, where the largest increasing in bearing capacity of tested columns a ratio of control column was for columns that use
connectors in the form of high strength bars and diameter of (Φ10 mm) with an increase of 8.3 %.
6. Using stud's shear connectors with diameter of (10 mm) increase the capacity by 7.4%, but the columns with connectors in the
form of smooth bars and diameter of (ø8 mm) were small increase of 0.53 %, therefore, it is preferred to use the connectors in the
form of high strength bars types from other types in the present study.
7. The concrete contribution is mainly dependent on the number of ties and shear transfer between the concrete and steel sections.
Despite this, no specific requirements for calculating shear transfer between the encased steel section and concrete are available in
the design codes. Future researches need to cover this point.
8. Finally, under axially loading, the deformation and mechanical performance of the concrete encased steel column with shear
connectors can further study with different factors, such as length to width ratio, slenderness ratio, axially load level and age,
strength of concrete, strength and shape of encased steel section, and also can analyze the influences of ultimate bearing capacity
under different factors by the orthogonal experiment.
VI. ACKNOWLEDGEMENT
The researchers express their gratitude to the staff of ‘‘faculty of engineering, Al-Azhar University and Reinforced Concrete
Institute Housing and Building National Research Centre’’, for their great effort through all experimental stages of this research.
REFERENCES
[1] Egyptian Code of Practice for Design and Construction of Concrete Structures, ECP 203, Housing and Building National
Research Center, 2007.
[2] Egyptian Code of Practice for Steel Construction (ECP-SC-LRFD-2012).
[3] Building Code Requirements for Reinforced Concrete, American Concrete Institute, ACI 318, Detroit, 2008.
[4] Specification for Structural Steel Buildings, (AISC-LRFD), American Institute of Steel Construction, Chicago, Illinois, 2010.
[5]Steel, Concrete and Composite Bridges, Part 5, (BS.5400-5): Code of Practice for Design of Composite Bridges, 2002.
[6] CECS159.Technical specification for structures with concrete filled rectangular steel tube members. Beijing: China Planning
Press; 2004 (in Chinese).
[7] Code of Practice for the Structural Use of Steel 2011. Hong Kong: Buildings Department; 2011.
[8]Eurocode4.Design of composite steel and concrete structures, part 1.1: general rules and rules for buildings. London: British
Standards Institution; 2004.
[9]- S. El - Tawil, G. Gregory. Strength and ductility of concrete encased composite columns. J. Struct. Eng 1999; 125: 1009–
1019.

© 2015 IJEDR | Volume 3, Issue 4 | ISSN: 2321-9939
IJEDR1504028 )www.ijedr.orgInternational Journal of Engineering Development and Research ( 204
[10]- C. Weng, S. Yen. Comparisons of concrete - encased composite column strength provisions of ACI code and AISC
specification. Eng. Struct. 2002; 24:59 – 72.
[11]-N. Shanmugam, B. Lakshmi. State of the art report on steel–concrete composite columns. J. Constr. Steel Res. 2001; 57:
1041–1080.
[12] K.Z. Soliman, A.I. Arafa, Tamer M. Elrakib. Review of design codes of concrete encased steel short columns under axial
compression. HBRC Journal 2013; 9: 134–143, Cairo, Egypt.
[13]- M. Mimoune. Design of Steel Concrete Composite Columns Subject to Axial Compression. Constantine University Algeria
2010; 35: 201–207.
[14]- A. Paul, A. Samanta .Review of design practice of concrete encased steel short column under axial load. Int. J. Earth
Sci. Eng. 2011; 4: 608–611.
[15]- Amiya Kumar Samanta , Amit Paul . Evaluation of Current Design Practices on Estimation of Axial Capacity of Concrete
Encased Steel Composite Stub Columns: A Review. Journal of Civil Engineering and Architecture 2013; 7: 1080-1091, USA.
[16] Laith Khalid Al- Hadithy, Khalil Ibrahim Aziz, Mohammed Raji M. AL-Alusi. Experimental And Finite Element
Investigation On The Load–Slip Behavior Of Composite Push Out Segments Using Various Shear Connectors. Journal of
Engineering 2009; 15: 4087- 4111.
[17]- Egyptian Code for FRP; (Code 208Version 2005), Chapter 2 and Chapter3.
[18] Mander. J. B, Priestley, M. J. N, Park, R. Theoretical Stress- Strain Model for Confined Concrete. Journal of Structural
Engineering, ASCE1988; 114: 1804-1826.
[19]- O’Shea, M. D., and Bridge, R. Q. Design of circular thin-walled concrete filled steel tubes, Journal of Structural
Engineering 2000; 126: 1295-1303.


![Evaluation of the Heading Confinement Pressure … of the Heading Confinement Pressure Effect on Ground Settlement for … 15 different mechanical behavior [21], still these methods](https://img.dokumen.tips/doc/110x75/5ab1680e7f8b9a284c8c6944/evaluation-of-the-heading-confinement-pressure-of-the-heading-confinement-pressure.jpg)