Embed Size (px)
Citation preview

THE EFFECT OF BEHAVIOURAL FACTORS ON INDIVIDUAL
INVESTOR CHOICES AT THE NAIROBI SECURITIES EXCHANGE
BY
OMERY CELESTINE SHIKUKU
D63/64075/2013
A RESEARCH PROJECT SUBMITTED IN PARTIAL FULFILMENT OF
THE REQUIREMENTS FOR THE DEGREE OF MASTER OF SCIENCE
IN FINANCE IN THE SCHOOL OF BUSINESS, UNIVERSITY OF
NAIROBI
OCTOBER, 2014

ii
DECLARATION
I the undersigned do hereby declare that the work contained in this Master of Science in Finance
Degree Research Project is my own work and has not previously in its entirety or in part been
submitted for a degree in any other university.
Signature: ……………………………………………. Date: ……………………
Omery Celestine Shikuku
D63/64075/2013
This research project has been submitted for examination with my approval as the university
Supervisor:
Signature: ……………………………………………. Date: ……………………
Mr. Herick Ondigo
Lecturer, Department of Finance and Accounting
School of Business
University of Nairobi.

iii
ACKNOWLEDGEMENTS
It is because of the almighty God that I have been able to undertake this program successfully.
I am also thankful to my Supervisor Mr. Herick Ondigo -Chairman Department of Finance and
Accounting and Moderator Mr. Mirie Mwangi for their invaluable support in guiding me in this
project through their ideas and support that has seen my research idea developing to a research
project.
Much appreciation to the investors at the NSE who took their time and were willing to complete
my questionnaire therefore enabled data analysis and findings. Lastly I wish to express my
gratitude to all my colleagues for their great contribution together with whom we have seen this
to the end.

iv
DEDICATION
I dedicate this project to my family & friends who supported me. May the Almighty God bless
you all.

v
TABLE OF CONTENTS
DECLARATION............................................................................................................... ii
ACKNOWLEDGEMENTS ............................................................................................ iii
DEDICATION.................................................................................................................. iv
LIST OF TABLES ......................................................................................................... viii
LIST OF FIGURES ......................................................................................................... ix
LIST OF ABBREVIATIONS ...........................................................................................x
ABSTRACT ..................................................................................................................... xii
CHAPTER ONE:INTRODUCTION ...............................................................................1
1.1 Background of the Study ...............................................................................................1
1.1.1 Behavioral Factors...................................................................................................2
1.1.2 Individual Investor Choices ....................................................................................5
1.1.3 Effect of Behavioral factors on Individual Investor Choices ..................................7
1.1.4 Individual Investors at Nairobi Securities Exchange ..............................................9
1.2 Research Problem ........................................................................................................11
1.3 Objective of the Study .................................................................................................12
1.4 Value of the Study .......................................................................................................13
CHAPTER TWO:LITERATURE REVIEW ................................................................14
2.1 Introduction ..................................................................................................................14
2.2 Theoretical Review ......................................................................................................14
2.2.1 Modern Portfolio Theory ......................................................................................14
2.2.2 Capital Asset Pricing Model .................................................................................16
2.2.3 Option Pricing Theory ..............................................................................................17
2.2.4 The Efficient Market Hypothesis ..........................................................................18
2.2.5 Behavioral Theories ..............................................................................................19
2.2.6 Prospect Theory.....................................................................................................26

vi
2.3 Factors that influence Individual Investor Choices .....................................................26
2.3.1 Behavioral Factors.................................................................................................26
2.3.2 Market Factors.......................................................................................................28
2.3.3 Market Efficiency ..................................................................................................29
2.3.4 Market Information ...............................................................................................29
2.4. Empirical Review........................................................................................................30
2.4.1 International Evidence...........................................................................................30
2.4.2 Local Evidence ......................................................................................................33
2.5 Summary of Literature Review ....................................................................................34
CHAPTER THREE:RESEARCH METHODOLOGY ...............................................36
3.1 Introduction ..................................................................................................................36
3.2 Research Design...........................................................................................................36
3.3 Population ....................................................................................................................36
3.4 Sample..........................................................................................................................37
3.5 Data Collection ............................................................................................................37
3.5.1 Data Reliability and Validity.................................................................................38
3.6 Data Analysis ...............................................................................................................39
3.6.1 Analytical Model ...................................................................................................40
3.7 Test of Significance .....................................................................................................41
CHAPTER FOUR:DATA ANALYSIS, RESULTS AND DISCUSSION ..................42
4.1 Introduction ..................................................................................................................42
4.2 Descriptive Statistics ....................................................................................................42
4.2.1 Response Rate .......................................................................................................42
4.2.2 Data Validity .........................................................................................................43
4.2.3 Gender of Respondents .........................................................................................44
4.2.4 Age Bracket of the Respondents ...........................................................................45

vii
4.2.5 Marital status of Respondents ...............................................................................45
4.2.6 Level of Education of the Respondents.................................................................46
4.2.7 Average Monthly Income of the respondents .......................................................46
4.2.8 Behavioral Factors Influencing Investment Decisions ..........................................47
4.2.9 Individual Investor Choices ..................................................................................49
4.2.10 Duration of Trading in Shares .............................................................................49
4.2.11 Duration of participation in the stock market......................................................50
4.2.12 Market sectors. ..................................................................................................51
4.3 Inferential Statistics .....................................................................................................52
4.3.1 Correlation Analysis ..............................................................................................52
4.3.2 Correlation coefficients .........................................................................................52
4.3.3 Regression Analysis ..............................................................................................54
4.3.4 Analysis of Variance (ANOVA) ...........................................................................54
4.4 Interpretation of the Findings.......................................................................................57
CHAPTER FIVE:SUMMARY, CONCLUSION AND RECOMMENDATIONS ....59
5.1 Introduction ..................................................................................................................59
5.2 Summary ......................................................................................................................59
5.3 Conclusion ...................................................................................................................60
5.4 Recommendations for Policy .......................................................................................60
5.5 Limitations of the Study...............................................................................................61
5.6 Suggestions for Further Research ................................................................................62
REFERENCES .................................................................................................................64
APPENDICES ..................................................................................................................71
Appendix I: List of NSE Member Brokerage Firms as at August 2014 ............................71
Appendix II: Questionnaire................................................................................................72

viii
LIST OF TABLES
Table 4.1: Reliability Results .............................................................................................44
Table 4.2: Gender of the respondents ................................................................................44
Table 4.3: Age Bracket of the Respondents.......................................................................45
Table 4.4: Marital Status of the Respondents ....................................................................45
Table 4.5: Level of education of the respondents ..............................................................46
Table 4.6: Average monthly income of the respondents ...................................................47
Table 4.7: Behavioral Factors Influencing Investment Decisions .....................................47
Table 4.8: Estimate of the last number of shares bought (KSHS) .....................................49
Table 4.9: Duration of trading in shares ............................................................................50
Table 4.10: Duration of participation in the stock market .................................................50
Table 4.11: Correlation coefficient ....................................................................................53
Table 4.12: Model Summary .............................................................................................54
Table 4.13: Analysis of Variance (ANOVA) ....................................................................55
Table 4.14: Regression coefficients ...................................................................................56

ix
LIST OF FIGURES
Figure 4.1: Response rate ...................................................................................................43
Figure 4.2: Market sectors .................................................................................................51

x
LIST OF ABBREVIATIONS
CAPM Capital Asset Pricing Model
CRSP Center for Research in Security Prices
EMH Efficient Market Hypothesis
IPO Initial Public Offer
MPT Modern Portfolio Theory
NASI NSE All Share Index
NSE Nairobi Securities Exchange
NYSE New York Securities Exchange
SPSS Statistical Package for the Social Sciences
USA United States of America

xii
ABSTRACT
The study of individual investors‟ behavior, based on the behavioral finance theory, is of
interest and a relatively important phenomenon in Kenya. Behavioral finance theories are
based on psychological attempts aimed at explaining how sentiments and cognitive errors
influence the individual investors‟ behaviors, especially in regard to the investment
decision making process. The objective of this study is to determine the effects of
behavioral factors on individual investor choices at the NSE. There are few studies
relating to the individual investors‟ behavior at the NSE. This research examines some of
the existing theories relevant to the behavioral factors and behavioral finance under the
theoretical literature review. Descriptive design study was used.
Data for the study is primary data collected by the use of interviews and questionnaires
administered to individual investors at the NSE through the sixty three individual
investors selected from the twenty one listed investment and stock brokerage firms where
93.65% response rate was registered. Cronbach‟s Alpha Test was used to test the internal
consistency reliability of measurements, which are in formats of continuous variables 5-
point Likert measurements. Analysis was done using Statistical Packages for Social
Scientists. Descriptive statistics and correlation analysis were used to summarize the
research findings. The findings of the study established factors that determine the
individual investor behavior at the NSE. These factors were established to be varied, with
herding, loss aversion, regret aversion, price changes, market information ,past trends of
stocks, overconfidence and anchoring being highly affected by their decisions while
Mental Accounting emerging as the least significant factor determining the individual
investors‟ behavior with a low mean . Future studies are recommended to confirm the
findings of this research on behavioral finance related to individual investors‟ decision
making processes. Securities and investment firms should use these findings as reference
for their analysis and prediction of the trends of the security market. Investors should be
educated in order to manage and balance the effect of behavioral influences with respect
to decision making. Investors should also carefully consider and carry out research before
making investment decisions and should not be carried away by their earlier loss for their
future investment decisions.

1
CHAPTER ONE
INTRODUCTION
1.1 Background of the Study
Behavioral finance is the study of the influence of psychology on the behavior of
financial practitioners and the subsequent effect on markets (Sewell, 2005). It attempts to
better understand and explain how emotions and cognitive errors influence investors.
Much of economic and financial theories presume that individuals act rationally and
consider all available information in the investment decision-making process. Bernstein
(1996) notes that there is evidence to show repeated patterns of irrationality,
inconsistency and incompetence in the way human beings arrive at decisions and choices
when faced with uncertainty. There is also emerging evidence that institutional investors
behave differently from individual investors, in part because they are agents acting on
behalf of the ultimate investors.
Behavioral finance theories are based on cognitive psychology, which suggests that
human decision processes are subject to several cognitive illusions. These cognitive
illusions can be grouped into two classifications: illusions due to heuristic decision
processes and illusions caused by the adoption of mental frames, which are conveniently
grouped in the prospect theory. These two categories form the basis of the behavioral
theories: (Waweru, 2008).
In finance and economics, behavioral biases refer to the tendency of decision making that
result in irrational financial decisions caused by faulty cognitive reasoning and/or
reasoning influenced by emotions (Pompian, 2012). The interest in biases caused by

2
faulty cognitive reasoning or emotions that affect individual financial outcomes has seen
the emergence of research on behavioral finance as a concept. Sewell (2005) construed
behavioral finance as the study of the influence of psychology on the behavior of
financial practitioners and the subsequent effect on markets. Singh, R. (2010) assumed
that the information structure and the characteristics of market participants systematically
influence individuals' investment decisions as well as market outcomes.
Investment in the stock market (equity investment) is the buying and holding of shares of
stocks on a stock market by individuals and funds in anticipation of income from
dividends and capital gain as the value of the stock rises. The buying of equity can be
done by direct holding where an investor places a buy order through his broker or this can
be done via pooled investment vehicles; many of which have quoted prices that are listed
in financial newspapers. (www.bdafrica.com, 2011).
1.1.1 Behavioral Factors
Behavioral finance considers how various psychological traits affect how individuals or
groups act as investors, analysts, and portfolio managers (Brown & Reilly, 2004).
Heuristics can be defined as the use of experience and practical efforts to answer
questions or to improve performance. Raines & Leathers (2011) argue that when faced
with uncertainty, people rely on heuristics or rules of thumb to subjectively assess risks
of alternatives, which reduces the complex tasks of assessing probabilities and predicting
values to simpler judgmental operations.

3
Behavioral factors according to Shleifer (2000) can be measured by relating the usual
assumptions of traditional finance by incorporating observable, systematic and very
human departures from rationality into models of financial markets and behavior. By
combining psychology and finance, researchers hope to better explain certain features of
securities markets and investor behavior that appear irrational. They include: loss
aversion, cognitive dissonance, mental accounting, representativeness, anchoring,
overconfidence and herding behavior.
Cognitive dissonance refers to the psychological conflict resulting from incongruous
beliefs and attitudes held simultaneously. This concept was introduced by psychologist
Leon Festinger in the late 1950s. He and other researchers showed that when confronted
with challenging new information most people seek to preserve their current
understanding of the world by rejecting, explaining away, or avoiding the new
information or by convincing themselves that no conflict really existed (Chandra, 2008).
Mental accounting describes the tendency of people to place particular events into
different mental accounts based on superficial attributes (Shiller, 1997). Shiller (1997)
suggests that investors place their investments into arbitrarily separate mental
compartments and react separately and in different ways to the investment based on
which compartment they are in.
Heuristics are rules of thumb, which people use to make decisions in complex, uncertain
environments. Decision-making is not strictly rational where all relevant information is

4
collected and objectively evaluated; rather the decision-maker takes mental shortcuts
(Kahneman and Tversky, 1979). Examples of illusions resulting from the use of
heuristics include: Representativeness, Anchoring, and Overconfidence.
Representativeness can manifest itself when investors seek to buy “hot” stocks and to
avoid stocks, which have performed poorly in the recent past. Investors may form
judgments‟ based on patterns that are simply random in a data and not representative of
the facts. This behavior could provide an explanation for investor overreaction (DeBondt
and Thaler, 1995).
Anchoring arises when a value scale is fixed (anchored) by recent observations. Investors
usually use their purchase price as a reference point (Kahneman and Riepe, 1998) and
react to changes in price relative to the initial purchase price. According to Shiller (1998),
prices of today are often determined merely by those of the past.
Overconfidence according to Ritter (2003) manifests itself when there is little
diversification because of a tendency to invest too much in what one is familiar with.
Selecting common stocks that will outperform the market is a difficult task in that
predictability is low and feedback is noisy thus, stock selection is the type of task for
which people are most overconfident (Barber and Odean, 2001). Overconfidence explains
why portfolio managers trade so much, why pension funds hire active equity managers,
and why even financial economists often hold actively managed portfolios-they all think
they can pick winners (DeBondt & Thaler, 1994).

5
Graham (1999) defined herding behavior as often said to occur when many people take
the same action, perhaps because some mimic the actions of others in making investment.
It is where individuals are led to conform to the majority of the individuals present in the
decision making environment by following their decisions (Chelangat, 2011). Herd
behavior can lead people astray when they follow blindly. According to Prechter (1999),
herd behavior in humans results from impulsive mental activity in individuals responding
to signals from the behavior of others. Due to the fact that more and more information is
spread faster and faster, (Fromlet, 2001), life for decision makers in financial markets has
become more complicated. According to Johnson et al (2002) the interpretation of new
information may require heuristic decision-making rules.
1.1.2 Individual Investor Choices
Investment according to Bodie et al. (2008) is the current commitment of money or other
resources in the expectation of reaping future benefits. Investment management is the
professional management of investment funds for individuals, families and institutions. It
can be done either by the consumer or a professional and can be passive, active,
aggressive or conservative. The level of return will depend on internal factors and
characteristics such as type of investment, quality of management, and how the
investment is financed (Griffith, 1990).
Investors have difficulties making long term financial decisions for reasons such as
shortsightedness, a lack of financial sophistication and inability to self regulate
(Winchester et al.2011). The individual investors can employ a team of investment

6
professionals under the direction of a portfolio or a fund manager. These individuals
work full time on studying the markets, market trends, and individual stocks (Fischer &
Jordan, 1995). Investment decisions should be guided by predefined asset allocation
decisions that incorporate an acceptable level of risk for the overall portfolio and are
consistent with the goals and time horizon of the investor. The willingness to act
prudently and maintain an appropriately balanced investment portfolio in the face of
falling security prices requires the ability to avoid behavioral impulses when making long
term asset allocation decisions (Winchester et al. 2011).
A number of studies have been conducted pointing to market anomalies that cannot be
explained with the help of financial theories, such as abnormal price movements in
connection with IPOs, mergers, stock splits, and spin-offs (Johnson et al. 2002). The high
trading volume on organized exchange is perhaps the most embarrassing fact to standard
finance paradigm. High volume is not produced by amateur investors but the average
turnover for institutional investors is much higher than the rate for individuals (DeBondt
& Thaler, 1994).
Investors have been shown not to react logically to new information but to be over
confident to alter their choices when given superficial changes in the presentation of
investment information (Olsen, 1998). These anomalies suggest that the underlying
principles of rational behavior underlying the efficient market hypothesis are not entirely
correct, and that we need to look at other models of human behavior, as have been
studied in other social sciences (Shiller, 1998).

7
1.1.3 Effect of Behavioral factors on Individual Investor Choices
Individual investments behavior is concerned with choices about purchases of small
amounts of securities for his or her own account (Nofsinger and Richard, 2002).The
different behavior in the individual investors is caused by various factors which
compromise the investor rationality. Rational investors will use diversification to
optimize their portfolios according to Modern Portfolio Theory (MPT). MPT proposes
how a risky asset should be priced. The basic concepts of the theory are Markowitz
diversification, the efficient frontier, capital asset pricing model, the alpha and beta
coefficients, the capital market line and the securities market line (Sharpe, 1964). Most
economic and financial models explicitly or implicitly assume that investors are efficient
and rational. Investors are always assumed to make the best choices for themselves
nevertheless; the choice does not provide an adequate foundation for a descriptive theory
of decision making.
Rational investors are evident in many theories that include: the Efficient Market
Hypothesis (EMH), which value securities for its fundamental value (i.e., net present
value of its future cash flows, discounted using risk characteristic); quickly respond to
new information and bid up when news is good and down when the news is bad. EMH
assumes that securities price incorporate all available information almost immediately
and price adjust to new levels corresponding to the new present value of cash flow.
Rational investors assume that it is impossible to earn superior risk adjusted return
(Fama, 1970)

8
Tversky and Kahneman (1986) argued that the deviation of actual behavior from the
normative model are too widespread to be ignored, too systematic to be dismissed as
random error, and too fundamental to be accommodated by relaxing the normative
system. This is in line with other scholars who have questioned rationality of investors.
Further in the study by Waweru et al (2008), institutional investors were found to have
relied on fundamental analysis as the most widely used decision making model at the
NSE. Heuristic processes and prospect theory were found evident with heuristics strongly
dominating prospect theory .Market information and the fundamentals of the underlying
stock were found to have the highest impact on the investment decision making. Investors
want to find out the information about the financial products, return, risk involved and
tax-benefit. Investors collects the information from different sources like Personal and
public sources.
Waweru et al. (2008) investigated the role of behavioral finance and investor psychology
in investment decision-making at the Nairobi Stock Exchange with special reference to
institutional investors. The population in the study included all the 40 institutional
investors operating at the NSE as on 30 June 2004. This covered the banks, mutual funds,
pension funds, endowment schemes, investment banks, companies, collective investment
schemes, and insurance companies. The study established that behavioral factors such as
representativeness, overconfidence, anchoring, gambler‟s fallacy, availability bias, loss
aversion, regret aversion and mental accounting affected the decisions of the institutional
investors operating at the NSE.

9
1.1.4 Individual Investors at Nairobi Securities Exchange
Investor behavior is defined as how the investors judge, predict, analyze and review the
procedures for decision making, which includes investment psychology, information
gathering, defining and understanding, research and analysis. Investors need to make
rational decisions for maximizing their returns based on the information available by
taking judgments that are free from emotions (Brabazon, 2000). Investor behavior is
characterized by overexcitement and overreaction in both rising and falling security
markets and various factors influences their decision making processes.
At the NSE, security price move in excess of the fundamental market expectations. The
most recent being the IPO where the Safaricom shares were oversubscribed by almost
twice and some investors went to the extent of taking loans to purchase the shares which
resulted to losses as the share price did not increase as expected. This is a case of herding
in that the investors bought the shares because everybody did. This is also witnessed
during the corporate earnings announcement. When the performance of the company is
good the share price goes up for a short while then they fall in prices. This is attributed to
disposition effect where investors rush to sell the stock when the prices are up in the fear
that it may go down.
A study done by Chelangat (2011) showed that male investors are more overconfident as
compared to the female investors. They believe in the precision of their knowledge.
Female investors are affected more by herding where they seek advice from friends and
observe what others are doing. They are also prone to regret aversion bias. Other biases

10
affected both the male and female investors alike, the differences in effect being
negligible.
The study also revealed that the age of investors matters in the way they make their
investment decisions. The older investors who have much experience at the NSE were
more rational in making investment decisions and they displayed overconfidence bias as
they believe they can predict the market correctly. Younger investors are prone to herding
as the trend in the market seems to affect their decisions. They are also prone to other
biases more than the older investors.
Investigations into the IPO market in Kenya by Fredrick (2012) showed that, on average,
IPOs provided abnormal return in the immediate aftermarket to investors who purchased
at the initial offering. This for instance led to an oversubscription of IPOs, some of whose
aftermarket performance has since been dismal. The Capital Investment Group (2008)
provided a snapshot of the inconsistency in IPO short run returns to investors. The
analysis showed that investors anticipated abnormal returns as evidenced in previous
IPOs like Ken Gen and rushed for IPOs like Safaricom which led to an oversubscription.
Eveready on the other hand did not last long enough, leaving millions of investors with
depreciated stocks. This suggests that investor decisions were potentially influenced by
cognitive and emotional biases that led to their faulty investment decisions as explained
by behavioral finance theorists.

11
Olwenyet al.,(2012) investigated the effect of stock market experience on risk tolerance
and in their finding, investors with previous experience in the market were found to be
more tolerant to risk compared to those without experience due to previous exposure to
market volatility to which newcomers may be reluctant to risk.
1.2 Research Problem
There is huge psychology literature documenting that people make mistakes in the way
they think in that they are overconfident and put too much weight on recent experience.
This preference may create distortion. The field of behavioral finance attempts to
investigate the psychological and sociological issues that influence investment decision
making process of individuals and institutions (Subrahmanyam, 2007).
The Kenyan market has recently witnessed tremendous rise in the number of companies
applying to be listed on the Nairobi Securities Exchange. Investors on the other hand
have responded positively as it is evidenced through repeated oversubscriptions of shares.
However many investors have had to endure the pain of losses due to following the
masses and being overconfident as it was exemplified in the Safaricom and Eveready
Initial Public Offers.
Researchers have however proved that due to the market inefficiencies, the standard
finance models employed by market practitioners have failed to account for the market
anomalies. One can therefore presume that individuals are rational and therefore strictly
observe and follow the standard finance models in decision making. It is emerging from
the literature that individual investors have embraced heuristics or rule of thumb in their

12
investment decision making. Local studies have not adequately addressed the effects of
behavioral aspects of investment decisions at the NSE.
Investors need to make rational decisions for maximizing their returns based on the
information available by taking judgments that are free from emotions (Brabazon, 2000).
Investor behavior is characterized by overexcitement and overreaction in both rising and
falling security markets and various factors influences their decision making processes.
According to Kimani (2011) there were five behavioral factors that were at play. These
were: herding, market, prospect, overconfidence and anchoring bias. However, it was not
clear whether these behavioral biases affected individual investor decisions concerning
IPOs. Additionally, a recent study related to IPOs conducted by Kipngetich et al. (2011)
modeled investor sentiments in their equation of determinants of IPO pricing in Kenya
using secondary data obtained from the NSE. However, their study did not explore the
behavioral biases that underpin individual investor behavior during IPOs. This means that
most of the studies on investor behavior that have been reported were carried out in
mature markets. There is a gap in relevant literature on developing countries markets
particularly Kenya which is an emerging security market.
This study intends to address the research question: What is the effect of behavioral
factors on individual investor decisions at the Nairobi Securities Exchange?
1.3 Objective of the Study
To determine the behavioral factors that affect individual investor choices.

13
1.4 Value of the Study
To theory; this study will contribute to the general body of knowledge in the field of
finance and act as a reference material for future scholars and researchers who would like
to advance their knowledge in behavioral finance and use the study to formulate their
research problems.
For Policy makers; it will help them to formulate appropriate strategies that will help to
minimize the negative impact of such influences.
To investors; the findings of the study are expected to assist investors and investment
managers in understanding the contribution of psychological and emotional factors
towards their investment decisions as well as forming a basis for self evaluation by
individuals in light of their previous decisions to gauge the extent of their biasness and
make necessary adjustment.

14
CHAPTER TWO
LITERATURE REVIEW
2.1 Introduction
This chapter reviews the existing literature on behavioral finance and investment decision
making. It reviews both the theoretical and empirical studies on both the standard models
of finance and the behavioral models.
2.2 Theoretical Review
Standard finance is the body of knowledge built on the pillars of the arbitrage principles
of Miller and Modigliani, the Portfolio Principles of Markowitz, the Capital Asset Pricing
theory of Sharpe, Lintner and Black, and the Option-Pricing theory of Black Scholes
(Statman, 1999). These approaches consider markets to be efficient and highly analytical
and normative.
The basic question facing all investors is which securities to invest in. Most investors
according to Samal (1995) have eight common needs from their investments: security of
original capital, wealth accumulation, comfort factor, tax efficiency, life cover, income,
simplicity, ease of withdrawal and communication.
2.2.1 Modern Portfolio Theory
Markowitz (1952) developed modern portfolio theory (MPT). This basic portfolio model
suggests that the variance of the rate of return is a significant measure of portfolio risk
under a certain set of assumptions related to investor behavior. Markowitz suggested that
to choose profitable investments, it is not enough to look at the relationship between risk
and return. Investors should not only focus on the significance of diversification to reduce
the total portfolio risk, but also learn how they can effectively diversify.

15
The basic assumption of the modern portfolio theory is that investors are willing to
maximize their return on investment for a given level of risk. However investors are
fundamentally risk averse which means that if they have to choose between two assets
with equal rates of returns they are more likely to choose the asset with the lower level of
risk. Markowitz further demonstrated that because investors are risk averse they need to
combine assets into efficiently diversified portfolios. MPT assumes that portfolio risk can
be reduced if investors focus on the variability of expected returns and to achieve that,
investors should pick assets that tend to have dissimilar price movement.
Modern portfolio theory suggests that traditional approach to portfolio analysis, selection,
and management may well yield less than optimum results-that a more scientific
approach is needed based on estimates of risk and return of the portfolio and the attitude
of the investor toward a risk-return trade-off stemming from the analysis of the individual
security (Fischer & Jordan, 1995). Investors make two types of decisions in constructing
their portfolio: the asset allocation decisions are the choice among the broad asset classes;
while security selection is the choice of which particular securities to hold within each
asset class (Bodie et al. 2008).

16
2.2.2 Capital Asset Pricing Model
In 1964, Sharpe extended Markowitz‟s theory to introduce the notion of systematic risk
and non-systematic risk. Sharpe developed the Capital Asset Pricing Model (CAPM) that
considers a simplified world where all investors aim to maximize economic utility, are
rational and risk averse, are price takers, can lend and borrow unlimited under the risk
free rate of interest, trade without transaction or taxation costs, deal with securities that
are all highly divisible into small parcels, have identical investment horizons, have
identical options about expected returns, volatilities and correlations of available
investments, and assume all information is at the same time available to all investors.
Sharpe (1964) found that the return on an individual stock or a portfolio of stocks should
equal to the cost of capital. The CAPM model is of the form:
E (Ri) =Rf +i (Rm -Rf);
Where;
E (Ri) is the expected return on the security I;
Rf is the risk free rate of interest;
i is the beta coefficient which is the sensitivity of the expected asset returns to the
expected market returns;
i (Rm-Rf) is the market premium.
CAPM starts with the idea that individual investments contain two types of risks. First,
systematic risk is the risk of holding the market portfolio. These are market risks that
cannot be diversified away. As the market moves each individual asset is more or less

17
affected. To the extent that any asset participates in such general market moves, that asset
entails market risk. Secondly, non-systematic risk is the risk which is unique to an
individual asset. This risk can be diversified away as the investor increases the number of
stocks in his or her portfolio. It represents the component of an asset‟s returns which is
uncorrelated with general market moves (Pandey, 2008).
Modern portfolio theory shows that non-systematic risk can be removed through
diversification. The trouble is that diversification does not solve the problem of
systematic risk; even a portfolio of all the shares in the stock market cannot eliminate that
risk. Therefore, when calculating a deserved return, systematic risk is what plagues
investors most. CAPM therefore evolved as a way to measure this systematic risk
(Brigham &Ehrhardt, 2005).
2.2.3 Option Pricing Theory
The model is named after Black and Scholes, who developed it in 1973.The model,
assumes the option price follows a Geometric Brownian motion with constant drift and
volatility. Among other more complicated variables, the formula takes into consideration
the price of the underlying stock, the strike price of the option, and the amount of time
before the option expires.
Empirical studies show that the Black-Scholes model is very predictive, meaning that it
generates option prices that are very close to the actual price at which the options trade.
However, various studies show that the model tends to overvalue deep out-of-the-money
calls and undervalue deep in-the-money calls. It also tends to mis price options that
involve high-dividend stocks. Several of the model's assumptions also make it less than

18
100% accurate. The model assumes: that the risk-free rate and the stock's volatility are
constant, that stock prices are continuous and that large changes (such as those seen after
a merger announcement) don't occur, that a stock pays no dividends until after expiration
and that analysts can only estimate a stock's volatility instead of directly observing it, as
they can for the other inputs. Analysts have developed variations of the Black-Scholes
model to account for these limitations.
2.2.4 The Efficient Market Hypothesis
Fama in 1965 published his dissertation arguing for the random walk hypothesis, and
Samuelson published a proof for a version of the efficient-market hypothesis. In 1970,
Fama published a review of both the theory and the evidence for the hypothesis. Fama
presented the efficient market theory in terms of a fair game model, contending that
investors can be confident that a current market price fully reflects all available
information about a security and the expected return based upon this price is consistent
with its risk.
Fama divided the overall efficient market hypothesis (EMH) and the empirical tests of
the hypothesis into three sub hypotheses depending on the information set involved: (1)
weak-form EMH, (2) semi strong-form EMH, and (3) strong-form EMH.
The weak-form EMH assumes that current stock prices fully reflect all security market
information, including the historical sequence of prices, rates of return, trading volume
data, and other market-generated information, such as odd-lot transactions, block trades,
and transactions by exchange specialists. This implies that past rates of return and other

19
historical market data should have no relationship with future rates of return (that is, rates
of return should be independent). Therefore, this hypothesis contends that you should
gain little from using any trading rule that decides whether to buy or sell a security based
on past rates of return or any other past market data.
The semi strong-form EMH asserts that security prices adjust rapidly to the release of all
public information; that is, current security prices fully reflect all public information. It
encompasses the weak-form hypothesis, because all the market information considered
by the weak-form hypothesis, such as stock prices, rates of return, and trading volume, is
public.
The strong-form EMH contends that stock prices fully reflect all information from public
and private sources. This means that no group of investors has monopolistic access to
information relevant to the formation of prices. Therefore, this hypothesis contends that
no group of investors should be able to consistently derive above-average risk-adjusted
rates of return.
2.2.5 Behavioral Theories
They are based on traditional finance whereby the traditional finance model assumes that
people are rational. However, psychologists challenged this assumption. They argued that
people often suffer from cognitive and emotional biases and act in a seemingly irrational
manner.

20
In its attempt to model financial markets and the behavior of firms (DeBondt & Thaler,
1994), modern finance theory starts from a set of normatively appealing axioms about
individual behavior. Specifically people are said to be risk averse, expected utility
maximizes and unbiased forecasters, that is agents make rational choices based on
rational expectations. As noted by Olsen (1998), behavioral finance advocates recognize
that the standard finance models of rational behavior and profit maximization can be true
within specific boundaries, but they assert that it is an incomplete model since it does not
consider individual behavior. It is argued that some financial phenomena can be better
explained using models where it is recognized that some investors are not fully rational or
realize that it is not possible for arbitrageurs to offset all instances of mispricing (Barberis
& Thaler, 2003).
Over the past years psychologists have found again and again that the usual axioms of
finance theory are descriptively false. Raines & Leathers (2011) argue that institutional
conducts allow the psychological propensities to drive financial behavior. With rational
calculation of long-term yields from investments being impossible, Raines and Leather
argue that investors lack confidence in their own judgment and rely instead on
conventional judgment. Professional investors according to Keynes (1936) are only
concerned with what the market will value it at, under the influence of mass psychology
in three months to a year. Some of the basic factors and principal theories within
behavioral finance that contradict the basic assumptions of standard finance theories
include: Representativeness, Anchoring, cognitive dissonance, regret avoidance, mental
accounting, loss aversion and overconfidence.

21
Representativeness can manifest itself when investors seek to buy “hot” stocks and to
avoid stocks, which have performed poorly in the recent past. Investors may form
judgments‟ based of patterns that are simply random in a data and not representative of
the facts. This behavior could provide an explanation for investor overreaction According
to DeBondt & Thaler, 1995.People tend to categorize events as typical or representative
of a well-known class, and to overstress the importance of such a categorization. For
example, share prices often rise when a company reports increased earnings several
quarters in a row, because investors tend to infer a high long-term earnings growth rate
(Barberis, 2001).
Anchoring and adjustment is a psychological heuristic that influences the way people
intuitively assess probabilities. The anchoring and adjustment heuristic was first
theorized by Tversky and Kahneman (1974). In one of their first studies, the two showed
that when asked to guess the percentage of African nations that are members of the
United Nations, people who were first asked "Was it more or less than 10%?" guessed
lower values (25% on average) than those who had been asked if it was more or less than
65% (45% on average). The pattern has held in other experiments for a wide variety of
different subjects of estimation.
Cognitive dissonance refers to the psychological conflict resulting from incongruous
beliefs and attitudes held simultaneously. It was developed by Festinger in 1957. The
theory asserted that individuals are distressed by conflicting cognitive elements such as

22
discrepancy between empirical evidence and past choice, and that they alter their beliefs
to reduce this discomfort. The key feature of dissonance is that individuals alter their
beliefs to conform to their past actions.
In the context of investment decision making, cognitive dissonance can be considered a
psychological cost that investors seek to reduce by adjusting their beliefs about the
efficacy of past investment choices. Cognitive dissonance theory is thus based on three
fundamental assumptions: humans are sensitive to inconsistencies between actions and
beliefs, we all recognize, at some level, when we are acting in a way that is inconsistent
with our beliefs/attitudes/opinions. Dissonance will be resolved in one of three basic
ways: change beliefs, change actions or change perception of action.
Regret refers to people‟s emotional reaction on making a mistake (Plous, 1993).
According to DeBondt & Thaler (1987) regret avoidance is consistent with both the size
and book-to-market effect. Higher book-to-market firms tend to have depressed stock
prices. These firms are “out of favor” and more likely to be in a financially precarious
position. Similarly, smaller less well known firms are also less conventional investments.
Such firms require more courage on the part of the investor which increases the required
rate of return. If investors focus on the gains or losses of individual stocks rather than on
broad portfolios they can become more risk averse concerning stocks with recent poor
performance, discount their cash flows at higher rate and thereby create a value-stock risk
premium.

23
Investors consistently engage in behavior that they regret later (Evans, 2002). They avoid
selling shares that have decreased in value, and readily sell shares that have increased in
value (Shiller, 1998; Lebaron, 1999). Psychologists have found that individuals who
make decisions that turn out badly have more regret (blame themselves more) when the
decision was more unconventional. For example buying a blue chip portfolio that turns
down is not as painful as experiencing the same losses on unknown start-up firm. Any
losses on a blue-chip stock can be more easily attributed to bad luck rather than bad
decision making and cause less regret.
Regret avoidance may also result in what is known as herding behavior. Shiller (2000)
outlines psychological experiment by Deutsh & Gerrard where the human tendency to
concur with the majority view was shown. In the experiment, people questioned their
own opinions and found everybody disagreed with it. These human tendencies are
individually sensible, but collectively can lead to irrational and herding behavior. Any
investor may feel more comfortable investing in a popular stock if everybody else
believed that it is a good one however responsibility of it falling will be shared with the
other investors who originally expected it to do well.
Mental accounting describes the tendency of people to place particular events into
different mental accounts based on superficial attributes (Shiller, 1997). Shiller (1997)
suggest that investors place their investments into arbitrarily separate mental
compartments and react separately and in different ways to the investment based on
which compartment they are in.

24
According to Statman (1997) mental accounting is consistent with some investors‟
irrational preference for stocks with high cash dividends (they feel free to spend dividend
income but do not dip into capital by selling a few shares of another stock with the same
total rate of return) and with a tendency to ride losing stocks position for too long
(because “behavioral investors” are reluctant to realize losses).
Mental accounting affects not only the personal finances but is common phenomenon in
the complex world of investment. When an investor buys a new stock, he starts
maintaining a new virtual account for this stock in his mind. Each decision, action, and
outcome about that stock is placed in that account. So has each investment of its own.
Once an outcome is assigned a mental account it is difficult to view that outcome in
another way. When interaction among assets indifferent accounts is overlooked, this
mental process can adversely affect investor wealth (Chandra, 2008).
“Losing $100 hurts more than gaining $100 yields pleasure. The influence of loss
aversion on mental accounting is enormous” According to (Thaler, 1999). “The positive
counterpart to regret is pride. While closing a stock account at a loss induces regret,
closing at a gain induces pride. The quest for pride and the avoidance of regret leads to a
disposition to realize gains and defer losses” (Shefrin & Statman, 1985).However, there
is asymmetry between the strength of pride and regret and losses loom larger than gains
(Kahneman & Tversky, 1979). Asymmetry between the strength of pride and regret
(regret is stronger) leads inaction to be favored over action (Kahneman & Tversky, 1979;

25
Thaler, 1999). Thus, investors who are prone to this bias may be reluctant to realize both
gains and losses (Shefrin & Statman, 1985).
Overconfidence According to Ritter (2003) manifests itself when there is little
diversification because of a tendency to invest too much in what one is familiar with.
Selecting common stocks that will outperform the market is a difficult task. Predictability
is low; feedback is noisy. Thus, stock selection is the type of task for which people are
most overconfident (Barber and Odean, 2001).
Barber & Odean in 2001 compared trading activity and average returns in brokerage
accounts of men and women. They found that men (in particular single men) trade far
more actively than women, consistent with the greater overconfidence among men
documented in the psychology literature. People tend to overestimate the precision of
their beliefs or forecasts, and they tend to overestimate their abilities. Such
overconfidence may be responsible for the prevalence of active versus passive investment
management itself an anomaly to adherents of the efficient market hypothesis.
Overconfidence leads investors to overestimate their predictive skills and believe that
they can time the market. Studies have shown that one side effect of investor
overconfidence is excessive trading (Evans, 2006; Allen and Evans, 2005). People are
overconfident in their own abilities, and investors and analysts are particularly
overconfident in areas where they have some knowledge (Shiller, 1998; Evans, 2006).
There is evidence (Evans, 2006) that financial analysts are slow to revise their previous

26
assessment of a company‟s likely future performance, even when there is strong evidence
that their existing assessment is incorrect.
2.2.6 Prospect Theory
This theory was developed by Kahneman & Tversky in 1979. It focuses on changes in
wealth, whereas expected utility theory focuses on level of wealth (Ritter, 2003). The
theory describes how people frame and value decisions involving uncertainty by looking
at choices in terms of potential gains or losses in relation to a specific reference point
which is often the purchase price. Kahneman & Tversky (1979) argue that investors value
gains/losses according to an S-shaped utility function.
Kahneman & Tversky asserted that people are risk lovers for losses (Johnson et al. 2002).
The utility function is concave for gains meaning that people feel good when they gain,
but twice the gain does not make them feel twice as good is convex for loss meaning that
people experience pain when they lose, but twice the loss does not mean twice the pain.
2.3 Factors that influence Individual Investor Choices
The factors that influence individual investor choices are behavioural factors which
include: Overconfidence, regret avoidance, loss aversion and herding behavior and other
factors such as market factors, market efficiency and market information.
2.3.1 Behavioral Factors
The behavioral factors that influence individual investor choices include:
Overconfidence, regret avoidance, loss aversion and herding behavior.
Odean 1998, explores that many investors trade too much due to their overconfidence.
These investors totally rely on the information quality of the market or stocks that they

27
have when making decisions of investment. Waweru et al. 2008, indicate that price
change of stocks has impact on their investment behavior at some level and also that
investors may revise incorrectly estimates of stock returns to deal with the price changes
so that this affects their investment decision-making. Odean 1999, states that investors
prefer buying to selling stocks that experience higher price changes during the past two
years. Change in stock price in this context can be considered as an attention-grabbing
occurrence in the market by investors.
Many investors tend to focus on popular stocks or hot stocks in the market and that past
trends of stocks are also explored to impact the decision making behavior of the investors
at a certain level by. In this concept, investors usually analyze the past trends of stocks by
technical analysis methods before deciding an investment. Behavioral investors prefer
selling their past winners to postpone the regret related to a loss that they can meet for
their stock trading decisions (Waweru et al., 2008).
Aduda et al. (2012) found out that, influence from friends; where most investors relied on
advice from friends and colleagues (3.65 on a likert scale of 1-5) before deciding to go
for stocks and; popular opinion about the market (3.58) and recent trend in share price
movements (3.53), were clear indication of herding behavior existing in NSE.
Additionally, Caparrelli et al. 2004, propose that investors are impacted by herding effect
and tend to move in the same flow with the others when price changes happen. Nagy &
Obenberger (1994) examined factors influencing investor behavior. They developed a

28
questionnaire that included 34 questions. Their findings suggested that classical wealth –
maximization criteria are important to investors, even though investors employ diverse
criteria when choosing stocks while important concerns such as local or international
operations, environmental track record and the firm‟s ethical posture appear to be given
less consideration. The recommendations of brokerage houses, individual stockbrokers,
family members and co-workers go largely unheeded. Many individual investors discount
the benefits of valuation models when evaluating stocks.
2.3.2 Market Factors
DeBondt & Thaler (1995), state that financial markets can be affected by investors‟
behaviors in the way of behavioral finance. If the perspectives of behavioral finance are
correct, it is believed that the investors may have over- or under-reaction to price changes
or news; extrapolation of past trends into the future; a lack of attention to fundamentals
underlying a stock; the focus on popular stocks and seasonal price cycles. These market
factors, in turn influence the decision making of investors in the stock market.
Waweru et al.(2008), identifies the factors of market that have impact on investors‟
decision making: Price changes, market information, past trends of stocks, customer
preference, over-reaction to price changes, and fundamentals of underlying stocks.
Market factors are external factors influencing investors‟ behaviors. However, the market
factors influence the behavioral investors and rational investors in different ways, so that
it is not adequate if market factors are not listed when considering the behavioral factors
impacting the investment decisions.

29
He further, indicates that price changes of stocks have an impact on their investment
behavior at some level. Odean 1999, states that investors prefer buying to selling stocks
that experience higher price changes during the past two years. Change in stock price can
be considered as an attention-grabbing occurrence in the market by investors.
2.3.3 Market Efficiency
Market efficiency (Luu, 2012), in the sense that market prices reflect fundamental market
characteristic and that excess returns on the average which are leveled out in the long run,
have been challenged by behavior finance. In the past few years there has, for example,
been a media interest in technology stocks. Most of the time, there has been a positive
bias in media assessment, which might have led investors in making incorrect investment
decisions. These anomalies suggest that the underlying principles of rational behavior
underlying the efficient market hypothesis are not entirely correct and that we need to
look, as well, at other models of human behavior, as have been studies in other social
sciences (Shiller, 1998).
2.3.4 Market Information
Normally, changes in market information, fundamentals of the underlying stock and
stock price can cause over/under-reaction to the price change. These changes are
empirically proved to have the high influence on decision-making behavior of investors.
Researchers convince that over-reaction (DeBondt & Thaler, 1985) or under-reaction
(Lai, 2001) to news may result in different trading strategies by investors and hence
influence their investment decisions.

30
Waweru et al. 2008, conclude that market information has very high impact on making
decision of investors and this makes the investors, in some way, tend to focus on popular
stocks and other attention-grabbing events that are relied on the stock market
information. Moreover, Barber and Odean 2000, emphasize that investors are impacted
by events in the stock market which grab their attention, even when they do not know if
these events can result good future investment performance.
Many investors tend to focus on popular stocks or hot stocks in the market and that past
trends of stocks are also explored to impact the decision making behavior of the investors
at a certain level. (Waweru et al.,2008).Odean1999, propose that investors usually choose
the stocks that attract their attention. Besides, the stock selection also depends on the
investors‟ preferences. Momentum investors may prefer stocks that have good recent
performance while rational investors tend to sell the past losers and this may help them to
postpone taxes. In contrast, behavioral investors prefer selling their past winners to
postpone the regret related to a loss that they can meet for their stock trading decisions.
2.4. Empirical Review
This section highlights the various types of behavioral biases that influence investor
decisions based on previous research concerning behavioral finance and investment
decisions. Theoretical and empirical reviews are done leading to review of the theories
that explain the concept of behavioral finance.
2.4.1 International Evidence
Empirical tests on the behavior of individual investors have been done predominately on
U.S. individual investor portfolios. In a study of market efficiency, DeBondt & Thaler

31
(1985) investigated whether such behavior affects stock prices. They used monthly return
data for New York Stock Exchange (NYSE) common stocks, as compiled by the Center
for Research in Security Prices (CRSP) of the University of Chicago, for the period
between January 1926 and December 1982. An equally weighted arithmetic average rate
of return on all CRSP listed securities serve as the market index.
The results are consistent with the overreaction hypothesis. Loser portfolios of 35 stocks
outperform the market by, on average, 19.6%, 36 months after portfolio formation.
Winner portfolios, on the other hand, earn about 5% less than the market, so that the
difference in cumulative average residual between the extreme portfolios equals 24.6%.
Their findings have other notable aspects. First, the overreaction effect is asymmetric; it
is much larger for losers than for winners. Secondly, most of the excess returns are
realized in January. Finally the overreaction phenomenon mostly occurs during the
second and third year of the test period.
Odean (1998) tested the disposition effect, the tendency of investors to hold losing
investments too long and sell winning investments too soon, by analyzing trading records
for 10,000 active accounts at a large nationwide discount brokerage house from 1987
through 1993. There were two hypotheses to be tested. The first was that investors tend to
sell their winners and hold their losers. The second hypothesis was that in December
investors are more willing to sell losers and less willing to sell winners than during the
rest of the year. The statistical method used is the t-test. These investors demonstrated a
strong preference for realizing winners rather than losers. Their behavior did not appear

32
to be motivated by a desire to rebalance portfolios, or to avoid the higher trading costs of
low priced stocks. Nor was it justified by subsequent portfolio performance. For taxable
investments, it is suboptimal and leads to lower after-tax returns. Tax-motivated selling is
most evident in December.
A study by Lin (2011) titled „Elucidating rational investment decisions and behavioral
biases: Evidence from the Taiwanese Stock Market‟, examined how rational decision
making and behavioral biases varies in different demographic characteristics. He
examined how personal characteristics influenced behavioral biases. He used a sample of
450 individual investors from the Taiwan Stock Market. Primary data was collected
through questionnaires. Cross section analysis was used via structure equation modeling.
He found out that gender explains the difference in behavioral biases. Females display a
greater disposition effect than males. Males are more overconfident than the females.
Females are most affected by herding as they tend to follow blindly other investors doing
the same investment decisions. The results further revealed that younger investors are
more prone to herding than the older investors. There is no significant evidence between
the level of income and behavioral biases.
A study by Obamuyi (2013) showed that the five most influencing factors on investors‟
investment decision in the Nigerian capital market in order of importance were: past
performance of the company stock, expected stock split/capital increases/bonus, dividend
policy, expected corporate earnings and get-rich-quickly. The results indicated that the
five most important factors are usually categorized as wealth maximizing criteria. The

33
finding is consistent with the works of Nagy & Obenberger (1994)). On the other hand,
the five least influencing factors include: religions, rumors, loyalty to the company‟s
products or services, opinions of members of the family) and expected losses in other
investments.
2.4.2 Local Evidence
Werah (2006) did a study to survey the influence of behavioral biases on investor
activities at the NSE. The study population composed of both individual and institutional
investors at the NSE. Data was collected through questionnaire and analysis was done to
establish the influence of herd behavior, mental accounting, loss aversion, anchoring,
over reaction and under reaction, overconfidence, confirmation bias, regret aversion on
investor activities at the NSE. The results obtained from the research suggested that the
behavior of investors at the NSE were to some extent irrational when considered from the
rationality of the investors in their disregard of fundamental estimations as a result of
herd behavior, regret aversion, overconfidence and anchoring.
Mbaluka (2008) study established the existence of behavioral effects on individual
investment decision making process. His results showed that investors had their
rationality affected by psychological aspects. The study found out that investors did not
invest as expected as they showed unwillingness to change their portfolio despite
unattractive macroeconomic outlook. The endowment effect was identified with investors
in the experiment with 23% of them changing their portfolio mix while 77% failed to
change even when the economic outlook demanded that change.

34
Aduda et al.(2012) while conducting their study on “the behavior and financial
performance of individual investors in the trading shares of companies listed at the
Nairobi Stock Exchange, Kenya” with the first objective of their study being „to find out
how individual investors make their investment decisions‟, found out that, influence from
friends; where most investors relied on advice from friends and colleagues (3.65 on a
likert scale of 1-5) before deciding to go for stocks and; popular opinion about the market
(3.58) and from recent trend in share price movements (3.53), were clear indication of
herding behavior existing in NSE. There were varied behaviors and financial
performance of individual investors in Kenya with some investors exhibiting rational
behavior while making investment decisions.
Mwaka (2013) showed that demographic characteristics of investors determine the
investors‟ decision making behavior. Investors of different demographic characteristics
made decisions differently. Some investors made decisions rationally but most of them
were affected by behavioral biases. The biases tested include herding, over confidence,
anchoring and loss aversion. All these biases affected investors as they traded in shares
though others were more prominent than others.
2.5 Summary of Literature Review
The literature has reviewed both cognitive errors and emotional biases that potentially
influence individual investor decisions. It has discussed biases such as representativeness
bias, cognitive dissonance, loss aversion, regret avoidance, overconfidence and mental
accounting biases which show that investors are rational when making investment
decisions and therefore regret when it is too late and further contradict the basic

35
assumptions of standard finance theories which are concerned with what the market will
value at. They do not consider individual behavior. It is argued that some financial
phenomena can be better explained using models where it is recognized that some
investors are not fully rational.
Empirical evidence instead, does not extensively support these. There exists contradictory
literature which suggests that investors are not immune from the effects of the popular
investing culture. There were varied behaviors on financial performance of individual
investors with some investors exhibiting rational behavior in their disregard of
fundamental estimations and some irrational to some extent when considered from the
rationality of others. Studies have shown that both individuals and institutional investors
are affected by emotions and cognitive influences when making investment decisions but
not to the extent of showing all the factors and how they affect investment decisions.
These are the gaps which this research will attempt to fill.

36
CHAPTER THREE
RESEARCH METHODOLOGY
3.1 Introduction
This chapter describes the methodology that will be used in the study. It forms a
framework for specifying the relationships among the study variables. The chapter covers
various aspects of the target population, sampling techniques, and data collection
procedure and data analysis.
3.2 Research Design
Research design is the plan and structure of investigation so conceived as to obtain
answers to research questions. The plan is the overall scheme or program of the research.
According to Cooper & Schinder (2001), there are many definitions of research design
but no one definition impacts the full range of important aspects.
Descriptive survey design was used. It describes the characteristics of the variables of
interest. Descriptive research according to Mugenda & Mugenda (1999) is a process of
collecting data in order to answer questions concerning the status of the subjects in the
study. This type of research attempts to describe things such as possible behavior,
attitudes, values and characteristics. This design is appropriate for this study because it
ensures in-depth analysis and description of the various phenomena under investigation
and it establishes how the decision making framework and behavior of investors in reality
is consistent with the existing theories of finance.
3.3 Population
The study involved surveying individual investors who trade at the Nairobi Securities
Exchange. There are about 1,315,616 investors at the NSE as at 30.06.2014 with

37
1,254,696 being the total number of individual investors. This represents 95.4% of the
total investors, Capital Markets Authority (CMA) Quarterly Statistical Bulletin (2014).
3.4 Sample
Out of the investors trading at the Nairobi Securities Exchange, a sample of 63 individual
investors was chosen using random sampling technique to represent all the individual
investors‟ in the country. The sample was selected from each of the twenty one registered
stock brokerage and investment banks with three investors selected from each. This is a
result of the large number of investors trading, limitations of time to facilitate faster
collection and analysis of data, financial constraints to reduce the research costs as it is
reduced to a smaller manageable sample which is handled easily and limited human
resource in undertaking the study. The sample will be obtained by presenting 3
questionnaires each to 21 identified stock brokerage firms. This sample is considered
appropriate as the availability of investors is usually to be high. The study adopted a
probability sampling technique whereby sampling technique is used to randomly select 3
respondents from each of the 21 brokerage firms. A respondent was selected after every
three customers being served in a brokerage firm in a given day.
3.5 Data Collection
Primary data was collected using an exploratory survey method where a standard
questionnaire with both closed and open ended questions were administered to capture
important information. The selected individuals were given the questionnaire to fill where
those with any difficulties were guided and assisted and thereafter the questionnaires
were collected. The questionnaire will incorporate three sections with the first section
enquiring respondent‟s background information, the second part consisting of factors that
attribute to investors making certain decisions and the behavioral factors influencing

38
investment decisions and the third part consisting of individual investor choices. A 5-
point likert scale, widely used for asking respondents‟ opinions and attitudes was utilized
to ask the individual investors to evaluate the degrees of their agreement with the impacts
of behavioral factors on their investment decision. The 5 points in the scale are
respectively from 1 to 5: highly disagree, somehow disagree, agree, somehow agree and
highly agree.
3.5.1 Data Reliability and Validity
According to Neuman & Kreuger (2003), “Reliability and validity are central issues in all
measurements. Reliability means dependability or consistency, and validity means
truthfulness. It refers to the bridge between the construct and the data (Neuman &
Kreuger 2003).When an interview is conceived as an opportunity for construction of
meaning, one “cannot expect a replication of answers because they emerge from different
circumstances of production” (Holstein & Gubrun, 1995). Thus, the trustworthiness of
the data can only be evaluated by the participants themselves.
Cronbach‟s Alpha Test was used to test the internal consistency reliability of
measurements, which are in formats of continuous variables (for example, 5-point Likert
measurements). It includes a statistical summary that describes the consistency of a
specific sample of respondents across a set of questions or variables that will help to
estimate the reliability of participants‟ responses to the measurements (Helms et al,
2006). Cronbach‟s alpha is usually used as an indicator of reliability (Liu, Wu & Zumbo,
2010). As such, the Cronbach‟s alpha is suitable for this research because the

39
questionnaire consists of 5-point Likert measurements and the research is in behavioral
finance.
Nunnally (1978) suggests that Cronbach‟s alpha should be at least 0.7 to make sure that
the measurements are reliable. However, many statisticians believe that it can be
acceptable if the Cronbach‟s alpha is over 0.6 and recommend that it is necessary to
consider the corrected item-total correlations when using the Cronbach‟s alpha index.
Measurement validity deals with the question of whether a measure can actually provide
measurements of a concept (Bryman & Bell, 2011). As the questionnaire is designed
based on the theoretical models from previous studies, indicators for measurements are
applied to reflect the concept of “behavioral factors influencing investors‟ decisions”.
Besides, the 5-point Likert measurements removing the neutral opinions, they also
increase the measurements‟ accuracy, measurement validity is obtained throughout this
study.
3.6 Data Analysis
Data was analyzed using the statistical package for social sciences SPSS software
package. Content analysis was used in summarizing the finding. The data was coded to
enable the responses to be grouped into various categories. Internal consistency of the
multi-item scales was tested using Cronbach‟s alpha. Factor analysis was used to test the
reliability of the items in the multi-item scales. Descriptive statistics was used to
summarize the data. This includes percentages and frequencies. Tables and figures were
used to present the data.

40
3.6.1 Analytical Model
The study will adopt linear regression model to explain the relationship between
behavioral biases and individual investor decisions using multiple regression model given
by Ghauri& Gronhaug (2005) as follows:
IID =β1HEB+β2LAB + β3RAB + β4MAB +β5PCB+β6MIB + β7PSB +β8OCB
β9ANB + i
Where:
Yi = Dependent variable is the individual investor decision and was measured by the interval
level of measurement since it was computed .Scores were got from the likert scale for each
behavioral factor.
Β1....βn = βetas for each behavioral factor.
X1…Xn = Predictors are the behavioral factors which influence investor choices. They were
measured by the ordinal level of measurement whereby the respondent indicated the
preference number from 1 to 5 in line with their opinion so as to measure the impact levels
for each factor using a likert scale.
= Error term with a significance level of 5%.

41
Where:
IID = Individual Investor Decision
HEB= Herding Bias
LAB = Loss Aversion Bias
RAB = Regret-Avoidance Bias
MAB= Mental Accounting Bias
PCB= Price Changes Bias
MIB= Market Information Bias
PSB= Past trends of Stocks
OCB = Overconfidence Bias
ANB=Anchoring Bias
The variables were measured using a 5-point likert scale to evaluate the degrees of the
respondents‟ agreement with the impacts of behavioral factors on their investment
decisions. The 5 points in the scale are respectively from 1 to 5: highly disagree,
somehow disagree, agree, somehow agree, and highly agree.
The dependent variable was measured by asking the respondent to assign a weight on
reason(s) why their investment decision is based on that behavioral factor.
3.7 Test of Significance
The Analysis of Variance (ANOVA) was used which contains the sum of squares SS, the
mean square MS, the F-statistic and the degrees of freedom df. All these were analyzed
after data had been collected.

42
CHAPTER FOUR
DATA ANALYSIS, RESULTS AND DISCUSSION
4.1 Introduction
This chapter covers data presentation and analysis. The main objective of the study was
to determine the effect of behavioral factors on individual investor choices at the Nairobi
Securities Exchange. In order to simplify the discussions, the researcher provided tables
and figures that summarize the collective reactions and views of the respondents.
4.2 Descriptive Statistics
This section shows demographic information for gender, age, marital status, level of
education and average monthly income for the respondents as well as the response rate. It
also shows the mean and standard deviation of the behavioural factors in relation to
investors‟ decisions.
4.2.1 Response Rate
The targeted sample size was 63 investors. Those filled and returned questionnaires were
59 respondents making a response rate of 93.65 %. According to Mugenda and Mugenda
(1999), a response rate of 50% is adequate for analysis and reporting; a rate of 60% is
good and a response rate of 70% and over is excellent. This means that the response rate
for this study was excellent and therefore enough for data analysis and interpretation.

43
Figure 4.1: Response rate
Source: Research Findings
4.2.2 Data Validity
To establish validity, the research instrument was used to evaluate the relevance of each
item in the instrument in relation to the objectives. The same were rated on the scale of 1
(very relevant) to 4 (not very relevant). Validity was determined by use of content
validity index (CVI). CVI was obtained by adding up the items rated 3 and 4 by the
experts and dividing this sum by the total number of items in the questionnaire. A CVI of
0.747 was obtained. Since, the alpha coefficients were all greater than 0.7, a conclusion
was drawn that the instruments had an acceptable reliability coefficient and were
appropriate for the study.

44
Table 4.1: Reliability Results
Variable Cronbach’s Alpha Items
Individual Investor Decision .79 6
Herding Bias .77 15
Loss Aversion Bias .78 3
Regret-Avoidance Bias .77 3
Mental Accounting Bias .76 4
Price Changes Bias .77 2
Market Information Bias .73 5
Past trends of Stocks .71 7
Overconfidence Bias .79 9
Anchoring Bias .75 5
Source: Research Findings
4.2.3 Gender of Respondents
The table displays demographic information according to gender.
Table 4.2: Gender of the respondents
Frequency Percentage
Male 39 66.10
Female 20 33.90
Total 59 100.0
Source: Research Findings
The study found it important to determine the respondents‟ gender in order to ascertain
whether there was gender parity in the positions indicated by the respondents. It was
evident in the analysis that majority of the respondents were male which represented
66.10% while 33.90% were female. It can therefore be deduced that male investors were
the most dominant gender at the Nairobi Securities Exchange.

45
4.2.4 Age Bracket of the Respondents
The researcher sought to determine if the respondents were old enough to provide
valuable responses that pertain to the effects of behavioral factors on individual investor
choice at the Nairobi securities exchange.
Table 4.3: Age Bracket of the Respondents
Frequency Percentage
Less than 30 years 7 11.86
31-40 years 17 28.81
41-50 years 22 37.29
More than 50 years 13 22.03
Total 59 100.0
Source: Research Findings
The study findings showed that majority (37.29%) indicated that their age bracket was
between 41 and 50 years. Analysis of findings also indicated that 28.81% of the
respondents were between the age of 31 and 40 years of age, 22.03% were more than 50
years and above while the remaining 11.86% were less than 30 years. The finding
therefore implies that the respondents were old enough to provide valuable responses that
pertain to the effects of behavioral factors on investor choice.
4.2.5 Marital Status of Respondents
The table displays demographic information according to marital status of the
respondents.
Table 4.4: Marital Status of the Respondents
Frequency Percentage
Single
Married
18
41
30.51
69.49
Total 59 100.0
Source: Research Findings

46
The study found it important to determine the respondents‟ marital status in order to
ascertain whether it affected the positions indicated by the respondents. It was evident
that majority of the respondents were married which was represented 69.49% while
30.51% were single. It can therefore be deduced that most of the investors interviewed
were married.
4.2.6 Level of Education of the Respondents
The table shows the respondents level of education.
Table 4.5: Level of education of the respondents
Frequency Percentage
Primary Certificate 0 0.0
Secondary Certificate 1 1.69
Other college education 5 8.47
Diploma 12 20.34
Degree certificate 22 37.29
Postgraduate/PhD 19 32.20
Total 59 100.0
Source: Research Findings
The study sought to find out the respondents level of education. From the findings,
majority (37.29%) had degrees certificates followed by 32.20% who indicated that they
had Postgraduate/PhD, 20.34% had diplomas, 8.47% had attained other college education
and the remaining 1.69% indicated that they had attained secondary certificate. Therefore
the findings conclude that most respondents had adequate education to execute their
pertaining to behavioral factors affecting individual investor choice.
4.2.7 Average Monthly Income of the respondents
The table shows the respondents monthly income.

47
Table 4.6: Average monthly income of the respondents
Frequency Percentage
Less than 5,000 0 0.0
5,001 – 20,000 3 5.08
20,001-50,000 5 8.47
50,001-100,000 7 11.86
100,001-200,000 11 18.64
More than 200,000 32 54.24
Total 59 100.0
Source: Research Findings
The study sought to find out the average monthly income of the respondents. From the
findings, majority (54.24%) of the respondents indicated that they get an income of more
than 200,000 Kenya shillings followed by 18.64% who get an income of 100,001-
200,000 Kenya shillings, 11.86% get an income of 50,001 – 100,000 Kenya shillings,
8.47% get an income of between 20,001-50,000 Kenya shilling and 5.08% get an income
of between 5,001 – 20,000.
4.2.8 Behavioral Factors Influencing Investment Decisions
The researcher wanted to find out the behavioral factors influencing investment decisions
Table 4.7: Behavioral Factors Influencing Investment Decisions
Herding Factors (buying and selling, choice and volume
of trading stocks, speed of herding)
Mean Std. deviation
Other investors' decisions of choosing stock types have
impact on my investment decisions.
4.51 1.027
Other investors' decisions of the stock volume have
impact on my investment decisions.
3.78 0.734
Other investors' decisions of buying and selling stocks
have impact on my investment decisions.
4.13 0.597
I usually react quickly to the changes of other investors'
decisions and follow their reactions to the stock market.
3.94 0.802
After a prior loss, I become more risk averse. 4.51 1.023
I avoid selling shares that have decreased in value and
readily sell shares that have increased in value.
4.18 0.724
I tend to treat each element of my investment portfolio 3.53 0.591
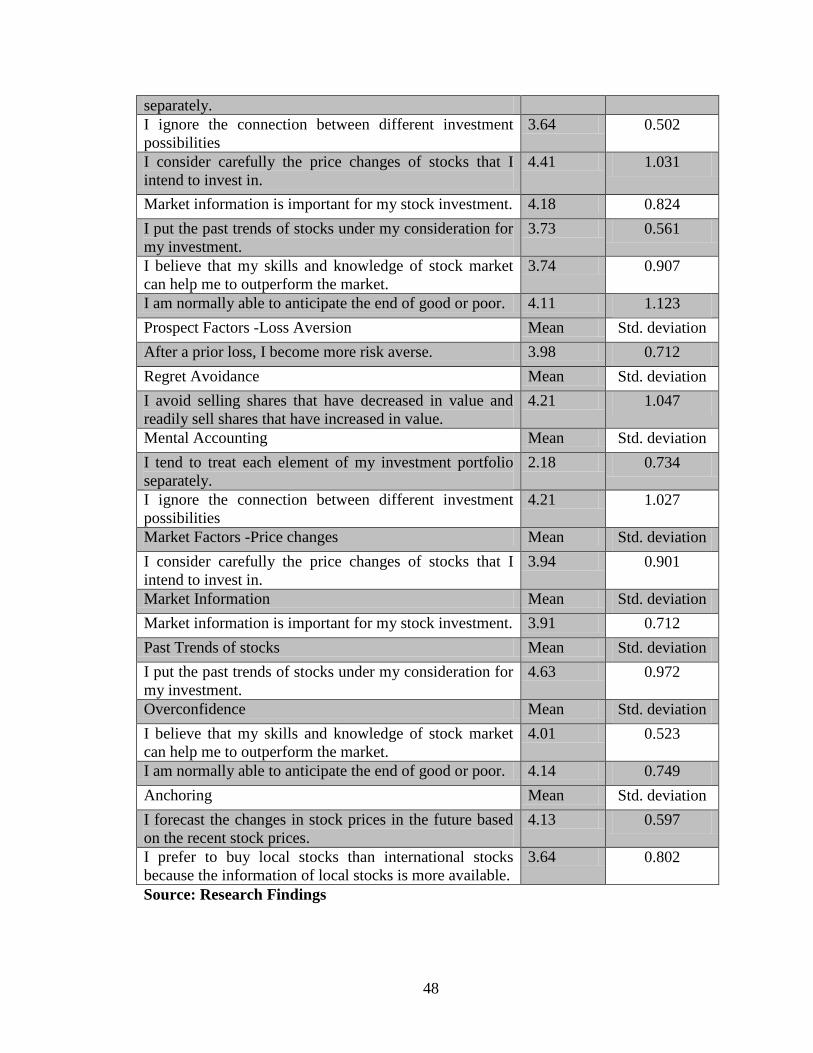
48
separately.
I ignore the connection between different investment
possibilities
3.64 0.502
I consider carefully the price changes of stocks that I
intend to invest in.
4.41 1.031
Market information is important for my stock investment. 4.18 0.824
I put the past trends of stocks under my consideration for
my investment.
3.73 0.561
I believe that my skills and knowledge of stock market
can help me to outperform the market.
3.74 0.907
I am normally able to anticipate the end of good or poor. 4.11 1.123
Prospect Factors -Loss Aversion Mean Std. deviation
After a prior loss, I become more risk averse. 3.98 0.712
Regret Avoidance Mean Std. deviation
I avoid selling shares that have decreased in value and
readily sell shares that have increased in value.
4.21 1.047
Mental Accounting Mean Std. deviation
I tend to treat each element of my investment portfolio
separately.
2.18 0.734
I ignore the connection between different investment
possibilities
4.21 1.027
Market Factors -Price changes Mean Std. deviation
I consider carefully the price changes of stocks that I
intend to invest in.
3.94 0.901
Market Information Mean Std. deviation
Market information is important for my stock investment. 3.91 0.712
Past Trends of stocks Mean Std. deviation
I put the past trends of stocks under my consideration for
my investment.
4.63 0.972
Overconfidence Mean Std. deviation
I believe that my skills and knowledge of stock market
can help me to outperform the market.
4.01 0.523
I am normally able to anticipate the end of good or poor. 4.14 0.749
Anchoring Mean Std. deviation
I forecast the changes in stock prices in the future based
on the recent stock prices.
4.13 0.597
I prefer to buy local stocks than international stocks
because the information of local stocks is more available.
3.64 0.802
Source: Research Findings

49
4.2.9 Individual Investor Choices
Estimate of the last number of shares bought (KSHS)
The table shows the estimates of the last number of shares bought by the respondents.
Table 4.8: Estimate of the last number of shares bought (KSHS)
Frequency Percentage
Less than 5,000 3 5.08
5,001 – 20,000 8 13.56
20,001-50,000 5 8.47
50,001-100,000 7 11.86
100,001-200,000 9 15.25
More than 200,000 27 45.76
Total 59 100.0
Source: Research Findings
The study sought to find out the estimates of the last number of shares bought by the
respondents. The findings of the study are tabulated as in table above. From the findings,
majority (45.76%) of the respondents indicated that they bought shares worth more than
200,000 Kenya shillings followed by 15.25% who indicated that they bought shares
worth between 100,001-200,000 Kenya shillings, 13.56% of the respondents indicated
that they bought shares worth 5,001 – 20,000 Kenya shillings, 11.86% indicated that they
had bought share worth between 50,001-100,000 Kenya shilling, 8.47% of the
respondents indicated that they bought shares worth between 20,001-50,000 Kenya
shillings and the remaining 5.08% indicated that they bought shares worth less than 5,000
Kenya shillings.
4.2.10 Duration of Trading in Shares
The researcher sought to find out for how long the respondents have been trading in
shares before.

50
Table 4.9: Duration of trading in shares
Frequency Percentage
Less than 1 year 7 11.86
1 to 3 years 9 15.25
4 to 5 years 11 18.64
6 to 10 years 10 16.95
More than 10 years 22 37.29
Total 59 100.0
Source: Research Findings
The study finding indicate that majority (37.29%) had traded in shares for more than 10
years followed by 16.95% who indicated that they had traded in shares for the 6-10 years,
18.64% who indicated that they had traded in shares for the last 4 to 5 years, 15.25% of
the respondents indicated that they had traded in shares for the last 1 to 3 years, and lastly
11.86% who indicated that they had traded in shares for the last less than a year. most of
the respondents further indicated that they have sold only part of their shares.
4.2.11 Duration of Participation in the Stock Market
The researcher sought to find out for how long the respondents have participated in the
stock market.
Table 4.10: Duration of participation in the stock market
Frequency Percentage
Less than 1 year 13 22.03
1 to 3 years 4 6.78
3 to 5 years 15 25.42
5 to 10 years 13 22.03
More than 10 years 14 23.73
Total 59 100.0
Source: Research Findings
The study finding indicate that majority (25.42%) had been participating in the stock
market for between 3-5 years followed by 23.73% who indicated that they had been
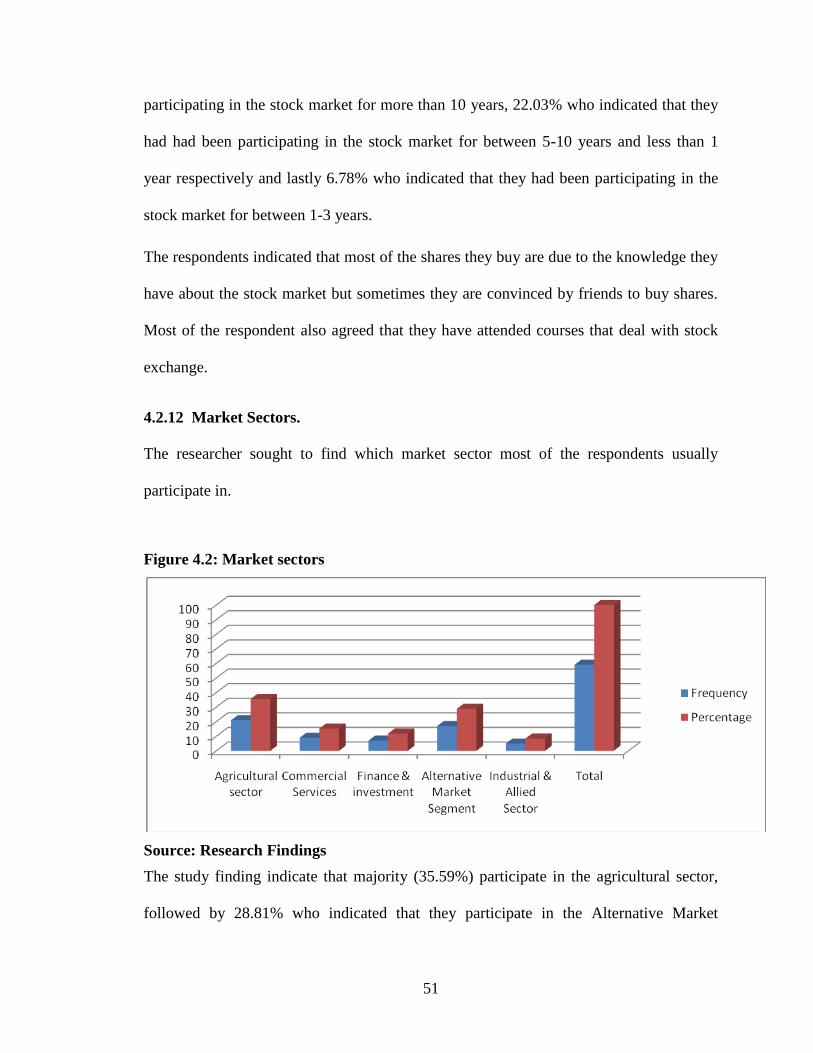
51
participating in the stock market for more than 10 years, 22.03% who indicated that they
had had been participating in the stock market for between 5-10 years and less than 1
year respectively and lastly 6.78% who indicated that they had been participating in the
stock market for between 1-3 years.
The respondents indicated that most of the shares they buy are due to the knowledge they
have about the stock market but sometimes they are convinced by friends to buy shares.
Most of the respondent also agreed that they have attended courses that deal with stock
exchange.
4.2.12 Market Sectors.
The researcher sought to find which market sector most of the respondents usually
participate in.
Figure 4.2: Market sectors
Source: Research Findings
The study finding indicate that majority (35.59%) participate in the agricultural sector,
followed by 28.81% who indicated that they participate in the Alternative Market

52
Segment, 15.25% indicated that they participate in commercial sector, 11.86% of the
respondent indicated that they perform in the Finance & investment sector and lastly
8.47% who indicated that they participate in the Industrial & Allied Sector. Therefore it
was deduced that the agricultural sector has more investors. Most of the investors also
indicated that they are long term capital investors.
4.3 Inferential Statistics
This section presents a discussion of the results of inferential statistics. Correlation
analysis was used measure the strength of the relationship between the independent
variables that is the relationship between Individual Investor Decision, Herding Bias,
Loss Aversion Bias, Regret-Avoidance Bias, Mental Accounting Bias, Price Changes
Bias, Market Information Bias, Past trends of Stocks, Overconfidence Bias and
Anchoring Bias. Regression analysis established the relative significance of each of the
variables on investor choices.
4.3.1 Correlation Analysis
The Pearson product-moment correlation coefficient (or Pearson correlation coefficient
for short) is a measure of the strength of a linear association between two variables and is
denoted by r. The Pearson correlation coefficient, r, can take a range of values from +1 to
-1. A value of 0 indicates that there is no association between the two variables. A value
greater than 0 indicates a positive association, that is, as the value of one variable
increases so does the value of the other variable. A value less than 0 indicates a negative
association, that is, as the value of one variable increases the value of the other variable
decreases.
4.3.2 Correlation Coefficients
The table 4.11 below shows the correlation coefficient matrix of the predictor variables.

53
Table 4.11: Correlation coefficient
Indiv
idual
Inves
tor
Dec
isio
n
Her
din
g
Bia
s
Loss
Aver
sion
Bia
s R
egre
t-
Avoid
ance
Bia
s
Men
tal
Acc
ounti
ng
Bia
s P
rice
Chan
ges
Bia
s
Mar
ket
Info
rmat
ion
Bia
s P
ast
tren
ds
of
Sto
cks
Over
con
fid
ence
Bia
s
Anch
ori
ng
Bia
s
Individual
Investor
Decision
1
Herding
Bias
0.8345 1
Loss
Aversion
Bias
0.8507 0.8679 1
Regret-
Avoidanc
e Bias
0.7619 0.8163 0.756
8
1
Mental
Accounti
ng Bias
0.57
17
0.6231 0.874
7
0.8191 1
Price
Changes
Bias
0.6710 0.7919 0.674
2
0.8365 0.67
14
1
Market
Informati
on Bias
0.7715 0.6615 0.774
5
0.7271 0.87
21
0.6912 1
Past
trends of
Stocks
0.8712 0.7929 0.874
1
0.8512 0.93
13
0.7915 0.8
74
1
Overconfi
dence
Bias
0.7713 0.5721 0.774
9
0.9723 0.71
35
0.6615 0.9
12
0.85
6
1
Anchorin
g Bias
0.6711 0.6915 0.974
2
0.6934 0.56
18
0.7814 0.7
74
0.65
1
0.6915 1
Source: Research Findings
The study in table 4.11 shows that all the predictor variables were shown to have a strong
positive association between them and Individual Investor Decision at a significant level
of 0.05 and hence included in the analysis.

54
4.3.3 Regression Analysis
Analysis in the table 4.12 below shows that the coefficient of determination (the
percentage variation in the dependent variable being explained by the changes in the
independent variables) R2 equals 0.843, that is, Loss Aversion Bias, Regret-Avoidance
Bias, Mental Accounting Bias, Price Changes Bias, Market Information Bias, Past trends
of Stocks, Overconfidence Bias and Anchoring Bias explains 84.3% of observed change
in individual investor decision. The P- value of 0.000 (Less than 0.05) implies that the
regression model is significant at the 95% significance level.
Table 4.12: Model Summary
Model R
R
Square
Adjusted
R Square
Std. Error
of the
Estimate
Change Statistics
R
Square
Change
F
Change df1 df2
Sig. F
Change
1 .918(a) .843 .805 .51038 .843 1.242 4 96 .000
Source: Research Findings
Predictors:(Constant), Herding Bias, Loss Aversion Bias, Regret-Avoidance Bias,
Mental Accounting Bias, Price Changes Bias, Market Information Bias, Past trends of
Stocks, Overconfidence Bias and Anchoring Bias
Dependent Variable: individual investor decision
4.3.4 Analysis of Variance (ANOVA)
The researcher sought to compare means using analysis of variance.

55
Table 4.13: Analysis of Variance (ANOVA)
Sum of
Squares df Mean Square F Sig.
Regression .852 4 .213 1.242 .000
Residual 20.35 119 .171
Total 22.64 123
Source: Research Findings
Predictors: (Constant), Herding Bias, Loss Aversion Bias, Regret-Avoidance Bias,
Mental Accounting Bias, Price Changes Bias, Market Information Bias, Past trends of
Stocks, Overconfidence Bias and Anchoring Bias
Dependent Variable: Individual Investor Decision
ANOVA findings (P- value of 0.00) in table 4.13 show that there is correlation between
the predictors‟ variables (Herding Bias, Loss Aversion Bias, Regret-Avoidance Bias,
Mental Accounting Bias, Price Changes Bias, Market Information Bias, Past trends of
Stocks, Overconfidence Bias and Anchoring Bias) and response variable (individual
investor decision).
The table shows the results of the regression coefficients required to form the multiple
regression model.
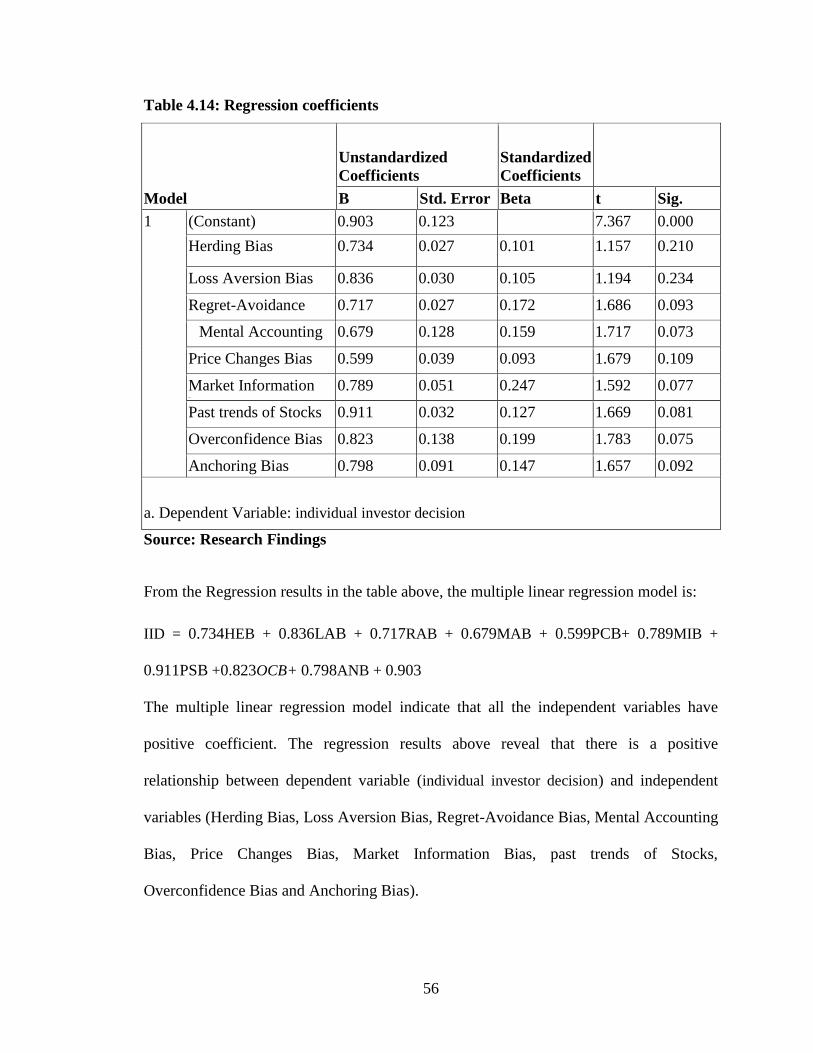
56
Table 4.14: Regression coefficients
Model
Unstandardized
Coefficients
Standardized
Coefficients
B Std. Error Beta t Sig.
1 (Constant) 0.903 0.123 7.367 0.000
Herding Bias 0.734 0.027 0.101 1.157 0.210
Loss Aversion Bias 0.836 0.030 0.105 1.194 0.234
Regret-Avoidance
Bias
0.717 0.027 0.172 1.686 0.093
Mental Accounting
Bias
0.679 0.128 0.159 1.717 0.073
Price Changes Bias 0.599 0.039 0.093 1.679 0.109
Market Information
bias
0.789 0.051 0.247 1.592 0.077
Past trends of Stocks 0.911 0.032 0.127 1.669 0.081
Overconfidence Bias 0.823 0.138 0.199 1.783 0.075
Anchoring Bias 0.798 0.091 0.147 1.657 0.092
a. Dependent Variable: individual investor decision
Source: Research Findings
From the Regression results in the table above, the multiple linear regression model is:
IID = 0.734HEB + 0.836LAB + 0.717RAB + 0.679MAB + 0.599PCB+ 0.789MIB +
0.911PSB +0.823OCB+ 0.798ANB + 0.903
The multiple linear regression model indicate that all the independent variables have
positive coefficient. The regression results above reveal that there is a positive
relationship between dependent variable (individual investor decision) and independent
variables (Herding Bias, Loss Aversion Bias, Regret-Avoidance Bias, Mental Accounting
Bias, Price Changes Bias, Market Information Bias, past trends of Stocks,
Overconfidence Bias and Anchoring Bias).

57
4.4 Interpretation of the Findings
The study finding indicated that concerning the herding factors (buying and selling,
choice and volume of trading stocks, speed of herding), the respondents strongly agreed
that other investors decisions of choosing stock types (mean of 4.51), decisions of the
stock volume (mean of 3.78) and decisions of buying and selling stocks (mean of 4.13),
have impacted on their investment decisions. On the other hand the respondents strongly
agreed that they usually react quickly to the changes of other investors decisions
following their reactions to the stock market (mean of 3.94) also, the respondents
indicated that after a prior loss they become more risk averse (mean of 4.51). They
strongly agreed that they avoid selling shares that have decreased in value and readily sell
shares that have increased in value (mean of 4.18). However they moderately agreed that
they tend to treat each element of their investment portfolio separately (3.53) and also
they ignore the connection between different investment possibilities (mean of 3.64).
Further, the respondents strongly agreed that they consider carefully the price changes of
stocks that they intend to invest in (mean of 4.41).Market information is important for
their stock investment (mean of 4.18) in that they are normally able to anticipate the end
of good or poor (mean of 4.11). Lastly the respondents agreed that they put the past
trends of stocks under their consideration for their investment (mean of 3.73) and that
they believe that their skills and knowledge of stock market can help me to outperform
the market (mean of 3.74).
Concerning prospect factors- loss aversion, the respondents strongly agreed that they
become more risk averse after a prior loss (mean of 3.98). They also strongly agreed that

58
they avoid selling shares that have decreased in value and readily sell shares that have
increased in value (mean of 4.21) this is in order to avoid regrets.
Mental accounting was also looked at and the respondents disagreed that they tend to
treat each element on their investment portfolio separately with a mean of 2.18, also
strongly agreed that they that they ignore the connection between different investment
possibilities with a mean of 4.21.
Concerning the market factors, price change and market information the respondents
strongly agreed that they consider carefully the price changes of stocks that they intend to
invest in with a mean of 3.94, also that market information is important for their stock
investment with a mean of 3.91. They also strongly agreed that they put the past trends of
stocks under their consideration for their investment with a mean of 4.63. overconfidence
in the investors was strongly agreed upon by the investors in that they believe that their
skills and knowledge of stock market can help them to outperform the market (mean of
4.01), and also that they are able to normally to anticipate the end of good or poor (mean
of 4.14).
Lastly considering anchoring, the respondents strongly agreed that they forecast the
changes in stock prices in the future based on the recent stock prices with a mean of 4.13
and they moderately agreed that they prefer to buy local stocks than international stocks
because the information of local stocks is more available with a mean of 3.64.

59
CHAPTER FIVE
SUMMARY, CONCLUSION AND RECOMMENDATIONS
5.1 Introduction
This chapter presents a summary of the research and conclusions based on the findings
and discussions in the previous chapter and from this; the study makes policy
recommendations and recommendations for further research.
5.2 Summary
Successful investing is more than choosing a particular stock; it is also how you go about
doing it. This is achieved through staying rational, choosing a few stocks that are likely to
outperform the market, being firm to hold on them during short-term market volatility,
keeping track of them and controlling excess optimism and pessimism. However, this has
not always been observed in practice. The field of behavioral finance has developed in
response to the increasing number of stock market anomalies (undervaluation or
overvaluation) that could not be explained by financial models. However, there is lack of
unanimous agreement in that behavioral finance as a concept is still open for discussion.
While research has been conducted in the secondary markets, there is little evidence of
studies on individual investor behavior with reference to the NSE. This led to the
question; which particular behavioral biases influence individual investor decisions?
Descriptive research design was adopted. The population was estimated at 1.3 million as
at 30.6.2014. The sample comprised of 63 individuals who had invested. Data was
collected using a structured questionnaire. Pearson product-moment correlation
coefficient and linear regression techniques were used for analysis. The data was
analyzed using SPSS. The findings were presented in figures and tables.

60
5.3 Conclusion
The following conclusions were made from the findings of this study:
Individual investment decisions were influenced by several biases. They showed that
herding, loss aversion, regret aversion, price changes, market information ,past trends of
stocks, overconfidence and anchoring were highly affected by their decisions with mean
of 4.51, 4.51, 4.18, 4.41,4.18,4.63,4.01and 4.13 respectively. However mental accounting
is less affected with a mean of 3.54 and 3.63.
5.4 Recommendations for Policy
The following are suggestions from the findings of the study in terms of conducting the
study and in analyzing the data.
Educating investors is important in order to overcome uncomfortable investment
outcomes caused by behavioral biases. In order to manage and balance the effect of
behavioral influences with respect to investors decision making, training programs that
create investor awareness through firms‟ websites in terms of the capacity to point out
and protect against cognitive errors and emotional biases that lead to bad investment
choices should be offered to prospective individual investors at the same level in that
information should not be hidden, misleading or given at different times for investors.
This should be done by all firms going public together with stockbrokers and investment
banks who should also direct on Annual General Meetings in a way that they are
participate and suggest ideas that will help investors grow and minimize losses as a result
of behavioral influences. They should also come up with a way of determining minimum
profits or dividends as most investors do not understand their payments.

61
Emphasis should be made on probable cognitive errors such as representativeness,
hindsight, illusion of control and availability biases and emotional biases such as regret
aversion and over optimism. Investors should carefully consider and carry out research
before making investment decisions and should not be carried away by their earlier loss
for their future investment decisions. This can restrain the good chances of investment
and negatively on the psychology of the investors and lead to unfavorable investment
performance. Investors should not put their investment portfolio into separate accounts
because each element of the portfolio is different in relation to the others and is treated as
independent which can result to unfavorable investment performance.
Apart from the individual investors who directly benefit from the findings of this study,
the securities and investment firms should use these findings as reference for their
analysis and prediction of the trends of the security market.
5.5 Limitations of the Study
This study had its limitations like any study sought to have which include:
This research was restricted by time in that a lot of time was taken in explaining that the
study was for research purposes only and also for gathering data in order to achieve
certain outcomes.
Most individual investors were not comfortable with being interviewed and argued that
their privacy was being interfered with and for those who were unwilling led me to adopt
the drop and pick technique in order to secure a high response rate which was 93.65%
that constituted the 59 questionnaires that were returned and therefore made it
quantitative enough and possible to do the analysis and make the conclusions.

62
Reliance on primary data only means that the advantages of secondary data were not
enjoyed which would show more information that would make it easier to analyze so as
to achieve desired results. Some of the firms could not allow more than one or two
questionnaires to be filled or dropped as that was the management policy.
5.6 Suggestions for Further Research
Future researchers can make contributions to this research:
An in depth study in the future that is not limited by time can be carried out to improve
the quality of the report whereby a certain identified scenario of investors behavior can be
investigated in a particular stock brokerage or investment bank and may provide new
information that may form basis of more studies.
A future study could account for more variables that potentially influence individual
investor decisions. Further researches are suggested to apply behavioral finance to
explore the behaviors influencing the decisions of institutional investors at the NSE.
These researches can help to test the suitability of applying behavioral finance for all
kinds of securities markets with all components of investors.
Further researchers should base their research on a bigger sample to increase the
qualitative data obtained for purposes of desired findings and achieving their objectives
fully.

63
Researchers could also adopt both quantitative and qualitative data to deepen the findings
of the study. Secondary data saves time that would otherwise be spent collecting data and
in the case of quantitative data, provides more and in depth data analysis that is less
biased and cannot be compared to what any individual researcher does on their own.

64
REFERENCES
Aduda, J., Oduor, E.O.,& Onwonga. M (2012), The Behavior and Financial Performance
of Individual Investors in the Trading Shares of Companies Listed at the Nairobi
Stock Exchange, Kenya, Journal of Finance and Investment Analysis, 1(3), 2012,
33-60
Barber, B., & Odean, T. (2001). Boys will be boys: Gender, overconfidence and common
stock investment. Quarterly Journal of Economics, 16, 262-292.
Barberis, N., Shleifer, A. (2003). Style investing, Journal of Financial Economics, Vol.
68.
Barberis, N., Thaller, R. (2003). A Survey of Behavioral Finance. Handbook of the
Economics of Finance.
Beck, T., Maimbo, S. M., Faye.I. & Triki, T. (2011).Financing Africa: Through the
Crisis and Beyond, Washington DC: World Bank Publications
Beckert, J. & Aspers, P. (2011).The Worth of Goods: Valuation and Pricing in the
Economy, Oxford: Oxford University Press.
Bernstein, P.L. (1996). Against the Gods: The Remarkable Story of Risk. John Wiley and
Sons, New York.
Bodie, Z., Kane, A., Marcus, A.J. (2008). Investments 4th Edition, McGraw Hill.
Brabazon, T. (2001).”Behavioral Finance: A New Sunrise or a False Down?”
Brigham, E.F., Ehrhardt, M.C. (2005). Financial Management: Theory and Practice, 11th
ed., International Student Edition, Thomson South-Western.
Brown, C. K &Reilly, F,K (2009): Investment Analysis and Portfolio Management, 9th
Edition, South Western College.
Bryman, A.& Bell, E (2011). Business Research Methods, 3rd ed, Oxford University
Press.

65
Caparrelli, F. D., Arcangelis, A. M., & Cassuto, A. (2004).Herding in the Italian stock
market: a case of behavioral finance. Journal of Behavioral Finance, 5(4), 222–
230.
http://dx.doi.org/10.1207/s15427579jpfm0504_5
Chandra, A. (2008). Decision Making in the Stock Market: Incorporating Psychology
with Finance. New Delhi-110025.
Chelangat, M.P. (2011).”Relationship between gender and age and investor decision
making behavior at the Nairobi Securities Exchange”. Unpublished MBA
research proposal. University of Nairobi.
Cooper, D.R. &Schindler, P.S. 2001).Business Research Methods (7th ed.). New York,
USA: The Irwin/McGraw-Hill Series.
Daily Nation(2011).Retail Investors Pave Way for Big Players at NSE. Nairobi: Daily
Nation.
DeBondt, W. F. M., & Thaler, R.(1985). Does the stock market overreact? The Journal of
Finance, 40(3), 793-805.
DeBondt, W. F. M., & Thaler, R (1987).Further evidence on investor overreaction and
stock market seasonality. The Journal of Finance, 42, 557-581.
De Bondt, W.F.M., Thaler, R.H. (1994). Financial Decision-Making in Markets and
Firms: A Behavioral Perspective, National Bureau of Economic Research,
Working Paper No. 4777.
Eugene F. Fama (1970). Efficient Capital Markets: A Review of Theory and Empirical
Work, Journal of Finance 25, (2 ) 383–417.
Evans, D.A.(2006).Subject perceptions of confidence and predictive validity in financial
cues, Journal of behavioral finance, 7, (1), 12–28.
Fama, E. (1965). “The Behavior of Stock Market Prices,” Journal of Business, 38,34-
105.
Fogel, O.& Berry, T. (2006).The disposition effect and individual investor decisions: the
roles of regret and counterfactual alternatives, Journal of Behavioral Finance,7,
(2),107–116.

66
Fromlet, H. (2001).Behavioral Finance-Theory and Practical Application. Business
Economics, 36(3).
Griffiths, H. 1990).Financial Investment, London; McGraw-Hill Book Company.
Goldin, I. & Reinert, K. A. (2007).Globalization for Development: Trade, Finance, Aid,
Migration, and Policy. Washington DC: World Bank Publications.
Holstein, J.A. & Gubrium, J. F. (2004).The active interview: Qualitative research:
theory, method and practice. London: Sage.
Johnson,M., Lindblom, H., Platan, P. (2002). Behavioral Finance: And the change of
investor behavior during and after the speculation bubble at the end of the 1990s.
Master‟s Thesis in Finance, Lund University.
John R. Nofsinger and Thaler, R, (2002). Individual investments behavior, New York,
McGraw-Hill
Kahneman, D., & Tversky, A. (1974). Judgment under Uncertainty: Heuristics and
Biases. Science, 185.
Kahneman, D., & Tversky, A. (1979).Prospect theory: an analysis of decision-making
under risk”, Econometrica, 47, (2) 263-291
Kimani, V. W. (2011).A Survey of Behavioral Factors Influencing Individual Investors’
Choices of Securities at the Nairobi Securities Exchange. Retrieved on 12 March
2013 from http://erepository.uonbi.ac.ke/handle/123456789/11066.
Kipngetich, T. J., Kibet, B. J., Shibia, A. G. & Kipkoskey, B. J. (2011).Determinants of
initial public offer pricing in Kenya, London: Annual Conference on Innovations
in Business & Management. Retrieved on 16th February 2013from
http://www.cibmp.org/Papers/Paper517.pdf
Keynes, J.M., (1936). The General Theory of Employment, Interest and Money, London:
Macmillan.

67
Kothari, C. R. (2004). Research Methodology: Methods and Techniques, 2nd Ed. New
Delhi: New Age International Ltd.
Lin, H.W., (2011).Elucidating Rational Investment Decisions and Behavior Biases:
Evidence from the Taiwanese Stock Market‟. African Journal of Business
Management, 5(5), 1630-1641.
Liu, Y.,Wu, A. D., & Zumbo, B. D. (2010).The Impact of Outliers on Cronbach’s
Coefficient Alpha Estimate of Reliability: Ordinal/Rating Scale Item Responses.
Educational and Psychological Measurement, 70 (1), 5–21.
Ljungqvist, A. & Wilhelm,W. J. (2004). Does Prospect Theory Explain IPO Market
Behavior? The Journal of Finance, 60(4), 1759-1790.
Luu, T. T. (2012).Marketing effectiveness and its precursors. Asia Pacific Journal of
Marketing and Logistics, 24(1), 125–152.
http://dx.doi.org/10.1108/13555851211192731
Markowitz, H. (1952).Portfolio Selection. Journal of Finance 7(1): 77-91.
Mugenda, M.O., Mugenda, G.A. (1999). Research methods: quantitative and Qualitative
approaches. African Centre for Technology Studies.
Mwaka, S .W. (2013) The effect of demographic characteristics on investor behavior at
the Nairobi Securities Exchange (Unpublished MBA research project, University
of Nairobi.)
Nairobi Stock Exchange, (2002).Handbook: An Authoritative 5-year Performance
Results of Listed Companies. 2002 Ed, Nairobi.
Nagy, R.A. & Obenberger, R.W., (1994) Factors influencing investor behavior, Financial
Analysts Journal 50, 63-68.
Neuman, W. L. & Kreuger, L. W. (2003) Social Work Research Methods: Qualitative and
Quantitative applications, First Ed, United State of America: Pearson Education.
Ngigi, G. (2012). Safaricom staffs shun ESOP over low share price. Business Daily,
Retrieved on January 20th 2013 from http://www.businessdailyafrica.com/

68
Ngugi, R. W. (2003). Development of the Nairobi Stock Exchange: A Historical
Perspective. Nairobi: Kenya Institute of Public Policy Research and Analysis.
Nunnally, J. C. (1978). Psychometric theory. New York: McGraw-Hill.
Obamuyi, T. M (2013) Organizations and markets in emerging economies, 4, (1)7
Odean, T. & Olsen, R. (1998).Behavioral finance and its implications for stock price
volatility, Financial Analysts Journal, 54,(2),10–18.
Odean, T. (1999). Do investors trade too much? American Economic Review, 89(5),
1279–1298.http://dx.doi.org/10.1257/aer.89.5.1279
Ogilo, F. (2012).An Investigation into the Existence of Fads in the Initial Public Offering
Market in Kenya.DBA Africa Management Review, 2(2), 31-44.
Olsen, R.A. (1998). Behavioral Finance and its Implications for Stock-Price Volatility,
Financial Analyst Journal 54, (2).
Olweny, T., Namusonge, G. S., & Onyango, S. (2012). The Influence of Social Cultural
Background on Individual Investors Risk Tolerence at Nairobi Securities
Exchange. International Journal of Arts and Commerce, 1 (4), 87-106.
Oso, w. y & Onen, D. (2009). Writing research proposal and Report. Nairobi: sitima
Pandey, I. M. (2008).Financial Management. Ninth edition, Vikas
Peter K. Mbaluka, (2008). Individuals’ Investment Behavior.
Plous, S. (1993). The Psychology of Judgment and Decision-Making, McGraw-Hill, New
York.
Pompian, M. (2012).Behavioral Finance and Investor Types: Managing Behavior to
Make Better Investment Decisions. New York: John Wiley & Sons.
Raines, J.P.,& Leathers, C.G. (2011).Behavioral Finance and Post Keynesian-
Institutional Theories of Financial Markets, Journal of Post Keynesian
Economics.

69
Ritter, R.J. (2003). Behavioral Finance: Pacific Basin Finance Journal, 2(14).
Samal, N. (1995).Factors Affecting Investors Preference for Mutual Funds in India.
Summer Internship Program Report.
Sewell, M. (2005). Behavioral Finance.
Sharpe, W. (1964).Capital Asset Prices: A Theory of Market Equilibrium Under
Conditions of Risk. Journal of Finance 19(3): 425-442.
Shefrin, A, Hersh M., and Statman, M.(1985).The disposition to sell winners too early
and ride losers too long, Journal of Finance 40, 777–790.
Shleifer, A. and Shiller, R.J. (2000).Inefficient Markets: An Introduction to Behavioral
Finance. Oxford: Oxford University Press
Shiller, R.J. (1997).Human Behavior and the Efficiency of the Financial System.
Princeton University Press.
Shiller, R. J. (1998).Survey evidence on diffusion of interest and information among
investors. Journal of Economic Behavior and Organization, 12(1), 47–66.
http://dx.doi.org/10.1016/0167-2681(89)90076-0
Shiller, R.J. (2000).Irrational Exuberance. Princeton University Press.
Singh, R. (2010). Behavioral Finance Studies: Emergence and Developments,
Contemporary Management Research, (4)2, 1-9.
Statman, M, Thaler, R. and Shefrin, H. (1999). Behavior finance: past battles and future
engagements, Financial Analysts Journal, 55,(6),18–27.
Subrahmanyam, A. (2007). Behavioral Finance: A Review and Synthesis. European
Financial Management, 14:12-29
Thaler, R (1993).Advances in Behavioral Finance. Journal of Political Economy, 98(4).
Thaler,R. H (1999).Mental accounting matters. Journal of Behavioral Decision Making,
12(3), 183-206

70
The Fletcher School (2009).Safaricom: What Happened after 9th? Medford: Tufts
University.
Waweru, N.M. and Ndungu, P. (Forthcoming).Relationship between increase in dividend
payments and future earnings of companies quoted in the Nairobi Stock
Exchange.
Waweru, N. M., Munyoki, E., &Uliana, E. (2008).The effects of behavioral factors in
investment decision-making: A survey of institutional investors operating at the
Nairobi Stock Exchange. International Journal of Business and Emerging
Markets1 (1), 24-41.
Werah. (2006).A survey of the influence of behavioral factors on investor activities at the
Nairobi Stock Exchange.(Unpublished MBA research proposal, University of
Nairobi).
Winchester, D.D.Huston, S.J., Finke, M.S. (2011).Investor Prudence and the Role of
Financial Advice. Journal of Financial Service Professionals, July 2011.
www.investinganswers.com
www.standardmedia.co.ke
www.nse.co.ke

71
APPENDICES
Appendix I: List of NSE Member Brokerage Firms as at August 2014
1. ABC Capital Ltd IPS Building, 5th floor
2. African Alliance Kenya Investment Bank Ltd 1st Floor, Trans-national Plaza
3. Afrika Investment Bank Ltd Finance House, 9th Floor
4. Apex Africa Capital Ltd Rehani House, 4th Floor
5. SBG Securities Ltd CfC Stanbic Centre, 58 Westlands Road
6. Discount Securities Ltd. (Under Statutory management) Nairobi
7. Francis Drummond & Company Limited Hughes Building, 2nd floor
8. Dyer & Blair Investment Bank Ltd Pension Towers, 10th floor
9. Faida Investment Bank Ltd Crawford Business park, Ground Floor, State House Road
10. Genghis Capital Ltd Prudential Building, 5th Floor
11. Kestrel Capital (EA) Limited ICEA Building, 5th floor
12. Kingdom Securities Ltd Co-operative Bank House, 5th Floor
13. Ngenye Kariuki& Co. Ltd. (Under Statutory Management) Corner House, 8th floor
14. NIC Securities Limited Ground Floor, NIC House, Masaba Road
15. CBA Capital Limited CBA Centre, Mara Ragati Road Junction, Upper Hill
16. Old Mutual Securities Ltd IPS Building, 6th Floor
17. Renaissance Capital (Kenya) Ltd Purshottam Place, 6th Floor, Westlands
18. Standard Investment Bank Ltd ICEA Building, 16th floor
19. Sterling Capital Ltd Barclays Plaza, 11th Floor, Loita Street
20. Suntra Investment Bank Ltd Nation Centre, 7th Floor
21. Equity Investment Bank Limited Equity Centre, Hospital Road, Upper Hill
Source: www.nse.com, 2014

72
Appendix II: Questionnaire
Questionnaire
I am a student at the University of Nairobi and am writing my MSC research project on
behavioral factors that affect investor choices at the NSE. I kindly request you to take
part of your time to complete this questionnaire. I assure you that all the information
provided will be treated with strict confidentiality. In each question provide the response
that best reflects your own experiences. Your cooperation will greatly contribute to the
success of this study.
Section A: Background of the Respondent
1. Gender: Male [ ] Female [ ]
2. Age: Less than 30 Years [ ] 31-40 Years [ ]
41-50 years [ ] More than 50 Years [ ]
3. Marital Status: Single [ ] Married [ ] Divorced [ ]
4. What level of education have you completed?
Primary Certificate [ ] Secondary Certificate [ ]
Other College Education [ ] Diploma [ ]
Degree Certificate [ ] Postgraduate/PhD [ ]
5. What is your nature of employment?
Self employment (Farming) [ ] Self employment (Business) [ ]
Formal employment [ ] Both Formal and Self employment [ ]
6. Please estimate your average monthly income (KSHS)
Less than 5,000 [ ] 5,000 – 20,000 [ ] 20,000-50,000 [ ]
50,000-100,000 [ ] 100,000-200,000 [ ] More than 200,000 [ ]

73
Section B: Behavioral Factors Influencing Investment Decisions 7. Please evaluate the degree of your agreement with the following statements:
Behavioral Factors Influencing
Investment Decisions
Highly
Disagree
Somehow
Disagree
Agree Somehow
Agree
Highly
Agree
Herding Factors (buying and selling, choice and volume of trading stocks, speed of herding)
Other investors' decisions of
choosing stock types have
impact on my investment
decisions.
Other investors' decisions of the
stock volume have impact on
my investment decisions.
Other investors' decisions of
buying and selling stocks have
impact on my investment
decisions.
I usually react quickly to the
changes of other investors'
decisions and follow their
reactions to the stock market.
Prospect Factors -Loss Aversion
After a prior loss, I become
more risk averse.
Regret Avoidance
I avoid selling shares that have
decreased in value and readily
sell shares that have increased
in value.
Mental Accounting
I tend to treat each element of
my investment portfolio
separately.
I ignore the connection between
different investment
possibilities
Market Factors -Price changes
I consider carefully the price
changes of stocks that I intend
to invest in.
Market Information
Market information is important

74
for my stock investment.
Past Trends of stocks
I put the past trends of stocks
under my consideration for my
investment.
Overconfidence
I believe that my skills and
knowledge of stock market can
help me to outperform the
market.
I am normally able to anticipate
the end of good or poor.
Anchoring
I forecast the changes in stock
prices in the future based on the
recent stock prices.
I prefer to buy local stocks than
international stocks because the
information of local stocks is
more available.

75
Section C: Individual Investor Choices
8. Please estimate the last shares (KSHS) you bought.
Less than 5,000 [ ] 5,001 – 20,000 [ ] 20,001-50,000 [ ]
50,001-100,000 [ ] 100,001-200,000 [ ] More than 200,000 [ ]
9. For how long had you been trading in shares?
Less than 1 year [ ]
1 to 3 years [ ]
4 to 5 years [ ]
6 to 10 years [ ]
More than 10 years [ ]
10. Have you sold all or part of the shares?
Yes [ ] No [ ]
11. How long have you been participating in the stock market?
Less than 1 year [ ] 1 - 3 years [ ] 3 - 5 year [ ]
5 - 10 years [ ] Over 10 years [ ]
Please name the security company(s) that you are holding an account for stock
investment.
………………………………………………………………………………………………
………………………………………………………………………………………………
………………………………………………………………………………………………
12. What encouraged you to purchase the company‟s shares during the listing?
(Please tick one only)
My friends [ ]
My experience and financial knowledge [ ]
Others (please specify) __________________________________

76
13. Have you attended any course of Stock Exchange?
Yes [ ] No [ ]
14. Which market sector do you usually participate in?
Agricultural sector [ ] Commercial Services [ ]
Finance & investment [ ] Alternative Market Segment [ ] Industrial & Allied Sector [ ]
15. What kind of an investor are you?
Speculative (short-term) [ ] Capital Long (long term) [ ] both [ ]
Thank you for Participating.