Embed Size (px)
Citation preview

The Effect of Bank Credit on Asset Prices:
Evidence from the Japanese Real Estate Boom during the 1980s
Nada Mora∗
American University of Beirut
July 25, 2005
Abstract This paper studies whether bank credit fuels asset prices. I show that I have an instrument for the supply of real estate loans. Financial deregulation during the 1980s allowed keiretsus to obtain finance publicly and reduce their dependence on banks. Banks that lost these blue-chip customers increased their property lending. Using this instrument I find that a 0.01 increase in a prefecture's real estate loans as a share of total loans causes 14-20% higher land inflation compared to other prefectures over the 1981-1991 period. The timing of losses also coincides with subsequent land inflation in a prefecture. Keywords: bank credit, asset prices, financial regulation JEL Classification: E44, G21, G28
∗ I am indebted to David Weinstein and Hugh Patrick for giving me the opportunity to be a visiting scholar at the Center on Japanese Economy and Business (CJEB) at Columbia Business School during the summer of 2004 and for many helpful conversations. I would like to acknowledge David Weinstein for providing me access to the Development Bank of Japan Corporate Finance Data Set and the CJEB for providing me access to the Nikkei NEEDS database. I thank Takeo Hoshi for sharing his data and for his initial encouragement to pursue this topic. I also benefited from comments received from Ricardo Caballero, Roberto Rigobón, James Vickery, participants at the MIT International Workshop and at the 22nd Symposium on Banking and Monetary Economics in Strasbourg. Email: [email protected]. Title: Assistant Professor. Address: Economics Department, The American University of Beirut, c/o New York Office. 3 Dag Hammarskjold Plaza, 8th Floor, New York, NY 10017-2303. Tel: +961-3-574390. Fax: +961-1-744461.

1 Introduction
The purpose of this paper is to determine whether bank credit affects asset prices. The Japanese real
estate boom during the 1980s provides a unique episode to help answer this question. In particular,
this paper studies to what extent an exogenous shock to the supply of bank credit contributes to
fuelling land prices. I show that I have an instrument for the supply of real estate loans, which is the
decrease in banks' loans to keiretsu firms beginning in the early 1980s. I then take advantage of the
cross-sectional and time-series variation in Japan's 47 prefectures. Using this instrument I find that a
0.01 increase in a prefecture's real estate loans as a share of total loans causes 14-20% higher land
inflation over the 1981-1991 period. The timing of losses also coincides with subsequent land inflation
in a prefecture.
There is consensus in the literature on Japan that some initial shock in the 1980s led banks to
increase lending towards the real estate sector. However the keiretsu shock to bank credit must be
exogenous, not endogenous to banks' decisions. The first part of this paper tests and determines that
lending to keiretsus declined as a result of the financial deregulation which enabled keiretsu firms to
obtain financing from the public market. This supports the Hoshi and Kashyap (hereafter HK)
hypothesis, which is that large known firms (mostly keiretsus) substantially reduced their dependence
on bank financing by issuing bonds during the 1980s. Therefore it was a choice by firms to move away
from banks. In contrast, the "good opportunities" hypothesis would imply that banks chose to move
away from keiretsu firms. Real estate may have been perceived to have good opportunities,
rationalizing a shift of bank lending towards the real estate sector during the 1980s1. The results of
extensive tests do not suggest that this was the case in Japan. Therefore, the HK hypothesis can be
applied to help answer the question motivating this paper.
The main part of this paper explains the Japanese bubble in land prices and its differential impact
across Japan's prefectures using the keiretsu loan shock as an instrument. When banks lost their
keiretsu (large and known) customers, they increased their lending to the real estate sector and that in
turn fuelled land prices. This main result is shown in both the cross-sectional and time-series view.
First, those prefectures that experienced a larger loss in their banks' proportion of keiretsu loans
experienced a larger increase in real estate lending which fuelled land inflation. An increase of 0.01 in a
prefecture's instrumented real estate loans as a share of total loans implies 14-20% higher land inflation
over the 1981-1991 period. Second, the timing of losses coincides with the subsequent land inflation in
a prefecture. A 0.01 increase in a prefecture's instrumented real estate loan share corresponds to a
1 A third view emphasizes monetary factors which can be related to the "good opportunities" view. Ueda (2000) and Hoffmaister and Schinasi (1994) are of the view that monetary policy was responsible for the wide swings in asset prices that caused increased bank lending towards real estate.
2

15%-27% higher land inflation rate. From 1983 to 1993 and based on the fixed effects model, the
average predicted land price inflation coming from instrumented real estate lending is close to the
Japan-wide average land price inflation during this period, 6.4 percent annually.
Previous papers assessing the importance of various factors for why banks in Japan increased their
lending to real estate during the 1980s take land prices as given. They overlook the idea that the
increase in banks' credit to real estate may itself have also contributed at the aggregate to land price
inflation. This paper attempts to further research into this question. Within the popular press, an
article in the Economist (4/24/2003) attributed the rise in property prices in Australia not only to low
interest rates but also to the observation that "banks and other institutions have competed to offer
cheap loans." With no imperfections in credit markets and in a standard asset pricing model, banks'
willingness to offer loans would have no impact on asset prices. Therefore, fundamental to the
empirical analysis in this paper is the presence of credit constraints. A useful frame of reference is
Kiyotaki and Moore (1997) who treat assets as not just factors of production, but also as collateral for
loans, so that credit limits are affected by the price of these assets. Therefore it is straightforward that a
firm's borrowing capacity and therefore its demand for credit is affected by changes in asset prices.
This leads to an upward sloping demand for land because firms can borrow more and their net worth
rises when the price of land increases.
However what motivates this paper is what happens when we allow for shocks to the supply of
loans. I show in Appendix 1 that this implies that asset prices (and asset holdings) can also be affected
by shocks to credit limits, based on an extension of the Kiyotaki and Moore model. A similar credit
cycle is created when banks ease binding credit limits independent of firms' net worth, allowing them to
borrow more, invest more in the asset and in the process increase the price of the asset. Gerlach and
Peng (2005) note that there can be a role for credit in asset valuations by increasing available liquidity,
an idea that goes back to Kindleberger (1978). This is also in the spirit of Ito and Iwaisako (1996) who
argue that in a setup with asymmetric information, it matters how much banks are willing to finance
projects that require acquisition of land or stocks. They support their argument with VAR results
based on total bank loans to real estate and the aggregate real estate price index in Japan. They find
that the bank loans to real estate leads the land price, while only current land price inflation helps
explain the growth of bank loans.
The main contribution of this paper is in isolating the effect of bank credit on real estate prices,
using an instrument for the supply of real estate loans. I am then able to apply the analysis to
disaggregated data, which is also new to the best of my knowledge. This paper therefore contributes to
the current policy debate on land price inflation and banks' role in fuelling real estate lending.
The rest of this paper is organized as follows. Section 2 tests whether the fall in keiretsu loans was a
choice by firms or a choice by banks. Having determined that the evidence supports the former,
3

Section 3 comprises the core of the paper and assesses whether and to what extent bank credit has an
effect on land prices. Section 4 concludes.
2 The Fall in Lending to Keiretsus: Firm or Bank Choice?
Japan liberalized its financial system in the 1980s. As part of this deregulation, firms reduced their
borrowing from banks. The Hoshi and Kashyap (HK) hypothesis is that large and known firms
substantially reduced their dependence on bank financing by issuing bonds during the 1980s (with the
market substituting reputation for monitoring). Therefore it was a choice by firms to move away from
banks. In contrast, the "good opportunities" hypothesis implies that banks chose to move away from
keiretsu firms to a promising real estate sector.
In this section I briefly summarize existing evidence for the HK hypothesis, i.e. the idea that the
development of the Japanese corporate bond market caused an exogenous fall in demand for bank
loans, which then fuelled an increase in bank real estate lending (as shown in Figure 1). I then present
new evidence consistent with the HK hypothesis using both bank-level and firm-level data.
2.1 Previous Literature on this Question
Hoshi and Kashyap articulate their view in several papers. For example, they draw several stylized
facts from figures for bank debt as a percent of total assets for publicly traded Japanese firms from
1970 to 1997 (refer to HK, 2001). First, there was a large decrease among large firms, and particularly
manufacturing firms. The ratio of bank debt to total assets for large manufacturing firms fell from 35
% in the 1970s to below 15 % by 1990. Second, firms that decreased their bank dependence primarily
replaced it with bond financing. Third, the shift appears to have occurred relatively soon after they
became eligible to do so.
In an earlier paper, HK (2000) test their view's implications for cross-bank differences. Those banks
that relied more heavily on loans to customers who then obtained access to capital markets should have
under-performed after deregulation. They test this using return on assets as a performance measure
and find it to have been true. A recent paper by Hoshi (2001) carries out more extensive tests also
using individual bank data. He tests the hypothesis in two steps. The first is a cross-section regression
of a bank's bad loan ratio in 1998 on the change in the bank's proportion of loans to real estate from
1983 to 1990. He confirms that banks that increased their lending to real estate during the 1980s boom
later ended up with higher non-performing loans. The second part relates more directly to the HK
hypothesis. He estimates a 150 bank panel from 1984-90 with the change in a bank's real estate loan
ratio regressed on lags in the change in keiretsu loan ratios, controlling for land prices and time
4

dummies. He finds that banks that experienced a larger decline in their keiretsu loan share
subsequently increased their real estate loans. Although this offers support for the HK view, it does
not rule out the "good opportunities" view.
It is better to look directly at firm data to distinguish between the two hypotheses and I will take this
up in Section 2.2.3 below. Hoshi, Kashyap and Scharfstein (1993) tabulate the ratio of bank debt to
total debt for those firms eligible and ineligible to issue bonds, respectively, from 1975 to 1992. For the
112 firms that were permitted to continuously issue convertible bonds from 1982 to 1989 the bank
debt ratio is throughout lower and increasingly so compared to the remaining 424 firms in their sample.
By 1992 only 30 % of the eligible firms' debt was bank debt compared to over 50% for the ineligible
firms. The rest of the econometric analysis in their paper concerns the choice to issue conditioning on
those firms eligible to do so. Therefore they do not specifically look at the time-series for a firm's
choice before and after it becomes eligible. Hirota (1999) finds that regulation criteria on new equity
issues influence a firm's leverage. Firms that are ineligible to issue are more highly leveraged than firms
eligible to issue. The policy was similar to the bond issuance criteria and was a voluntary rule
concerning equity issues, but enforced by the major securities companies and continued until 1996.
A paper by Weinstein and Yafeh (1998) emphasizes the holdup problem of firms by banks prior to
liberalization. Using data on manufacturing firms, they find that while close bank-firm ties increase the
availability of capital to borrowing firms, their cost of capital is higher. However, they find that much of
the difference in capital use between affiliated and unaffiliated firms disappeared by 1981. They
interpret this as evidence of the importance of the liberalization of the foreign exchange law in 1980.
Even if one were to agree with the finding that firms reduced their borrowing from banks in favor of
public finance, it does not fully explain the shift of bank loans to real estate. What are the alternatives
available to banks? Faced with a decrease in demand for bank loans from keiretsus, they could look for
other loans, invest in government bonds, look for foreign opportunities, or choose to reduce deposit
rates and shrink. These are all points that I will test in Section 2.2.2. I first briefly summarize what the
existing literature has to say on these points.
Hoshi and Kashyap argue that the answer lies in the incomplete and skewed financial deregulation
implemented gradually over two decades. One implication of the gradual deregulation was that
households had limited savings options and continued to channel their funds to banks. When
combined with interest rate controls to ensure profit margins and a policy of government deposit
guarantees, banks attempted to make up through volume whatever decrease in margins they received
on loans during the period of deregulation. The "convoy" system in Japan ensured that no bank was
allowed to go bankrupt. Therefore the government assumed banks' credit risk. As the main bank
system receded in importance, it was not effectively replaced with a proper regulatory alternative to
evaluate and monitor risk-taking by banks. More details on the implications of deregulation are
5

highlighted in Appendix 2. Variations of this argument are also raised by Kitigawa and Kurosawa
(1994), Nagajima and Taguchi (1995), Ito and Iwaisako (1996), Cargill, Hutchison and Ito (1997),
Lincoln (1998), Hanazaki and Horiuchi (2000), and Tsuru (2001).
While the gradual deregulation combined with the government policy of limited liability can explain
the fact that banks did not shrink as they lost their favored keiretsu customers, it still does not fully
explain why banks predominantly shifted to real estate and not to other types of loans, government
bonds or foreign opportunities. This is best left for the data to answer in Section 2.2.2 below, but I
briefly summarize what the literature has to say on the question. Hoshi (2001) argues that because
banks lacked close knowledge of new customers, they relied on collateralized loans. Land was
considered the most secure collateral because its value had not fallen throughout the postwar period.
Therefore a plausible explanation is that banks may (on average) have wrongly perceived low volatility
in real estate. This view is echoed by Ueda (1994) who comments that banks strongly competed for
loans to land and equity investment-related loans because credit analysis was considered relatively easy
as it consisted of forecasting future land prices. Cargill, Hutchison and Ito (1997) also point out that
loans to real estate and construction were extended on the expectation of future price increases.
It is interesting to discuss the actions of the Bank of Japan and the Ministry of Finance during the
real estate boom. Ueda (1994) argues that although the Bank of Japan and the Ministry of Finance
were concerned about the increase in land prices, they did not stop it because the general price level
was stable and they were unable to perceive the collapse. Only in April 1990 did the Ministry of
Finance and the Bank of Japan introduce quantitative controls and effectively capped bank lending to
the real estate-related sector. Ito (2004) suggests that this action contributed to the end of the land
bubble. This further adds to the evidence that it was a bank-led real estate boom as opposed to one led
by real estate demand. No caps were placed on the ability of firms in real estate and construction to
raise funds from capital markets and other sources.
2.2 New Empirical Tests on Firm or Bank Choice
2.2.1 Stylized Evidence
I now turn to presenting new evidence consistent with the HK hypothesis discussed above. I begin
with firm survey data, which provides insight into the question of whether keiretsu firms chose to
reduce bank financing or vice versa. The Central Bank of Japan conducts a quarterly survey of
enterprises (disaggregated by sector and by size) with questions on short-term economic conditions,
known as the Tankan survey. One of the questions pertains to their assessment of the lending attitudes
6
of financial institutions. Figure 2 shows the "diffusion" index for manufacturing and real estate &
construction enterprises, respectively. A higher value of the index indicates that more firms perceived
accommodative lending conditions. Since keiretsu firms are typically large manufacturing firms (e.g.
Hoshi 2001), the index for the large manufacturing enterprises in addition to that for enterprises in
construction and real estate is shown. If the "good opportunities" hypothesis were the correct one, then
it would be expected that the index (or its difference) for real estate and construction firms to be higher
than that for large manufacturing firms during the 1980s. This is not the case. In fact, during the first
part of the 1980s when the share of bank loans to keiretsus declined from around 15% to 5% (Figure
1), large manufacturing enterprises reported increasingly accommodative lending attitudes in contrast to
stable lending attitudes perceived by construction and real estate firms.
Table 1 presents evidence on the source of flow of funds to the real estate market based on data
reported in Cargill, Hutchison and Ito (1997). Additional evidence on the financing of real estate firms
will be presented in Section 2.2.3 based on firm-level data. If large real estate companies with the
ability to borrow in the bond market were fuelling the boom, then bank lending would not be expected
to be the dominant means of financing real estate investment. It turns out that banks accounted for the
principal source of funds (59 out of 120 trillion yen total in June 1991 at the peak of the boom). Non-
bank financial institutions accounted for another 50-55, insurance companies, credit unions and foreign
banks accounted for 9.1, and only a residual of 2 came from the capital market. It is important to note
that a significant share of non-bank financial institutions were the "jusen", which were specialized
housing loan companies created as subsidiaries of banks in the 1970s. Therefore if we account for the
indirect flow of funds from banks to real estate via non-banks, banks would account for the vast
majority of the flow of funds to real estate (since 72 trillion yen is reported to be the flow of funds
from banks to non-banks).
Another interesting comparison from Table 1 is that of foreign banks' behavior to that of Japanese
banks. Table 1 reports that the flow of funds from foreign banks to real estate was 0.6 trillion yen
compared to 59 trillion yen for domestic banks. However this needs to be normalized by a valid
measure of the size of these institutions to compare their behavior. In Section 2.2.2 below, only
domestic individual bank data is available. Foreign bank balance sheet data is available in aggregate
form through the Bank of Japan2 but it is sufficient for the purpose of this stylized comparison. I
divide the flow of funds to real estate by the total assets of domestically licensed banks and foreign
banks, respectively, as of end-June 1991. It turns out that the flow of funds to real estate as a share of
banks' total assets was approximately 7.8% for domestically licensed banks in contrast to only 2.3% for
2 Refer to the series "Principal Assets and Liabilities of Foreign Banks in Japan" and for comparison "Assets and Liabilities of Domestically Licensed Banks(Banking Accounts)(excluding trust subsidiaries and foreign trust banks, through September 1993" available from the Bank of Japan, http://www.boj.or.jp/en
7

foreign banks. Again, this does not support the "good opportunities" demand view, where we would
expect foreign banks to behave similarly to domestic banks.
2.2.2 Bank-level Evidence
A more stringent test can be carried out with individual bank balance sheet and income statement
data. If the HK hypothesis were correct, then those banks that lost keiretsu loans would then have
excess funds. While under the alternative, banks would actively seek funds to lend to the promising
real estate sector. For example if real estate loan demand caused the return on real estate loans to rise
relative to keiretsu lending, banks would increase their share of real estate lending at the expense of
lending to keiretsus. In this case, banks would be expected to increase their deposit rates (and
quantities of borrowed funds) compared to other banks. Regression results are shown in Table 2.
Data on 150 banks for the years 1983-90 is used and all regressions are panel fixed effects that include
year dummies and two lags of prefectural land inflation, following Hoshi (2001). Sample summary
statistics are shown in Table A1. Columns (1) through (3) are estimated with real estate loans to total
loans (first difference) as the dependent.
Column (1) is a similar model to that shown in Table 9.1 in Hoshi (2001). Four lags of the keiretsu
loan share (first difference) are included on the right hand side. The results are very significant
indicating that those banks that lost more keiretsu loans subsequently increased their real estate lending.
The estimates suggest that for a 0.01 annual decrease (over 4 years) in a bank's share of keiretsu loans
to total loans, its lending to real estate increases by 0.0013. Column (2) includes four lags of the
difference between loan and deposit rates to the model in column (1). Those banks that experienced
falling margins subsequently increased their real estate lending, a point raised in the literature (e.g.
Hoshi and Kashyap 2001; Nagajima and Taguchi 1995; Ueda 1994).
Column (3) provides one test for whether those banks that decreased their keiretsu loans and moved
to real estate increased their deposit rates to obtain funds (and decreased their lending rates but there is
a more severe selection problem with the lending side so I will not focus on it). If this were the case, it
would support the "good opportunities" hypothesis. Therefore column (3) includes the interaction
between the four lags of keiretsu loans with the contemporaneous change in deposit rate. Under the
null of good opportunities, the coefficients will be negative. There is no support for this hypothesis.
Column (4) shows the estimates from a model with the deposit interest rate as the dependent
variable. It is a more direct test than the previous column. On the right hand side are the four lags of
the keiretsu loan shares. The results, which are very significant, indicate that those banks that lost
keiretsu loans subsequently decreased their deposit rate relative to other banks, suggesting that they had
excess funds. In contrast the null of "good opportunities" would predict that they would seek funds by
8

increasing their deposit rates. In short, the bank-level results do not support the hypothesis that there
were good opportunities to be lent to in real estate that rationalized a bank shift away from keiretsus3.
One potential criticism is that the results in Table 2 do not account for the different types of banks
(although fixed effects are included and variables such as keiretsu loans are normalized by each bank's
total loans). There may be institutional and size differences between city banks, long-term credit banks,
trust banks, and regional banks that are not fully accounted for and the results may be generated by a
subset of the banks. For example and as shown in the summary statistics in Table A1, city banks,
followed by long-term and trust banks are the largest banks. To account for this possibility, I reran the
basic regression in column (1) with dummies for the 5 different bank types (random effects had to be
used instead of fixed effects because of the inclusion of bank-type dummies.) The relation between a
bank's loss of keiretsu loans and increased lending to real estate is robust. In the interest of brevity, all
the robustness checks discussed in the remainder of this section are available on the author's website4.
I additionally reran the regression restricting to city banks, long-term and trust banks, and regional
banks, respectively. The results do not appear to be driven by the larger city, long-term and trust
banks, and in fact are stronger among the regional banks (although the degrees of freedom are reduced
among the former because there are only 11 city banks and 10 long-term and trust banks.) Finally, I
reran the regression separately by bank size, where big banks are defined as those belonging to the
upper 85 percentile of the fraction of aggregate real bank assets over the period (23 banks), medium
banks are defined as those in the 60 to 85 percentile (37) and small banks accounting for the remaining
banks (90). Again the results appear robust to the different bank sizes5.
To summarize the bank-level evidence so far, I have shown that there is no support for the
hypothesis that there were "good opportunities" in the real estate sector. Banks that experienced a
decrease in lending to keiretsus did not increase their deposit rates (and quantities of borrowed funds)
compared to other banks. The evidence is consistent with the HK hypothesis, as these banks appear to
have excess funds and did reduce their deposit rates in an attempt to shrink. However it remains to be
answered whether they predominantly increased lending to the real estate market, whether they sought
other loans, invested in government bonds, or looked for foreign opportunities.
To answer these questions, I begin by regressing the (change) in the amount of loans to small firms
as a share of total loans on the same variables shown in column (1) of Table 2. There is mixed
evidence on the sign of the keiretsu loan shares. Nonetheless the sum is negative, indicating that those
3 Other results (available on author's website, http://www.aub.edu.lb/~nm32/) regressed quantity variables (such as the log first difference of total deposits and "borrowed money") on the four lags of the change in the keiretsu loan share as before. The results confirm that banks that lost keiretsu loans subsequently decreased their deposits as well. 4 Refer to http://www.aub.edu.lb/~nm32/ 5 In fact, in a regression including the interaction of a bank's total assets with the (lagged) change in keiretsu loan share on the right-hand side, the estimates are insignificant except for the first lag with a positive coefficient. That is, the shift to real estate is stronger among the smaller banks that lost keiretsu loans.
9

banks that lost more keiretsu loans subsequently increased their lending to small firms. Another option
available to banks is to increase their holdings of government bonds. I therefore replace the dependent
variable with the change in government bonds in own account to total assets. Again the results are
mixed but the sum is overall negative suggesting that those banks that lost keiretsu loans subsequently
increased government bond holdings. However the result for both government bonds and lending to
small firms is weaker than for real estate lending.
A third option available to a bank facing an exogenous fall in keiretsus' demand for bank loans is to
look for foreign opportunities. Unfortunately, the Nikkei NEEDS dataset does not contain data on the
amount of a bank's foreign loans or foreign investments. I therefore follow Hoshi (2001) in using the
proportion of a bank's branches located overseas as a proxy measure. There is no statistical
relationship between the loss of keiretsu loans and a subsequent increase in foreign activity.
Finally I regress loans to sectors other than real estate on the same right-hand side variables for
additional robustness checks. The sectors are construction, non-bank financial institutions, agriculture
forestry and fishing, individuals & others, local governments, mining, manufacturing, services,
transportation & telecommunication, utilities, and wholesale & retail industries, respectively. In fact,
only loans to real estate increase when keiretsu loans decrease. The results also confirm that keiretsu
loans tended to be towards sectors with "large" firms such as manufacturing, transportation &
telecommunication, utilities, and wholesale & retail industries. Loans to these sectors were significantly
and positively related to the lags of keiretsu loans. In contrast, there was little or no effect on loans to
agriculture forestry & fishing, individuals & others, local governments, mining, and service industries.
2.2.3 Firm-level Evidence
In this section I offer new evidence consistent with the HK hypothesis using firm-level data. It is
best to directly examine whether it was a firm choice using firm-level accounting data from the
Development Bank of Japan (DBJ) Corporate Finance Data Set on companies listed on the Tokyo,
Osaka, and Nagoya stock exchanges6. An eligible-to-issue time-varying dummy was created based on
the bond issuance criteria (BIC) reported in Table A3. Prior to 1976, there was rationing in the
corporate bond market. Beginning in 1976, once a firm met the criteria, it could issue as many bonds
as it chose. These criteria applied from October 1976-December 19907 for domestic secured
6 Note that the data was cleaned up for duplicate accounting periods in a given year by taking the average and if there was a missed year by taking the average over the previous and the following year. 7 For the period from May 1989 to December 1990, a firm with a BB rating or higher could issue bonds if its dividend per share was greater than 5 yen and its ordinary after-tax profit per share was greater than 7 yen, without it having to satisfy the other accounting criteria. Therefore the eligible-to-issue bonds dummy will be excessively conservative during the period from May 1989 to December 1990.
10

convertible bonds. Convertible bonds were the principle source of public debt financing throughout
the 1980s and the criteria also applied to foreign issues of convertible bonds (see Hoshi 1996).
Table 3 reports the number of companies eligible to issue secured convertible bonds for each year
from 1976 to 1990. The number steadily increased from a low of 65 companies in 1976 (22% of total
listed) to 1374 by 1990 (72% of total listed). Figure 3 plots the average ratio of a firm's bank debt to
total bank and bond debt according to whether a firm was fully eligible to issue throughout 1982-1989,
eligible for part of the period, or ineligible to issue during 1982-1989. In 1975, both eligible and
ineligible firms had a bank debt ratio of approximately 89%. By 1982, this ratio was 68.6% for eligible
firms and remained 88.8% for ineligible firms. By 1989, the ratio was 42.6% for eligible firms and
75.7% for ineligible firms. Therefore it appears that firms that became eligible to issue bonds greatly
reduced their dependence on bank debt.
More formal results are reported in Table 4, column (1). The dependent variable is the bank debt to
total debt for a firm. The estimation is an unbalanced panel fixed effects from 1977 to 1991 for 1291
companies. The ratio of bank debt is regressed on the first lag of the eligible-to-issue dummy and year
dummies. The eligibility dummy is significant at the 1% level and suggests that when a firm becomes
eligible to issue, its bank debt initially falls by 7 percentage points compared to ineligible firms. Column
(2) controls for other variables that a priori may be thought to affect the bank debt ratio such as firm
accounting variables (such as leverage, collateral, total assets and all the separate accounting variables
used to determine bond issuance eligibility) as well as land inflation in the firm's prefecture. The latter
is included to control for the possibility that high land inflation may be a measure of good
opportunities in the real estate sector. If so, then firms located in that prefecture would experience a
fall in their bank debt if their banks shifted towards the real estate sector. The coefficient remains
significant at the 1% level, although it is reduced to 5 percentage points.
Evidence from the DBJ database is also consistent with the figures reported in Table 1 on the flow
of funds to the real estate market. Table 5 reports the ratio of a firm's bank debt to total debt for firms
in the real estate, real estate & construction, and the manufacturing sector as a comparison. The share
of bank debt in 1976 is around 94% for real estate firms and 89% for manufacturing firms. By 1986,
the share had declined to 59% for manufacturing firms but only to 85% for real estate firms. Even by
1990 and at the peak of the boom, the major part of the debt of real estate firms was owed to banks
(73% and even 66% among the subset of real estate firms fully eligible to issue bonds throughout the
1982-89 period). Therefore it is not possible to make the case that large real estate companies with the
ability to borrow in the bond market were fuelling the boom. Bank lending remained the dominant
means of financing real estate investment during the 1980s even for relatively large companies. The
DBJ database is composed of large companies because they are listed on Japan's major stock
11

exchanges. The results would be even more pronounced if data were available on financing of smaller
real estate companies.
Combining this evidence from the firm side with the bank-level evidence as well as the illustrative
evidence and previous literature supports using changes in keiretsu loans as a valid and exogenous
shock to analyze the effect of bank credit on land prices. There is no support for the "good
opportunities" view of the real estate market that may have created a higher threshold return for banks
to lend and decrease their lending to keiretsus. There is no evidence that it was an increase in real
estate demand that caused real estate lending to rise. Furthermore, the bank-level evidence shows that
those banks that lost their keiretsu customers had excess funds. While they did begin to shrink and
pursue other alternatives, their principal substitute was to increase lending to real estate. Therefore the
results indicate that the development of the Japanese corporate bond market caused an exogenous fall
in demand for bank loans, which then fuelled an increase in bank real estate lending.
3 Shocks to the Supply of Bank Credit: Is There an Effect on Land Prices?
The analysis in Section 2 confirmed that I have an instrument for the supply of real estate loans.
This section uses bank loans to keiretsu firms to determine the extent of the effect, if any, of bank
credit on asset prices. The Japanese real estate boom during the 1980s provides a unique episode to
study this question. Taking advantage of the cross-sectional and time-series variation in Japan's 47
prefectures, this section analyzes the effect of bank credit on land prices.
I begin by briefly reviewing the theory for potential causality of bank credit to asset prices raised in
the introduction. In the presence of credit constraints, credit limits are affected by the price of assets
used as collateral for loans. However it also matters how much banks are willing to finance projects
which require the acquisition of assets. Asset prices can therefore be positively affected by slackened
credit limits and increasing available liquidity.
3.1 Empirical Estimation
Data on 150 banks' balance sheets was compiled from the Nikkei NEEDS database. This data was
previously used in section 2.2.2 when testing for bank choice against firm choice. The variables of
interest in this section include loans disaggregated by sector (e.g. real estate), loans to keiretsu and listed
firms, and the location of a bank's headquarters. The individual bank data is then aggregated by
prefecture. Refer to Table A2 for sample summary statistics. The maximum sample of the data is from
12

1976 to 1998. However the effective sample is from 1981 to 1993 because prefecture land prices are
available beginning in 1980 and keiretsu loan numbers end in 1993. This is not very constraining
because the 1981 to 1993 period is the one of interest to study the real estate boom.
The land price data is available from the annual prefectural land price survey for the 47 prefectures,
conducted by the Ministry of Land, Infrastructure and Transport and reported in the Japan Statistical
Yearbook. Figure 4 shows land price inflation figures. In Figure 4a, countrywide and the largest 6 city
averages are presented (based on semi-annual data from the Japan Real Estate Institute). It is
interesting that the country average lagged the increase in land prices in the 6 largest cities. Both series
lag the stock market (Nikkei index) that collapsed in 1990 compared to 1992 for land prices. Figure 4b
presents prefecture-specific data from the annual July land price survey. Shown are inflation rates for
Tokyo, Osaka (the two largest cities) along with rates for Hokkaido and Okinawa (two prefectures
geographically at opposite ends of Japan). There is considerable variation across prefectures, which is
also confirmed by the summary statistics in Table A2. The inflation rate peaked in Tokyo in the mid-
1980s compared to the early 1990s for Okinawa. The annual average real land price inflation over the
period 1983 to 1993 is 6.4% Japan-wide, 10.8% for Tokyo, and 11.1% for Osaka.
Finally, data on prefectural demand conditions is obtained from the Japan Statistical Yearbook
(various annual issues)8. Among the series available are population, job openings and applications,
income per capita and so on. These are used to control for demand conditions that may also affect
land prices.
In order to explain the Japanese real estate boom, the empirical estimation slices the data in two
ways. The first view is to determine if prefectures where banks lost the most keiretsu loans as a share
of total loans had the largest increase in land prices. This takes advantage of the cross-sectional
variation. The second view is to determine if the timing of keiretsu losses coincides with the
subsequent increase in a prefecture's land prices. This takes advantage of the time-series variation in
the data. It is worth pointing out that even if bank loans are not limited to the prefecture the bank is
headquartered in (and they are not), this would go against finding an effect on prefecture land prices9.
The cross-sectional regression takes the 1991-81 long difference in the variables across the 47
prefectures,
8 I would like to acknowledge Mr Akihiko Ito from the Japan Statistical Association who sent me some data missing from the Japan Statistical Yearbook. 9 Therefore the fact that an effect of bank credit on land prices is later found suggests that the true effect coming from bank loan supplies is stronger. These results are consistent with previous literature, which has found that banks tend to loan to companies located close to them (see Petersen and Rajan 2002). Among their findings is that banks are closer than other lenders (even accounting for the fact that firms may have deposits with them.) They suggest that banks are physically close lenders because the nature of the lending functions they perform is different.
13

)1(,loans total
keiretsu)price land realln( 811991,811991,
81 -1991 i, iii
i X εγβα ++⎟⎠⎞
⎜⎝⎛∆+=∆ −
−
where i indexes a prefecture, t indexes a year, and X are demand controls. In addition, land inflation is
regressed on the variable of interest, the change in real estate loans, 811991,loans total
loans estate real
−
⎟⎠⎞
⎜⎝⎛∆
i
, where
the latter is instrumented with 811991,loans total
keiretsu
−
⎟⎠⎞
⎜⎝⎛∆
i
.
The time-series 1981-1993 empirical estimation takes the fixed effects panel form,
)2(, dummiesyear loans total
keiretsu)price land realln( ,,
4
0 , ti, titi
j jtiji X εγβα +++⎟
⎠⎞
⎜⎝⎛∆+=∆ ∑
= −
)3(, dummiesyear loans total
loans estate real)price land realln( ,,,
ti, tititi
i X εγβα +++⎟⎠⎞
⎜⎝⎛∆+=∆
where i indexes a prefecture, t indexes a year, X are demand controls, and ti,loans total
loans estate real⎟⎠⎞
⎜⎝⎛∆ is
instrumented with ti,loans total
keiretsu⎟⎠⎞
⎜⎝⎛∆ and its four lags10.
3.2 Results
Table 6 reports the results of the cross-section regression, equation 1. The results are very significant
and imply that those prefectures that experienced a loss in keiretsu loans during the 1980s also
experienced higher land inflation during that period. For a 0.01 decrease in the share of keiretsu loans
to total loans in a prefecture, land inflation increases by 4.7% (column (1)), which is significant at the
1% level. Note that the average share of keiretsu loans is 0.06 during the estimated sample. In column
(3) are the IV results when instrumenting for the real estate loan share with the keiretsu loan share.
10 Note that the variables for keiretsu loans and real estate loans are taken as a proportion of total loans. This is the approach taken by Hoshi (2001). The advantage compared to using growth rates is that the latter can exaggerate the importance of keiretsu loans if a bank starts from a low level. However, the criticism that the captured significant effect of keiretsu loans on real estate loans may stem directly from the construction of the variables is not the case. First, the "total loans" measure used to normalize real estate loans come from summing the 12 components of reported sectoral loans. In contrast, the "total loans" used for keiretsus comes from the total loans measure in a bank's balance sheet. More importantly, no mechanical relation was found when robustness checks were done on other sectoral loans regressed on the keiretsu loans. In fact and as discussed in Section 2.2.2, only loans to real estate increase when keiretsu loans decrease.
14

The estimate is 20.3% and is significant at the 1% level. This suggests that prefectures whose banks
experienced a larger loss in their proportion of keiretsu loans experienced a larger increase in real estate
lending which fuelled land inflation11. Column (5) repeats the analysis but for "risky" loans instead of
real estate loans. Risky loans are defined as the sum of real estate, construction, and non-bank financial
institution loans, which were used to proxy for risky loans by Hoshi (2001). As discussed in Section
2.2.1, a large part of non-bank financial institutions were the "jusen", which were housing loan
subsidiaries of banks. Similar results are obtained: a 0.01 increase in the instrumented share of risky
loans leads to 14.2% higher prefectural land inflation over the period.
It is interesting to contrast the OLS results to the IV results. Column (2) presents the regression of
prefectural land inflation on a prefecture's difference in real estate loan share over the 1981-91 period.
Because the latter is not instrumented, the estimate of 11.5% higher inflation should be interpreted as a
correlation. It is interesting that IV estimation results in almost twice the magnitude with 20.3%. A
similar result is found with risky loans. The OLS coefficient is 4.5% compared to the IV coefficient of
14.2%. That the coefficient is larger when using IV underlies the significance of keiretsu loans in
identifying real estate lending and the latter's independent effect on land prices. One possibility is that a
higher land price also reduces demand for land, which is standard if we ignore the positive effect on net
worth coming from the relaxation of credit constraints. This biases the OLS coefficient downwards.
Another possibility is that a higher land price increases people's expectation of future increases in land
prices (especially in a speculative setting). This leads to an increase in supply of land and construction
and mitigates the OLS estimate.
Columns (6) through (8) report robustness results by including long differences of variables to
control for demographic and economic differences across prefectures (such as job openings to
applications, growth in income per capita, the growth in population, unemployment rate, and CPI
excluding rent). The (instrumented) real estate loan share remains significant at the 1% level but is
reduced in magnitude from 20.3% to 14.9% higher inflation. Similarly, the coefficient on the risky loan
share is reduced but not by much to 13.5%. Apart from a prefecture's population and its job openings
to applications ratio, the remaining macroeconomic controls are insignificant. This may be on account
of the limited degrees of freedom and potential multicollinearity. Another explanation may be that
demand factors were not very responsible for the large increase in land inflation over the period.
Hutchison (1994) finds that aggregate demand disturbances were responsible for only a small part of
the variation in land prices. To summarize, prefectures whose banks lost keiretsu loans increased their
real estate loans (and risky loans more generally). This resulted in 14-20% higher land inflation over the
11 The regressions were also estimated excluding the Tokyo and Osaka prefectures. This is to counter the criticism that the coefficients might simply be capturing that the two largest prefectures had high land inflation rates (for some other reason) coupled with a larger share of loans to keiretsu firms. However, the results remain significant.
15

1981-1991 period for a 0.01 increase in a prefecture's instrumented real estate bank loans as a share of
total bank loans.
Table 7 reports the results of the within regressions that take advantage of the time-series variation
over the period from 1981-1993, equations 2 and 3. The first column reports the simplest regression of
the log difference in real prefectural land price regressed on the (first difference of) the keiretsu loan
share and its 4 lags, accounting for prefecture fixed effects. The results are very significant and imply
that a 0.01 annual decrease (over 5 years) in the share of keiretsu loans to total loans leads to a
subsequent 10% increase in a prefecture's land inflation. Column (2) includes year dummies and the
significance and magnitude of the keiretsu loan loss is reduced yet remains considerable and causes a
6% increase in land inflation.
Column (3) reports the estimates for equation <ref>eq2</ref> using the uninstrumented real estate
loan share. The results confirm the correlation between the increase in land prices and real estate loans
(3.3% higher inflation). Column (4) instruments the contemporaneous real estate loan share with the
keiretsu loan share and its 4 lags. The coefficient on the real estate loans is much larger and coincides
with 27% higher land inflation in a prefecture. However the result is significant only at the 13% level12.
Columns (5) and (6) repeat the analysis for risky loans. Here a 0.01 increase in the instrumented risky
loan share coincides with a 9.5% higher land inflation rate and is significant at the 10% level13.
Finally, demand controls are included in the regressions reported in columns (7) through (12). As in
the cross-section regressions, prefecture-level controls are included (job openings to applications,
growth in income per capita, the growth in population, unemployment rate, CPI excluding rent, as well
as the second lags of house rent and the ratio of rent to residential land price). Also included are Japan-
wide macro controls (changes in unemployment rate, stock market, and population.). Many of these
variables enter with the expected sign. For example, a larger growth in a prefecture's population
contributes to higher land inflation. A prefecture experiencing an increase in its job openings to
applications ratio also has higher land inflation etc. What is important though is that the loss in
keiretsu loans are robust in significance, a 0.01 annual decrease in the share (over 5 years) contributes to
approximately 6% higher land inflation. Note that this estimate is similar to that found in column (2)
which only included year dummies. Also the result is similar whether we look at column (7) or (8).
Column (7) reports a random effects model because some of the prefecture controls are time-
independent and therefore do not allow for fixed effects. Also omitted are the year dummies because
the Japan-level controls are time-varying. 12 It is worth mentioning that the Hausman test for all these models favors random effects over fixed effects (for example the Chi-squared value is 0.27 for the model in column (4)). Random effects is more efficient and the coefficient is estimated to be 18.6 and significant at the 1.2% level. However, fixed effects are reported for ease of understanding the time dimension of the keiretsu shock. 13 Again the random effects model is favored and results in an almost identical coefficient estimate of 9.3, which is significant at the 1% level.
16
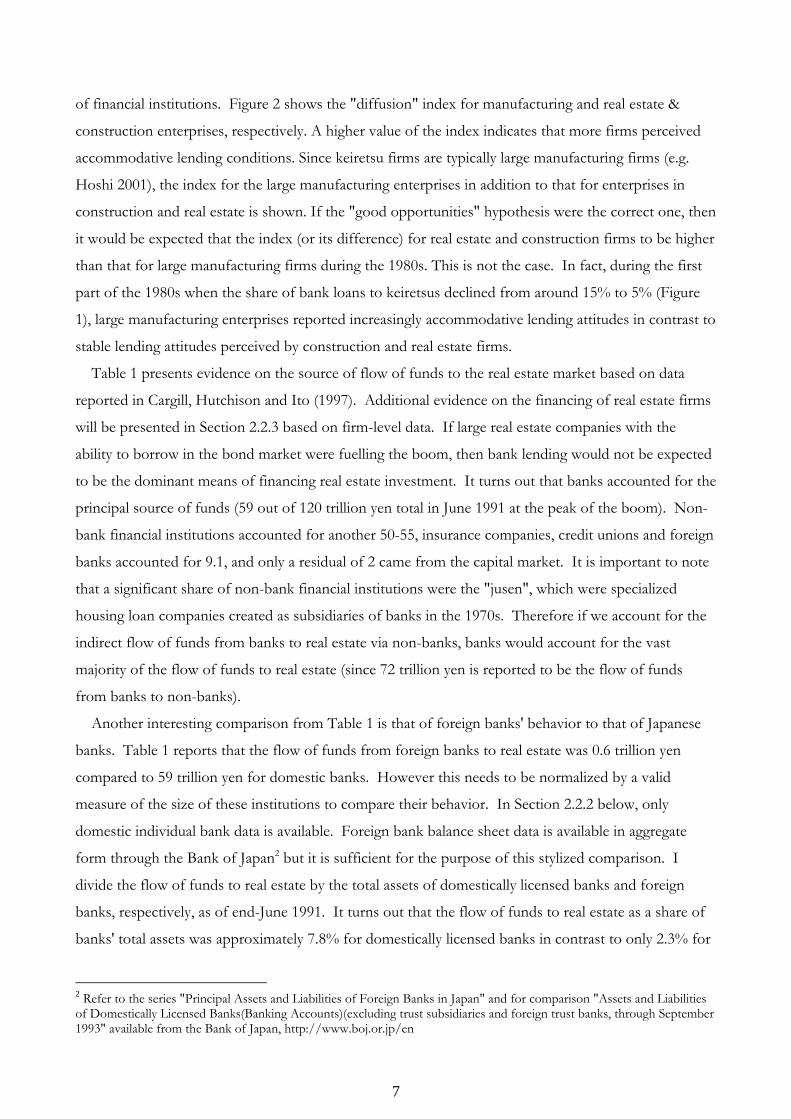
Columns (9) and (10) reestimate the IV regression for real estate loans reported in column (4) but
now with demand controls. The magnitude is reduced from before to 15.7-17.3% higher inflation.
The coefficient of 17.3% from the fixed effects model is now not significant (in column (4) it was only
at the 13% level). Nonetheless the associated random effects model coefficient is 20.9% and significant
at the 5% level (the Hausman test chi-squared is 1.26 favoring the random effects model). Finally
columns (11) and (12) reestimate the IV regression reported in column (6) for instrumented risky loans
with demand controls. The coefficient of 7.9% from the fixed effect model is only significant at the
16% level, while the random effects coefficient on the same model is 9.5% (similar to that reported in
column (6)) and significant at the 1.3% level.
What can therefore be learned from the panel regressions is that the timing of the keiretsu losses
coincides with the subsequent increase in land prices in a prefecture during the period from 1981 to
1993. A 0.01 instrumented increase in a prefecture's real estate loan share corresponds to a 15%-27%
higher land inflation rate (and is particularly significant for the Hausman preferred random effects
model). More generally, a 0.01 instrumented increase in a prefecture's risky loan share (loans to real
estate, construction and non-bank financial institutions) leads to a 6%-9.5% higher land inflation rate.
To get a better sense of how large the implied effect is, it is worth comparing estimates with actual
figures for Japan during the period from 1983 to 1993. The average over Japan's 47 prefectures of the
share of keiretsu loans was 0.06, of real estates loans was 0.08, and of "risky" loans was 0.21. As for
changes in these shares, the average for keiretsu loans was -0.002, for real estate loans was 0.002, and
"risky" loans was 0.007. At the same time, the average (real) land inflation rate in Japan was 0.064
(6.4%). A simple calculation combining the coefficient estimates from model 7.3 (i.e. the one reported
in Table 7, column (3)) and these average figures, implies that the average increase in real estate loans of
0.002 would lead to inflation increase of 0.008. But this model is not appropriate because it does not
instrument for real estate lending with keiretsu loans. When using the IV coefficients from model 7.4,
the implied inflation rate coming from real estate lending is 0.0618, almost identical to the actual figure
in Japan. A similar figure of 0.0617 is derived from risky lending from Model 7.6. Looking specifically
at Tokyo, where the average actual inflation rate was 0.108, the implied rate from model 7.4 is higher at
0.166. Overall these results suggest a large but not unrealistic effect of bank credit on land prices.
Figure 5 shows the time-variation in the Japan-wide average land inflation rate and the predicted
rates based on the uninstrumented real estate loans (model 7.3) and on the instrumented real estate
loans (model 7.4). As calculated above, the average land inflation over the time period 1983-1993
predicted by the instrumented real estate loans regression is similar to the actual one. What is
interesting is to look specifically at the time series and to note the ability of the exogenous real estate
lending by banks to predict well the actual land inflation rate (this is also the case for risky loans). The
predicted component tends to lead the actual rate during the 1980s boom. As expected by the
17

underlying hypothesis, this shock was most relevant during the mid to late 1980s. Note that the
predicted land inflation coming from the uninstrumented real estate lending does not do a good job at
capturing the actual path of land inflation. Its effect is small.
In short, the analysis has shown that shocks to the supply of credit fuel land prices. The effect is
considerably but not unrealistically large. The main result can be seen in two slices of the data. First,
prefectures whose banks lost keiretsu loans increased their real estate loans and this led to 14-20%
significantly higher land inflation compared to other prefectures (for a 0.01 increase in a prefecture's
instrumented real estate bank loans as a share of total bank loans). Second, the timing of the keiretsu
loan loss coincides with the increase in land prices at the prefecture level.
4 Conclusion
The history of the Japanese financial system runs contrary to popular opinion about its uniqueness in
its emphasis on banks. This has been a relatively recent phenomenon. The history of the system
evolved as an outcome of regulatory changes which in turn were endogenous to macroeconomic
shocks. Among the more important shocks to the Japanese economy were World War II and the oil
shocks in the 1970s (see Hoshi and Kashyap 2001). It is interesting that from the Meiji restoration to
the 1930s, firms (including MSEs) received most of their funding through the capital market in the
form of bonds and stocks. For example, this share reached 70% in 1935 (Ueda 1994). The
government's motivation to restrict competition was a result of the 1930s and war. It was at this time
that the government took control of the allocation of credit and used the banks to implement its
preference towards funding the military. During the Japanese miracle period from the 1950s to the
early 1970s, the government's priority shifted away from military to industry. As a result, the system
did not revert to the prewar emphasis on capital markets. The savings restrictions on households
guaranteed the flow of funds to the banks which in turn channeled them to large industrial companies -
- mostly keiretsus.
Japan liberalized its financial system in the 1980s. As part of this deregulation, large and known
firms reduced their borrowing from banks. In the first part of this paper I test the Hoshi and Kashyap
hypothesis, i.e. the idea that the development of the Japanese corporate bond market caused an
exogenous fall in demand for bank loans, which then fuelled an increase in bank real estate lending. I
find evidence consistent with the HK hypothesis using firm-level and bank-level data. There is no
support for the alternative "good opportunities" hypothesis, which is that real estate had (or was
perceived to have) good opportunities, rationalizing a shift of bank lending towards the real estate
sector during the 1980s. There is no evidence that it was an increase in real estate demand that caused
real estate lending to rise. Therefore it was a choice by keiretsu firms to move away from banks. One
18

question remains however and it is why did banks shift their lending to real estate? Faced with a
decrease in demand for bank loans from keiretsus, they could look for other types of loans, invest in
government bonds, look for foreign opportunities, or choose to reduce deposit rates and shrink. I
evaluate each of these competing alternatives and find none to be a major explanation. While banks
that lost their keiretsu customers had excess funds, did begin to shrink and pursue other alternatives,
their principal substitute was to increase lending to real estate. Hoshi and Kashyap (2001) argue that
this is on account of the incomplete and slow financial deregulation that ensured that household
savings continued to be directed to banks at the same time as a policy of interest rate controls was
maintained and government assumed banks' credit risk. Ueda (1994) contends that banks actively
competed for real estate-related loans because credit analysis was considered easy as it consisted of
forecasting future land prices. The latter had not fallen throughout the postwar period suggesting that
banks wrongly perceived low volatility in real estate.
Therefore the HK hypothesis can be applied to help answer the question motivating this paper.
What is the effect, if any, of bank credit on asset prices? The Japanese real estate boom during the
1980s provides the appropriate setting and some answers to this ongoing debate. I use a bank's
keiretsu loan loss as an instrument for the supply of real estate loans. First, in the beginning of the
paper this shock is shown to be exogenous and not a result of movements in land prices and demand.
Second, it is highly correlated with banks' subsequent lending shift to real estate. Taking advantage of
both the cross-sectional and time-series variation in Japan's 47 prefectures' land prices, this paper
explains the Japanese real estate boom. Shocks to the supply of bank credit fuel land prices. First, a
0.01 increase in a prefecture's instrumented real estate loans as a share of total loans causes 14-20%
higher land inflation over the 1981-1991 period. Second, the timing of keiretsu loan losses coincides
with subsequent land inflation in a prefecture. For example, from 1983 to 1993 the average predicted
land price inflation coming from IV real estate lending is close to the Japan-wide average land price
inflation during this period of 6.4 percent annually.
That the supply of credit can have such a large impact on asset prices has implications for both
monetary policy and regulatory policy. If there were no imperfections in credit markets, banks'
willingness to offer loans would have no impact on asset prices. But in the presence of credit
constraints and in the short run, a shock like incomplete financial deregulation can amplify its effect on
asset prices. This can be true even if financial liberalization eases credit market imperfections in the
long run. I elaborate on this point in Appendix 1, which is based on an extension of the Kiyotaki and
Moore (1997) model. The idea behind this paper can be captured by shocks to lending limits, not
originating in shocks to productivity as in the original Kiyotaki and Moore framework. Because durable
assets play a dual role: they are both factors of production and collateral for loans, credit limits are
19

affected by the price of these assets14. However, allowing for shocks to lending implies that asset prices
(and asset holdings) are also affected by shocks to credit limits. It therefore matters for asset valuations
how willing banks are to finance projects which involve the purchase of assets such as land. A credit
cycle is created when banks ease binding credit limits independent of firms' net worth, allowing them to
borrow more, invest more in the asset and in the process increase the price of the asset.
The main contribution of this paper is in identifying the role of bank credit in fuelling real estate
prices, using an instrument for the supply of real estate loans. I am then able to apply the analysis to
disaggregated data, which is also new to the best of my knowledge. Ito and Iwaisako (1996) find a role
for bank loans in explaining land price inflation, but their analysis is on aggregate data using a VAR
approach. More recently and in a paper on bank lending and property prices in Hong Kong using
aggregate data, Gerlach and Peng (2005) find instead that the direction of influence goes from property
prices and demand to bank credit. A paper by Peek and Rosengren (2000) that studied an exogenous
(originating in Japan) negative loan supply shock's effect on 3 US states is closest to mine. They find
that the real decline in Japanese bank lending contributed to a substantial decline in new construction
projects in the US.
What lessons for monetary and regulatory policy are to be drawn? As mentioned earlier and if credit
markets were perfect, then there would be no effect of bank credit on real asset prices. The latter
would only depend on the discounted flow of future income deriving from the asset. In reality
however, credit markets are imperfect and even a move towards financial liberalization can in the short
run amplify the effect of credit on asset prices. This is especially true in the case of Japan that
underwent incomplete and slow financial deregulation over two decades. The resulting "over-banking"
problem (as dubbed by Hoshi and Kashyap) that has characterized the Japanese banking system is
gradually being resolved as banks begin to merge and shrink. If the process of liberalization had been
more complete and faster, the wrong incentives would not have materialized to cause banks to shift
lending disproportionately to real estate. Ito (2004) calls for the supervisory regime to have been
strengthened in Japan in the 1980s to ensure stricter prudential guidelines (on real estate lending) when
the regulatory regime began to allow for more competition. With the benefit of hindsight, such a move
can be well justified. That said, central banks continue to struggle with appropriate policy when there is
asset price inflation and little goods inflation. More research is needed but the results of this paper
suggest that banks can actively contribute to asset inflation.
14 It is for this reason that a positive productivity shock causes the constrained borrowers to demand more credit and invest more. In contrast, the first-best allocation is not affected and the only outcome is that agents increase their consumption.
20
References
Anderson, Christopher W. and Anil K. Makhija. (1999). "Deregulation, Disintermediation, and Agency
Costs of Debt: Evidence from Japan." Journal of Financial Economics 51, 309-339.
Aoki, Masahiko and Hugh Patrick, eds. (1994). The Japanese Main Bank System: Its Relevance for
Developing and Transforming Economies. Oxford and New York: Oxford University Press.
Cargill, Thomas F., Michael M. Hutchison, and Takatoshi Ito. (1997). The Political Economy of
Japanese Monetary Policy. Cambridge and London: MIT Press.
Cargill, Thomas F., Michael M. Hutchison, and Takatoshi Ito. (2000). Financial Policy and Central
Banking in Japan. Cambridge and London: MIT Press.
The Economist. (March 6, 2003). "Betting the House."
The Economist. (April 24, 2003). "Through the Roof in Australia."
Gelos, R. Gaston and Alejandro M.Werner. (2002). "Financial Liberalization, Credit Constraints, and
Collateral: Investment in the Mexican Manufacturing Sector." Journal of Development Economics 67,
1-27.
Gerlach, Stefan and Wensheng Peng. (2005). "Bank Lending and Property Prices in Hong Kong."
Journal of Banking and Finance 29, 461-481.
Hall, Brian J. and David E. Weinstein. (2000). "Main Banks, Creditor Concentration, and the
Resolution of Financial Distress in Japan." In Finance, Governance, and Competitiveness in Japan,
edited by Masahiko Aoki and Gary R. Saxonhouse, pp. 64-80. Oxford and New York: Oxford
University Press.
Hanazaki, Masaharu and Akiyoshi Horiuchi. (2000). "Is Japan's Financial System Efficient?" Oxford
Review of Economic Policy 16, 61-73.
21

Hayashi, Fumio. (2000). "The Main Bank System and Corporate Investment: An Empirical
Reassessment." In Finance, Governance, and Competitiveness in Japan, edited by Masahiko Aoki and
Gary R. Saxonhouse, pp. 81-97. Oxford and New York: Oxford University Press, 2000.
Hirota, Shin'ichi. (1999). "Are Corporate Financing Decisions Different in Japan? An Empirical Study
on Capital Structure." Journal of the Japanese and International Economies 13, 201-229.
Hoffmaister, Alexander W. and Garry J. Schinasi. (1994). "Asset Prices, Financial Liberalization and the
Process of Inflation in Japan." IMF Working Paper 94/153, International Monetary Fund, December
1994.
Hoshi, Takeo. (1996). "The Impact of Financial Deregulation on Corporate Financing." In Japanese
Firms, Finance and Markets, edited by Paul Sheard, pp.222-248. Melbourne, Australia: Addison-Wesley,
1996.
Hoshi, Takeo. (2001). "What Happened to Japanese Banks?" Monetary and Economic Studies 19, 1-29.
Hoshi, Takeo and Anil K. Kashyap. (2000). "The Japanese Banking Crisis: Where Did It Come from
and How Will It End?" In NBER Macroeconomics Annual 1999, edited by Ben S. Bernanke and Julio
J. Rotemberg, pp. 129-201. Cambridge and London: MIT Press.
Hoshi, Takeo and Anil K. Kashyap. (2001). Corporate Financing and Governance in Japan: The Road
to the Future. Cambridge and London: MIT Press.
Hoshi, Takeo and Hugh Patrick. (2000). "The Japanese Financial System: An Introductory Overview."
In Crisis and Change in the Japanese Financial System, edited by Takeo Hoshi and Hugh Patrick, pp. 1-
33. Boston, Dordrecht and London: Kluwer Academic.
Hoshi, Takeo, Anil K. Kashyap, and David S. Scharfstein. (1990). "Bank Monitoring and Investment:
Evidence from the Changing Structure of Japanese Corporate Banking Relationships." In Asymmetric
Information, Corporate Finance, and Investment, edited by R. Glenn Hubbard, pp. 105-126. Chicago
and London: University of Chicago Press.
Hoshi, Takeo, Anil K. Kashyap, and David S. Scharfstein. (1991). "Corporate Structure, Liquidity, and
Investment: Evidence from Japanese Industrial Groups." Quarterly Journal of Economics 106, 33-60.
22

Hoshi, Takeo, Anil K. Kashyap, and David S. Scharfstein. (1993). "The Choice Between Public and
Private Debt: An Analysis of Post-Deregulation Corporate Financing in Japan." NBER Working Paper
4421, National Bureau of Economic Research, August 1993.
Hutchison, Michael M. (1994). "Asset Price Fluctuations in Japan: What Role for Monetary Policy?"
Monetary and Economic Studies 12, 61-83.
Ito, Takatoshi. (2004). "Retrospective on the Bubble Period and its Relationship to Developments in
the 1990s." In Japan's Lost Decade, edited by Gary R. Saxonhouse and Robert M. Stern, pp. 17-34.
Malden, Oxford and Victoria: Blackwell Publishing Ltd.
Ito, Takatoshi and Tokuo Iwaisako. (1996). "Explaining Asset Bubbles in Japan." Monetary and
Economic Studies 14, 143-193.
Kindleberger, Charles. (1978). "Manias, Panics and Crashes: A History of Financial Crises." In Financial
Crises: Theory, History and Policy, edited by Charles Kindleberger and J. Laffarge. Cambridge:
Cambridge University Press.
Kitagawa, Hiroshi and Yoshitaka Kurosawa. (1994). "Japan: Development and Structural Change of the
Banking System." In The Financial Development of Japan, Korea, and Taiwan: Growth, Repression,
and Liberalization, edited by Hugh T. Patrick and Yung Chul Park, pp. 81-128. New York and Oxford:
Oxford University Press.
Kiyotaki, Nobuhiro and John Moore. (1997). "Credit Cycles." Journal of Political Economy 105, 211-
248.
Lincoln, Edward. (1998). "Japan's Financial Problems." Brookings Papers on Economic Activity 2, 347-
375.
Nakajima, Zenta and Hiroo Taguchi. (1995). "Toward a More Stable Financial Framework." In
Financial Stability in a Changing Environment, edited by K. Sawamoto. St. Martin's.
23

Okina, Kunio, Masaaki Shirakawa, and Shigenori Shiratsuka. (2001). "The Asset Price Bubble and
Monetary Policy: Japan's Experience in the Late 1980s and the Lessons." Monetary and Economic
Studies Special Edition, 395-450.
Peek, Joe and Eric S. Rosengren. (2000). "Collateral Damage: Effects of the Japanese Bank Crisis on
Real Activity in the United States." American Economic Review 90, 30-45.
Petersen, Mitchell A. and Raghuram G. Rajan. (2002). "Does Distance Still Matter? The Information
Revolution in Small Business Lending." Journal of Finance 57, 2533-2570.
Rajan, Raghuram G. (1992). "Insiders and Outsiders: The Choice between Informed and Arm's-Length
Debt." Journal of Finance 47, 1367-1400.
Teranishi, Juro. (1994). "Japan: Development and Structural Change of the Financial System." In The
Financial Development of Japan, Korea, and Taiwan: Growth, Repression, and Liberalization, edited by
Hugh T. Patrick and Yung Chul Park, pp.27-80. New York and Oxford: Oxford University Press.
Tsuru, Kotaro. (2001). "The Choice of Lending Patterns by Japanese Banks During the 1980s and
1990s: The Causes and Consequences of a Real Estate Lending Boom." IMES Discussion Paper 2001-
E-8, Institute for Monetary and Economic Studies, Bank of Japan.
Ueda, Kazuo. (1994). "Institutional and Regulatory Frameworks for the Main Bank System." In The
Japanese Main Bank System: Its Relevance for Developing and Transforming Economies, edited by
Masahiko Aoki and Hugh Patrick, pp. 89-108. Oxford and New York: Oxford University Press.
Ueda, Kazuo. (2000). "Causes of Japan's Banking Problems in the 1990s." In Crisis and Change in the
Japanese Financial System, edited by Takeo Hoshi and Hugh Patrick, pp. 59-81. Boston, Dordrecht and
London: Kluwer Academic.
Weinstein, David E. and Yishay Yafeh. (1998). "On the Costs of a Bank-Centered Financial System:
Evidence from the Changing Main Bank Relations in Japan." Journal of Finance 53, 635-672.
24

Appendix 1
Extending the Kiyotaki and Moore Framework: Shocks to Lending Limits
The Kiyotaki and Moore Model
It is possible to analyze the effect of shocks to bank credit in the credit cycles framework presented
in Kiyotaki and Moore (1997), hereafter KM15. They impose a Hart-Moore limited commitment
condition. Therefore "farmers" ("gatherers" are the unconstrained other group) face an endogenous
credit limit given by :
)4(,1 ttt kqRb +≤
where q is the relative price of land to traded "fruit", R is the gross interest rate, b is debt, and k
is the asset (landholdings) . This constraint will bind in equilibrium and farmers will borrow up to the
limit. It can be shown that farmers' aggregate landholdings and borrowing will equal, respectively:
( )[ ] )5(,11
11
1
−−
+
−+−
= ttt
tt
t RBKqaq
Rq
K
)6(,11 ttt Kq
RB +=
where the term in square brackets of the land equation is the farmers' net worth and the term in the
denominator is the user cost of holding land (u), the gap between the purchase price of land and the
amount that a farmer can borrow against each unit of land. Shocks to productivity in KM are captured
by shocks to a.
The farmers' landholdings equation implies there will be an upward sloping demand for capital. For
example, if present and future land prices, qt and qt+1, increase by 1 % (implying that ut also increases by
1 %), then farmers' demand for Kt would also increase (conditional on R Bt-1 > a Kt-1). The intuition is
that farmers' net worth is increasing more than proportionately with qt because of the leverage effect of
outstanding debt.
The aggregate productivity will be endogenous in such a credit-constrained economy. KM focus on
shocks to productivity affecting credit-constrained farmers' net worth, which lead to shocks to their
15 Among the empirical support for the KM view is a recent paper by Gelos and Werner (2002) which studies the effect of financial deregulation in Mexico on firm investment. They find that cash flow is correlated with investment and that the value of a firm's real estate has a large effect on investment. After liberalization in 1989, real estate as collateral has become even more important in Mexico.
25

asset demand leading to shocks to asset prices that in turn affect the amount of lending to these firms.
Linearizing around the steady state16, it can be shown that for a temporary increase in productivity by
∆a at time t:
)7(,1∆≅
∧
ηtq
)8(,11
111
1∆⎟⎟⎠
⎞⎜⎜⎝
⎛−
++
≅∧
ηη
RRK t
where η>0 is the elasticity of the residual supply of land to the farmers with respect to the user cost at
the steady state. If η =0 there is an inelastic supply and the shock does not persist into the future. The
dynamic interaction between credit limits and asset prices can be important in amplifying the initial
shock. The multiplier in the equation is greater than one. If there were no dynamic multiplier
(suppose that q
tK∧
t+1 was artificially pegged at q*), the effect from the static multiplier will be smaller:
)9(,11∆
−≅
∧
ηRRqt
)10(.∆≅∧
tK
Shocks to Lending Limits
The spirit of this paper can be captured by shocks to lending limits, not originating in shocks to
productivity as in KM. This view is also highlighted by Ito and Iwaisako (1996). Using aggregate
Japanese data they find that, first, the aggregate growth of bank loans to real estate has high explanatory
power for land returns (in a VAR framework). Second, they find comovement between stock and land
prices, with stock returns leading land returns empirically. Finally, they suggest that it was an irrational
bubble, though the initial shock may have been a shock to fundamentals. They suggest a hypothesis
that emphasizes the KM relationship between the collateral value of land and the cash flow of credit-
constrained firms but where the KM productivity shock is not the full story. Because of liquidity
constraints, it matters how much banks are also willing to finance projects that require the acquisition
of land.
One way to capture such a shock is mentioned in KM. If the economy experiences an unanticipated
one-time reduction in the value of its debt obligations at time t such that: 16 .X define *
*
XXX t −=
∧
26

[ ] [ ] )11(,**1 KqKqERBE ttt == +
)12(,11 actualbut **KqR
RRBt ⎥⎦⎤
⎢⎣⎡ −
∆−=
then the results will be the same for and as before. Intuitively, a reduction in the value of their
debt obligations of only (R-1)/R percent is needed to have the same effect as a one percent
productivity shock because farmers' outstanding debt to tradable output in steady state is equal to
RB
tq∧
tK∧
*/aK* = R/(R-1).
An alternative shock can be an ex ante shock to borrowing limits. Suppose there is a one-time shock
to collaterizable land at time t so that:
( ) )13(,1 ttt kqRB ∆+= +
where I have assumed that the borrowing constraint continues to bind. Therefore the path of K will
be:
[ ] )14(,1 **
1Kqqa
Rq
qK t
tt
t −+∆+
−=
+
[ ] )15(,12
1
1 tt
t
t Ka
Rq
qK ∆−
−=
++
+
)16(2. sfor ,11
1≥
−= −+
+++
+ stst
st
st aK
Rq
qK
The dynamics are more complicated. Suppose the static multiplier is isolated. This implies that:
)17(,111∆⎟⎠⎞
⎜⎝⎛
∆−−
≅∧
aRRRqt η
)18(,1∆
∆−≅
∧
aRK t
which is similar to the static result above except for the term 1/(aR - ∆). Therefore and are no
longer unambiguously positive for a positive shock ∆. This is because a one-time shock to borrowing
limits implies that the debt repayment will be higher in the following period. For there to be a positive
tq∧
tK∧
27

effect on land prices and landholdings, it must be that a >∆/R or the marginal product of farmers' land
(the tradable part of output) exceed the additional debt taken at time t for each unit of land.
Simulations
To get a sense of the order of magnitude of the various shocks, consider a 1 percent increase in
productivity in period t, ∆=0.01. I use the same parameter values employed by KM when they simulate
a more complicated quarterly model: R=1.01 (a 4 percent annual interest rate), a=1 (normalization), and
η=0.1.
Allowing for dynamic effects implies that on impact, the land price increases by 10 percent and
landholdings by 92 percent. While these are very large magnitudes, there is almost no persistence and
the peak is on impact. After a quarter, the land price increase is only 0.9 percent and landholdings
increase 8 percent. After two quarters, the land price increase is only 0.08 percent and landholdings
increase 0.7 percent. With a land elasticity of 100 percent, η=1, there will be a more persistent effect
on landholdings (period t, t+1, t+2: 51 %, 26 %, and 13 % respectively) and a reduced effect on land
prices (period t, t+1, t+2: 1 %, 0.5 %, and 0.25 %). If the static effect is isolated, land prices increase
by only 0.1 percent (compared to 10 percent with dynamics) and landholdings increase by only 1
percent. This confirms that the dynamic multiplier accounts for the large increase at impact.
If this shock is interpreted as a one-time reduction in the value of debt obligations, then it will only
need to decrease by ∆(R-1)/R=0.01 percent. The resulting effect will be identical to a 1 percent
increase in productivity, because of the leverage effect discussed above. As interest rates in the
economy fall, then the debt reduction necessary to obtain the same effect on land prices and
landholdings will be even smaller.
If the shock is to borrowing limits, so that at time t farmers take on additional debt of 1 percent,
then the static effect will be the same as the static multiplier for an increase in productivity of 1 percent.
This is because the parameters are such that the extra term has no effect, 1/(aR-∆)=1. So that allowing
for additional debt of 1 percent implies that land prices increase by 0.1 percent. What is different from
the productivity shock is that allowing for dynamics does not change the initial impact much and the
later dynamics are close to zero and negative. This is on account of the one-time nature of the shock
because the debt has to be repaid in the following period.
All these simulations result in a large (too large) effect at the time of the shock and very little
persistence. Therefore to obtain persistent cycles and decrease the contemporaneous response, KM
impose two additional assumptions. First, they introduce a reproducible and depreciating asset (trees)
which reduces the leverage effect and makes investment positive, reinforcing persistence. Second, they
introduce lumpy investment which causes further persistence and can lead to endogenous cycles
28
because it uncouples farmers' aggregate borrowing from their aggregate landholdings. In such a model,
they find that a one percent increase in productivity (and setting some additional parameters for
investment and lumpiness) implies that the land price increases by 0.37 %, landholdings by 0.1 %, and
debt by 0.13 % at time t. The land price increase reaches a maximum at impact, compared to
landholdings and debt which peak after seven quarters at 0.37 % and 0.55 % respectively.
In short, in the KM model durable assets play a dual role: they are factors of production, but are also
used as collateral for loans, so that credit limits are affected by the price of these assets. I have also
shown that allowing for shocks to lending implies that asset prices (and asset holdings) are affected by
shocks to credit limits.
Appendix 2
Financial Regulation and Deregulation in Japan
Banks and Households
The Japanese economy was characterized by interest rate controls (TIRAL), which were effective
from 1947 until 1992. While these were controls on deposit rates, they were accompanied by loan rate
restrictions to ensure that long-term credit banks earned profits. Certain implications of interest rate
controls on banks' profitability have been highlighted by Hoshi and Kashyap (2001) and Kitagawa and
Kurosawa (1994). Hoshi and Kashyap argue that the increase in fraction of assets lent out by banks
reflects their attempting to make up through volume the reduction in margins they received on loans
during the period of deregulation. Kitagawa and Kurosawa echo this view that the objective of banks
was not profit but scale. However they also suggest that the two may have been equivalent in Japan at
the time. For example, because of the policy of ensured profit margins, as profit margins fell banks
increased scale. Another policy was the discount window guidance given by the Bank of Japan at a
lower rate than the interbank call market. The discount rate at which the Bank of Japan lent funds to
banks was essentially a subsidy proportional to a bank's size. Aside from these incentives, there is the
possibility that banks were in fact not profit maximizing but directly maximizing scale due to social
status, a branch manager's promotion ambitions and so on.
The Japanese banking system was also characterized by regulation limiting bank entry, branch
growth restrictions, regional segmentation, and bank segmentation from non-banks. For example,
Ueda (1994) notes that opening a new branch required permission from the Ministry of Finance. He
argues that long-term and trust banks were more severely affected by the loss of manufacturing firms
because of their low branch to loan figure.
29

In addition to restrictions on banking activity, households had limited savings options. Household
savings did eventually shift to insurance and pensions companies, albeit slowly because of slow
deregulation (Hoshi and Kashyap 2001; Kitagawa and Kurosawa 1994). The share of household funds
at banks fell from 60-80 % in 1960s and 1970s to 40-50 % in late 1980s. From 1980-86, 72 % of the
increase in savings was deposited at insurance companies and the rest at banks (Kitagawa and
Kurosawa 1994). So although, as a share of GDP, deposits at banks did continue to increase during the
1980s, the overall increase in savings was even larger. The Big Bang in 1998 further deregulated the
foreign exchange law and allowed residents to directly open accounts in foreign institutions abroad.
This led to a large capital outflow (Cargill et al. 2000).
Firms
Corporate finance regulation was also extensive. There were restrictive bond issuance criteria (BIC)
in place which were based on accounting criteria initially (refer to Appendix Table 3). Only in 1990
were the accounting criteria removed and the criteria limited to a firm's rating (of BB or higher). In
1979, only two firms satistifed the BIC for domestic issues of unsecured straight bonds and unsecured
convertible bonds (Matsushita Electric and Toyota Motors). By 1989, about 300 companies were
eligible to issue unsecured straight bonds and 500 companies to issue unsecured convertible bonds
(Hoshi et al. 1993 based on Nomura Securities).
The relaxation of the foreign exchange law in 1980 allowed firms to issue bonds in foreign markets
without explicit government approval. This triggered the easing of the domestic BIC. Prior to 1980,
only Japanese banks were allowed to manage firms' collateral as trustees for the bondholders. This led
to high fees charged by banks. Banks were also members of the bond issuance committee. The
foreign exchange law revision in 1980 coupled with the increase in the supply of goverment bonds due
to increased government financing needs after the oil shocks in the late 1970s helped relax domestic
controls on bond finance. For example, total funds raised in overseas markets in 1981 exceeded 1.4
trillion Yen, almost three times the 1975-79 average of 560 million Yen. As a fraction of all securities
issued by Japanese corporations, overseas issues rose from under 20% prior to 1980 to almost 50% by
1985 (cited in Weinstein and Yafeh 1998).
30
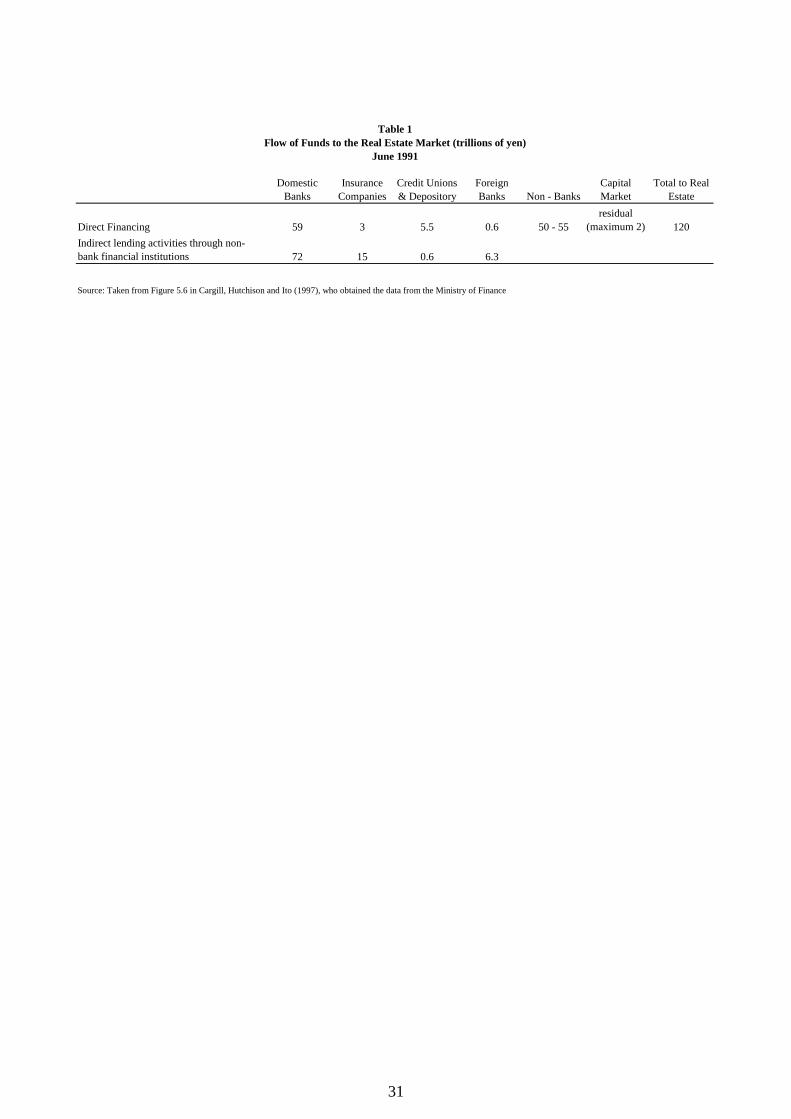
31
Domestic Banks
Insurance Companies
Credit Unions & Depository
Foreign Banks Non - Banks
Capital Market
Total to Real Estate
Direct Financing 59 3 5.5 0.6 50 - 55residual
(maximum 2) 120Indirect lending activities through non-bank financial institutions 72 15 0.6 6.3
Source: Taken from Figure 5.6 in Cargill, Hutchison and Ito (1997), who obtained the data from the Ministry of Finance
Table 1Flow of Funds to the Real Estate Market (trillions of yen)
June 1991

(1)a (2) (3) (4)
Dependent variable: first difference of:Deposit interest rate
Regressors
Prefecture land inflation, lag 1b 0.0086*** 0.0086*** 0.0078*** -0.0024***(0.0016) (0.0016) (0.0016) (0.0006)
Prefecture land inflation, lag 2 -0.0013 -0.0008 -0.0005 0.0015**(0.0017) (0.0017) (0.0017) (0.0006)
Year 1983 -0.0025** -0.0024* -0.0023 -0.0095***(0.0012) (0.0012) (0.0015) (0.0004)
Year 1984 -0.0034*** -0.0015 -0.0038*** -0.0062***(0.0011) (0.0013) (0.0013) (0.0004)
Year 1985 -0.0017 -0.0017 -0.0022* -0.0049***(0.0012) (0.0013) (0.0013) (0.0004)
Year 1986 0.0016 0.0026* 0.0014 -0.0056***(0.0012) (0.0013) (0.0013) (0.0004)
Year 1987 0.0035*** 0.0037*** 0.0029* -0.0113***(0.0012) (0.0012) (0.0017) (0.0004)
Year 1988 -0.0004 0.0000 -0.0004 -0.0079***(0.0011) (0.0012) (0.0015) (0.0004)
Year 1989 0.0008 0.0007 0.0010 -0.0058***(0.0011) (0.0012) (0.0013) (0.0004)
Keiretsu loan share, first diff, lag 1 -0.0163* -0.0111 -0.0060 0.0019(0.0088) (0.0093) (0.0100) (0.0033)
Keiretsu loan share, first diff, lag 2 -0.0464*** -0.0401*** -0.0253** 0.0222***(0.0110) (0.0117) (0.0126) (0.0041)
Keiretsu loan share, first diff, lag 3 -0.0358*** -0.0365*** -0.0272* 0.0115***(0.0114) (0.0121) (0.0146) (0.0043)
Keiretsu loan share, first diff, lag 4 -0.0341*** -0.0329*** 0.0139 0.0247***(0.0109) (0.0112) (0.0160) (0.0041)
Interest on loans - Interest on deposits to total assets (first diff, lag 1) -0.1348(0.1159)
Interest on loans - Interest on deposits to total assets (first diff, lag 2) -0.3510***(0.1235)
Interest on loans - Interest on deposits to total assets (first diff, lag 3) 0.1011(0.1276)
Interest on loans - Interest on deposits to total assets (first diff, lag 4) -0.2551**(0.1245)
Deposit rate (first diff) 0.1373(0.1037)
Loan rate (first diff) -0.1193(0.0812)
Deposit rate (first diff) * Keiretsu loan share (first diff, lag 1) 0.8638(1.5868)
Deposit rate (first diff) * Keiretsu loan share (first diff, lag 2) 1.7107(1.1723)
Deposit rate (first diff) * Keiretsu loan share (first diff, lag 3) 2.0725(1.4613)
Deposit rate (first diff) * Keiretsu loan share (first diff, lag 4) -1.6570(1.3753)
Loan rate (first diff) * Keiretsu loan share (first diff, lag 1) 0.2324(2.0113)
Loan rate (first diff) * Keiretsu loan share (first diff, lag 2) -0.3579(1.0428)
Loan rate (first diff) * Keiretsu loan share (first diff, lag 3) -0.1702(1.9285)
Loan rate (first diff) * Keiretsu loan share (first diff, lag 4) 3.7731*(2.0532)
Constant 0.0034*** 0.0032*** 0.0043*** 0.0053***(0.0009) (0.0009) (0.0011) (0.0003)
Observations 1200 1200 1200 1200Number of Banks 150 150 150 150R-squared 0.11 0.12 0.13 0.49
Real estate loans to total loansDependent variable: first difference of:
Table 2Bank Regressions: Testing The Hoshi-Kashyap Hypothesis
1983-1990
***, **, and * denote significance at the 1%, 5%a Column (1) is similar model to that in Hoshi (2bPrefecture land inflation refers to the land inflatNote:
This table presents results from fixed effects regr
, and 10% levels, respectively.001) Table 9 column 1ion in the prefecture (among 47 prefectures) in which a bank is headquartered.
essions. Standard errors are reported in parentheses.
32

Table 3
Bond Issuance Eligibility for Domestic Secured Convertible Bonds
1976 1977 1978 1979 1980 1981 1982 1983 1984 1985 1986 1987 1988 1989 1990
Number of companies eligible 65 378 422 496 559 616 671 675 727 799 819 855 1084 1247 1374
As a share of total companies (in %) 21.5 25.0 27.3 31.8 35.5 38.6 41.3 41.1 43.9 47.9 49.0 51.7 63.4 68.2 71.7
Source: The figures come from author's calculations based on the accounting criteria effective in Japan from October 1976-December 1990. These criteria are given in Table A3. The underlying accounting data comes from the Development Bank of Japan Corporate Finance Data Set for listed Japanese companies. Therefore "total companies" refers to the entire sample of companies with accounting data available in a given year. Note that convertible bonds were the principle source of public debt financing during the 1980s and these criteria were also applied to foreign issues of convertible bonds (refer to Hoshi, 1996).
33

Dependent variable: Bank loans as a Share of a Firm's Total Debt (1) (2)
Regressors
Eligible to issue bonds dummy (BIC), first lag -0.0732*** -0.0499***(0.0056) (0.0079)
Year 1977 0.2871***(0.0203)
Year 1978 0.2533***(0.0098)
Year 1979 0.2345***(0.0096)
Year 1980 0.2292***(0.0094)
Year 1981 0.2484***(0.0092)
Year 1982 0.2431*** 0.2298***(0.0090) (0.0123)
Year 1983 0.2276*** 0.2198***(0.0090) (0.0120)
Year 1984 0.1967*** 0.1871***(0.0089) (0.0113)
Year 1985 0.1761*** 0.1681***(0.0087) (0.0113)
Year 1986 0.1391*** 0.1438***(0.0085) (0.0126)
Year 1987 0.0786*** 0.0968***(0.0082) (0.0116)
Year 1988 0.0506*** 0.0671***(0.0081) (0.0100)
Year 1989 0.0238*** 0.0378***(0.0077) (0.0089)
Year 1990 0.0059 0.0050(0.0073) (0.0081)
Prefecture land inflation -0.0044(0.0146)
Prefecture land inflation, first lag -0.0312**(0.0135)
Leverage (ratio of debt to assets), first lag -0.4056***(0.0547)
Collateral (financial investments to assets), first lag 0.3339***(0.1002)
Total assets, first lag 7.72x10⁻¹¹***(1.87x10⁻¹¹)
Variables used to determine bond issuance criteria from 1976-1990Net worth, first lag -2.13x10⁻¹⁰**
(8.28x10⁻¹¹)Dividend per share, first lag -0.0002
(0.0002)Net worth to assets, first lag -0.3454***
(0.0660)Net worth to paid-in-capital, first lag 0.0005
(0.0058)Business profits to assets, first lag -1.0428***
(0.1136)Ordinary after tax profit per share, first lag 0.0001*
(0.0000)Constant 0.5758*** 0.8055***
(0.0072) (0.0416)
Observations 9269 6273Number of firms from DBJ database 1291 1138R-squared 0.27 0.27
Table 4Firm Regressions: Testing The Hoshi-Kashyap Hypothesis
1977-1991
***, **, and * denote significance at the 1%, 5%, and 10% levels, respectively.Note:This table presents results from fixed effects regressions using a panel of firms from the Development Bank of Japan Corporate Finance Data Set. Standard errors are reported in parentheses. The estimates are over the period 1977-1991 because the bond issuance accounting criteria were valid from October 1976 to December 1990. The other control variables are taken from the Development Bank of Japan Corporate Finance Data Set, except for prefecture land inflation which comes from the Statistical Yearbook of Japan and refers to the land inflation in the prefecture in which a firm is headquartered.
34
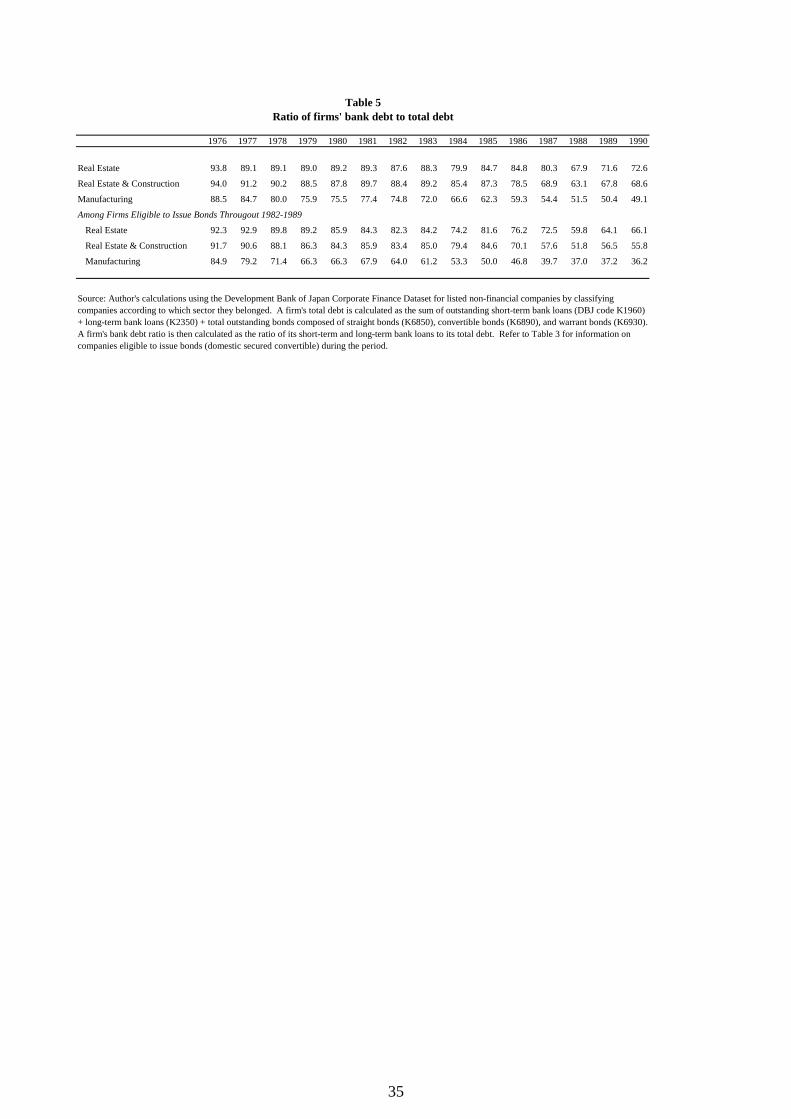
1976 1977 1978 1979 1980 1981 1982 1983 1984 1985 1986 1987 1988 1989 1990
Real Estate 93.8 89.1 89.1 89.0 89.2 89.3 87.6 88.3 79.9 84.7 84.8 80.3 67.9 71.6 72.6
Real Estate & Construction 94.0 91.2 90.2 88.5 87.8 89.7 88.4 89.2 85.4 87.3 78.5 68.9 63.1 67.8 68.6
Manufacturing 88.5 84.7 80.0 75.9 75.5 77.4 74.8 72.0 66.6 62.3 59.3 54.4 51.5 50.4 49.1
Among Firms Eligible to Issue Bonds Througout 1982-1989
Real Estate 92.3 92.9 89.8 89.2 85.9 84.3 82.3 84.2 74.2 81.6 76.2 72.5 59.8 64.1 66.1
Real Estate & Construction 91.7 90.6 88.1 86.3 84.3 85.9 83.4 85.0 79.4 84.6 70.1 57.6 51.8 56.5 55.8
Manufacturing 84.9 79.2 71.4 66.3 66.3 67.9 64.0 61.2 53.3 50.0 46.8 39.7 37.0 37.2 36.2
Table 5Ratio of firms' bank debt to total debt
Source: Author's calculations using the Development Bank of Japan Corporate Finance Dataset for listed non-financial companies by classifying companies according to which sector they belonged. A firm's total debt is calculated as the sum of outstanding short-term bank loans (DBJ code K1960) + long-term bank loans (K2350) + total outstanding bonds composed of straight bonds (K6850), convertible bonds (K6890), and warrant bonds (K6930). A firm's bank debt ratio is then calculated as the ratio of its short-term and long-term bank loans to its total debt. Refer to Table 3 for information on companies eligible to issue bonds (domestic secured convertible) during the period.
35

Dependent variable: Log difference in real prefectural (1) (2) (3) (4) (5) (6) (7) (8) land price between 1991 and 1981
All regressors are the difference between 1991 and 1981 a :
Keiretsu loan share -4.6568*** -3.4475***(0.7352) (0.9895)
Real estate loan share 11.4852*** 20.3016*** 14.8649***(2.1672) (4.6123) (4.8989)
"Risky" loan share (loans to real estate & construction & 4.4586** 14.2489*** 13.5435*non-bank financial institutions.) (1.6632) (5.0130) (7.5214)
Macro controls c
Prefecture population, in logs 3.6120*** 0.8910 3.8869*(0.9883) (1.3197) (2.1875)
Prefecture unemployment rate -0.1376 0.0878 0.0019(0.1940) (0.2183) (0.3484)
Prefecture income per capita, in logs -0.0994 1.1116 -2.9717(0.7785) (0.9088) (3.1228)
Prefecture job openings to applications -0.2670* -0.2694 -0.0069(0.1415) (0.1740) (0.3522)
Prefecture CPI excluding rent, in logs 0.3925 4.0841 -3.1615(3.3966) (2.7428) (8.1607)
Instrumenting for real estate or "risk" loan share with Yes Yes Yes Yeskeiretsu loan share?
Constant 0.8961*** 0.7439*** 0.5197*** 0.6749*** -0.1180 1.0232 -0.5199 1.8371(0.0547) (0.0641) (0.1180) (0.1252) (0.4103) (0.7128) (0.7229) (2.0110)
Number of prefectures 47 47 47 47 47 47 47 47R-squared 0.35 0.38 0.16 0.17 R-sq < 0b 0.57 0.46 R-sq < 0c
***, **, and * denote significance at the 1%, 5%, and 10% levels, respectively.aExcept for Prefecture population and unemployment which are the difference between 1990 and 1980 due to data availability.bNote that in 2SLS the R-squared can sometimes be negative, even when a constant is included.cThe controls are compiled from the Japan Statistical Yearbook, various issues. Note:
Table 6The Effect of Bank Credit on Land Prices: The Prefecture Cross-Sectional View
Robust standard errors are reported in parentheses and they are clustered by prefecture.
36

Dependent variable: Log difference in real prefectural (1) (2) (3) (4) (5) (6) (7) (8) (9) land price, annual
Regressors
Keiretsu loan share, first difference -3.3154*** -1.8019*** -1.1640** -1.6448**(0.6597) (0.6186) (0.5821) (0.6716)
Keiretsu loan share, first difference, lag 1 -3.3996*** -1.3002* -1.0870* -1.1346(0.7626) (0.7270) (0.6145) (0.7686)
Keiretsu loan share, first difference, lag 2 -2.4380*** -1.3379* -1.3945** -1.5180*(0.7841) (0.7532) (0.5907) (0.7913)
Keiretsu loan share, first difference, lag 3 -0.9592 -1.0184 -1.1142* -1.2089(0.7700) (0.7347) (0.5826) (0.7718)
Keiretsu loan share, first difference, lag 4 -0.1979 -0.5232 -0.7107 -0.5973(0.6594) (0.6168) (0.5457) (0.6527)
Real estate loan share, first difference 3.3498** 27.0575 15.6876**(1.3651) (18.0139) (6.5623)
"Risky" loan share (loans to real estate & construction & 1.6221** 9.4662*non-bank financial institutions.) (0.7119) (5.0734)
Year dummies? Yes Yes Yes Yes Yes Yes
Japan-wide macro controlsJapanese unemployment, first difference -0.0883 -0.0251
(0.0687) (0.0824)Nikkei stock market, in logs, first difference 0.0344 -0.1139
(0.0656) (0.0889)Japan population, in logs, first difference 12.8641* 11.5327
(7.2285) (7.9958)Prefecture-level controls
Population, in logs, 1990-80 difference 0.4116** 0.1872(0.1694) (0.2135)
Unemployment rate, 19990-80 difference -0.0056 0.0226(0.0342) (0.0380)
Income per capita, in logs, first difference -0.0715 0.1178 0.3970(0.3550) (0.3699) (0.4334)
Job openings to applications, first difference 0.3025*** 0.1216 0.2591***(0.0641) (0.0764) (0.0738)
CPI excluding rent, in logs, first difference 1.6192* 1.2422 3.6304***(0.8577) (1.5712) (1.1620)
House rent, in logs, first difference, lag 2 0.5511*** 0.5271*** 0.5152***(0.1197) (0.1258) (0.1350)
House rent to residential land price, lag 2 0.0082** 0.0147* 0.0061*(0.0032) (0.0078) (0.0034)
Instrumenting for real estate or "risk" loan share with Yes Yes Yeskeiretsu loan share and its lags?
Constant 0.0434*** -0.1385*** -0.1418*** -0.1898*** -0.1361*** -0.1412*** -0.1212*** -0.2166*** -0.1718***(0.0108) (0.0247) (0.0243) (0.0473) (0.0242) (0.0269) (0.0432) (0.0603) (0.0565)
Observations 611 611 611 611 611 611 562 562 562R-squared 0.05 0.28 0.27 0.14 0.27 0.11 0.26 0.32 0.17
***, **, and * denote significance at the 1%, 5%, and 10% levels, respectively.Note:
Regressions reported in columns 7,9, and 11 were estimated using random effects and no year dummies because the Japan-wide macro controls serve as an alternative time control while the prefectural-level population and unprefecture fixed effects.
Standard errors are reported in parentheses.
Table 7The Effect of Bank Credit on Land Prices: The Time-Series View
Prefecture Fixed Effects 1981-1993
37
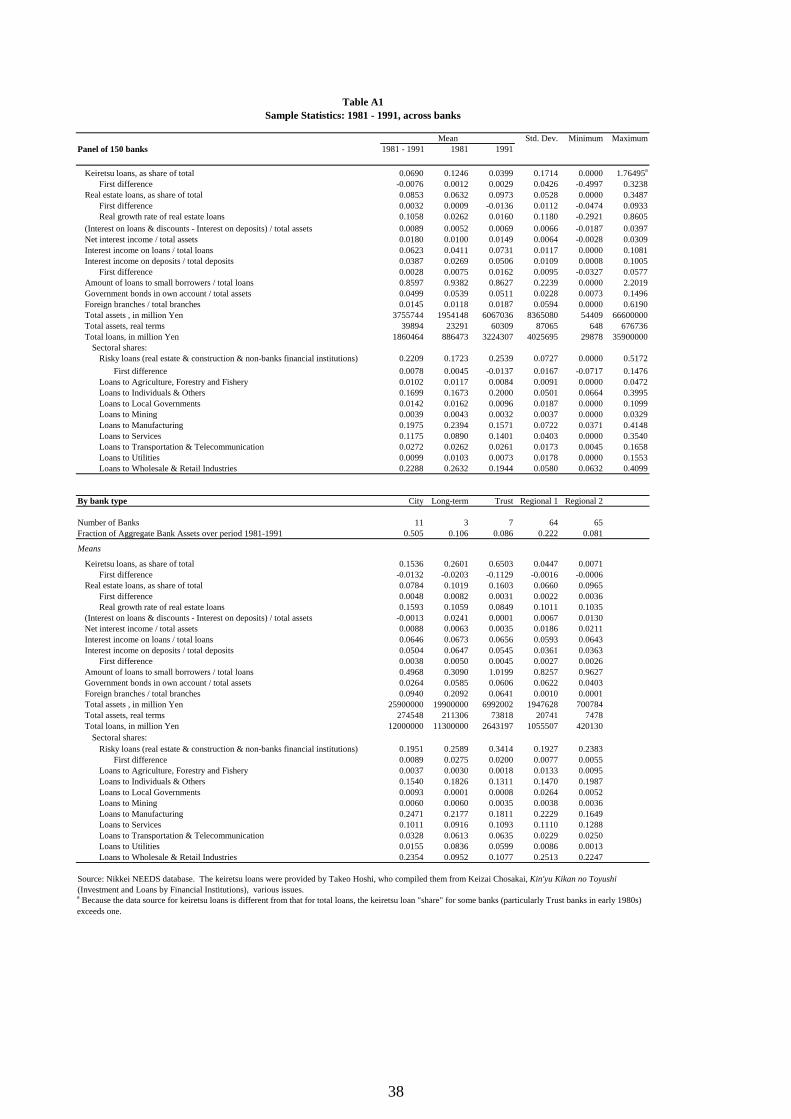
Std. Dev. Minimum MaximumPanel of 150 banks 1981 - 1991 1981 1991
Keiretsu loans, as share of total 0.0690 0.1246 0.0399 0.1714 0.0000 1.76495a
First difference -0.0076 0.0012 0.0029 0.0426 -0.4997 0.3238Real estate loans, as share of total 0.0853 0.0632 0.0973 0.0528 0.0000 0.3487
First difference 0.0032 0.0009 -0.0136 0.0112 -0.0474 0.0933Real growth rate of real estate loans 0.1058 0.0262 0.0160 0.1180 -0.2921 0.8605
(Interest on loans & discounts - Interest on deposits) / total assets 0.0089 0.0052 0.0069 0.0066 -0.0187 0.0397Net interest income / total assets 0.0180 0.0100 0.0149 0.0064 -0.0028 0.0309Interest income on loans / total loans 0.0623 0.0411 0.0731 0.0117 0.0000 0.1081Interest income on deposits / total deposits 0.0387 0.0269 0.0506 0.0109 0.0008 0.1005
First difference 0.0028 0.0075 0.0162 0.0095 -0.0327 0.0577Amount of loans to small borrowers / total loans 0.8597 0.9382 0.8627 0.2239 0.0000 2.2019Government bonds in own account / total assets 0.0499 0.0539 0.0511 0.0228 0.0073 0.1496Foreign branches / total branches 0.0145 0.0118 0.0187 0.0594 0.0000 0.6190Total assets , in million Yen 3755744 1954148 6067036 8365080 54409 66600000Total assets, real terms 39894 23291 60309 87065 648 676736Total loans, in million Yen 1860464 886473 3224307 4025695 29878 35900000
Sectoral shares:Risky loans (real estate & construction & non-banks financial institutions) 0.2209 0.1723 0.2539 0.0727 0.0000 0.5172
First difference 0.0078 0.0045 -0.0137 0.0167 -0.0717 0.1476Loans to Agriculture, Forestry and Fishery 0.0102 0.0117 0.0084 0.0091 0.0000 0.0472Loans to Individuals & Others 0.1699 0.1673 0.2000 0.0501 0.0664 0.3995Loans to Local Governments 0.0142 0.0162 0.0096 0.0187 0.0000 0.1099Loans to Mining 0.0039 0.0043 0.0032 0.0037 0.0000 0.0329Loans to Manufacturing 0.1975 0.2394 0.1571 0.0722 0.0371 0.4148Loans to Services 0.1175 0.0890 0.1401 0.0403 0.0000 0.3540Loans to Transportation & Telecommunication 0.0272 0.0262 0.0261 0.0173 0.0045 0.1658Loans to Utilities 0.0099 0.0103 0.0073 0.0178 0.0000 0.1553Loans to Wholesale & Retail Industries 0.2288 0.2632 0.1944 0.0580 0.0632 0.4099
By bank type City Long-term Trust Regional 1 Regional 2
Number of Banks 11 3 7 64 65Fraction of Aggregate Bank Assets over period 1981-1991 0.505 0.106 0.086 0.222 0.081
Means
Keiretsu loans, as share of total 0.1536 0.2601 0.6503 0.0447 0.0071First difference -0.0132 -0.0203 -0.1129 -0.0016 -0.0006
Real estate loans, as share of total 0.0784 0.1019 0.1603 0.0660 0.0965First difference 0.0048 0.0082 0.0031 0.0022 0.0036Real growth rate of real estate loans 0.1593 0.1059 0.0849 0.1011 0.1035
(Interest on loans & discounts - Interest on deposits) / total assets -0.0013 0.0241 0.0001 0.0067 0.0130Net interest income / total assets 0.0088 0.0063 0.0035 0.0186 0.0211Interest income on loans / total loans 0.0646 0.0673 0.0656 0.0593 0.0643Interest income on deposits / total deposits 0.0504 0.0647 0.0545 0.0361 0.0363
First difference 0.0038 0.0050 0.0045 0.0027 0.0026Amount of loans to small borrowers / total loans 0.4968 0.3090 1.0199 0.8257 0.9627Government bonds in own account / total assets 0.0264 0.0585 0.0606 0.0622 0.0403Foreign branches / total branches 0.0940 0.2092 0.0641 0.0010 0.0001Total assets , in million Yen 25900000 19900000 6992002 1947628 700784Total assets, real terms 274548 211306 73818 20741 7478Total loans, in million Yen 12000000 11300000 2643197 1055507 420130
Sectoral shares:Risky loans (real estate & construction & non-banks financial institutions) 0.1951 0.2589 0.3414 0.1927 0.2383
First difference 0.0089 0.0275 0.0200 0.0077 0.0055Loans to Agriculture, Forestry and Fishery 0.0037 0.0030 0.0018 0.0133 0.0095Loans to Individuals & Others 0.1540 0.1826 0.1311 0.1470 0.1987Loans to Local Governments 0.0093 0.0001 0.0008 0.0264 0.0052Loans to Mining 0.0060 0.0060 0.0035 0.0038 0.0036Loans to Manufacturing 0.2471 0.2177 0.1811 0.2229 0.1649Loans to Services 0.1011 0.0916 0.1093 0.1110 0.1288Loans to Transportation & Telecommunication 0.0328 0.0613 0.0635 0.0229 0.0250Loans to Utilities 0.0155 0.0836 0.0599 0.0086 0.0013Loans to Wholesale & Retail Industries 0.2354 0.0952 0.1077 0.2513 0.2247
Mean
Table A1Sample Statistics: 1981 - 1991, across banks
Source: Nikkei NEEDS database. The keiretsu loans were provided by Takeo Hoshi, who compiled them from Keizai Chosakai, Kin'yu Kikan no Toyushi(Investment and Loans by Financial Institutions), various issues.a Because the data source for keiretsu loans is different from that for total loans, the keiretsu loan "share" for some banks (particularly Trust banks in early 1980s) exceeds one.
38

Std. Dev. Minimum MaximumPanel of 47 Prefectures 1981 - 1991 1981 1991
JapanwideReal land price index, average 6 largest cities 0.5548 0.3170 1.0239 0.2629 0.3170 1.0239
First difference 0.1085 0.0208 0.0074 0.0940 0.0074 0.2465Real land price index, average all 0.8199 0.6841 1.0974 0.1289 0.6841 1.0974
First difference 0.0450 0.0221 0.0768 0.0346 0.0003 0.1077Prefecture specific
Real land price at the prefecture 1.4095 0.6257 2.4329 3.2744 0.0660 30.7996First difference 0.1015 0.0807 0.0687 0.1812 -2.2563 2.3458
Keiretsu loans, as share of total in prefecture 0.0507 0.0658 0.0358 0.0472 0.0011 0.3711First difference -0.0026 0.0014 0.0018 0.0149 -0.1587 0.1529
Real estate loans, as share of total in prefecture 0.0708 0.0542 0.0796 0.0269 0.0238 0.1744First difference 0.0023 0.0000 -0.0124 0.0074 -0.0300 0.0295Real growth rate of real estate loans 0.0997 0.0182 0.0229 0.0879 -0.1232 0.4700Risky loans (real estate & construction & non-banks financial institutions) 0.2007 0.1544 0.2354 0.0442 0.1143 0.3729First difference 0.0076 0.0029 -0.0132 0.0125 -0.0624 0.0633
Number of banks headquartered in prefecture 3.1915 3.1915 3.1915 3.0462 1.0000 20.0000Proportion of major banks in prefecture (city & long-term & trust banks) 0.0331 0.0331 0.0331 0.1248 0.0000 0.7500Proportion of regional banks in prefecture (regional 1 & regional 2 banks) 0.9669 0.9669 0.9669 0.1248 0.2500 1.0000Proportion of long-term & trust banks in prefecture 0.0112 0.0112 0.0112 0.0657 0.0000 0.4500Prefecture Macroeconomic controlsPopulation (in 1000s), in logs 7.5742 7.5396 7.5802 0.7155 6.4232 9.3806Unemployment rate, in % 3.1454 2.4579 2.9663 1.0995 1.6281 7.7758Job openings to applications 0.8756 0.6616 1.3663 0.4820 0.1314 2.4415Income per capita (in 1000 yen), in logs 7.6421 7.4020 7.9021 0.2194 7.1624 8.4011CPI excluding rent 4.4899 4.4072 4.5862 0.0530 4.3747 4.6592House rent to residential land price 6.0427 6.4906 5.6299 2.7795 0.6457 14.8566
Note: Prefecture population and unemployment are provided for 1980 and 1990 because 1981 and 1991 are not available.
Table A2Sample Statistics: 1981 - 1991, across prefectures
Mean
Source: Nikkei NEEDS database for bank data. The keiretsu loans were provided by Takeo Hoshi, who compiled them from Keizai Chosakai, Kin'yu Kikan no Toyushi (Investment and Loans by Financial Institutions), various issues. Japan-wide land prices are from the semi-annual Japan Real Estate Institute and prefecture land prices are from the annual July 1st Prefectural Land Price Survey. Prefectural macroeconomic controls are taken from the Japan Statistical Yearbook, various issues.
39
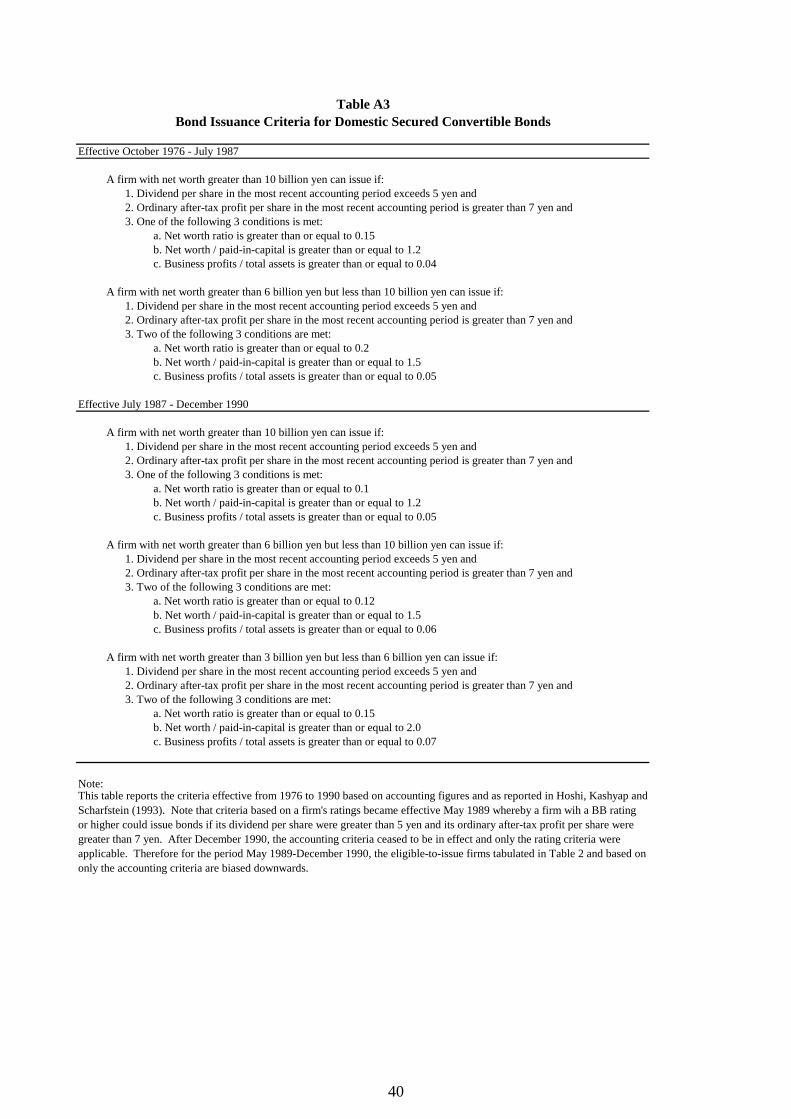
Table A3Bond Issuance Criteria for Domestic Secured Convertible Bonds
Effective October 1976 - July 1987
A firm with net worth greater than 10 billion yen can issue if: 1. Dividend per share in the most recent accounting period exceeds 5 yen and2. Ordinary after-tax profit per share in the most recent accounting period is greater than 7 yen and3. One of the following 3 conditions is met:
a. Net worth ratio is greater than or equal to 0.15b. Net worth / paid-in-capital is greater than or equal to 1.2c. Business profits / total assets is greater than or equal to 0.04
A firm with net worth greater than 6 billion yen but less than 10 billion yen can issue if: 1. Dividend per share in the most recent accounting period exceeds 5 yen and2. Ordinary after-tax profit per share in the most recent accounting period is greater than 7 yen and3. Two of the following 3 conditions are met:
a. Net worth ratio is greater than or equal to 0.2b. Net worth / paid-in-capital is greater than or equal to 1.5c. Business profits / total assets is greater than or equal to 0.05
Effective July 1987 - December 1990
A firm with net worth greater than 10 billion yen can issue if: 1. Dividend per share in the most recent accounting period exceeds 5 yen and2. Ordinary after-tax profit per share in the most recent accounting period is greater than 7 yen and3. One of the following 3 conditions is met:
a. Net worth ratio is greater than or equal to 0.1b. Net worth / paid-in-capital is greater than or equal to 1.2c. Business profits / total assets is greater than or equal to 0.05
A firm with net worth greater than 6 billion yen but less than 10 billion yen can issue if: 1. Dividend per share in the most recent accounting period exceeds 5 yen and2. Ordinary after-tax profit per share in the most recent accounting period is greater than 7 yen and3. Two of the following 3 conditions are met:
a. Net worth ratio is greater than or equal to 0.12b. Net worth / paid-in-capital is greater than or equal to 1.5c. Business profits / total assets is greater than or equal to 0.06
A firm with net worth greater than 3 billion yen but less than 6 billion yen can issue if: 1. Dividend per share in the most recent accounting period exceeds 5 yen and2. Ordinary after-tax profit per share in the most recent accounting period is greater than 7 yen and3. Two of the following 3 conditions are met:
a. Net worth ratio is greater than or equal to 0.15b. Net worth / paid-in-capital is greater than or equal to 2.0c. Business profits / total assets is greater than or equal to 0.07
Note:This table reports the criteria effective from 1976 to 1990 based on accounting figures and as reported in Hoshi, Kashyap and Scharfstein (1993). Note that criteria based on a firm's ratings became effective May 1989 whereby a firm wih a BB rating or higher could issue bonds if its dividend per share were greater than 5 yen and its ordinary after-tax profit per share were greater than 7 yen. After December 1990, the accounting criteria ceased to be in effect and only the rating criteria were applicable. Therefore for the period May 1989-December 1990, the eligible-to-issue firms tabulated in Table 2 and based on only the accounting criteria are biased downwards.
40

Source: The keiretsu loans and loans to listed firms were provided by Takeo Hoshi,who compiled them from Keizai Chosakai, Kin'yu Kikan no Toyushi (Investment and Loans by Financial Institutions), various issues.The real estate loans and the total loans come from the Nikkei NEEDS database.
Figure 1. Keiretsu Loans, Loans to Listed Firms, and Loans to Real Estate Sector (as a share of total loans, all banks, average)
.05
.1.1
5.2
1975 1980 1985 1990 1995 2000
Loans to keirets u Loans to lis tedLoans to R eal Es tate
41

Source: Bank of Japan, Research and Statistics Department, http://www.boj.or.jp/enNote: For judgement questions, the percentage share of the raw number of responding enterprises for each of
the three choices is calculated. The diffusion index (DI) is calculated as following: DI = percentage share of enterprises responding for choice 1minus percentage share of enterprises responding for choice 3. The choices for lending attitude were 1) Accommodative Choice 2) Not so severe and 3) Severe. Therefore if all the surveyed enterprises perceived the lending attitude to be accomodative, the index would be equal to 100 and vice versa.
Figure 2. Tankan Survey: Perception by enterprises of financial institutions' lending attitudes
(A higher number indicates perception of more relaxed conditions)
-100
-80
-60
-40
-20
0
20
40
60
1974 1975 1977 1978 1980 1981 1983 1984 1986 1987 1989 1990 1992 1993 1995 1996 1998 1999 2001 2002
Manufacturing, All enterprises
Construction & Real Estate, All
Manufacturing, Small enterprises
Manufacturing, Large enterprises
42

Source: Author's calculations using the Development Bank of Japan CorporateFinance Dataset by classifying whether a firm was eligible to issue during the period from 1982-1989. Eligible-to-issue bonds criteria are shown in Table A3.
Figure 3. Ratio of firms' bank debt to total debt
Note: The calculations are based on all companies with accounting data available for each year during 1982-1989 (resulting in 371 companies). See Tables 3 and 5 for details.
.4.6
.81
1960 1970 1980 1990 2000
El ig i bl e from 1982-89 E lig ible par t of 1982-89Inelig ible from 1982-89
43

Source: Nikkei stock market index from Bank of Japan, http://www.boj.or.jp/enLand prices, all areas and 6 largest cities are from the Japan Statistical Yearbook's Table 17-12 Index of Urban Land Prices (1960-2003), which in turn are from the Japan Real Estate Institute (as of end-March).Prefecture land prices are from the Japan Statistical Yearbook, various issues, which come fromthe annual July 1st Prefectural Land Price Survey carried out by the Land and Water Bureau, Ministry of Land, Infrastructure and Transport. The weighted average over 6 categories of land is taken: residential site, prospective housing land, commercial site, quasi-industrial site, industrial site, and housing land within urbanization control area. Land price indices are divided by the GDP deflator to obtain real land prices, then the inflation rate iscalculated as the annual log difference.
Figure 4. Inflation
Figure 4a. Land price inflation and the Nikkei stock market index
Figure 4b. Prefecture-level land price inflation (selected prefectures)
-.4-.2
-5.5
5e-1
7.2
.4
1975 1980 1985 1990 1995 2000
Land pr i ce infl at ion, 6 largest c iti es Land pr i ce i nf lation, all areasN ikkei index, % c hange
-.50
.51
1975 1980 1985 1990 1995 2000
T okyo O sakaH okkaido O ki nawa
44

Source: Land inflation is the average over the 47 prefectures of the prefectural real land price inflation.The predicted inflation rate comes from Model 7.3 for the uninstrumented real estate loans and fromModel 7.4 for the keiretsu-share instrumented real estate loans (refer to columns 3 and 4 in Table 7).
Figure 5. The Japan Average Actual Land Inflation Rate and the Predicted Rate -.3
-.2-.1
2.78
e-17
.1.2
1980 1985 1990 1995
Land inflati onpredic ted f rom real es tate l oans (uninst rumented)predic ted f rom real es tate l oans ( i ns trument ed)
45