Embed Size (px)
Citation preview

Confidential manuscript submitted to Global Biogeochemical Cycles
The Effect of Atmospheric Acid Processing on the Global Deposition of Bioavailable
Phosphorus from Dust
R. J. Herbert1, † M. D. Krom1, ‡ K. S. Carslaw1, A. Stockdale1, R. J. G. Mortimer2, L. G.
Benning1, 3, 4, K. Pringle1, J. Browse1, *
1 School of Earth and Environment, University of Leeds, Leeds, LS2 9JT, UK.
2 School of Animal, Rural and Environmental Sciences, Nottingham Trent University,
Brackenhurst Campus, Southwell, Nottinghamshire, NG25 0QF, UK.
3 GFZ German Research Centre for Geosciences, Telegrafenberg, 14473 Potsdam, Germany.
4 Department of Earth Sciences, Free University of Berlin, 12249 Berlin, Germany.
Corresponding author: Ross Herbert ([email protected])
† Now at Department of Meteorology, University of Reading, Reading, RG6 6AH, UK.
‡ Now at Morris Kahn Marine Research Station, Department of Marine Biology, Leon H.
Charney School of Marine Science, University of Haifa, Haifa, 3498838, Israel.
* Now at College of Life and Environmental Sciences, University of Exeter, Penryn, TR10 9EZ,
UK.
Confidential manuscript submitted to Global Biogeochemical Cycles
Abstract
The role of dust as a source of bioavailable phosphorus (Bio-P) is quantified using a new
parameterization for apatite dissolution in combination with global soil data maps and a global
aerosol transport model. Mineral dust provides 31.2 Gg-P yr-1 of Bio-P to the oceans, with
14.3 Gg-P yr-1 from labile P present in the dust, and an additional 16.9 Gg-P yr-1 from acid
dissolution of apatite in the atmosphere, representing an increase of 120%. The North Atlantic,
northwest Pacific, and Mediterranean Sea are identified as important sites of Bio-P deposition
from mineral dust. The acid dissolution process increases the fraction of total-P that is
bioavailable from ~10% globally from the labile pool to 23% in the Atlantic Ocean, 45% in the
Pacific Ocean, and 21% in the Indian Ocean, with an ocean global mean value of 22%. Strong
seasonal variations, especially in the North Pacific, northwest Atlantic, and Indian Ocean, are
driven by large-scale meteorology and pollution sources from industrial and biomass-burning
regions. Globally constant values of total-P content and bioavailable fraction used previously do
not capture the simulated variability. We find particular sensitivity to the representation of
particle-to-particle variability of apatite, which supplies Bio-P through acid-dissolution, and
calcium carbonate, which helps to buffer the dissolution process. A modest 10% external mixing
results in an increase of Bio-P deposition by 18%. The total Bio-P calculated here
(31.2 Gg-P yr-1) represents a minimum compared to previous estimates due to the relatively low
total-P in the global soil map used.

Confidential manuscript submitted to Global Biogeochemical Cycles
1 Introduction
Phosphorus (P) is an essential requirement for life. In the terrestrial ecosystem P is made
accessible naturally through weathering processes and increasingly through the supply of
fertilizer and other P-containing compounds from anthropogenic processes. The dominant supply
of P to coastal systems is from rivers and wastewater discharge, which are augmented by
sedimentary recycling processes (Ruttenberg, 2003). By contrast, in the offshore ocean the
dominant external supply is from atmospheric deposition processes, with long-range
transportation of mineral dust from desert regions being the most important single source of P to
the ocean surface (Graham and Duce, 1982; Mahowald et al., 2008; Myriokefalitakis et al.,
2016). In-situ measurements of atmospheric aerosol (e.g., Carbo et al., 2005; Herut et al., 1999;
Zamora et al., 2013) and soil mineralogical databases (Nickovic et al., 2012; Yang et al., 2013)
show that total P (hereafter TP) content of soils and mineral dust is spatially and temporally
variable and may range from < 500 to > 1000 ppm, with corresponding variability in the
component P pools.
Many studies show the importance of atmospheric supply in general and dust in particular as a
source of external nutrients (Fe, N and P) to the open ocean (Krishnamurthy et al., 2010;
Mahowald et al., 2008). In such systems, the total N supplied is in a readily bioavailable form. In
contrast the P (and Fe) is supplied in both labile (and hence bioavailable) and non-bioavailable
forms. The non-bioavailable particles of P can drop through the photic zone without enhancing
phytoplankton growth and hence carbon uptake. Herut et al. (2005) showed that when fresh
Saharan dust and dust pre-treated to remove any water-leachable nutrients were added to a
microcosm experiment containing N- and P-limited Mediterranean seawater only the fresh dust
resulted in increased chlorophyll content. The fresh dust added nutrients in the ratio of 31N:1P
(nitrate:phosphate) and thus it was the water-leachable fraction of the dust rather than the particle
itself that caused the extra productivity in this N and P co-limited system (Thingstad et al.,
2005). Eijsink et al. (2000) found that even in the P-limited Eastern Mediterranean, 70% of the
TP (mainly detrital apatite) supplied as Saharan dust to the surface waters was transferred
through the water column and ended up deposited in the sediment. The remaining 30% was taken
up by biological processes in the water column.
Observations suggest that the percentage of TP in mineral dust that is deposited in a bioavailable
form (Bio-P) is spatially variable, ranging from < 10% to > 80% (Baker et al., 2006a; Markaki et
al., 2003; Zamora et al., 2013; Vet et al., 2014), and may increase with distance from the dust
source (Baker et al., 2006a). Recent ambient observations and laboratory experiments (Nenes et
al., 2011; Srinivas and Sarin, 2015; Stockdale et al., 2016) provide support for the hypothesis
that atmospheric acidification and subsequent dissolution is a primary process for producing Bio-
P in mineral dust. Increasing the amount of leachable, or bioavailable, P by acid processes in the
atmosphere will have a direct effect of increasing phytoplankton biomass and hence carbon
uptake in a variety of ocean systems (e.g., Jickells and Moore, 2015; Mahowald et al., 2008)
The paucity of observational data from the open oceans necessitates the use of models to
determine the atmospheric flux of Bio-P to surface waters. Models are also needed to quantify
how Bio-P deposition may change with environmental factors such as source strength,
atmospheric pollution, and large-scale changes to global circulation. To achieve this, models
must represent the emission, transport and deposition of the particulate P, as well as processes

Confidential manuscript submitted to Global Biogeochemical Cycles
that determine the TP and Bio-P content. Previous global deposition modelling studies using
global chemical transport models (Brahney et al., 2015; Krishnamurthy et al., 2010; Mahowald
et al., 2008; Wang et al., 2015) assumed that dust emissions contain a constant fraction of TP
(between ~720 and 1050 ppm) and a constant percentage of TP deemed Bio-P (between 10% and
15%). The result is a spatially varying flux of dust-borne P to the surface with a constant
solubility, which may not reflect underlying variability between dust sources, nor atmospheric
acidification processes. A recent study by Myriokefalitakis et al. (2016) represented the
acidification process using an acid-solubilization mechanism in which apatite dissolution is
treated as a kinetic process dependent on the H+ activity of the surrounding water droplet and
known acid dissolution thermodynamic constants. Their study used a global soil mineralogy
dataset (Nickovic et al., 2012) to represent the spatially varying soil TP content with dust-TP
emissions adjusted to a global mean of 880 ppm and a soluble fraction of 10% representing a
leachable inorganic pool of P in the initial dust. The remaining TP was assumed to be apatite.
This treatment reproduces the atmospheric acidification process but relies on several
assumptions for estimating the different forms of P. A recent global soil database (Yang et al.,
2013) provides high resolution information on the geographical distribution of TP in its different
forms including apatite, labile, organic, occluded, and secondary P. The dataset shows that there
is considerable spatial variability in all components. This dataset provides more appropriate
forms of P for use in estimating dust-borne P emissions and simulating atmospheric acidification
processes of apatite.
A recent study by Stockdale et al. (2016) presents results from a series of experiments simulating
atmospheric acidification on dust samples and dust precursor soils in which the acidity of the
solution and the mass of dust was systematically varied. Phosphorus speciation experiments
identified the dominant forms of phosphorus in the dust samples as ~80% apatite P, ~10% Fe-
bound P, and ~10% labile-P. The acidification experiments provide robust evidence for a
relatively simple relationship in which the dissolution behaviour of mineral dust is controlled by
the absolute number of protons in the solution, the calcium carbonate (CaCO3) content, and the
apatite (Ap-P) content of the dust. Rapid acid dissolution of both mineral species occurs
simultaneously when both minerals are present on the same mineral grain (internally mixed). The
dissolution rate of Ap-P is greater when the Ap-P and CaCO3 exist on different grains (externally
mixed). As a result of slow mineral precipitation kinetics the dissolved phosphate remains in
solution when the H+ concentration falls or water content increases. The total mass of Bio-P
upon deposition to the surface is thus the sum of acid-dissolved apatite (Acid-P) and the loosely
bound labile P (Lab-P) that was initially available in the particles. As the dissolution of Ap-P
occurs at a faster rate when CaCO3 is not present, if Ap-P and CaCO3 where exclusively present
on different particles (i.e., externally mixed) then it is possible that more Acid-P would be
produced. As discussed by Stockdale et al. (2016) it is hypothesized that many particles would
contain both Ap-P and CaCO3, however, there is likely a degree of variation between particles
with some containing more or less of each mineral component.
It is widely recognized that mineral dust plays an important role in the transport of nutrients to
the open ocean surfaces, however, as shown by Yang et al. (2013) there exists considerable
variability in the relative abundance of different P-containing components from different source
regions. The results of Stockdale et al. (2016) additionally show that the spatial distribution of
CaCO3 and its abundance in relation to Ap-P may have considerable impacts on the production

Confidential manuscript submitted to Global Biogeochemical Cycles
of Bio-P from acid dissolution of Ap-P. The simplistic dissolution mechanism presented by
Stockdale et al. (2016) and the detailed soil-P speciation dataset presented by Yang et al. (2013)
provide a new and readily applicable method for estimating the spatio-temporal distribution of
Bio-P from dust and allows us to investigate the sensitivity of Acid-P production to the degree of
internal and external mixing of the components. This will help to understand key uncertainties in
the acid dissolution process and help better define the focus of future research.
In this study we use the Global Model of Aerosol Processes (GLOMAP) coupled to the global
chemical transport model TOMCAT to simulate the emission, transport, and deposition of dust-
borne phosphorus to the surface. Apatite dissolution parameterizations based on the results from
Stockdale et al. (2016) and a database of soil P speciation (Yang et al., 2013) are used to
simulate atmospheric acidification of mineral dust by H2SO4 and HNO3; the soil database is also
used to simulate the contribution of the dust-borne Lab-P as a spatially variable percentage of
dust mass. These results are used to investigate the drivers of the spatio-temporal variability in
dust-borne Bio-P and the Acid-P (the amount of TP converted to Bio-P by atmospheric acid
processes). The results are compared to a global dataset of observations (Vet et al., 2014) and
results from other modelling studies to help understand the importance of atmospheric
acidification of mineral dust on the global supply of P nutrients to the open oceans and
elsewhere. Finally, simulations are performed to investigate the sensitivity of the results to the
effect of external mixing of apatite and CaCO3 on the amount of Bio-P delivered to the ocean
surface.
2 Model description
We use the global aerosol microphysics model GLOMAP-mode (Mann et al., 2010) coupled to
the 3D global chemical transport model TOMCAT (Chipperfield, 2006). Simulations are
performed using a horizontal resolution of 2.8° by 2.8° and 31 hybrid σ-pressure levels extending
from the surface to 10 hPa. Meteorology for the simulated year is driven by the European Centre
for Medium-Range Weather Forecasts (ECMWF) ERA-Interim reanalyses at 6-hourly intervals
Monthly mean low-cloud fields are prescribed from the International Satellite Cloud
Climatology Project (ISCCP) archive. In the standard GLOMAP-mode setup the aerosol particle
number and size distribution is described using a modal scheme with 7 internally mixed modes
(4 soluble and 3 insoluble) and 5 aerosol species: sulfate, black carbon, organic carbon, sea-salt,
and dust. The 7 modes cover four size ranges: nucleation (~1 to 10 nm diameter), Aitken (~10 to
100 nm), accumulation (~0.1 to 0.5 µm), and coarse (~0.5 to 10 µm).
The aerosol processes treated in the model include primary and precursor emissions, nucleation
of H2SO4 aerosol, sedimentation and dry deposition, hygroscopic growth, in-cloud activation and
scavenging, below-cloud scavenging, inter- and intra-modal coagulation, condensation of H2SO4
and secondary organic vapors onto all aerosol particles, ageing of water-insoluble particles, and
in-cloud processing (formation of sulfate mass from oxidation of sulfur dioxide in aerosol
particles activated into cloud droplets). GLOMAP-mode also includes an aerosol precursor
chemistry scheme primarily for simulating gas and aqueous phase reactions leading to the
production of SO2 and H2SO4.
Confidential manuscript submitted to Global Biogeochemical Cycles
Monthly emissions of anthropogenic BC, OC, and SO2, and volcanic SO2 are supplied by global
datasets from AeroCom hindcast (Diehl et al., 2012). The Global Fire Emissions Database
(GFED) v2 database (van der Werf et al., 2010) is used for wildfire emissions, and dimethyl
sulfide (DMS) emissions are calculated using DMS seawater concentrations from Kettle et al.
(1999) and transfer velocity parameterizations of Nightingale et al. (2000). Daily size-resolved
emissions of dust (covering accumulation and coarse modes) are included via prescribed fluxes
from AeroCom (Dentener et al., 2006). Deposition of aerosol species occurs via dry deposition,
using a dry deposition velocity following Slinn (1982), and wet deposition through nucleation
scavenging from large-scale and convective precipitation (activation of cloud condensation
nuclei), impaction scavenging by precipitation, and scavenging by low-cloud drizzle (Browse et
al., 2012). The aqueous chemistry scheme includes the dissolution of SO2, H2O2, and O3 into
cloud droplets and the subsequent oxidation of S(IV) to S(VI) by H2O2 and O3. Condensation of
H2SO4 onto aerosols is simulated using coefficients following Fuchs and Sutugin (1971) with
added correction factors for molecular effects and limiting interfacial mass transport, the latter
using an accommodation coefficient 1.0 for both insoluble and soluble modes as per Mann et al.
(2010). For this study, the condensation of HNO3 onto dust has been added following the above
method; HNO3 concentrations are taken from the coupled TOMCAT model with condensation
acting as a sink to the HNO3 fields. For simplicity, the condensed HNO3 is added to the sulfate
component as an equivalent mass of H2SO4 that would produce the same mass of H+ ions upon
dissociation of HNO3.
In this study we are interested in the sulfate associated with dust aerosol, rather than the sulfate
associated with sea-salt, and thus have altered the model setup to isolate the dust-associated
sulfate which will be used to determine the amount of associated acid. Full details can be found
in the supporting information (Text S1). The resulting annual dust deposition flux, shown
alongside the data from the standard setup, is compared to AeroCom observations (Huneeus et
al., 2011) in the supporting information (Figure S1) and shows the current setup is able to
simulate dust deposition fluxes both close to source and in remote regions and is comparable to
the original GLOMAP setup.
To simulate the acid dissolution process in GLOMAP two soil databases were used to provide
information on the dust mineralogy. For the different forms of P in the dust the soil phosphorus
database presented by Yang et al. (2013) was used. The database uses a global distribution of soil
parent material and lithological dependent P concentrations along with a pedogenesis
transformation model to simulate the weathering of each parent rock type. The authors present
global distributions of P in different forms as an average of the top 50 cm of the soil profile,
including total-P (TP), labile inorganic P (Lab-P), and apatite-P (Ap-P). A database of global soil
CaCO3 content was obtained from the gridded Global Soil Dataset for use in Earth System
Models (GSDE) developed by Shangguan et al. (2014). A mean content was determined using
the top 50cm of data in order to provide comparable emissions to the P components and to
maximise global coverage of emissions. Figure 1 shows the datasets regridded to a 2.8°
horizontal resolution. Dust TP content typically ranges from 200 – 1000 ppm by mass (global
mean of 563 ppm), Ap-P from 20 – 300 ppm (164 ppm), and Lab-P from 20 – 100 ppm
(50 ppm), whilst CaCO3 content, at over two orders of magnitude greater, typically ranges from
1 – 12% (global mean of 3.3%) of the total dust mass. In terms of global means Lab-P constitutes
9% of TP dust content and varies between 5 – 10%, whereas Ap-P constitutes 29% of TP and

Confidential manuscript submitted to Global Biogeochemical Cycles
varies between 5 – 60%; the major deserts show less variability and Ap-P tends to represent
~50% of TP. The form of P that represents the majority of remaining TP is occluded-P (not
shown; spatial distribution apparent from the low values of Ap-P:TP). Experimental observations
from Stockdale et al. (2016) suggest this form of P is not released through acid dissolution nor
upon deposition to the ocean surface; it is also much more prevalent in the northern boreal
regions where dust uplift is less important.
To simulate the emission and deposition of the dust mineralogy, tracers were included in
GLOMAP alongside dust following previous studies (Atkinson et al., 2013 and Vergara-
Temprado et al., 2017) using the regridded soil-P and CaCO3 datasets. For each tracer the
spatially variable mass fraction of the components from the regridded soil-P and CaCO3
databases were applied to the modelled dust emission at each grid point to produce an associated
mass. Throughout the simulation, dust is considered a single component with the fractional
partition between the constituents conserved for all processes, including interaction between two
dust modes. The simulations produce monthly mean wet and dry mass deposition fluxes (both
impaction and nucleation scavenging) from each grid point for total dust, TP, Ap-P, Lab-P,
CaCO3, and dust-associated acid in the form of the sulfate component.
The acid dissolution process is simulated using parameterizations based on experimental
observations from Stockdale et al. (2016), which provide robust evidence that the dissolution of
Ap-P occurs rapidly (seconds to minutes) and that the system can be replicated by a simple liner
relationship between acid input and Ap-P / CaCO3 dissolution. Linear fits to the experimental
data on a logarithmic scale using all dust samples provides the mass of dissolved Ap-P and
CaCO3 as a function of the absolute number of protons available. The dissolution rate of Ap-P
increases in the absence of CaCO3, therefore an additional step has been introduced to simulate
the enhanced dissolution rate. Stockdale et al. (2016) found that the dissolution of hydroxyapatite
powder was well reproduced by the geochemical PHREEQC model (Parkhurst and Appelo,
2013); this model was used to produce a linear fit between available protons and dissolution of
Ap-P, which provides a means for estimating Ap-P dissolution in the absence of CaCO3. The
resulting parameters from the linear fits can be found in the supporting information (Table S1).
At each grid point (horizontal and vertical) the number of protons available, determined from the
mass of dust-associated sulfate and assuming each mole of H2SO4 dissociates to produce 2 moles
of H+, is used to determine the number of moles of deposited dissolved CaCO3 (mol CaCO3diss)
using Eq. 1. Applying mol CaCO3diss to Eq. 2 provides dissolved Ap-P (mol Ap-Pdiss) from
simultaneous dissolution of Ap-P and CaCO3. If all CaCO3 has been dissolved (i.e.,
mol CaCO3diss= mol CaCO3available
) any excess protons are used to determine a second
source of mol Ap-Pdiss using Eq. 2 under the condition that mol CaCO3available= 0 . The
number of moles of dissolved Ap-P from simultaneous and separate dissolution, constrained by
the available deposited mass of Ap-P, is integrated over each horizontal grid point to provide a
monthly mean surface deposition flux of bioavailable P from Ap-P dissolution. The deposition
fluxes of Lab-P are similarly integrated over each grid point and added to the dissolved Ap-P to
provide the total atmospheric bioavailable P flux to the surface from inorganic mineral dust.
log10(mol CaCO3diss) = a1 + b1 ∙ log10(mol H+) (1)

Confidential manuscript submitted to Global Biogeochemical Cycles
log10(mol Ap-Pdiss) = {a2 + b2 ∙ log10(mol CaCO3diss), if mol CaCO3available > 0
a3 + b3 ∙ log10(mol Hexcess+ ), if mol CaCO3available = 0
(2)
3 Results
3.1 Bioavailable phosphorus
Annual deposition fluxes of bioavailable phosphorus (Bio-P) from dust, dust mass, and the dust-
associated acid for the year 2001 are shown in Figure 2. The large spatial variability in dust
deposition drives the spatial variability of Bio-P. Highest values are found close to major dust
source regions of Sahara and Kalahari deserts in Africa, and across central Asia, the Americas,
and Australia. A significant proportion of the dust is deposited close to the source of emission.
However, considerable transport occurs from all dust source regions driven by large-scale
meteorology, most notably the transport of African dust advecting westwards across the Atlantic
Ocean driven by trade winds, and mid-latitude transport from South America and South Africa
eastwards. Northern Hemisphere mid-latitude transport from Asia across the western and central
Pacific Ocean also provides a considerable transport route for dust to these remote ocean regions.
The amount of acid condensed onto the mineral dust (Figure 2c) shows a strong correlation with
regions of high pollution and dust transport. The industrialized regions of North America,
Europe, central and eastern Asia can be clearly identified, as well as regions of biomass burning
in central Africa. Transported pollutants also play a considerable role over the north-west Pacific
and North Atlantic, as well as northern Africa and the Mediterranean Sea. The low dust loading
in the central Pacific and Atlantic coincident with a moderate amount of acid highlights the
marine source of sulfate emissions from DMS in this region, and a similar correlation in the
northern high latitudes highlights the transport of pollutants from Europe and North America to
this remote region.
Table 1 provides a breakdown of absolute mass and mass per unit area deposited per year
globally, on terrestrial ecosystems, on marine ecosystems, and into each ocean basin and
continent; boundaries to each basin are shown in the supporting information (Figure S2).
Globally, 117 Gg-P yr-1 Bio-P from mineral dust is deposited to the surface annually, with
86 Gg-P yr-1 to the continents and 31 Gg-P yr-1 to the oceans and seas. The large value over land
is dominated by Africa (52 Gg-P yr-1) and Asia (24 Gg-P yr-1), both of which contain large areas
of desert and reflect short-range transport from these important source regions. There is a
considerable spatial variability over the ocean basins. The North Atlantic, North Pacific, and
Indian Oceans dominate the absolute mass of Bio-P deposited to the surface waters accounting
for 37%, 19%, and 18% of all Bio-P deposited to the oceans and seas, respectively. In the North
Atlantic and Indian Ocean this is correlated with the dust mass deposition (52% and 21%), whilst
the North Pacific accounts for only 11% of global dust supply to surface waters. This apparent
enrichment is due to relatively enhanced acid dissolution, which will be discussed in the
following section. The global importance of the Mediterranean Sea as a region impacted by dust
is clearly demonstrated; it accounts for 5% of the total ocean Bio-P and results in the largest
deposited mass per unit area over the oceans (1.5 µg-P m-2day-1) and is exceeded on land only by
Africa (4.8 µg-P m-2day-1) and Asia (1.5 µg-P m-2day-1), which are both important dust source
regions. The NE Atlantic is also strongly impacted because of its proximity to the Saharan

Confidential manuscript submitted to Global Biogeochemical Cycles
Desert, which exhibits a strong outflow over this region and results in a mean deposition rate of
1.2 µg-P m-2day-1.
3.2 Acid dissolution vs labile P
As observed by Stockdale et al. (2016) mineral dust contains Ap-P and Lab-P that both
contribute towards the total fraction of inorganic mineral-borne phosphorus that is potentially
bioavailable in marine surface waters. Although measurements reported by Stockdale et al.
(2016) find Lab-P present in much smaller quantities than Ap-P, the total mass of Lab-P is
directly bioavailable in the surface waters, whereas the Ap-P requires the presence of acid to
yield a bioavailable form of P, hereafter referred to as Acid-P. The differences in immediate
bioavailability of the two components results in distinct regional differences that can be seen in
Figure 3 (panels a and b). Close to the dust source regions (Saharan, Arabian, Gobi, Patagonian,
Kalahari, Great Basin, and Great Australian deserts) the Lab-P dominates the total Bio-P
deposition, whereas further away from source regions and over industrialized regions Acid-P
dominates; the formation of Acid-P is enhanced as dust accumulates condensed acids during
long-range transport and when dust loading is low in proximity to local pollution sources (thus
highlighting areas that are possibly acid-limited in respect to the dissolution of Ap-P). DMS can
also play a role in providing a source of acid over the open oceans, especially in the Pacific
Ocean, Southern Ocean, and Arctic Ocean (Belviso et al., 2004).
Table 1 and Table 2 provide regional information on the annual mean contribution from Lab-P
and Acid-P. Of the total 31.2 Gg-P yr-1 of Bio-P deposited to the oceans 16.9 Gg-P yr-1 is from
Acid-P and 14.3 Gg P yr-1 from Lab-P. The North Atlantic Ocean, Mediterranean Sea, and the
western Indian Ocean, all regions strongly influenced by their proximity to significant dust
sources, are dominated by the Lab-P fraction with 94% of the ocean’s total Lab-P mass being
deposited in these three regions (73%, 7%, and 14%, respectively). Conversely, the Pacific
Ocean, Arctic Ocean, SE Atlantic, South China Sea, and the Southern Ocean, regions further
from dust source regions, are dominated by the acid dissolution process; in these regions the
contribution of Acid-P to the total Bio-P ranges from 75% to 81%. Although dominated by Lab-
P the North Atlantic Ocean, Mediterranean Sea, and western Indian Ocean also receive a
considerable mass of Bio-P from Acid-P. Considerable acid dissolution of Ap-P occurs over the
Pacific Ocean even though this region receives a very small mass of dust (14% of global oceans
dust supply, 25% of global oceans Bio-P supply).
3.3 Spatial variability of TP bioavailability
Estimated percentages of TP bioavailability for dust are shown in Figure 3c and Table 2. The
simulated TP bioavailability from dust varies from ~10% to 60% and is generally negatively
correlated with areas of high dust loading, and positively correlated with acid loading. The Lab-P
content in dust tends to only vary between 9% and 11% of the TP across the globe (see Table 2).
As this pool of phosphorus is deemed directly bioavailable, Bio-P in regions of high dust loading
will be dominated by the Lab-P component and are likely to be less dependent on changes to
acid concentrations. The dominance of Lab-P in high dust loading regions can be seen close to
dust source regions over land and in the NE Atlantic Ocean where TP bioavailability (14%) is
closely matched with the content of Lab-P in the dust (10%). Conversely, in regions that are not

Confidential manuscript submitted to Global Biogeochemical Cycles
dominated by dust loading, such as the central Pacific and the remote Arctic Ocean, Acid-P has a
greater impact and results in a greater TP bioavailability (~50%). Due to the almost constant
percentage of Lab-P in dust TP content the variability in TP bioavailability across the globe is
controlled by the acid dissolution process; this is apparent from the wide range in percentage
contribution of Acid-P in Table 2, which ranges from only 7% over Africa and 29% over the NE
Atlantic, to over 77% in the Pacific and 81% over the Arctic Ocean. These findings highlight the
importance that acid dissolution has on the deposition of Bio-P from dust to remote regions that
have fewer sources of nutrients, such as the Greenland and Antarctic ice sheets, and the Arctic
and Southern oceans. These estimates only refer to the bioavailability of dust-borne P. Results
from the modelling study of Myriokefalitakis et al. (2016) suggest dust is the dominant driver of
the collective bioavailability of P-containing aerosol species in northern hemisphere oceans,
whereas in the southern hemisphere primary biological particles are more pronounced in the
South Atlantic and South Pacific Oceans, and sea spray in the Southern Ocean. Therefore, our
estimates are likely representative of northern hemisphere oceans, but other sources of P may
increasingly drive the observed bioavailability in the high southern hemisphere latitudes.
3.4 Sensitivity of acid dissolution to degree of particle external mixing
The assumption used in this study is that a given mass of dust particles can be treated as if they
are internally mixed, with each dust constituent (Ap-P, Lab-P, and CaCO3) being present at a
constant fraction of each particle’s mass, i.e., in each grid box every particle will contain the
same mass fraction of Ap-P, Lab-P, and CaCO3. This is not necessarily important for the Lab-P
fraction, but the dissolution of Ap-P into Acid-P occurs simultaneously with the dissolution of
CaCO3 at a rate that is faster than when no CaCO3 is present.
To understand the importance of the particle mixing assumption, the deposited masses of dust
and associated acid were split into distinct components to mimic a population of internally and
externally mixed particles of varying concentrations. As previously, all Lab-P is deemed
bioavailable, and hence the deposited Lab-P mass is the same as in the previous experiments. For
a given percentage of externally mixed particles the relevant percentage mass of Ap-P is treated
separately using Eq. 2 and assuming no CaCO3 present, whilst the remaining mass of Ap-P is
assumed internally mixed and treated as per the control experiment using Eq. 2 with the
corresponding mass of CaCO3. A third group, consisting of the externally mixed CaCO3 is also
removed but has no direct impact on the Bio-P and is simply removed along with its associated
condensed acid (thereby having an indirect effect on Bio-P). The modelled uptake efficiency of
acid onto the mineral particle is independent of the degree of external mixing. The total Bio-P
deposited is the sum of Lab-P, internally mixed Acid-P, and externally mixed Acid-P. Externally
mixed percentages of 1%, 2%, 5%, 10%, 25%, 50%, and an extreme case of 100% were used to
determine the change in total Bio-P deposition to each region as a percentage of the control
experiment where all particles are assumed to be internally mixed (0% externally mixed). Results
are shown in Table 3.
The results show that the Bio-P deposition is very sensitive to the assumptions used for the
distribution of components between dust particles. All regions show an increasing deposition rate
of Bio-P with an increasing degree of external mixing. An increase from 0% to 5% results in a
9% increase of Bio-P to the oceans, with most of this from regions with large dust loadings

Confidential manuscript submitted to Global Biogeochemical Cycles
where acid dissolution of Ap-P is usually strongly buffered by CaCO3. Regions that show less
sensitivity are those where acid dissolution is already a dominating process and CaCO3 is close
to exhaustion; in this case the enhanced dissolution rate of Ap-P is already occurring. In reality it
is unlikely that CaCO3 and Ap-P will be exclusively present on different particles, but this
provides insight of how sensitive the process is, and clearly suggests that this assumption is
important for determining the dissolution process of Ap-P, and also other minerals that would
usually be buffered by the CaCO3.
3.5 Evaluation of model simulation
Our modelled deposition fluxes, solely from mineral dust, are evaluated against a dataset of
observed fluxes and in-situ aerosol concentrations from ocean cruises and ground-based
observations compiled by Vet et al. (2014) which includes data from a number of sources (Baker
et al., 2006a; Baker et al., 2006b; Baker et al., 2010; Carbo et al., 2005; Chen and Chen, 2008;
Chen, 2004; Furutani et al., 2010; Herut et al., 1999; Kocak et al., 2005; Koelliker et al., 2004;
Markaki et al., 2003; Migon and Sandroni, 1999; Morales-Baquero et al., 2006;
NADP/AIRMoN, 2010; Oredalen et al., 2010; Ozsoy, 2003; Rodríguez et al., 2011; Tamatamah
et al., 2005; Zhang et al., 2007). Figure 4 and Figure 5a show the observations compared to the
modelled deposition fluxes from our study. Although limited by observations, the model captures
the regional variations in TP: the highest values are found close to source regions, such as the
Mediterranean Sea and off the eastern coast of Africa, and lower values in more remote regions,
such as the central Pacific. Apparently linear features in Figure 5a for the Pacific coast and
Mediterranean occur due to multiple observations being present in the same model grid-box.
Standard deviations of model data, shown in Figure 5a, show considerable variability throughout
the year. The observational dataset contains P from all sources, whereas we only estimate fluxes
for mineral dust. The results support the idea that mineral dust is a globally important source of
P, but it is worth noting that in regions of low dust loading, such as the Southeast Pacific and
Southern Ocean, other sources of P may play a more important role (Myriokefalitakis et al.,
2016).
We also compared our Bio-P estimates to field observations in Figure 4 and Figure 5b. The
model reproduces the observations within an order magnitude for much of the Atlantic Ocean
and Mediterranean Sea but, as with TP, is under-estimating values over the Pacific Ocean and
the land; the under-representation over land is likely due to the enhanced role of other sources of
P. A key result is that when acid dissolution is removed from the model, shown in Figure 5b
using crossed symbols, the Bio-P values are systematically too low compared with
measurements. The normalized mean bias (and with respect to the logarithm) without acid
dissolution is -0.60 (-0.27) and -0.54 (-0.1) when acid dissolution is included. Our model
confirms that acid dissolution in the atmosphere is an important process affecting the deposited
flux of Bio-P (through the addition of Acid-P) to the Earth’s surface.
Overall TP deposition fluxes to ocean basins and seas are compared to other modelling studies in
Table 4. Regional trends show good agreement with other studies: The North Atlantic Ocean is
the globally dominant region for deposition, with the North Pacific Ocean and Indian Ocean also
important regions for deposition. Our results show good agreement with Zhang et al. (2013),
who similarly only considered mineral dust, in all regions except for the North Atlantic for which

Confidential manuscript submitted to Global Biogeochemical Cycles
the authors estimate an additional 40% deposition of TP. Okin et al. (2011) and Myriokefalitakis
et al. (2016) estimate similar fluxes for the Atlantic Ocean but estimate a factor of ~2 to 3 greater
deposition to the Pacific and Indian oceans. Mahowald et al. (2008) estimate considerably
greater fluxes in most regions: the Atlantic Ocean is a factor of 3 greater, and the Pacific and
Indian oceans are a factor of ~4 greater than our estimates. These differences are largely due to
the assumed P content of dust. In our study the P content of the emitted dust was determined
using a soil P-content database from Yang et al. (2013), which results in a global mean TP
content of 489 ppm per mass of dust. Mahowald et al. (2008), assumed a constant P content of
720 ppm, Okin et al. (2011) use 700 ppm, whilst Myriokefalitakis et al. (2016) use a soil
database (Nickovic et al., 2012) and tune emissions to result in a global mean dust TP content of
880 ppm. Using these alternative global mean contents and our modelled dust fluxes would
result in equivalent ocean TP deposition fluxes of 212, 206, and 259 Gg-P yr-1.
Table 4 also compares Bio-P from this study with other modelling studies. Zhang et al. (2015)
provide a good comparison as their study only considers inorganic P from dust and uses a
globally constant TP bioavailability for each mineral, experimentally determined in solution with
a pH of 2. In contrast we use a parameterization based on experiments using a full range of
conditions, which results in a TP bioavailability that depends on acidity levels and dust loading.
In Zhang et al. (2015) the TP bioavailability is ~10% for most of the basins, whereas in this
study the bioavailability varies from ~15% in areas of high dust loading to > 45% in regions of
high pollution or remote regions only accessible through long-range transport. This results in a
global deposition of Bio-P in our study (31.2 Gg-P yr-1) that is roughly double that of Zhang et
al. (2015). Mahowald et al. (2008) estimate Bio-P ocean deposition of 96.5 Gg-P yr-1, which is
roughly three times our estimate. In their study a constant TP bioavailability of 10% for mineral
dust is used, However, the inclusion of other P sources results in a TP bioavailability from all P
sources that is greater than 10% in regions where other P sources are important, such as the
Pacific and Arctic. The increased TP from other sources, and from the assumed TP content of
dust, results in a greater Bio-P deposition estimate than our study.
Myriokefalitakis et al. (2016) estimate 88.7 Gg-P yr-1 Bio-P from inorganic sources only (dust-
borne Lab-P, dissolved Ap-P, and volcanic aerosols), which is a factor of ~3 greater than our
study; this difference arises mainly through differences in the TP content of dust, as well as a
different modelled acid dissolution process, and through contributions from volcanic aerosols
(6 Gg-P yr-1 predominantly to the Pacific Ocean). If we apply the higher dust TP and Lab-P
content from Myriokefalitakis et al. (2016), it increases our global Bio-P estimate by
16 Gg-P yr-1. The final difference occurs through the treatment of the Acid-P production; we
estimate 30 Gg-P yr-1 is deposited globally as Acid-P, compared to 144 Gg-P yr-1 by
Myriokefalitakis et al. (2016). Part of this difference in Acid-P is due to the assumption used in
Myriokefalitakis et al. (2016) that the TP content of dust is comprised of Lab-P and Ap-P only,
whereas other constituents are included in our soil database (e.g., Lab-P and Ap-P make up
~50% of TP in the Sahara Desert). Assuming our deposited dust is only comprised of Lab-P and
Ap-P would provide a factor 3 increase in Ap-P availability, which as shown by our sensitivity
study (Table S2) could have a considerable impact on Bio-P deposition. The final differences in
Acid-P production occur in the different representations of acid dissolution: in our study the
empirically parameterized process is dependent on the absolute number of H+ ions from H2SO4
and HNO3 uptake and calculated offline after deposition, whereas in Myriokefalitakis et al.

Confidential manuscript submitted to Global Biogeochemical Cycles
(2016) an online aerosol thermodynamic equilibrium framework is used to determine conditions
for use in a kinetic model. The added sources of atmospheric acid and detailed treatment of the
particle’s aqueous composition results in greater acid dissolution than the simple experimentally
based method used in our study. However, despite these differences it is an interesting result that
the two methods produce similar spatial patterns but of different magnitudes. Assessing these
differences and identifying the more appropriate method are beyond the scope of this study but
merit further attention.
4 Discussion
There is large spatial variability in the amount of Bio-P supplied to the surface ocean. The largest
flux of dust and of Bio-P, predominantly in the form of Lab-P, is supplied to the NE Atlantic
Ocean; this area is known to have a high dust flux from the world’s major source of mineral dust,
the Sahara Desert. The modelling suggests that this area not only has the highest total input of
Bio-P (6.9 Gg-P yr-1) but also a high input of Bio-P per unit area (436 µg-P m-2yr-1; second to the
Mediterranean Sea with 549 µg-P m-2yr-1). Neuer et al. (2004) suggest the pulses of Saharan dust
seem to exert a feast or famine effect on phytoplankton export from this region. A pulsing that
may be linked to the observed phytoplankton export is apparent in the modelled fluxes (Figures
S3 to S6) which vary between 0.2 and 0.6 Gg-P per month in the NE Atlantic and between 0.4
and 0.9 Gg-P per month in the NW Atlantic, another region with considerable deposition of Bio-
P. In these regions, Saharan dust plumes transported over the N Atlantic meet N American air
masses which are enriched in anthropogenic combustion products. Sedwick et al. (2007)
identified an increase in soluble Fe delivered to the offshore NW Atlantic caused by the N
American polluted air masses. Here we show based on our modelling that these air masses also
increase the amount of Acid-P from the mineral dust transported across the Atlantic from the
Sahara, especially during the summer months when dust transport and acid pollution are both
relatively enhanced.
The total Bio-P supplied to the ocean is the sum of contributions from Lab-P and Acid-P. The
location with the highest mass of deposited Bio-P from Acid-P is the NW Pacific (3.6 Gg-P yr-1).
Our data (Table 1) is averaged over the whole NW Pacific area, however the impact is greatest in
the area directly under the plume from the Gobi and Taklamakan deserts which passes over the
highly polluted air in East Asia (Jaffe et al., 1999) and out into the NW Pacific (Chen et al.,
2017). This plume is rather narrowly confined to ~40°N but has a large effect within that plume
as shown in Figures S3 and S4. We see the strongest peak during the Northern Hemisphere
spring (March-April-May; Figure S5), which is consistent with the findings of Chen et al.
(2017). Maki et al. (2016) find that Asian dust is a major nutrient source to the area of the NW
Pacific under the plume though their study concentrates on the flux of atmospheric nitrate to this
N limited region. As argued below the greatly increased flux of Bio-P from the dust plume will
reduce the potential effect of switching to P limitation and may also increase the N2 fixation in
the surface waters (Jickells and Moore, 2015) as well as increasing the total primary productivity
over longer timescales (Tyrell, 1999).
The location with the highest annual mass of Bio-P per unit area (~550 µg-P m-2yr-1) is the
Mediterranean Sea. This area is particularly sensitive to the addition of extra Bio-P since both the
Western and particularly the Eastern Mediterranean are P limited (Krom et al., 1991; Moutin and

Confidential manuscript submitted to Global Biogeochemical Cycles
Raimbault, 2002; Powley et al., 2017). Any addition of P available to the phytoplankton will
rapidly be taken up into the P-starved water (Krom et al., 2005) and be translated into extra
primary productivity. Microcosm experiments have shown the importance of dust inputs to
increasing primary productivity particularly during the summer when there is minimal nutrient
supply from below (Laghdass et al., 2012; Ridame et al., 2014). Krom et al. (2010) estimated
that Lab-P from atmospheric sources provided 30% of the non-marine external P supplied to the
Eastern Mediterranean while Powley et al. (2017), using a mass-balance model, estimated that
49% of the non-marine external supply to the entire Mediterranean was from atmospheric
supply. African dust outbreaks are estimated by Pey et al. (2013) to occur over the
Mediterranean over 20% of annual days. These plumes of mineral dust, along with locally
derived sources, meet air polluted with acidic gases from Europe including air that has passed
over cities such as Athens (Nenes et al., 2011); this results in extra Acid-P, and thus Bio-P, being
produced. The modelling results are compatible with the predictions made by Nenes et al. (2011)
concerning the effect of acid processing on mineral aerosol over the Mediterranean.
There is also a considerable contribution from Acid-P in both the western and eastern Indian
Ocean. This is an area where dust from local desert regions such as the Arabian Peninsula and
the Thar desert in India meet with air masses polluted from highly populated areas in South and
South-East Asia (Lelieveld et al., 2001), and pollution from biomass burning over Central and
South-eastern Africa and South Asia (Sinha et al., 2004). It has been suggested that atmospheric
aerosols including dust particles, as well as biomass burning and other anthropogenic sources,
are increasing the flux of dissolved nutrients (including phosphate) to the Bay of Bengal
(Srinivas and Sarin, 2015). Rengarajan and Sarin (2004) suggested that aerosols that have been
involved in interactions between mineral dust and pollution also impacted the Arabian Sea; they
identified its effect on Fe and NOx. Here we suggest it also affects the Acid-P.
It is generally assumed that any potential Bio-P (i.e., mineral apatite and/or Fe-bound P) as well
as Lab-P that lands on most parts of the terrestrial system will be consumed by plants. Plants and
their accompanying mycorrhizal fungi are evolved to extract this key nutrient from such minerals
present in the soil (Smits et al., 2012). The only exception to this might be areas of snow, such as
Greenland and the Arctic, which host algal communities which are important for climate change
due to their impact on surface albedo (Lutz et al., 2016). It has been reported that microbes in
arctic glaciers live in P-deficient environments (Stibal et al., 2009) which suggests that
atmospheric input of Bio-P to these key regions may play an important role on local algal and
microbial activity. We estimate that the amount of Bio-P delivered to the major ice sheets of the
world (Greenland and Antarctica) is 0.08 Gg-P yr-1 of which the majority (~80%) is produced by
acid dissolution.
Modelling studies routinely use a constant value for TP bioavailability, which typically ranges
from ~10 to ~15%. From the soil P database used in our study we show that TP bioavailability is
at least 10% due to Lab-P alone and is considerably greater once the Acid-P contribution is
included. For inorganic Bio-P from mineral dust we estimate global mean TP bioavailability of
22% and 12% for oceans and land, respectively. For the ocean basins, we estimate the following:
Pacific Ocean (425%); Atlantic Ocean (18%); Indian Ocean (20%); Mediterranean (15%);
Southern Ocean (46%); and Arctic Ocean (55%). Other studies such as Myriokefalitakis et al.
(2016) show similar increases in TP bioavailability caused by Acid-P. These calculations suggest
Confidential manuscript submitted to Global Biogeochemical Cycles
that while the spatial variability of TP and Bio-P are similar (Table 4), the absolute fluxes vary
considerably to a large extent because of different values for TP in the source material.
Uncertainties in current soil databases primarily arise from a lack of observations and sampling
of under-represented soil types, including species that contain phosphorus (Nickovic et al., 2012;
Yang et al., 2013); the result is poor spatial coverage and a lack of process-level understanding
that yields considerable uncertainties. The sensitivity experiments (Table 3 and Table S2)
highlight the clear need for improved estimates of dust-borne P components at source.
Krishnamurthy et al. (2010) calculated that the addition of atmospheric P to the global ocean will
increase the total carbon uptake by 0.12% based on an estimated 8.3 Gg-P yr-1 Bio-P deposited to
the oceans. However, the authors assumed a globally constant dust TP content of 1050 ppm and
a globally constant TP bioavailability of 15%. In comparison our model estimates Bio-P
deposition from inorganic mineral dust to be ~400% of this value (31.2 Gg-P yr-1) with TP
bioavailability ranging from ~15% to ~50%. Our enhanced Bio-P deposition estimate suggests
the total carbon uptake could be even greater, if the apatite and CaCO3 composition in the
mineral dust population were externally mixed. Assuming all Bio-P is taken up by
phytoplankton, and applying the Redfield ratio, our results suggest the atmospheric input of Bio-
P from mineral dust may account for an uptake of 1.3 Tg-C yr-1, with 0.7 Tg-C yr-1 from acid-
dissolution of mineral dust. If the mineral dust Ap-P/CaCO3 content is deemed 100% externally
mixed, then the total uptake would be 3.0 Tg-C yr-1.
In non Fe-limited areas where the system is N limited in the short term, it has been shown that
most atmospheric input has a high bioavailable N:P ratio and an excess of Fe. It has been
suggested that the input of Fe and N causes the systems to switch towards P limitation (Jickells
and Moore, 2015). The increased Bio-P shown to be formed by these atmospheric acid processes
linked mainly to anthropogenic pollution will slow this process down particularly in areas like
the NW Atlantic (Chien et al., 2016). This study suggests that the abundant acid gases produced
during volcanic eruptions are likely to have a short term but possibly dramatic effect on the
supply of Bio-P to the ocean. Previous work has been confined to the actual Bio-P produced
within the volcanic plume itself, which is rather small (e.g., Mahowald et al., 2008). Here we
predict that a more important effect might be to increase the flux of Bio-P to the ocean due to the
interaction of acid gasses from the volcano with existing mineral particles in the atmosphere.
Stoichiometric proxies have been used to estimate nitrogen fixation rates in oceanic surface
waters. Deutsch et al., (2007) calculated a parameter (P* = PO43-
– NO3-/16) and suggested that
regions with high P* are also regions of the ocean with high N2 fixation rates and vice versa. It is
noticeable that the three regions of the global ocean with low values of P* in their calculations
(north central Atlantic, north western Pacific, and Mediterranean) are also the areas with the
predicted highest fluxes of Acid-P. Superficially the addition of extra bio-P should increase P*,
however a large fraction of the acid which produces acid-P is nitric acid. This is apparent in the
Eastern Mediterranean where the Atmospheric N:P ratio has been observed as high as 105:1
(Markaki et al., 2010). This is an area of the ocean with very low N2 fixation rates (Yogev et al.,
2011). By contrast the N2 fixation rate of the north central Atlantic is relatively high because the
high flux of Saharan dust contains abundant Fe and P, which are required by N2 fixing organisms
(Mills et al., 2004). It is unclear what overall impact the external supply of bio-P from mineral

Confidential manuscript submitted to Global Biogeochemical Cycles
dust has on N2 fixation rates and P*, however, our results provide global estimates that may help
to improve our understanding in the future.
5 Summary
In this study a parameterization for acid-dissolution of mineral apatite, developed using results
presented by Stockdale et al. (2016), was incorporated into a global aerosol model (GLOMAP;
Mann et al., 2010) with a global soil P database (Yang et al., 2013) to model the atmospheric
flux of inorganic bioavailable P from mineral dust. We estimate that 870 G-P yr-1 of inorganic
TP associated with dust is deposited globally, with 726 Gg-P yr-1 to the land and 144 Gg-P yr-1 to
the oceans. Our model is able to discriminate between the leachable (labile) pool of phosphorus
which is present upon emission and the dissolved apatite pool which is a result of the
simultaneous acid-dissolution of apatite and calcium-carbonate; the two pools combined
represent the atmospheric flux of bioavailable phosphorus from dust.
We estimate a global flux of 31 Gg-P yr-1 Bio-P to the oceans with 14.3 Gg-P yr-1 from the labile
pool (Lab-P), and 16.9 Gg-P yr-1 from the acid-dissolved pool (Acid-P). The acid dissolution of
mineral dust increases supply of Bio-P to the oceans by 120%, showing the importance of the
acid dissolution process on global Bio-P fluxes. We identify the Mediterranean Sea, North
Atlantic Ocean, and North Pacific Ocean as particularly important regions for dust-borne Bio-P
deposition.
Our modelling results show that the percentage of deposited dust TP that is in a bioavailable
form ranges from ~10% to ~50%, however, generally it has been assumed in modelling studies
that the percentage of mineral dust TP bioavailability is globally constant, with values between
10% and 15% commonly used. We use a similar approach to Myriokefalitakis et al. (2016) to
show that although the labile fraction of TP is globally constant at ~10%, the acid-dissolved pool
increased the mean TP bioavailability over oceans to 22% with considerable variation between
ocean basins: Pacific Ocean (45%); Atlantic Ocean (23%); Indian Ocean (21%); and
Mediterranean (15%). This variability again highlights the impact that the acid-dissolution
process has on the global flux of Bio-P from dust.
The world’s largest dust sources all have relatively enriched levels of dust-P pools but show
variability between sources. We therefore advise against using global constant values for dust-P
pools and recommend using global databases of soil-P content. In our study we used a
pedogenesis-based soil-P database from Yang et al. (2013) which resulted in a global mean
deposited dust TP content of 489 ppm with 49 ppm from Lab-P and 243 ppm from Ap-P, with all
pools displaying roughly one order of magnitude variability across the globe. Comparing these
results with other modelling studies and results from a series of sensitivity tests highlighted the
affect that the assumed dust mineralogical content has on the Bio-P flux. It is noted that there is
no consensus on the global mean deposited dust TP and previous studies have used higher values
(e.g., 880 ppm by Myriokefalitakis et al. (2016) and 720 ppm by Mahowald et al. (2008)).
From our sensitivity study we have identified that treating the dust population as an externally
rather than internally mixed population (i.e., assuming the population exhibits particle-to-particle
diversity in apatite and CaCO3 content) results in a considerable increase in global Bio-P flux
(44% increase for a 25% externally mixed population). It is currently not known which treatment
is appropriate and requires more research.

Confidential manuscript submitted to Global Biogeochemical Cycles
Our results confirm the importance of acid processes in the atmosphere in increasing the flux of
Bio-P to the global ocean as suggested by Nenes et al. (2011). The effect is spatially and
temporally variable and it is suggested that increased Bio-P can result in regionally important
changes in biogeochemical processes such as nutrient limitation, nitrogen fixation rates and
carbon uptake.
Acknowledgements
This research was funded by the Leverhulme Trust Research Project Grant RPG 406, entitled
“Understanding the Delivery of phosphorus nutrient to the oceans”. KSC acknowledges funding
from the EU CRESCENDO project under grant agreement No 641816. The authors wish to
thank T. Nenes, M. Kanikidou, and S. Myriokefalitakis for useful discussions and for providing
data used in the comparison to Myriokefalitakis et al. (2016). The authors also wish to thank R.
Vet for providing the observational dataset used; this source is listed in the references. Other data
used are listed in the references, tables, and supplementary information.
References
Atkinson, J. D., Murray, B. J., Woodhouse, M. T., Whale, T. F., Baustian, K. J., Carslaw, K. S.,
Dobbie, S., O'Sullivan, D., and Malkin, T. L. (2013), The importance of feldspar for ice
nucleation by mineral dust in mixed-phase clouds. Nature, 498, 355-358. 10.1038/nature12278
Baker, A. R., French, M., and Linge, K. L. (2006a), Trends in aerosol nutrient solubility along a
west–east transect of the Saharan dust plume. Geophysical Research Letters, 33, L07805.
10.1029/2005gl024764
Baker, A. R., Jickells, T. D., Witt, M., and Linge, K. L. (2006b), Trends in the solubility of iron,
aluminium, manganese and phosphorus in aerosol collected over the Atlantic Ocean. Marine
Chemistry, 98, 43-58. 10.1016/j.marchem.2005.06.004
Baker, A. R., Lesworth, T., Adams, C., Jickells, T. D., and Ganzeveld, L. (2010), Estimation of
atmospheric nutrient inputs to the Atlantic Ocean from 50°N to 50°S based on large-scale field
sampling: Fixed nitrogen and dry deposition of phosphorus. Global Biogeochemical Cycles, 24,
GB3006. 10.1029/2009gb003634
Belviso, S., Moulin, C., Bopp, L., and Stefels, J. (2004), Assessment of a global climatology of
oceanic dimethylsulfide (DMS) concentrations based on SeaWiFS imagery (1998-2001).
Canadian Journal of Fisheries and Aquatic Sciences, 61, 804-816. 10.1139/f04-001
Brahney, J., Mahowald, N., Ward, D. S., Ballantyne, A. P., and Neff, J. C. (2015), Is atmospheric
phosphorus pollution altering global alpine Lake stoichiometry? Global Biogeochemical Cycles,
29, 1369-1383. 10.1002/2015gb005137

Confidential manuscript submitted to Global Biogeochemical Cycles
Browse, J., Carslaw, K. S., Arnold, S. R., Pringle, K., and Boucher, O. (2012), The scavenging
processes controlling the seasonal cycle in Arctic sulfate and black carbon aerosol. Atmospheric
Chemistry and Physics, 12, 6775-6798. 10.5194/acp-12-6775-2012
Carbo, P., Krom, M. D., Homoky, W. B., Benning, L. G., and Herut, B. (2005), Impact of
atmospheric deposition on N and P geochemistry in the southeastern Levantine basin. Deep Sea
Research Part II: Topical Studies in Oceanography, 52, 3041-3053. 10.1016/j.dsr2.2005.08.014
Chen, H.-Y., & Chen, L.-D. (2008), Importance of anthropogenic inputs and continental-derived
dust for the distribution and flux of water-soluble nitrogen and phosphorus species in aerosol
within the atmosphere over the East China Sea. Journal of Geophysical Research, 113, D11303.
10.1029/2007jd009491
Chen, S., Huang, J., Kang, L., Wang, H., Ma, X., He, Y., Yuan, T., Yang, B., Huang, Z., and
Zhang, G. (2017), Emission, transport, and radiative effects of mineral dust from the Taklimakan
and Gobi deserts: comparison of measurements and model results. Atmospheric Chemistry and
Physics, 17, 2401-2421. 10.5194/acp-17-2401-2017
Chen, Y. (2004), Sources and Fate of Atmospheric Nutrients over the Remote Oceans and Their
Role on Controlling Marine Diazotrophic Microorganisms, Ph.D. diss., Univ. of Maryland,
College Park.
Chien, C.-T., Mackey, K. R. M., Dutkiewicz, S., Mahowald, N. M., Prospero, J. M., and Paytan,
A. (2016), Effects of African dust deposition on phytoplankton in the western tropical Atlantic
Ocean off Barbados. Global Biogeochemical Cycles, 30, 716-734. 10.1002/2015gb005334
Chipperfield, M. P. (2006), New version of the TOMCAT/SLIMCAT off-line chemical transport
model: Intercomparison of stratospheric tracer experiments. Quarterly Journal of the Royal
Meteorological Society, 132, 1179-1203. 10.1256/qj.05.51
Dentener, F., Kinne, S., Bond, T., Boucher, O., Cofala, J., Generoso, S., Ginoux, P., Gong, S.,
Hoelzemann, J. J., Ito, A., Marelli, L., Penner, J. E., Putaud, J. P., Textor, C., Schulz, M., van der
Werf, G. R., and Wilson, J. (2006), Emissions of primary aerosol and precursor gases in the
years 2000 and 1750 prescribed data-sets for AeroCom. Atmospheric Chemistry and Physics, 6,
4321-4344. 10.5194/acp-6-4321-2006
Deutsch, C., Sarmiento, J. L., Sigman, D. M., Gruber, N., Dunne, J. P. (2007), Spatial coupling
of nitrogen inputs and losses in the ocean. Nature, 445, 163-167. 10.1038/nature05392
Diehl, T., Heil, A., Chin, M., Pan, X., Streets, D., Schultz, M., and Kinne, S. (2012),
Anthropogenic, biomass burning, and volcanic emissions of black carbon, organic carbon, and
SO2 from 1980 to 2010 for hindcast model experiments. Atmospheric Chemistry and Physics
Discussions, 12, 24895-24954. 10.5194/acpd-12-24895-2012
Confidential manuscript submitted to Global Biogeochemical Cycles
Eijsink, L. M., Krom, M. D., and Herut, B. (2000), Speciation and burial flux of phosphorus in
the surface sediments of the eastern Mediterranean. American Journal of Science, 300, 483-503.
10.2475/ajs.300.6.483
Fuchs, N. A., and Sutugin, A. G. (1971), High-Dispersed Aerosols, in: Topics in Current Aerosol
Research, edited by: Brock, J. R., Pergamon, 1.
Furutani, H., Meguro, A., Iguchi, H., and Uematsu, M. (2010), Geographical distribution and
sources of phosphorus in atmospheric aerosol over the North Pacific Ocean. Geophysical
Research Letters, 37, L03805. 10.1029/2009gl041367
Graham, W. F., and Duce, R. A. (1967), The atmospheric transport of phosphorus to the western
North Atlantic. Atmospheric Environment, 16, 1089-1097. 10.1016/0004-6981(82)90198-6
Herut, B., Krom, M. D., Pan, G., and Mortimer, R. (1999), Atmospheric input of nitrogen and
phosphorus to the Southeast Mediterranean: Sources, fluxes, and possible impact. Limnology and
Oceanography, 44, 1683-1692. 10.4319/lo.1999.44.7.1683
Herut, B., Zohary, T., Krom, M. D., Mantoura, R. F. C., Pitta, P., Psarra, S., Rassoulzadegan, F.,
Tanaka, T., and Frede Thingstad, T. (2005), Response of East Mediterranean surface water to
Saharan dust: On-board microcosm experiment and field observations. Deep Sea Research Part
II: Topical Studies in Oceanography, 52, 3024-3040. 10.1016/j.dsr2.2005.09.003
Huneeus, N., Schulz, M., Balkanski, Y., Griesfeller, J., Prospero, J., Kinne, S., Bauer, S.,
Boucher, O., Chin, M., Dentener, F., Diehl, T., Easter, R., Fillmore, D., Ghan, S., Ginoux, P.,
Grini, A., Horowitz, L., Koch, D., Krol, M. C., Landing, W., Liu, X., Mahowald, N., Miller, R.,
Morcrette, J. J., Myhre, G., Penner, J., Perlwitz, J., Stier, P., Takemura, T., and Zender, C. S.
(2011), Global dust model intercomparison in AeroCom phase I. Atmospheric Chemistry and
Physics, 11, 7781-7816. 10.5194/acp-11-7781-2011
Jaffe, D., Anderson, T., Covert, D., Kotchenruther, R., Trost, B., Danielson, J., Simpson, W.,
Berntsen, T., Karlsdottir, S., Blake, D., Harris, J., Carmichael, G., and Uno, I. (1999), Transport
of Asian air pollution to North America. Geophysical Research Letters, 26, 711-714.
10.1029/1999GL900100
Jickells, T., and Moore, C. M. (2015), The Importance of Atmospheric Deposition for Ocean
Productivity. Annual Review of Ecology, Evolution, and Systematics, 46, 481-501.
10.1146/annurev-ecolsys-112414-054118
Kanakidou, M., Duce, R. A., Prospero, J. M., Baker, A. R., Benitez-Nelson, C., Dentener, F. J.,
Hunter, K. A., Liss, P. S., Mahowald, N., Okin, G. S., Sarin, M., Tsigaridis, K., Uematsu, M.,
Zamora, L. M., and Zhu, T. (2012), Atmospheric fluxes of organic N and P to the global ocean.
Global Biogeochemical Cycles, 26, GB3026. 10.1029/2011gb004277
Kettle, A. J., Andreae, M. O., Amouroux, D., Andreae, T. W., Bates, T. S., Berresheim, H.,
Bingemer, H., Boniforti, R., Curran, M. A. J., DiTullio, G. R., Helas, G., Jones, G. B., Keller, M.

Confidential manuscript submitted to Global Biogeochemical Cycles
D., Kiene, R. P., Leck, C., Levasseur, M., Malin, G., Maspero, M., Matrai, P., McTaggart, A. R.,
Mihalopoulos, N., Nguyen, B. C., N 258ovo, A., Putaud, J. P., Rapsomanikis, S., Roberts, G.,
Schebeske, G., Sharma, S., Simó, R., Staubes, R., Turner, S., and Uher, G. (1999), A global
database of sea surface dimethylsulfide (DMS) measurements and a procedure to predict sea
surface DMS as a function of latitude, longitude, and month. Global Biogeochemical Cycles, 13,
399-444. 10.1029/1999gb900004
Kocak, M., Kubilay, N., Herut, B., and Nimmo, M. (2005), Dry atmospheric fluxes of trace
metals (Al, Fe, Mn, Pb, Cd, Zn, Cu) over the Levantine Basin: A refined assessment.
Atmospheric Environment, 39, 7330-7341. 10.1016/j.atmosenv.2005.09.010
Koelliker, Y., Totten, L. A., Gigliotti, C. L., Offenberg, J. H., Reinfelder, J. R., Zhuang, Y., and
Eisenreich, S. J. (2004), Atmospheric Wet Deposition of Total Phosphorus in New Jersey.
Water, Air, & Soil Pollution, 154, 139-150. 10.1023/B:WATE.0000022952.12577.c5
Krishnamurthy, A., Moore, J. K., Mahowald, N., Luo, C., and Zender, C. S. (2010), Impacts of
atmospheric nutrient inputs on marine biogeochemistry. Journal of Geophysical Research, 115,
G01006. 10.1029/2009jg001115
Krom, M. D., Kress, N., Brenner, S., and Gordon, L. I. (1991), Phosphorus limitation of primary
productivity in the eastern Mediterranean Sea. Limnology and Oceanography, 36, 424-432.
10.4319/lo.1991.36.3.0424
Krom, M. D., Thingstad, T. F., Brenner, S., Carbo, P., Drakopoulos, P., Fileman, T. W., Flaten,
G. A. F., Groom, S., Herut, B., Kitidis, V., Kress, N., Law, C. S., Liddicoat, M. I., Mantoura, R.
F. C., Pasternak, A., Pitta, P., Polychronaki, T., Psarra, S., Rassoulzadegan, F., Skjoldal, E. F.,
Spyres, G., Tanaka, T., Tselepides, A., Wassmann, P., Wexels Riser, C., Woodward, E. M. S.,
Zodiatis, G., and Zohary, T. (2005), Summary and overview of the CYCLOPS P addition
Lagrangian experiment in the Eastern Mediterranean. Deep Sea Research Part II: Topical
Studies in Oceanography, 52, 3090-3108. 10.1016/j.dsr2.2005.08.018
Krom, M. D., Emeis, K. C., and Van Cappellen, P. (2010), Why is the Eastern Mediterranean
phosphorus limited? Progress in Oceanography, 85, 236-244. 10.1016/j.pocean.2010.03.003
Laghdass, M., Catala, P., Caparros, J., Oriol, L., Lebaron, P., and Obernosterer, I. (2012), High
contribution of SAR11 to microbial activity in the north west Mediterranean Sea. Microb Ecol,
63, 324-333. 10.1007/s00248-011-9915-7
Lelieveld, J., Crutzen, P. J., Ramanathan, V., Andreae, M. O., Brenninkmeijer, C. A. M.,
Campos, T., Cass, G. R., Dickerson, R. R., Fischer, H., de Gouw, J. A., Hansel, A., Jefferson, A.,
Kley, D., de Laat, A. T. J., Lal, S., Lawrence, M. G., Lobert, J. M., Mayol-Bracero, O. L., Mitra,
A. P., Novakov, T., Oltmans, S. J., Prather, K. A., Reiner, T., Rodhe, H., Scheeren, H. A., Sikka,
D., and Williams, J. (2001), The Indian Ocean Experiment: Widespread Air Pollution from
South and Southeast Asia. Science, 291, 1031-1036. 10.1126/science.1057103
Confidential manuscript submitted to Global Biogeochemical Cycles
Lutz, S., Anesio, A. M., Raiswell, R., Edwards, A., Newton, R. J., Gill, F., and Benning, L. G.
(2016), The biogeography of red snow microbiomes and their role in melting arctic glaciers.
Nature Comms, 7, 11968. 10.1038/ncomms11968
Mahowald, N., Jickells, T. D., Baker, A. R., Artaxo, P., Benitez-Nelson, C. R., Bergametti, G.,
Bond, T. C., Chen, Y., Cohen, D. D., Herut, B., Kubilay, N., Losno, R., Luo, C., Maenhaut, W.,
McGee, K. A., Okin, G. S., Siefert, R. L., and Tsukuda, S. (2008), Global distribution of
atmospheric phosphorus sources, concentrations and deposition rates, and anthropogenic
impacts. Global Biogeochemical Cycles, 22, GB4026. 10.1029/2008gb003240
Mahowald, N. M. (2004), Comment on “Relative importance of climate and land use in
determining present and future global soil dust emission” by I. Tegen et al. Geophysical
Research Letters, 31, L24105. 10.1029/2004gl021272
Maki, T., Ishikawa, A., Mastunaga, T., Pointing, S. B., Saito, Y., Kasai, T., Watanabe, K., Aoki,
K., Horiuchi, A., Lee, K. C., Hasegawa, H., Iwasaka, Y. (2016), Atmospheric aerosol deposition
influences marine microbial communities in oligotrophic surface waters of the western Pacific
Ocean. Deep-Sea Research, 118, 37-45. 10.1016/j.dsr.2016.10.002
Mann, G. W., Carslaw, K. S., Spracklen, D. V., Ridley, D. A., Manktelow, P. T., Chipperfield,
M. P., Pickering, S. J., and Johnson, C. E. (2010), Description and evaluation of GLOMAP-
mode: a modal global aerosol microphysics model for the UKCA composition-climate model.
Geoscientific Model Development, 3, 519-551. 10.5194/gmd-3-519-2010
Markaki, Z., Oikonomou, K., Kocak, M., Kouvarakis, G., Chaniotaki, A., Kubilay, N., and
Mihalopoulos, N. (2003), Atmospheric deposition of inorganic phosphorus in the Levantine
Basin, eastern Mediterranean: Spatial and temporal variability and its role in seawater
productivity. Limnology and Oceanography, 48, 1557-1568. 10.4319/lo.2003.48.4.1557
Markaki, Z., Loÿe-Pilot, M. D., Violaki, K., Benyahya, L., Mihalopoulos, N. (2010), Variability
of atmospheric deposition of dissolved nitrogen and phosphorus in the Mediterranean and
possible link to the anomalous seawater N/P ratio. Marine Chemistry, 120, 187-194.
10.1016/j.marchem.2008.10.005
Migon, C., & Sandroni, V. (1999), Phosphorus in rainwater: Partitioning inputs and impact on
the surface coastal ocean. Limnology and Oceanography, 44, 1160-1165.
10.4319/lo.1999.44.4.1160
Mills, M. M., Ridame, C., Davey, M., La Roche, J., Geider, R. J. (2004), Iron and phosphorus
co-limit nitrogen fixation in the eastern tropical North Atlantic. Nature, 429, 292-294.
10.1038/nature02550
Morales-Baquero, R., Pulido-Villena, E., and Reche, I. (2006), Atmospheric inputs of
phosphorus and nitrogen to the southwest Mediterranean region: Biogeochemical responses of
high mountain lakes. Limnology and Oceanography, 51, 830-837. 10.4319/lo.2006.51.2.0830

Confidential manuscript submitted to Global Biogeochemical Cycles
Moutin, T., & Raimbault, P. (2002), Primary production, carbon export and nutrients availability
in western and eastern Mediterranean Sea in early summer 1996 (MINOS cruise). Journal of
Marine Systems, 33-34, 273-288. 10.1016/S0924-7963(02)00062-3
Myriokefalitakis, S., Nenes, A., Baker, A. R. (2016), Mihalopoulos, N., and Kanakidou, M.:
Bioavailable atmospheric phosphorous supply to the global ocean: a 3-D global modeling study.
Biogeosciences, 13, 6519-6543. 10.5194/bg-13-6519-2016
NADP/AIRMoN: (Atmospheric Integrated Research Monitoring Network), (2010), National
Atmospheric Deposition Program (NADP) Office, Illinois State Water Survey, 2204 Griffith Dr.,
Champaign, IL, U.S., Website: http://nadp.sws.uiuc.edu/AIRMoN/
Nenes, A., Krom, M. D., Mihalopoulos, N., Van Cappellen, P., Shi, Z., Bougiatioti, A., Zarmpas,
P., and Herut, B. (2011), Atmospheric acidification of mineral aerosols: a source of bioavailable
phosphorus for the oceans. Atmospheric Chemistry and Physics, 11, 6265-6272. 10.5194/acp-11-
6265-2011
Neuer, S., Torres-Padrón, M. E., Gelado-Caballero, M. D., Rueda, M. J., Hernández-Brito, J.,
Davenport, R., and Wefer, G. (2004), Dust deposition pulses to the eastern subtropical North
Atlantic gyre: Does ocean's biogeochemistry respond? Global Biogeochemical Cycles, 18,
GB4020. 10.1029/2004gb002228
Nickovic, S., Vukovic, A., Vujadinovic, M., Djurdjevic, V., and Pejanovic, G. (2012), Technical
Note: High-resolution mineralogical database of dust-productive soils for atmospheric dust
modeling. Atmospheric Chemistry and Physics, 12, 845-855. 10.5194/acp-12-845-2012
Nightingale, P. D., Malin, G., Law, C. S., Watson, A. J., Liss, P. S., Liddicoat, M. I., Boutin, J.,
and Upstill-Goddard, R. C. (2000), In situ evaluation of air-sea gas exchange parameterizations
using novel conservative and volatile tracers. Global Biogeochemical Cycles, 14, 373-387.
10.1029/1999gb900091
Okin, G. S., Baker, A. R., Tegen, I., Mahowald, N. M., Dentener, F. J., Duce, R. A., Galloway, J.
N., Hunter, K., Kanakidou, M., Kubilay, N., Prospero, J. M., Sarin, M., Surapipith, V., Uematsu,
M., and Zhu, T. (2011), Impacts of atmospheric nutrient deposition on marine productivity:
Roles of nitrogen, phosphorus, and iron. Global Biogeochemical Cycles, 25, GB2022.
10.1029/2010gb003858
Oredalen, T., Aas, W., and Maenhaut, W. (2010), Atmospheric dry and wet deposition of
phosphorus in southern Norway. In: Data obtained from the World Meteorological Organization
Scientific Advisory Group of Precipitation Chemistry Workshop, Berg-en-Dal, South Africa, 15-
20 March 2010
Ozsoy, T. (2003), Atmospheric wet deposition of soluble macro-nutrients in the Cilician Basin,
north-eastern Mediterranean sea. J Environ Monit, 5, 971-976. 10.1039/B309636J

Confidential manuscript submitted to Global Biogeochemical Cycles
Parkhurst, D. L., & Appelo, C. A. J. (2013), Description of input and examples for PHREEQC
version 3 - A computer program for speciation, batch-reaction, one-dimensional transport, and
inverse geochemical calculations. U.S. Geological Survey Techniques and Methods, Book 6
Pey, J., Querol, X., Alastuey, A., Forastiere, F., and Stafoggia, M. (2013), African dust outbreaks
over the Mediterranean Basin during 2001-2011: PM10 concentrations, phenomenology and
trends, and its relation with synoptic and mesoscale meteorology. Atmospheric Chemistry and
Physics, 13, 1395-1410. 10.5194/acp-13-1395-2013
Powley, H. R., Krom, M. D., and Van Cappellen, P. (2017), Understanding the unique
biogeochemistry of the Mediterranean Sea: Insights from a coupled phosphorus and nitrogen
model. Global Biogeochemical Cycles, 31, 1010-1031. 10.1002/2017gb005648
Rengarajan, R., and Sarin, M. M. (2004), Atmospheric deposition fluxes of 7Be, 210Pb and
chemical species to the Arabian Sea and Bay of Bengal. Indian Journal of Marine Sciences, 33,
56-64.
Ridame, C., Dekaezemacker, J., Guieu, C., Bonnet, S., L'Helguen, S., and Malien, F. (2014),
Contrasted Saharan dust events in LNLC environments: impact on nutrient dynamics and
primary production. Biogeosciences, 11, 4783-4800. 10.5194/bg-11-4783-2014
Rodríguez, S., Alastuey, A., Alonso-Pérez, S., Querol, X., Cuevas, E., Abreu-Afonso, J., Viana,
M., Pérez, N., Pandolfi, M., and de la Rosa, J. (2011), Transport of desert dust mixed with North
African industrial pollutants in the subtropical Saharan Air Layer. Atmospheric Chemistry and
Physics, 11, 6663-6685. 10.5194/acp-11-6663-2011
Ruttenberg, K. C. (2003), The Global Phosphorus Cycle. Treatise on Geochemistry, 8, 585-643.
10.1016/B0-08-043751-6/08153-6
Sedwick, P. N., Sholkovitz, E. R., and Church, T. M. (2007), Impact of anthropogenic
combustion emissions on the fractional solubility of aerosol iron: Evidence from the Sargasso
Sea. Geochemistry, Geophysics, Geosystems, 8, Q10Q06. 10.1029/2007gc001586
Shangguan, W., Dai, Y., Duan, Q., Liu, B., and Yuan, H. (2014), A global soil data set for earth
system modeling. Journal of Advances in Modeling Earth Systems, 6, 249-263.
10.1002/2013ms000293
Sinha, P., Jaeglé, L., Hobbs, P. V., and Liang, Q. (2004), Transport of biomass burning
emissions from southern Africa. Journal of Geophysical Research: Atmospheres, 109, D20204.
10.1029/2004JD005044
Slinn, W. G. N. (1982), Predictions for particle deposition to vegetative canopies. Atmospheric
Environment, 16, 1785-1794. 10.1016/0004-6981(82)90271-2

Confidential manuscript submitted to Global Biogeochemical Cycles
Smits, M. M., Bonneville, S., Benning, L. G., Banwart, S. A., Leake, J. R. (2012), Plant-driven
weathering of apatite – the role of an ectomycorrhizal fungus. Geobiology, 10, 445-456.
10.1111/j.1472-4669.2012.00331.x
Srinivas, B., & Sarin, M. M. (2015), Atmospheric deposition of phosphorus to the Northern
Indian Ocean. Current Science, 108, 1300-1305. 10.1016/j.scitotenv.2013.03.068
Stibal, M., Anesio, A. M., Blues, C. J. D., Tranter, M. (2009), Phosphatase activity and organic
phosphorus turnover on a high Arctic glacier. Biogeosciences, 6, 913-922. 10.5194/bg-6-913-
2009
Stockdale, A., Krom, M. D., Mortimer, R. J., Benning, L. G., Carslaw, K. S., Herbert, R. J., Shi,
Z., Myriokefalitakis, S., Kanakidou, M., and Nenes, A. (2016), Understanding the nature of
atmospheric acid processing of mineral dusts in supplying bioavailable phosphorus to the oceans.
Proc Natl Acad Sci USA, 113, 14639-14644. 10.1073/pnas.1608136113
Tamatamah, R. A., Hecky, R. E., and Duthie, H. (2005), The atmospheric deposition of
phosphorus in Lake Victoria (East Africa). Biogeochemistry, 73, 325-344. 10.1007/s10533-004-
0196-9
Thingstad, T. F., Krom, M. D., Mantoura, R. F., Flaten, G. A., Groom, S., Herut, B., Kress, N.,
Law, C. S., Pasternak, A., Pitta, P., Psarra, S., Rassoulzadegan, F., Tanaka, T., Tselepides, A.,
Wassmann, P., Woodward, E. M., Riser, C. W., Zodiatis, G., and Zohary, T. (2005), Nature of
phosphorus limitation in the ultraoligotrophic eastern Mediterranean. Science, 309, 1068-1071.
10.1126/science.1112632
Tipping, E., Benham, S., Boyle, J. F., Crow, P., Davies, J., Fischer, U., Guyatt, H., Helliwell, R.,
Jackson-Blake, L., Lawlor, A. J., Monteith, D. T., Rowe, E. C., and Toberman, H. (2014),
Atmospheric deposition of phosphorus to land and freshwater. Environ Sci Process Impacts, 16,
1608-1617. 10.1039/c3em00641g
Tyrrell, T. (1999), The relative influences of nitrogen and phosphorus on oceanic primary
production. Nature, 400, 525-531. 10.1038/22941
van der Werf, G. R., Randerson, J. T., Giglio, L., Collatz, G. J., Mu, M., Kasibhatla, P. S.,
Morton, D. C., DeFries, R. S., Jin, Y., and van Leeuwen, T. T. (2010), Global fire emissions and
the contribution of deforestation, savanna, forest, agricultural, and peat fires (1997–2009).
Atmospheric Chemistry and Physics, 10, 11707-11735. 10.5194/acp-10-11707-2010
Vergara-Temprado, J., Murray, B. J., Wilson, T. W., amp, apos, Sullivan, D., Browse, J., Pringle,
K. J., Ardon-Dryer, K., Bertram, A. K., Burrows, S. M., Ceburnis, D., DeMott, P. J., Mason, R.
H., amp, apos, Dowd, C. D., Rinaldi, M., and Carslaw, K. S. (2017), Contribution of feldspar and
marine organic aerosols to global ice nucleating particle concentrations. Atmospheric Chemistry
and Physics, 17, 3637-3658. 10.5194/acp-17-3637-2017

Confidential manuscript submitted to Global Biogeochemical Cycles
Vet, R., Artz, R. S., Carou, S., Shaw, M., Ro, C.-U., Aas, W., Baker, A., Bowersox, V. C.,
Dentener, F., Galy-Lacaux, C., Hou, A., Pienaar, J. J., Gillett, R., Forti, M. C., Gromov, S., Hara,
H., Khodzher, T., Mahowald, N. M., Nickovic, S., Rao, P. S. P., and Reid, N. W. (2014), A
global assessment of precipitation chemistry and deposition of sulfur, nitrogen, sea salt, base
cations, organic acids, acidity and pH, and phosphorus. Atmospheric Environment, 93, 3-100.
10.1016/j.atmosenv.2013.10.060
Wang, R., Balkanski, Y., Bopp, L., Aumont, O., Boucher, O., Ciais, P., Gehlen, M., Penuelas, J.,
Ethe, C., Hauglustaine, D., Li, B., Liu, J., Zhou, F., and Tao, S. (2015), Influence of
anthropogenic aerosol deposition on the relationship between oceanic productivity and warming.
Geophys Res Lett, 42, 10745-10754. 10.1002/2015GL066753
Wu, J., Sunda, W., Boyle, E. A., and Karl, D. M. (2000), Phosphate depletion in the western
North Atlantic Ocean. Science, 289, 759-762. 10.1126/science.289.5480.759
Yang, X., Post, W. M., Thornton, P. E., and Jain, A. (2013), The distribution of soil phosphorus
for global biogeochemical modeling. Biogeosciences, 10, 2525-2537. 10.5194/bg-10-2525-2013
Yogev, T., Rahav, E., Bar-Zeev, E., Man-Aharonovich, D., Stambler, N., Kress, N., Béjà, O.,
Mulholland, M. R., Herut, B., Berman-Frank, I. (2011), Is dinitrogen fixation significant in the
Levantine Basin, East Mediterranean Sea? Environmental Microbiology, 13, 854-871.
doi:10.1111/j.1462-2920.2010.02402.x
Zamora, L. M., Prospero, J. M., Hansell, D. A., and Trapp, J. M. (2013), Atmospheric P
deposition to the subtropical North Atlantic: sources, properties, and relationship to N
deposition. Journal of Geophysical Research: Atmospheres, 118, 1546-1562. 10.1002/jgrd.50187
Zhang, G., Zhang, J., and Liu, S. (2007), Characterization of nutrients in the atmospheric wet and
dry deposition observed at the two monitoring sites over Yellow Sea and East China Sea.
Journal of Atmospheric Chemistry, 57, 41-57. 10.1007/s10874-007-9060-3
Zhang, Y., Mahowald, N., Scanza, R. A., Journet, E., Desboeufs, K., Albani, S., Kok, J. F.,
Zhuang, G., Chen, Y., Cohen, D. D., Paytan, A., Patey, M. D., Achterberg, E. P., Engelbrecht, J.
P., and Fomba, K. W. (2015), Modeling the global emission, transport and deposition of trace
elements associated with mineral dust. Biogeosciences, 12, 5771-5792. 10.5194/bg-12-5771-
2015
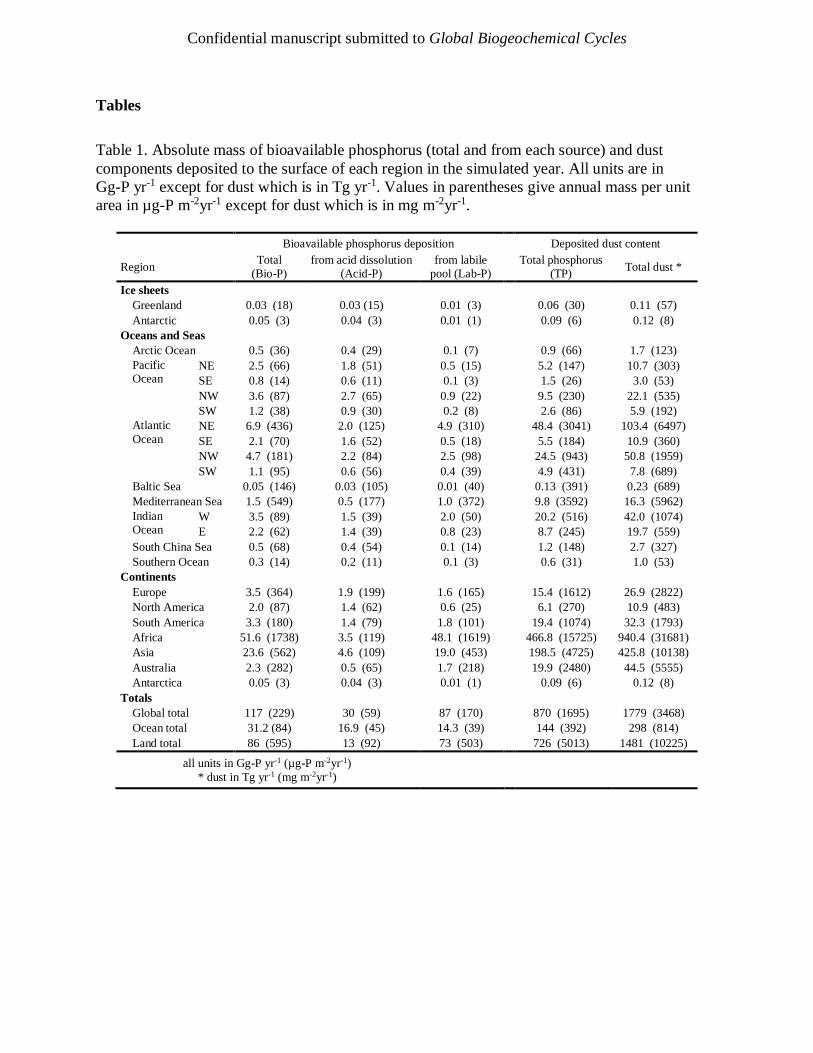
Confidential manuscript submitted to Global Biogeochemical Cycles
Tables
Table 1. Absolute mass of bioavailable phosphorus (total and from each source) and dust
components deposited to the surface of each region in the simulated year. All units are in
Gg-P yr-1 except for dust which is in Tg yr-1. Values in parentheses give annual mass per unit
area in µg-P m-2yr-1 except for dust which is in mg m-2yr-1.
Bioavailable phosphorus deposition Deposited dust content
Region Total
(Bio-P)
from acid dissolution
(Acid-P)
from labile
pool (Lab-P)
Total phosphorus
(TP) Total dust *
Ice sheets
Greenland 0.03 (18) 0.03 (15) 0.01 (3) 0.06 (30) 0.11 (57)
Antarctic 0.05 (3) 0.04 (3) 0.01 (1) 0.09 (6) 0.12 (8)
Oceans and Seas
Arctic Ocean 0.5 (36) 0.4 (29) 0.1 (7) 0.9 (66) 1.7 (123)
Pacific
Ocean NE 2.5 (66) 1.8 (51) 0.5 (15) 5.2 (147) 10.7 (303)
SE 0.8 (14) 0.6 (11) 0.1 (3) 1.5 (26) 3.0 (53)
NW 3.6 (87) 2.7 (65) 0.9 (22) 9.5 (230) 22.1 (535)
SW 1.2 (38) 0.9 (30) 0.2 (8) 2.6 (86) 5.9 (192)
Atlantic
Ocean NE 6.9 (436) 2.0 (125) 4.9 (310) 48.4 (3041) 103.4 (6497)
SE 2.1 (70) 1.6 (52) 0.5 (18) 5.5 (184) 10.9 (360)
NW 4.7 (181) 2.2 (84) 2.5 (98) 24.5 (943) 50.8 (1959)
SW 1.1 (95) 0.6 (56) 0.4 (39) 4.9 (431) 7.8 (689)
Baltic Sea 0.05 (146) 0.03 (105) 0.01 (40) 0.13 (391) 0.23 (689)
Mediterranean Sea 1.5 (549) 0.5 (177) 1.0 (372) 9.8 (3592) 16.3 (5962)
Indian
Ocean W 3.5 (89) 1.5 (39) 2.0 (50) 20.2 (516) 42.0 (1074)
E 2.2 (62) 1.4 (39) 0.8 (23) 8.7 (245) 19.7 (559)
South China Sea 0.5 (68) 0.4 (54) 0.1 (14) 1.2 (148) 2.7 (327)
Southern Ocean 0.3 (14) 0.2 (11) 0.1 (3) 0.6 (31) 1.0 (53)
Continents
Europe 3.5 (364) 1.9 (199) 1.6 (165) 15.4 (1612) 26.9 (2822)
North America 2.0 (87) 1.4 (62) 0.6 (25) 6.1 (270) 10.9 (483)
South America 3.3 (180) 1.4 (79) 1.8 (101) 19.4 (1074) 32.3 (1793)
Africa 51.6 (1738) 3.5 (119) 48.1 (1619) 466.8 (15725) 940.4 (31681)
Asia 23.6 (562) 4.6 (109) 19.0 (453) 198.5 (4725) 425.8 (10138)
Australia 2.3 (282) 0.5 (65) 1.7 (218) 19.9 (2480) 44.5 (5555)
Antarctica 0.05 (3) 0.04 (3) 0.01 (1) 0.09 (6) 0.12 (8)
Totals
Global total 117 (229) 30 (59) 87 (170) 870 (1695) 1779 (3468)
Ocean total 31.2 (84) 16.9 (45) 14.3 (39) 144 (392) 298 (814)
Land total 86 (595) 13 (92) 73 (503) 726 (5013) 1481 (10225)
all units in Gg-P yr-1 (µg-P m-2yr-1)
* dust in Tg yr-1 (mg m-2yr-1)

Confidential manuscript submitted to Global Biogeochemical Cycles
Table 2. Annual means: percentage of total-P in deposited dust bioavailable at surface;
percentage of bioavailable-P from acid dissolution of apatite; percentage of total-P in dust from
labile-P; and percentage of apatite-P in deposited dust dissolved by acid dissolution.
Region
% of TP in dust
bioavailable at
surface
% of bio-P from
acid dissolution
% of TP in dust
from labile pool
% of Ap-P in
dust dissolved
Ice sheets Greenland 62 % 82 % 11 % 100 %
Antarctic 60 % 82 % 11 % 93 %
Oceans and Seas
Arctic Ocean 55 % 81 % 10 % 86 % Pacific
Ocean NE 45 % 77 % 10 % 73 %
SE 52 % 81 % 10 % 84 %
NW 38 % 75 % 10 % 56 %
SW 44 % 80 % 9 % 65 % Atlantic
Ocean NE 14 % 29 % 10 % 9 %
SE 38 % 75 % 10 % 58 %
NW 19 % 46 % 10 % 19 %
SW 22 % 59 % 9 % 28 %
Baltic Sea 37 % 72 % 10 % 54 %
Mediterranean Sea 15 % 32 % 10 % 10 %
Indian
Ocean
W 17 % 43 % 10 % 14 %
E 25 % 63 % 9 % 31 %
South China Sea 46 % 79 % 10 % 70 %
Southern Ocean 45 % 79 % 10 % 74 %
Continents
Europe 23 % 55 % 10 % 25 %
North America 32 % 71 % 9 % 45 %
South America 17 % 44 % 9 % 16 %
Africa 11 % 7 % 10 % 12 %
Asia 12 % 19 % 10 % 4 %
Australia 11 % 23 % 9 % 5 %
Antarctica 60 % 82 % 11 % 93 %
Global means
Global mean 14 % 26 % 10 % 7 %
Ocean mean 22 % 54 % 10 % 24 %
Land mean 12 % 16 % 10 % 4 %

Confidential manuscript submitted to Global Biogeochemical Cycles
Table 3. Sensitivity of annual deposited mass of bioavailable phosphorus to degree of external
mixing of apatite and calcium carbonate (CaCO3) content in the deposited dust. Data show
percentage increase of bioavailable phosphorus compared to the control run (0% mixing;
internally mixed assumption). An externally mixed percentage of 0% implies that apatite and
dust are present at the same ratio in all dust particles (therefore internally mixed) and a
percentage of 100% implies that apatite and calcium carbonate are exclusively present in
different dust particles.
Percentage of apatite and CaCO3
externally mixed in dust
Region 1% 2% 5% 10% 25% 50% 100%
Ice sheets
Greenland 0 0 0 0 0 0 0
Antarctic 0 0 0 1 2 4 5
Oceans and
Seas
Arctic 0 0 1 2 4 7 11
Pacific NE 0 1 2 4 9 17 24 SE 0 0 1 2 4 8 12 NW 1 1 4 7 17 33 48 SW 1 1 3 5 12 24 34
Atlantic NE 3 6 15 31 77 153 229 SE 1 1 3 6 15 29 43 NW 2 4 10 20 51 102 152 SW 2 3 8 16 39 78 116
Baltic 1 1 3 7 17 33 49
Mediterranean 3 6 15 29 73 148 221
Indian W 3 5 13 26 66 132 198 E 1 3 7 15 37 74 110
South China 0 1 2 4 9 19 27
Southern 0 1 2 3 8 16 23
Ocean total 2 4 9 18 44 88 131
all data in % increase compared to control run

Confidential manuscript submitted to Global Biogeochemical Cycles
Table 4. Modelled deposition fluxes of TP and Bio-P to different ocean basins in Gg-P yr-1.
Figures in parentheses correspond to the TP bioavailability (%) upon deposition. Bio-P data from
Zhang et al. (2015) are presented for their ‘sol-1’ dataset (please refer to the study for details).
Values for both total dissolved phosphorus (DP) and dissolved inorganic phosphorus (DIP) from
Myriokefalitakis et al. (2016) are included. Values from Zhang et al. (2015) and this study are
only for phosphorus from inorganic mineral dust.
Mahowald
et al. 2008
Okin
et al. 2011 Zhang et al. 2015* Myriokefalitakis et al. 2016 This study*
TP Bio-P TP Bio-P TP Bio-P
sol-1 TP
Bio-P
DP
Bio-P
DIP † TP Bio-P
Atlantic 232 35.8 (15) 128 - 112 9.6 (9) 110 54.9 (50) 36.6 83 14.8 (18)
N Atlantic 190 27.9 (15) - - 103 8.8 (9) 96 44.2 (46) 32.3 73 11.6 (16)
S Atlantic 42 7.9 (19) - - 9 0.8 (9) 14 10.6 (74) 4.4 10 3.2 (30)
Pacific 85 28 (33) 68 - 18 1.8 (9) 60 48.4 (81) 26.6 20 8.4 (42)
N Pacific 63 22 (35) - - 18 1.7 (10) 47 38.0 (80) 23.9 15 5.9 (40)
S Pacific 22 6 (27) - - 1 0.07 (8) 12 10.5 (86) 2.7 5 2.5 (47)
Indian 149 20.3 (14) 73 - 37 3.8 (10) 56 37.3 (66) 20.7 29 5.7 (20)
Southern 12 1.7 (14) 32 - 0.2 0.01 (7) 2 1.5 (82) 0.2 1 0.5 (46)
Arctic 7 2.2 (32) - - 1 0.1 (10) 5 3.3 (74) 1.7 1 0.5 (55)
Mediterranean 54 5.7 (11) - - 11 1.1 (10) 7 4.4 (59) 2.7 10 1.5 (15)
Antarctic ice - - - - 0.1 0.01 (9) 0.1 0.0 (23) 0.0 0.1 0.1 (60)
Greenland ice - - - - 5 0.5 (9) 0.3 0.2 (62) 0.1 0.1 0.03 (62)
Ocean total 558 96.5 (17) 320 - 180 16.3 (9) 240 150.2 (63) 88.7 144 31.2 (22)
Land total 831 143.5 (17) - - - - 1051 303 (29) 160 726 86 (12)
* mineral dust only
† dissolved inorganic P from dust and volcanic emissions only

Confidential manuscript submitted to Global Biogeochemical Cycles
Figures
Figure 1. Global gridded datasets used for GLOMAP dust-associated emissions of a) total-
phosphorus (ppm); b) apatite-phosphorus (ppm); c) labile-phosphorus (ppm); d) calcium-
carbonate (%); e) ratio of apatite-phosphorus to total-phosphorus (%); and f) ratio of labile-
phosphorus to total-phosphorus (%).

Confidential manuscript submitted to Global Biogeochemical Cycles
Figure 2. Annual deposition rate of a) bioavailable phosphorus in µg-P m-2yr-1, b) dust in
g m-2yr-1, and c) dust-associated H+ ions in mol-H+ m-2yr-1.

Confidential manuscript submitted to Global Biogeochemical Cycles
Figure 3. Annual mean percentage contribution of a) the acid dissolution process and b) the
labile pool of phosphorus to the total bioavailable phosphorus from dust deposition, and c) the
percentage of the total phosphorus content in dust that is bioavailable upon deposition.
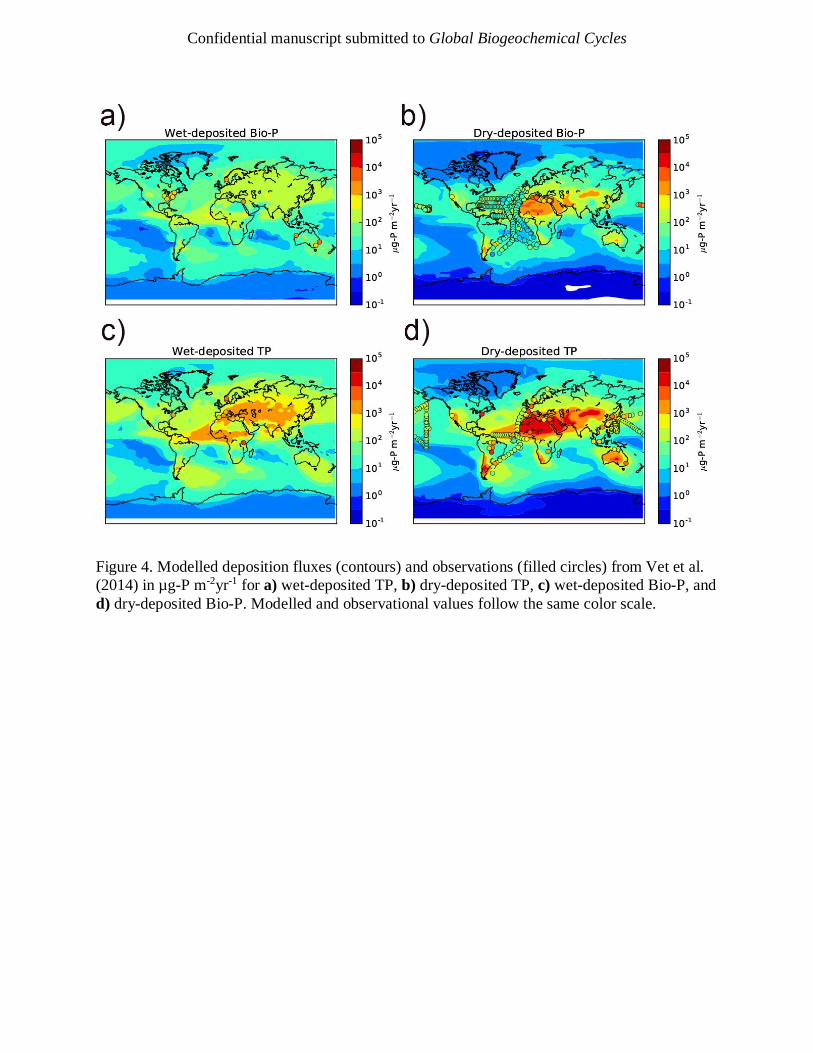
Confidential manuscript submitted to Global Biogeochemical Cycles
Figure 4. Modelled deposition fluxes (contours) and observations (filled circles) from Vet et al.
(2014) in µg-P m-2yr-1 for a) wet-deposited TP, b) dry-deposited TP, c) wet-deposited Bio-P, and
d) dry-deposited Bio-P. Modelled and observational values follow the same color scale.
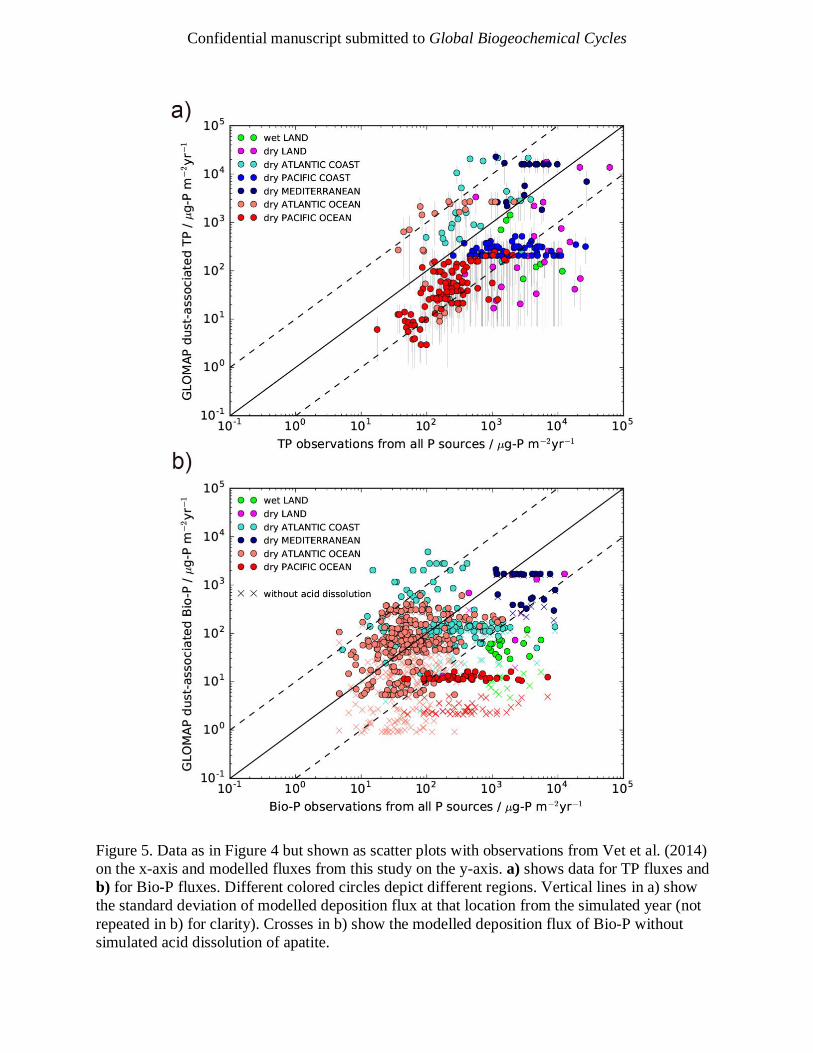
Confidential manuscript submitted to Global Biogeochemical Cycles
Figure 5. Data as in Figure 4 but shown as scatter plots with observations from Vet et al. (2014)
on the x-axis and modelled fluxes from this study on the y-axis. a) shows data for TP fluxes and
b) for Bio-P fluxes. Different colored circles depict different regions. Vertical lines in a) show
the standard deviation of modelled deposition flux at that location from the simulated year (not
repeated in b) for clarity). Crosses in b) show the modelled deposition flux of Bio-P without
simulated acid dissolution of apatite.