Embed Size (px)
Citation preview

The effect of a serotonin-induced dissociationbetween spiking and perisynaptic activityon BOLD functional MRIAlexander Rauch*†, Gregor Rainer*, and Nikos K. Logothetis*†‡
*Max Planck Institute for Biological Cybernetics, Spemannstrasse 38, D-72076 Tubingen, Germany; and ‡Division of Imaging Science and BiomedicalEngineering, University of Manchester, Manchester M13 9PT, United Kingdom
Edited by Marcus E. Raichle, Washington University School of Medicine, St. Louis, MO, and approved March 10, 2008 (received for review January 11, 2008)
The relationship of the blood oxygen-level-dependent (BOLD)signal to its underlying neuronal activity is still poorly understood.Combined physiology and functional MRI experiments suggestedthat local field potential (LFP) is a better predictor of the BOLDsignal than multiunit activity (MUA). To further explore this rela-tionship, we simultaneously recorded BOLD and electrophysiolog-ical activity while inducing a dissociation of MUA from LFP activitywith injections of the neuromodulator BP554 into the primaryvisual cortex of anesthetized monkeys. BP554 is a 5-HT1A agonistacting primarily on the membrane of efferent neurons by potas-sium-induced hyperpolarization. Its infusion in visual cortex reli-ably reduced MUA without affecting either LFP or BOLD activity.This finding suggests that the efferents of a neuronal networkpose relatively little metabolic burden compared with the overallpresynaptic and postsynaptic processing of incoming afferents. Wediscuss implications of this finding for the interpretation of BOLDactivity.
5-HT1A � BP554 � local field potentials � multiunit activity
The blood oxygen-level-dependent (BOLD) signal representsa complex response controlled by different parameters,
including blood oxygenation, cerebral blood flow, and cerebralblood volume, all in turn reflecting regional increases in metab-olism due to enhanced neural activity. Although the existenceand importance of this neurometabolic and neurovascular cou-pling have long been acknowledged, the actual relationshipbetween neuronal activity and the ensuing hemodynamic re-sponse signal is still far from being completely understood. Animportant pertinent question is the contribution of differentprocessing stages to hemodynamic responses. In principle, brainstructures are conceptualized as information-processing entities,with an input, a local processing capacity, and an output. Yet,although such a scheme can often successfully describe thefunction of subcortical nuclei, its implementation in differentareas of cortex is anything but straightforward. This is mainly sobecause the local cortical connectivity reveals strong excitatoryand inhibitory recurrence, and the output reflects changes inexcitation–inhibition balance rather than simple feed-forwardintegration of inputs (1).
Autoradiography studies have long suggested that the ‘‘peri-synaptic’’ activity, mostly representing the input and local pro-cessing in cortex, accounts for the lion’s share of metabolicenergy demands (2). For instance, the greatest 2-deoxyglucoseuptake occurs in the neuropil, i.e., in areas rich in synapses,dendrites, and axons, rather than in cell bodies. When cell bodiesand axon terminals of neurons are in different structures, as isthe case with the cells in the supraoptic and paraventricularnuclei of the hypothalamus, only the structures involving pre-synaptic terminals (in this case the posterior pituitary gland)exhibit increased glucose consumption during electrical micro-stimulation (3). Similarly, the highest density of cytochromeoxidase (an enzyme of the respiratory chain) is found in soma-todendritic regions that are adjacent to axon terminals (4, 5).
Simultaneous measurements of intracortical activity and func-tional MRI in the non-human primate have confirmed thesefindings by demonstrating that the local field potential (LFP)generated by a local neuronal network are more closely relatedto the BOLD signal than the multiunit activity (MUA) of thesame network, although both electrical measures of neuronalactivity are correlated with the BOLD signal (6). The LFP is amass signal that reflects a whole population of excitatory orinhibitory postsynaptic potentials as well as a number of inte-grative processes, including somatic and dendritic potentials withtheir ensuing afterpotentials and voltage-dependent membraneoscillations (2–4, 7).
The decisive observation underlying the conclusions of thesefMRI experiments (6) was the characteristic hemodynamicresponse in cases of cortical LFP–MUA dissociation. In thatstudy, hemodynamic responses were not reduced at many re-cording sites in the absence of neuronal spiking, but thereremained strong stimulus-induced modulation of the field po-tentials. A similar but experimentally induced dissociation hadbeen reported previously in the cerebellum of rats in a studycombining electrophysiology with laser Doppler flowmetry (8),i.e., with regional measurements of cerebral blood flow. Theseinvestigators stimulated the parallel fibers of cerebellum whilerecording Purkinje cell activity. Measurements of LFPs, single-unit activity, and changes in cerebral f low showed that both LFPsand CBF may increase at the same time that spiking activityceases (8, 9). Most recently a similar LFP–MUA dissociation wasalso reported in the cortex of cats in studies directly measuringneural activity and tissue oxygenation at a high spatiotemporalresolution (10). These authors demonstrated a strong couplingbetween LFPs and changes in tissue oxygen concentration in theabsence of spikes. All of these observations suggest that theperisynaptic, i.e., dendrosomatic elements of neuronal networksare the sites of enhanced metabolic activity, a large part of whichmight serve to restore the perturbed ionic gradients in thepostsynaptic membranes (7, 9).
Here we set out to test the differential contributions of LFPand MUA to the fMRI signal, doing so directly in concurrentelectrophysiological and fMRI experiments by selectively de-creasing the MUA in primary visual cortex with injections of a5-HT1A agonist. BP554 is a centrally active 5-HT1A agonistwhose primary function is to raise the spike threshold of
Author contributions: A.R. and N.K.L. designed research; A.R. performed research; A.R. andG.R. analyzed data; and A.R., G.R., and N.K.L. wrote the paper.
The authors declare no conflict of interest.
This article is a PNAS Direct Submission.
Freely available online through the PNAS open access option.
†To whom correspondence may be addressed. E-mail: [email protected] [email protected].
This article contains supporting information online at www.pnas.org/cgi/content/full/0800312105/DCSupplemental.
© 2008 by The National Academy of Sciences of the USA
www.pnas.org�cgi�doi�10.1073�pnas.0800312105 PNAS � May 6, 2008 � vol. 105 � no. 18 � 6759–6764
NEU
ROSC
IEN
CE
Dow
nloa
ded
by g
uest
on
Janu
ary
20, 2
022

pyramidal neurons by hyperpolarization (11). The hyperpolar-ization triggered by the 5-HT1A receptor is mostly driven by apotassium current, stabilizing the membrane of pyramidal neu-rons at a hyperpolarized level and reaching a spiking thresholdonly under a much heavier synaptic load (12, 13). In the macaquecortex, the 5-HT1A receptors show a discrete localization on theinitial segment of the axon hillock in layer-3 and layer-5 pyra-midal neurons (14). This localization is ideally suited for the5-HT1A receptors to perform a sort of gatekeeper function forthe output of neuronal networks, thereby controlling spikingactivity. BP554 is therefore expected to primarily affect theoutput side of the neuronal network by reducing MUA. TheLFP, on the other hand, should remain largely intact becausethalamic and corticocortical inputs continue to stream to thenetwork and keep generating local synaptic activity. Our exper-iment allows us to assess pharmacologically whether the BOLDsignal is more faithfully represented by MUA or LFP activity.
BP554 injections were performed in the primary visual cortex(V1) of anesthetized monkeys during a visual stimulation pro-tocol, allowing us to assess the changes in visually inducedactivity. To identify possible drug-induced changes to the BOLDsignal with high sensitivity, we used independent componentanalysis (ICA) on the imaging data. We have previously shownthat spatial ICA provides a sensitive method to quantify theimpact of local injections on the BOLD signal (15). In particular,this method can robustly identify injection-related changes invisual stimulus-induced BOLD modulation and at the same timedelineate their spatial extent. A preliminary report on the actionof the 5HT agonist using a different experimental protocol waspublished elsewhere (16).
ResultsWe induced activity in the primary visual cortex (V1) by usinga block paradigm consisting of a rotating polar checkerboardstimulus lasting 32 s followed by an isoluminant gray blankperiod of equal length [see supporting information (SI) Fig. S1].After a baseline period lasting four blocks of visual stimulation,we performed local injection of the 5HT1A agonist BP554 usinga single dose of 10 �l at a concentration of 100 �M. We analyzedthe fMRI data using spatial ICA (see Materials and Methods).We focus here on independent components (ICs) showing robustcorrelation with the visual stimulation during the baselineperiod. In Fig. 1A we show, for a single experiment, the three ICsand their spatial distribution in V1 in three slices around theinjector. The injector is marked by a blue arrow and was placedin cortical layer IV/V. Voxels corresponding to each of the ICswere located in cortical regions within the field of view (FOV)and surrounding the injector. Fig. 1B shows the time course ofIC1; the arrow indicates the time of injection at the end of thefourth block of visual stimulation. No effect on the time courseof IC1 can be detected after the injection of BP554. Themodulation in response to the visual stimulus is plotted in Fig.1 C–E for the three ICs. The ordinate of the graphs denotes thevisual modulation in percent of baseline values (100%), such thata reduction in modulation due to the injection would result in adecrease of modulation after the time of injection. None of themodulation plots shows significant reduction after the injection.Statistical analyses confirm that modulation was in fact similarduring the baseline period (0–4.3 min) and a period after theinjection (6.5–14.2 min) (t test: IC1, P � 0.70; IC2, P � 0.64; IC3,P � 0.29). The injection of BP554 thus has no significant effecton any of the groups of voxels surrounding the injector that wereidentified by ICA.
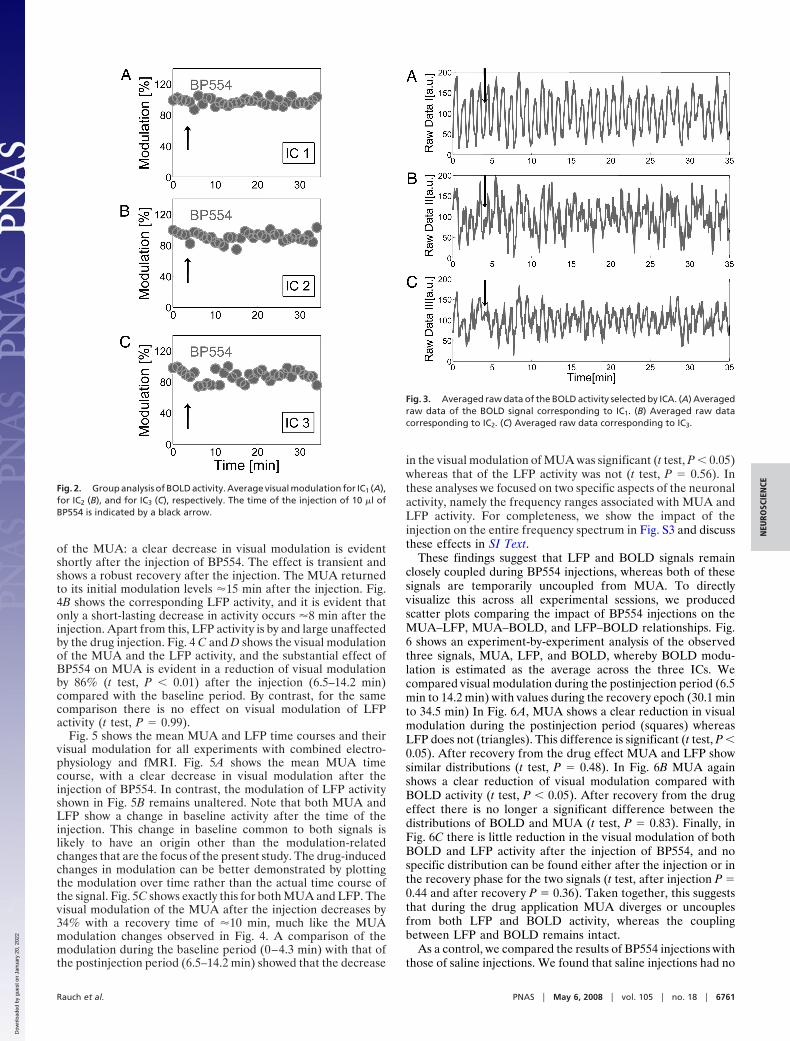
A group analysis summarized in Fig. 2 confirmed that thisobservation was made reliably across all experiments. In Fig. 2A–C the average visual modulation for the three ICs is shown inpercentages, and the time of injection is again indicated by anarrow. When the baseline period (0–4.3 min) was compared with
the postinjection period (6.5–14.2 min), there was no significantchange in visual modulation for any of the ICs (t test: IC1, P �0.76; IC2, P � 0.51; IC3, P � 0.52). This analysis shows that thethree selected ICs remain unaffected by the injection andcontinue to display robust stimulus-induced modulation. Toconfirm that these effects observed at the level of ICs were alsotrue for the raw fMRI data, we repeated this analysis on theBOLD data corresponding to each of the ICs. Fig. 3 shows theraw data corresponding to each of the ICs. The baseline period(0–4.3 min) compared with the postinjection period (6.5–14.2min) did not show any significant change in visual modulation(IC1, raw BOLD t test, P � 0.31; IC2, raw BOLD t test, P � 0.29;IC3, raw data t test, P � 0.11). This indicates that effects for theraw BOLD data were in close agreement to the effects seen inthe ICs, and both signals were not significantly affected by BP554injections. Thus, even the highly sensitive spatial ICA methoddid not reveal any voxel groups that might have been stronglyaffected by the injection. However, it might still be the case thatthe amount of remaining visual stimulus-induced BOLD mod-ulation in each of the ICs still correlates with the distance fromthe injector. This would indicate that the drug injection doeshave a quantifiable effect on the BOLD signal. In Fig. S2 and SIText we show that this was in fact not the case.
Given that BOLD signals were unaffected by the injection, weproceeded to analyze neuronal activity at the level of LFP andMUA to examine which of these signals was a better predictorof BOLD activity. Fig. 4 shows the electrophysiological record-ings of the experiment corresponding to the fMRI resultspresented in Fig. 1. The electrophysiological signals were band-passed into two frequency ranges: MUA from 800 Hz to 3,000Hz and LFP from 24 Hz to 90 Hz. Fig. 4A shows the time course
Fig. 1. Single-trial results for BOLD activity. (A) Three panels showing slicesof 1-mm thickness and interslice separation of 1 mm including regions ofprimary visual cortex around the injector in Center. Each panel shows voxeldistributions corresponding to the three ICs, IC1 (red), IC2 (blue), and IC3
(green). (B) Time course of IC1. The black arrow marks the time of the injectionof 10 �l of BP554. (C) Visual modulation for IC1. (D) Visual modulation for IC2.(E) Visual modulation for IC3. In C–E the time of the injection is indicated by ablack arrow.
6760 � www.pnas.org�cgi�doi�10.1073�pnas.0800312105 Rauch et al.
Dow
nloa
ded
by g
uest
on
Janu
ary
20, 2
022
of the MUA: a clear decrease in visual modulation is evidentshortly after the injection of BP554. The effect is transient andshows a robust recovery after the injection. The MUA returnedto its initial modulation levels �15 min after the injection. Fig.4B shows the corresponding LFP activity, and it is evident thatonly a short-lasting decrease in activity occurs �8 min after theinjection. Apart from this, LFP activity is by and large unaffectedby the drug injection. Fig. 4 C and D shows the visual modulationof the MUA and the LFP activity, and the substantial effect ofBP554 on MUA is evident in a reduction of visual modulationby 86% (t test, P � 0.01) after the injection (6.5–14.2 min)compared with the baseline period. By contrast, for the samecomparison there is no effect on visual modulation of LFPactivity (t test, P � 0.99).
Fig. 5 shows the mean MUA and LFP time courses and theirvisual modulation for all experiments with combined electro-physiology and fMRI. Fig. 5A shows the mean MUA timecourse, with a clear decrease in visual modulation after theinjection of BP554. In contrast, the modulation of LFP activityshown in Fig. 5B remains unaltered. Note that both MUA andLFP show a change in baseline activity after the time of theinjection. This change in baseline common to both signals islikely to have an origin other than the modulation-relatedchanges that are the focus of the present study. The drug-inducedchanges in modulation can be better demonstrated by plottingthe modulation over time rather than the actual time course ofthe signal. Fig. 5C shows exactly this for both MUA and LFP. Thevisual modulation of the MUA after the injection decreases by34% with a recovery time of �10 min, much like the MUAmodulation changes observed in Fig. 4. A comparison of themodulation during the baseline period (0–4.3 min) with that ofthe postinjection period (6.5–14.2 min) showed that the decrease
in the visual modulation of MUA was significant (t test, P � 0.05)whereas that of the LFP activity was not (t test, P � 0.56). Inthese analyses we focused on two specific aspects of the neuronalactivity, namely the frequency ranges associated with MUA andLFP activity. For completeness, we show the impact of theinjection on the entire frequency spectrum in Fig. S3 and discussthese effects in SI Text.
These findings suggest that LFP and BOLD signals remainclosely coupled during BP554 injections, whereas both of thesesignals are temporarily uncoupled from MUA. To directlyvisualize this across all experimental sessions, we producedscatter plots comparing the impact of BP554 injections on theMUA–LFP, MUA–BOLD, and LFP–BOLD relationships. Fig.6 shows an experiment-by-experiment analysis of the observedthree signals, MUA, LFP, and BOLD, whereby BOLD modu-lation is estimated as the average across the three ICs. Wecompared visual modulation during the postinjection period (6.5min to 14.2 min) with values during the recovery epoch (30.1 minto 34.5 min) In Fig. 6A, MUA shows a clear reduction in visualmodulation during the postinjection period (squares) whereasLFP does not (triangles). This difference is significant (t test, P �0.05). After recovery from the drug effect MUA and LFP showsimilar distributions (t test, P � 0.48). In Fig. 6B MUA againshows a clear reduction of visual modulation compared withBOLD activity (t test, P � 0.05). After recovery from the drugeffect there is no longer a significant difference between thedistributions of BOLD and MUA (t test, P � 0.83). Finally, inFig. 6C there is little reduction in the visual modulation of bothBOLD and LFP activity after the injection of BP554, and nospecific distribution can be found either after the injection or inthe recovery phase for the two signals (t test, after injection P �0.44 and after recovery P � 0.36). Taken together, this suggeststhat during the drug application MUA diverges or uncouplesfrom both LFP and BOLD activity, whereas the couplingbetween LFP and BOLD remains intact.
As a control, we compared the results of BP554 injections withthose of saline injections. We found that saline injections had no
Fig. 3. Averaged raw data of the BOLD activity selected by ICA. (A) Averagedraw data of the BOLD signal corresponding to IC1. (B) Averaged raw datacorresponding to IC2. (C) Averaged raw data corresponding to IC3.
Fig. 2. Group analysis of BOLD activity. Average visual modulation for IC1 (A),for IC2 (B), and for IC3 (C), respectively. The time of the injection of 10 �l ofBP554 is indicated by a black arrow.
Rauch et al. PNAS � May 6, 2008 � vol. 105 � no. 18 � 6761
NEU
ROSC
IEN
CE
Dow
nloa
ded
by g
uest
on
Janu
ary
20, 2
022

systematic effect on the BOLD signal or on the electrophysio-logical signals (see Fig. S4 and SI Text).
DiscussionWe described the effects of the 5-HT1A agonist BP554 (100 �Msolution) on neural and BOLD activity in the primary visualcortex of monkeys. The agonist was used to induce dissociationbetween LFP and MUA activity. This dissociation is due to thefact that BP554 selectively hyperpolarizes pyramidal neurons incortex through an increase in potassium conductivity that clampsthe neuronal membrane close to this ion’s reversal potential (13,17). Because of this pharmacological specificity and the narrowdistribution of 5-HT1A receptors around the axon hillock ofthese neurons, the 5-HT1A agonist BP554 acts as a gatekeeperfor the output of the neuronal network (MUA) (14, 18). We wereable to show that the main effect of BP554 is exerted on MUA,whereas LFP remains largely unaffected. Simultaneous fMRIduring the recording of neuronal signals and drug applicationallowed us to address the question: Which of the two measuresof neuronal activation is a better predictor of BOLD signallevels? We found that, during the temporary uncoupling ofMUA from LFP activity, the BOLD signal indeed is wellpredicted by LFP activity. The robust decreases in MUA levelsduring drug application by contrast do not have an appreciableimpact on the BOLD signal in cortical areas around the injector.This functional relationship is consistent with previous obser-vations (6, 8, 19). To the best of our knowledge, however, this isthe first study reporting the effects of different types of neuralactivity on the BOLD fMRI signal under the condition ofexperimentally induced LFP–MUA dissociation.
Our findings demonstrate, once again, that increases in thefMRI signal may not necessarily be interpreted as showing an
increase in the activity of the area’s projection neurons—theneurons typically monitored during extracellular recording inexperimental animals. Naturally, increases in the field potentialsare often coupled with increases in spiking and in hemodynamicresponses. This is most pronounced in experiments in whichresponses to a simple sensory stimulus are studied. In fact, it isremarkable that LFP–MUA dissociations occur during suchsimple experimental designs and even in the anesthetized ani-mal. Neuroimaging in studies of human cognitive capacities,however, in which a cortical area might be strongly influenced byneuromodulation (e.g., as a result of attention, arousal, orshort-term memory), could show that LFP and MUA may varyto different extents or even in opposite directions.
The occasional discussion about the relationship of spikes toBOLD suffers from a certain amount of contention seekingwhere none is warranted. For one, LFP and MUA cannot bealways regarded as independent measures of activity, and theirdissociation usually speaks to the relative contribution of thesesignals to the BOLD signal in the cortex. The strong recurrentexcitatory and inhibitory loops of the typical cortical microcir-cuit predict correlations between these signals, each of whichmay then be also correlated with the local BOLD signal levels (6,20, 21). Should, however, the excitatory and inhibitory conduc-tances show proportional increases or decreases, hemodynamicresponses may strongly change with little difference in thespiking of stimulus-selective projection neurons. Here we haveexamined BOLD levels in the primary visual cortex (V1) duringvisual stimulation. V1 receives visual signals from the lateralgeniculate nucleus, and these synaptic inputs continue to arriveduring the entire experimental session regardless of drug appli-
Fig. 4. MUA versus LFP single trial. (A) Time course of MUA associated withinjection of 10 �l of BP554, with injection indicated by a black arrow. (B) Timecourse of LFP associated with injection of 10 �l of BP554, with injectionindicated by a black arrow. (C and D) Visual modulation of MUA (C) and visualmodulation of LFP (D). Injections are indicated by black arrows.
Fig. 5. MUA versus LFP group analysis. (A) Average time course of MUAassociated with injection of 10 �l of BP554, with injection indicated by a blackarrow. (B) Average time course of LFP associated with injection of 10 �l ofBP554, with injection indicated by a black arrow. (C) Average visual modula-tion of MUA and average visual modulation of LFP.
6762 � www.pnas.org�cgi�doi�10.1073�pnas.0800312105 Rauch et al.
Dow
nloa
ded
by g
uest
on
Janu
ary
20, 2
022

cation in V1, because the drug applied in V1 cannot directlyaffect the neurons in the distant thalamic nucleus. Our modelsystem thus allows us to examine drug effects in V1 underconditions where synaptic inputs continue to arrive, and thereported results corroborate indeed the notion that synapticactivity is in general a better predictor of metabolic demand thanlocal spiking.
In the present study we used ICA to analyze the BOLDimaging data because we had previously found it to be moresensitive for the delineation of drug effects than traditionalmethods. In a previous study examining the effects of lidocaineon neural and vascular signals (15), ICA was able to identifymeaningful clusters of voxels on the basis of changes in the timecourse of the voxels at and around the injection site. The studyalso showed that the distribution of lidocaine-affected voxels wasoften anisotropic. ICA showed clear advantages over a tradi-tional distance-to-injector-based correlation analysis because itaccounted for the anisotropic distribution and estimated thisinformation directly from experimental data sets with no priorassumptions on the possible distribution of the affected voxels.We used the same methodology here to study effects of BP554
to maximize our chances of observing injection-related effectson the BOLD signal. We suggest that, particularly for pharma-cological MRI studies, ICA provides a valuable tool for delin-eating and describing effects in the BOLD signal.
Finally, our present observations have some interesting im-plications for medical research. In specific, variations of endog-enous levels of serotonin can occur because of different cogni-tive states or as a result of brain disorders. Our findings suggestthat such variations could have an appreciable impact on BOLDsignals observed in functional imaging experiments involvinghuman subjects by action of the 5-HT1A receptor. Indeed, thereis now increasing evidence that 5-HT1A receptors are involvedin the pathology of schizophrenia. In human prefrontal cortexthe density of these receptors increases by up to 80% in thisdisorder (22, 23). Given our results, one might expect that theactivation of the pathologically increased 5-HT1A receptorsthrough their action primarily on MUA would lead to a decreasein the output of the prefrontal neural networks without disrupt-ing local processing. In this view, local processing might berelatively unimpaired, but the output of prefrontal circuits wouldnot be available to control activity in target brain regions.Because BOLD signals couple to LFP under serotonergic ma-nipulation, these pathological changes in information processingwould be difficult to detect by using fMRI. This is consistent withrecent evidence (24, 25) indicating that the overall amplitude ofBOLD responses is undisturbed in patients with schizophrenia.Note that these studies did observe changes in BOLD temporaldynamics, suggesting that subtle aspects of fMRI activation,other than signal intensity, may provide clues to the output oflocal networks. Further research is needed to uncover theneuronal and metabolic mechanisms underlying BOLD signalgeneration.
In summary, we have shown that the activation of an endog-enous 5-HT1A receptor, which in a relay-like function depressesthe efferent output of neuronal networks (MUA), does not affectvisual modulation of the BOLD signal, nor does it lead tosignificant reductions in afferent neuronal processing (LFP). Wecan conclude that in this brain state the LFP serves as a morereliable indicator of the cortical BOLD signal than MUA.
Materials and MethodsThree male rhesus monkeys (Macaca mulatta) aged 4–6 years and weighing5–7 kg were used. The surgical operations and anesthesia procedures havebeen described in detail elsewhere (26, 27). The experiments were approvedby the local authorities (Regierungsprasidium) and were in full compliancewith the guidelines of the European Community for the care and use oflaboratory animals (EUVD 86/609/EEC).
Injections. We used three independent injection lines driven by three separateHPLC pumps (M6; VICI). The three independent lines allowed us to switchbetween different solutions in successive trials during one experiment. Alllines were monitored by high-precision flow meters (Sensirion) controlling theexact applied volume and the actual flow. We used BP554 as a 5-HT1A agonist.We observed no side effects during our experiments, and BP544 is to ourknowledge not used clinically. A stock solution of 100 mM BP554 in DMSO wasprepared and further diluted with a solution on the basis of artificial cere-brospinal fluid (ACSF) to a final concentration of 100 �M BP554. The pH wasadjusted with NaOH to 7.25. The ACSF was composed of 148.19 mM NaCl, 3.0mM KCl, 1.40 mM CaCl2, 0.80 mM MgCl2, 0.80 mM Na2HPO4, and 0.20 mMNaH2PO4. The unmodified ACSF solution was also used as a control solution.These chemicals, including BP554 and DMSO, were purchased from Sigma-Aldrich. BP554 injections were delivered at depths corresponding to corticallayers IV/V.
Recording Electrodes. The recording electrodes and injectors were custom-made; the injector consisted of a triple-barrel glass tube to keep the linesseparated until the very tip of the injector. Electrode and injector formed oneunit to assure placement at same depth. The resistance of the recordingelectrodes was in the range of 0.6 M�.
Fig. 6. Comparison of MUA, LFP, and BOLD activity. (A) Average visualmodulation reduction after injection of 10 �l of BP554 for MUA versus LFP,with the postinjection period (6.5 min to 14.2 min) indicated by rectangles andthe recovery period (35.1 min to 39.5min) indicated by triangles. (B) Averagevisual modulation reduction for MUA versus BOLD activity; symbols are as inA. (C) Average visual modulation reduction for LFP versus BOLD activity;symbols are as in A.
Rauch et al. PNAS � May 6, 2008 � vol. 105 � no. 18 � 6763
NEU
ROSC
IEN
CE
Dow
nloa
ded
by g
uest
on
Janu
ary
20, 2
022

Electrophysiology. The monkeys had an implanted recording chamber on theprimary visual cortex, V1. These chambers are made of PEEK (a nonmagneticpolymer) and were custom-milled for an optimal fit on the skull. The amplifiersfor the electrophysiological recordings were custom-made and already had ananalog compensation mechanism for the gradient noise from the scanner. Theprecleaned signal was then read in by an analog–digital (AD) converter with16-bit resolution (National Instruments). The AD converter was linked directlyto a PC running a real-time QNX operating system, where the signal wasstored. However, the denoising process was not yet complete at this point, soadditional offline cleaning of the data sets was necessary to completelyremove gradient artifacts. This was done with custom-written code based onprincipal component analysis in Matlab (MathWorks).
Magnetic Resonance Imaging. Images were acquired with a 4.7-tesla BrukerBioSpec 47/40v scanner with a 40-cm-diameter bore (Bruker). Customized,small radio frequency coils with an inner diameter of 30 mm were used astransceivers and were directly positioned around the recording chamber. Theywere optimized for increased sensitivity over the chosen region of interest ofprimary visual cortex (V1). For functional imaging we used Gradient Echo EPIwith a FOV of 76.8 to 48.0 mm, a slice thickness of 1 mm, and in-planeresolution of 0.3 � 0.375 mm2. We used a multishot EPI with eight segments,flip angle 30°, TR/TE 500/18 ms. A total of 592 volumes were acquired in eachexperiment. Slices were oriented parallel to the injector and perpendicular tothe cortical surface with the center slice containing the injector. Anatomicalreference scans were made by using a high-resolution GEFI sequence within-plane resolution of 0.15 � 0.19 mm for a FOV of 76.8 � 48.0 mm. Special carewas taken in the shimming process to achieve good homogeneity of themagnetic field by using FASTMAP (28) with a shim volume of 12 mm3 posi-tioned in the area of the electrode tip.
Visual Stimulation. Visual stimuli were presented binocularly by using a �-cor-rected SVGA fiber optic system (AVOTEC; Silent Vision) with a resolution of 640 �480 voxels and a frame rate of 60 Hz. Hard contact lenses were inserted to bringthe plane of stimulus into focus (hard PMMA lenses; Wohlk). The visual stimula-tion resulted in a good activation of primary visual cortex V1. Our stimulationprotocol consisted of blocks of visual stimulation using a rotating polar checker-boardstimulus10°�10° in size lasting32s followedbyan isoluminantgrayblankperiod of equal length. Checkerboard rotation direction was reversed every 8 s tominimize adaptation of the BOLD and neural signals. In the injection scan thedrugs were applied after the fourth repetition of an on–off sequence; the
injection lastedbetween2and3min,andthedurationof theentire scanwas39.5min corresponding to 37 blocks of visual stimulation.
Data Analysis. We applied spatial ICA to the imaging data, allowing thedetermination of spatially independent brain topographies, each of which isassociated with a characteristic distribution measured over the repeatedacquisition of volumes and whose weighted sum recovers the original imagingdata (29, 30). Using the Matlab toolbox fastICA (31), we estimated a numberof IC time courses and determined the voxels that strongly contributed to eachIC by selecting those voxels whose component values exceeded a set thresholdvalue. Voxel activation distributions were normalized such that the SD � � 1,and we used a cutoff SD value of � � 2. For each experimental data setbetween 10 and 30 ICs were produced, three to five of which showed robustvisual-stimulus-induced modulation during the baseline period before injec-tion. For each experiment, we selected the three ICs that were most stronglyactivated by visual stimulation and named them IC1, IC2, and IC3. The correla-tion coefficients of the selected components with the visual stimulationparadigm across all experiments (mean � SD) were as follows: IC1, 0.54 � 0.18;IC2, 0.36 � 0.13; IC3, 0.35 � 0.11. We considered only the first three ICs becausestatistical analyses revealed that correlation coefficients of IC4 (0.263 � 0.091)and IC5 (0.217 � 0.081) were already significantly lower than 0.35 (mean of IC3)over all experiments (P � 0.01 for IC4, and P � 0.001 for IC5) and were notconsistently activated by the visual stimulus. Modulation was estimated bysubtracting IC values during the baseline period (blocks 11–16) from corre-sponding values during stimulus (blocks 3–8) to take account of the hemody-namic lag. Our IC selection evidently made no assumptions regarding thesignal changes that followed the agonist injection because it relied on thebaseline time window before injection.
The electrophysiological signals were band-passed into two frequencyranges: MUA from 800 Hz to 3,000 Hz and LFP from 24 Hz to 90 Hz. The powerof the two bands was calculated for time bins corresponding to the samplingof the BOLD signal, namely 592 time points (volumes) corresponding to anexperimental duration of 39.5 min. Then the visual modulation was computedfor each block of visual stimulation by subtracting the power values during thebaseline period (blocks 9–16) from corresponding power values during thestimulus (blocks 1–8).
ACKNOWLEDGMENTS. This work was supported by the Max Planck Society,Grants 01GQ0711 and 01EV0701 from the German Ministry of Education andResearch, Swiss National Science Foundation Grant PBBSB-106816, and the M.and W. Lichtenstein Foundation (Switzerland) (A.R.). G.R. is a Deutsche For-schungsgemeinschaft Heisenberg Investigator (RA-1025/1-2).
1. Douglas RJ, Martin KA (2004) Neuronal circuits of the neocortex. Annu Rev Neurosci27:419–451.
2. Jueptner M, Weiller C (1995) Review: Does measurement of regional cerebral bloodflow reflect synaptic activity? Implications for PET and fMRI. NeuroImage 2:148–156.
3. Schwartz WJ, et al. (1979) Metabolic mapping of functional activity in the hypo-thalamo-neurohypophysial system of the rat. Science 205:723–725.
4. Di Rocco RJ, Kageyama GH, Wong-Riley MT (1989) The relationship between CNSmetabolism and cytoarchitecture: A review of 14C-deoxyglucose studies with correla-tion to cytochrome oxidase histochemistry. Comput Med Imaging Graphics 13:81–92.
5. Kageyama GH, Wong-Riley M (1986) Laminar and cellular localization of cytochromeoxidase in the cat striate cortex. J Comp Neurol 245:137–159.
6. Logothetis NK, Pauls J, Augath M, Trinath T, Oeltermann A (2001) Neurophysiologicalinvestigation of the basis of the fMRI signal. Nature 412:150–157.
7. LogothetisNK,WandellBA(2004) InterpretingtheBOLDsignal.AnnuRevPhysiol66:735–769.8. Mathiesen C, Caesar K, Akgoren N, Lauritzen M (1998) Modification of activity-
dependent increases of cerebral blood flow by excitatory synaptic activity and spikesin rat cerebellar cortex. J Physiol 512:555–566.
9. Mathiesen C, Caesar K, Lauritzen M (2000) Temporal coupling between neuronalactivity and blood flow in rat cerebellar cortex as indicated by field potential analysisJ Physiol 523:235–246.
10. Viswanathan A, Freeman RD (2007) Neurometabolic coupling in cerebral cortex re-flects synaptic more than spiking activity. Nat Neurosci 10:1308–1312.
11. Matsuda T, et al. (1989) Agonist activity of a novel compound, 1-[3-(3,4-methyl-enedioxyphenoxy)propyl]-4-phenyl piperazine (BP-554), at central 5-HT1A receptors.Eur J Pharmacol 170:75–82.
12. Ma L, Shalinsky MH, Alonso A, Dickson CT (2007) Effects of serotonin on the intrinsic mem-brane properties of layer II medial entorhinal cortex neurons. Hippocampus 17:114–129.
13. Beique JC, et al. (2004) Serotonergic regulation of membrane potential in developingrat prefrontal cortex: Coordinated expression of 5-hydroxytryptamine (5-HT)1A,5-HT2A, and 5-HT7 receptors. J Neurosci 24:4807–4817.
14. Azmitia EC, Gannon PJ, Kheck NM, Whitaker-Azmitia PM (1996) Cellular localization ofthe 5-HT1A receptor in primate brain neurons and glial cells. Neuropsychopharmacol-ogy 14:35–46.
15. Rauch A, Rainer G, Augath M, Oeltermann A, Logothetis NK (2008) PharmacologicalMRI combined with electrophysiology in non-human primates: Effects of Lidocaine onprimary visual cortex. NeuroImage 40:590–600.
16. Logothetis NK (2003) MR imaging in the non-human primate: Studies of function andof dynamic connectivity. Curr Opin Neurobiol 13:630–642.
17. Tanaka E, North RA (1993) Actions of 5-hydroxytryptamine on neurons of the ratcingulate cortex. J Neurophysiol 69:1749–1757.
18. Czyrak A, Czepiel K, Mackowiak M, Chocyk A, Wedzony K (2003) Serotonin 5-HT1Areceptors might control the output of cortical glutamatergic neurons in rat cingulatecortex. Brain Res 989:42–51.
19. Attwell D, Iadecola C (2002) The neural basis of functional brain imaging signals.Trends Neurosci 25:621–625.
20. Mukamel R, et al. (2005) Coupling between neuronal firing, field potentials, and FMRIin human auditory cortex. Science 309:951–954.
21. Raichle ME, Mintun MA (2006) Brain work and brain imaging. Annu Rev Neurosci29:449–476.
22. Gurevich EV, Joyce JN (1997) Alterations in the cortical serotonergic system in schizo-phrenia: A postmortem study. Biol Psychiatry 42:529–545.
23. Bantick RA, Deakin JF, Grasby PM (2001) The 5-HT1A receptor in schizophrenia: Apromising target for novel atypical neuroleptics? J Psychopharmacol 15:37–46.
24. Ford JM, Johnson MB, Whitfield SL, Faustman WO, Mathalon DH (2005) Delayedhemodynamic responses in schizophrenia. NeuroImage 26:922–931.
25. Fox MD, Snyder AZ, McAvoy MP, Barch DM, Raichle ME (2005) The BOLD onsettransient: Identification of novel functional differences in schizophrenia. NeuroImage25:771–782.
26. Logothetis NK, Guggenberger H, Peled S, Pauls J (1999) Functional imaging of themonkey brain. Nat Neurosci 2:555–562.
27. Logothetis N, Merkle H, Augath M, Trinath T, Ugurbil K (2002) Ultra high-resolutionfMRI in monkeys with implanted RF coils. Neuron 35:227–242.
28. Gruetter R (1993) Automatic, localized in vivo adjustment of all first- and second-ordershim coils. Magn Reson Med 29:804–811.
29. Stone JV (2002) Independent component analysis: An introduction. Trends Cognit Sci6:59–64.
30. McKeown MJ, Sejnowski TJ (1998) Independent component analysis of fMRI data:Examining the assumptions. Hum Brain Mapp 6:368–372.
31. Hyvarinen A (1999) Fast and robust fixed-point algorithms for independent compo-nent analysis. IEEE Trans Neural Netw 10:626–634.
6764 � www.pnas.org�cgi�doi�10.1073�pnas.0800312105 Rauch et al.
Dow
nloa
ded
by g
uest
on
Janu
ary
20, 2
022


![Pressure-Induced Dissociation Sedimenting Ribosomes ... · Pressure-Induced Dissociation of Ribosomes 1781 3 2 0C (0 w z a] 0 3 2 E EC DISTANCE FROM MENISCUS (cm) FIG. 2. Effect of](https://img.dokumen.tips/doc/110x75/5eb526877887907881763bb9/pressure-induced-dissociation-sedimenting-ribosomes-pressure-induced-dissociation.jpg)
![Pressure-Induced Dissociation Sedimenting …Pressure-Induced Dissociation of Ribosomes 1781 3 2 0C (0 w z a] 0 3 2 E EC DISTANCE FROM MENISCUS (cm) FIG. 2. Effect of length of centrifugation](https://img.dokumen.tips/doc/110x75/5fd2d4ad2ccfe1396b271cef/pressure-induced-dissociation-sedimenting-pressure-induced-dissociation-of-ribosomes.jpg)