Embed Size (px)
Citation preview

Columbus State UniversityCSU ePress
Theses and Dissertations
Spring 2014
The educational leader portfolio: the reliability ofportfolios as documentation of mastery of Isllcstandards and functionsCynthia Lynn Halstead Bowen
Follow this and additional works at: http://csuepress.columbusstate.edu/theses_dissertations
Part of the Educational Leadership Commons
This Dissertation is brought to you for free and open access by CSU ePress. It has been accepted for inclusion in Theses and Dissertations by anauthorized administrator of CSU ePress.
Recommended CitationBowen, Cynthia Lynn Halstead, "The educational leader portfolio: the reliability of portfolios as documentation of mastery of Isllcstandards and functions" (2014). Theses and Dissertations. 215.http://csuepress.columbusstate.edu/theses_dissertations/215
THE EDUCATIONAL LEADER PORTFOLIO: THE RELIABILITY OF
PORTFOLIOS AS DOCUMENTATION OF MASTERY OF
ISLLC STANDARDS AND FUNCTIONS
By
Cynthia Lynn Halstead Bowen
A Dissertation Submitted to the Faculty of Columbus State University
In Partial Fulfillment of the Requirements For the degree of Doctor of Education
in Education Leadership
Columbus State University Columbus, Georgia
May 2014
Copyright by
Cynthia Lynn Halstead Bowen
2014
ii

i
THE EDUCATIONAL LEADER PORTFOLIO: THE RELIABILITY OF
PORTFOLIOS AS DOCUMENTATION OF MASTERY OF
ISLLC STANDARDS AND FUNCTIONS
By
Cynthia Lynn Halstead Bowen
Approved:
_____________________________ ___________________________ Thomas J. McCormack Michael D. Richardson Professor of Educational Leadership Professor of Educational Leadership (Committee Chair) (Committee Member) ______________________________ Camille L. Bryant Associate Professor of Foundations (Methodologist)
ii

Name: Cynthia Lynn Halstead Bowen
Previous degrees: Ed. S. Columbus State University, 2008, (Educational Leadership); M. Ed. LaGrange College, 2006, (Curriculum and Leadership); B. A. LaGrange College, 1985, (Middle Childhood Education); A. S. Andrew College, 1983, (General Science) Date of Current Degree: May 12, 2014 Institution: Columbus State University Major Field: Educational Leadership Major Professor: Dr. Thomas McCormack Title of Study: THE EDUCATIONAL LEADER PORTFOLIO: THE RELIABILITY OF
PORTFOLIOS AS DOCUMENTATION OF MASTERY OF ISLLC STANDARDS AND FUNCTIONS
Pages in Study: 154
Candidate for Degree of Doctor of Education
This mixed-methods study explores the reliability of portfolios as evidence of
mastery of the Interstate School Leaders Licensure Consortium (ISLLC) leader standards.
The quantitative portion of the study was conducted to determine to what extent are
portfolios reliable as evidence of mastery of ISLLC standards and functions of students
enrolled in educational leadership specialist programs when measured by intra-class
correlation. The qualitative portion of the study was to explore why consistency or
inconsistency existed among the portfolio raters. Many colleges and universities utilize
portfolios as performance-based assessments to measure growth of educational leadership
students. The results of this study are provided as evidence of what is working and what
is not working in regard to the utilization of portfolios as evidence of leader skill mastery.
iii

The two-phase sequential mixed-methods study was used. Portfolios from two
cohorts of educational specialist students were rated (N=30) using a six-point Likert-type
scale at the function and standard levels. Three raters from a pool of nine were randomly
assigned to each of the thirty portfolios, so that each of the nine raters evaluated between
six and nine portfolios, and that each portfolio was evaluated by three of the nine raters.
After establishing normal distribution of ratings, the data were evaluated through intra-
class correlation to determine agreement of the raters regarding standards mastery for
each of the ISLLC functions. The intra-class correlation coefficients ranged from -.257 to
.626 at the function level and from 105 to .521 at the standard level. Although no
agreement was found at the function or standard level, five themes which were supported
by prior research emerged from the qualitative data provided by raters. Weak artifacts,
confusing or unclear artifacts, misplaced or incorrectly aligned artifacts, incomplete
artifacts, and implied artifacts contributed to discrepancies in scores earned by
participants in the Educational Leadership Specialist program. Poor reflections lowered
scores portfolios earned. Some raters gave credit for characteristics while others did not.
A number of raters gave full credit for all functions in a standard if some of the functions
were met, while other raters gave credit only for functions which were explicitly
represented. Raters also lacked agreement regarding quality of particular artifacts. All of
these issues led to poor consensus among the raters of these portfolios. In conclusion,
students who participate in performance-based programs which required a portfolio to
document the action component need to be well-trained on the purpose of the portfolio
and how to create its components. Additionally, students enrolled in Ed. S. Leadership
programs need to internalize the importance of reflection, as it is a practice which will
iv

assist them in creating a high-quality portfolio. Finally, extensive rater training and
practice is essential to reliably scoring educational leadership portfolios.
v

DEDICATION
Without God’s grace and mercy, this task would never have been accomplished. I
dedicate this work and any opportunities which may follow to Him.
I also dedicate this research to my dad, J. David Halstead. Although his only
college degree was from the University of Hard Knocks, he found a way to help my
mom, my two brothers, and me to earn at least Bachelor’s degrees. Hey, Dad, we finally
have a doctor in the house.
vi

ACKNOWLEDGEMENTS
Heartfelt appreciation goes to Mike, my brave husband and cheerleader. His
patience, encouragement, chef’s hat, and love have sustained me through one of the most
challenging tasks I have ever embraced. He brought me thousands of cups of coffee and
endured many frozen pizzas in order for me to pursue my dream. I love you.
My mom has inspired me throughout this entire journey. I almost think her name
should be next to mine on the diploma. Her red pen made my papers bleed, and then she
bought the Blizzards to anesthetize the pain. She truly knew when to push, when to pull,
and when to stand next to me and hold my hand.
Special thanks to my Dissertation Chair, Dr. McCormack. He encouraged me with
quiet, peaceful words when I felt frustration beyond belief with this dissertation. I saved
the email he sent with three powerful words-- “Hang in there.” It was perfectly timed,
perfectly delivered. I appreciate his willingness to take me on as a project when my
original chair retired. Thank you for helping me to recruit others to join us. Dr. Bryant
has been amazing. She never flinched as she tried to teach twenty rowdy, restless teachers
how to perform statistical feats after long days with rowdy, restless children. She was
willing to guide me through the statistical landmine of this study as I worked through the
quantitative and qualitative portions of this work. She was even available on holidays and
weekends, with her sweet little infant in tow. Although Dr. Richardson joined us late in
the study, I appreciated his sense of humor as well as his high expectations for this
program.
Do all things as unto God, a worker who does not need to be ashamed.
vii

TABLE OF CONTENTS
DEDICATION .......................................................................................................... vi
ACKNOWLEDGEMENTS ...................................................................................... vii
LIST OF CHARTS AND TABLES ......................................................................... xiii
LIST OF FIGURES .................................................................................................. xiv
CHAPTER
I. INTRODUCTION ............................................................................................ 2
Background of the Problem ............................................................................... 2 Statement of the Problem ................................................................................... 4 Purpose of the Study .......................................................................................... 4 Conceptual Framework ...................................................................................... 5 Importance of the Study ..................................................................................... 7 Limitations of the Study ..................................................................................... 7 Delimitations of the Study ................................................................................. 8 Definition of Key Terms .................................................................................... 9 Organization of the Study ................................................................................ 11 Summary .......................................................................................................... 11 II. A REVIEW OF SELECTED LITERATURE .................................................. 13 Introduction ...................................................................................................... 13 ISLLC Leadership Standards ........................................................................... 15
Leader Standard 1 ................................................................................ 17 Development and implementation of vision ................................. 17 Data collection and use ................................................................. 18 Creating, implementing, monitoring, and revising plans for continuous improvement ........................................................ 20 Leader Standard 2 ................................................................................ 21 School culture .............................................................................. 21 Developing staff instructional and leadership capacity ............... 22 Student motivation ....................................................................... 23 Maximizing quality instructional time ......................................... 24 Transformational, distributed, and shared leadership .................. 24 Assessment and accountability .................................................... 25 Leader Standard 3 ................................................................................ 26 Managing school resources .......................................................... 26 Managing technological resources ..................................... 27 Managing human resources ............................................... 28
viii

Promoting and protecting safety of students and staff ................. 28 Developing distributed leadership ............................................... 30 Protecting instructional time ........................................................ 31 Leader Standard 4 ............................................................................. 33 Building and sustaining positive and productive relationships with stakeholders ................................................................ 33 Building relationships with media outlets ................................... 35 Leader Standard 5 ............................................................................. 36 Setting a tone of democracy, equity, and diversity ..................... 36 Considering moral and legal consequences of decisions ............. 37 Modeling and promoting self-awareness, reflection, ethical behavior, and transparency .................................................. 38 Leader Standard 6 ............................................................................. 40 Advocating for children, families, and caregivers ...................... 40 Assessing, analyzing, and anticipating emerging trends ............ 41
Summary of Leader Standards ........................................................... 42 Leadership Preparation Programs .................................................................. 43 Introduction ........................................................................................ 43 Leadership Training Programs ........................................................... 44 Performance-based programs ...................................................... 44 Performance-based assessments ................................................. 45
Reflective portfolios ........................................................... 48 Electronic portfolios ........................................................... 52 Student reflection .............................................................. 55
Concerns regarding portfolio use ................................................ 55 Concerns regarding reliability ..................................................... 56 Summary of Leadership Training Programs ....................................... 57 Summary of the Review of Literature .......................................................... 57
III. METHODOLOGY ........................................................................................ 61 Introduction .................................................................................................... 61 Description of Research Methodology Design ............................................... 62
Research Questions ............................................................................. 62 Rationale for a Mixed-Methods Paradigm .......................................... 63 Selection of Design ............................................................................. 66
Population and Sample .................................................................................. 68 Portfolios and Raters ........................................................................... 68 Instrumentation ................................................................................... 69 Validity ............................................................................................... 71 Data Collection Procedures ................................................................. 72
Item Analysis ....................................................................................... 73 Quantitative ............................................................................... 73 Qualitative .................................................................................. 75
Summary ......................................................................................................... 78
ix

IV. RESULTS ........................................................................................................ 81 Introduction ...................................................................................................... 81 Purpose of Study .............................................................................................. 81 Research Questions .......................................................................................... 82 Results .............................................................................................................. 82 Quantitative Findings ................................................................................ 82 Assumptions ........................................................................................ 83 Intra-class correlation .......................................................................... 87 Qualitative Findings .................................................................................. 88 Weak ................................................................................................... 93 Confusing or unclear ............................................................................ 98 Misplaced or incorrectly aligned ........................................................ 99 Incomplete ......................................................................................... 100 Implied .............................................................................................. 101 General Portfolio Comments .................................................................. 104 Reflections ........................................................................................ 104 Organization ...................................................................................... 106 Observations ..................................................................................... 107 Summary ........................................................................................................ 107 V. SUMMARY, CONCLUSION, AND FUTURE STUDIES............................ 108 Summary ........................................................................................................ 108 Analysis of Research Findings ....................................................................... 110 Discussion of Research Findings ................................................................... 111 Conclusion ..................................................................................................... 114 Implications .................................................................................................... 115 Recommendations .......................................................................................... 116 Dissemination ................................................................................................ 118 Concluding Thoughts ..................................................................................... 118 REFERENCES ....................................................................................................... 120
x

APPENDIX
A. RATER RECRUITMENT LETTER .......................................................... 136
B. RATING INSTRUMENTS ......................................................................... 138
C. IRB APPROVAL ......................................................................................... 145
D. LETTER OF INFORMED CONSENT ....................................................... 148
E. ARCHIVED PORTFOLIO USAGE APPROVAL ..................................... 151
F. NIH TRAINING CERTIFICATION ........................................................... 153
xi
LIST OF TABLES
2.1 Concept Analysis Chart .................................................................................. 59
3.1 Table of Decisions about Mixed Methods Research ...................................... 64
4.1 Normality Scores by Rated Function .............................................................. 85
4.2 Intra-Class Correlation Coefficients by Function ........................................... 89
4.3 Intra-Class Correlation Coefficients by Standard ........................................... 90
4.4 Standards with Related Artifacts .................................................................... 91
4.5 Results from Rater Commentary on Functions .............................................. 103
4.6 General Commentary on Portfolios (Holistic) .............................................. 105
4.7 Positive Commentary .................................................................................... 105
xii

LIST OF FIGURES
1.1 Dissertation conceptual framework .................................................................. 6
2.1 Concurrent Nested Strategy ............................................................................ 67
xiii
CHAPTER I
INTRODUCTION
Background of the Problem
In an effort to answer criticisms about educational leadership preparation (Levine,
2005, & Brady, 2003) leaders in state departments of education and institutions of higher
learning began to seek ways to reform and restructure educational leadership training. In
2008, significant changes took place in the structure and focus of Georgia’s educational
leadership certification. Partially, in response to the No Child Left Behind Act of 2001
and partially with a focus on fiscal responsibility, the Georgia Professional Standards
Commission and other stakeholders launched new educational leadership certification
routes which focused on Performance-Based preparation for those desiring to enter
leadership roles in Georgia’s public schools and school district offices. The new
certification programs were designed to train educational leaders with a balance of
practical on-the-job training and best-practices research skills. One key element in the
restructured certification process was that those tapped for educational leadership
positions had to enter leadership positions prior to entering university educational
leadership programs and had to be actively mentored by personnel already in leadership
positions throughout the duration of their university degree pursuits (Georgia
Professional Standards, 2012).
According to the Georgia Professional Standards Commission, while candidates
worked on a Specialist or Doctoral degree, they had to be engaged in activities that
2

allowed them to develop a wide range of skills with as many different stakeholders as
possible (Georgia Professional Standards, 2012). Training which the candidates received
had to show that they were challenged with a variety of leadership opportunities that were
intentionally selected to develop a substantial skill set so that the emergent leaders would
be prepared through practical opportunities to synthesize the theories they learned in the
university setting, hence a performance-based structure. These residency requirements
had to be collaboratively selected by school districts, building level leaders, and the
institutions from which they sought degrees and had to be designed to give the emergent
leader real opportunities to develop leadership functions and dispositions outlined by the
Educational Leadership Constituent Council, the National Council for the Accreditation
of Teacher Education, the Interstate School Leaders Licensure Consortium (ISLLC) and
the Guidelines for Georgia Performance-Based Educational Leadership Program
(Georgia Professional Standards, 2012). Each candidate had to have an individualized
program, but all of the skills and standards for educational leaders had to be developed
within the framework of their residency.
Documentation of the Education Leadership residency was tracked primarily
through the utilization of portfolios, either electronic or paper. More than 90% of
educational administration programs utilized portfolios according to a 2004 national
study (Norton). Marzano (2000) suggested that portfolios were one of many types of
performance assessments which captured more of an essence of what a learner actually
knew. Reflections written in the portfolios were a valuable part of the portfolio process
because thinking about learning established even deeper cognitive development
(Schulman, 1998).
3

Statement of the Problem
Educational leadership programs moved toward a performance-based structure
more than five years ago. Some sort of internship or practical experience was required to
receive specialist degrees. Most universities utilize portfolios or electronic portfolios to
document these practical internship experiences. Several years have passed since the
requirement of performance-based activities, internships, and practical experience;
principals and other mentors have had opportunity to apply the new requirements for
leader candidates. Many portfolios were created to document leadership tasks, roles, and
activities. However, what is not known is how well portfolios documented the mastery of
leadership skills. Therefore, the researcher purposed to answer the overarching
quantitative question: To what extent are portfolios reliable as evidence of mastery of
ISLLC standards and functions of students enrolled in educational leadership specialist
programs when measured by intra-class correlation? A secondary qualitative question
was: Why does consistency or inconsistency exist among the raters?
Purpose of the Study
The researcher purposed to determine the reliability of portfolios as evidence of
mastery of ISLLC standards and functions of students enrolled in an educational
leadership program. Intra-class correlation was utilized to compare ratings assigned by
those with advanced degrees in educational leadership when evaluating evidence of
ISLLC standards and functions in portfolios presented by educational leadership students,
thus determining reliability of the portfolios. From a pool of nine raters, each of thirty
portfolios was evaluated by three raters to determine reliability. Those raters were asked
4

to explain why ratings were given and ways to improve evidence of skill mastery. Rater
commentary was considered narrative or written interview. After the numerical data were
gathered, the written narratives were coded and grouped to provide insight into the
reliability of portfolios as documentation of leadership skill practice and mastery. The
quantitative component of the study was designed to determine to what extent raters
would evaluate portfolios similarly, and the qualitative element of the study was to offer
explanation, justification, and rationalization of those scores. The ultimate goal was to
gain practical, applicable understanding to the utilization of portfolios as a tool to
ascertain mastery of ISLLC standards and functions.
Conceptual Framework
As background and foundational research, evolution of leadership preparation was
examined. Additionally, ISLLC standards and functions were studied in order to build an
understanding of theory behind the standards. The researcher also briefly delved into
various leadership training programs. Utilization of authentic, performance-based
assessment in university programs was another focus, especially when documentation of
assessments was through portfolios and e-portfolios. The importance of adequate and
appropriate artifacts along with their introductions and reflections was another
component of study for the researcher.
The major conceptual framework for this study was drawn from various research
relating to performance-based documentation of skills mastery. Marzano, Pickering, and
McTighe suggested that performance tasks and assessments deepen student construction
of their own learning (1993). Davis, Darling-Hammond, Meyerson, and LaPointe (2005)
revealed in their research that programs with standards-based curriculum and field-based 5
internships prepared effective leaders. The researcher sought to determine reliability of
the portfolios of artifacts created in performance-based and field-based assignments as
documentation of mastery of educational leadership standards.
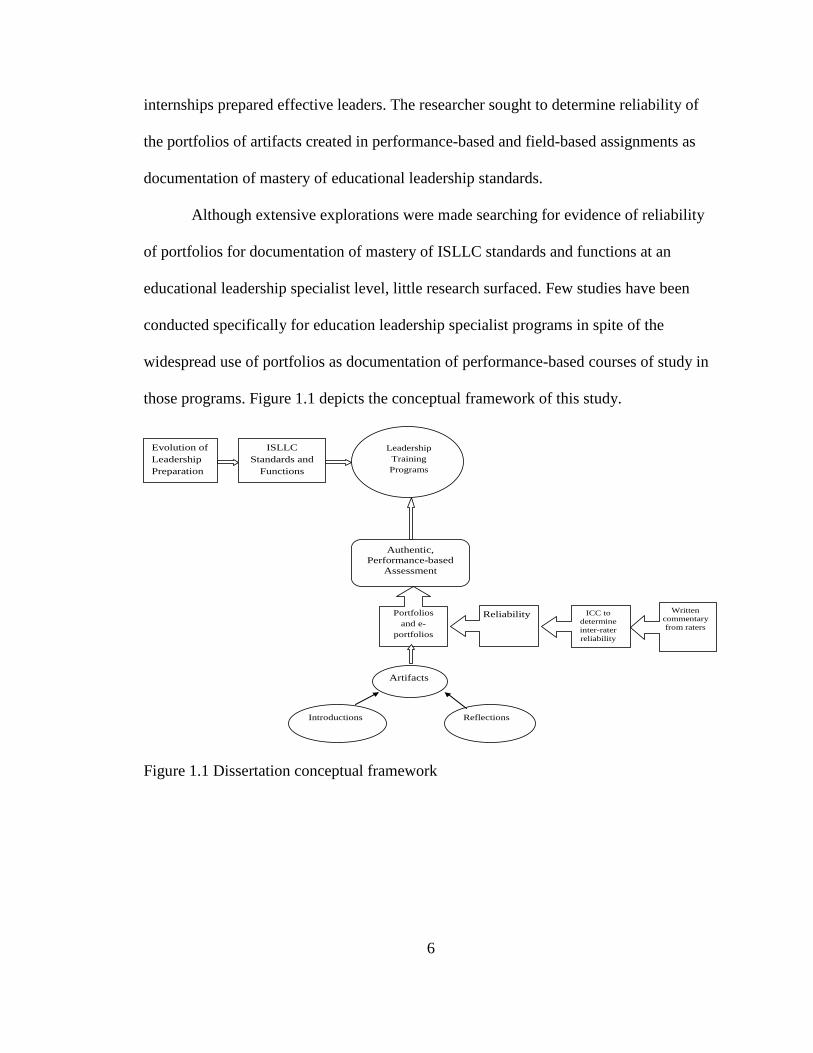
Although extensive explorations were made searching for evidence of reliability
of portfolios for documentation of mastery of ISLLC standards and functions at an
educational leadership specialist level, little research surfaced. Few studies have been
conducted specifically for education leadership specialist programs in spite of the
widespread use of portfolios as documentation of performance-based courses of study in
those programs. Figure 1.1 depicts the conceptual framework of this study.
Figure 1.1 Dissertation conceptual framework
Evolution of Leadership Preparation
ISLLC Standards and
Functions
Leadership Training Programs
Authentic, Performance-based
Assessment
Portfolios and e-
portfolios
Reliability
Artifacts
Reflections Introductions
ICC to determine inter-rater reliability
Written commentary from raters
6

Importance of the Study
This study was of benefit to this mid-sized university in the Southeast United
States and other institutes of higher learning because most universities utilize e-portfolios
in some capacity to measure student growth. Reliability is a basic component of statistical
data collection, and establishing the reliability of the use of one of the cornerstone pieces
of evidence of leadership preparedness is necessary to include it in best-practices
techniques. Portfolio reliability has been debated, but little evidence has been published
regarding the reliability of electronic portfolio utilization in educational leadership
programs. In fact, Markham and Hurst suggested that since the advent of the electronic
platform, “the implications for reliability and validity appears not to have been subjected
to research” (2009, p. 11). One of the potential benefits of this study was that it would
help those who design educational leadership programs understand what was working
and what was not working with regard to portfolio documentation of the ISLLC standards
for aspiring educational leaders. A final potential benefit was to students who participate
in Educational Specialist in Leadership programs. They would profit from preparing a
purposeful portfolio from a program which had a reliable and valid assessment process of
the performance-based component of their program of study.
Limitations of the Study
The portfolios utilized in this study were limited to those submitted by students
who had completed this mid-sized university in the Southeast United States’ Education
Leadership Specialist program of study in any semester of 2011-2012. Raters were
recruited from professors at this mid-sized university in the Southeast United States and
7

from school leaders who had earned Doctor of Philosophy in Educational Leadership or
Doctor of Education in Educational Leadership degrees. Thirty portfolios were examined.
Because this study was limited to a few portfolios in one university, it may not be
generalizable to the entire population of education leadership candidates. However, by
limiting the study to one program, variables of university Educational Leadership
framework and coursework were eliminated. All students had the same criteria for
entering the Education Specialist program. Although they may have been from different
cohorts, many attended the same classes taught by the same professors. Expectations for
portfolio documentation were similar for all students, and the raters were familiar with
the ISLLC standards for Educational Leadership. Raters were limited to professors of
educational leadership at this mid-sized university in the RSU or individuals with earned
doctorates (either Ph. D. or Ed. D.) in the field of educational leadership and were
working as educational leaders. These criteria ensured that raters had in-depth familiarity
with the ISLLC standards so that they could appropriately determine to what extent
artifacts (with their introductions and reflections, if included) provided evidence of
mastery of particular standards and functions.
Delimitations of the Study
Because of the size of the university (mid-sized), the researcher had access to
university personnel to recruit as raters. Additionally, because the school system in which
the researcher works was midsized and many personnel in the system were acquainted
with each other, a delimitation of this study was access to school building and district
leaders as potential raters. A final delimitation was the provision of access to archived
data by the university. 8

9

Definition of Key Terms
Administrators - building principals and others in leadership roles who provide
instructional leadership or manage the daily activities in schools.
Authentic assessment - when student learning is applied in a complex, real-world
situation and assessment in more than an event for a grade (Benson & Barnett, 2005).
Composite score - total of all function scores within a particular standard.
Comprehensive score - total of all standard scores; the total score of a portfolio.
Effective school - a school that meets the district’s mission and vision for
students.
Evaluation - the identification, clarification, and application of defensible criteria
to determine an evaluation object’s value (worth or merit), quality, utility, effectiveness,
significance in relation to those criteria (Worthern, Sanders, &Fitzpatrick, 1998, p. 517).
Function- descriptor of tasks related to each ISLLC standard
Interstate School Leader Licensure Consortium (ISLLC) - The Interstate School
Leaders Licensure Consortium (ISLLC) is a representative body of most of the major
stakeholders in educational leadership including national associations, states, and
colleges and universities. The ISLLC was organized by the Council of Chief State School
Officers (CCSSO) and was formed for the purpose of developing model standards for
school leaders (Hale and Moorman, 2003).
Mentoring relationships - close working relationship between a student enrolled in
this mid-sized university in the Southeast United States’ Education Leadership program
and an administrator in which relationships are developed based on the strengths,
10

knowledge, and skills of the mentor and the knowledge of these areas that are needed by
the mentee.
Parametric statistics - statistical test based on the normal distribution of data; must
meet four basic assumptions in order for the test to be accurate: “normally distributed
data, homogeneity of variance, interval or ratio data, and independence” (Field, 2009, p.
791)
Performance assessment - the rating of student performance, process, and product.
Many performance assessments require higher-order thinking.
Performance task - A performance task enables pupils to demonstrate their ability
to integrate and use knowledge, skills, and work habits in a meaningful activity.
Portfolio - “A portfolio is a purposeful collection of student work that exhibits the
student’s efforts, progress, and achievements in one or more areas. The collection must
include student participation in selecting contents, the criteria for selection, the criteria
for judging merit, and the evidence of self-reflection” (Paulson, Paulson, & Meyer, 1991,
p. 60).
Principal - refers to any person who is certified as an administrator through
successful completion of a graduate course of study or certification program and who
presently serves as the lead administrator of an elementary, middle, junior high, or high
school.
Principal Preparation Program - refers to a program designed to prepare
administrative candidates for leadership roles in schools.
Reflection - quality commentary, created by students, for the sake of
improvement and performance (Benson & Barnett, 2005).
11
Self-efficacy - conceptualizes a person’s perceived ability to perform a task as a
mediator of performance on future tasks (Bandura, 1977).
Stakeholder - refers to an individual who has a stake in or may be affected by the
program to be evaluated or the evaluation’s results (Worthern, Fitzpatrick, & Sanders,
1998).
Standard - generally describing one of six ISLLC standards for school leaders.
Organization of the Study
This dissertation was divided into five chapters. Chapter I included a background
of the problem, statement of the problem, the purpose and significance of the study, the
research question which guided the study, and definition of terms.
Chapter II was a literature review that focused on the ISLLC standards and
functions, leadership preparation programs including mentorship, performance-based
assessments, and portfolios.
Chapter III contained the methodology for the study and reviewed the purposes of
the study, research questions, data collection, and analysis of data.
Chapter IV presented the data analysis and the findings of the study. The findings
were guided by the research questions.
Chapter V contained the conclusion, implications, and recommendations for
further research.
Summary
Although portfolios provided a collection of artifacts documenting performance-
based educational leadership activities, it was unclear how reliable these documents were
12
to indicate mastery of the standards provided by ISLLC. This research project was
designed in order to explore the reliability of portfolios as documentation of mastery of
ISLLC leadership standards.
13

CHAPTER II
A REVIEW OF SELECTED LITERATURE
Introduction
The perception of the role of a school leader emerged from being the lead teacher
in a small school to being a manager of an organization. As new knowledge about
effective leadership practices emerged, those in charge of developing preparation
programs for school leaders responded by creating courses of study responsive to social
change. As schools changed from being one-room, one-teacher structures to being multi-
room buildings with students divided by grade and skill level, the need arose for someone
to oversee schools for management and continuity’s sake (Rousmaniere, 2007). Early
school administrators were generally lead teachers who were not even formally trained.
By the early 1900’s, school board members who hired and fired administrators were the
norm, and universities began offering a few courses to train educators to become school
administrators. State certification for principals differed from that of teachers in only
seven American states in 1923. After World War II ended, entire new programs of study
had been introduced into universities to prepare educational leaders (Glass, 1962). Early
processes involved in the construction of school leader standards and their assessment
instruments had been considered for the last four decades. In 1968, Stufflebeam
published the first of a series of articles about how to develop an educational evaluation
process which was based on a research project lasting more than two years at Ohio State
University. Members of state departments of education began developing individual
assessments for principals and school leaders, and Georgia was one of the states which
14

led the principal assessment charge. In 1978 they began evaluating principals with the
Georgia Principal Assessment System (GPAS) which was comprised of four distinct
instruments scored by the principal, a teacher, an external observer, and someone from
central office, often the superintendent (Ellett, 1978). The GPAS was one of the earliest
instruments validated and standardized, carefully constructed over a four-year period of
study. This instrument met several school assessment needs. “The items have been
demonstrated to have validity; information has been demonstrated to be effective in
targeting areas for improvement, and performance defects have been identified and
corrected using these instruments” (McCleary, 2001, p. 49).
Members of the National Association of Secondary School Principals (NASSP)
saw the need for more continuity among the states. In 1977, the NASSP members took
several steps to build connections between state assessment and licensing processes,
including establishing a psychometric testing center with which to evaluate
administrators and potential school leaders (McCleary, 2001). In 1985, the National
Commission on Standards for the Principalship (NCSP) was organized and funded by the
NASSP (Erlandson, 1990). The commission’s focus was four-fold: determining the
problems related to the establishment and enforcement of universal standards, reviewing
what had already been done relating to development of standards, developing a course of
action for identifying standards, and collecting data from educational leaders about their
tasks and functions (Erlandson, 1990).
When national and school leaders read A Nation at Risk in 1983 led national
leaders, not just school leaders, they examined educational leadership in the United
States, wrote the No Child Left Behind laws, formed the National Education Standards
15

and Improvement Council, and eventually formed ISLLC, the Interstate School Leaders
Licensure Consortium (CCSSO, 1996). ISLLC was recognized as one of the national
guiding forces to develop standards by which school leaders were evaluated.
In this review of selected literature, the researcher first considered each of the six
ISLLC leadership standards and their implications. Additionally, educational leadership
training approaches, especially internships, were reviewed. Finally, the utilization of
performance-based assessments as measurement tools for authentic appraisal of
educational leader skills, including reflective portfolios, was examined.
ISLLC Leadership Standards
Members of ISLLC presented the original set of standards for educational leaders
November 2, 1996. These standards were the catalyst for employees in 24 state education
agencies to develop standards for educational leadership. Compatible with National
Council for the Accreditation of Teacher Education (NCATE), members of state
education agencies set forth guidelines for educational leadership preparation programs in
colleges, universities, and state licensing agencies. The standards were designed to
measurably increase educational leaders’ performance.
The ISLLC standards (CCSSO, 1996) were developed to help guide instructional delivery and field-based opportunities to ensure that aspiring school leaders are exposed to and immersed in project-based, experiential, researched, and hands-on experiences through a combination of traditional instructional methodologies, mentored experiences, and internships. (Weidmer, 2007, p. 18)
Representatives in the consortium wanted to raise the standards for educational leaders in
order to train and retain the best leaders possible for schools. Six leader standards
emerged, with indicators for knowledge, disposition, and performances listed for each
(CCSSO, 1996). 16

In 2008, members of the Wallace Foundation sponsored a revisiting of the ISLLC
standards of 1996. Realizing that many more empirical studies had taken place since the
1996 consortium, Leithwood, Lewis, Anderson, and Wahlstrom wrote a meta-analysis
(2004). In this analysis they reported that classroom instruction was the most influential
factor in student learning, but the second most powerful factor was school leadership.
This set the stage for education leader training agencies to continue to improve
educational leadership programs. Simplifying the standards, the 2005 ISLLC members
eliminated knowledge, disposition, and performance indicators and replaced them with
delineated functions (Babo & Ramaswami, 2011) which served as markers for
educational leaders. These changes served a two-fold purpose by increasing the flexibility
in leadership preparation programs and by reducing the confusion associated with the
1996 standards (CCSSO, 2008). Although the new standards retained the six major
headings of the 1996 ISLLC standards, the 2008 consortium representatives reduced 183
knowledge, disposition, and performance indicators to 31 functions of school leaders
while keeping the framework and goals to effectively develop capable and competent
educational leaders (Weidmer, 2007). Eacho of the 2005 ISLLC standards are described
below. Several components overlapped in the leader standards and were mentioned in
more than one section. This was by design; leadership tasks necessarily draw from
multiple leadership characteristics.
College and university professors that train school leaders have imbedded the
mastery of these standards into their curricula in an effort to better prepare school leaders.
University courses were designed around ISLLC leader standards. In this research
project, raters correlated artifacts that were presented as evidence of standard mastery
17

with the standard with which they were compared. Having a deeper understanding of
each standard was important to the researcher. The initial phase of research was to
provide a thorough understanding of each standard.
Leader Standard 1
“An education leader promotes the success of every student by facilitating the
development, articulation, implementation, and stewardship of a vision of learning that is
shared and supported by all stakeholders” (CCSSO, 2008, p.,14). Now principals were
responsible not only for guiding the development of a vision of learning in a school, but
also for sharing it, for executing it, and for carefully evaluating its progress (Devos &
Bouckenooghe, 2009). In preparing individuals to become school administrators and
leaders, college and university faculty provided specific areas of development guided by
the ISLLC leader standards.
Development and implementation of vision.
Individuals in an educational leadership preparation program had to learn how to
collaboratively develop a vision of learning then learn how to carry it through to its
implementation and evaluation, while acting as the agent of stability during any
necessary transition (Masci, Cuddpaph, & Pajak, 2008). Involving parents and
community leaders in the process of deciding what students needed to learn and how to
measure their progress was a powerful tool for student engagement and academic success
(Wright & Saks, 2000). A leader provided direction for organizations; schools were no
different. Standard 1 included direction for leaders to guide the creation and
implementation of a shared vision of learning. School leadership took a two-pronged
approach (Hulpia & Devos, 2009). Leaders who transformed organizations set a school 18

vision shared by all, and then they motivated stakeholders into implementing the vision
(Hulpia & Devos, 2009). The necessity to understand the many dimensions of learning
tasks was touted by Starrat (2005). He asserted that school leaders were responsible not
only for learning to take place but also for ensuring that the learning accounts for helping
students to grow into “an intentional self-governing community” (2005, p. 130) by
establishing the democratic and somewhat idealistic climate of the school. This ability to
multitask was vital. “A principal’s capacity to facilitate conditions for student learning,
manage the organization and build community partnerships is paramount to reaching
essential school outcomes” (Militello, Gajda, & Bowers, 2009, p. 32). School leaders
were the “critical link” (Louis & Wahlstrom, 2011, p. 54) to ensure improvement in
student learning, but they worked as team players (Du, 2007; Hulpia & Devos, 2009).
Lickona and Davidson stated the following:
Great schools “row as one”; they are quite clearly in the same boat, pulling in the same direction in unison. The best schools we visited were tightly aligned communities marked by a palpable sense of common purpose and shared identity among staff -- a clear sense of “we.” By contrast, struggling schools feel fractured; there is a sense that people work in the same school but not towards the same goals. (2005, p. 65)
Data collection and use.
A key component of this standard was encouraging the assimilation and proper
use of data in order to ascertain what individual student’s needs were. An article entitled
“Data, Data, and More Data—What’s an Educator to Do?” Goren summed up the
quandary well by stating that “the ubiquitous nature of data now available in the public
domain runs the risk of every other education fad that has preceded it: significant rhetoric
that yields false promises about improving schools and the life chances of young people”
19

(2012, p. 233). Mountains of data abounded, but it was incumbent on school leaders to
identify which data were significant and useful in the education of young people. Student
achievement data were the most frequently data used, and most data were used as
summative information to ascertain what students had learned after instruction, rather
than formative which guided instruction, according to a study of 16 Michigan principals.
Additionally, the study revealed that a great diversity existed relative to the extent to
which school leaders utilized data to improve curriculum and instruction (Shen, Cooley,
Reeves, Burt, Ryan, Rainey, & Yuan, 2010). Teachers were no more consistent; some
were invited or required to dialogue with principals, parents, academic coaches, and
consultants about data from standardized tests, benchmarks, and dropout rates, while
others were not (Little, 2012). Effective school leaders knew how to navigate the
treacherous data mine in order to identify which information guided toward their vision
and goals. They were also equipped to lead teachers into understanding relevant data and
how to utilize it to benefit students.
When school leaders interpreted and applied data in its educational context, the
data helped leaders develop more effective visions and goals (Spillane, 2010). Two
performances relevant to using assessment and demographic data in the development of a
school’s vision and goals were delineated in Standard 1. Educational leaders were skilled
in the interpretation of relevant data and perceptive enough to know what was reasonable
in the context within which this data was situated (Spillane, 2010) while guarding against
misinterpretation, misuse, and unintended consequences (Coburn & Turner, 2012).
People-minded principals felt more adept at involving teachers and other stakeholders in
developing a shared vision when compared with administrative-minded principals (Devos
20

& Bouckenooghe, 2009). Therefore, it was important to identify leader candidates who
were more administrative-minded and to develop their skills of creating shared vision.
However, were educational leaders charged with the task of developing and
implementing vision, and they were also responsible for ensuring that existing school
resources were utilized for goal-reaching purposes and for procuring the needed
resources to ensure progress toward educational goals (CCSSO, 2008). According to
Horng, Klasik, and Loeb, when principals left their school campuses, they usually were
meeting with people in the school district or with external community stakeholders to
obtain needed resources for the school (2010).
Creating, implementing, monitoring, and revising plans for
continuous improvement.
Intentional decision-making practices were also addressed in Leader Standard 1.
Descriptors in the standard delineated decision-making practices as always reflecting on
how the decision met goals that were previously set. Exemplary educational leaders
utilized the vision and mission as an objective and filtered all decisions through
questioning how the change assisted in meeting goals. If plans did not work, they were
changed (Quong & Walker, 2010). The goal of continuous improvement was at the
forefront. For example, the Keller Independent School District was recognized by
winning the Malcom Baldridge Quality Award which was usually given to an industry
for its continuous improvement process. This school district’s leaders were cited for
developing a way to identify gaps in performance goals then using that information to
develop action plans. Veitenheimer, one of the educational leaders of that district, said
21

that utilizing the structure enabled them to become “intentionally exceptional” (Johnson
& Sommer, 2012).
Leader Standard 2
“An education leader promotes the success of every student by advocating,
nurturing and sustaining a school culture and instructional program conducive to student
learning and staff professional growth” (CCSSO, 2008, p. 14). Key components of this
standard included school culture, learning climate for students and teachers, professional
development, leadership capacity of staff, guarding of instructional time, and monitoring
the impact of the educational process.
School culture.
The culture of a school was characterized by its “beliefs, attitudes and behaviors”
(Phillips, 1996, p. 1). School culture was a broad descriptor encompassing collaboration,
trust, expectations, motivation, leadership capacity, and many other attributes. Although
school culture was an abstract concept, it was detected almost immediately. Daniel L.
Duke noted that
culture is conveyed in the way staff members think of themselves, their colleagues, and their work. It is embodied in assumptions about students and parents, beliefs about teaching and learning, and values regarding what it means to be an educator. (2010, p. 82)
As stewards of a school’s culture, an educational leader had an effect on collective
teacher efficacy (Ross & Gray, 2006), and teacher efficacy had a powerful impact on
student achievement (Goddard, LoGerfo, & Hoy, 2004). One of the most critical
functions was recruiting and retaining staff members who were committed to the value of
continuous improvement; a high turnover rate in teachers and staff was counterproductive 22

and undermining of the school’s success (Duke, 2010). Team commitment, shared
leadership, shared vision, and effective communication were additional descriptors of
effective organizations (MacBeath, 2005; Salazar, 2007). Collaboration, trust, learning,
and high expectation were integral factors school leaders embeded in the culture of a
school of excellence (CCSSO, 2008).
Defining the school’s mission, managing the instructional program, and
promoting a positive school learning climate were key behaviors which coordinated
positively to the effectiveness of a school (Hallinger, 2005). One researcher suggested
that learning-centered leadership positively affected the outcomes on the Virginia
Standards of Learning (SOL) test which provided quantitative evidence that school
leaders who developed instructional programs conducive to student learning were more
effective (Reardon, 2011). Evidence that learning-centered leadership played an integral
part in student achievement was also found in other studies (Halinger & Heck, 1996;
Hallinger & Heck, 1998; Leithwood, Louis, Anderson, & Wahlstrom, 2004; Leithwood
& Jantzi, 2005; Lindahl, 2010; Sebastian, & Allensworth, 2012). The most significant
effect principals had on student learning was that of school climate (Sebastian and
Allensworth, 2012).
Developing staff instructional and leadership capacity.
Learning was not limited to the student population. School leaders who created
professional learning opportunities for their teachers enhanced and renewed the teachers’
passion for learning (Drago-Severson, 2007). By understanding professional learning
needs and developing teachers within the building, many positive outcomes were noted
(Leithwood & Mascall, 2008, Printy, 2008). Some of the outcomes of staff development 23

classes included more collaboration and cooperation, a better appreciation of the diversity
within the school, healthy communication and expression of feelings, and better
mediation skills (Collins, 2003). Teachers were able to consider new ways of thinking,
behaving, and collaborating, and they felt supported and validated (Drago-Severson,
2007). The greatest benefit for improving instruction was strategic individual attention
principals gave to teachers to support instructional practice (May & Supovitz, 2011).
Insightful leaders knew how to balance individual instructional coaching and group
coaching to invest time in the most productive manner. They also understood the value of
supporting teachers.
Student motivation.
Motivating students was a challenging endeavor, but if a school leader developed
relationships with the students as well as with the staff of a school, personalization of
rewards became more effective. Stimulation, encouragement, and promotion were
powerful leadership tools (Leithwood & Jantzi, 2006). Some motivation was in the form
of verbal encouragement, but some schools had even begun having pizza parties and pep
rallies to increase academic performance (Hollingworth, Dude, & Shepherd, 2010). By
having celebrations of learning, school leaders demonstrated that reaching educational
goals were valued. Principals showed that academic accomplishments were a priority by
recognizing achievements of students and staff. Walls of fame, honor rolls, and
attendance recognitions were ways to celebrate milestones for students, while public
announcements recognizing teachers who obtained advanced degrees indicated that
learning was a lifelong process. “It’s part of a leader’s job to show appreciation for
people’s contributions and to create a culture of celebrating values and victories” (Kouzes 24

& Posner, 2007, p. 22). Creative ways to commemorate accomplishments of teachers,
staff, and students was a trait of an effective leader. Leaders of excellence looked for
meaningful methods to honor achievements.
Maximizing quality instructional time.
Guarding time spent on instructional activities was one of the most pressing
challenges of an instructional leader. Balancing activities that promoted student
engagement and celebrating student accomplishments with actual instructional time was
exigent but necessary. Academically engaged time had a strong correlation with student
achievement (Bellei, 2009; Harn, Linan-Thompson, & Roberts, 2008; Leithwood, Patten,
& Jantzi, 2010; Marburger, 2006), and it fell to educational leaders to develop a culture
which protected this time.
Transformational, distributed, and shared leadership.
Transformational leadership, distributed leadership, and shared leadership all led
to more effective schools (Hulpia, Devos, & VanKeer, 2011). One especially notable
benefit of shared leadership was the increase of teachers’ organizational commitment
which strengthened schools. Shared leadership did not mean that school leaders delegated
others to be in charge of certain activities (Hulpia et al., 2011); effectiveness came from
authentic collaboration which resulted in synergy (Marks & Printy, 2003). Although
having more individuals involved in decision making was not always easy and could
even be messy, a transformational leader utilized those situations “as learning
opportunities rather than self-righteous occasions for punishment” (Starratt, 2005, p.
129). In their meta-analysis, Waters, Marzano, and McNulty (2005) revealed that
25

engaging stakeholders, including teachers and teacher-leaders, created a culture and
climate for student success. A school leader’s power and influence were not reduced
when they augmented the power and influence of others (Leithwood, Jantzi, &
McElheron-Hopkins, 2006). In fact just the opposite occurred. When principals shared
leadership, a stronger sense of community and trust were established (Louis &
Wahlstrom, 2011), and teachers took more ownership in educational issues (Smith,
2010).
Assessment and accountability.
With accountability came measurement of effectiveness, which came in many
shapes and sizes. Student learning was a key component of the measurement of
effectiveness of any given school, teacher, or leader. This information was gathered from
formative and summative classroom assessments (Herman, Waldrip, Hall, & Chimino,
2012), school and district benchmarks, and state or national standardized tests. Some
measurements were broad based and inclusive of descriptors such as teachers’ caring
about and challenging students (Crow, 2011). Other measurements were more focused on
specific standards in particular content areas (Bulkey, Christman, Goertz, & Lawrence,
2010). Recent trends included measuring teacher effectiveness through student growth
(Schafer, Lissitz, Zhu, Zhang, Hou, & Li, 2012). One key to improving student learning
was assessment for learning (formative assessment) in order to identify misconceptions
well before summative assessments were given (Popham, 2009). Educational leaders
needed to be aware of local, district, state, and national trends in order to most effectively
measure student growth and education.
26

School culture including collaboration, trust, high expectations, learning
environment, maximizing time on instruction, and monitoring instructional effectiveness
were addressed in Leader Standard 2. Each of these skills was important to obtain and
maintain if an educational leader wanted to serve schools in a dynamic capacity. If
educational leaders were proficient in these skills, they could nurture and sustain a school
culture in which students made progress toward attainable educational goals.
Leader Standard 3
“An education leader promotes the success of every student by ensuring
management of the organization, operations, and resources for a safe, efficient, and
effective learning environment” (CCSSO, 2008, p. 14). Although it was important for
principals to be strong instructional leaders, it was equally important that educational
leaders had strong organizational management skills. “School leaders influence
classroom teaching, and consequently student learning, by staffing schools with highly
effective teachers and supporting those teachers with effective teaching and learning
environments” (Horng & Loeb, 2010, p. 69). One of the key tasks of effective school
leaders was guarding and guiding the stewardship of all resources, both tangible and
intangible. Tangible resources included financial, structural, and technological, while
intangibles included such assets as personnel and time.
Managing school resources.
Much attention was placed on transformational leadership, focusing less on the
management aspects. However, some management tasks still remained a priority for
school leaders. “The administrator must orchestrate the school’s resources, structures,
27

and processes” (Starratt, 2005, p. 131) while being mindful of the entire organization.
The effective leader needed to be knowledgeable in educational aspects of school such as
learning, teaching, and student development, as well as the operational aspects such as
building maintenance, equipment management, and fiscal operations including allocation
of resources (Drake & Roe, 1994). Shared responsibility in making management
decisions actually worked to improve morale in a school; if principals invested time in
developing leadership potential in others, it empowered them (Du, 2007).
Managing technological resources.
Alignment and utilization of technology as a tool for learning and teaching was
another component of Leader Standard 3. As technology became more available and
necessary for the twenty-first century population, it was essential that educational leaders
sought methods and means for cutting-edge technological tools to be integrated into the
classroom. “…Our results suggest that a school’s technology efforts are seriously
threatened unless key administrators become active technology leaders in a school”
(Anderson & Dexter, 2005, p. 74). These efforts included technology audits, goals,
policies, budgets, and other supports (Anderson & Dexter, 2005). Teachers utilized more
current technology in schools whose leaders integrated technology training into
professional development. Interestingly, more true technology integration occurred in
schools which practiced distributed leadership (Schrum & Levin, 2013). School leaders
whose technology integration was considered exemplary developed teachers as leaders
and depended on the teacher-leaders not only to lead technology integration but also to
lead other school improvement missions as well (Leithwood & Jantzi, 2006; Schrum &
Levin, 2013). 28

Managing human resources.
Hiring effective teachers was one of the most significant responsibilities of a
school leader. “Without a question, the single most important task of a principal is to hire
highly qualified, exceptional staff” (Mason & Schroeder, 2010, p. 186). School leaders
were able to select teachers who knew the curriculum and knew how to impart that
curriculum to students in various ways to ensure that all pupils applied learned skills to
their lives (Starratt, 2005). As relationships were built with staff, developing the culture
(Standard 2) was also enhanced.
Promoting and protecting safety of students and staff.
Noted in the ISLLC Standard 3 was school safety (2008, 14). Maslow’s hierarchy
of needs identified feeling safe and secure as one of the basic components of human
existence. The relationship between school leaders, teachers, and staff was the foundation
of school safety (Collins, 2003; Kinney, 2009). In the 1980’s, as a part of school safety
training, school administrators were trained in vocabulary related to toxic material
detection and elimination (Hoyle, English & Steffy, 1985). Concerns such as gangs,
weapons, drugs, and bullying were reported as the most troublesome safety issues in
Arizona schools (Bosworth, Ford, & Hernandez, 2011). More than 825,000 victimization
instances were reported in 2009 according to the 2011 Indicators of School Crime and
Safety report. These instances included theft, violence, and simple assault. About 31% of
students in grades 9-12 reported having been in a fight in 2009, and about 7% of students
revealed they had carried a weapon on school property in the 30 days prior to the study
(Indicators of School Crime and Safety, 2011).
29

As a response to weapons concerns, many schools installed metal detectors;
however, research indicated that relationships were even more important than security
devices and procedures (Bosworth et al., 2011). “The security loop would never have
been closed without every student and staff member taking responsibility for the safety
and security of others and their school” (Kinney, 2009, p. 54). Another researcher noted
that educational leaders had the obligation to provide materials and direction for teachers
to develop a learning community in which “democratic citizenry and social
responsibility” (Pryor, 2010, p. 364) were the norm in order to end bullying
victimization. Kinney discussed the effect of school safety on academic achievement and
framed the need for safety succinctly, “How can principals expect their teachers to focus
on curriculum, instruction, and assessment if they don’t feel safe?” (Kinney, 2009, p. 54).
Students perceive that rule enforcement was the most significant factor in school safety
(Booren & Handy, 2009). Students were asked to rate various safety strategies, including
surveillance cameras and metal detectors, counseling, bullying prevention training,
mental health, and policies and procedures. Students saw principals, teachers, and other
adults in the building of paramount importance in regard to school safety. They indicated
that the adults in the building consistently managing and enforcing safety rules made
them feel more secure (Booren & Handy, 2009; Bosworth et al., 2011). However, Essex
(2001) cautioned about the use of zero tolerance as an ethical discipline tool and
universal remedy for discipline issues. Building compassionate relationships was seen as
a much more effective cure for behavioral problems (Dufresne & McKenzie, 2009;
Essex, 2001; Mirk, 2009).
30

Another safety issue which gained recognition in educational arenas recently was
that of cyber-bullying. The delicate balance between freedom of speech and shouting fire
in a crowded theater was seen when addressing cyber-bullying incidents. Educational
leaders knew their legal obligations and took opportunities to protect victims of this
rampant issue, while not trampling on the first amendment rights of the perpetrators.
Hinduja and Patchin (2011) reviewed legal issues regarding cyber-bullying and the law
and identified school leaders’ guidelines for intervention: If it disrupted learning, if it
interfered with education or school discipline, if it was done on school technology, or if it
threatened or impeded another’s civil rights, discipline may occur. Hinduja and Patchin
suggested that educational leaders had to intervene on behalf of the victims of this
epidemic problem which has led to traumatic emotional issues from low self esteem to
suicide (2011).
Developing distributed leadership.
Encompassed in Standard 3, distributed leadership was discussed as one of the
most important element in schools of excellence (Demir, 2008; Schrum & Levin, 2013).
An essential ingredient in the principal’s work is to intentionally share meaningful information, to build a culture of care, to develop and contribute to a communication in the school where as many as possible participate and to manage different themes of discussions in different arenas of communication. (Presthus, 2006, p. 82)
According to early analyses by Jantzi and Leithwood (1996) of 34 studies of
transformational school leadership, practices of shared leadership facilitated
improvement in schools when school leaders included faculty in school decisions. In a
review of subsequent studies, Leithwood and Jantzi revisited transformational school
leadership research (32 additional studies) and found several positive influences, from 31

modest to large in effect. They also found that perceptions of organizational leadership
were significant and large, influence on student achievement was modest but positive,
and that a positive, although small, effect was noted on student engagement in their 2005
meta-analysis (Leithwood & Jantzi, 1999). However, Timperly (2011) cautioned that if
weak teachers were tapped to have influence in decision-making, then weak decisions
were possible. Therefore, if pedagogically strong teachers were included in making
leadership decisions in a true shared leadership and collaborative effort, more sound
educational decisions were realized (Devos & Bouckenooghe, 2009; Du, 2007; Leech &
Fulton, 2008). “Transformational leadership empowers followers and renews their
commitment to the organization’s vision” (Leech & Fulton, 2008, p. 641). Selection of
those involved with collaborative decisions was strategic and often involved selecting
those faculty members that a leader perceived as “co-conspirators,” while selecting those
who might oppose the school leader were positive as well (Kirby, Paradise, & King,
1992). By selecting both those who agreed and those who disagreed, a school leader built
trust among more constituents. Learning networks were created; synergy abounded.
Protecting instructional time.
A final component of Leader Standard 3 was that education leaders were
responsible for guarding instructional time and ensuring that quality instruction and
student learning were occurring. Content leaders lost up to 8% of their instructional time
dealing with interruptions that were mostly avoidable. One particular teacher had 18
interruptions resulting in 45 instructional minutes lost in one day (Glover & Miller,
1999). In exceptional education cases, the time spent non-instructionally was even more.
Paperwork, discipline, IEPs, and other interruptions accounted for nearly 47 minutes per 32

hour of instructional time for one particular participant in a time-management study
(Vannest & Hagan-Burke, 2010). High-quality instructional leaders learned to protect
instructional minutes by seeking ways to reduce non-instructional responsibilities in order
to improve student success (Berliner, 1990; Carroll, 1963). Lynch (2012) noted that
principal preparation programs had a direct influence on how well building leaders
addressed unique needs of exceptional education students, including instructional time.
Concerns were also raised about how high-stakes testing had affected developmentally
appropriate instruction. Musalino and White, in a 2010 study of middle-school instruction
noted that prior to NCLB and high-stakes testing, 76-100% of the time was spent on
developmentally appropriate instruction. Since then, a 7% drop was seen in utilizing
developmentally appropriate classroom practices (Musalino & White, 2010). Scheduling
(Bair, M. A. & Bair, 2010) and tardiness (Tyre, Feuerborn & Pierce, 2011) were
additional issues that decreased teaching time, resulting in reduced academic
performance for middle- and high- school students. School leader awareness of these
issues was essential to addressing and preventing them from occurring.
The management and administration aspects of school leadership were
communicated in Leader Standard 3. Effective leaders sought to acquire, to align, and to
allocate all of a school’s resources, whether tangible or intangible. They also intentionally
invested in leadership development of promising faculty as they worked toward sharing
leadership tasks among school personnel. As a critical part of school management,
efficient leaders orchestrated resources to safely enhance the educational process and
ensure protection of quality instruction.
33

Leader Standard 4
“An education leader promotes the success of every student by collaborating with
families and community members, responding to diverse community interests and needs,
and mobilizing community resources” (CCSSO, 2008, p. 15). School leaders had the
challenge of understanding the academic and social needs of students and then
collaborating with stakeholders to ensure those needs were met. They did this by
accumulating and assimilating information about the community so that they really began
to understand various stakeholders in the community. By attempting to build, nurture,
and sustain relationships with students, parents, extended families, businesses, churches,
and others with an interest in the education of children in a particular community,
resources were mobilized to deepen and widen the impact of schools.
Building and sustaining positive and productive relationships
with stakeholders.
A school’s vision was not limited to its walls and doors. Educational leaders
reached across boundaries to involve community stakeholders in coalitions with the goal
of helping students achieve not only academically but also socially. One of the chief
relationships which was nurtured was the one between the school and family. This
relationship played a primary role in the success of students. Boske and Benavente-
McEnery (2010) tracked student achievement when school leaders and teachers began
making regular home visits. They found that as school personnel assumptions about the
social and intellectual backgrounds of household members were altered, their
relationships with students changed, and student achievement improved. One troubling
34

aspect was parents’ refusing to engage in conversations that included negative feedback
about their children. Cooperation between teachers and parents was one key to the
success of students (Strom, P. S. & Strom, 2003). They indicated that teachers and
parents had equally necessary functions. Instructors taught students what they must know
and do to be successful academically, and parents ensured that children come to school
ready to be educated and treat other people in the school civilly (Strom, P. S. & Strom,
2003). It was a school leader’s responsibility to ensure those roles were understood.
School leaders involved individuals from businesses, faith-based organizations,
social agencies, and others to dialogue and to determine what was best for students and
families without dictating what those needs were (Jean-Marie, Ruffin, & Burr, 2010).
Especially in turnaround schools, community partnerships were a critical component for
school success (Duke, 2010). Joyce Epstein, director of National Network of Partnership
Schools, asserted that it was the educational leader’s responsibility to engage community
members, not to leave it for them to “figure it out on their own” (Epstein, 2010, p. 29).
Sheldon and Epstein (2005), in a longitudinal study, showed a small but positive
association between student math achievement and math-focused family and community
involvement. Partnerships between churches and low-performing schools were positive
(Green-Powell, Hilton, & Joseph (2011). Building confidence in school-community
relationships was positively related to input on school improvement planning, as revealed
in a Utah strength-based study. If community members believed they had a direct impact
on student achievement and believed they made a difference, they perceived a strong
relationship with school leaders. In contrast, those involved in a pseudo-council (in name
only) were demoralized and disappointed (Nygaard, 2010). Parents concurred as well. In
35

a study of 150 respondents, 73.2% agreed that partnerships between families, the school,
and community were “useful” (Griffin & Steen, 2010, p. 221).
Building relationships with media outlets.
Media relationships were also a part of this collaboration standard. School leaders
were concerned not only with radio, television and newspapers as in earlier years, but
they also were barraged with the complexities of internet, e-mail, cellular phones,
Facebook, MySpace, and other social media. “It’s up to the school administrator to
accommodate the media and make a special effort to work with them” (Hoyle et al.,
1985, p. 52). School leaders were challenged to create and preserve effective media
relationships because the media often shaped public perception about schools. A good
relationship with the media was indispensable in order for good rapport between the
school and community to be present.
Effective leaders determined what student needs were by collecting and analyzing
data and then by rallying community stakeholders in order to meet the educational needs
of their students. These stakeholders included school personnel, students, their families,
and friends as well as community members such as business leaders, faith-based partners,
and social agencies. Through nurturing relationships with these stakeholders, effective
school leaders mobilized community resources to meet the needs of diverse populations
in schools. Additionally, researchers suggested that cultivating a positive relationship
with media outlets provided a powerful opportunity to shape constructive rapport with all
stakeholders. Collaboration not only with students and their families, but also with
businesses, faith-based groups, media, and other neighborhood resources brought a sense
of community for schools and their stakeholders. Collecting and analyzing community 36
data and then bringing educational processes that met community educational needs
through the collective efforts of stakeholders was a necessary characteristic for school
leaders.
Leader Standard 5
“An education leader promotes the success of every student by acting with
integrity, fairness, and in an ethical manner” (CCSSO, 2008, p. 15). One researcher
identified “five domains of an educational leader’s ethical responsibility: as a human
being, as a citizen and public servant, as an educator, as an educational administrator, and
as an educational leader” (Starratt, 2005, p. 124). Starratt described a principal’s
influence as creating an environment in which the authentic learning took place or
allowing an environment in which teaching and learning was curtailed (2005). He also
remarked that no actions or decisions were neutral: Either they promoted teaching and
learning, or they curtailed the education process (Starrat, 2005). Principals had the
enormous challenge of managing the learning environment.
Setting a tone of democracy, equity, and diversity.
Because schools were made up of students from a variety of cultural, social,
economic, and ethnic backgrounds, the principal had to set the tone of the school to value
the diversity represented by the learning community. Model educational leaders not only
embraced democratic ideals within schools but also propagated and modeled the ideals of
social justice and equality to help students become better global citizens.
“Schools are thrust into a position in which they must prepare children and communities for participation in a multicultural, multiethnic, multireligious, global society – where dramatically different world-views, values, and belief
37

systems characterize our geographic and electronically accessible neighbors” (Hoff, D. L., Yoder, & Hoff, 2006, p. 240).
38

Raising awareness of cultural, linguistic, and economic diversity within the staff of a
school was one way leaders helped teachers improve their interactions with students and
families of different backgrounds (Guerra & Nelson, 2009). With the idea of the common
good at the forefront, those in school leadership verbalized and modeled inclusiveness
(Hoff, D. L. et al., 2006). Inclusiveness and unity did not eradicate diversity; in fact,
diversity was reverently celebrated in a learning community in which differences were
understood and truly embraced (Rud & Garrison, 2010). School leaders were challenged
with the task of including students and families from diverse backgrounds and cultures
and of creating a unified learning environment.
Considering moral and legal consequences of decisions.
In its leader standards and functions, members of ISLLC pointed out that moral
and legal consequences were to be considered (CCSSO, 2008). Split-second decisions
had to be made regarding students, teachers, and community interaction so individuals
who had been given the responsibility of making judgments had to have a deep sense of
the impact of their choices (Patton, 2008). Codes of ethics for educators and
administrators existed to guide those in schools regarding some decisions, but personal
virtues such as “honesty, courage, compassion, generosity, fidelity, integrity, fairness,
self-control, and prudence” (Patton, 2008, p. 3) were woven into the personal character
traits of effective educational leaders When a questionable decision was made by a
teacher, often the school leader was the mediator between teacher and student or parent
(Johnson, Green, Kim, & Pope, 2008). Principals set the ethical tone for a school
(Johnson et al., 2008; Patton, 2008) and led for students’ best interest (Frick, 2011). As a
role model for students, teachers, parents, and other stakeholders, a leader’s ability to 39

treat others with respect was fundamental in setting a tone for those values to be
expanded to all members of the educational community. An example of fairness in action
occurred when the leader made choices which considered the diversity of those with
whom the leader was in contact.
Modeling and promoting self-awareness, reflection, ethical
behavior, and transparency.
Self-awareness, reflection, ethical behaviors, and transparency were traits of an
effective school leader which were also considered in Leader Standard 5. Those
behaviors were important for the development of a powerful educational organization,
and they were also instrumental in renewing and sustaining a school leader’s practice
(Drago-Severson, Asghar, Blum-DeStefano, & Welch, 2012). Principals preparing for
change found introspection and transparency an asset when preparing and leading schools
through change (Zimmerman, 2011). These reflective practices helped school leaders
identify personal beliefs, strengths, and weaknesses, and even helped leaders refrain from
counterproductive behavior when under stress (Senge, 1999; Zimmerman, 2011).
The challenge of safeguarding the values of democracy, equity, and diversity was
included in Leader Standard 5. All students had the right to an education, and it was
incumbent upon the educational leader to instill that value as a non-negotiable guiding
principle in the school. In a tri-national study, principals addressed the issues of “varied
forms of diversity, from ethnic, cultural, religious and socio-economic background, to
diversity of learning needs and abilities” (Billot, Goddard, & Cranston, 2007, p. 15). In
fact, when diversity issues arose, excellent school leaders negotiated and taught students
40

how to democratically express their concerns and how to articulate their grievances
(Kezar, 2008). Additionally, Kezar (2008) noted that school leaders anticipated political
environments in order to prepare for any issues that arose and captured those times of
controversy as teachable moments. Some of the strategies which were used in strong
ethno-culturally diverse schools were as follows:
• a strong commitment to social justice principles, with these embedded in school practices and culture;
• an acceptance of difference and the capacity to work across various cultures, accommodating differences and using these as strengths;
• the setting of high learning expectations for all students and avoiding an “excuse culture”;
• the celebration of the diverse ethnocultural nature of schools, with cultural and sporting activities that respect and highlight individual and group differences. (Billot et al., 2007, pp. 16-17)
Researchers expressed concern that those in training to become building leaders
did not have enough exposure to issues regarding diversity, especially when it came to
exceptional education (Hoppey & McLeskey, 2010). In fact, Hoppey and McLeskey cited
instances of some being in principal leadership without having had a single course in
undergraduate or graduate school that addressed special-needs students. Effective school
leaders understood the needs of exceptional students as individuals and advocated for
their inclusive education (Andrews & Covell, 2007; Hoppey & McLeskey, 2010).
In managing diversity, inclusion, and democratic issues in schools as well as
safety, health, and content, a firm understanding of school law was necessary. From
specific statues to case law, familiarity with legal concepts was necessary in order to
ascertain the legal consequences of decisions made within school confines. No longer
was it sufficient to have an understanding of legal theory (Stewart, 2005); model school
leaders were familiar with legal changes which occurred frequently. For school leaders,
41

the maxim ignorantia legis non excusat which literally means “ignorance of the law does
not excuse” (Davies, 1998, p. 342) applied. Effective educational leaders considered the
moral and legal ramifications of decisions they made.
Ethical school leadership was the focus of Leader Standard 5. From accountability
in assessment and finances to evaluation of moral and legal consequences of the many
daily decisions a school leader made, it was imperative that school leaders had a highly
developed moral compass which guided them. Successful school leaders served as
examples of ethical behavior and were prepared to fervently protect the values of
democracy, equity, and diversity.
Leader Standard 6
“An education leader promotes the success of every student by understanding,
responding to and influencing the political, social, economic, legal, and cultural context”
(CCSSO, 2008, p. 15). The education leader’s obligation to advocate for students and
their families and caregivers as a part of the larger cultural picture was the focus of
Leader Standard 6 (Anderson, 2009). This obligation included staying abreast of
impending changes in policies, from local to national, which might affect student learning
(Winton & Pollock, 2013). Effective school leaders were aware of emerging trends and
adjusted leadership strategies accordingly.
Advocating for children, families, and caregivers.
Being an advocate for children ranked at the high end of importance of a
principal’s functions, according to a study of school district superintendents (Babo &
Ramaswami, 2011). Effective school leaders were involved in political agendas and were
42

stalwart advocates for students who were most at-risk (Anderson, 2009). Whether it was
wellness (Belansky, Cutforth, Delong, Ross, Scarbro, Gilbert, Beatty, and Marshall,
2009) or safety (Cotton, 2003), effective school leaders championed causes to protect
children in our schools. The leaders who daily oversaw student education were better at
influencing lawmakers regarding class size, promotion and retention policies, charter
schools, school finance, curriculum, and the myriad of other politicizing issues which
affected children.
School leaders bore the burden of modeling compassion and understanding of the
issues children faced to the faculty they led. As caring principals and assistant principals
monitored the daily activities of the school, they encouraged teachers to be vigilant in
looking for signs of child abuse and neglect (Lovitt, 2010). For students in difficult
circumstances, Lovitt suggested watching for health issues, especially mental health, and
being careful about assigning homework, because many of the children in abusive or
neglectful situations did not have adults who had the ability to help them at home. On the
other hand, Lovitt (2010) reminded educators that these students were often street-smart
and manipulative. Savvy educational leaders discerned where these students really were
and how to assist them.
Assessing, analyzing, and anticipating emerging trends.
From the issues facing gifted students (Duquette, Orders, Fullarton, & Robertson-
Grewal, 2011) to the problems facing students with racial and ethnic diversity (Park &
Denson, 2009), principals and local school leaders set the tone for conversation with
parents and the community. They were aware of new legislation which affected the
management and education in their schools. For example, in a 2011 case, Snyder v. Blue 43

Mountain School District, judges found that a student’s internet posting in MySpace was
protected under the First Amendment and that Tinker v. Des Moines did not apply to the
ruling, although the posting created substantial disruption in the school setting (Harvard
Law Review, 2012). Many principals have had to deal with disruption that technology
has created (Cassidy, Brown, & Jackson, 2012).
School leaders were challenged with advocating for children and their families in
Leader Standard 6. Educational leaders guarded them against decisions being made on a
local, district, state, and national level which might not have been in their best interest.
Commendable school leaders stayed abreast of, if not ahead of, emerging trends in order
to minimize negative effects on their schools by adapting leadership practices
appropriately.
Summary of Leader Standards
Effective educational leaders possessed a highly developed skill set related to
ISLLC tasks and functions in order to encourage the achievement of every student.
Facilitation of a vision of learning shared and supported by all stakeholders was
addressed in Leader Standard 1. The development of a school culture centered on student
learning and staff development was emphasized in Leader Standard 2. Management of
organization, operations, and resources were incorporated in Leader Standard 3 in order
to ensure a safe, effective school learning environment. Collaboration between faculty
and community members and mobilization of community resources to ensure student
success was the focus of Leader Standard 4. The school leader’s responsibility to act with
integrity and ethics was emphasized in Leader Standard 5. Finally, school leaders were
charged with the task of advocating for children and their families in the larger political, 44

social, economic, legal, and cultural context in Leader Standard 6. Effective school
leaders demonstrated mastery of ISLLC standards and functions.
Leadership Preparation Programs
Introduction
Preparation for being an educational leader had taken many forms in recent years,
but the goal remained to train potential leaders for the pressures and demands of leading
teachers to educate students. Researchers asserted that “preparation programs should do
their best to deliver the content current and future school leaders need to carry out the
demands of accountability and to fulfill their professional mission of leading a
community of teachers to advance student learning” (Militello et al., 2009, p. 46).
Because schools were ever-changing, leaders in effective university programs responded
by offering courses that were relevant and were delivered in a germane approach
(Weidmer, 2007). Faculty in these programs trained educational leaders through
providing opportunities to experience skill-building through practice (Cunningham &
Sherman, 2008; Leech & Fulton, 2008). By learning through experience, higher-order
capacities such as “reading the situation, balanced judgement, intuition (not just hunch
but tested against stored memory and ordered experience) and political acumen” (Cave &
Wilkinson, 1992, pp. 34-35) were developed. Glatter also remarked that much of the
useful information that leadership required was learned from personal interactions and
was often much more difficult to acquire than formal knowledge (2009). University
professors and in-service school leaders offered more authentic learning opportunities for
pre-service educational leaders by entwining field-based experience with lecture (Mohn
45

& Machell, 2005). Cambridge (2010) suggested that deeper learning took place through
performance-based, hands-on training. By pairing in-service and pre-service school
leaders, administrative practitioners as well as university faculty members saw an
improvement in the skills and competencies developed by the pre-service leaders when
compared with new administrators who had not experienced field-based learning (Mohn
& Machell, 2005).
Leadership Training Programs
Cibulka (2009) claimed that too little research was available that defined effective school
leaders’ knowledge and experience base. Cibulka also suggested that the lack of
consensus among those deciding what constituted an effective program yielded programs
that were developed on a weak research base. Others described leadership training
programs as insufficient, decrying that “the majority of programs range from inadequate
to appalling, even at some of the country’s leading universities” (Levine, 2005, p. 23).
Georgia’s educational leadership training programs were criticized in one particular
study. Breault (2010) stated that although 60% of the work for certification was
conducted through the internship, there was no real theoretical or empirical evidence that
the performance-based assessments that educational leader candidates experienced in the
state of Georgia were better at preparing educational leaders than programs that were not
performance based.
Performance-based programs.
In spite of the lack of agreement on what were components of effective leadership
preparation programs, hands-on opportunities and internships were touted as valued
46
elements of leadership development. In fact, Cibulka (2009) suggested that training
agencies for school leaders consider focusing on creating practice opportunities by
generating situations which could actually occur in an educational setting. Practicing
these scenarios was similar to utilizing teaching hospitals for preparing future principals
and other school leaders. Numerous educational leadership program developers have
instituted hands-on components in an effort to develop aspiring leaders’ practical skills.
Weidmer stated that “the challenge educational administration and supervision
postsecondary professors face is to make their graduate courses meaningful, personalized,
substantive and authentic” (2007, p. 17). For many programs, an internship was the
model of practical skill development (Hines, 2007). Training leaders with knowledge
acquisition alone, then providing them with a multiple-choice test with which to evaluate
their competencies was inadequate. Prospective leaders had to be able to apply learned
information to daily situations. “Students need to develop competencies because real life
demands the ability to integrate and coordinate knowledge, skills, and attitudes, and the
capacity to apply them in new situations” (Gulikers, Bastiaens, & Kirschner, 2004, p. 69).
Aspiring leaders were connected with mentors who were currently in leadership positions
and took on leadership roles alongside the mentors (Hines, 2008; Reames, 2010).
Performance-based assessments.
A wide range of mentorships existed. Some mentorships were haphazard, barely
meeting the requirements of university programs, while others were intentional, powerful
opportunities to groom aspiring leaders by challenging them with authentic opportunities
to function as leaders while under the watchful eye of a more experienced principal or
role model (Blumburg & Greenfield, 1986; Fry, Bottoms, & O’Neill, 2005). Often no real 47

connection was made between formal coursework and internship situations, so
opportunities to ground leadership foundational principals in real-life school situations
were left untapped (Blumburg & Greenfield, 1986; Gulikers et al., 2004).
Gulikers et al. completed a study on authentic assessments. Their findings
included five dimensions of authentic assessment: “the assessment task, the physical
context, the social context, the assessment result or form, and the assessment criteria”
(2004, p. 70). They defined authentic assessment as “an assessment requiring students to
use the same competencies or combinations of knowledge, skills and attitudes that they
need to apply in the criterion situation in professional life” (2004, p. 69). In order for an
assessment to be authentic, it required similar cognitive processes, skills, and attitudes as
a comparable real-life situation (Gulikers et al., 2004; Savery & Duffy, 1995). Student
ownership in the assignment was comparable to that of adult professionals doing similar
real-world tasks (Gulikers et al., 2004). In order for the performance-based assessment to
evaluate the skill one had in a particular competency, the tasks included in those
competencies were executed in a real-life situation. Wiggins (1989) simply stated that the
authentic assessment was a similar product or performance that was presented in a real-
life situation.
Another consideration regarding performance-based assessment and performance
tasks was the physical context. Because the literal as well as the figurative environments
were less controlled and less clean than the sterile, safe learning environments of colleges
and universities, it was important to assess one’s ability to perform a task in a natural
setting. Well-designed performance-based assessments mirrored the real-world
application as nearly as possible and exhibited the understanding and competencies of a
48
student, as well as the mind-set with which the task was executed (Brown, Collins &
Duguid, 1989; Gulikers et al., 2004; Herrington & Oliver, 2000).
Although the setting of the real-life situation on which competencies were
demonstrated was important, Gulikers et al. (2004) argued that perhaps the most
important factor was the social processes component. These researchers suggested that, if
the real life task was usually completed within a team or network of individuals, a team
or network should be consulted when performing the performance-based assessment. Not
all would agree. J. Herrington and Herrington (1998) suggested that all tasks required
collaboration, and that collaboration was a defining point of authenticity. Conversely,
Gulikers et al. (2004) proposed that the necessity to collaborate or not was determined by
whether or not the tasks were performed by individuals or groups (2004). Internships
were often imbedded within coursework and normally had some sort of assessment
related to the task. Because the practicum was a performance-based activity, utilizing
skills to work in real situations to benefit schools, school districts, and students was
frequently a component of the internship. Internships helped students develop skills in a
real-world environment (Hines, 2007). Militello et al. challenged institutes of higher
learning to prepare school leaders to “carry out the demands of accountability and to
fulfill their professional mission of leading a community of teachers to advance student
learning” (2009, p. 46). Militello et al. revealed that most of the respondents in their
survey of participants in the Massachusetts Department of Elementary and Secondary
Education educational leadership licensure programs cited internships as “very helpful
for their practice” (2009, p. 39), although the remaining 12 of their 13 preparation
courses were not. In contrast, most respondents rated alternative preparation programs a
49

bit higher than traditional public or private university leadership preparation programs.
Survey participants scored non-traditional programs such as online training courses and
district-university partnerships as more adequately preparing them for challenges facing
educational leaders (Militello et al., 2009).
Valid inferences about the ability of the candidate to carry out required tasks were
made by watching the candidate complete product or performance tasks (Darling-
Hammond & Snyder, 2000). Candidates demonstrated their ability to discern when and
how to apply skills to multiple situations with the necessary range of depth (Darling-
Hammond & Snyder, 2000). Candidates defended their ability to demonstrate mastery of
standards by presenting a collection of written or oral work samples (Gulikers et al.,
2004; Wiggins, 1989).
Reflective portfolios.
How to assess such mentorships was another issue raised. Performance-based
learning tasks were not graded according to “right” and “wrong” but were evaluated for
many other elements. Higher order thinking processes were evaluated, and more than one
right answer existed. The means by which many universities have chosen to have
students demonstrate their performance in their internships was through a reflective
portfolio (Meadows & Dyal, 2000; Meadows, Dyal, & Wright, 1998). More than 90% of
university administration programs used portfolios in some capacity (Norton, 2004). In
some of the portfolios, leadership candidates logged activities and numbers of hours
spent performing them and submitted a reflective piece relating that activity to classroom
tasks or to connect theory and practice (Moerkerke, Doorton, & deRoode, 1999; Norton,
2004). Moerkerke, Doorton, and deRoode called this an assessment result (1999), which 50

was then evaluated by comparing it to some sort of assessment criteria. Portfolios were
used in other programs to document professional growth or to promote reflection
(Norton, 2004). Professors of many educational leadership departments required
reflective portfolios to be kept as record of the internship activities. These portfolios were
reviewed and graded as documentation of the participants’ real-life practice of skills and
competencies necessary for school leaders, thus meeting the requirements of being a
performance-based assessment (Meadows & Dyal, 2000). Weidmer (2007) reported that
one university required students to choose mentors through an interview process,
selecting people with whom they would like to establish a significant working
relationship. The students sought guidance, reviews, and feedback from their mentors
regarding the artifacts in the portfolios.
Portfolios were described as “a focused purposeful collection of student work that
documents evidence of traditional and nontraditional sources of student learning,
progress, and achievement over time” (Gadbury-Amyot, Kim, Palm, Mills, Noble, &
Overman , 2003, p. 991). Brown and Irby portrayed administrative portfolios as “a
collection of thoughtfully selected exhibits or artifacts and reflections indicative of an
individual’s experiences and ability to lead and of the individual’s progress toward and/or
attainment of established goals or criteria” (2001, p. 2). Components of the portfolio
included a variety of artifacts, attestations, reflections, revisions, feedback, and reviews
(Hackman & Alsbury, 2005; Wildy & Wallace, 1998). Artifacts, evidence of learning
about educational leadership, consisted of school schedules, budgets, school
improvement plans, emergency plans, student and teacher handbooks, and reflective
journals (Hackman & Alsbury, 2005, p. 37). Portfolios contained
51

course assignments as research papers, an educational philosophy statement, a leadership platform, the student’s resume, and a variety of performance-based assessments, such as student’s materials from a clinical supervision activity conducted with a teacher, action research project; case study analysis, data disaggregation and analysis of a school’s achievement test scores, creation of a three-year parent involvement plan for a school; or a school cultural analysis. (Hackman & Alsbury, 2005, p. 37)
Attestations, written by someone other than the student, authenticated skills and
competencies the mentee had attained. For example, “college transcripts, letters of
recommendation, professional licenses, personal notes from parents and students and
honors and awards” (Hackman & Alsbury, 2005, p. 37) could be added to a portfolio’s
documents to verify a pre-service educational leader’s accomplishments.
Reflections were a powerful tool for developing thoughtful insights into learning.
One professor trained university IT students how to write reflections for their electronic
portfolios by utilizing up to one-third of alloted teaching time during a semester on the
reflective process. Students practiced the reflective process by interacting in a forum,
commenting on reflections of classmates, and interacting until all were satisfied with
each student’s reflections. They encouraged each other to dig deeper into their
understanding, an act which inspired better reflections and, consequently, better
portfolios (Hadley, 2007). The instructor of the educational leadership course taught
students reflective processing by imbedding reflection within several assignments
(Castelli, 2011). All assignments had reflective questions associated with them, and then
upon return to class, students and instructors evaluated the evidence and thoughts
collectively. For example, the instructor challenged students to interview educational
leaders about how they developed leadership skills then to reflect on similarities and
differences between them and the interviewee. Additionally, the final exam was
52

purposefully reflective, asking students to reflect on powerful assignments in which their
paradigms were challenged. As a part of the exam, a Reflective Consolidation Paper,
students were asked to comment on the reflective learning process and how reflection
influenced their thinking about leadership development. Students confirmed prior studies
which suggested that the reflective learning process required them to evaluate their
personal “values, beliefs and assumptions” (Castelli, 2011, p. 27). Subsequently, when
the instructor created a safe discussion place for these thoughts, students evaluated
alternative ideas and even incorporated them into personal belief systems, therefore
transforming their paradigm (Castelli, 2011). Reflection was essential to practicing
transformational leadership.
Researchers in another university study sought to understand how students
experienced project-based learning assignments (performance-based) by reflecting on the
processes of how and what they learned while they created the artifacts for their
engineering portfolios. Thirteen junior and senior engineering students were interviewed
about their epistemological and reflective experiences. They reported that they
remembered what they learned for a longer period of time, they saw how theories from
class and practical experience were related, and they acquired improved motivation and
attitude toward particular classes because they could see the relevance of course material
when they reflected on what they learned. Additionally, they differentiated between
going through the motions of learning theoretical concepts and integrating the theories
into real-life practice (Turns, Cuddihy, & Guan, 2010). Reflective practices enhanced the
learning process for these engineering students.
53

In a survey about the use of portfolios, Wildy and Wallace revealed that these
portfolios were being used in four distinct ways: “as evidence of improvement, as
organizer, as record of achievement, and as collection of work samples” (1998, p. 126).
The model portfolio was a working document with commentary and feedback from
professors and mentors (Weidmer, 2007; Wildy & Wallace, 1998). Assignments were
supervised, personalized, and standards-based (Weidmer, 2007). The portfolios were seen
not only as teaching tools for the development of a pre-service leader’s knowledge
(Drago-Sverson, 2011; Wildy & Wallace, 1998) but also as a way to document student
learning, development, professional accountability, and improvement, especially when
coupled with guided reflection (Brody, Vissa, & Weathers, 2010; Hackman & Alsbury,
2005; Lazaridou, 2009; Wildy & Wallace, 1998). Freed and Huba (2000) suggested that
portfolios were not assessments if someone did not assess its contents. In fact, without
feedback, the portfolio simply became a collection of work samples (Wildy & Wallace,
1998). Critics of incorrectly used portfolios described them as “resumes on steroids” and
a “blown up daily diary” (Wildy & Wallace, 1998, pp. 133-135). Without some sort of
assessment, validation of competencies did not occur; rather, the process of building a
portfolio just proved a book could be filled (Tochel et al., 2013). Portfolios were versatile
tools if their purpose was clearly stated and if they were assessed interactive documents
which were utilized for student learning, reflection, and growth.
Electronic portfolios.
With the rise in electronic accessibility, many schools moved toward the
electronic portfolio as the culminating work of an educational leadership graduate
student. Through web-based portfolios and e-portfolios, activities were readily linked to 54
competencies or standards (Redish, Webb, & Jiang, 2005-2006; Tochel et al., 2013).
Scholars were able to capture evidence from diverse formats (video, print, and
presentation) to support their learning (Cambridge, 2010). For instance, with the use of e-
portfolios, in addition to paper documents, video and pictorial evidences could be
provided to validate one’s experiences. Cambridge advocated the e-portfolio platform
because it provided a means through which students could have “a stronger sense of
ownership, self-efficacy and self-authorship” (2010, p. 25). An additional bonus was the
flexibility for users to access virtually unlimited information (Tochel et al., 2013).
Another researcher cited reduction of paper use and storage space as added benefits of an
electronic portfolio format (Wiedmer, 1998).
Regardless of the platform, a portfolio’s value was relevant to the requirements
and reflections collected. Reflections allowed students to integrate theory and practice at
a deeper level, as well as to showcase intellectual and professional growth (Brody et al.,
2010; Drago-Sverson et al., 2012; Gadbury-Amyot et al., 2003). Students also took more
responsibility for their performance because they were taking more ownership in their
experiences (Gadbury-Amyot et al., 2003; Wildy & Wallace, 1998). In a survey study
regarding their capstone projects, university seniors indicated that they were able to
evaluate their own growth, they could see how coursework related to actual practice, and
they could integrate skills and knowledge from a variety of courses (Buzzetto-More,
2010). These portfolios were more student-centered (Buzzetto-More, 2010). Reflections
were designed to help students dig deeper into their own paradigms, and discussions
about those reflections challenged their assumptions, assisting pre-service leaders to
devise new ideas about handling multifaceted situations (Drago-Sverson, 2011).
55
Although speaking of e-portfolios specifically, Cambridge’s observation worked for
either electronic or paper portfolios:
At the heart of the process of composing an e-portfolio is reflection on evidence. E-portfolio authors need to move beyond simply aggregating and sorting evidence to reflect on what each piece means and how it relates to other items, the e-portfolio as a whole, and the author’s identity and the institutional context in which he or she lives, works, and learns. (2010, p. 199)
In fact, E-portfolios were slightly more effective in two areas: feedback and reflection
according to a study by Tochel et al (2013). They reported that one drawback in the use
of the electronic format was technophobia: A user’s ability to interface with computers
could still present a barrier if their technical ability was limited (2013).
One question raised in the use of portfolios was whether they were personalized,
offering more room for personal exploration and reflection, or whether they were
standardized, with strict limitations of what must be found in the portfolios. Cambridge
(2010) noted that the two were not exclusive: The use of personalized portfolios provided
and supported direct authenticity, while the use of standardized portfolios indirectly
created an outlet for performance-based assessment. In order to streamline evaluation of
portfolios, Strudler and Wetzel (2011-2012) suggested that a blend of standard artifacts
relating to state and national standards which all students included and a few
individualized artifacts which were unique to a particular student’s showcase of work
offered benefits to both professors and students. Program-selected, standardized artifacts
were evaluated with common rubrics relating to state and national standards, while
student-selected artifacts assisted students in identifying areas of learning and progress.
One of the attractive aspects of portfolio use was the opportunity for individuals
to construct their own learning, which is a higher-order thinking skill. However, Wildy
56

and Wallace (1998) noted that out of necessity some sort of proof of validity of the
achieved functions or standards must be obtained. In one example, the students and
professors created a scale for measurement of the portfolio entries compared with the
standards. The students measured themselves against the standards, and then a faculty
reviewer evaluated the entries. Opportunity for conversation about the attainment of
standards was created by any discrepancies. This dialogue was a teaching tool as well
(Weidmer, 2007).
Student reflection.
Student reflection was an essential piece of the portfolio documentation. Model
portfolios contained detailed student explanation of each artifact. Students situated the
artifact in its context in order to defend its placement with a particular standard in the
portfolio. Through this practice, students demonstrated skills mastery and understanding
of the standard and acquired a platform from which to explain any knowledge gained
(Borko, Michalec, Timmons, & Siddle, 1997; Hackman & Alsbury, 2005). Yancey
(2009) declared that a student’s ability to select artifacts, reflect on their meaning, and
connect them to standards was also an instructional opportunity as well as a way to
measure what a student had learned. Quality reflection took time, but it was central to the
learning progression (Strudler & Wetzel, 2011-2012)
Concerns regarding portfolio use.
A researcher who performed a national study of portfolios utilized in education
administration graduate schools revealed several issues related to portfolio use. Although
96 % of the professors in these graduate schools of education administration saw the
57

portfolios as highly or considerably beneficial in developing transformational leadership
traits and reflection, these same respondents complained that they were time-consuming
to evaluate. In fact, one respondent even suggested that the time investment did not result
in adequate return. Approximately 63% of the respondents indicated that finding time to
assess student portfolio quality was problematic (Norton, 2004). Although they could see
benefits, some university professors were skeptical about the power of portfolios in
educational administration programs.
Other time constraints related to the use of portfolios were related to creation,
artifact selection, and instruction on how to assimilate the portfolio. A common concern
was the student time taken to create and organize the artifacts and reflections (Shepherd
& Hannafin, 2013). Strudler and Wetzel (2005) concluded that much training and
coaching was needed for quality portfolios to be created. This training involved
university instructional time as well as student classroom time to be invested in selection
and assimilation of portfolio entries.
Concerns regarding reliability.
Performance-based assessments, including portfolios and their electronic
counterparts, were not without criticism. Worthen, Borg, and White (1993) identified
concerns regarding the honesty of entries, technical quality, the standardization of
assessment of the work, and the appropriateness of portfolios for high-stakes assessment.
Other researchers raised concerns about reliability among those who assess the work
(Barton & Collins, 1993; Shulman, 1998). In a study of 30 preservice teacher portfolios,
Chronbach’s alpha and Pearson product-moment correlation coefficients were found to
support inter-rater reliability, but Cohen’s kappa did not (Derham & Diperna, 2007). 58

Fook and Sidhu (2010) noted that performance-based assessments lacked validity and
reliability, and they were time-consuming. If the mentorships were not providing both
training in real-life situations and the opportunity to assess leadership candidates as they
dealt with authentic situations, was there a clear opportunity for evaluation of a potential
leader’s ability to handle real-life issues which arose in schools? In a list of five questions
that researchers raised about portfolio use, one was how it ensured the validity and
reliability of the performance of the student (Evans, Daniel, Mikovch, Metze, & Norman,
2010). Clearly researchers were concerned about the reliability of portfolios as a measure
of how well students had mastered concepts.
Summary of Leadership Training Programs
Many institutions of higher learning implemented programs with components
which utilize performance-based assessment. The measurement of performance in many
cases involved students creating portfolios of artifacts which indicated participation in
and mastery of real-life educational leadership situations. More often, universities moved
toward an electronic format for these portfolios. Mastery was better demonstrated in
reflective portfolios, but students had to be taught how to reflect on artifacts contained in
the portfolios. Some researchers raised concerns about the reliability of portfolios to
measure mastery of performance standards.
Summary of the Review of Literature
Preparation to meet the ISLLC Standards for School Leaders involved experience
in each of the six standards and descriptive functions. Exemplary education leaders
developed, implemented, assessed, and evaluated progress toward a shared vision. They
59

also created a school culture of high expectation of student learning by comprehensive
curriculum taught with appropriate technology, motivation, assessment, accountability
and evaluation. Operational and managerial skills were needed to ensure a safe
environment in which to teach and learn. Relationships with and celebration of a school’s
and a community’s diverse population ensured mobilization in and sustainability with the
local neighborhood and its rich cultural, social, and intellectual resources. Ethical leaders
interacted with all stakeholders in a moral, legal, and democratic manner. Finally, ideal
education leaders relentlessly advocated for children and their families in the larger
political picture, analyzing trends and initiatives to ensure that they were in the best
interest of the stakeholders, especially the students.
With such monumental standards and functions, the preparation of educational
leaders was a critical component of their success. In response to state and national
directives, many university visionaries wove an applied, hands-on component into their
training curriculum. For numerous institutions of higher learning, this was a mentorship
in which students enrolled in education leadership programs were paired with in-service
leaders and were given practical tasks to complete under the watchful eyes of their
mentors. As evidence of their experiences in the ISLLC standards and functions, some
were required to keep portfolios as record.
Performance-based assessments of student work were often evaluated to ensure
mastery of skill. In educational leadership programs, these performance-based assessment
records were sometimes in the form of reflective portfolios or, more recently, electronic
portfolios. Students included artifacts of their experiences of each of the ISLLC leader
standards, reflecting on their practices and performances as indicators of mastery of
60

needed skills. However, very little evidence existed regarding the reliability of these
portfolios as indicators of student mastery. The educational leader portfolio was
examined through intra-class correlation to determine the reliability of its evaluation as
measurement of mastery of the ISLLC standards and functions.
61
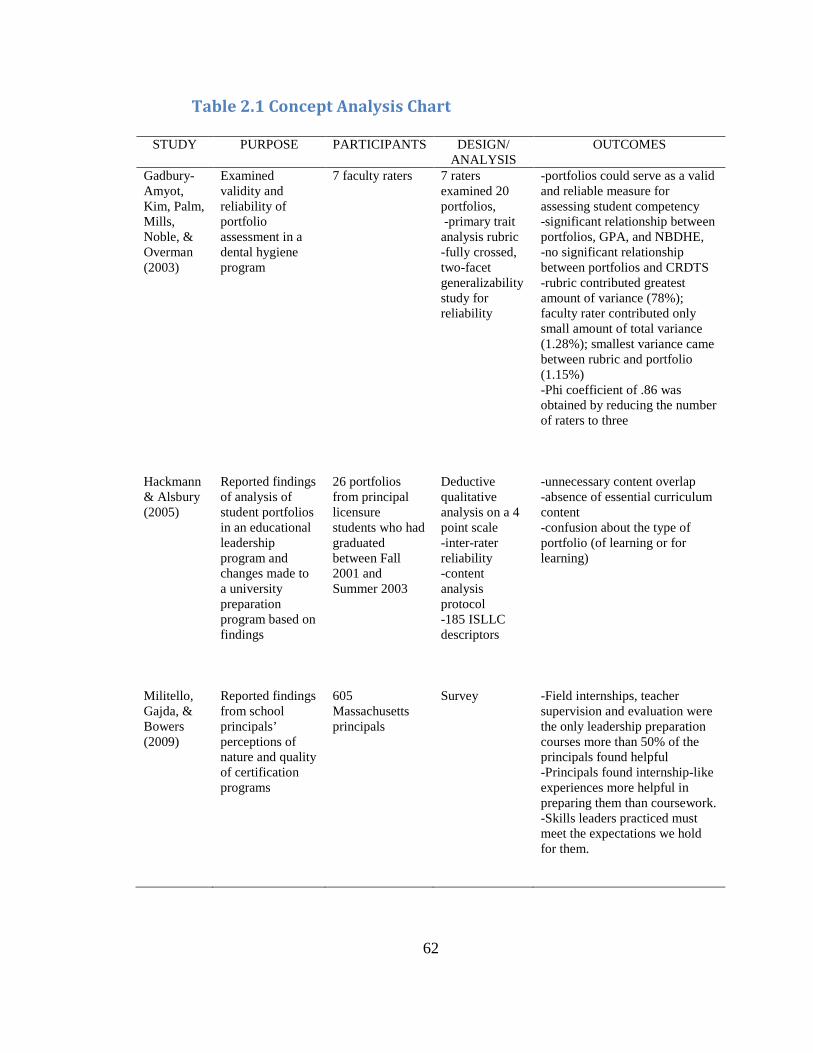
Table 2.1 Concept Analysis Chart
STUDY PURPOSE PARTICIPANTS DESIGN/ ANALYSIS
OUTCOMES
Gadbury-Amyot, Kim, Palm, Mills, Noble, & Overman (2003) Hackmann & Alsbury (2005) Militello, Gajda, & Bowers (2009)
Examined validity and reliability of portfolio assessment in a dental hygiene program Reported findings of analysis of student portfolios in an educational leadership program and changes made to a university preparation program based on findings Reported findings from school principals’ perceptions of nature and quality of certification programs
7 faculty raters 26 portfolios from principal licensure students who had graduated between Fall 2001 and Summer 2003 605 Massachusetts principals
7 raters examined 20 portfolios, -primary trait analysis rubric -fully crossed, two-facet generalizability study for reliability Deductive qualitative analysis on a 4 point scale -inter-rater reliability -content analysis protocol -185 ISLLC descriptors Survey
-portfolios could serve as a valid and reliable measure for assessing student competency -significant relationship between portfolios, GPA, and NBDHE, -no significant relationship between portfolios and CRDTS -rubric contributed greatest amount of variance (78%); faculty rater contributed only small amount of total variance (1.28%); smallest variance came between rubric and portfolio (1.15%) -Phi coefficient of .86 was obtained by reducing the number of raters to three -unnecessary content overlap -absence of essential curriculum content -confusion about the type of portfolio (of learning or for learning) -Field internships, teacher supervision and evaluation were the only leadership preparation courses more than 50% of the principals found helpful -Principals found internship-like experiences more helpful in preparing them than coursework. -Skills leaders practiced must meet the expectations we hold for them.
62
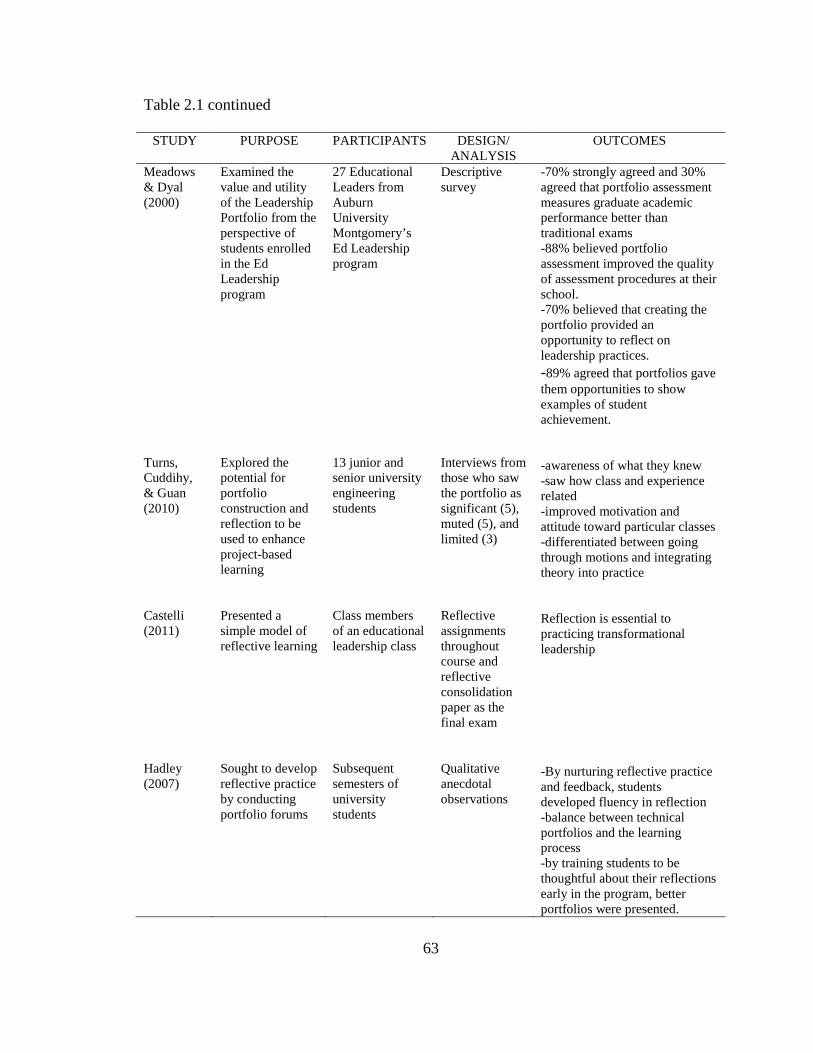
Table 2.1 continued
STUDY PURPOSE PARTICIPANTS DESIGN/ ANALYSIS
OUTCOMES
Meadows & Dyal (2000) Turns, Cuddihy, & Guan (2010) Castelli (2011) Hadley (2007)
Examined the value and utility of the Leadership Portfolio from the perspective of students enrolled in the Ed Leadership program Explored the potential for portfolio construction and reflection to be used to enhance project-based learning Presented a simple model of reflective learning Sought to develop reflective practice by conducting portfolio forums
27 Educational Leaders from Auburn University Montgomery’s Ed Leadership program 13 junior and senior university engineering students Class members of an educational leadership class Subsequent semesters of university students
Descriptive survey Interviews from those who saw the portfolio as significant (5), muted (5), and limited (3) Reflective assignments throughout course and reflective consolidation paper as the final exam Qualitative anecdotal observations
-70% strongly agreed and 30% agreed that portfolio assessment measures graduate academic performance better than traditional exams -88% believed portfolio assessment improved the quality of assessment procedures at their school. -70% believed that creating the portfolio provided an opportunity to reflect on leadership practices. -89% agreed that portfolios gave them opportunities to show examples of student achievement. -awareness of what they knew -saw how class and experience related -improved motivation and attitude toward particular classes -differentiated between going through motions and integrating theory into practice Reflection is essential to practicing transformational leadership -By nurturing reflective practice and feedback, students developed fluency in reflection -balance between technical portfolios and the learning process -by training students to be thoughtful about their reflections early in the program, better portfolios were presented.
63

CHAPTER III
METHODOLOGY
Introduction
The methods and procedures utilized to carry out this study were described in this
chapter. It included the following: 1) Introduction, 2) Research design, 3) Population and
sampling plan, 4) Instrumentation, 5) Procedures, 6) Methods of data analysis, 7)
Reporting of results, 8) Evaluation of research methods, and 9) Summary. The purpose of
this study was to determine the reliability of the portfolio as an assessment tool. The
portfolio measured the extent to which participants in Randolph State University’s1
(RSU’s) educational leadership program demonstrated proficiency in the ISLLC leader
standards.
In developing this research project Crotty’s (1998) questions were considered. He
suggested that in developing research projects, decisions about the epistemology,
theoretical practice, methodology (techniques), and methods (procedures) must be made.
Creswell (2003) suggested that this information be summarized to select an alternative
knowledge claim position from which the researcher viewed the problem. This project
had a pragmatic approach: The researcher was interested in determining “what works”
with the use of portfolio entries as evidence of mastery of the ISLLC standards (Council
of Chief State School Officers, 2008). This study was a problem-centered approach that
was focused around the real-world practice of utilization of portfolios as performance-
based measures of mastery of the ISLLC standards. The purpose of this study was to
1 RSU is a pseudonym 64

determine the reliability of the portfolio as an assessment tool. The portfolio measures the
extent to which participants in CSU’s educational leadership program demonstrated
proficiency in the ISLLC leader standards. The six Standards for School leaders were the
following:
1) Shared Vision
2) School Culture
3) School Management
4) Collaboration,
5) Educational Ethics, and
6) Influence.
The researcher utilized the intra-class correlation coefficient to determine reliability and
utilized written surveys from raters to assist in deepening the understanding of the results.
Description of Research Methodology Design
Research Questions
Answers to the following questions were sought to address the purpose of the
study. The quantitative question was, to what extent are portfolios reliable as evidence of
mastery of the ISLLC standards and functions of students enrolled in an educational
specialist leadership program when measured by intra-class correlation? The qualitative
question was why does consistency or inconsistency exist among the raters regarding
how the artifacts related to the standard?
65
Rationale for a Mixed-Methods Paradigm
The intent of this two-phase, sequential mixed-methods study (Creswell, Plano
Clark, Gutmann, & Hanson, 2003; Tashakkori & Teddie, 1998) was to determine the
reliability of portfolios as evidence of mastery of the ISLLC standards. After developing
the research question, the researcher decided that numerical data alone would not explain
the results. A mixed-methods methodology was needed. To aid in design selection, three
questions had to be answered. First, would quantitative and qualitative data be gathered at
the same time, or would one be gathered first? Second, would the quantitative and
qualitative data be equally weighted in the results, or would one be weighted more than
the other? Finally, the question of how to merge the results was asked (Creswell, Plano-
Clark et al., 2003). This researcher chose to gather data at the same time (concurrently)
for both methodologies. Both methodologies carried equal weight, and the results were
merged during interpretation. (See Table 3.1)
Although the quantitative and qualitative data were collected concurrently, they
were evaluated in phases. In the first phase, the quantitative research question addressed
the reliability of portfolios by using intra-class correlation. Information from this first
phase was investigated further in a second qualitative phase. In the second phase,
qualitative written comments from portfolio raters were used to probe noteworthy
correlations by exploring aspects of the portfolio artifacts. The rationale for following up
with qualitative research in the second phase was to gain a better understanding of
portfolio ratings and to explain the quantitative results (Creswell, 2008).
66

Table 3.1
Table of Decisions about Mixed-Methods Research
Research Item Decision
Research approach Mixed methods
Knowledge claims Pragmatic assumptions
Strategy of inquiry Mixed methods design
Methods Closed ended measures (ICC) Open ended observations (written observations from raters)
Data collection type Quantitative- Likert-type rating scale Qualitative-Document of written observations from raters
Advantages of data collection type
Utilize language of participants Accessed at researcher’s leisure Thoughtful data which raters contemplated No transcribing necessary
Disadvantages of data collection type
Incomplete (some raters provided no commentary)
Data analysis and interpretation
Quantitative- ICC Qualitative- Phenomenology
Lens Pragmatism
Coding process Read all commentary, looked for themes, wrote down themes Selected a rater’s commentary (the most comments) Wrote comments from that rater on cards Grouped them and named categories by prevalent theme Read all other rater comments, wrote them down Placed the other rater comments in appropriate group, if available Created new group if no appropriate group was available Divided groups by standard if necessary
Perspective Rater’s perspective on portfolio
Validation Triangulation with literature and examples in portfolios Member Checking (inspection, clarification, approval) Rich, thick description
67

In addition to the intra-class correlation (ICC) reliability study, each rater was
asked to provide feedback on the artifacts given. Utilizing a quantitative method (ICC)
and a qualitative method (written feedback) made this study a mixed-methods
investigation. The open-ended question was to provide feedback that would assist in
making the portfolio artifacts effective indicators of mastery of ISLLC standards. When
adding a qualitative component to a quantitative research project, additional factors had
to be considered. The researcher sought to combine quantitative data from ICC but
wanted to examine the data in a deeper way, so a pragmatic approach was selected
(Onwuegbuzie & Leech, 2005; Tashakkori & Teddie, 1998).
Three main schools of thought emerged from the quantitative-qualitative
disagreement also regarded as the “paradigm war” (Gage, 1989): purists, situationalists,
and pragmatists (Rossman & Wilson, 1985). When viewed on a continuum, purists were
situated on one end, situationalists in the center, and pragmatists on the opposite end from
purists. Purists believed that quantitative and qualitative research methods differ in their
ontology, epistemology, and axiological assumptions about the nature of research. The
purist posited that the two methods should never be mixed. Situationalists held to the idea
that the two methods should not be mixed, but they saw value in contributions that either
method offered. They held to the mono-methodology of the purist but believed certain
research questions could only be studied from a quantitative approach, while other
research questions required a qualitative approach. On the far end of the spectrum,
pragmatists posited that both methods had much to contribute, and utilizing both methods
capitalized on the strengths of each method while reducing the impact of each method’s
weaknesses (Onwuegbuzie & Leech, 2005). Pragmatism drew from both qualitative and
68

quantitative methods and techniques to collect and analyze data from various sources
(Creswell, 2003).
The pragmatist sought to “provide the best understanding of a research problem”
(Creswell, 2003, p. 12), and the researcher engaging in pragmatic studies needed to
explain the need for the mixing (Maudsley, 2011). The researcher did not believe that
simply calculating the ICC (quantitative) would provide enough information to be
especially useful to educational leadership programs; therefore, the researcher designed
the study with a written survey component (qualitative) to explain the scores and to
suggest ways to improve the portfolio. A Concurrent Nested Strategy was employed in
this study (Creswell, 2003). This strategy suggested that one of the methodologies took
precedence over the other, and as such, was nested within the other. In this case, the
quantitative results took precedence over the qualitative, and the qualitative was used to
explain the quantitative. Therefore, the qualitative is nested within the quantitative
(Creswell, 2003). The researcher wanted to gain more insight into the rationale behind
the ratings, specifically, why scores were given as they were, and how could higher
scores have been earned?
Selection of Design
A major challenge of mixed-methods research was the decision regarding
prioritizing the methods. Three possibilities for this study emerged.
• The quantitative (reliability of portfolios as determined by ICC) would take precedent, making the qualitative (explanations offered by the raters) secondary
• The qualitative would be primary, thus prioritizing the narrative provided by raters, then using the quantitative data to support the emerging themes
69

• The two would be equal in priority and blended together.
The researcher decided that utilizing the narrative to understand and explain the
results of intra-class correlation would provide a more thorough answer to the research
question. As such, the researcher used the first possibility previously listed (Figure 2.1).
Tashakkori and Teddle (1998) suggested that a pragmatist considered the research
question to drive the decision regarding importance of quantitative/qualitative in a mixed-
methods study, while others tended to allow the research method to drive the priority.
Oppenheim suggests the following:
It would be more helpful to suggest that choosing the best design or the best method is a matter of appropriateness. No single approach is always or necessarily superior, it all depends on what we need to find out and on the type of question to which we seek an answer. (1992, p. 12)
Analysis of Findings
Concurrent Nested Strategy showing primary quantitative research with qualitative research explaining it, on the basis of Creswell (2003). Adapted from “Research Design: Qualitative, Quantitative, and Mixed Methods Approaches, 2nd Ed.” p. 214. Copyright 2003 by SAGE Publications. Figure 2.1 Concurrent Nested Strategy
QUAN
Qual
70

Onwuegbuzie and Leech (2005) identified several advantages of pragmatic
research. They proposed that qualitative research might be used to “inform the
quantitative portion of research studies, and vice versa” (2005, p. 383). They also
approached research data from a macro or micro lens, thus seeing both the big picture and
the detail (Onwuegbuzie & Leech, 2005). Perhaps most relevant to this study was the
following observation, “Because the pragmatic researchers utilize mixed methodologies
within the same inquiry, they are able to delve further into a dataset to understand its
meaning and to use one method to verify findings from the other method” (Onwuegbuzie
& Leech, 2005, p. 384). By letting the research question drive the study, methods were
chosen that provided the most real-world answer to an educational leadership question.
The research question, “Are portfolios reliable as evidence of mastery of the
ISLLC standards and functions of students enrolled in an educational leadership
specialist program when measured by intra-class correlation?” was not sufficiently
answered to be especially significant to schools of Educational Leadership if only ICC
findings were presented. Qualitative explanations provided a richer (Lincoln & Guba,
1985) insight into the use of portfolios as documentation of mastery of ISLLC standards.
Therefore, the researcher sought feedback from raters as they evaluated each portfolio.
Population and Sample
Portfolios and Raters
The sample size of 30 portfolios was used in this study. All portfolios were from
Education Specialist students at a mid-size university in the southeast region of the
United States. The portfolios were submitted during two semesters by students from two
71

different cohorts. They covered a limited time span of four semesters, the duration of an
Education Specialist program. These portfolios were developed during the coursework
throughout the length of the Ed. S. program and turned in for a final perusal before the
end of the last semester. When conducting an ICC statistical study with a limited number
of samples, the researcher may increase the power of the study by increasing either the
number of samples or the number of judges (Shoukri, Asyali, & Donner, 2004; Walter,
Eliasziw, & Donner, 1996). Tochel et al., (2013) stated that when the number of raters
was increased, reliability increased. A limited number of portfolios were available, and
nine raters agreed to conduct the study. Therefore, each of 30 portfolios was reviewed by
three judges who were randomly assigned from a pool of nine judges (Derham &
Diperna, 2007, Gadbury-Amyot, Kim, Palm, Mills, Noble, & Overman, 2003; Shrout and
Fleiss, 1979). Raters were recruited to participate in this study. Criteria were that they
held advanced degrees in Educational Leadership or a related field (either Ed. S., Ed. D.,
or Ph. D.) and taught in an Educational Leadership department of a university, or they
were school or district administrators with doctorates (Ed. D. or Ph. D.) in Educational
Leadership. Appendix A contains the rater recruitment letter.
Instrumentation
The rating instrument was specifically designed for this study utilizing the ISLLC
standards published in 2008 and the functions delineated and published in the
Educational Leadership Policy Standards (ISLLC, 2008). A 6-point Likert scale was
selected as the rating scale from 1 (no evidence), to 6 (exemplary evidence). A 6-point
scale was chosen because optimum reliability occurs when a scale includes between four
and seven response choices, with reliability increasing up until seven choices are given 72

(Croasmun & Ostrum, 2011). A study of the number of response options and reliability
suggested that having a middle option could increase the variability of the scale (Lozano,
Garcia-Cueto & Muniz, 2008), so having six response options was the choice of the
researcher. Likert-type surveys were often utilized to study the strength of raters’ beliefs
on a categorical scale (Dittrich, Francis, Hatzinger, & Katzenbeisser, 2007). Appendix A
is a copy of the rating instrument.
The six standards for school leaders studied using this rating scale and the
performance indicators were as follows:
Standard 1—Shared Vision as described by performance indicators: (1.1)
Collaboratively develop and implement a shared vision and mission; (1.2) Collect and
use data to identify goals, assess organizational effectiveness, and promote organizational
learning; (1.3) Create and implement plans to achieve goals; (1.4) Promote continuous
and sustainable improvement; and (1.5) Monitor and evaluate progress and revise plans.
Standard 2—School Culture as described by performance indicators: (2.1)
Nurture and sustain a culture of collaboration, trust, learning, and high expectations; (2.2)
Create a comprehensive, rigorous, and coherent curricular plan; (2.3) Create a
personalized and motivating learning environment for students; (2.4) Supervise
instruction; (2.5) Develop assessment and accountability systems to monitor student
progress; (2.6) Develop the instructional and leadership capacity of staff; (2.7) Maximize
time spent on instruction; (2.8) Promote the use of the most effective and appropriate
technologies to support teaching and learning; and (2.9) Monitor and evaluate the impact
of the instructional program.
73
Standard 3—School Management as described by performance indicators: (3.1)
Monitor and evaluate the management and operational systems; (3.2) Obtain, allocate,
align, and efficiently utilize human, fiscal, and technological resources; (3.3) Promote
and protect the welfare and safety of students and staff; (3.4) Develop the capacity for
distributed leadership; and (3.5) Ensure teacher and organizational time is focused to
support quality instruction and student learning.
Standard 4—Collaboration as described by performance indicators: (4.1) Collect
and analyze data and information pertinent to the educational environment; (4.2) Promote
understanding, appreciation, and use of the community’s diverse cultural, social, and
intellectual resources; (4.3) Build and sustain positive relationships with families and
caregivers; and (4.4) Build and sustain productive relationships with community partners.
Standard 5—Educational Ethics as described by performance indicators: (5.1)
Ensure a system of accountability for every student’s academic and social success; (5.2)
Model principles of self-awareness, reflective practice, transparency, and ethical
behavior; (5.3) Safeguard the values of democracy, equity, and diversity; (5.4) Consider
and evaluate the potential moral and legal consequences of decision making; and (5.5)
Promote social justice and ensure that individual student needs inform all aspects of
schooling.
Standard 6—Influence as described by performance indicators: (6.1) Advocate for
children, families, and caregivers; (6.2) Act to influence local, district, state, and national
decisions affecting student learning; and (6.3) Assess, analyze, and anticipate emerging
trends and initiatives in order to adapt leadership strategies.
74

Validity
Validity of the rating instrument was established. Validity, according to Creswell
(2005), is the degree to which a rating instrument measures what it was developed to
measure, allowing inferences to be formed which are both meaningful and justifiable. A
panel of experts reviewed the survey prior to its use. The panel included an expert in
educational leadership who teaches leadership courses in a university, an experienced
school principal who is familiar with the ISLLC standards, and a retired professor of
Educational Leadership who had been involved in various capacities in school and
district leadership as well. Validity for the qualitative component was substantiated by
triangulation, member-checking, and rich, thick description (Creswell, 1998).
Data Collection Procedures
Upon approval by the university’s Institutional Review Board (Appendix C), all
potential participants were contacted personally by the principal investigator, either by
phone, e-mail or personal visit. The participants voluntarily signed the Informed Consent
Form (Appendix D). After the permission was obtained to utilize the archived portfolios
(Appendix E), the portfolios were obtained and kept in a secure location for the duration
of the research project. Each e-portfolio was coded by the primary investigator, who had
been trained and certified in NIH protocol (Appendix F). All relevant personal
information including name, school, title, grade level, and school district were removed
from the electronic portfolios in order to ensure privacy of the students who authored
them. Each participant was notified that they would receive no monetary gift for
participation.
75

Several opportunities for training for raters were offered. Two face-to-face
training sessions were offered, and an online training module was also available. All nine
raters were trained utilizing the same PowerPoint presentation, and all nine raters were
trained by the primary investigator. All nine raters were involved in teaching Educational
Leadership classes or were actively involved in school-level leadership. The primary
qualifications of the raters were familiarity with the ISLLC standards and holding an
earned terminal degree in Educational Leadership, either Ph. D. or Ed. D. A randomizer
from Microsoft Excel 2007 was used to assign numbers to raters. The randomizer
assigned each portfolio a number. Then the same randomizer was used to assign each
portfolio number to three raters, distributing the portfolios among the raters.
Item Analysis
Quantitative.
The quantitative portion of this study was developed around the work of Shrout
and Fleiss (1979) which detailed proper use of intra-class correlation coefficients as a
form of reliability study. Shrout and Fleiss proposed three distinct models for reliability
studies, depending on the research design. First, each sample is rated by the same number
of raters, randomly assigned from a field of raters. Second, each randomly selected rater
evaluates all samples. Third, each sample is rated by all judges. The first model was an
appropriate design for this study because a set of raters provided ratings on different sets
of portfolios. These raters were randomly assigned. Shrout and Fleiss proposed different
mathematical treatments of the three methods in order to ensure adequate reliability.
Generalizability theory, the Rasch model, joint probability of agreement, Kohen’s kappa
76

and Fleiss’ kappa, Pearson’s r and Spearman’s p were all considered, but each one was
found inferior to the intra-class correlation coefficient for this particular study. The
generalizability theory would not take into account the stringency of the raters (Draney,
1995), while the Rasch model should be used to compare an item’s difficulty with a
person’s ability (Bond & Fox, 2013). Joint probability of agreement did not consider the
fact that variances between raters can happen by chance (Gwet, 2012; Shoukri, 2010).
Cohen’s kappa can only measure the variance between two raters, and this study had
more than two raters (Posener, Sampson, Caplain, Ward & Cheney, 1990). Although the
kappa coefficient can be used with more than two raters, it did not take into account
differences due to chance (Cohen, 1960; Cohen, 1968; Fleiss et al., 1969). Pearson’s r
was limited to two raters, and Spearman’s p simply rank-ordered data after Pearson’s r
had been computed (Field, 2009). In the end, the ICC model was chosen because the
agreement between scores aimed to be examined (Field, 2009).
A similar reliability study was conducted in order to study reliability of portfolio
assessment for dental hygiene students (Gadbury-Amyot et al., 2003). A total of 30
portfolios were reviewed and analyzed using a rubric with 35 items measured on a 4-
point Likert scale. Seven faculty members rated each portfolio. The study associated with
the project demonstrated that with only three faculty raters a high degree of reliability
could be obtained.
Statistical tests were conducted using IBM’s SPSS version 22. Data scores were
entered at the function level and at the standard level. For example, standard one had five
functions. In data set one (by function) each score was entered for individual functions. In
data set two (by standard) the scores for all items were added and entered.
77

Prior to conducting the intra-class correlation of scores, assumptions for
parametric statistics had to be met. For intra-class correlations, the statistical assumptions
of a complete data set, outliers (z > |3.29|), and both univariate and multivariate normality
were examined (measures of skewness and kurtosis > |1.0|). In addition, the Malanobis
Distance was used to determine if multivariate outliers existed using 𝑋𝑋902 = 26.036, α =
.001. In addition to normality, a final statistic was computed to determine if collinearity
existed between the variables. This test was designed to ensure that variables were not
measuring the same characteristic and that they were all necessary to the study. A
common threshold of 10 for the variance inflation factor (VIF) was frequently found in
the literature (Hair, Anderson, Tatham, & Black, 1995).
After assumptions were run and met, the final statistical test was the intra-class
correlation, which showed how well different raters’ scores agreed with each other.
Scores near 1 exemplified perfect agreement, while scores closer to 0 revealed less
agreement between raters. A two-way random model was selected because portfolios
were randomly chosen and raters were randomly assigned to portfolios. Each of the 30
functions was assigned a Likert-type score between one and six. An intra-class
correlation of 0.7 was considered the minimum acceptable standard, 0.8 as good, and 0.9
as excellent (Kirkegaard et al., 2006).
Qualitative.
Intra-class correlation gave the researcher numerical data, but in order to truly
understand the process of rating portfolios, a qualitative method was chosen to enhance
the richness of results, thus making this a mixed-methods study. The methodology behind
78

this mixed-methods project, as well as guidance for the qualitative component, was
largely based on the work of Creswell (2003). As a qualitative researcher, several
components of theory applied in addition to the quantitative theory. Ways to protect
methodological integrity when performing qualitative research included limiting methods
used and explaining steps of the research thoroughly (Fielding, 2010).
Synthesizing the methodology in a succinct manner (Creswell, 2003; Lincoln &
Guba, 1985) helped the researcher finalize approaches. From several questions and
charts, research decisions were listed below (Table 3.1). The research approach was
mixed methods. Knowledge claims came from a pragmatic perspective. The researcher
was seeking to solve a practical, real-world problem of the reliability of portfolios to
assess students in an Educational Leadership Specialist program. The strategy of inquiry
was a mixed-methods design, with closed-ended measures (ICC) and open-ended
observations (written commentary from raters). The closed-ended measures, ratings from
portfolios, were the quantitative piece of the study, while the open-ended request for rater
observation was the qualitative segment of the study (Creswell, 2003).
Advantages and disadvantages of qualitative commentary from raters surfaced
(Creswell, 2003). One advantage was being able to utilize the language of participants as
the researcher included commentary in the study. By including rater expressions, the
researcher was able to represent exactly what thoughts raters communicated in their
writings. Raters could think about responses prior to writing them. Thoughtful responses
were preferable to ideas given hurriedly. Additionally, the rater was able to work from
written documents without a need to transcribe: Ideas did not get lost in transcription.
However, disadvantages surfaced as well. Some raters did not respond with written
79
commentary. The possibility existed that the researcher could have misrepresented or
misinterpreted the rater’s thoughts.
Measures were taken to ensure validity of the qualitative portion of this study.
The researcher triangulated data with literature as well as with the examples from the
portfolio. Member-checking was utilized as well. The researcher approached raters with
the final results and made sure the concepts and ideas raters were attempting to convey
were captured in written narrative (Lincoln & Guba, 1985). The researcher sought
inspection, clarification, and approval from the raters. Finally, narrative was written with
thick, rich description in order to capture the complete essence of ideas being
communicated (Creswell, 2003; Lincoln & Guba, 1985).
After ICC was run on numerical data, the researcher collected all rating sheets and
divided them into two segments: those with commentary and those with no commentary.
The commentary was then divided further into groups: commentary related to individual
standards and functions and commentary related to the portfolios as a whole. All
commentary was read holistically, but one rater emerged as the most detailed in
comments. The researcher evaluated the commentary related to standards and functions
initially and then evaluated the commentary relating to the portfolios as a whole. Those
comments were grouped and coded as themes emerged. As the researcher read other
raters’ comments, they were grouped and coded with existing themes, but if new themes
emerged, new groups were constructed. When all commentary was grouped and coded,
rich, thick narrative was written that provided examples from the portfolios and also
related back to the literature to triangulate the findings (Creswell, 2003; Lincoln & Guba,
1985). After the narrative was written, the researcher submitted it to the raters who had
80

provided commentary in order to ensure honest representation of what the raters intended
to communicate was noted (Onwuegbuzie & Leach, 2005)
The researcher’s role in the qualitative component of this study was that of
observer. From a lens of pragmatism, the researcher wanted to assimilate practical
information that would improve preparation of educational leaders. Her research
background has prepared her for this undertaking. In her Master’s degree program, she
took several research classes, both quantitative and qualitative. Her Master’s thesis
examined the impact teachers have on grieving students through the use of qualitative
analysis. In her Specialist studies, she participated in field research by conducting
interviews with educational leaders for a broad study for Georgia Educational Leadership
Faculty Association (GELFA). Additionally, her doctoral coursework included three
advanced statistics courses as well as a qualitative course, and she has written a
qualitative research proposal on Brain-Based learning. She has experience with coding
and analyzing information in qualitative research and has obtained “A” marks in
Statistical Analysis courses.
Regarding bias, the researcher was required to complete a portfolio when she
undertook the Educational Leadership degree at the same mid-sized university in
Southeast United States. She worked for many hours developing a portfolio, so she was
intimately familiar with the assimilation of artifacts as evidence of mastery of ISLLC
standards. She has participated in the portfolio process, even though the standards and
functions have been refined since her coursework. Although some graduate schools offer
courses that isolate qualitative and quantitative methodologies (Onwuegbuzie & Leech,
2005), this mid-sized university in Southeast United States has offered the opportunity to
81

study the benefits of mixed-method research as a component of a qualitative research
course.
Summary
The methodology of this study was reviewed in detail in Chapter 3. The purpose
of this two-phase sequential mixed-methods study was to answer two research questions.
The first question, a quantitative one, was to what extent are portfolios reliable as
evidence of mastery if the ISLLC standards and functions of students enrolled in an
educational specialist leadership program when measured by intra-class correlation. The
second question, the qualitative component, was why does consistency or inconsistency
exist among the raters?
Portfolios from a mid-sized university in the southeastern United States (RSU)
were evaluated to determine to what extent raters agreed on the quality of evidence they
contained. Thirty randomly-selected portfolios from a pool of forty-two were chosen
using Microsoft Excel 2007 randomizer. These portfolios were from students who had
graduated in 2011 or 2012 from RSU’s Education Leadership Specialist program. From a
pool of nine raters, three raters were randomly assigned to evaluate these portfolios with
a Likert-type scale of 1 (no evidence) to 6 (exemplary evidence) of mastery of each
ISLLC function and standard. Subsequently, raters were asked to write commentary
about how these portfolios could have been made better or why they were rated as they
were. The raters were professors at RSU in the Education Leadership department or
school leaders who had earned Ed. D. degrees or Ph. D. degrees in Education Leadership
in the past five years.
82
Two instruments were used in this study. The first was a Likert-type rating scale
for raters to select to what extent portfolios, along with their introductions and
reflections, indicated mastery of ISLLC functions and standards. The second was an
open-ended question: How could these portfolios be better indicators that the student had
mastered ISLLC standards and functions? The rating scale was created by the primary
investigator. The researcher listed each standard and function and listed numbers 1-6
beside each. After the instrument was created, it was reviewed by experts in the
Education Leadership field to determine validity.
Raters received a packet with an IRB (Institutional Review Board) informed
consent form (APPENDIX G), rating sheets, flash drives, and a copy of an instructional
PowerPoint. Before the researcher explained the contents of the packets, raters were
asked to sign the IRB consent forms, which the principal investigator immediately filed.
The customized 8g flash drive included portfolios they were instructed to rate and the
same instructional PowerPoint presentation. Rating sheets were explained to each person
before they filled them out. Raters were asked to circle the number that best indicated to
what extent the artifacts contained for each standard and function indicated student
mastery. The electronic portfolios had been redacted by the principal investigator using
Adobe Acrobat XI PDF maker. Additionally, each rater was instructed to comment on the
portfolio quality and reasons portfolios were scored as they were. The principal
investigator procured each packet when raters were finished with all portfolios. Two
raters had to be given extra time; three finished early.
83
Upon receipt of the returned packets with grading sheets and flash drives, the
principal investigator reviewed each one to determine if all pertinent materials were
enclosed. The next chapter explained results from collected information.
84

CHAPTER IV
RESULTS
Introduction
The purpose of this chapter was to examine the inter-rater reliability results of
portfolios submitted by students in an Education Specialist in Leadership course of study.
The purpose of the study, research questions, and data collection process were reviewed.
Data from tested assumptions and an analysis of intra-class correlation data were
presented. Qualitative data were collected, reviewed, coded, grouped, validated, and
reported.
Purpose of Study
The researcher purposed to determine the reliability of portfolios as evidence of
mastery of ISLLC standards and functions of students enrolled in an educational
leadership program. Data were analyzed using intra-class correlation to determine the
extent to which portfolio scores assigned by those with advanced degrees in educational
leadership agreed with each other. From a pool of nine raters, each of thirty portfolios
was evaluated by three raters to determine reliability. The raters assigned a Likert-type
score of 1-6 for each item under each standard: 1 represented “no evidence,” 2
represented “insufficient evidence,” 3 represented “some evidence,” 4 represented
“adequate evidence,” 5 represented “satisfactory evidence,” and 6 represented
“exemplary evidence.” According to Norman (2010), data from a Likert scale could be
85

treated as ordinal data and therefore parametric statistics was an acceptable option when
examining such data.
Additionally, those raters were asked to give commentary as to why ratings were
given and ways to improve evidence of skill mastery. This rater commentary was
considered narrative or written interview. The written narratives were coded and grouped
to provide insight into the reliability of portfolios as documentation of leadership skill
practice and mastery. The quantitative component of the study was designed to determine
to what extent raters would evaluate portfolios similarly (Norman, 2010), and the
qualitative element of the study was to offer explanation, justification, and rationalization
to those scores (Miles & Huberman, 1984). The final objective was to gain useful,
applicable understanding about utilization of portfolios as an instrument to determine
mastery of ISLLC standards and functions.
Research Questions
To what extent were portfolios reliable as evidence of mastery of the ISLLC
standards and functions of students enrolled in an educational leadership program when
measured by intra-class correlation coefficient? Why does consistency or inconsistency
exist among the raters?
Results
Quantitative Findings
The quantitative results answered the research question: to what extent were
portfolios reliable as evidence of mastery of the ISLLC standards and functions of
students enrolled in an educational leadership program when measured by intra-class 86

correlation coefficient? The intra-class correlation coefficient was used to answer this
question. In this way, reliability of the instrument was determined. Prior to conducting
the intra-class correlation of scores, assumptions for parametric statistics had to be met.
For intra-class correlations, the statistical assumptions of a complete data set, outliers,
and both univariate and multivariate normality were examined. Statistical tests were
conducted using IBM’s SPSS version 22. Data scores were entered at the item level and
at the standard level. For example, standard one had five functions. In data set one (by
functions) each score was entered for individual functions. In data set two (by standard)
the scores for all functions for that standard were added and entered.
Assumptions
Preliminary tests showed that there were negligible missing data entries. Two
raters did not score one item for two different standards. These items were not the same
and they were not from the same standard. The first missing item was from standard 2,
function 9 (portfolio 19), which states that leaders monitor and evaluate the impact of the
instructional program. The second missing item was from standard 5, function 1, which
instructs leaders to ensure a system of accountability for every student’s academic and
social success (portfolio 18). Determination of normal distribution of data was conducted
through four analyses: standardized scores (z-scores), Skewness, Kurtosis, and Shapiro-
Wilks (Table 4.1). These tests were important because elimination or transformation of
non-normally distributed data can reduce Type I and Type II errors (Osborne, 2001).
Standardized scores (z-scores) were examined for each item entered in order to determine
univariate outliers. The acceptable level of z scores are z ≤ |3.29| (Tabachnick and
87

Fidell, 2007). In this study, all values were between -2.00189 < z < 2.29890 except one
outlier, whose value was z = 3.50075. This value came from standard 2 function 8 and
stated that effective leaders promote use of effective and appropriate technologies to
support teaching and learning. The single outlier was determined to have a minimal effect
on the data; therefore, it was left unaltered.
Skewness indicates how asymmetric a distribution is. Skewness values ranged
from < |1| (Field, 2009). As the values approach or exceed |1|, violation of that
assumption of normality has occurred. In this study, skewness values fell between -.508 <
Sk < .638, so this indicated that the data is not skewed. Kurtosis examines how peaked or
flat the distribution is. Acceptable kurtosis values were limited to those below |3.29|
(Field, 2009), but those nearer to |1| would indicate a more normal distribution. Positive
values are more peaked, while negative values are less peaked. Evaluation of kurtosis
among the samples showed that only one value showed evidence of flatness, with values
ranging from -1.605 < K < .025. The minimal departure for the kurtosis values provided
was further evidence of a normal distribution. The final indicator of normality was
examined using the Shapiro-Wilks test. This data was evaluated using a = .05 such that
p ≥ .05 and indicated a normal distribution. Six variables were found to be non-normally
distributed (see Table 4.1), while the rest of the values were smaller. However, this test
is sensitive to sample size. As such, when examining the data, a few departures from
normality were found, but when looking at the evidence as a whole, the decision was
made not to transform the data because departures were marginal.
88

Table 4.1 Normality Scores by Rated Function
ITEM Skewness Kurtosis Shapiro-
Wilks ITEM Skewness Kurtosis Shapiro-
Wilks ITEM Skewness Kurtosis Shapiro-
Wilks R1S1* R2S1 R3S1
1 -.386 -.933 .026 .686 -.771 .000 .100 -.893 .066
2 -.508 -1.046 .003 .083 -1.164 .032 .151 -.557 .019
3 -.455 -1.055 .010 .391 -.930 .031 -.048 -.558 .071
4 -.426 -1.072 .004 .182 -1.221 .022 .302 -.557 .022
5 -.241 -1.410 .003 .360 -1.243 .003 .543 -.530 .019
R1S2 R2S2 R3S2
1 -.367
-1.147 .004 .289 -.996 .026 -.505 -.833 .016
2 -.257 -1.261 .001 -.373 -1.323 .001 -.124 -.904 .106
3 -.253 -1.235 .009 .022 -1.470 .001 -.294 -.919 .016
4 .014 -1.171 .021 .003 -1.384 .004 -.066 -1.022 .030
5 -.294 -1.233 .006 .000 -1.146 .005 .155 -1.247 .008
6 -.200 -1.230 .013 .216 -.637 .034 -.057 -.840 .090
7 -.016 -1.373 .007 -.019 -1.437 .003 -.362 -.995 .001
8 .147 -1.528 .001 .169 -1.227 .006 -.463 -1.084 .002
9 -.238 -1.181 .017 -.099 -1.301 .008 .204 -.927 .042
R1S3 R2S3 R3S3
1 .000 -1.360 .015 .016 -.982 .030 .098 -.897 .035
2 .049 -1.151 .016 .092 -.539 .081 .456 -.437 .023
3 .164 -1.259 .010 -.037 -.780 .008 .359 -1.092 .008
4 .303 -.1007 .003 .613 -.564 .005 .363 -1.119 .005
5 -.213 -1.344 .005 -.056 -1.088 .013 -.035 -1.464 .005
89

Table 4.1, (continued)
ITEM Skewness Kurtosis Shapiro-Wilks
ITEM Skewness Kurtosis Shapiro-Wilks
ITEM Skewness Kurtosis Shapiro-Wilks
R1S4 R2S4 R3S4
1 -.228 -1.482 .001 -.364 -.714 .045 .054 -1.011 .043
2 .064 -1.180 .017 .119 -1.474 .002 .009 -1.429 .002
3 .119 -1.415 .011 .130 -1.174 .012 -.148 -1.237 .010
4 .235 -1.228 .014 .294 -1.287 .003 .052 -.881 .081
R1S5 R2S5 R3S5
1 .294 -1.525 .001 .022 -1.470 .001 -.020 -1.443 .009
2 -.105 -1.415 .003 -.242 -1.605 .000 -.321 -.824 .033
3 -.009 -1.573 .002 .366 -.672 .018 .015 -1.172 .012
4 -.241 -1.325 .005 .189 -1.065 .007 -.301 -1.525 .001
5 .140 -1.560 .003 -.008 -1.371 .003 -.056 -1.515 .003
R1S6 R2S6 R3S6
1 .102 -1.126 .035 .494 .025 .002 -.160 -.871 .021
2 .457 -.933 .009 .548 -.803 .001 .094 -.667 .100
3 .171 -1.280 .014 .638 -.834 .000 -.265 -1.311 .002
*Note: Table is arranged according to rater, standard, and then item. For example: R1S2 means rater 1, standard 2, and R2S5 means rater 2, standard 5. Item numbers denote standard descriptors.
90

In addition to univariate normality, evidence of multivariate outliers was
examined to determine if normality existed for the multivariate case using the Malanobis
Distance estimate. The results revealed that there were no multivariate outliers using
χ902 = 26.036, α = .001. All χ2 values were less than this threshold. This indicates that
multivariate outliers were not present.
A final statistic was computed to determine if collinearity existed between the
variables. This test was designed to ensure that variables are not measuring the same
characteristic and that they are all necessary to the study. Finally, multicollinearity was
examined using the Variance Inflation Factor (VIF). The VIF values in this study were
well below the threshold of 10, varying between 1.284 as a lower value and 5.308 as an
upward value, with only one variable falling above 5.000. This indicates that collinearity
was not an issue for this data.
Intra-class correlation
The intra-class correlation examined the reliability of portfolio assessment and
determined the agreement between raters’ scores. As indicated in Table 4.2, none of the
values showed a strong agreement between raters. The intra-class correlation coefficients
ranged from -.257 to .626. Two functions nearly met the threshold for reliability. They
were Function 2 from Standard 1 (ICC = .606) and Function 2 from Standard 6 (ICC =
.626). The first function was to collect and use data to identify goals, assess
organizational effectiveness, and promote organizational learning, and the second
function was to model principles of self-awareness, reflective practice, transparency, and
ethical behavior. Subsequently, reliability was evaluated at the standard level using a
91

two-way random intra-class correlation. The scores for functions for each standard were
added and examined for reliability to ascertain if inter-rater reliability could be
determined. The resulting data is shown in Table 4.3. The agreement between the raters
for each standard overall did not reach the threshold of .7 as indicated by the range of
ICC values from .105 to .521 in Table 4.3. Therefore, even by combining the functions in
each standard, no agreement was obtained.
Qualitative Findings
Although the researcher found that no agreement existed among ratings in this
reliability study, elements for consideration arose through the qualitative feedback
provided by the raters. As a part of the data collection process, raters were asked to
provide commentary that would give insight into the scores that were earned. In this
discussion segment, quantitative and qualitative findings were woven together to provide
a clearer representation of this study’s merits.
Students were required to demonstrate mastery of each standard by providing at
least one classroom artifact and one internship artifact per standard. Each artifact was to
have an introduction which explained why the artifact was associated with a particular
standard and situating the student within the artifact. Additionally, each artifact was to
have a reflection which gave the student a chance to explain further thoughts and
concerns. Placement of artifacts was left up to the Educational Leadership student. Each
standard’s artifacts were compared with a list of standards, and raters scored the artifacts,
along with their introductions and reflections, 1 (no evidence), 2 (insufficient evidence),
3 (some evidence), 4 (adequate evidence), 5 (satisfactory evidence), or 6 (exemplary
92

evidence) for evidence of a student’s mastery of the ISLLC standard. Table 4.4
summarizes the standards with sample classroom and internship artifacts.
Table 4.2 Intra-Class Correlation Coefficients by Function
Average measures
Standard 1: Facilitating the development , articulation, implementation and stewardship of a vision of learning that is shared and supported by all stakeholders Collaboratively develop and implement a shared vision and mission .185 Collect and use data to identify goals, assess organizational effectiveness, and promote organizational learning
.606
Create and implement plans to achieve goals .430 Promote continuous and sustainable improvement .532 Monitor and evaluate progress and revise plans .418 Standard 2: Advocating, nurturing and sustaining a school culture and instructional program conducive to student learning and staff professional growth Nurture and sustain a culture of collaboration, trust, learning , and high expectation .221 Create a comprehensive, rigorous and coherent curricular plan .497 Create a personalized and motivating learning environment for students .139 Supervise instruction .118 Develop assessment and accountability systems to monitor student progress .179 Develop the instructional and leadership capacity of staff .493 Maximize time spent on quality instruction .401 Promote use of effective and appropriate technologies to support teaching and learning .380 Monitor and evaluate the impact of the instructional program .312 Standard 3: Ensuring management of the organization, operations and resources for a safe, efficient, and effective learning environment Monitor and evaluate the management and operational systems .489 Obtain, allocate, align, and efficiently utilize human, fiscal, and technological resources .327 Promote and protect the welfare and safety of students and staff .331 Develop the capacity for distributed leadership .388 Ensure teacher and organizational time is focused to support quality instruction and student learning
.463
Standard 4: Collaborating with faculty and community members, responding to diverse community interests and needs, and mobilizing community resources Collect and analyze data and information pertinent to the educational environment .500 Promote understanding, appreciation and use of the community’s diverse cultural, social and intellectual resources
.470
Build and sustain positive relationships with families and caregivers .518 Build and sustain positive relationships with community partners .559 Standard 5: Acting with integrity, fairness, and in an ethical manner Ensure a sustem of accountability for every student’s academic and social success .135 Model principles of self-awareness, reflective practice, transparency, and ethical behavior .626 Safeguard the values of democracy, equity and diversity -.257 Consider and evaluate the potential moral and legal consequences of decision-making .072 Promote social justice and ensure that individual student needs inform all aspects of school learning
-.002
Standard 6: Understanding, responding to, and influencing the political, social, economic, legal
and cultural context
Advocate for children, families, and caregivers .359 Act to influence local, district, state, and national decision affecting student learning .389
93

Average measures
Assess, analyze, and anticipate emerging trends and initiatives in order to adapt leadership strategies
.196
94

Table 4.3 Intra-Class Correlation Coefficients by Standard
Average measures ICC
Standard 1: Facilitating the development , articulation, implementation and stewardship of a vision of learning that is shared and supported by all stakeholders
.329
Standard 2: Advocating, nurturing and sustaining a school culture and instructional program conducive to student learning and staff professional growth
.324
Standard 3 Ensuring management of the organization, operations and resources for a safe, efficient, and effective learning environment
.442
Standard 4: Collaborating with faculty and community members, responding to diverse community interests and needs, and mobilizing community resources
.521
Standard 5: Acting with integrity, fairness, and in an ethical manner .105
Standard 6: Understanding, responding to, and influencing the political, social, economic, legal and cultural context
.208
95

Table 4.4 Standards with Related Artifacts
Standard 1: An education leader promotes the success of every student by facilitating the development, articulation, implementation and stewardship of a vision of learning that is shared and supported by all stakeholders. Collaboratively develop and implement a shared vision and mission Collect and use data to identify goals, assess organizational effectiveness, and promote organizational learning Create and implement plans to achieve goals Promote continuous and sustainable improvement Monitor and evaluate progress and revise plans
Coursework Internship CCRPI transition/overview Strategic/school/system improvement essay Budget strategic plan Mission statement description/procedures School improvement plan (Virtual/Mock) Student survey Assessment essay Curriculum audit Leadership styles
School Improvement Plan/School Improvement team (vision, plan, minutes, agenda)
Student recognition Student transition (8th to 9th)- camp/brochure/ Transition to CCGPS, Course test (math, history) School program guide (comprehensive) Teacher observation (peer, ewalk) Meeting agenda/weekly planner Summer school calendar, Board minutes School Leader interviews
Standard 2: An education leader promotes the success of every student by advocating, nurturing and sustaining a school culture and instructional program conducive to student learning and staff professional growth. Nurture and sustain a culture of collaboration, trust, learning, and high expectations Create a comprehensive, rigorous, and coherent curricular plan Create a personalized and motivating learning environment for students Supervise instruction, Develop assessment and accountability systems to monitor student progress Develop the instructional and leadership capacity of staff, Maximize time spent on quality instruction Promote the use of the most effective and appropriate technologies to support teaching and learning Monitor and evaluate the impact of the instructional program
Coursework Internship Curriculum alignment project Curriculum audit/development Change essay Strategic plan for CCRPI implementation GPS to CCRPI essay School improvement plan, Balanced scorecard Scenario responses, Data alignment
Standards based classroom- checklist (&/or Ewalk), strategies, Curriculum audit/tools
Student support/recognition (ICU, young men of distinction, AP night, senior day
Faculty training/support (content, coteaching, peer-to peer observation, Thoughtful Literacy, “Classworks” implementation, Literacy, R4 committee meeting, curriculum maps, minutes from training)
Agenda- weekly planning/coach’s meeting/PTO/CCRPI/
Standard 3: An education leader promotes the success of every student by ensuring management of the organization, operations, and resources for a safe, efficient, and effective learning environment. Monitor and evaluate the management and operational systems Obtain, allocate, align, and efficiently utilize human, fiscal, and technological resources Promote and protect the welfare and safety of students and staff, Develop the capacity for distributed leadership Ensure teacher and organizational time is focused to support quality instruction and student learning
96

Table 4.4, continued
Coursework Internship School Equity research paper Social media research paper Budget/Accounting process School Improvement plan data Mentoring plan of action
Schedule (tutoring, hall duty, block) Tutoring Form (transportation request , tutoring, extended
day tutoring, letter to parent) Grant/application, Student course catalog, Edmodo Policy manuals/documents (Title 1, attendance, new
teacher, safety), ewalk data, PLC facilitation Memo/Agenda (data analysis, mentor, athletic budget)
Standard 4: An education leader promotes the success of every student by collaborating with faculty and community members, responding to diverse community interests and needs, and mobilizing community resources. Collect and analyze data and information pertinent to the educational environment Promote understanding, appreciation, and use of the community’s diverse cultural, social and intellectual resources Build and sustain positive relationships with families and caregivers Build and sustain productive relationships with community partners
Coursework Internship Data (analysis)- chart or essay Strategic/Action/Improvement plan Professional Learning Communities Presentation feedback form ESSAY- CCRPI, diversity, collaboration Curriculum audit
Agenda/minutes (study group, school council, Business advisory board, weekly news)
Notifications (Hybrid Bell schedule, open house, Deficiency notice, Benchmark analysis protocol, AdvancED, differentiation brochure, newsletter, communication website)
Student celebrations (Senior, 9th orientation, reward) Contract- credit recovery Presentation (Title 1, 7th grade class meeting, planning
briefs for test prep related to SIP goals) Photo of nursing home visit, Open house sign in End of year survey, EOCT score comparison
Standard 5: An education leader promotes the success of every student by acting with integrity, fairness, and in an ethical manner. Ensure a system of accountability for every student’s academic and social success Model principles of self-awareness, reflective practice, transparency, and ethical behavior Safeguard the values of democracy, equity, and diversity Consider and evaluate the potential moral and legal consequences of decision-making Promote social justice and ensure that individual student needs inform all aspects of schooling
Coursework Internship School law assignment Dispositions/self inventory Research paper or proposal- NCLB, Academic
performance related to PE, school violence, Methodology section of research plan, interactive whiteboards, teens with behavior disorders, relationship of freedom of speech/school law
Role of principal essay Ethnography ppt Data analysis Action plan
Testing instructions/procedures Agenda/Invitation/Minutes (coach’s meeting, school
council minutes, District Advisory Task force) Expectations (Honor code, class rules, handbook, parent
letter, code of ethics, Teacher of the Year recommendation Evaluation- self inventory, observation, parent survey,
assessment rubric, Data disaggregation/at risk file Teacher Keys training/evaluation/feedback RTI training document, Club sponsor roster Study Hall Intervention Program development
97

Table 4.4, continued Standard 6: An education leader promotes the success of every student by understanding, responding to, and influencing the political, social, economic, legal and cultural context. Advocate for children, families, and caregivers Act to influence local, district, state, and national decisions affecting student learning Assess, analyze, and anticipate emerging trends and initiatives in order to adapt leadership strategies
Coursework Internship School law assignment Dispositions/self inventory Research paper or proposal- NCLB, Academic
performance related to PE, school violence, Methodology section of research plan, interactive whiteboards, teens with behavior disorders, relationship of freedom of speech/school law
Role of principal essay Ethnography ppt, Data analysis, Action plan
Minutes (board meeting, Education Excellence Foundation, school council, discipline committee,
Agenda (Conference, stakeholder, PIE program, board meeting, DOE drive-by, new report card committee, Data Dig), Presentation (Parent involvement)
Reports (monthly enrollment, parent involvement, tribunal statement, press release, comprehensive ELA action plan-SIP, survey results, newsletter)
Sign in sheet (TKES training), Survey (Staff, student, parent)
Feedback from raters (Table 4.5) was classified into five categories: Weak,
Confusing or Unclear, Misplaced or Incorrectly Aligned, Incomplete, and Implied.
Comments were coded as Weak when the evidence was listed as a poor choice or not a
good example. Commentary was coded as Confusing or Unclear when several raters
offered conflicting commentary or when they labeled it as confusing or unclear.
Commentary was coded as Misplaced or Incorrectly Aligned when raters labeled them
with those terms. Items coded as Incomplete were either labeled as incomplete or a
synonym for that term. When raters identified items as implied they were coded and
placed in that category descriptor.
Weak.
The most widespread comments were themed around weak artifacts. A
representative overarching comment from Rater 5 was, “Although some of the artifacts
might pertain to the standards, a meeting or event announcement is not sufficient
98
evidence of mastery of all of the functions under that specific standard.” One example of
a gap between raters with Standard 1 was Portfolio 5, which presented a school
improvement plan. The standard included developing and implementing a shared vision
and mission, collecting and utilizing data to assess organizational effectiveness, creating
and implementing a plan to achieve goals, promoting continuous and sustainable
improvement, and monitoring and evaluating progress and revising plans accordingly.
The composite scores for Standard 1 were 5, 8, and 20. The commentary from the low
rater (Rater 1) included “no evidence of collaboration or implementation, data was not
provided to identify goals” and “strategies were weak, no real plans for implementation,
and nothing provided to monitor, evaluate or revise.” That particular rater (Rater 1)
provided a rationale for scores. Rater 2, who scored all functions in the 4 (adequate), did
not provide justification or a rationale for scores given. Under Standard 1, Portfolio 3’s
SAR (team mission statement) as a classroom artifact was mentioned by Rater 8 as
“inadequate” with composite scores of 8, 13, and 13. Some discrepancy in scores was
evident with this example.
Also categorized in the weak group were several examples with Standard 2. This
standard related to advocating, nurturing and sustaining a school culture and instructional
program conducive to student learning and staff professional growth. One of the greatest
discrepancies in scores, with composite scores of 11, 35, and 45 was in Portfolio 15. It
contained a PowerPoint presentation on how to conduct a curriculum audit (classroom)
and a school vision statement (internship). The low ratings were earned, according to
Rater 3, because “artifacts were weak in those components addressed and did not provide
evidence of several components of the standard.” Minutes from a coach’s meeting
99

(Portfolio 6 - scores 14, 28, and 49) as well as a timesheet of internship tasks (Portfolio 7
- scores 33, 44, and 45) were both listed as “poor choices” from Rater 6 for Standard 2.
Rater 3 scored those artifacts at a composite level of 49 and did not provide commentary.
Standard 3 dealt with monitoring and evaluating the management and operations,
proper use of school resources, safety, leadership development, and guarding
instructional time. Rater 3 gave commentary that “an athletic budget is a poor choice of
evidence.” In Portfolio 5 (scores 9, 18, and 20), the internship artifact was a curriculum
audit. The portfolio had no classroom artifact for this standard. The low rater (Rater 9)
noted that the “curriculum audit addresses some of the components but does not provided
extensive enough examples to show mastery.” “School map” also received a comment of
“poor choice” for Rater 9 Standard 3, even though the student linked the map to school
safety, which was one of the functions in Standard 3. Portfolio 24’s Standard 3 received
this remark from Rater 7, “The only artifact provided was a list of eight ways that a
school has raised money.” Portfolio 24, Standard 3 received scores of 5, 5, and 6 from the
three raters, which was a closer score than most. Portfolio 26, Standard 3 (composite
scores 11, 19, and 24) included a comment from Rater 7, “Fiscal is only one part of
managing and operating a school.” Many students chose to include budgeting as the only
focus on Standard 3, but it also focused on using human and technological resources,
developing others in the building for leadership roles, and guarding instructional time.
Standard 4, which addressed collaborating with parents and community leaders,
responding to diversity within the community, and mobilizing community resources
received this feedback from Rater 2, “NAH!” This artifact, from Portfolio 5, was a
presentation feedback form (scores 4, 7, and 8). The student imbedded a one-page
100

evaluation, with no commentary, with Standard 4, that addressed collaboration with
faculty and community members to respond to diverse community interests and needs
and mobilization of community resources. Another example of weak artifacts in Standard
4 was a photocopy of a page on standards from an Advance-ED booklet in Portfolio 6
(composite scores 6, 12, and 21) as an internship artifact and a research paper on how to
improve teacher assessment scores for the classroom artifact. Rater 8, who scored the
portfolio the lowest, provided the following note, “The artifacts did not address the larger
aspects of the standard (community). Additionally, a copy of standards is NOT an
adequate artifact. It shows no understanding or mastery by the student.” Rater 8 clearly
indicated that the presented artifact was insufficient.
Examples of weakness, according to some raters, were revealed in Standard 5.
This standard included acting with integrity, fairness and in an ethical manner, with
accountability, democracy, equity, diversity, moral and legal judgment, and
consequences, and social high scorer, Rater 1, justice. Portfolio 9 presented a disposition
evaluation (classroom) and performance data (internship) as its evidence. Portfolio 9’s
composite scores (14, 15, and 25) on the five functions were not sufficient for some
evaluators. Rater 7 noted, “I’m not sure that the classroom artifacts of disposition
evaluations are sufficient. These characteristics should be shown in the public school
setting (rather than the college classroom.) Additionally, I do not think the performance
data alone supports the standard.” Rater 7 (lowest scorer) gave scores ranging from 1
(insufficient) to 4 (adequate) on the five functions under that standard, while Rater 1, the
high scorer, marked all the functions as 5 (satisfactory). Rater 7 also commented that a
set of class rules under Standard 5 (internship) was “not a good example of the standard.”
101

Another example of a “weak” artifact in Standard 5 was a disposition evaluation. Rater 1
said, “A disposition is useful for a student, not so useful in evaluating standard mastery.”
Portfolio 17’s artifacts, an ethnography research PowerPoint and a set of classroom rules,
were considered ineffective. Comments from rater 7 included, “Neither artifact was
effective for this standard. Much more information would be needed to show mastery.”
This portfolio received composite scores of 10, 14, and 21 for Standard 5. Rater 7 scored
all five functions at a level of 2 (insufficient), while Rater 4 scored all level 4 (adequate).
The discrepancy between scores revealed a great disconnect between raters. In fact, the
low score came from a school district leader, and the high score was a professor in the
Educational Leadership program from which the student had graduated.
Weak artifacts were found in Standard 6 as well. Standard 6 addressed the larger
social context of education by suggesting that educational leaders serve as advocates for
children and their education at local, district, state, and national levels, and anticipate
future educational trends in order to adapt leadership strategies. One artifact was an
agenda from conference participation in Portfolio 26 (composite scores 8, 9, and 15).
Rater 7 noted, “While conference participation is good, it does not demonstrate active
leadership.” Rater 7 scored all functions as 3 (some evidence) while Rater 1 scored all
functions as 5 (significant). Raters did not agree to what extent the artifact demonstrated
standard mastery. Board meeting minutes were presented as the internship artifact in
Portfolio 9. Scores given were 1 (no evidence) for all functions from Rater 1, to 4
(adequate evidence) for all functions from Rater 2. Rater 1 remarked, “While attending
board meetings is part of the job, attendance does not demonstrate active understanding.
Reflection is needed to tie it all together.” Rater 1 saw board meetings as not providing
102
evidence of standard mastery, while Rater 2 saw board meetings as enough evidence that
student had mastered the standard. Another educational leadership student provided the
classroom school law assignment paired with a board meeting agenda. Rater 7 responded,
The artifacts did not represent the standard. The classroom artifact was basically a question and answer assignment about the legal system. Although the standard does say “legal,” I do not believe that the characteristics of the legal system are what the standard is trying to address. Additionally, a copy of a board meeting agenda does not reflect the standard without additional commentary on how the topics discussed relate to the standard.
The range in scores Portfolio 6 ranged from 1 (no evidence) for most functions from
Rater 7 to 6 (satisfactory or exemplary) for most functions from Rater 3. Artifacts
included a school board meeting’s minutes and a copy of the group school law test. No
agreement between raters was evident in the scoring of Portfolio 6 artifacts.
Weak artifacts drew the most commentary from raters. Examples from an array of
portfolios demonstrated the vast differences in opinions of the raters about the extent to
which artifacts, along with their introductions and conclusions, furnished evidence of
mastery of ISLLC standards and functions. However, weak evidence was not the only
type that raters submitted as cause for investigation.
Confusing or unclear.
The next theme of commentary from raters is confusing or unclear. This category
included artifacts that were identified as confusing to the raters, or raters indicated they
were unclear why the artifacts were in a particular category. Several artifacts labeled as
confusing or unclear were identified in Standard 4. Standard 4 dealt with “collaborating
with faculty and community members, responding to diverse community interests and
needs, and mobilizing community resources.” A function of Standard 4 was “collect and
103

analyze data and information pertinent to the educational environment.” Several students
placed CRCT, EOCT, GHSGT, and other testing data with this standard, but raters noted
that students did not provide clear information on how that data related to stakeholder and
community diversity. Portfolio 26 was one example. The author presented a data set of
EOCT test data. Rater 7 scored each function with 3 (some evidence), but the Raters 1
and 5 marked composite scores 15 and 20, with one rater scoring all functions 5
(satisfactory), indicating that the EOCT data was enough evidence of that student’s
mastery.
Misplaced or incorrectly aligned.
Misplaced or Incorrectly Aligned artifacts were those that were not listed with
the correct standard, according to the raters. In the set of Portfolio 9’s scores of 11, 16,
and 20, Rater 7 observed, “Neither artifact really hit the main aspect of developing and
implementing a vision. The artifacts were more about strategies. The internship artifact
(action plan for community involvement) might have been better aligned with Standard 4
on improving community communication.” The classroom artifact was a strategic plan,
which had been developed as a group project. Portfolio 17 had a gap of 28 points
between its high and low composite score for Standard 2 (18, 34, 46), and Rater 7
commented, “A letter asking you to serve as mentor teacher demonstrates no mastery of
Standard 2.” In Portfolio 5, Standard 3’s composite scores were 9, 18, and 20. An
observation from Rater 1 was, “The School Improvement Plan provided focused on
academic performance which is not the focus of Standard 3. This artifact would have
been more appropriate for Standard 2.” Another comment from Rater 1 was about the
“disconnect between the artifact submitted and the standard” (Standard 4). The artifact 104

was dealing with testing data, but the standard dealt with educational environment and
mobilizing community resources. Rater 5 commented, “Just because the word ‘data’
appears in the standard does not mean test data is relevant.” Another misplaced or
incorrectly aligned artifact was noted by Rater 5, who evaluated Portfolio 6 (composite
scores 5, 7, and 16). The comments on Standard 6 by Rater 5 were, “The only artifacts
provided dealt with law, ethics and discipline. The standard relates to understanding,
responding to, and influencing the political, social, economic, legal and cultural context.”
Portfolio 5 had a range of 3 to 10 in its composite scores of Standard 6. Commentary
from Rater 7 provided on one of the two scores of 3, “An artifact answering questions
about law cases from class does not address the meaning of the standard to ‘advocate, act,
assess, analyze, and anticipate.’” Those raters did not agree on the evaluation of the
available artifacts.
Incomplete.
The Incomplete theme presented examples of standards that were not fully
addressed, and were placed in the category labeled Incomplete. Portfolio 5, Standard 1
had an example of this type of variation in composite scores, with a range between 5 and
21. Rater 1, whose composite score of the artifacts was 6, said, “Artifacts were missing
although the reflection mentioned additional artifacts.” The artifact that was available
was a copy of the school’s vision statement and beliefs, but it was in a TIFF image, so it
is possible that some raters may not have been able to access it or may not have known
how to open an image of that type. Introductions and reflections were available. Portfolio
15 (total comprehensive scores 52, 115, and 149) included several instances from Rater 8
with specific components receiving a score of 1 (no evidence), while other components 105
were scored 4’s and 5’s (adequate and satisfactory), while the Rater 3 marked scores of
all 4’s and 5’s (adequate and satisfactory). Rater 8, who indicated the low scores, noted
that evidence was missing on specific functions. It is unclear if the other Raters 2 and 3
looked for those specific functions, or viewed the artifacts for the standards in a more
global manner.
Implied.
The next theme, Implied, mentioned that certain functions were implied but not
expressly stated under particular functions and were placed in the category labeled
“Implied”. This was evident with Standard 1 on multiple portfolios. The vision cycle,
presented in Standard 1, has five functions. When just a school improvement plan or
vision was presented, even when it had an introduction and reflection, raters noticed that
the single artifact did not address all five functions within the standard. Some
commentaries from Rater 7 were, “role with vision statement was implied,” “SIP
information was clear and concise, reflection was linked to a participant’s role, but
follow-through was implied,” and “monitor and evaluate was implied by process
employed for planning.” These were common comments from Rater 7 regarding this
standard. Some raters elected to give students credit for the implied function mastery with
scores of 4, 5, or 6 on the same portfolio. Other raters elected to score a 1 when there was
no specific evidence given and mentioned in the introduction or reflection.
Another example of a glaring gap in scores pertained to Standard 2, “advocating,
nurturing and sustaining a school culture and instructional program conducive to student
learning and staff professional growth.” The artifacts presented for Portfolio 17 were a
group curriculum project (classroom) and a school curriculum audit (internship). The 106

raters’ composite scores on Portfolio 17 were 18, 34, and 46. Rater 7, who scored the
composite as 18, noted that under “maximize time spent on quality instruction” the
comment was, “this was not addressed” and scored the implied functions as 1. The other
raters (Raters 1 and 4) scored the implied functions a 3 and a 4, resulting in scores that
did not relate to each other well.
An example of credit given by some raters for implied information was in
Standard 5, integrity, fairness and in an ethical manner. The three raters’ composite
scores on Portfolio 17 were 9, 10, and 21. Raters 1 and 4 gave credit for components of
the artifact that were not explicitly stated, while Rater 7 noted, “The artifacts focused on
the first component of the standard, but there was little to nothing on the other
components.” This large discrepancy was an illustration of how scores varied so greatly.
107

Table 4.5 Results from Rater Commentary on Functions
Theme Sample comment(s)
Weak Number of Occurrences 44
Letter asking you to serve as mentor teacher demonstrates no mastery of standards.(S2P17R1)
Class rules not a good example (S5P9R1) Conference participation is good but does not demonstrate active leadership.
(S6P7R1) While attending board meetings is part of the job, attendance does not demonstrate
active understanding- no reflection included to tie it all together. (S6P9R1) Much more information would be needed to show mastery. (S5P17R7) Disposition useful for student. Not so useful in evaluating standards. (S5P9R1) Law paper and board agenda did not demonstrate standard 6 (S6P11R5) The only artifact provided - a list of 8 ways that a school has raised money.
(S3P24R7) The parent survey is not a true indicator if only 14 participants respond. (S6P25R5) The classroom artifact initially indicated that they had developed a theme, but later
referred to it as the mission. Both the classroom and internship artifacts were the same. (S1P3R5)
School law assignment was not totally accurate. The internship assignment was only a portion of the board minutes. (S4P3R5)
Artifact was an essay on the candidate’s leadership style which does not translate into a plan or any action based on data and needs (S1P24R7)
Confusing or Unclear Number of Occurrences 19
Role with vision was implied but not clear. (S1P5R1) Student implied role but did not document. (S2P21R1)
Misplaced or Incorrectly Aligned
Number of Occurrences 27
Disconnect between artifact submitted and standard (S4P5R1) Curriculum review, coach’s meeting agenda really didn’t reinforce standard 2
(S2P11R1) PowerPoint was about leadership functions more than nurturing and sustaining a
school culture or instructional program (S2P6R5) Artifacts represent school improvement as it relates to test scores, not building or
fostering community relationships (S4P6R5) Not sure Honor’s Night fits here. (S1P22R5) The student had a great overview of CCRPI and great pictures of classrooms, but
these artifacts did not fit the standard. (S1P27R5) Code of ethics video and school law paper do not demonstrate the student’s ability to
do it. (S5P27R5) The classroom artifact was a budget project that focused on receiving and expending
money. This is a limited view of budgeting and only one component of the standard. The internship artifact would have been more aligned with Standard 2. (S3P22R7)
The classroom artifact was the same for Standards 2 & 3 (P19R5) The internship artifact really did not address the standard (S3P3R5) I am not sure what a statement regarding an incident at school had to do with this
standard. (S6P8R5)
108

Theme Sample comment(s) Incomplete Number of Occurrences 71
Class assignment – NO SIP outside of school vision? (S1P18R5) Would have been a 5, but did not explain any differentiation (S2P18R1) CCRPI paper, agenda- incomplete- no planning, no vision and mission (S1P11R5) Duty roster and athletic budget did not ensure teacher time is focused to support
quality instruction (S3P11R5) Did not see a classroom artifact (S2P25R5) Very good artifacts; however, there was no mention of plan revision(S1P16R5) The internship artifact was incomplete, therefore, the ratings I gave may be lower
than they could have been if I had a complete picture. (S2P3R5) Goals were written but no plans to achieve them (S1P8R5) Few, if any, artifacts touched on human and technological resources.(S3, general, R7)
Table 4.5 continued
Theme Sample comment(s) Implied Number of Occurrences 12
Role- implied follow through lost 2 points. Monitor and evaluate (S1) process implied by process employed for planning. Much is implied by student’s role at school. Not clearly stated in reflection.
Other Number of Occurrences 8
The student had great artifacts of what the school was doing but nothing that the student created (S2P27R5)
Unable to open the link for classroom artifact (S5P3R5)
General Portfolio Comments
Reflections.
Finally, some raters provided general comments about the quality of artifacts and
how they viewed the overall portfolio. Four raters (Raters 1, 5, 7, and 9) mentioned that
portfolios with better introductions and reflections earned more points because the work
the intern had done was clearer. An example comment from Rater 9 on Portfolio 30 was,
“No rationale for why artifacts were included. No introduction or reflection. (It was) just
a series of reports with some original work by the student.” Portfolio 30 received
comprehensive scores of 56, 59, and 96 from a possible 177 points. Rater 1’s
commentary on Portfolio 5 was, “All reflections were weak and are generally only
summaries of what was included as an artifact-little thought was given to leadership
role/responsibility in relation to artifacts.” Portfolio 5’s comprehensive scores were 43,
109

77, and 55. Commentary that Rater 1 provided on Portfolio 7 (comprehensive scores 51,
130, and 148) indicated that the reflections were “generally weak and did not provide that
deep level of self-awareness you would hope to see. (The portfolio) could have been
strengthened by including information about what was most useful, what would be more
beneficial, next time, etc.” Sample commentary which raters gave about portfolios in
general is shown in Table 4.6, and positive commentary is shown in Table 4.7.
Table 4.6 General Commentary on Portfolios (Holistic)
Category Sample Commentary Weak Many artifacts were generic and not related to the student or the student’s ability.
Elements were all included but not much depth. Student had great artifacts but nothing that showed the student’s ability to initate,
collaborate, or master the 6 standards. (P27R5)
Confusing or Unclear Some artifacts were a little confusing. Standards 5 & 6 could have interchanged. Not sure of personal role in strategic plan, mostly theoretical. Collaborating with a team
on the test but not sure if (he) had a leadership role.
Incomplete Most of the standards would require numerous artifacts to show mastery. 1-2 artifacts for each is not enough because few artifacts would touch on all aspects of a standard unless it was a very detailed and comprehensive list.
Other Community is the most difficult piece to document-sensitivity to needs of parents can be
inferred to community at large, particularly in a small district. (S4P9R1) Difficult to open links, but I saw some attached artifacts. (P21 R5) Several grammatical errors. Did not use past tense when student should have.
(S2P14R5)
Table 4.7 Positive Commentary
Category Sample commentary Organization Thoughtful and well-organized portfolio.(P3R3)
Much easier to evaluate when documents are clearly labeled and grouped. (P1R9) So far I have reviewed 6 portfolios. This one was very informative, easy to move
through, and very organized. (P19R5)
Artifacts Overall good artifacts (R2P2) Powerpoint gave clear understanding of aspects of curriculum(S2P7R1) Curriculum review good indicator of understanding(2P9R1) Stronger standard because followed system plan (S3P5R1) Data analysis with follow-up presentation demonstrates good understanding of how it all
fits together in schools. (S3P7R1) School law assignment showed comprehensive understanding of legal issues (S6P7R1) I liked the data talks with students (S4P18R5) Very good classroom artifact- school improvement plan (S1P6R1) Good internship artifact (S1P25R5)
110

Category Sample commentary Good artifacts. The artifacts enhanced each other. (S2P8R5) Good rubric. Also, it was good to have one of your personal evaluations as an artifact.
(S5P8R5)
Reflections A well-written reflection-that is truly reflective in nature-does much to enhance demonstration of concepts. Artifacts are not sufficient. (R1, general)
Self-evaluation reflected understanding of how personal beliefs influence choices in regard to ethical, etc. (S5P7R1)
Reflection gives validity to self-evaluation documents (S5P9R1)
Clarity SIP information was clear and concise. (S1P7R1) Intro clearly states leadership role in relation to artifact (S4P7R1)
On the other hand, Rater 1 noted regarding Portfolio 26, “Well-written reflections,
truly reflective in nature, make it easy to recognize that the candidate has internalized and
applied course learning.” Portfolio comprehensive scores were 85, 116, and 177 for
Portfolio 26. Portfolio 9 also received positive commentary about the strength of the
portfolio. Rater 7 said, “Well-written reflections support the artifacts and truly
demonstrate an understanding of key leadership skills – next time I will…” However, the
positive commentary did not narrow the gap between comprehensive scores. The scores
were 83, 91, and 144 and did not demonstrate consistency in the way raters scored the
portfolio artifacts.
Organization.
Another general theme surrounded the idea of organization. Two raters
commented on Portfolio 10’s lack of organization. Rater 1 noted, “Organization - or lack
thereof - made it impossible to determine what was intended to represent which standard.
I could not locate introductions or reflections. I cannot justify assigning any category a
score higher than 2.” Rater 4 just scrawled, “Poorly organized…” and rated all categories
1. Comprehensive scores were 31, 62, and 62. Raters had either given all categories 1
point (no evidence) or 2 points (insufficient evidence) for Portfolio 10. Portfolio 12 also 111

received commentary about lack of organization. Rater 5 remarked, “This portfolio was
difficult to follow because of organization – (I) was finally able to locate all the artifacts.”
The comprehensive scores earned for Portfolio 12 were 100, 124, and 152. Organization
was an area that affected how portfolios were rated.
112

Observations.
A final group of commentaries that were noted were grouped as observations.
These were stand-alone comments that were reported by raters, although perhaps they
were only mentioned once. One such comment about Portfolio 5 from Rater 9
(comprehensive scores 55, 77, and 95) was that the portfolio “seemed hastily assembled
to meet minimum portfolio requirements.” Another comment (Portfolio 12,
comprehensive scores 100, 124, and 152) was from Rater 1, “Dispositions are not a
strong tool to evaluate standards.” Portfolio 16 (comprehensive scores 73, 104, and 145)
received this remark from Rater 5, “Meeting agendas do not demonstrate proficiency.”
Although these comments were given only once, they did provide insight as to the way
raters viewed artifacts with their introductions and reflections.
Summary
Weak artifacts, confusing or unclear artifacts, misplaced or incorrectly aligned
artifacts, incomplete artifacts, and implied artifacts contributed to discrepancies in scores
earned by participants in the Educational Leadership Specialist program at RSU. Poor
reflections lowered scores portfolios earned. Some raters gave credit for characteristics
while others did not. A number of raters gave full credit for all functions in a standard if
some of the functions were met, while other raters gave credit only for functions which
were explicitly represented. Raters also lacked agreement regarding quality of particular
artifacts. All of these issues led to poor consensus among the raters of these portfolios.
113

CHAPTER V
SUMMARY, CONCLUSION, AND FUTURE STUDIES
Summary
This researcher sought to determine the extent to which electronic portfolios were
evidence of mastery of the ISLLC standards and functions of students enrolled in an
educational leadership program when evaluated by intra-class correlation (Creswell,
2008; Creswell, Plano Clark, Gutmann, & Hanson, 2003; Tashakkori & Teddie, 1998)
and qualitative data (Lincoln & Guba, 1985) provided by the raters. The two-phase
sequential mixed-methods model (Creswell, 2003) was used to determine if any
agreement existed between rater scores (quantitative) and the rationale for scores given
(qualitative). The study was limited to the use of thirty portfolios from students who had
completed an Educational Leadership specialist program at a mid-sized university in the
southeastern United States. Raters were individuals who were involved in the Educational
Leadership department of this university and school district leaders who had earned
doctoral degrees in Educational Leadership. Each portfolio was evaluated three times by
different individuals. Thirty portfolios were randomly selected from a group of 42
available electronic portfolios. Then, the portfolios were randomly assigned to the raters.
Raters received copies of redacted electronic portfolios via flash drives prepared
by the principal investigator. After signing IRB and confidentiality documents, raters
were given 3-4 weeks to rate between 6 and 10 portfolios. Raters evaluated classroom
and internship artifacts, along with their introductions and reflections, on a 6-point
Likert-type scale, with the scale being 1=no evidence, 2=insufficient evidence, 3= some
114

evidence, 4=adequate evidence, 5=satisfactory evidence and 6=exemplary evidence
(Dittrich, Francis, Hatzinger, & Katzenbeisser, 2007). These rating scores provided
quantitative evidence of performance-based activities that educational leaders are
expected to know how to do, according to the ISSLC standards and functions. Some
raters evaluated more than the initial ten because some expected raters decided not to
participate in the study. Raters were also asked to give feedback as to which artifacts
offered more evidence of standard mastery and why. This feedback provided qualitative
information which was used to give additional insight to the quantitative findings
(Lincoln & Guba, 1985).
After receiving data from all raters, the principal investigator conducted tests to
determine normality of data. The two missing scores were deemed negligible.
Standardized scores (z-scores), skewness, kurtosis, and Shapiro-Wilks were analyzed in
order to determine if the data needed to be eliminated or transformed in order to reduce
Type I and Type II errors. Acceptable scores on all tests revealed no need to eliminate or
transform data (Field, 2009).
After determining normality, intra-class correlation was conducted on the scores
to determine how well different raters’ scores agreed that artifacts demonstrated mastery
of ISLLC functions. An intra-class correlation score of 0.7 was considered to be the
minimum acceptable score, 0.8 was considered good, and 0.9 was considered excellent
(Kirkegaard et al., 2006). None of the values showed strong agreement. The intra-class
correlation ranged from -.257 to .626. This suggested that no strong agreement was
found. A subsequent intra-class correlation was performed at the standard level, and the
115

agreement failed to meet the threshold of .7 as indicated by the range of ICC values from
.105 to .521.
The qualitative data was then coded and evaluated to determine if an explanation
could be found. Five themes emerged from the comments offered by raters regarding the
artifacts: weak, confusing/unclear, misplaced/incorrectly aligned, incomplete, and
implied. When a more in-depth evaluation was conducted, each of these themes revealed
discrepancies between raters about the earned scores. For example, in the Weak category,
Portfolio 6, Standard 2 received composite scores of 11, 35, and 45 of a possible 54
points. The artifacts were a copy of a PowerPoint about how to conduct a curriculum
audit and a copy of a school’s vision statement. Raters did not agree about the level at
which those artifacts demonstrated to what extent the candidate could perform the ISLLC
tasks and functions listed under Standard 2. Several examples were provided for each
theme.
Analysis of Research Findings
Although no evidence of agreement among raters was found, several explanations
emerged about the reasons for poor consensus among the raters. Some students included
artifacts which were weak, confusing or unclear, misplaced or incorrectly aligned,
incomplete, or implied. Additionally, some portfolios were so poorly organized that a few
raters did not even try to score them. Lack of agreement among the raters of these
portfolios was caused by one or a combination of several of these conditions.
116

Discussion of Research Findings
Some of the findings of this study compared positively with prior research, while
other components of the literature were not seen in the results. Researchers studying
dental portfolio reliability determined that portfolios could serve as a valid and reliable
measure for assessing student competencies (Gadbury-Amyot, 2003). However, this
present study did not result in quantitative data that confirmed the reliability of portfolios
as assessment instruments of performance-based tasks. Some raters in this study indicated
that scores were low because of missing elements relating to the standards, which
corroborated information from Hackman and Alsbury (2005). The results were described
as revealing a lack of essential curriculum content in portfolios. Raters in this study
mentioned missing and unclear evidence of mastery, which coincided with Hackman and
Alsbury’s results of missing information relating to the standards. Therefore evidence in
this study corroborated at least two of the Hackman and Alsbury findings, missing
evidence and unclear evidence.
On the other hand, Militello et al. (2009) suggested that principals found
internship experiences helpful in their preparation as school leaders; no research with this
study confirmed that report. However, another concept in the Militello study stated that
skills which leaders practiced must meet expectations held for them. The Militello
finding was confirmed in the present study from some of the commentary from the raters.
Several raters in this study commented on the poor quality of the artifacts collected.
Some artifacts with their reflections did not meet expectations of the raters of those
particular portfolios.
117

Artifact reflections were mentioned by the raters as being both enlightening and
ineffective. Quite a few comments from raters (1, 4, 7, & 9) indicated that reflections
were helpful for understanding how the candidates participated in the activity that
produced the artifacts. Rater 1 also stated that poor reflections did not help raters
understand how well the student understood how the artifacts and standards were related.
This finding was supported by Hackman and Alsbury (2005). The researchers noted an
absence of essential curriculum content being mentioned in reflections. When students
did not relate artifacts and standards together well in reflections, evidence that students
had mastered essential curriculum components was not provided.
When students’ reflections were well-developed, they revealed what students
knew and showed student’s understanding of how theoretical classwork and practical
application in leadership settings worked together (Turns et al., 2010). Evidence in this
study affirmed that finding. Rater 1 noted that well-written reflections show an
understanding of how key leadership skills connect to theory. Rater 1 was seeking
evidence of transformational leadership, which was not evident in many of the portfolios.
Rater 1 stated that the weak reflections did not provide a “deep level of self-awareness
you would hope to see” in a transformational leader. These findings were consistent with
Castelli’s (2011) research, which suggested that reflection is essential to practicing
transformational leadership. When students included a reflection which connected
artifacts with corresponding theory or theories, raters were able to give higher scores.
A final existing research piece was upheld by findings in this study. Hadley
(2007) utilized portfolio forums to assist students in creating stronger reflections and in
relating a proper balance between technical electronic portfolios and the learning process
118

which was foundational to utilization of technical skills. Complementary to that finding
was Rater 1’s note that Portfolio 5’s reflections were merely summaries and descriptions
of the artifacts and that little thought was given to how the artifacts related to leadership
roles and responsibilities. Strong leadership portfolio reflections were not simply
descriptions of artifacts. They contained philosophical underpinnings which related to
leadership theory and the individual demonstrating related skills and functions.
Practical implications emerged from the qualitative synopses provided. In some
cases, weak artifacts were presented that provided some evidence of understanding and
mastery of ISLLC standards, but raters disagreed to what extent individuals provided
evidence of their understanding. In other cases, raters noted confusing or unclear
artifacts. For example, one rater noted that just because a standard utilized the word
“data” in it, not all data applied. Students provided CRCT, EOCT, GHSGT, and other
testing data as evidence of collecting and analyzing data about a community and its
resources. Because of the wide range of scores earned on those artifacts, perhaps some of
the raters themselves did not understand the ISLLC standards and functions to the extent
necessary to perform a reliable rating.
Raters also mentioned other concerns regarding portfolios. These included weak
reflections and poor organization of the portfolios. Reflections were important because
they indicated self-awareness and situated the student within the artifact practice (Brody,
Vissa & Weathers, 2010; Drago-Severson et al., 2012; Hackman & Alsbury, 2005;
Lazaridou, 2009; Senge, 1999; Wildy & Wallace, 1998; Zimmerman, 2011). Some of the
raters suggested that students did not provide thoughtful reflections for the artifacts.
Several researchers suggested that portfolios lost part of their instructional value if
119
reflection of student learning was not provided. Raters pointed out that they marked poor
scores on portfolios which were more disorganized.
Possible improvements to utilizing electronic portfolios in an Educational
Leadership Specialist program to provide evidence of mastery of ISLLC standards might
be to engage school districts in conversation about what type of evidence might be more
useful in determining to what extent an educational leader is ready to lead schools (Fry,
Bottoms, & O’Neil, 2005). Additionally, extensive student training on creation, selection,
introduction, and reflection of artifacts might lead to decreased confusion for the raters
resulting in a more reliable instrument.
Conclusion
No evidence was found to suggest that portfolios were the best way to
demonstrate knowledge. Although the ratings of the 30 electronic did not reveal enough
agreement to consider them reliable as evidence of mastery of ISLLC standards, perhaps
more important knowledge was gained from the qualitative data which needs to be
addressed. From a pragmatic perspective (Onwuegbuzie & Leech, 2005; Tashakkori &
Teddle, 1998), the researcher sought to determine to what extent portfolios were a
reliable assessment to examine the mastery of ISLLC standards for those enrolled in an
Educational Leadership Specialist program. The researcher drew various conclusions
from this research project. First, students who participated in performance-based
programs which required a portfolio to document the action component needed to be
well-trained on the purpose of the portfolio and how to create its components. Second,
students enrolled in the Ed. S. Leadership program needed to internalize the importance
of reflection, as it is a practice which will assist them in creating a high-quality portfolio. 120

Third, extensive rater training and practice is essential to reliably scoring educational
leadership portfolios. If 90% of colleges and universities utilize portfolios in some
manner in their educational leadership programs, extensive research is essential to know
how to utilize these portfolios in the most effective manner possible. If universities are
going to continue to utilize performance-based tasks to prepare future educational
leaders, and if the electronic portfolio is going to continue to be the tool with which
performance data is collected and measured, then higher standards must be developed
and maintained in order to fulfill the spirit of performance-based initiatives.
Implications
Several groups of people were identified which would benefit from results of this
study. Instructional leaders of the Educational Specialist program at RSU may benefit
from informing participants of the philosophy, intent, importance, components, and
scoring of the portfolio. Instructors can work with students until they master the skill of
reflection, which will help them construct stronger portfolios, but reflective practice will
also make the students stronger educational leaders. Other universities which utilize
reflective electronic portfolios for documentation of ISLLC standards and functions will
be able to build stronger programs in the same manner as RSU if they develop reflective
practice among their educational leadership students. Additionally, students enrolled in
RSU’s Educational Specialist in Leadership program will benefit because they could see
usefulness in the portfolio process. This process involves thoughtfully selecting artifacts
and reflecting on how they relate to theoretical underpinnings as well as practical
implementation. Ultimately, elementary, middle, and high school students will benefit
from having stronger, more reflective leaders. 121

Recommendations
Several potential research topics are suggested in relation to future studies relating
to reliability of portfolios in Ed. S. Leadership programs. Reliability was not found in the
quantitative evaluations performed by these raters on the 30 Education Specialist
portfolios that were evaluated. However, this does not mean that portfolios have no place
in an educational specialist training program, and it does not mean that portfolios will
never be a reliable form of providing mastery of ISLLC standards and functions. The
following is a suggestion for future research projects:
1. Compare the rating system of Educational Leadership Specialist portfolios of
other mid-size universities.
2. Conduct a similar research project using just three raters from the Educational
Leadership Specialist department, and have all raters evaluate 30 portfolios.
Prior to evaluation, conduct extensive training and preliminary practice ratings
until consensus is reached about quality of the practice portfolios.
3. Replicate this study with two district leadership personnel and two professors
of Educational Leadership rating 30 portfolios (with practice ratings prior to
the actual study). Of interest to the researcher is whether or not educational
leaders in schools and professors in universities rate portfolios similarly. It
would be informative to compare the ways school district leadership and those
who teach educational leadership programs view artifacts as evidence of
standards mastery.
4. Survey suggestions from school district leadership as to what evidence
educational leadership candidates might provide to demonstrate proficiency of
122

the leader standards and functions could provide ideas and examples of
helpful internship tasks.
5. Conduct a pre- and post-training evaluation on scoring of artifacts with
extensive training on how to write reflections. This would inform the general
public about the importance of reflection in assembling a portfolio and would
also inform educational leadership candidates about the importance of
reflection as an educational leader.
6. Conduct a confirmatory factor analysis on the portfolio scores with student
GPA’s, GRE scores, portfolio scores, and leadership evaluations might offer
insight to reliability.
7. Conduct a replication study, but instead of having descriptors for the rating
scale, state the endpoint numbers and allow raters to place a mark along the
continuum at any point. Lack of specific descriptors might allow different
variability discovered in this study.
If this researcher duplicates this study, several changes will be considered. All
students involved in the Ed. S. Leadership program will receive adequate preliminary
training on how to create initial artifacts, integrate the artifacts with standards, introduce
each artifact adequately, and write reflections which indicate depth of knowledge of
theory and practice expected of an educational leader. These components of portfolios
will be formed together in class until student mastery is obtained. Adequate time will be
spent training students how to write exemplary reflections. All raters will receive
consistent and uniform training, working together on sample data until agreement on the
sample data can be achieved, which will potentially lead to more agreement on actual
123
portfolios. Professors in the education specialist leadership department will determine if
portfolios will be rated on a standard level or a function level, and then they will clearly
communicate that information to students as well as raters.
Dissemination
Results from this research will be sent to the Georgia Educational Research
Association to be reviewed for the October conference. This association encourages
presentation of research findings by new and experienced researchers. The American
Educational Research Association, the largest research conference in the United States, is
another research organization which will receive these discoveries. Additionally, the
findings will be sent to the Journal of Research on Leadership Education for possible
publication. This journal focuses on educational leadership training and research on
leadership preparation pedagogy. Readers of this journal might be interested in creating
stronger portfolios through the development of the reflective process.
Concluding Thoughts
As the researcher reflects on the two years of study and investigation, the question
which begs an answer is, “so what?” In the end, what did the researcher really find? The
most frequent train of thought emerges: If policy makers and those in charge really
believe that performance-based leadership training is the most effective way to prepare
educational leaders, and if designers of leadership specialist programs are truly
committed to the development of strong, reflective educational leaders, then results from
this study suggest that policy makers and program developers have much to accomplish.
It is imperative for those who develop educational leadership specialist programs to
124

determine if and how portfolios are to be used and to express those criteria clearly to
educational leadership specialist students, as well as to the raters who will be evaluating
the portfolios. It is incumbent upon those in positions of leadership to develop reflective
leaders by modeling and teaching reflective practice. Adequate feedback must be given to
expand the Ed. S. Leadership students’ visions for schools and districts. Most of all, Ed.
S. students must be coached to the point that practicing ISLLC leadership performance
standards are second nature.
In conclusion, here is a final thought. This poem was written by Robert D.
Abrahams in 1938 about events in Asia as World War II was beginning. The last stanza
speaks of apathy, and educators are sometimes prone to get tired and even apathetic.
Tonight Shanghai is burning, And we are dying too.
What bomb more surely mortal Than death inside of you?
For some men die by shrapnel, And some go down in flames,
But most men perish inch by inch, In play at little games.
No part of instructional leadership should be a “little” game played with our
thoughts, energy, time, or money. If the solution to developing excellent educational
leaders is by using performance-based portfolios, the portfolios must be created with a
purpose and product in mind, and must be perfect. All too often flash drives and compact
discs are submitted and wind up in a drawer in some cabinet without being evaluated for
evidence of mastery. Without feedback from instructional leaders, how can educational
specialist students master ISLLC performance standards? After all, what is important is
125
that educational leadership faculties prepare quality school leaders who perform with
distinction.
126

REFERENCES
Anderson, G. (2009). Advocacy leadership: Toward an authentic post reform agenda in education. Routledge: NewYork. ISBN 0415994284
Anderson, R. E., & Dexter, S. (2005). School technology leadership: An emperical investigation of prevalence and effect. Education Administration Quarterly, 42(49), 49-82.
Andrews, J. F., & Covell, J.A. (2006-2007). Preparing future teachers and doctoral-level leaders in deaf education: Meeting the challenge. American Annals of the Deaf, 151(5), 464-475.
Babo, G., & Ramaswami, S. (2011). Principal evaluation and the application of the ISLLC 2008 standards’ ‘functions’ by school superintendents: A national study. International Studies in Educational Administration, 39(3), 77-90.
Bair, M. A., & Bair, D. (2010). Scheduling inequality in math and science: How trimesters hurt students at risk of academic failure. American Secondary Education, 39(1), 78-94.
Bandura, A. (1977). Self-efficacy: Toward a unifying theory of behavioral change. Psychological Review, 84(2), 191.
Barton, J., & Collins, A. (1993). Portfolios in teacher education. Journal of Teacher Education, 44(3), 200-210.
Belanski, E. S., Cutforth, N., Delong, E., Ross, C., Scarbro, S., Gilbert, L., Beatty, B., & Marshall, J.A. (2009). Early impact of the federally mandated local wellness policy on physical activity in rural, low income elementary schools in Colorado. Journal of Public Health Policy, Supplement 1(30), S141-S160.
Bellei, C. (2009). Does lengthening the school day increase students’ academic achievement? Results from a natural experiment in Chile. Economics of Education Review, 28(5), 629-640.
Benson, B. P., & Barnett, S. P. (2005). Student-led conferencing using showcase portfolios. Thousand Oaks, CA: Corwin Press.
Berliner, D. C. (1990). What’s all the fuss about instructional time? The nature of time in schools. Theoretical Concepts, Practitioner Perceptions, 3-35.
Billot, J., Goddard, J., & Cranston, N. (2007). How principals manage ethnocultural diversity: Learnings from three countries. International Studies in Educational Administration, 35(2), 3-19.
127

Blumberg, A., & Greenfield, W. (1986). The effective principal: Perspectives on school leadership. Newton, MA: Allyn and Bacon, Longwood Division.
Bond, T. G., & Fox, C. M. (2013). Applying the Rasch model: Fundamental measurement in the human sciences. New York: Psychology Press.
Booren, L. M., & Handy, D. J. (2009). Students' perceptions of the importance of school safety strategies: An introduction to the IPSS survey. Journal of School Violence, 8(3), 233-250.
Borko, H., Michalec, P., Timmons, M., & Siddle, J. (1997). Student teaching portfolios: A tool for promoting reflective practice. Journal of Teacher Education, 48(5), 345-57.
Boske, C.A., & Benavente-McEnery, L. (2010). Taking it to the streets: A new line of inquiry for school communities. Journal of School Leadership. 20(3), 369-398.
Bosworth, K., Ford, L., & Hernandez, D. (2011). School climate factors contributing to student and faculty perceptions of safety in select Arizona schools. Journal of School Health 2011(4), 194-201.
Brady, R. C. (2003). Can failing schools be fixed? Washington, DC: Thomas B. Fordham Foundation.
Breault, D. A. (2010). Tethering one’s self to the pole of utility: A Deweyan critique of recent shifts in leadership preparation. School Practitioner Quarterly, 4(4), 294.
Brody, J. L., Vissa, J., & Weathers, J. M. (2010). School leader professional socialization: The contribution of focused observations. Journal of Research on Leadership Education 5(4), 611-651.
Brown, G., & Irby, B. J. (2001). The principal portfolio. Thousand Oaks, CA: Corwin.
Brown, J. S., Collins, A., & Duguid, P. (1989). Situated cognition and the culture of learning. Educational Researcher, 18(1), 32–42.
Bulkey, K. E., Christman, J. B., Goertz, M. E., & Lawrence, N. R. (2010). Building with benchmarks: The role of the district in Philadelphia’s benchmark assessment system. Peabody Journal of Education, 85(2), 186-204.
Buzzetto-More, N. (2010). Assessing the efficacy and effectiveness of an e-portfolio used for summative assessment. Interdisciplinary Journal of E-Learning and Learning Objects, 6, 61-85.
Cambridge, D. (2010). E-portfolios for lifelong learning and assessment. San Francisco, CA: Jossey-Bass Wiley.
128

Cambridge, D., Cambridge, B. L., & Yancey, K. B. (Eds.). (2009). Electronic portfolios 2.0: Emergent research on implementation and impact. Sterling, VA: Stylus Publishing, LLC.
Carroll, J. (1963). A model of school learning. The Teachers College Record, 64(8), 723-723.
Cassidy, W., Brown, K., & Jackson, M. (2012). ‘Under the radar’: Educators and cyberbullying in schools. School Psychology International, 33(5), 520-532.
Cave, E., & Wilkinson, C. (1992). Developing managerial capabilities in education. Managing change in education: Individual and organisational perspectives. Thousand Oaks, CA: SAGE Publications.
Cibulka, J. G. (2009). Declining support for higher-education leadership programs: An analysis. Peabody Journal of Education, 84(3), 453-466.
Coburn, C. E., & Turner, E. O. (2012). The practice of data use: An introduction. American Journal of Education, 18(2), 99-111.
Cohen, J. (1960). A coefficient of agreement for nominal scales. Educational and Psychological Measurement, 20(1), 37-46.
Cohen, J. (1968). Weighted kappa: Nominal scale agreement provision for scaled disagreement or partial credit. Psychological Bulletin, 70(4), 213.
Collins, L. (2003). Building caring communities through conflict resolution: The new challenge for principals. The Delta Kappa Gamma Bulletin, 69(2), 17-24.
Cotton, K. (2003). Principals and student achievement: What the research says. Alexandria, VA: Association for Supervision and Curriculum Development.
Council of Chief State School Officers (1996). Standards for School Leaders. Interstate School Leaders Licensure Consortium, Washington, D. C.
Council of Chief State School Officers (2008). Educational leadership policy standards: ISLLC 2008. Referenced from www.ccsso.org/ISLLC2008Research.
Creswell, J. W., Plano Clark, V. L., Gutmann, M. L., & Hanson, W. E. (2003). Advanced mixed methods research designs. Handbook of mixed methods in social and behavioral research, Thousand Oaks, CA: Sage.
Creswell, J. W. (2008, February). Planning a mixed methods study. Presentation to Social Work-Nursing Graduate Students, Ann Arbor, University of Michigan.
Croasmun, J. T., & Ostrom, L. (2011). Using Likert-type scales in the social sciences. Journal of Adult Education, 40(1), 19-22.
129

Crotty, M. (1998). The foundation of social research: Meaning and perspective in the research process. London: Sage.
Crow, T. (2011). The view from the seats. Journal of Staff Development, 32(6), 24-28.
Cunningham, W. G., & Sherman, W. H. (2008). Effective internships: Building bridges between theory and practice. Educational Forum, 72(4), 308-318.
Darling-Hammond, L., & Snyder, J. (2000). Authentic assessment of teaching in context. Teaching and Teacher Education, 16(5), 523-545.
Davies, S. J. (1998). The jurisprudence of willfulness: An evolving theory of excusable ignorance. Duke Law Journal, 48, 341- 342.
Davis, S., Darling-Hammond, L., LaPointe, M., & Meyerson, D. (2005). Review of research: School leadership study developing successful principals. Stanford Educational Leadership Institute. Referenced from www.wallacefoundation.org.
Demir, K. (2008). Transformational leadership and collective efficacy: The moderating roles of collaborative culture and teachers’ self-efficacy. Egiyun Arastirmalari Eurasian Journal of Educational Research, 33, 93-112.
Derham, C., & Diperna, J. (2007). Digital professional portfolios of preservice teaching: An initial study of score reliability and validity. Journal of Technology and Teacher Education, 15(3), 363-381.
Devos, G., & Bouckenooghe, D. (2009). An exploratory study on principals’ conceptions about their role as school leaders. Leadership and Policy in Schools, 8, 173-196.
Dittrich, R., Francis, B., Hatzinger, R., & Katzenbeisser, W. (2007). A paired comparison approach for the analysis of sets of Likert-scale responses. Statistical Modelling, 7(1), 3- 28.
Drago-Severson, E. (2007). Helping teachers learn: Principals as professional development leaders. Teachers College Record, 109(1), 70-125.
Drago-Severson, E. (2011). Conceptual changes in aspiring school leaders: Lessons from a university classroom. Journal of Research on Leadership Education, 6(4), 83-132.
Drago-Severson, E., Asghar, A., Blum-DeStefano, J., & Welch, J. R. (2012). The need for principal renewal: The promise of sustaining principals through principal to principal reflective practice. Teacher College Board, 114, 1-58.
Drake, T. L., & Roe, W. H. (1994). School business management: Supporting instructional effectiveness. New York, NY: Allyn and Bacon.
130

Draney, K. (1995). Objective measurement: Theory into practice (Vol. 3). M. Wilson, & G. Engelhard, Jr. (Eds.). Norwood, NJ: Ablex Publishing Corporation.
Du, F. (2007). A case study of teacher leaders as group leaders: Implications of research and teacher education. The Teacher Educator, 42(3), 185-209.
Dufresne, P., & McKenzie, A. S. (2009). A culture of ethical leadership. Principal Leadership, 10(2), 36-39.
Duke, D. L. (2010). The challenges of school district leadership. New York, NY: Routledge.
Duquette, C., Orders, S., Fullarton, S., & Robertson-Grewal, K. (2011). Fighting for their rights: Advocacy experiences of parents of children identified with intellectual giftedness. Journal for the Education of the Gifted, 34(3), 488-512.
Ellett, C. D. (1978). Understanding and using the Georgia Principal Assessment System (GPAS). CCBC Notebook, 7(2).
Epstein, J. L. (2010). Teamwork is the key: The national network of partnership school National Civic Review, 99(2), 21-29.
Erlandson, D. A. (1990). Performances standards for the principalship: Emergence of a viable model. School Organization, 10(1), 17.
Essex, N. L. (2001). The limits of zero tolerance. Principal Leadership, 1(8), 5-7.
Evans, S., Daniel, T., Mikovch, A., Metze, L., & Norman, A. (2006). The use of technology in portfolio assessment of teacher education candidates. Journal of Technology and Teacher Education, 14(1), 5-27.
Field, A. (2009). Discovering statistics using SPSS. London, England: Sage publications.
Fleiss, J. L., Cohen, J., & Everitt, B. S. (1969). Large sample standard errors of kappa and weighted kappa. Psychological Bulletin, 72(5), 323.
Fook, C. Y., & Sidhu, G. K. (2010). Authentic assessment and pedagogical strategies in higher education. Journal of School Sciences, 6(2), 153-161.
Freed, J. E., & Huba, M. E. (2000). Learner-centered assessment on college campuses: Shifting the focus from teaching to learning. Needham Heights, MA: Allyn & Bacon.
Frick, W. C. (2011). Practicing a professional ethic: Leading for students’ best interests. American Journal of Education, 117(4), 527-562.
131

Fry, B., Bottoms, G., & O’Neill, K. (2005, April). The principal internship: How can we get it right? Atlanta, GA: Southern Regional Education.
Gadbury-Amyot, C. C., Kim, J., Palm, R. L., Mills, G. E., Noble, E., Overman, P. R. (2003). Validity and reliability of portfolio assessment of competency in a baccalaureate dental hygiene program. Journal of Dental Education, 67(9), 991-1002.
Georgia Professional Standards Commission. (2012). 505-3-.58. Educational leadership, certification rules. Atlanta, GA: GaPSC.
Glass, W. N. (1962). Administrative requirements of principals and superintendents. Canadian Education and Research Digest, 5(2), 243-252.
Glatter, R. (2009). Wisdom and bus schedules: Developing school leadership. School Leadership and Management, 29(3), 225-237.
Glover, D., & Miller, D. (1999). The working day of the subject leader: And the impact of interruptions on teaching and learning in secondary schools. Research in Education, 62(1), 55-65.
Goddard, R. D., LoGerfo, L., & Hoy, W. K. (2004). High school accountability: The role of perceived collective efficacy. Educational Policy, 18(3), 403-425.
Goren, P. (2012). Data, data, and more data—What’s an educator to do? American Journal of Education, 118(2), 233-237. Stable URL: http://www.jstor.org/stable/11086/6632730
Green-Powell, P. A., Hilton, A. A., & Joseph, C. L. (2011). Creating collaborative partnership with local churches to improve academic performance of K-12 public schools. US-China Education Review, 8(1), 64-69.
Griffin, D., & Steen, S. (2010). School-family-community partnerships: Applying Epstein’s theory of the six types of involvement to school counselor practice. Professional School Counseling, 13(4), 218-226.
Guerra, P. L., & Nelson, S. W. (2009). Changing professional practice requires changing belief. Phi Delta Kappan, 90(5), 354-360.
Gulikers, J. T., Bastiaens, T. J., & Kirschner, P. A. (2004). A five dimensional framework for authentic assessment. Educational Technology Research & Development, 52(3), 67-85.
Gwet, K. L. (2012). Handbook of inter-rater reliability: The definitive guide to measuring the extent of agreement among multiple raters. Gaithersburg, MD: Advanced Analytics Press. http://irrsas.advancedanalyticsllc.com/index.html
132

Hackman, D. G., & Alsbury, T. L. (2005). Standards-based leadership preparation program improvement through the use of portfolio assessments. Educational Considerations, 32(2), 36-45.
Hadley, N. (2007). The portfolio forum: Power in reflection. Journal of Educational Technology Systems, 35(4), 449-455.
Hair, J. F., Anderson, R. E., Tatham, R. L., & Black, W. C. (1995). Multivariate data analysis with readings. Englewood Cliffs, NJ: Prentice-Hall.
Hale, E. L., & Moorman, H. N. (2003). Preparing school principals: A national perspective on policy and program innovations. Edwardsville, IL: Institute for Educational Leadership, Washington, DC and Illinois Education Research Council.
Hallinger, P. (2005). Instructional leadership and the school principal: A passing fancy that refuses to fade away. Leadership and Policy in Schools, 4, 221-229. doi:10.1080/15700760500244793
Hallinger, P., & Heck, R. H. (1996). Reassessing the principal’s role in school effectiveness: A review of empirical research. Educational Administration Quarterly, 32(1), 5-44.
Hallinger, P., & Heck, R. H. (1998). Exploring principal’s contribution to school effectiveness: 1980-1995. School Effectiveness and School Improvement, 9(2), 157-191.
Harn, B. A., Linan-Thompson, S., & Roberts, G. (2008). Intensifying instruction: Does additional instructional time make a difference for the most at-risk first graders? Journal of Learning Disabilities, 41(2), 115-125.
Harvard Law Review. (2012). First amendment-student speech-third circuit applies Tinker to off-campus student speech. J. S. ex rel. Snyder v. Blue Mountain School District, 650 F.3d 915 (3rd Cir. 2011) (en banc), 125(4), 1064-1071. ISSN0017811X Accession Number 71839995
Herman, P., Wardrip, P., Hall, A., & Chimino, A. (2012). Teachers harness the power of assessment: Collaborative use of student data gauges performance and guides instruction. Journal of Staff Development, 33(4), 26-29.
Herrington, J., & Herrington, A. (1998). Authentic assessment and multimedia: How university students respond to a model of authentic assessment. Higher Education Research & Development, 17(3), 305-322.
Herrington, J., & Oliver, R. (2000). An instructional design framework for authentic learning environments. Educational Technology Research and Development, 48(3), 23-48.
133

Hinduja, S., & Patchin, J. W. (2011). Cyberbullying: A review of the legal issues facing educators. Preventing School Failure, 55(2), 71-78.
Hines III, M. T. (2007). The effect of leadership style on preservice concerns about becoming a principal. Educational Leadership and Administration, 19, 103-116.
Hines III, M. T. (2008). Postservice principals’ post-internship concerns about becoming a principal: America and Scotland in review. Educational Consultations, 36(1), 1-5.
Hoff, D. L., Yoder, N., & Hoff, P. S. (2006). Preparing educational leaders to embrace the “public” in public schools. Journal of Educational Administration, 44(3), 239-249.
Hollingworth, L., Dude, D. J., & Shepherd, J. K. (2010). Pizza parties, pep rallies and practice tests: Strategies used by high school principals to raise percent proficient. Leadership and Policy in Schools, 9, 162-178.
Hoppey, D., & McLeskey (2010). A case study of principal leadership in an effective inclusive school. The Journal of Special Education, 46(4), 245-256.
Horng, E. L., Klasik, D., & Loeb, S. (2010). Principal’s time use and school effectiveness. American Journal of Education, 116(4), 491-523.
Horng, E., & Loeb, S. (2010). New thinking about instructional leadership. Phi Delta Kappan, 92(3). 66-69.
Hoyle, J. R., English, F., & Steffy, B. (1985). Skills for successful leaders. Arlington, VA: American Association of School Administrators.
Hulpia, H., & Devos, G. (2009). Exploring the link between distributed leadership and job satisfaction of school leaders. Educational Studies, 35(2), 153-171.
Hulpia, H., Devos, G., & Van Keer, H., (2011). The relation between school leadership from a distributed perspective and teachers’ organizational commitment: Examining the source of the leadership function. Education Administration Quarterly, 47(5), 728-771.
Robers, R., Zhang, J., Truman, J., & Snyder, T. (2011). Indicators of school crime and safety. Washington, D. C., National Center for Education Statistics. NCJ 236021.
Jantzi, D., & Leithwood, K. (1996). Toward an explanation of variation in teachers' perceptions of transformational school leadership. Educational Administration Quarterly, 32(4), 512-538.
Jean-Marie, G., Ruffin, V., & Burr, K. (2010). Leading across boundaries: The role of community schools and cross-boundary leadership in school reform. New
134
Perspectives in Educational Leadership: Exploring Social, Political, and Community Contexts and Meaning. New York, NY: Peter Lang.
Johnson, R. L., Green, S. K., Kim, D. H., & Pope, N. S. (2008). Educational leaders’ perceptions about ethical practices in student evaluation. American Journal of Evaluation, 29(4), 520-530.
Johnson, S., & Sommer, P. (2012). Keller Independent School District recognized by Texas Award for Performance Excellence. The Journal for Quality and Participation, 34(4), 34-36.
Kezar, A. (2008). Understanding leadership strategies. The Journal of Higher Education, 79(4), 406-441.
Kirby, P. C., Paradise, L. V., & King, M. L. (1992). Extraordinary leaders in education: Understanding transformational leadership. Journal of Educational Research. 85(5). 303-311
Kirkegaard, T., Edwards, J., Tovey, S., McGlynn, L. M., Krishna, S. N., Mukherjee, R., ... & Bartlett, J. M. S. (2006). Observer variation in immunohistochemical analysis of protein expression, time for a change? Histopathology, 48(7), 787-794.
Kinney, P. (2009). Safety relies on climate. Principal Leadership, 9(5), 54-55.
Kouzes, J. M., & Posner, B. Z., (2007). The leadership challenge. San Francisco, CA: Jossey-Bass.
Lazaridou, A. (2009). The kinds of knowledge principals use: Implications for training. International Journal of Educational Policy and Leadership, 4(10). 1-15.
Leech, D., & Fulton, C. (2008). Faculty perceptions of shared decision making and the principal’s leadership behaviors in secondary schools in a large urban district. Education, 128(4), 630-644.
Leithwood, K., & Jantzi, D. (1999). The relative effects of principal and teacher sources of leadership on student engagement with school. Educational Administration Quarterly, 35(5), 679-706.
Leithwood, K., & Jantzi, D. (2005). A review of transformational school leadership research 1996-2005. Leadership & Policy in Schools, 4(3), 177-199.
Leithwood, K., & Jantzi, D. (2006). Transformational school leadership for large-scale reform: Effects on students, teachers, and their classroom practices. School Effectiveness and School Improvement, 17(2), 201-227.
135
Leithwood, K., Jantzi, D., & McElheron-Hopkins, C. (2006). The development and testing of a school improvement model. School Effectiveness and School Improvement, 17(4), 441-464.
Leithwood, K. A., Louis, K. S., Anderson, S., & Wahlstrom, K. (2004). Review of research: How leadership influences student learning. Toronto, Canada: University of Minnesota.
Leithwood, K., & Mascall, B. (2008). Collective leadership effects on student achievement. Educational Administration Quarterly, 44(4), 529-561.
Leithwood, K., Patten, S., & Jantzi, D. (2010). Testing a conception of how school leadership influences student learning. Education Administration Quarterly, 46(5).
Levine, A. (2005). Educating school leaders. New York, NY: Education Schools Project.
Lickona, T., & Davidson, M. (2005). Smart & good high schools: Integrating excellence and ethics for success in school, work, and beyond. Center for the 4th and 5th R’s (Respect and Responsibility). Washington, D. C.: Character Education Partnership.
Lindahl, R. A. (2010). Differences in principals’ leadership behavior in high- and low- performing schools. Journal of Leadership Studies, 5(4), 34-45.
Little, J. (2012). Understanding data practice among teachers: The contribution of micro-process studies. American Journal of Education, 118(2), 143-166. Retrieved from http://www.jstor.org/stable/10.1086663271
Louis, K. S., & Wahlstrom, K. (2011). Principals as cultural leaders. Phi Delta Kappan, 92(5), 52-56.
Lovitt, T. C. (2010). What teachers can do for children living in difficult circumstances. Intervention in School and Clinic 45(5), 317-320.
Lozano, L. M., Garcia-Cueto, E., & Muniz, J. (2008). Effect of the number of response categories on the reliability and validity of rating scales. Methodology, 4(2), 73-79.
Lynch, J. (2012). Responsibilities of today’s principal: Implications for principal preparation programs and principal certification policies. Rural Special Education Quarterly, 31(2), 40-47.
Lyons, N. (1998). With portfolio in hand: Validating the new teacher professionalism . New York, NY: Teachers College Press.
136
MacBeath, J. (2005). Leadership as distributed: A matter of practice. School Leadership and Management, 25(4), 349-366.
Marburger, D. R. (2006). Does mandatory attendance improve student performance? The Journal of Economic Education, 37(2), 148-155.
Markham, S. & Hurst, J. (2009). Re-assessing validity and reliability in the E-learning environment. In C. Spratt & P. Lajobcyger (Ed. S.) E-Learning Technologies and Evidence-based Assessment Approaches (pp. 1-19). Hershey, PA: Information Science Reference.
Marks, H. M., & Printy, S. M. (2003). Principal leadership and school performance: An integration of transformational and instructional leadership. Educational Administration Quarterly, 39(3), 370-397.
Marzano, R. J. (2000). Transforming classroom grading. Aurora, CO: Mid-continent Regional Educational Laboratory.
Marzano, R. J., Pickering, D., & McTighe, J. (1993). Assessing student outcomes: Performance assessment using the dimensions of learning model. Alexandria, VA: Association for Supervision and Curriculum Development.
Marzano, R. J., Waters, T., & McNulty, B. A. (2005). School leadership that works: From research to results. Alexandria, VA: Association for Supervision and Curriculum Development.
Masci, F. J., Cuddpaph, J. L., & Pajak, E. F. (2008). Becoming an agent of stability: Keeping your school in balance during the perfect storm. American Secondary Education, 36(2), 57-68.
Mason, R. W., & Schoreder, M. P. (2010). Principal hiring practices: Toward a reduction of uncertainty. The Clearing House, 83(5), 186-193.
Maudsley, G. (2011). Mixing it but not mixed-up: Mixed methods research in medical education (A critical narrative review). Medical Teacher, 33. 92-104.
Maxwell, J. C. (2005). Developing the leaders around you: How to help others reach their full potential. Nashville, TN: Nelson.
May, H., & Supovitz, J. A. (2011). The scope of principal efforts to improve instruction. Education Administration Quarterly, 47(2), 332-352.
McCleary, L. (1979). Evaluation of principals. Theory Into Practice, 18(1), 45-49.
Meadows, R., & Dyal, A, (2000). Implementing portfolio assessment in the development of school administrators: Improving preparation for educational leadership. Education, 120(2), 304-314.
137

Meadows, R., Dyal, A., & Wright, J. (1998) Preparing educational leaders through the use of portfolio. Journal of Instructional Psychology, 25(2).
Miles, M. B., & Huberman, A. M. (1984). Qualitative data analysis: A sourcebook of new methods. In Qualitative data analysis: a sourcebook of new methods; Qualitative data analysis: a sourcebook of new methods. Thousand Oaks, CA: Sage publications.
Militello, M., Gajda, R., & Bowers, A. J. (2009). The role of accountability policies and alternative certification on principals’ perceptions of leadership preparation. Journal of Research on Leadership Education, 4(2), 30-66.
Mirk, P. (2009). Ethics by example. Principal Leadership, 10(2), 18-23.
Moerkerke, G., Doorten, M., & de Roode, F. A. (1999). Constructie van toetsen voor competentiegericht curricula [Construction of assessments for competency-based curricula] (OTEC report 1999/W02). The Netherlands: Open University of the Netherlands Educational Technology Expertise Center.
Mohn, C., & Machell, J. (2005). Reconceptualizing school leader learning: Blurring the lines between staff development and university-based principal preparation programs. Planning and Changing, 36(1&2), 120-127.
Norman, G. (2010). Likert scales, levels of measurement and the “laws” of statistics. Advances in Health Sciences Education, 15(5), 625-632.
Norton, M. S. (2004). Student learning portfolios: How they are being implemented in educational administration preparation programs. Planning and Changing, 35(3&4), 223-235.
Nygaard, R. (2010). Sources of confidence in school community councils. The School Community Journal, 20(2), 137-158.
-- Building community, respect and achievement. Principal Leadership, 11(9), 68-72, 74.
Onwuegbuzie, A. J., & Leech, N. L. (2005). On becoming a pragmatic researcher: The importance of combining quantitative and qualitative research methodologies. International Journal of Social Research Methodology, 8(5), 375-387.
Oppenheim, A. N. (1992). Questionnaire design, interviewing and attitude measurement. (2nd ed.). London: Continuum.
Park, J. J., & Denson, N. (2009). Attitudes and advocacy: Understanding faculty views on racial/ethnic diversity. The Journal of Higher Education, 80(4), 415-438.
138

Patton, M. C. (2008). Principles for principals: Using the realms of meaning to practice ethical leadership—national recommendations. National Forum of Applied Educational Research Journal, 21(3), 1-8.
Paulson, F., Paulson, P., & Meyer, C. (1991). What makes a portfolio a portfolio? Educational Leadership, 48(5), 60-63.
Phillips, G. (1996). Classroom rituals for at-risk learners. Vancouver, BC: Educserv, British Columbia School Trustees Publishing.
Presthus, A. M. (2006). A successful school and its principal—Enabling leadership within the organization. International Studies in Educational Administration, 34(2), 82-99.
Printy, S. M. (2008). Leadership for teacher learning: A community of practice perspective. Educational Administration Quarterly, 44(2), 187-226.
Popham, W. J. (2009). Instruction that measures up: Successful teaching in an age of accountability. Alexandria, VA: ASCD.
Posner, K. L., Sampson, P. D., Caplan, R. A., Ward, R. J., & Cheney, F. W. (1990). Measuring inter-rater reliability among multiple raters: An example of methods for nominal data. Statistics in Medicine, 9(9), 1103-1115.
Pryor, C. R. (2010). How democratic practitioners can address school bullying: An imperative for educational leaders. School Practitioner Quarterly, 4(4), 364-366.
Quong, T., & Walker, A. (2010). Seven principles of strategic leadership. International Studies in Education Administration, 38(1), 22-34.
Redish, T., Webb, L., & Jiang, B. (2005-2006). Design and implementation of a web-based portfolio for aspiring educational leaders: A comprehensive, evidence-based model. Journal of Educational Technology Systems, 34(3), 283-295.
Reames, E. (2010). Shifting paradigms: Redesigning a principal preparation program’s curriculum. Journal of Research on Leadership Education, 5(12.5), 436-459.
Reardon, R. M. (2011). Elementary school principals’ learning-centered leadership and educational outcomes: Implications for principals’ professional development. Leadership and Policy in Schools, 10, 63-83.
Ross, J. A., & Gray, P. (2006). Transformational leadership and teacher commitment to organizational values: The mediating effects of collective teacher efficacy. School Effectiveness and School Improvement, 17(2), 179-199.
139

Rossman, G. B., & Wilson, B. L. (1985). Numbers and words combining quantitative and qualitative methods in a single large-scale evaluation study. Evaluation Review, 9(5), 627-643.
Rousmaniere, K. (2007). Go to the principal’s office: Toward a social history of the school principal in North America. History of Education Quarterly, 47(1), 1-22.
Rud, A. G., & Garrison, J. (2010). Leading schools with reverence. The Educational Forum, 74(2), 143-167.
Salazar, P. S. (2007). The professional development needs of rural high school principals: A seven-state study. The Rural Educator, 28(3), 20-26.
Savery, J. R., & Duffy, T. M. (1995). Problem based learning: An instructional model and its constructivist framework. Educational Technology, 35(5), 31-38.
Schafer, W. D., Lissitz, R. W., Zhu, X., Zhang, Y., Hou, X., & Li, Y. (2012). Evaluating teachers and schools using student growth models. Practical Assessment, Research & Evaluation, 17(17), 1-21.
Schrum, L., & Levin, B. (2013). Teachers’ technology professional development: Lessons learned from exemplary schools. TechTrends, 57(1), 38-42.
Shulman, L. S. (1998). Teacher portfolios: A theoretical activity. With portfolio in hand, Nona M. Lyons (Ed.). New York: Teachers College Press.
Sebastian, J., & Allensworth, E. (2012). The influence of principal leadership on classroom instruction and student learning: A study of mediated pathways to learning. Educational Administration Quarterly, 48(4), 626-663.
Senge, P. M. Kleiner. A., Roberts C., Ross R., Roth G. and Smith B. (1999). The Dance of Change: The Challenges to Sustaining Momentum in Learning Organization. New York, NY: Doubleday.
Sheldon, S. B., & Epsetin, J. L. (2005). Involvement counts: Family and community partnerships and mathematics achievement. The Journal of Educational Research, 98(4), 196-206.
Shen, J., Cooley, V. E., Reeves, P., Burt, W. L., Ryan, L., Rainey, J. M., &Yuan, W. (2010). Using data for decision-making: Perspectives from 16 principals in Michigan, USA. International Review of Education, 56, 435-456.
Shepherd, C. E. & Hannafin, M. J. (2013). Reframing portfolio evidence: Empowering teachers through single-case frameworks. Journal of Thought, 48(1). 33-51.
Shipman, N. J, Queen, J. A., & Peel, H. A. (2007). Transforming school leadership with ISLLC and ELCC. Larchmont, NY: Eye on Education, Inc.
140

Shoukri, M. M. (2010). Measures of interobserver agreement and reliability. New York, NY: Taylor & Francis.
Shoukri, M. M., Asyali, M. H., & Donner, A. (2004). Sample size requirements for the design of reliability study: Review and new results. Statistical Methods in Medical Research, 13, 251-271.
Shrout, P. E., & Fleiss, J. L. (1979). Intraclass correlations: Uses in assessing rater reliability. Psychological Bulletin, 86(1), 420-428.
Smith, D. (2010). Developing leaders using case inquiry. Scholar-Practitioner Quarterly, 4(2), 104-124.
Spillane, J. P. (2010). Data in practice: Conceptualizing the data-based decision-making phenomenon. American Journal of Education, 118(2), 113-141.
Starratt, R. J. (2005). Responsible leadership. The Educational Forum, 69(2), 124-133.
Stewart, D. (2005). The place of law in the leadership and management of schools. Education and the Law, 17(4), 127-136.
Strom, P. S., & Strom, R. D. (2003). Uniting adolescent support systems for safe learning environments. The Educated Forum, 67(2), 164-173.
Tashakkori A., & Teddle, C. (1998). Mixed methodology: Combining qualitative and quantitative approaches. London: Sage.
Timperly, H. (2011). Knowledge and the leadership of learning. Leadership and Policy in Schools, 10(none), 145-170. doi:10.1080/15700763.2011.557519
Tochel, C., Haig, A., Hesketh, A., Cadzow, A., Beggs, K., Colthart, I., & Peacock, H. (2013). The effectiveness of portfolios for post-graduate assessment and education: BEME guide No. 12. Medical Teacher, 31(4), 320-339.
Tyre, A., Feuerborn, L., & Pierce, J. (2011). Schoolwide intervention to reduce chronic tardiness at the middle and high school levels. Preventing School Failure, 55(5), 132-139.
United States National Commission on Excellence in Education. (1983). A nation at risk: The imperative for educational reform: A report to the nation and the Secretary of Education, United States Department of Education. Washington, D.C.: The Commission.
Vannest, K. J., & Hagan-Burke, S. (2010). Teacher time use in special education. Remedial and Special Education, 31(2), 126-142.
141

Walter, S. D., Eliasziw, M., & Donner, A. (1998). Sample size and optimal designs for reliability studies. Statistics in Medicine, 17, 101-110.
Marzano, R. J., Waters, T., & McNulty, B. A. (2005). School leadership that works: From research to results. Alexandria, VA: Association for Supervision and Curriculum Development.
Wiedmer, T. L. (2007). Highly qualified instructional supervisors: A case for standards-driven and experiential learning. Delta Kappa Gamma Bulletin, 74(1).
Wiggins, G. (1989). A true test. Phi Delta Kappan, 70(9), 703-713.
Wildy, H., & Wallace, J. (1998). Professionalism, portfolios and the development of school leaders. School Leadership and Management, 18(1), 123-140.
Winton, S., & Pollock, K. (2013). Preparing politically savvy principals in Ontario, Canada. Journal of Educational Administration, 51(1), 40-54.
Worthen, B. R., Borg, W. R., & White, K. (1993). Measurement and evaluation in the schools. New York, NY: Longman.
Wright, A., & Saks, J. (2000). The community connection: Case studies in public engagement. Alexandria, VA: National School Boards Association.
Zimmerman, J. (2011). Principals preparing for change: The importance of reflection and professional learning. American Secondary Education, 29(2), 107-114.
142

APPENDIX A
RATER RECRUITMENT LETTER
143

Dear (name of potential rater), This mid-size university in Southeast United States’ Ed. S. program utilizes the
electronic portfolio as documentation of mastery of the ISLLC Leader Standards in its performance-based program. As a doctoral candidate in this Educational Leadership program, my dissertation is an inter-rater reliability study on the use of portfolios as performance indicators. This study will involve 30 portfolios being rated three times each. I am recruiting ten raters (each will rate nine randomly- assigned portfolios). The time requirements will be as follows:
1. One hour training program – (offered at three different times; you choose the
one training session most convenient for you) - Snacks and door prizes will be included. Door prizes include gift cards to various restaurants and places of business, a cell phone, a hard drive, and similar tokens of appreciation.
2. Rate nine portfolios- delivered via flash drive- Each should take between one
and two hours to rate, according to preliminary trials completed by the principal investigator. These should be rated within a three week window of time, to be determined by the principal investigator. Rating sheets have 31 items to be rated on a 6-point Likert-type scale.
3. Return flash drives and rating sheets to the principal investigator.
In order to protect your privacy, all evaluations will go directly to me, the
principal investigator. Links between evaluators (raters) and evaluations will be protected from others.
Thank you for assisting in this research endeavor, which I believe will broaden
existing research on the utilization of portfolios as performance mastery indicators. I look forward to hearing a positive response from you via email at [email protected].
Sincerely, Cindy Bowen
144
APPENDIX B
RATING INSTRUMENTS
145

ISLLC Leader Standards Rating Rubric Portfolio # _________
Instructions: For each leader standard function, circle the point value that best
describes how the portfolio demonstrates performance indicators given. Use the following scale.
No evidence The function is not addressed.
Insufficient evidence Minimum evidence is given to support mastery of the function.
Some Evidence Some evidence is given to support mastery of the function.
Adequate Evidence Reasonable evidence is given to support mastery of the function
Satisfactory evidence Significant evidence is given to support mastery of the function.
Exemplary evidence Specific, extensive evidence is shown to support mastery of the function.
146

Leader Standard I
An education leader promotes the success of every student by facilitating the development, articulation, implementation and stewardship of a vision of learning that is shared and supported by all stakeholders.
The portfolio demonstrates student’s ability to N
o
Insu
ffic
ient
Som
e
Ade
quat
e
Satis
fact
ory
Ex
empl
ary
Collaboratively develop and implement a shared vision and mission Collect and use data to identify goals, assess organizational effectiveness, and promote organizational learning
Create and implement plans to achieve goals Promote continuous and sustainable improvement Monitor and evaluate progress and revise plans
Leader Standard 2
An education leader promotes the success of every student by advocating, nurturing and sustaining
a school culture and instructional program conducive to student learning and staff professional growth. The portfolio demonstrates student’s ability to N
o
Insu
ffic
ient
Som
e
Ade
quat
e
Satis
fact
ory
Exem
plar
y
Nurture and sustain a culture of collaboration, trust, learning, and high expectations
Create a comprehensive, rigorous, and coherent curricular plan Create a personalized and motivating learning environment for students Supervise instruction Develop assessment and accountability systems to monitor student progress Develop the instructional and leadership capacity of staff Maximize time spent on quality instruction Promote the use of the most effective and appropriate technologies to support teaching and learning
Monitor and evaluate the impact of the instructional program
Leader Standard 3
An education leader promotes the success of every student by ensuring management of the
organization, operations, and resources for a safe, efficient, and effective learning environment.
147

The portfolio demonstrates student’s ability to
No
evid
ence
Insu
ffic
ient
Evi
denc
e So
me
Evid
ence
A
dequ
ate
Evid
ence
Sa
tisfa
ctor
y Ev
iden
ce
Exem
plar
y Ev
iden
ce
Monitor and evaluate the management and operational systems Obtain, allocate, align, and efficiently utilize human, fiscal, and technological resources
Promote and protect the welfare and safety of students and staff Develop the capacity for distributed leadership Ensure teacher and organizational time is focused to support quality instruction and student learning
Leader Standard 4
An education leader promotes the success of every student by collaborating with faculty and community members, responding to diverse community interests and needs, and mobilizing community resources. The portfolio demonstrates student’s ability to N
o
Insu
ffic
ient
So
me
A
dequ
ate
Sa
tisfa
ctor
y
Exem
plar
y
Collect and analyze data and information pertinent to the educational environment Promote understanding, appreciation, and use of the community’s diverse cultural, social and intellectual resources
Build and sustain positive relationships with families and caregivers Build and sustain productive relationships with community partners
Leader Standard 5
An education leader promotes the success of every student by acting with integrity, fairness, and
in an ethical manner. The portfolio demonstrates student’s ability to N
o
Insu
ffic
ient
So
me
A
dequ
ate
Sa
tisfa
ctor
y
Exem
plar
y
Ensure a system of accountability for every student’s academic and social success Model principles of self-awareness, reflective practice, transparency, and ethical
148

The portfolio demonstrates student’s ability to N
o
Insu
ffic
ient
So
me
A
dequ
ate
Sa
tisfa
ctor
y
Exem
plar
y
behavior Safeguard the values of democracy, equity, and diversity Consider and evaluate the potential moral and legal consequences of decision-making
Promote social justice and ensure that individual student needs inform all aspects of schooling
149

Leader Standard 6
An education leader promotes the success of every student by understanding, responding to, and
influencing the political, social, economic, legal and cultural context. The portfolio demonstrates student’s ability to
No
In
suff
icie
nt
Som
e
Ade
quat
e
Satis
fact
ory
Ex
empl
ary
Advocate for children, families, and caregivers Act to influence local, district, state, and national decisions affecting student learning
Assess, analyze, and anticipate emerging trends and initiatives in order to adapt leadership strategies
150

Artifact Summary
Directions: Mark the artifacts you see as you are rating portfolios. Please give feedback that would assist in making the portfolio artifacts effective indicators of mastery of ISLLC standards.
Standard Classroom Commentary Internship Commentary Standard
1 CCRPI transition/overview Strategic/school/system
improvement essay Budget strategic plan Mission statement
description/procedures School improvement plan
(Virtual/Mock) Student survey Assessment essay Curriculum audit Leadership styles
School Improvement Plan/School Improvement team (vision, plan, minutes, agenda)
Student recognition Student transition (8th to 9th)-
camp/brochure/ Transition to CCGPS Course test (math, history) School program guide
(comprehensive) Teacher observation (peer, ewalk) Meeting agenda/weekly planner Summer school calendar Board minutes School Leader interviews
Standard 2
Curriculum alignment project Curriculum audit/development Change essay Strategic plan for CCRPI
implementation GPS to CCRPI essay School improvement plan Balanced scorecard Scenario responses Data alignment
Standards based classroom- checklist (&/or Ewalk), strategies
Student support/recognition (ICU, young men of distinction, AP night, senior day
Faculty training/support (content, coteaching, peer-to peer observation, Thoughtful Literacy, “Classworks” implementation, Literacy, R4 committee meeting, curriculum maps, minutes from training)
Agenda- weekly planning/coach’s meeting/PTO/CCRPI/
Curriculum audit/tools
Standard 3
School Equity research paper Social media research paper Budget/Accounting process School Improvement plan data Mentoring plan of action
Schedule (tutoring, hall duty, block, Tutoring Form (transportation
request , tutoring, extended day tutoring, letter to parent)
Grant/application Student course catalog Edmodo staff development Policy manuals/documents (Title 1,
attendance, new teacher, school safety)
Memo/Agenda (data analysis, mentor, athletic budget, ewalk data, PLC facilitation)
Presentation (SIP, Budget, etc.)
151
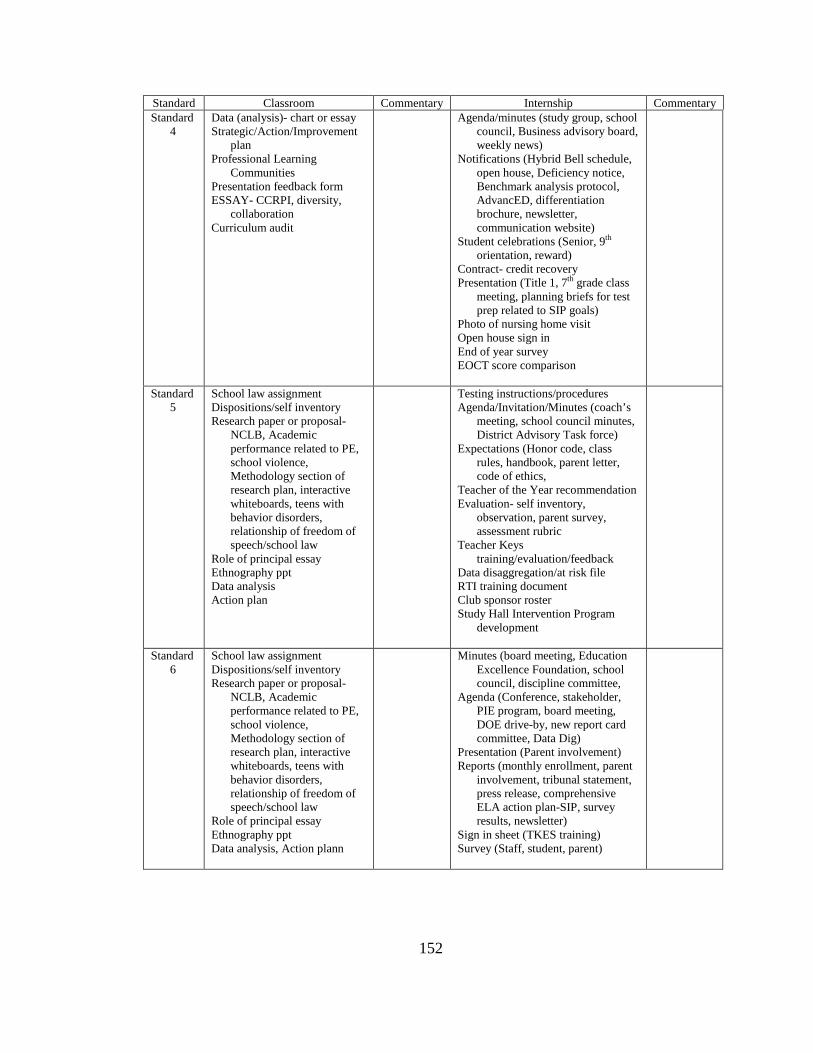
Standard Classroom Commentary Internship Commentary Standard
4 Data (analysis)- chart or essay Strategic/Action/Improvement
plan Professional Learning
Communities Presentation feedback form ESSAY- CCRPI, diversity,
collaboration Curriculum audit
Agenda/minutes (study group, school council, Business advisory board, weekly news)
Notifications (Hybrid Bell schedule, open house, Deficiency notice, Benchmark analysis protocol, AdvancED, differentiation brochure, newsletter, communication website)
Student celebrations (Senior, 9th orientation, reward)
Contract- credit recovery Presentation (Title 1, 7th grade class
meeting, planning briefs for test prep related to SIP goals)
Photo of nursing home visit Open house sign in End of year survey EOCT score comparison
Standard 5
School law assignment Dispositions/self inventory Research paper or proposal-
NCLB, Academic performance related to PE, school violence, Methodology section of research plan, interactive whiteboards, teens with behavior disorders, relationship of freedom of speech/school law
Role of principal essay Ethnography ppt Data analysis Action plan
Testing instructions/procedures Agenda/Invitation/Minutes (coach’s
meeting, school council minutes, District Advisory Task force)
Expectations (Honor code, class rules, handbook, parent letter, code of ethics,
Teacher of the Year recommendation Evaluation- self inventory,
observation, parent survey, assessment rubric
Teacher Keys training/evaluation/feedback
Data disaggregation/at risk file RTI training document Club sponsor roster Study Hall Intervention Program
development
Standard 6
School law assignment Dispositions/self inventory Research paper or proposal-
NCLB, Academic performance related to PE, school violence, Methodology section of research plan, interactive whiteboards, teens with behavior disorders, relationship of freedom of speech/school law
Role of principal essay Ethnography ppt Data analysis, Action plann
Minutes (board meeting, Education Excellence Foundation, school council, discipline committee,
Agenda (Conference, stakeholder, PIE program, board meeting, DOE drive-by, new report card committee, Data Dig)
Presentation (Parent involvement) Reports (monthly enrollment, parent
involvement, tribunal statement, press release, comprehensive ELA action plan-SIP, survey results, newsletter)
Sign in sheet (TKES training) Survey (Staff, student, parent)
152

153

APPENDIX C
IRB APPROVAL
154

155
156

APPENDIX D
LETTER OF INFORMED CONSENT
157

158
159
APPENDIX E
ARCHIVED PORTFOLIO USAGE APPROVAL
160

161

APPENDIX F
NIH TRAINING CERTIFICATION
162

163