Embed Size (px)
Citation preview

The Economist /YouGov PollApril 26 - 28, 2020 - 1500 US Adult citizens
List of Tables
1. Direction Of Country . . . . . . . . . . . . . . . . . . . . . . . . . . . . . . . . . . . . . . . . . . . . . . . . . . . . . . . . . . . . . . . . . . . . . . . . . . . . 22A. Friend Or Enemy — Canada . . . . . . . . . . . . . . . . . . . . . . . . . . . . . . . . . . . . . . . . . . . . . . . . . . . . . . . . . . . . . . . . . . . . . . . 42B. Friend Or Enemy — China . . . . . . . . . . . . . . . . . . . . . . . . . . . . . . . . . . . . . . . . . . . . . . . . . . . . . . . . . . . . . . . . . . . . . . . . 62C. Friend Or Enemy — France . . . . . . . . . . . . . . . . . . . . . . . . . . . . . . . . . . . . . . . . . . . . . . . . . . . . . . . . . . . . . . . . . . . . . . . . 82D. Friend Or Enemy — Germany . . . . . . . . . . . . . . . . . . . . . . . . . . . . . . . . . . . . . . . . . . . . . . . . . . . . . . . . . . . . . . . . . . . . . . . 102E. Friend Or Enemy — Iran . . . . . . . . . . . . . . . . . . . . . . . . . . . . . . . . . . . . . . . . . . . . . . . . . . . . . . . . . . . . . . . . . . . . . . . . . . 122F. Friend Or Enemy — Israel . . . . . . . . . . . . . . . . . . . . . . . . . . . . . . . . . . . . . . . . . . . . . . . . . . . . . . . . . . . . . . . . . . . . . . . . . 142G. Friend Or Enemy — Japan . . . . . . . . . . . . . . . . . . . . . . . . . . . . . . . . . . . . . . . . . . . . . . . . . . . . . . . . . . . . . . . . . . . . . . . . 162H. Friend Or Enemy — North Korea . . . . . . . . . . . . . . . . . . . . . . . . . . . . . . . . . . . . . . . . . . . . . . . . . . . . . . . . . . . . . . . . . . . . . 182I. Friend Or Enemy — South Korea . . . . . . . . . . . . . . . . . . . . . . . . . . . . . . . . . . . . . . . . . . . . . . . . . . . . . . . . . . . . . . . . . . . . . 202J. Friend Or Enemy — Mexico . . . . . . . . . . . . . . . . . . . . . . . . . . . . . . . . . . . . . . . . . . . . . . . . . . . . . . . . . . . . . . . . . . . . . . . . 222K. Friend Or Enemy — Russia . . . . . . . . . . . . . . . . . . . . . . . . . . . . . . . . . . . . . . . . . . . . . . . . . . . . . . . . . . . . . . . . . . . . . . . . 242L. Friend Or Enemy — United Kingdom . . . . . . . . . . . . . . . . . . . . . . . . . . . . . . . . . . . . . . . . . . . . . . . . . . . . . . . . . . . . . . . . . . . 263. Following News . . . . . . . . . . . . . . . . . . . . . . . . . . . . . . . . . . . . . . . . . . . . . . . . . . . . . . . . . . . . . . . . . . . . . . . . . . . . . . . 284. Main Source Of News . . . . . . . . . . . . . . . . . . . . . . . . . . . . . . . . . . . . . . . . . . . . . . . . . . . . . . . . . . . . . . . . . . . . . . . . . . . . 305. Most Watched Cable News Network . . . . . . . . . . . . . . . . . . . . . . . . . . . . . . . . . . . . . . . . . . . . . . . . . . . . . . . . . . . . . . . . . . . . 336. People I Know – Worn A Face Mask In Public . . . . . . . . . . . . . . . . . . . . . . . . . . . . . . . . . . . . . . . . . . . . . . . . . . . . . . . . . . . . . . . 357. People I Know – Lives In A Part Of The Country Under A Shelter In Place Order . . . . . . . . . . . . . . . . . . . . . . . . . . . . . . . . . . . . . . . . . . . . 378. People I Know – Has Had Their Work Hours Reduced Due To COVID-19 . . . . . . . . . . . . . . . . . . . . . . . . . . . . . . . . . . . . . . . . . . . . . . . . 399. People I Know – Has Been Laid Off From Work Due To COVID-19 . . . . . . . . . . . . . . . . . . . . . . . . . . . . . . . . . . . . . . . . . . . . . . . . . . . . 4110. People I Know – Has Had To Start Working From Home Due To COVID-19 . . . . . . . . . . . . . . . . . . . . . . . . . . . . . . . . . . . . . . . . . . . . . . 4311. People I Know – Has Tested Positive For COVID-19 . . . . . . . . . . . . . . . . . . . . . . . . . . . . . . . . . . . . . . . . . . . . . . . . . . . . . . . . . . . 4512. People I Know – Has Died Due To Complications From COVID-19 . . . . . . . . . . . . . . . . . . . . . . . . . . . . . . . . . . . . . . . . . . . . . . . . . . . 4713. Effectiveness Of Face Masks . . . . . . . . . . . . . . . . . . . . . . . . . . . . . . . . . . . . . . . . . . . . . . . . . . . . . . . . . . . . . . . . . . . . . . . 4814. Personal Worry About COVID-19 . . . . . . . . . . . . . . . . . . . . . . . . . . . . . . . . . . . . . . . . . . . . . . . . . . . . . . . . . . . . . . . . . . . . . 5015. Stay-At-Home Order Effectiveness . . . . . . . . . . . . . . . . . . . . . . . . . . . . . . . . . . . . . . . . . . . . . . . . . . . . . . . . . . . . . . . . . . . . 5216. Stay-At-Home Order . . . . . . . . . . . . . . . . . . . . . . . . . . . . . . . . . . . . . . . . . . . . . . . . . . . . . . . . . . . . . . . . . . . . . . . . . . . . 5417. Stay-At-Home Order Infringing On Rights . . . . . . . . . . . . . . . . . . . . . . . . . . . . . . . . . . . . . . . . . . . . . . . . . . . . . . . . . . . . . . . . 5518. COVID-19 Personal Risk . . . . . . . . . . . . . . . . . . . . . . . . . . . . . . . . . . . . . . . . . . . . . . . . . . . . . . . . . . . . . . . . . . . . . . . . . 5619. Length Of Outbreak . . . . . . . . . . . . . . . . . . . . . . . . . . . . . . . . . . . . . . . . . . . . . . . . . . . . . . . . . . . . . . . . . . . . . . . . . . . . 5820. Length Of Social Distancing . . . . . . . . . . . . . . . . . . . . . . . . . . . . . . . . . . . . . . . . . . . . . . . . . . . . . . . . . . . . . . . . . . . . . . . . 6021. End Social Distancing By May 1 . . . . . . . . . . . . . . . . . . . . . . . . . . . . . . . . . . . . . . . . . . . . . . . . . . . . . . . . . . . . . . . . . . . . . 6222. End Social Distancing By June 1 . . . . . . . . . . . . . . . . . . . . . . . . . . . . . . . . . . . . . . . . . . . . . . . . . . . . . . . . . . . . . . . . . . . . . 6323. Time Before Re-Opening Economy . . . . . . . . . . . . . . . . . . . . . . . . . . . . . . . . . . . . . . . . . . . . . . . . . . . . . . . . . . . . . . . . . . . . 6424. Concern About A Local Epidemic . . . . . . . . . . . . . . . . . . . . . . . . . . . . . . . . . . . . . . . . . . . . . . . . . . . . . . . . . . . . . . . . . . . . . 6625. Local Cases . . . . . . . . . . . . . . . . . . . . . . . . . . . . . . . . . . . . . . . . . . . . . . . . . . . . . . . . . . . . . . . . . . . . . . . . . . . . . . . . 68
1

The Economist /YouGov PollApril 26 - 28, 2020 - 1500 US Adult citizens
26. Concern About A National Epidemic . . . . . . . . . . . . . . . . . . . . . . . . . . . . . . . . . . . . . . . . . . . . . . . . . . . . . . . . . . . . . . . . . . . 6927. Describe Americans’ Thinking About COVID-19 . . . . . . . . . . . . . . . . . . . . . . . . . . . . . . . . . . . . . . . . . . . . . . . . . . . . . . . . . . . . . 7128. Economic Recession . . . . . . . . . . . . . . . . . . . . . . . . . . . . . . . . . . . . . . . . . . . . . . . . . . . . . . . . . . . . . . . . . . . . . . . . . . . 7329. Are We In A Recession . . . . . . . . . . . . . . . . . . . . . . . . . . . . . . . . . . . . . . . . . . . . . . . . . . . . . . . . . . . . . . . . . . . . . . . . . . 7430. Effect Of Recession . . . . . . . . . . . . . . . . . . . . . . . . . . . . . . . . . . . . . . . . . . . . . . . . . . . . . . . . . . . . . . . . . . . . . . . . . . . . 7531. How Long Before Economy Recovers . . . . . . . . . . . . . . . . . . . . . . . . . . . . . . . . . . . . . . . . . . . . . . . . . . . . . . . . . . . . . . . . . . 7732. National Unemployment Problem . . . . . . . . . . . . . . . . . . . . . . . . . . . . . . . . . . . . . . . . . . . . . . . . . . . . . . . . . . . . . . . . . . . . . 7933. Local Unemployment Problem . . . . . . . . . . . . . . . . . . . . . . . . . . . . . . . . . . . . . . . . . . . . . . . . . . . . . . . . . . . . . . . . . . . . . . 8134. Received A Stimulus Check . . . . . . . . . . . . . . . . . . . . . . . . . . . . . . . . . . . . . . . . . . . . . . . . . . . . . . . . . . . . . . . . . . . . . . . . 8335. Government Statistics . . . . . . . . . . . . . . . . . . . . . . . . . . . . . . . . . . . . . . . . . . . . . . . . . . . . . . . . . . . . . . . . . . . . . . . . . . . 8536. Census Statistics . . . . . . . . . . . . . . . . . . . . . . . . . . . . . . . . . . . . . . . . . . . . . . . . . . . . . . . . . . . . . . . . . . . . . . . . . . . . . . 8737. Unemployment Statistics . . . . . . . . . . . . . . . . . . . . . . . . . . . . . . . . . . . . . . . . . . . . . . . . . . . . . . . . . . . . . . . . . . . . . . . . . 8938. Infection Statistics . . . . . . . . . . . . . . . . . . . . . . . . . . . . . . . . . . . . . . . . . . . . . . . . . . . . . . . . . . . . . . . . . . . . . . . . . . . . . 9139. Death Statistics . . . . . . . . . . . . . . . . . . . . . . . . . . . . . . . . . . . . . . . . . . . . . . . . . . . . . . . . . . . . . . . . . . . . . . . . . . . . . . 9340. Trump COVID-19 Job Handling . . . . . . . . . . . . . . . . . . . . . . . . . . . . . . . . . . . . . . . . . . . . . . . . . . . . . . . . . . . . . . . . . . . . . . 9541. Trump COVID-19 Response Timing . . . . . . . . . . . . . . . . . . . . . . . . . . . . . . . . . . . . . . . . . . . . . . . . . . . . . . . . . . . . . . . . . . . . 9742. Congressional COVID-19 Job Handling . . . . . . . . . . . . . . . . . . . . . . . . . . . . . . . . . . . . . . . . . . . . . . . . . . . . . . . . . . . . . . . . . 9943A. Favorability Of Officials Working On COVID-19 Response — Andrew Cuomo . . . . . . . . . . . . . . . . . . . . . . . . . . . . . . . . . . . . . . . . . . . . 10143B. Favorability Of Officials Working On COVID-19 Response — Gretchen Whitmer . . . . . . . . . . . . . . . . . . . . . . . . . . . . . . . . . . . . . . . . . . . 10343C. Favorability Of Officials Working On COVID-19 Response — Mike DeWine . . . . . . . . . . . . . . . . . . . . . . . . . . . . . . . . . . . . . . . . . . . . . 10543D. Favorability Of Officials Working On COVID-19 Response — Ron DeSantis . . . . . . . . . . . . . . . . . . . . . . . . . . . . . . . . . . . . . . . . . . . . . 10743E. Favorability Of Officials Working On COVID-19 Response — Gavin Newsom . . . . . . . . . . . . . . . . . . . . . . . . . . . . . . . . . . . . . . . . . . . . 10943F. Favorability Of Officials Working On COVID-19 Response — Anthony Fauci . . . . . . . . . . . . . . . . . . . . . . . . . . . . . . . . . . . . . . . . . . . . . 11143G. Favorability Of Officials Working On COVID-19 Response — Centers for Disease Control and Prevention (CDC) . . . . . . . . . . . . . . . . . . . . . . . . . 11343H. Favorability Of Officials Working On COVID-19 Response — World Health Organization (WHO) . . . . . . . . . . . . . . . . . . . . . . . . . . . . . . . . . . 11544. COVID-19 A National Emergency . . . . . . . . . . . . . . . . . . . . . . . . . . . . . . . . . . . . . . . . . . . . . . . . . . . . . . . . . . . . . . . . . . . . . 11745. U.S. Containment Of Outbreak . . . . . . . . . . . . . . . . . . . . . . . . . . . . . . . . . . . . . . . . . . . . . . . . . . . . . . . . . . . . . . . . . . . . . . 11846. Rate Federal Handling . . . . . . . . . . . . . . . . . . . . . . . . . . . . . . . . . . . . . . . . . . . . . . . . . . . . . . . . . . . . . . . . . . . . . . . . . . . 12047. Describe Trump’s Thinking About COVID-19 . . . . . . . . . . . . . . . . . . . . . . . . . . . . . . . . . . . . . . . . . . . . . . . . . . . . . . . . . . . . . . . 12248. Rate State Handling . . . . . . . . . . . . . . . . . . . . . . . . . . . . . . . . . . . . . . . . . . . . . . . . . . . . . . . . . . . . . . . . . . . . . . . . . . . . 12449. Rate Local Handling . . . . . . . . . . . . . . . . . . . . . . . . . . . . . . . . . . . . . . . . . . . . . . . . . . . . . . . . . . . . . . . . . . . . . . . . . . . . 12650A. Trust In Medical Advice — Donald Trump . . . . . . . . . . . . . . . . . . . . . . . . . . . . . . . . . . . . . . . . . . . . . . . . . . . . . . . . . . . . . . . . 12850B. Trust In Medical Advice — Mike Pence . . . . . . . . . . . . . . . . . . . . . . . . . . . . . . . . . . . . . . . . . . . . . . . . . . . . . . . . . . . . . . . . . 13050C. Trust In Medical Advice — Anthony Fauci . . . . . . . . . . . . . . . . . . . . . . . . . . . . . . . . . . . . . . . . . . . . . . . . . . . . . . . . . . . . . . . . 13250D. Trust In Medical Advice — Andrew Cuomo . . . . . . . . . . . . . . . . . . . . . . . . . . . . . . . . . . . . . . . . . . . . . . . . . . . . . . . . . . . . . . . 13450E. Trust In Medical Advice — World Health Organization (WHO) . . . . . . . . . . . . . . . . . . . . . . . . . . . . . . . . . . . . . . . . . . . . . . . . . . . . . 13650F. Trust In Medical Advice — Centers for Disease Control and Prevention (CDC) . . . . . . . . . . . . . . . . . . . . . . . . . . . . . . . . . . . . . . . . . . . . 13851. Coronavirus Made In A Lab . . . . . . . . . . . . . . . . . . . . . . . . . . . . . . . . . . . . . . . . . . . . . . . . . . . . . . . . . . . . . . . . . . . . . . . . 140
2

The Economist /YouGov PollApril 26 - 28, 2020 - 1500 US Adult citizens
52A. Heard Of Treatments — Ingesting or injecting disinfectant . . . . . . . . . . . . . . . . . . . . . . . . . . . . . . . . . . . . . . . . . . . . . . . . . . . . . . . 14252B. Heard Of Treatments — Hydroxychloroquine (an anti-parasite and immunosuppressive drug used to treat malaria and some autoimmune diseases) . . . . . . 14352C. Heard Of Treatments — UV-light exposure . . . . . . . . . . . . . . . . . . . . . . . . . . . . . . . . . . . . . . . . . . . . . . . . . . . . . . . . . . . . . . . 14452D. Heard Of Treatments — Remdesivir (an antiviral drug not currently approved for any use) . . . . . . . . . . . . . . . . . . . . . . . . . . . . . . . . . . . . . 14552E. Heard Of Treatments — Azithromycin (an antibiotic used to treat bacterial infections) . . . . . . . . . . . . . . . . . . . . . . . . . . . . . . . . . . . . . . . . 14652F. Heard Of Treatments — Kaletra (an antiretroviral drug used to treat HIV) . . . . . . . . . . . . . . . . . . . . . . . . . . . . . . . . . . . . . . . . . . . . . . . 14752G. Heard Of Treatments — Actemra (an immunosuppressive drug used to treat rheumatoid arthritis) . . . . . . . . . . . . . . . . . . . . . . . . . . . . . . . . . 14852H. Heard Of Treatments — Social distancing . . . . . . . . . . . . . . . . . . . . . . . . . . . . . . . . . . . . . . . . . . . . . . . . . . . . . . . . . . . . . . . 14953A. Effectiveness Of Coronavirus Treatments — Ingesting or injecting disinfectant . . . . . . . . . . . . . . . . . . . . . . . . . . . . . . . . . . . . . . . . . . . . 15053B. Effectiveness Of Coronavirus Treatments — Hydroxychloroquine (an anti-parasite and immunosuppressive drug used to treat malaria and some autoimmune
diseases) . . . . . . . . . . . . . . . . . . . . . . . . . . . . . . . . . . . . . . . . . . . . . . . . . . . . . . . . . . . . . . . . . . . . . . . . . . . . . . . . . 15253C. Effectiveness Of Coronavirus Treatments — UV-light exposure . . . . . . . . . . . . . . . . . . . . . . . . . . . . . . . . . . . . . . . . . . . . . . . . . . . . 15453D. Effectiveness Of Coronavirus Treatments — Remdesivir (an antiviral drug not currently approved for any use) . . . . . . . . . . . . . . . . . . . . . . . . . . . 15653E. Effectiveness Of Coronavirus Treatments — Azithromycin (an antibiotic used to treat bacterial infections) . . . . . . . . . . . . . . . . . . . . . . . . . . . . . 15853F. Effectiveness Of Coronavirus Treatments — Kaletra (an antiretroviral drug used to treat HIV) . . . . . . . . . . . . . . . . . . . . . . . . . . . . . . . . . . . . 16053G. Effectiveness Of Coronavirus Treatments — Actemra (an immunosuppressive drug used to treat rheumatoid arthritis) . . . . . . . . . . . . . . . . . . . . . . 16253H. Effectiveness Of Coronavirus Treatments — Social distancing . . . . . . . . . . . . . . . . . . . . . . . . . . . . . . . . . . . . . . . . . . . . . . . . . . . . 16454A. Re-Open Or Remain Closed — Public parks . . . . . . . . . . . . . . . . . . . . . . . . . . . . . . . . . . . . . . . . . . . . . . . . . . . . . . . . . . . . . . 16654B. Re-Open Or Remain Closed — Golf courses . . . . . . . . . . . . . . . . . . . . . . . . . . . . . . . . . . . . . . . . . . . . . . . . . . . . . . . . . . . . . . 16854C. Re-Open Or Remain Closed — Tattoo parlors . . . . . . . . . . . . . . . . . . . . . . . . . . . . . . . . . . . . . . . . . . . . . . . . . . . . . . . . . . . . . 17054D. Re-Open Or Remain Closed — Beauty salons . . . . . . . . . . . . . . . . . . . . . . . . . . . . . . . . . . . . . . . . . . . . . . . . . . . . . . . . . . . . . 17254E. Re-Open Or Remain Closed — Churches . . . . . . . . . . . . . . . . . . . . . . . . . . . . . . . . . . . . . . . . . . . . . . . . . . . . . . . . . . . . . . . 17454F. Re-Open Or Remain Closed — Restaurants . . . . . . . . . . . . . . . . . . . . . . . . . . . . . . . . . . . . . . . . . . . . . . . . . . . . . . . . . . . . . . 17654G. Re-Open Or Remain Closed — Casinos . . . . . . . . . . . . . . . . . . . . . . . . . . . . . . . . . . . . . . . . . . . . . . . . . . . . . . . . . . . . . . . . 17854H. Re-Open Or Remain Closed — Bars . . . . . . . . . . . . . . . . . . . . . . . . . . . . . . . . . . . . . . . . . . . . . . . . . . . . . . . . . . . . . . . . . . 18054I. Re-Open Or Remain Closed — Gyms . . . . . . . . . . . . . . . . . . . . . . . . . . . . . . . . . . . . . . . . . . . . . . . . . . . . . . . . . . . . . . . . . . 18254J. Re-Open Or Remain Closed — Schools . . . . . . . . . . . . . . . . . . . . . . . . . . . . . . . . . . . . . . . . . . . . . . . . . . . . . . . . . . . . . . . . . 18455. Congressional Work Away From The Capitol . . . . . . . . . . . . . . . . . . . . . . . . . . . . . . . . . . . . . . . . . . . . . . . . . . . . . . . . . . . . . . . 18656. Respondents Biggest Concern . . . . . . . . . . . . . . . . . . . . . . . . . . . . . . . . . . . . . . . . . . . . . . . . . . . . . . . . . . . . . . . . . . . . . . 18757. Political Leaders Biggest Concern . . . . . . . . . . . . . . . . . . . . . . . . . . . . . . . . . . . . . . . . . . . . . . . . . . . . . . . . . . . . . . . . . . . . 18958. Knowledge Of Census . . . . . . . . . . . . . . . . . . . . . . . . . . . . . . . . . . . . . . . . . . . . . . . . . . . . . . . . . . . . . . . . . . . . . . . . . . . 19159. Received Census Questionnaire . . . . . . . . . . . . . . . . . . . . . . . . . . . . . . . . . . . . . . . . . . . . . . . . . . . . . . . . . . . . . . . . . . . . . 19260. Website Or Paper Questionnaire . . . . . . . . . . . . . . . . . . . . . . . . . . . . . . . . . . . . . . . . . . . . . . . . . . . . . . . . . . . . . . . . . . . . . 19361. Answering Status . . . . . . . . . . . . . . . . . . . . . . . . . . . . . . . . . . . . . . . . . . . . . . . . . . . . . . . . . . . . . . . . . . . . . . . . . . . . . 19562. Easy To Answer . . . . . . . . . . . . . . . . . . . . . . . . . . . . . . . . . . . . . . . . . . . . . . . . . . . . . . . . . . . . . . . . . . . . . . . . . . . . . . 19863. Justification To Ask Questions . . . . . . . . . . . . . . . . . . . . . . . . . . . . . . . . . . . . . . . . . . . . . . . . . . . . . . . . . . . . . . . . . . . . . . . 20064. Importance Of Answering . . . . . . . . . . . . . . . . . . . . . . . . . . . . . . . . . . . . . . . . . . . . . . . . . . . . . . . . . . . . . . . . . . . . . . . . . 20265. 2020 Census Statistics . . . . . . . . . . . . . . . . . . . . . . . . . . . . . . . . . . . . . . . . . . . . . . . . . . . . . . . . . . . . . . . . . . . . . . . . . . 204
3

The Economist /YouGov PollApril 26 - 28, 2020 - 1500 US Adult citizens
66. You Better Off Now . . . . . . . . . . . . . . . . . . . . . . . . . . . . . . . . . . . . . . . . . . . . . . . . . . . . . . . . . . . . . . . . . . . . . . . . . . . . . 20667. Country Better Off Now . . . . . . . . . . . . . . . . . . . . . . . . . . . . . . . . . . . . . . . . . . . . . . . . . . . . . . . . . . . . . . . . . . . . . . . . . . 20768. Support For Trump Policies . . . . . . . . . . . . . . . . . . . . . . . . . . . . . . . . . . . . . . . . . . . . . . . . . . . . . . . . . . . . . . . . . . . . . . . . 20869. Attention To 2020 Election . . . . . . . . . . . . . . . . . . . . . . . . . . . . . . . . . . . . . . . . . . . . . . . . . . . . . . . . . . . . . . . . . . . . . . . . . 21170A. Favorability Of Politicians — Joe Biden . . . . . . . . . . . . . . . . . . . . . . . . . . . . . . . . . . . . . . . . . . . . . . . . . . . . . . . . . . . . . . . . . 21370B. Favorability Of Politicians — Stacey Abrams . . . . . . . . . . . . . . . . . . . . . . . . . . . . . . . . . . . . . . . . . . . . . . . . . . . . . . . . . . . . . . 21570C. Favorability Of Politicians — Tammy Baldwin . . . . . . . . . . . . . . . . . . . . . . . . . . . . . . . . . . . . . . . . . . . . . . . . . . . . . . . . . . . . . . 21770D. Favorability Of Politicians — Kamala Harris . . . . . . . . . . . . . . . . . . . . . . . . . . . . . . . . . . . . . . . . . . . . . . . . . . . . . . . . . . . . . . . 21970E. Favorability Of Politicians — Amy Klobuchar . . . . . . . . . . . . . . . . . . . . . . . . . . . . . . . . . . . . . . . . . . . . . . . . . . . . . . . . . . . . . . 22170F. Favorability Of Politicians — Barack Obama . . . . . . . . . . . . . . . . . . . . . . . . . . . . . . . . . . . . . . . . . . . . . . . . . . . . . . . . . . . . . . . 22370G. Favorability Of Politicians — Michelle Obama . . . . . . . . . . . . . . . . . . . . . . . . . . . . . . . . . . . . . . . . . . . . . . . . . . . . . . . . . . . . . 22570H. Favorability Of Politicians — Elizabeth Warren . . . . . . . . . . . . . . . . . . . . . . . . . . . . . . . . . . . . . . . . . . . . . . . . . . . . . . . . . . . . . 22771. Vote In 2020 Primary Or Caucus . . . . . . . . . . . . . . . . . . . . . . . . . . . . . . . . . . . . . . . . . . . . . . . . . . . . . . . . . . . . . . . . . . . . . 22972. Democratic Nominee Preference . . . . . . . . . . . . . . . . . . . . . . . . . . . . . . . . . . . . . . . . . . . . . . . . . . . . . . . . . . . . . . . . . . . . . 23173. Effect Of Sanders Endorsement . . . . . . . . . . . . . . . . . . . . . . . . . . . . . . . . . . . . . . . . . . . . . . . . . . . . . . . . . . . . . . . . . . . . . . 23274. Sanders’s Role In General . . . . . . . . . . . . . . . . . . . . . . . . . . . . . . . . . . . . . . . . . . . . . . . . . . . . . . . . . . . . . . . . . . . . . . . . . 23475. Effect Of Obama Endorsement . . . . . . . . . . . . . . . . . . . . . . . . . . . . . . . . . . . . . . . . . . . . . . . . . . . . . . . . . . . . . . . . . . . . . . 23676. Effect Of Warren Endorsement . . . . . . . . . . . . . . . . . . . . . . . . . . . . . . . . . . . . . . . . . . . . . . . . . . . . . . . . . . . . . . . . . . . . . . 23877. Month Joe Biden Should Pick His VP . . . . . . . . . . . . . . . . . . . . . . . . . . . . . . . . . . . . . . . . . . . . . . . . . . . . . . . . . . . . . . . . . . . 24078. Female VP Nominee . . . . . . . . . . . . . . . . . . . . . . . . . . . . . . . . . . . . . . . . . . . . . . . . . . . . . . . . . . . . . . . . . . . . . . . . . . . . 24279. Democratic VP . . . . . . . . . . . . . . . . . . . . . . . . . . . . . . . . . . . . . . . . . . . . . . . . . . . . . . . . . . . . . . . . . . . . . . . . . . . . . . . 24380. Trial Heat - Biden V Trump . . . . . . . . . . . . . . . . . . . . . . . . . . . . . . . . . . . . . . . . . . . . . . . . . . . . . . . . . . . . . . . . . . . . . . . . . 24581. 2020 Election Winner . . . . . . . . . . . . . . . . . . . . . . . . . . . . . . . . . . . . . . . . . . . . . . . . . . . . . . . . . . . . . . . . . . . . . . . . . . . 24782. Senate Control . . . . . . . . . . . . . . . . . . . . . . . . . . . . . . . . . . . . . . . . . . . . . . . . . . . . . . . . . . . . . . . . . . . . . . . . . . . . . . . 24883. House Control . . . . . . . . . . . . . . . . . . . . . . . . . . . . . . . . . . . . . . . . . . . . . . . . . . . . . . . . . . . . . . . . . . . . . . . . . . . . . . . 24984. Economy Better If Biden Elected . . . . . . . . . . . . . . . . . . . . . . . . . . . . . . . . . . . . . . . . . . . . . . . . . . . . . . . . . . . . . . . . . . . . . 25085. Economy Better If Trump Reelected . . . . . . . . . . . . . . . . . . . . . . . . . . . . . . . . . . . . . . . . . . . . . . . . . . . . . . . . . . . . . . . . . . . 25286. Confidence In Biden Handling Of Coronavirus . . . . . . . . . . . . . . . . . . . . . . . . . . . . . . . . . . . . . . . . . . . . . . . . . . . . . . . . . . . . . . 25487. Confidence In Biden Handling Of An Economic Recession . . . . . . . . . . . . . . . . . . . . . . . . . . . . . . . . . . . . . . . . . . . . . . . . . . . . . . . 25588A. Issue Importance — Jobs and the economy . . . . . . . . . . . . . . . . . . . . . . . . . . . . . . . . . . . . . . . . . . . . . . . . . . . . . . . . . . . . . . 25688B. Issue Importance — Immigration . . . . . . . . . . . . . . . . . . . . . . . . . . . . . . . . . . . . . . . . . . . . . . . . . . . . . . . . . . . . . . . . . . . . 25888C. Issue Importance — Climate change and the environment . . . . . . . . . . . . . . . . . . . . . . . . . . . . . . . . . . . . . . . . . . . . . . . . . . . . . . 26088D. Issue Importance — Terrorism . . . . . . . . . . . . . . . . . . . . . . . . . . . . . . . . . . . . . . . . . . . . . . . . . . . . . . . . . . . . . . . . . . . . . . 26288E. Issue Importance — Education . . . . . . . . . . . . . . . . . . . . . . . . . . . . . . . . . . . . . . . . . . . . . . . . . . . . . . . . . . . . . . . . . . . . . 26488F. Issue Importance — Health care . . . . . . . . . . . . . . . . . . . . . . . . . . . . . . . . . . . . . . . . . . . . . . . . . . . . . . . . . . . . . . . . . . . . . 26688G. Issue Importance — Taxes and government spending . . . . . . . . . . . . . . . . . . . . . . . . . . . . . . . . . . . . . . . . . . . . . . . . . . . . . . . . . 26888H. Issue Importance — Civil rights and civil liberties . . . . . . . . . . . . . . . . . . . . . . . . . . . . . . . . . . . . . . . . . . . . . . . . . . . . . . . . . . . 27088I. Issue Importance — Gun control . . . . . . . . . . . . . . . . . . . . . . . . . . . . . . . . . . . . . . . . . . . . . . . . . . . . . . . . . . . . . . . . . . . . . 272
4

The Economist /YouGov PollApril 26 - 28, 2020 - 1500 US Adult citizens
88J. Issue Importance — Crime and criminal justice reform . . . . . . . . . . . . . . . . . . . . . . . . . . . . . . . . . . . . . . . . . . . . . . . . . . . . . . . . . 27489. Most Important Issue . . . . . . . . . . . . . . . . . . . . . . . . . . . . . . . . . . . . . . . . . . . . . . . . . . . . . . . . . . . . . . . . . . . . . . . . . . . 27690A. Favorability Of Individuals — Donald Trump . . . . . . . . . . . . . . . . . . . . . . . . . . . . . . . . . . . . . . . . . . . . . . . . . . . . . . . . . . . . . . . 27990B. Favorability Of Individuals — Mike Pence . . . . . . . . . . . . . . . . . . . . . . . . . . . . . . . . . . . . . . . . . . . . . . . . . . . . . . . . . . . . . . . . 28190C. Favorability Of Individuals — Nancy Pelosi . . . . . . . . . . . . . . . . . . . . . . . . . . . . . . . . . . . . . . . . . . . . . . . . . . . . . . . . . . . . . . . 28390D. Favorability Of Individuals — Mitch McConnell . . . . . . . . . . . . . . . . . . . . . . . . . . . . . . . . . . . . . . . . . . . . . . . . . . . . . . . . . . . . . 28591A. Favorability Of Political Parties — The Democratic Party . . . . . . . . . . . . . . . . . . . . . . . . . . . . . . . . . . . . . . . . . . . . . . . . . . . . . . . . 28791B. Favorability Of Political Parties — The Republican Party . . . . . . . . . . . . . . . . . . . . . . . . . . . . . . . . . . . . . . . . . . . . . . . . . . . . . . . . 28992. Trump Job Approval . . . . . . . . . . . . . . . . . . . . . . . . . . . . . . . . . . . . . . . . . . . . . . . . . . . . . . . . . . . . . . . . . . . . . . . . . . . . 29193A. Trump Approval On Issues — Jobs and the economy . . . . . . . . . . . . . . . . . . . . . . . . . . . . . . . . . . . . . . . . . . . . . . . . . . . . . . . . . 29393B. Trump Approval On Issues — Immigration . . . . . . . . . . . . . . . . . . . . . . . . . . . . . . . . . . . . . . . . . . . . . . . . . . . . . . . . . . . . . . . 29593C. Trump Approval On Issues — Climate change and the environment . . . . . . . . . . . . . . . . . . . . . . . . . . . . . . . . . . . . . . . . . . . . . . . . . 29793D. Trump Approval On Issues — Terrorism . . . . . . . . . . . . . . . . . . . . . . . . . . . . . . . . . . . . . . . . . . . . . . . . . . . . . . . . . . . . . . . . . 29993E. Trump Approval On Issues — Education . . . . . . . . . . . . . . . . . . . . . . . . . . . . . . . . . . . . . . . . . . . . . . . . . . . . . . . . . . . . . . . . 30193F. Trump Approval On Issues — Health care . . . . . . . . . . . . . . . . . . . . . . . . . . . . . . . . . . . . . . . . . . . . . . . . . . . . . . . . . . . . . . . . 30393G. Trump Approval On Issues — Taxes and government spending . . . . . . . . . . . . . . . . . . . . . . . . . . . . . . . . . . . . . . . . . . . . . . . . . . . . 30593H. Trump Approval On Issues — Civil rights and civil liberties . . . . . . . . . . . . . . . . . . . . . . . . . . . . . . . . . . . . . . . . . . . . . . . . . . . . . . 30793I. Trump Approval On Issues — Gun control . . . . . . . . . . . . . . . . . . . . . . . . . . . . . . . . . . . . . . . . . . . . . . . . . . . . . . . . . . . . . . . . 30993J. Trump Approval On Issues — Crime and criminal justice reform . . . . . . . . . . . . . . . . . . . . . . . . . . . . . . . . . . . . . . . . . . . . . . . . . . . . 31194. Trump Perceived Ideology . . . . . . . . . . . . . . . . . . . . . . . . . . . . . . . . . . . . . . . . . . . . . . . . . . . . . . . . . . . . . . . . . . . . . . . . . 31395. Trump Cares About People Like You . . . . . . . . . . . . . . . . . . . . . . . . . . . . . . . . . . . . . . . . . . . . . . . . . . . . . . . . . . . . . . . . . . . 31596. Trump Likability . . . . . . . . . . . . . . . . . . . . . . . . . . . . . . . . . . . . . . . . . . . . . . . . . . . . . . . . . . . . . . . . . . . . . . . . . . . . . . 31797. Trump Leadership Abilities . . . . . . . . . . . . . . . . . . . . . . . . . . . . . . . . . . . . . . . . . . . . . . . . . . . . . . . . . . . . . . . . . . . . . . . . 31998. Trump Honesty . . . . . . . . . . . . . . . . . . . . . . . . . . . . . . . . . . . . . . . . . . . . . . . . . . . . . . . . . . . . . . . . . . . . . . . . . . . . . . . 32199. Trump Confidence In International Crisis . . . . . . . . . . . . . . . . . . . . . . . . . . . . . . . . . . . . . . . . . . . . . . . . . . . . . . . . . . . . . . . . . 323100. Confidence In Trump Handling Of Coronavirus . . . . . . . . . . . . . . . . . . . . . . . . . . . . . . . . . . . . . . . . . . . . . . . . . . . . . . . . . . . . . 324101. Confidence In Trump Handling Of An Economic Recession . . . . . . . . . . . . . . . . . . . . . . . . . . . . . . . . . . . . . . . . . . . . . . . . . . . . . . 325102. Trump Appropriate Twitter Use . . . . . . . . . . . . . . . . . . . . . . . . . . . . . . . . . . . . . . . . . . . . . . . . . . . . . . . . . . . . . . . . . . . . . . 326103. Approval Of U.S. Congress . . . . . . . . . . . . . . . . . . . . . . . . . . . . . . . . . . . . . . . . . . . . . . . . . . . . . . . . . . . . . . . . . . . . . . . 327104. Pelosi Job Approval . . . . . . . . . . . . . . . . . . . . . . . . . . . . . . . . . . . . . . . . . . . . . . . . . . . . . . . . . . . . . . . . . . . . . . . . . . . 329105. Mcconnell Job Approval . . . . . . . . . . . . . . . . . . . . . . . . . . . . . . . . . . . . . . . . . . . . . . . . . . . . . . . . . . . . . . . . . . . . . . . . . 331106. Congressional Accomplishment - 5 Point . . . . . . . . . . . . . . . . . . . . . . . . . . . . . . . . . . . . . . . . . . . . . . . . . . . . . . . . . . . . . . . . 333107. Blame . . . . . . . . . . . . . . . . . . . . . . . . . . . . . . . . . . . . . . . . . . . . . . . . . . . . . . . . . . . . . . . . . . . . . . . . . . . . . . . . . . . 335108. Trend Of Economy . . . . . . . . . . . . . . . . . . . . . . . . . . . . . . . . . . . . . . . . . . . . . . . . . . . . . . . . . . . . . . . . . . . . . . . . . . . . 337109. Stock Market Expectations Over Next Year . . . . . . . . . . . . . . . . . . . . . . . . . . . . . . . . . . . . . . . . . . . . . . . . . . . . . . . . . . . . . . . 339110. Stock Ownership . . . . . . . . . . . . . . . . . . . . . . . . . . . . . . . . . . . . . . . . . . . . . . . . . . . . . . . . . . . . . . . . . . . . . . . . . . . . . 341111. Change In Personal Finances Over Past Year . . . . . . . . . . . . . . . . . . . . . . . . . . . . . . . . . . . . . . . . . . . . . . . . . . . . . . . . . . . . . 342112. Jobs In Six Months . . . . . . . . . . . . . . . . . . . . . . . . . . . . . . . . . . . . . . . . . . . . . . . . . . . . . . . . . . . . . . . . . . . . . . . . . . . . 344
5

The Economist /YouGov PollApril 26 - 28, 2020 - 1500 US Adult citizens
113. Worried About Losing Job . . . . . . . . . . . . . . . . . . . . . . . . . . . . . . . . . . . . . . . . . . . . . . . . . . . . . . . . . . . . . . . . . . . . . . . . 346114. Job Availability . . . . . . . . . . . . . . . . . . . . . . . . . . . . . . . . . . . . . . . . . . . . . . . . . . . . . . . . . . . . . . . . . . . . . . . . . . . . . . 347115. Happy With Job . . . . . . . . . . . . . . . . . . . . . . . . . . . . . . . . . . . . . . . . . . . . . . . . . . . . . . . . . . . . . . . . . . . . . . . . . . . . . . 349116. Generic Congressional Vote . . . . . . . . . . . . . . . . . . . . . . . . . . . . . . . . . . . . . . . . . . . . . . . . . . . . . . . . . . . . . . . . . . . . . . . 351
6

The Economist /YouGov PollApril 26 - 28, 2020 - 1500 US Adult citizens
1. Direction Of CountryWould you say things in this country today are...
Gender Education Income
Total Male Female HS or less Some college College grad Postgrad Under $50K $50-100K $100K or more
Generally headed in theright direction 30% 32% 28% 32% 30% 26% 30% 27% 32% 36%
Off on the wrong track 57% 56% 58% 52% 56% 63% 67% 56% 57% 58%
Not sure 13% 12% 14% 16% 14% 10% 3% 17% 11% 6%
Totals 100% 100% 100% 100% 100% 99% 100% 100% 100% 100%
Unweighted N (1,500) (667) (833) (471) (531) (302) (196) (600) (443) (287)
Age Race Region
Total 18-29 30-44 45-64 65+ White Black Hispanic Other Northeast Midwest South West
Generally headed in theright direction 30% 24% 25% 33% 37% 34% 16% 25% 21% 26% 26% 33% 31%
Off on the wrong track 57% 60% 61% 53% 56% 55% 72% 53% 62% 57% 59% 53% 61%
Not sure 13% 17% 14% 13% 8% 12% 12% 21% 17% 17% 14% 14% 8%
Totals 100% 101% 100% 99% 101% 101% 100% 99% 100% 100% 99% 100% 100%
Unweighted N (1,500) (313) (280) (594) (313) (1,088) (162) (165) (85) (275) (330) (552) (343)
Registered Primary Voter Party ID Ideology
Total Voters Dem Rep Dem Ind Rep Lib Mod Con
Generally headed in theright direction 30% 33% 11% 67% 11% 26% 59% 10% 26% 55%
Off on the wrong track 57% 58% 85% 24% 81% 56% 30% 83% 61% 32%
Not sure 13% 9% 5% 8% 8% 18% 11% 7% 13% 13%
Totals 100% 100% 101% 99% 100% 100% 100% 100% 100% 100%
continued on the next page . . .
7

The Economist /YouGov PollApril 26 - 28, 2020 - 1500 US Adult citizens
continued from previous pageRegistered Primary Voter Party ID Ideology
Total Voters Dem Rep Dem Ind Rep Lib Mod Con
Unweighted N (1,500) (1,222) (564) (337) (536) (584) (380) (449) (451) (457)
8
The Economist /YouGov PollApril 26 - 28, 2020 - 1500 US Adult citizens
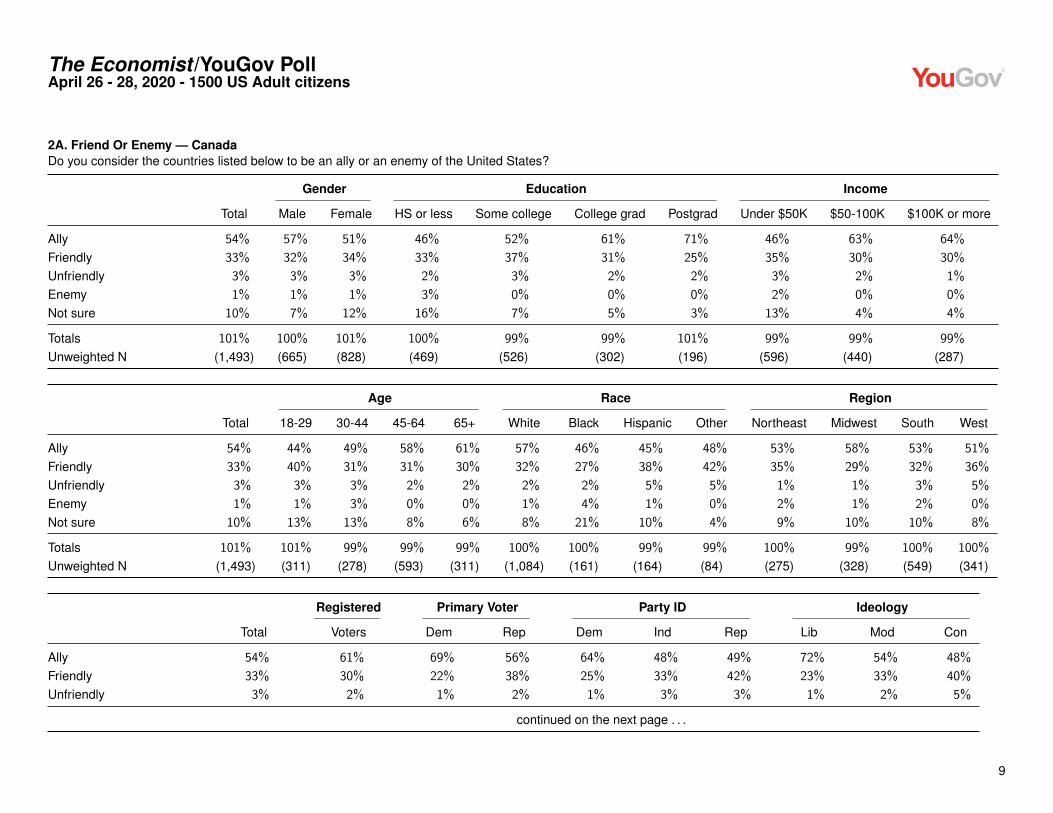
2A. Friend Or Enemy — CanadaDo you consider the countries listed below to be an ally or an enemy of the United States?
Gender Education Income
Total Male Female HS or less Some college College grad Postgrad Under $50K $50-100K $100K or more
Ally 54% 57% 51% 46% 52% 61% 71% 46% 63% 64%
Friendly 33% 32% 34% 33% 37% 31% 25% 35% 30% 30%
Unfriendly 3% 3% 3% 2% 3% 2% 2% 3% 2% 1%
Enemy 1% 1% 1% 3% 0% 0% 0% 2% 0% 0%
Not sure 10% 7% 12% 16% 7% 5% 3% 13% 4% 4%
Totals 101% 100% 101% 100% 99% 99% 101% 99% 99% 99%
Unweighted N (1,493) (665) (828) (469) (526) (302) (196) (596) (440) (287)
Age Race Region
Total 18-29 30-44 45-64 65+ White Black Hispanic Other Northeast Midwest South West
Ally 54% 44% 49% 58% 61% 57% 46% 45% 48% 53% 58% 53% 51%
Friendly 33% 40% 31% 31% 30% 32% 27% 38% 42% 35% 29% 32% 36%
Unfriendly 3% 3% 3% 2% 2% 2% 2% 5% 5% 1% 1% 3% 5%
Enemy 1% 1% 3% 0% 0% 1% 4% 1% 0% 2% 1% 2% 0%
Not sure 10% 13% 13% 8% 6% 8% 21% 10% 4% 9% 10% 10% 8%
Totals 101% 101% 99% 99% 99% 100% 100% 99% 99% 100% 99% 100% 100%
Unweighted N (1,493) (311) (278) (593) (311) (1,084) (161) (164) (84) (275) (328) (549) (341)
Registered Primary Voter Party ID Ideology
Total Voters Dem Rep Dem Ind Rep Lib Mod Con
Ally 54% 61% 69% 56% 64% 48% 49% 72% 54% 48%
Friendly 33% 30% 22% 38% 25% 33% 42% 23% 33% 40%
Unfriendly 3% 2% 1% 2% 1% 3% 3% 1% 2% 5%
continued on the next page . . .
9

The Economist /YouGov PollApril 26 - 28, 2020 - 1500 US Adult citizens
continued from previous pageRegistered Primary Voter Party ID Ideology
Total Voters Dem Rep Dem Ind Rep Lib Mod Con
Enemy 1% 1% 1% 0% 1% 2% 1% 1% 1% 1%
Not sure 10% 6% 7% 4% 9% 14% 5% 4% 9% 7%
Totals 101% 100% 100% 100% 100% 100% 100% 101% 99% 101%
Unweighted N (1,493) (1,215) (562) (335) (535) (581) (377) (448) (449) (454)
10

The Economist /YouGov PollApril 26 - 28, 2020 - 1500 US Adult citizens
2B. Friend Or Enemy — ChinaDo you consider the countries listed below to be an ally or an enemy of the United States?
Gender Education Income
Total Male Female HS or less Some college College grad Postgrad Under $50K $50-100K $100K or more
Ally 3% 3% 3% 3% 4% 3% 1% 4% 3% 2%
Friendly 13% 13% 14% 15% 12% 12% 12% 15% 14% 13%
Unfriendly 40% 41% 39% 33% 37% 49% 51% 33% 44% 48%
Enemy 27% 30% 24% 26% 29% 26% 24% 25% 27% 28%
Not sure 17% 13% 20% 22% 18% 10% 10% 22% 12% 9%
Totals 100% 100% 100% 99% 100% 100% 98% 99% 100% 100%
Unweighted N (1,495) (665) (830) (470) (528) (302) (195) (598) (442) (285)
Age Race Region
Total 18-29 30-44 45-64 65+ White Black Hispanic Other Northeast Midwest South West
Ally 3% 6% 4% 3% 1% 2% 4% 9% 1% 4% 3% 3% 4%
Friendly 13% 17% 14% 13% 8% 12% 16% 18% 13% 14% 13% 13% 13%
Unfriendly 40% 39% 39% 42% 37% 42% 27% 35% 45% 41% 37% 37% 45%
Enemy 27% 21% 19% 30% 38% 29% 23% 19% 28% 26% 28% 28% 26%
Not sure 17% 17% 24% 12% 16% 14% 31% 19% 14% 15% 19% 19% 13%
Totals 100% 100% 100% 100% 100% 99% 101% 100% 101% 100% 100% 100% 101%
Unweighted N (1,495) (311) (279) (593) (312) (1,086) (160) (164) (85) (274) (328) (551) (342)
Registered Primary Voter Party ID Ideology
Total Voters Dem Rep Dem Ind Rep Lib Mod Con
Ally 3% 3% 3% 2% 4% 4% 2% 3% 3% 4%
Friendly 13% 13% 15% 10% 15% 16% 7% 16% 17% 8%
Unfriendly 40% 42% 50% 34% 46% 35% 39% 47% 41% 34%
continued on the next page . . .
11

The Economist /YouGov PollApril 26 - 28, 2020 - 1500 US Adult citizens
continued from previous pageRegistered Primary Voter Party ID Ideology
Total Voters Dem Rep Dem Ind Rep Lib Mod Con
Enemy 27% 31% 18% 48% 17% 25% 42% 18% 21% 46%
Not sure 17% 12% 13% 6% 18% 20% 10% 16% 19% 9%
Totals 100% 101% 99% 100% 100% 100% 100% 100% 101% 101%
Unweighted N (1,495) (1,217) (561) (337) (533) (582) (380) (448) (448) (457)
12

The Economist /YouGov PollApril 26 - 28, 2020 - 1500 US Adult citizens
2C. Friend Or Enemy — FranceDo you consider the countries listed below to be an ally or an enemy of the United States?
Gender Education Income
Total Male Female HS or less Some college College grad Postgrad Under $50K $50-100K $100K or more
Ally 36% 39% 34% 34% 34% 41% 44% 33% 41% 43%
Friendly 39% 40% 38% 35% 40% 42% 43% 36% 43% 43%
Unfriendly 7% 7% 7% 6% 10% 6% 5% 7% 7% 6%
Enemy 2% 1% 2% 3% 1% 1% 0% 2% 1% 0%
Not sure 16% 13% 19% 22% 15% 10% 7% 22% 9% 8%
Totals 100% 100% 100% 100% 100% 100% 99% 100% 101% 100%
Unweighted N (1,489) (663) (826) (467) (525) (302) (195) (592) (443) (285)
Age Race Region
Total 18-29 30-44 45-64 65+ White Black Hispanic Other Northeast Midwest South West
Ally 36% 32% 33% 37% 43% 38% 37% 26% 32% 37% 38% 36% 35%
Friendly 39% 40% 38% 40% 38% 39% 29% 46% 48% 39% 39% 37% 42%
Unfriendly 7% 4% 5% 8% 12% 7% 5% 9% 8% 9% 5% 8% 8%
Enemy 2% 2% 3% 1% 0% 1% 2% 5% 2% 2% 2% 2% 1%
Not sure 16% 22% 21% 14% 7% 14% 27% 15% 9% 13% 16% 17% 15%
Totals 100% 100% 100% 100% 100% 99% 100% 101% 99% 100% 100% 100% 101%
Unweighted N (1,489) (312) (277) (589) (311) (1,084) (160) (163) (82) (272) (327) (547) (343)
Registered Primary Voter Party ID Ideology
Total Voters Dem Rep Dem Ind Rep Lib Mod Con
Ally 36% 41% 52% 32% 45% 33% 30% 48% 39% 29%
Friendly 39% 41% 35% 50% 37% 34% 49% 39% 39% 46%
Unfriendly 7% 8% 4% 10% 4% 9% 9% 2% 7% 11%
continued on the next page . . .
13

The Economist /YouGov PollApril 26 - 28, 2020 - 1500 US Adult citizens
continued from previous pageRegistered Primary Voter Party ID Ideology
Total Voters Dem Rep Dem Ind Rep Lib Mod Con
Enemy 2% 1% 1% 1% 1% 1% 2% 2% 0% 1%
Not sure 16% 9% 8% 8% 13% 22% 10% 8% 14% 13%
Totals 100% 100% 100% 101% 100% 99% 100% 99% 99% 100%
Unweighted N (1,489) (1,214) (563) (336) (535) (577) (377) (447) (447) (455)
14

The Economist /YouGov PollApril 26 - 28, 2020 - 1500 US Adult citizens
2D. Friend Or Enemy — GermanyDo you consider the countries listed below to be an ally or an enemy of the United States?
Gender Education Income
Total Male Female HS or less Some college College grad Postgrad Under $50K $50-100K $100K or more
Ally 32% 35% 29% 27% 26% 42% 49% 24% 39% 44%
Friendly 38% 41% 35% 35% 40% 42% 35% 34% 40% 41%
Unfriendly 9% 8% 9% 8% 11% 7% 7% 9% 9% 7%
Enemy 3% 2% 3% 6% 2% 1% 1% 5% 1% 1%
Not sure 19% 14% 24% 25% 21% 9% 9% 28% 10% 7%
Totals 101% 100% 100% 101% 100% 101% 101% 100% 99% 100%
Unweighted N (1,491) (665) (826) (468) (525) (302) (196) (595) (440) (287)
Age Race Region
Total 18-29 30-44 45-64 65+ White Black Hispanic Other Northeast Midwest South West
Ally 32% 27% 26% 34% 40% 35% 24% 22% 30% 31% 33% 32% 31%
Friendly 38% 37% 35% 39% 40% 38% 28% 42% 39% 42% 33% 35% 43%
Unfriendly 9% 6% 11% 11% 6% 8% 8% 10% 14% 6% 9% 11% 8%
Enemy 3% 5% 4% 2% 2% 2% 8% 4% 2% 4% 2% 3% 3%
Not sure 19% 26% 25% 15% 11% 17% 32% 21% 14% 17% 22% 20% 16%
Totals 101% 101% 101% 101% 99% 100% 100% 99% 99% 100% 99% 101% 101%
Unweighted N (1,491) (311) (279) (591) (310) (1,083) (160) (164) (84) (273) (328) (548) (342)
Registered Primary Voter Party ID Ideology
Total Voters Dem Rep Dem Ind Rep Lib Mod Con
Ally 32% 39% 50% 25% 42% 28% 25% 46% 34% 25%
Friendly 38% 39% 31% 53% 30% 35% 51% 34% 37% 47%
Unfriendly 9% 8% 5% 11% 8% 10% 7% 5% 8% 12%
continued on the next page . . .
15

The Economist /YouGov PollApril 26 - 28, 2020 - 1500 US Adult citizens
continued from previous pageRegistered Primary Voter Party ID Ideology
Total Voters Dem Rep Dem Ind Rep Lib Mod Con
Enemy 3% 2% 3% 1% 4% 3% 1% 3% 2% 2%
Not sure 19% 12% 11% 9% 15% 24% 15% 12% 19% 15%
Totals 101% 100% 100% 99% 99% 100% 99% 100% 100% 101%
Unweighted N (1,491) (1,214) (560) (334) (533) (583) (375) (448) (448) (453)
16

The Economist /YouGov PollApril 26 - 28, 2020 - 1500 US Adult citizens
2E. Friend Or Enemy — IranDo you consider the countries listed below to be an ally or an enemy of the United States?
Gender Education Income
Total Male Female HS or less Some college College grad Postgrad Under $50K $50-100K $100K or more
Ally 2% 2% 2% 2% 1% 3% 1% 3% 1% 1%
Friendly 4% 4% 5% 6% 4% 4% 1% 6% 4% 3%
Unfriendly 30% 31% 30% 23% 28% 42% 44% 28% 36% 33%
Enemy 47% 54% 41% 48% 51% 40% 45% 43% 49% 54%
Not sure 16% 10% 22% 20% 16% 11% 9% 20% 11% 9%
Totals 99% 101% 100% 99% 100% 100% 100% 100% 101% 100%
Unweighted N (1,495) (667) (828) (469) (528) (302) (196) (597) (443) (287)
Age Race Region
Total 18-29 30-44 45-64 65+ White Black Hispanic Other Northeast Midwest South West
Ally 2% 3% 4% 1% 0% 1% 5% 4% 0% 3% 0% 2% 3%
Friendly 4% 9% 5% 1% 4% 3% 4% 10% 6% 2% 4% 4% 6%
Unfriendly 30% 29% 36% 29% 27% 31% 26% 24% 50% 34% 31% 27% 32%
Enemy 47% 35% 35% 56% 58% 51% 35% 45% 33% 45% 50% 49% 44%
Not sure 16% 24% 20% 12% 11% 14% 30% 17% 11% 15% 14% 18% 15%
Totals 99% 100% 100% 99% 100% 100% 100% 100% 100% 99% 99% 100% 100%
Unweighted N (1,495) (312) (279) (594) (310) (1,085) (162) (163) (85) (273) (330) (549) (343)
Registered Primary Voter Party ID Ideology
Total Voters Dem Rep Dem Ind Rep Lib Mod Con
Ally 2% 2% 2% 3% 2% 3% 1% 3% 1% 2%
Friendly 4% 4% 4% 2% 5% 4% 4% 5% 4% 4%
Unfriendly 30% 32% 43% 20% 37% 30% 23% 45% 28% 21%
continued on the next page . . .
17

The Economist /YouGov PollApril 26 - 28, 2020 - 1500 US Adult citizens
continued from previous pageRegistered Primary Voter Party ID Ideology
Total Voters Dem Rep Dem Ind Rep Lib Mod Con
Enemy 47% 50% 37% 67% 39% 45% 61% 33% 50% 62%
Not sure 16% 12% 14% 7% 17% 18% 11% 14% 16% 11%
Totals 99% 100% 100% 99% 100% 100% 100% 100% 99% 100%
Unweighted N (1,495) (1,218) (563) (337) (533) (583) (379) (448) (448) (457)
18

The Economist /YouGov PollApril 26 - 28, 2020 - 1500 US Adult citizens
2F. Friend Or Enemy — IsraelDo you consider the countries listed below to be an ally or an enemy of the United States?
Gender Education Income
Total Male Female HS or less Some college College grad Postgrad Under $50K $50-100K $100K or more
Ally 34% 42% 26% 29% 36% 37% 38% 26% 40% 43%
Friendly 29% 28% 30% 25% 27% 32% 38% 29% 29% 32%
Unfriendly 11% 11% 10% 14% 8% 9% 7% 11% 11% 9%
Enemy 5% 4% 6% 6% 5% 5% 4% 6% 4% 3%
Not sure 22% 15% 28% 25% 24% 16% 13% 28% 16% 13%
Totals 101% 100% 100% 99% 100% 99% 100% 100% 100% 100%
Unweighted N (1,496) (666) (830) (469) (530) (302) (195) (597) (442) (287)
Age Race Region
Total 18-29 30-44 45-64 65+ White Black Hispanic Other Northeast Midwest South West
Ally 34% 22% 22% 41% 47% 38% 19% 23% 36% 31% 32% 34% 36%
Friendly 29% 32% 28% 28% 27% 27% 31% 37% 32% 33% 28% 28% 27%
Unfriendly 11% 17% 11% 8% 7% 10% 11% 11% 13% 12% 9% 10% 12%
Enemy 5% 6% 8% 5% 2% 4% 5% 11% 4% 4% 4% 6% 7%
Not sure 22% 23% 31% 18% 16% 21% 35% 17% 15% 20% 26% 23% 18%
Totals 101% 100% 100% 100% 99% 100% 101% 99% 100% 100% 99% 101% 100%
Unweighted N (1,496) (313) (279) (592) (312) (1,085) (162) (164) (85) (274) (329) (550) (343)
Registered Primary Voter Party ID Ideology
Total Voters Dem Rep Dem Ind Rep Lib Mod Con
Ally 34% 42% 30% 59% 22% 34% 48% 23% 33% 52%
Friendly 29% 29% 34% 20% 34% 27% 24% 35% 33% 22%
Unfriendly 11% 9% 11% 8% 15% 9% 7% 16% 8% 7%
continued on the next page . . .
19

The Economist /YouGov PollApril 26 - 28, 2020 - 1500 US Adult citizens
continued from previous pageRegistered Primary Voter Party ID Ideology
Total Voters Dem Rep Dem Ind Rep Lib Mod Con
Enemy 5% 4% 5% 5% 5% 5% 7% 6% 5% 4%
Not sure 22% 16% 21% 7% 24% 25% 14% 20% 19% 14%
Totals 101% 100% 101% 99% 100% 100% 100% 100% 98% 99%
Unweighted N (1,496) (1,219) (564) (336) (536) (582) (378) (449) (450) (456)
20

The Economist /YouGov PollApril 26 - 28, 2020 - 1500 US Adult citizens
2G. Friend Or Enemy — JapanDo you consider the countries listed below to be an ally or an enemy of the United States?
Gender Education Income
Total Male Female HS or less Some college College grad Postgrad Under $50K $50-100K $100K or more
Ally 30% 38% 23% 25% 25% 39% 49% 21% 38% 46%
Friendly 40% 41% 38% 35% 45% 44% 35% 38% 44% 38%
Unfriendly 9% 7% 10% 12% 9% 3% 5% 11% 5% 5%
Enemy 4% 3% 4% 4% 4% 3% 1% 5% 2% 2%
Not sure 18% 11% 25% 24% 17% 12% 10% 25% 11% 9%
Totals 101% 100% 100% 100% 100% 101% 100% 100% 100% 100%
Unweighted N (1,490) (665) (825) (469) (524) (302) (195) (595) (441) (286)
Age Race Region
Total 18-29 30-44 45-64 65+ White Black Hispanic Other Northeast Midwest South West
Ally 30% 20% 24% 34% 41% 34% 13% 22% 35% 29% 28% 30% 34%
Friendly 40% 41% 37% 40% 41% 40% 38% 37% 47% 39% 43% 38% 39%
Unfriendly 9% 10% 12% 7% 7% 7% 11% 16% 6% 8% 6% 10% 10%
Enemy 4% 4% 4% 4% 3% 3% 7% 4% 2% 4% 3% 4% 3%
Not sure 18% 25% 24% 15% 9% 16% 31% 21% 10% 19% 20% 19% 13%
Totals 101% 100% 101% 100% 101% 100% 100% 100% 100% 99% 100% 101% 99%
Unweighted N (1,490) (311) (278) (592) (309) (1,082) (162) (161) (85) (274) (327) (547) (342)
Registered Primary Voter Party ID Ideology
Total Voters Dem Rep Dem Ind Rep Lib Mod Con
Ally 30% 39% 43% 39% 33% 28% 30% 37% 30% 33%
Friendly 40% 40% 36% 43% 37% 39% 44% 41% 40% 43%
Unfriendly 9% 7% 7% 8% 10% 6% 10% 7% 7% 8%
continued on the next page . . .
21

The Economist /YouGov PollApril 26 - 28, 2020 - 1500 US Adult citizens
continued from previous pageRegistered Primary Voter Party ID Ideology
Total Voters Dem Rep Dem Ind Rep Lib Mod Con
Enemy 4% 3% 2% 3% 3% 3% 5% 4% 3% 4%
Not sure 18% 12% 12% 7% 16% 24% 11% 11% 19% 12%
Totals 101% 101% 100% 100% 99% 100% 100% 100% 99% 100%
Unweighted N (1,490) (1,213) (561) (334) (534) (580) (376) (446) (447) (454)
22

The Economist /YouGov PollApril 26 - 28, 2020 - 1500 US Adult citizens
2H. Friend Or Enemy — North KoreaDo you consider the countries listed below to be an ally or an enemy of the United States?
Gender Education Income
Total Male Female HS or less Some college College grad Postgrad Under $50K $50-100K $100K or more
Ally 2% 1% 2% 2% 2% 0% 0% 2% 1% 2%
Friendly 7% 7% 6% 8% 6% 7% 4% 9% 4% 7%
Unfriendly 22% 22% 23% 21% 22% 23% 29% 22% 28% 18%
Enemy 56% 62% 50% 50% 58% 61% 62% 50% 57% 68%
Not sure 13% 7% 19% 19% 12% 9% 5% 17% 9% 5%
Totals 100% 99% 100% 100% 100% 100% 100% 100% 99% 100%
Unweighted N (1,493) (665) (828) (471) (524) (302) (196) (596) (440) (287)
Age Race Region
Total 18-29 30-44 45-64 65+ White Black Hispanic Other Northeast Midwest South West
Ally 2% 3% 3% 1% 1% 1% 1% 3% 2% 2% 1% 2% 2%
Friendly 7% 15% 7% 4% 4% 5% 8% 16% 9% 6% 4% 9% 6%
Unfriendly 22% 19% 25% 23% 22% 23% 18% 20% 28% 26% 23% 19% 25%
Enemy 56% 45% 51% 62% 62% 59% 48% 44% 57% 53% 60% 55% 56%
Not sure 13% 18% 15% 11% 11% 12% 24% 16% 5% 13% 12% 16% 11%
Totals 100% 100% 101% 101% 100% 100% 99% 99% 101% 100% 100% 101% 100%
Unweighted N (1,493) (313) (277) (592) (311) (1,084) (160) (164) (85) (274) (329) (549) (341)
Registered Primary Voter Party ID Ideology
Total Voters Dem Rep Dem Ind Rep Lib Mod Con
Ally 2% 1% 1% 4% 1% 2% 2% 1% 1% 2%
Friendly 7% 5% 5% 4% 7% 6% 9% 8% 8% 6%
Unfriendly 22% 24% 25% 25% 25% 21% 21% 23% 27% 18%
continued on the next page . . .
23

The Economist /YouGov PollApril 26 - 28, 2020 - 1500 US Adult citizens
continued from previous pageRegistered Primary Voter Party ID Ideology
Total Voters Dem Rep Dem Ind Rep Lib Mod Con
Enemy 56% 61% 60% 62% 55% 54% 59% 59% 53% 63%
Not sure 13% 9% 10% 5% 12% 17% 9% 8% 12% 10%
Totals 100% 100% 101% 100% 100% 100% 100% 99% 101% 99%
Unweighted N (1,493) (1,217) (562) (335) (534) (582) (377) (447) (450) (454)
24

The Economist /YouGov PollApril 26 - 28, 2020 - 1500 US Adult citizens
2I. Friend Or Enemy — South KoreaDo you consider the countries listed below to be an ally or an enemy of the United States?
Gender Education Income
Total Male Female HS or less Some college College grad Postgrad Under $50K $50-100K $100K or more
Ally 31% 43% 19% 26% 25% 42% 43% 24% 37% 43%
Friendly 32% 32% 32% 29% 36% 31% 32% 30% 36% 32%
Unfriendly 10% 7% 13% 10% 11% 7% 8% 11% 9% 10%
Enemy 10% 7% 12% 11% 11% 8% 6% 12% 7% 6%
Not sure 17% 11% 23% 23% 17% 11% 11% 24% 11% 8%
Totals 100% 100% 99% 99% 100% 99% 100% 101% 100% 99%
Unweighted N (1,494) (665) (829) (468) (528) (302) (196) (595) (442) (287)
Age Race Region
Total 18-29 30-44 45-64 65+ White Black Hispanic Other Northeast Midwest South West
Ally 31% 26% 26% 32% 39% 34% 22% 18% 34% 27% 33% 29% 34%
Friendly 32% 29% 29% 34% 36% 34% 24% 29% 43% 32% 32% 30% 36%
Unfriendly 10% 12% 12% 9% 7% 10% 13% 11% 7% 15% 7% 11% 7%
Enemy 10% 13% 10% 11% 5% 8% 12% 19% 6% 8% 7% 12% 11%
Not sure 17% 21% 23% 14% 12% 15% 29% 24% 10% 18% 20% 18% 12%
Totals 100% 101% 100% 100% 99% 101% 100% 101% 100% 100% 99% 100% 100%
Unweighted N (1,494) (312) (280) (593) (309) (1,084) (162) (163) (85) (274) (329) (549) (342)
Registered Primary Voter Party ID Ideology
Total Voters Dem Rep Dem Ind Rep Lib Mod Con
Ally 31% 38% 40% 40% 34% 28% 31% 38% 31% 32%
Friendly 32% 35% 32% 35% 29% 32% 37% 36% 31% 37%
Unfriendly 10% 9% 10% 10% 13% 9% 9% 7% 12% 9%
continued on the next page . . .
25

The Economist /YouGov PollApril 26 - 28, 2020 - 1500 US Adult citizens
continued from previous pageRegistered Primary Voter Party ID Ideology
Total Voters Dem Rep Dem Ind Rep Lib Mod Con
Enemy 10% 7% 5% 8% 9% 10% 11% 7% 9% 9%
Not sure 17% 11% 13% 6% 16% 22% 12% 12% 17% 13%
Totals 100% 100% 100% 99% 101% 101% 100% 100% 100% 100%
Unweighted N (1,494) (1,217) (563) (334) (536) (581) (377) (448) (448) (456)
26

The Economist /YouGov PollApril 26 - 28, 2020 - 1500 US Adult citizens
2J. Friend Or Enemy — MexicoDo you consider the countries listed below to be an ally or an enemy of the United States?
Gender Education Income
Total Male Female HS or less Some college College grad Postgrad Under $50K $50-100K $100K or more
Ally 16% 20% 13% 13% 14% 24% 24% 13% 17% 24%
Friendly 46% 49% 43% 43% 47% 46% 51% 43% 53% 48%
Unfriendly 18% 16% 20% 17% 20% 18% 16% 17% 18% 18%
Enemy 3% 3% 3% 4% 3% 2% 1% 4% 3% 2%
Not sure 17% 13% 20% 23% 17% 10% 7% 23% 10% 8%
Totals 100% 101% 99% 100% 101% 100% 99% 100% 101% 100%
Unweighted N (1,498) (666) (832) (470) (530) (302) (196) (598) (443) (287)
Age Race Region
Total 18-29 30-44 45-64 65+ White Black Hispanic Other Northeast Midwest South West
Ally 16% 14% 16% 15% 21% 17% 10% 21% 8% 10% 19% 15% 22%
Friendly 46% 44% 44% 48% 47% 45% 42% 48% 60% 50% 41% 45% 48%
Unfriendly 18% 19% 17% 20% 15% 19% 15% 17% 15% 17% 19% 19% 16%
Enemy 3% 2% 4% 3% 3% 3% 5% 3% 1% 2% 4% 3% 2%
Not sure 17% 21% 18% 14% 14% 16% 28% 11% 16% 20% 17% 18% 11%
Totals 100% 100% 99% 100% 100% 100% 100% 100% 100% 99% 100% 100% 99%
Unweighted N (1,498) (313) (280) (593) (312) (1,087) (161) (165) (85) (274) (330) (551) (343)
Registered Primary Voter Party ID Ideology
Total Voters Dem Rep Dem Ind Rep Lib Mod Con
Ally 16% 20% 28% 15% 23% 13% 13% 26% 16% 11%
Friendly 46% 48% 47% 47% 47% 44% 47% 46% 51% 47%
Unfriendly 18% 17% 12% 26% 14% 18% 23% 14% 15% 23%
continued on the next page . . .
27

The Economist /YouGov PollApril 26 - 28, 2020 - 1500 US Adult citizens
continued from previous pageRegistered Primary Voter Party ID Ideology
Total Voters Dem Rep Dem Ind Rep Lib Mod Con
Enemy 3% 3% 2% 4% 3% 3% 3% 3% 2% 3%
Not sure 17% 11% 11% 8% 13% 21% 14% 12% 16% 15%
Totals 100% 99% 100% 100% 100% 99% 100% 101% 100% 99%
Unweighted N (1,498) (1,220) (563) (337) (535) (584) (379) (449) (450) (457)
28

The Economist /YouGov PollApril 26 - 28, 2020 - 1500 US Adult citizens
2K. Friend Or Enemy — RussiaDo you consider the countries listed below to be an ally or an enemy of the United States?
Gender Education Income
Total Male Female HS or less Some college College grad Postgrad Under $50K $50-100K $100K or more
Ally 3% 2% 3% 4% 2% 2% 0% 4% 2% 1%
Friendly 14% 14% 14% 14% 14% 12% 17% 14% 16% 15%
Unfriendly 37% 40% 33% 32% 36% 42% 47% 31% 41% 42%
Enemy 31% 32% 29% 29% 31% 35% 29% 30% 29% 33%
Not sure 16% 12% 20% 22% 17% 10% 7% 21% 12% 9%
Totals 101% 100% 99% 101% 100% 101% 100% 100% 100% 100%
Unweighted N (1,494) (666) (828) (468) (528) (302) (196) (596) (441) (287)
Age Race Region
Total 18-29 30-44 45-64 65+ White Black Hispanic Other Northeast Midwest South West
Ally 3% 3% 4% 3% 0% 2% 7% 3% 1% 3% 1% 3% 3%
Friendly 14% 13% 17% 13% 14% 14% 9% 20% 20% 18% 13% 12% 16%
Unfriendly 37% 37% 37% 37% 35% 39% 25% 31% 45% 29% 38% 36% 43%
Enemy 31% 22% 26% 33% 42% 30% 39% 27% 24% 32% 33% 31% 25%
Not sure 16% 25% 17% 15% 9% 16% 19% 19% 10% 18% 15% 18% 13%
Totals 101% 100% 101% 101% 100% 101% 99% 100% 100% 100% 100% 100% 100%
Unweighted N (1,494) (312) (280) (591) (311) (1,084) (161) (164) (85) (274) (327) (550) (343)
Registered Primary Voter Party ID Ideology
Total Voters Dem Rep Dem Ind Rep Lib Mod Con
Ally 3% 2% 1% 3% 2% 4% 2% 2% 2% 2%
Friendly 14% 14% 10% 20% 11% 14% 18% 10% 19% 15%
Unfriendly 37% 39% 35% 40% 34% 35% 42% 37% 36% 41%
continued on the next page . . .
29

The Economist /YouGov PollApril 26 - 28, 2020 - 1500 US Adult citizens
continued from previous pageRegistered Primary Voter Party ID Ideology
Total Voters Dem Rep Dem Ind Rep Lib Mod Con
Enemy 31% 34% 45% 26% 41% 27% 24% 41% 29% 26%
Not sure 16% 11% 10% 11% 13% 20% 14% 12% 14% 16%
Totals 101% 100% 101% 100% 101% 100% 100% 102% 100% 100%
Unweighted N (1,494) (1,218) (563) (335) (535) (580) (379) (448) (448) (456)
30

The Economist /YouGov PollApril 26 - 28, 2020 - 1500 US Adult citizens
2L. Friend Or Enemy — United KingdomDo you consider the countries listed below to be an ally or an enemy of the United States?
Gender Education Income
Total Male Female HS or less Some college College grad Postgrad Under $50K $50-100K $100K or more
Ally 55% 61% 50% 47% 53% 64% 74% 46% 65% 69%
Friendly 28% 28% 29% 29% 31% 27% 19% 31% 25% 25%
Unfriendly 4% 3% 5% 5% 5% 0% 3% 5% 3% 2%
Enemy 1% 1% 1% 1% 1% 1% 0% 1% 1% 1%
Not sure 12% 8% 15% 17% 10% 8% 4% 16% 7% 4%
Totals 100% 101% 100% 99% 100% 100% 100% 99% 101% 101%
Unweighted N (1,492) (665) (827) (469) (525) (302) (196) (599) (441) (285)
Age Race Region
Total 18-29 30-44 45-64 65+ White Black Hispanic Other Northeast Midwest South West
Ally 55% 42% 49% 61% 66% 60% 44% 35% 56% 51% 59% 54% 58%
Friendly 28% 37% 29% 24% 26% 27% 22% 42% 31% 33% 27% 27% 28%
Unfriendly 4% 3% 5% 4% 3% 3% 5% 9% 7% 3% 3% 4% 5%
Enemy 1% 2% 1% 1% 0% 1% 1% 2% 2% 1% 1% 1% 1%
Not sure 12% 16% 17% 10% 4% 9% 28% 13% 5% 11% 11% 14% 9%
Totals 100% 100% 101% 100% 99% 100% 100% 101% 101% 99% 101% 100% 101%
Unweighted N (1,492) (310) (278) (594) (310) (1,086) (160) (162) (84) (274) (327) (548) (343)
Registered Primary Voter Party ID Ideology
Total Voters Dem Rep Dem Ind Rep Lib Mod Con
Ally 55% 63% 68% 64% 61% 49% 57% 64% 55% 58%
Friendly 28% 26% 21% 27% 24% 30% 31% 27% 31% 28%
Unfriendly 4% 3% 3% 3% 4% 4% 4% 2% 4% 4%
continued on the next page . . .
31

The Economist /YouGov PollApril 26 - 28, 2020 - 1500 US Adult citizens
continued from previous pageRegistered Primary Voter Party ID Ideology
Total Voters Dem Rep Dem Ind Rep Lib Mod Con
Enemy 1% 1% 1% 1% 1% 1% 1% 1% 1% 1%
Not sure 12% 7% 7% 5% 10% 16% 7% 5% 10% 9%
Totals 100% 100% 100% 100% 100% 100% 100% 99% 101% 100%
Unweighted N (1,492) (1,216) (563) (335) (534) (580) (378) (448) (448) (455)
32

The Economist /YouGov PollApril 26 - 28, 2020 - 1500 US Adult citizens
3. Following NewsHow closely are you following the news about COVID-19?
Gender Education Income
Total Male Female HS or less Some college College grad Postgrad Under $50K $50-100K $100K or more
Very closely 41% 40% 41% 31% 40% 47% 63% 35% 44% 52%
Somewhat closely 45% 44% 46% 52% 43% 40% 33% 46% 45% 40%
Not very closely 12% 13% 10% 13% 13% 12% 3% 15% 10% 7%
Not following at all 3% 3% 2% 4% 4% 1% 1% 5% 1% 1%
Totals 101% 100% 99% 100% 100% 100% 100% 101% 100% 100%
Unweighted N (1,497) (665) (832) (469) (530) (302) (196) (597) (443) (287)
Age Race Region
Total 18-29 30-44 45-64 65+ White Black Hispanic Other Northeast Midwest South West
Very closely 41% 25% 40% 43% 52% 42% 38% 36% 37% 42% 38% 41% 42%
Somewhat closely 45% 58% 41% 45% 37% 43% 47% 51% 52% 47% 48% 45% 40%
Not very closely 12% 14% 14% 10% 8% 13% 7% 9% 11% 10% 10% 12% 14%
Not following at all 3% 2% 4% 2% 3% 2% 8% 4% 1% 2% 4% 2% 4%
Totals 101% 99% 99% 100% 100% 100% 100% 100% 101% 101% 100% 100% 100%
Unweighted N (1,497) (312) (279) (593) (313) (1,087) (161) (164) (85) (274) (329) (551) (343)
Registered Primary Voter Party ID Ideology
Total Voters Dem Rep Dem Ind Rep Lib Mod Con
Very closely 41% 49% 57% 48% 51% 34% 37% 53% 40% 38%
Somewhat closely 45% 42% 38% 41% 41% 47% 47% 38% 46% 49%
Not very closely 12% 7% 4% 8% 6% 15% 14% 8% 11% 12%
Not following at all 3% 2% 1% 2% 2% 4% 2% 2% 3% 1%
Totals 101% 100% 100% 99% 100% 100% 100% 101% 100% 100%
continued on the next page . . .
33

The Economist /YouGov PollApril 26 - 28, 2020 - 1500 US Adult citizens
continued from previous pageRegistered Primary Voter Party ID Ideology
Total Voters Dem Rep Dem Ind Rep Lib Mod Con
Unweighted N (1,497) (1,220) (564) (337) (535) (582) (380) (449) (451) (456)
34

The Economist /YouGov PollApril 26 - 28, 2020 - 1500 US Adult citizens
4. Main Source Of NewsWhat is your main source of news?
Gender Education Income
Total Male Female HS or less Some college College grad Postgrad Under $50K $50-100K $100K or more
National broadcastnetwork news (ABC,CBS, NBC, PBS) 21% 16% 24% 19% 24% 21% 15% 20% 23% 21%
Cable news (CNN, FoxNews, MSNBC) 21% 24% 19% 19% 21% 24% 25% 18% 23% 28%
Local television news 14% 13% 15% 19% 11% 10% 8% 16% 12% 7%
National newspapers(New York Times,Washington Post, WallStreet Journal) 6% 6% 6% 2% 5% 10% 16% 3% 8% 12%
Local newspapers 3% 4% 3% 5% 3% 2% 2% 5% 3% 3%
Radio 4% 6% 3% 5% 4% 4% 7% 4% 5% 5%
Social media 12% 10% 14% 13% 12% 12% 7% 14% 11% 5%
Other internet 13% 16% 10% 11% 14% 14% 16% 12% 12% 16%
Other 5% 5% 5% 7% 5% 4% 2% 7% 3% 3%
Totals 99% 100% 99% 100% 99% 101% 98% 99% 100% 100%
Unweighted N (1,495) (664) (831) (469) (528) (302) (196) (596) (442) (287)
Age Race Region
Total 18-29 30-44 45-64 65+ White Black Hispanic Other Northeast Midwest South West
National broadcastnetwork news (ABC,CBS, NBC, PBS) 21% 15% 18% 24% 23% 21% 26% 13% 23% 24% 23% 19% 17%
Cable news (CNN, FoxNews, MSNBC) 21% 10% 18% 24% 33% 22% 19% 23% 16% 24% 19% 21% 22%
Local television news 14% 11% 10% 17% 16% 15% 15% 13% 1% 8% 17% 16% 13%
continued on the next page . . .
35

The Economist /YouGov PollApril 26 - 28, 2020 - 1500 US Adult citizens
continued from previous pageAge Race Region
Total 18-29 30-44 45-64 65+ White Black Hispanic Other Northeast Midwest South West
National newspapers(New York Times,Washington Post, WallStreet Journal) 6% 7% 8% 4% 5% 7% 2% 3% 11% 5% 4% 6% 8%
Local newspapers 3% 4% 5% 2% 3% 3% 5% 7% 0% 3% 2% 4% 3%
Radio 4% 3% 7% 5% 3% 4% 3% 9% 4% 5% 6% 3% 6%
Social media 12% 28% 13% 7% 3% 11% 10% 15% 23% 15% 12% 11% 10%
Other internet 13% 11% 17% 13% 10% 13% 14% 8% 19% 9% 12% 14% 15%
Other 5% 11% 4% 3% 4% 5% 6% 8% 3% 7% 5% 5% 4%
Totals 99% 100% 100% 99% 100% 101% 100% 99% 100% 100% 100% 99% 98%
Unweighted N (1,495) (312) (279) (592) (312) (1,085) (160) (165) (85) (275) (328) (550) (342)
Registered Primary Voter Party ID Ideology
Total Voters Dem Rep Dem Ind Rep Lib Mod Con
National broadcastnetwork news (ABC,CBS, NBC, PBS) 21% 21% 24% 16% 23% 18% 22% 19% 26% 17%
Cable news (CNN, FoxNews, MSNBC) 21% 27% 25% 34% 22% 18% 26% 20% 21% 28%
Local television news 14% 12% 8% 12% 14% 14% 14% 12% 12% 16%
National newspapers(New York Times,Washington Post, WallStreet Journal) 6% 8% 12% 5% 10% 4% 4% 13% 4% 4%
Local newspapers 3% 2% 2% 1% 2% 5% 4% 2% 4% 4%
Radio 4% 5% 4% 6% 6% 2% 6% 3% 5% 5%
Social media 12% 10% 10% 10% 11% 16% 8% 13% 11% 7%
Other internet 13% 13% 12% 11% 9% 17% 12% 13% 14% 13%
continued on the next page . . .
36

The Economist /YouGov PollApril 26 - 28, 2020 - 1500 US Adult citizens
continued from previous pageRegistered Primary Voter Party ID Ideology
Total Voters Dem Rep Dem Ind Rep Lib Mod Con
Other 5% 4% 3% 3% 4% 7% 5% 6% 3% 5%
Totals 99% 102% 100% 98% 101% 101% 101% 101% 100% 99%
Unweighted N (1,495) (1,221) (563) (337) (535) (580) (380) (449) (449) (456)
37

The Economist /YouGov PollApril 26 - 28, 2020 - 1500 US Adult citizens
5. Most Watched Cable News NetworkWhich cable news network do you watch the most?Asked of those who responded that cable news was their main source of news
Gender Education Income
Total Male Female HS or less Some college College grad Postgrad Under $50K $50-100K $100K or more
CNN 33% 33% 32% 26% 29% 41% 49% 27% 31% 44%
Fox News 46% 47% 45% 53% 51% 40% 30% 53% 45% 40%
MSNBC 19% 18% 21% 22% 18% 17% 19% 20% 20% 17%
Other cable newsnetwork 1% 1% 2% 0% 3% 1% 2% 0% 4% 0%
Totals 99% 99% 100% 101% 101% 99% 100% 100% 100% 101%
Unweighted N (370) (191) (179) (111) (130) (72) (57) (135) (118) (77)
Age Race Region
Total 18-29 30-44 45-64 65+ White Black Hispanic Other Northeast Midwest South West
CNN 33% 58% 52% 28% 20% 28% 44% 53% ∗ 41% 26% 30% 36%
Fox News 46% 33% 31% 52% 53% 54% 10% 27% ∗ 37% 53% 49% 45%
MSNBC 19% 8% 16% 18% 26% 17% 46% 17% ∗ 22% 19% 19% 18%
Other cable newsnetwork 1% 1% 1% 1% 1% 1% 0% 3% ∗ 0% 1% 2% 1%
Totals 99% 100% 100% 99% 100% 100% 100% 100% ∗ 100% 99% 100% 100%
Unweighted N (370) (32) (56) (170) (112) (269) (43) (39) (19) (71) (76) (135) (88)
Registered Primary Voter Party ID Ideology
Total Voters Dem Rep Dem Ind Rep Lib Mod Con
CNN 33% 31% 49% 12% 54% 28% 17% 49% 49% 10%
Fox News 46% 47% 9% 86% 7% 53% 81% 7% 26% 86%
MSNBC 19% 21% 41% 0% 37% 18% 2% 42% 25% 2%
continued on the next page . . .
38

The Economist /YouGov PollApril 26 - 28, 2020 - 1500 US Adult citizens
continued from previous pageRegistered Primary Voter Party ID Ideology
Total Voters Dem Rep Dem Ind Rep Lib Mod Con
Other cable newsnetwork 1% 2% 2% 2% 2% 1% 1% 2% 1% 2%
Totals 99% 101% 101% 100% 100% 100% 101% 100% 101% 100%
Unweighted N (370) (342) (154) (120) (141) (114) (115) (105) (103) (147)
39

The Economist /YouGov PollApril 26 - 28, 2020 - 1500 US Adult citizens
6. People I Know – Worn A Face Mask In PublicDo you personally know anyone who... [worn a face mask in public]? Check all that apply.
Gender Education Income
Total Male Female HS or less Some college College grad Postgrad Under $50K $50-100K $100K or more
Yes, me 68% 66% 70% 61% 70% 75% 78% 61% 73% 75%
Yes, a family member 52% 48% 56% 46% 52% 64% 55% 44% 54% 64%
Yes, a close friend 35% 30% 39% 26% 36% 46% 45% 30% 37% 47%
No 13% 17% 9% 19% 11% 6% 7% 17% 12% 7%
Prefer not to say 1% 1% 1% 1% 0% 1% 0% 1% 0% 0%
Unweighted N (1,500) (667) (833) (471) (531) (302) (196) (600) (443) (287)
Age Race Region
Total 18-29 30-44 45-64 65+ White Black Hispanic Other Northeast Midwest South West
Yes, me 68% 61% 65% 69% 78% 66% 73% 77% 64% 88% 59% 63% 67%
Yes, a family member 52% 59% 55% 53% 41% 53% 40% 61% 60% 64% 52% 48% 50%
Yes, a close friend 35% 35% 36% 37% 30% 36% 34% 31% 29% 46% 27% 34% 35%
No 13% 11% 12% 14% 12% 14% 12% 4% 12% 3% 17% 15% 13%
Prefer not to say 1% 1% 2% 1% 0% 1% 1% 0% 0% 1% 0% 1% 1%
Unweighted N (1,500) (313) (280) (594) (313) (1,088) (162) (165) (85) (275) (330) (552) (343)
Registered Primary Voter Party ID Ideology
Total Voters Dem Rep Dem Ind Rep Lib Mod Con
Yes, me 68% 73% 81% 65% 79% 62% 64% 75% 70% 63%
Yes, a family member 52% 55% 63% 51% 58% 48% 51% 63% 49% 47%
Yes, a close friend 35% 40% 48% 34% 44% 32% 29% 42% 37% 28%
No 13% 9% 4% 12% 5% 18% 14% 7% 15% 15%
Prefer not to say 1% 0% 0% 0% 1% 1% 1% 1% 1% 0%
continued on the next page . . .
40

The Economist /YouGov PollApril 26 - 28, 2020 - 1500 US Adult citizens
continued from previous pageRegistered Primary Voter Party ID Ideology
Total Voters Dem Rep Dem Ind Rep Lib Mod Con
Unweighted N (1,500) (1,222) (564) (337) (536) (584) (380) (449) (451) (457)
41

The Economist /YouGov PollApril 26 - 28, 2020 - 1500 US Adult citizens
7. People I Know – Lives In A Part Of The Country Under A Shelter In Place OrderDo you personally know anyone who... [lives in a part of the country under a shelter in place order]? Check all that apply.
Gender Education Income
Total Male Female HS or less Some college College grad Postgrad Under $50K $50-100K $100K or more
Yes, me 65% 65% 65% 62% 62% 73% 73% 61% 70% 77%
Yes, a family member 44% 42% 47% 36% 42% 58% 53% 38% 50% 55%
Yes, a close friend 34% 31% 37% 23% 35% 48% 47% 29% 39% 45%
No 20% 21% 19% 24% 23% 12% 11% 24% 17% 12%
Prefer not to say 2% 2% 2% 3% 2% 1% 0% 2% 0% 1%
Unweighted N (1,500) (667) (833) (471) (531) (302) (196) (600) (443) (287)
Age Race Region
Total 18-29 30-44 45-64 65+ White Black Hispanic Other Northeast Midwest South West
Yes, me 65% 57% 60% 69% 73% 69% 55% 57% 64% 61% 73% 62% 68%
Yes, a family member 44% 44% 48% 46% 38% 47% 33% 43% 40% 44% 48% 42% 45%
Yes, a close friend 34% 35% 39% 34% 29% 37% 22% 27% 38% 34% 30% 36% 35%
No 20% 23% 21% 17% 20% 19% 26% 23% 17% 28% 16% 20% 16%
Prefer not to say 2% 3% 3% 1% 1% 1% 3% 4% 5% 2% 1% 2% 3%
Unweighted N (1,500) (313) (280) (594) (313) (1,088) (162) (165) (85) (275) (330) (552) (343)
Registered Primary Voter Party ID Ideology
Total Voters Dem Rep Dem Ind Rep Lib Mod Con
Yes, me 65% 70% 74% 68% 70% 59% 68% 73% 65% 66%
Yes, a family member 44% 49% 56% 44% 48% 43% 42% 54% 45% 40%
Yes, a close friend 34% 38% 43% 35% 38% 33% 32% 43% 35% 29%
No 20% 17% 13% 18% 18% 23% 17% 15% 18% 21%
Prefer not to say 2% 1% 1% 1% 2% 2% 1% 2% 2% 1%
continued on the next page . . .
42

The Economist /YouGov PollApril 26 - 28, 2020 - 1500 US Adult citizens
continued from previous pageRegistered Primary Voter Party ID Ideology
Total Voters Dem Rep Dem Ind Rep Lib Mod Con
Unweighted N (1,500) (1,222) (564) (337) (536) (584) (380) (449) (451) (457)
43

The Economist /YouGov PollApril 26 - 28, 2020 - 1500 US Adult citizens
8. People I Know – Has Had Their Work Hours Reduced Due To COVID-19Do you personally know anyone who... [has had their work hours reduced due to covid-19]? Check all that apply.
Gender Education Income
Total Male Female HS or less Some college College grad Postgrad Under $50K $50-100K $100K or more
Yes, me 26% 26% 26% 20% 25% 40% 25% 23% 32% 30%
Yes, a family member 37% 32% 42% 32% 39% 42% 39% 35% 40% 40%
Yes, a close friend 29% 29% 29% 24% 27% 40% 34% 24% 36% 33%
No 32% 35% 30% 36% 34% 23% 30% 37% 27% 29%
Prefer not to say 1% 1% 2% 2% 1% 2% 1% 1% 0% 0%
Unweighted N (1,500) (667) (833) (471) (531) (302) (196) (600) (443) (287)
Age Race Region
Total 18-29 30-44 45-64 65+ White Black Hispanic Other Northeast Midwest South West
Yes, me 26% 30% 36% 28% 7% 25% 21% 29% 37% 29% 24% 24% 28%
Yes, a family member 37% 44% 34% 38% 32% 38% 33% 39% 36% 39% 37% 36% 36%
Yes, a close friend 29% 33% 35% 29% 19% 31% 23% 22% 27% 32% 26% 30% 28%
No 32% 22% 27% 32% 49% 32% 39% 30% 31% 31% 35% 34% 28%
Prefer not to say 1% 2% 2% 1% 1% 1% 3% 1% 1% 1% 1% 2% 2%
Unweighted N (1,500) (313) (280) (594) (313) (1,088) (162) (165) (85) (275) (330) (552) (343)
Registered Primary Voter Party ID Ideology
Total Voters Dem Rep Dem Ind Rep Lib Mod Con
Yes, me 26% 27% 29% 29% 26% 27% 24% 31% 27% 22%
Yes, a family member 37% 39% 41% 37% 37% 35% 40% 40% 36% 36%
Yes, a close friend 29% 32% 36% 30% 31% 30% 24% 33% 30% 25%
No 32% 31% 28% 33% 34% 31% 32% 31% 29% 37%
Prefer not to say 1% 1% 0% 0% 1% 2% 1% 1% 2% 2%
continued on the next page . . .
44

The Economist /YouGov PollApril 26 - 28, 2020 - 1500 US Adult citizens
continued from previous pageRegistered Primary Voter Party ID Ideology
Total Voters Dem Rep Dem Ind Rep Lib Mod Con
Unweighted N (1,500) (1,222) (564) (337) (536) (584) (380) (449) (451) (457)
45

The Economist /YouGov PollApril 26 - 28, 2020 - 1500 US Adult citizens
9. People I Know – Has Been Laid Off From Work Due To COVID-19Do you personally know anyone who... [has been laid off from work due to covid-19]? Check all that apply.
Gender Education Income
Total Male Female HS or less Some college College grad Postgrad Under $50K $50-100K $100K or more
Yes, me 14% 16% 13% 17% 14% 13% 9% 14% 15% 15%
Yes, a family member 26% 24% 27% 26% 29% 22% 20% 27% 25% 23%
Yes, a close friend 26% 26% 27% 19% 29% 38% 26% 24% 31% 29%
No 44% 46% 43% 46% 42% 42% 50% 43% 45% 46%
Prefer not to say 2% 1% 2% 2% 1% 1% 2% 1% 0% 0%
Unweighted N (1,500) (667) (833) (471) (531) (302) (196) (600) (443) (287)
Age Race Region
Total 18-29 30-44 45-64 65+ White Black Hispanic Other Northeast Midwest South West
Yes, me 14% 21% 17% 15% 3% 12% 10% 31% 24% 18% 15% 13% 13%
Yes, a family member 26% 31% 22% 27% 21% 25% 33% 24% 23% 31% 24% 25% 24%
Yes, a close friend 26% 29% 32% 26% 18% 28% 21% 26% 23% 32% 22% 27% 26%
No 44% 33% 41% 45% 59% 46% 42% 36% 39% 38% 47% 46% 44%
Prefer not to say 2% 3% 2% 1% 1% 2% 2% 0% 3% 2% 1% 2% 2%
Unweighted N (1,500) (313) (280) (594) (313) (1,088) (162) (165) (85) (275) (330) (552) (343)
Registered Primary Voter Party ID Ideology
Total Voters Dem Rep Dem Ind Rep Lib Mod Con
Yes, me 14% 12% 12% 12% 14% 16% 12% 18% 12% 12%
Yes, a family member 26% 25% 26% 24% 26% 26% 25% 28% 26% 23%
Yes, a close friend 26% 27% 32% 25% 28% 30% 20% 30% 29% 20%
No 44% 47% 43% 50% 45% 39% 50% 40% 44% 51%
Prefer not to say 2% 1% 1% 0% 2% 2% 1% 1% 1% 2%
continued on the next page . . .
46
The Economist /YouGov PollApril 26 - 28, 2020 - 1500 US Adult citizens
continued from previous pageRegistered Primary Voter Party ID Ideology
Total Voters Dem Rep Dem Ind Rep Lib Mod Con
Unweighted N (1,500) (1,222) (564) (337) (536) (584) (380) (449) (451) (457)
47
The Economist /YouGov PollApril 26 - 28, 2020 - 1500 US Adult citizens
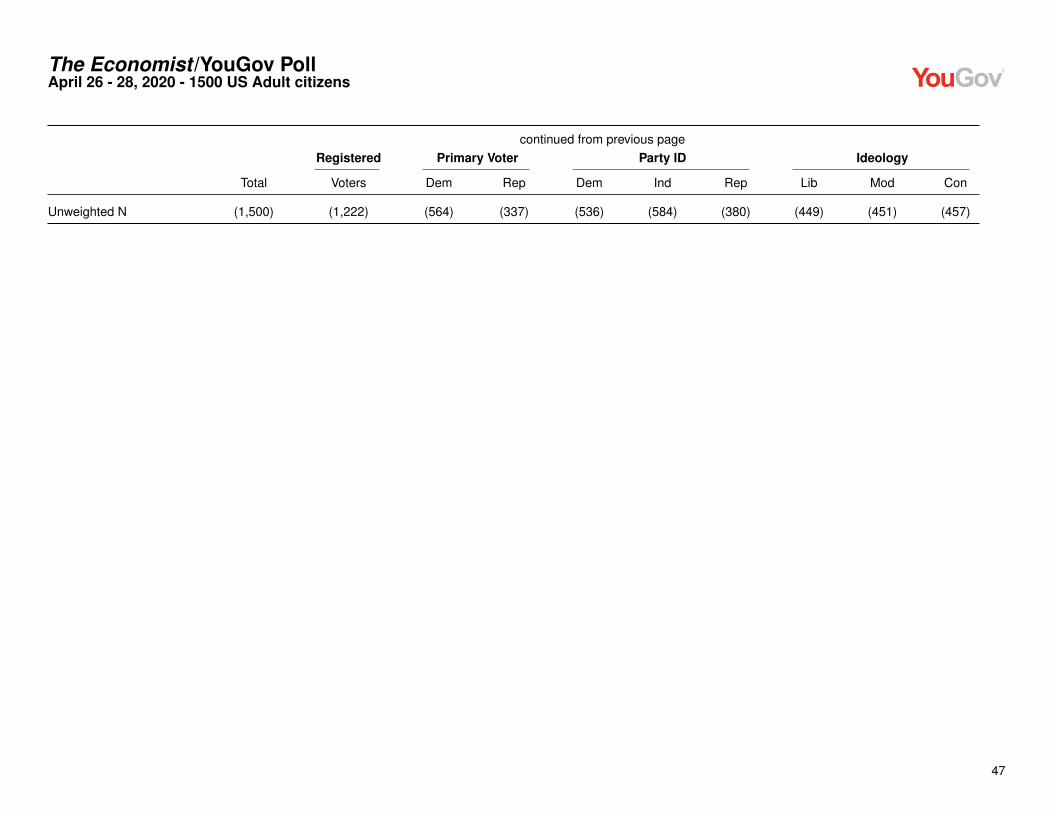
10. People I Know – Has Had To Start Working From Home Due To COVID-19Do you personally know anyone who... [has had to start working from home due to covid-19]? Check all that apply.
Gender Education Income
Total Male Female HS or less Some college College grad Postgrad Under $50K $50-100K $100K or more
Yes, me 21% 22% 20% 9% 15% 44% 40% 12% 24% 43%
Yes, a family member 38% 38% 39% 34% 35% 48% 45% 30% 43% 51%
Yes, a close friend 27% 23% 30% 17% 27% 39% 39% 19% 30% 40%
No 35% 38% 33% 47% 37% 17% 20% 47% 28% 19%
Prefer not to say 2% 1% 2% 3% 1% 1% 1% 2% 1% 0%
Unweighted N (1,500) (667) (833) (471) (531) (302) (196) (600) (443) (287)
Age Race Region
Total 18-29 30-44 45-64 65+ White Black Hispanic Other Northeast Midwest South West
Yes, me 21% 31% 28% 20% 6% 21% 16% 24% 32% 24% 21% 20% 20%
Yes, a family member 38% 47% 35% 36% 38% 40% 37% 30% 37% 41% 38% 37% 38%
Yes, a close friend 27% 27% 34% 26% 19% 28% 27% 20% 28% 25% 28% 27% 28%
No 35% 26% 32% 38% 44% 34% 31% 46% 33% 32% 33% 38% 34%
Prefer not to say 2% 2% 3% 1% 1% 2% 3% 0% 1% 3% 1% 2% 1%
Unweighted N (1,500) (313) (280) (594) (313) (1,088) (162) (165) (85) (275) (330) (552) (343)
Registered Primary Voter Party ID Ideology
Total Voters Dem Rep Dem Ind Rep Lib Mod Con
Yes, me 21% 25% 31% 22% 24% 21% 18% 32% 21% 16%
Yes, a family member 38% 42% 45% 38% 40% 36% 39% 47% 37% 37%
Yes, a close friend 27% 31% 38% 28% 33% 24% 23% 34% 26% 25%
No 35% 30% 24% 33% 32% 38% 36% 25% 35% 39%
Prefer not to say 2% 1% 1% 0% 2% 1% 2% 1% 1% 1%
continued on the next page . . .
48

The Economist /YouGov PollApril 26 - 28, 2020 - 1500 US Adult citizens
continued from previous pageRegistered Primary Voter Party ID Ideology
Total Voters Dem Rep Dem Ind Rep Lib Mod Con
Unweighted N (1,500) (1,222) (564) (337) (536) (584) (380) (449) (451) (457)
49

The Economist /YouGov PollApril 26 - 28, 2020 - 1500 US Adult citizens
11. People I Know – Has Tested Positive For COVID-19Do you personally know anyone who... [has tested positive for covid-19]? Check all that apply.
Gender Education Income
Total Male Female HS or less Some college College grad Postgrad Under $50K $50-100K $100K or more
Yes, me 1% 1% 1% 1% 1% 1% 1% 1% 1% 1%
Yes, a family member 5% 4% 6% 5% 4% 6% 4% 5% 3% 7%
Yes, a close friend 8% 7% 9% 6% 8% 12% 13% 6% 11% 11%
No 84% 85% 82% 84% 87% 80% 81% 84% 85% 80%
Prefer not to say 2% 2% 2% 3% 1% 1% 1% 1% 0% 1%
Unweighted N (1,500) (667) (833) (471) (531) (302) (196) (600) (443) (287)
Age Race Region
Total 18-29 30-44 45-64 65+ White Black Hispanic Other Northeast Midwest South West
Yes, me 1% 1% 1% 1% 0% 0% 2% 2% 0% 1% 0% 1% 1%
Yes, a family member 5% 6% 7% 4% 2% 4% 8% 7% 6% 6% 6% 4% 3%
Yes, a close friend 8% 10% 10% 7% 7% 8% 8% 11% 12% 12% 7% 8% 6%
No 84% 79% 79% 85% 90% 86% 77% 80% 79% 79% 84% 85% 86%
Prefer not to say 2% 3% 2% 2% 0% 2% 2% 0% 4% 2% 1% 1% 3%
Unweighted N (1,500) (313) (280) (594) (313) (1,088) (162) (165) (85) (275) (330) (552) (343)
Registered Primary Voter Party ID Ideology
Total Voters Dem Rep Dem Ind Rep Lib Mod Con
Yes, me 1% 1% 1% 1% 1% 1% 1% 1% 0% 1%
Yes, a family member 5% 5% 5% 6% 6% 4% 4% 5% 5% 5%
Yes, a close friend 8% 10% 10% 9% 9% 8% 9% 8% 10% 8%
No 84% 83% 83% 83% 84% 83% 84% 85% 83% 84%
Prefer not to say 2% 1% 1% 0% 1% 2% 1% 2% 2% 1%
continued on the next page . . .
50

The Economist /YouGov PollApril 26 - 28, 2020 - 1500 US Adult citizens
continued from previous pageRegistered Primary Voter Party ID Ideology
Total Voters Dem Rep Dem Ind Rep Lib Mod Con
Unweighted N (1,500) (1,222) (564) (337) (536) (584) (380) (449) (451) (457)
51

The Economist /YouGov PollApril 26 - 28, 2020 - 1500 US Adult citizens
12. People I Know – Has Died Due To Complications From COVID-19Do you personally know anyone who... [has died due to complications from covid-19]? Check all that apply.
Gender Education Income
Total Male Female HS or less Some college College grad Postgrad Under $50K $50-100K $100K or more
Yes, a family member 3% 1% 4% 3% 3% 2% 2% 2% 1% 5%
Yes, a close friend 7% 7% 7% 7% 6% 10% 4% 7% 6% 9%
No 89% 90% 88% 88% 90% 87% 93% 89% 92% 86%
Prefer not to say 1% 2% 1% 2% 1% 1% 1% 1% 1% 1%
Unweighted N (1,500) (667) (833) (471) (531) (302) (196) (600) (443) (287)
Age Race Region
Total 18-29 30-44 45-64 65+ White Black Hispanic Other Northeast Midwest South West
Yes, a family member 3% 2% 3% 3% 2% 2% 6% 1% 4% 3% 2% 3% 2%
Yes, a close friend 7% 6% 10% 7% 5% 6% 13% 9% 8% 8% 6% 8% 5%
No 89% 89% 85% 90% 93% 91% 79% 87% 88% 87% 92% 88% 91%
Prefer not to say 1% 3% 2% 1% 0% 1% 2% 2% 1% 2% 0% 1% 2%
Unweighted N (1,500) (313) (280) (594) (313) (1,088) (162) (165) (85) (275) (330) (552) (343)
Registered Primary Voter Party ID Ideology
Total Voters Dem Rep Dem Ind Rep Lib Mod Con
Yes, a family member 3% 3% 3% 2% 4% 2% 2% 2% 3% 3%
Yes, a close friend 7% 7% 9% 5% 9% 7% 5% 6% 9% 6%
No 89% 89% 88% 91% 87% 89% 92% 90% 86% 91%
Prefer not to say 1% 1% 0% 1% 1% 2% 1% 2% 1% 1%
Unweighted N (1,500) (1,222) (564) (337) (536) (584) (380) (449) (451) (457)
52

The Economist /YouGov PollApril 26 - 28, 2020 - 1500 US Adult citizens
13. Effectiveness Of Face MasksHow effective do you believe face masks are in limiting the spread of COVID-19?
Gender Education Income
Total Male Female HS or less Some college College grad Postgrad Under $50K $50-100K $100K or more
Extremely effective 8% 6% 10% 9% 10% 5% 7% 9% 8% 9%
Very effective 23% 24% 22% 22% 22% 25% 26% 21% 25% 27%
Somewhat effective 51% 51% 51% 48% 50% 56% 54% 51% 52% 48%
Not very effective 13% 13% 13% 15% 13% 12% 11% 15% 11% 12%
Not at all effective 5% 6% 4% 7% 5% 2% 2% 5% 4% 5%
Totals 100% 100% 100% 101% 100% 100% 100% 101% 100% 101%
Unweighted N (1,500) (667) (833) (471) (531) (302) (196) (600) (443) (287)
Age Race Region
Total 18-29 30-44 45-64 65+ White Black Hispanic Other Northeast Midwest South West
Extremely effective 8% 6% 11% 8% 7% 6% 17% 11% 9% 8% 5% 10% 8%
Very effective 23% 27% 20% 22% 25% 22% 18% 37% 21% 27% 26% 20% 21%
Somewhat effective 51% 44% 52% 53% 52% 53% 47% 38% 51% 50% 57% 49% 48%
Not very effective 13% 18% 13% 12% 11% 14% 13% 8% 15% 11% 7% 16% 16%
Not at all effective 5% 5% 4% 5% 4% 4% 4% 7% 3% 4% 4% 4% 6%
Totals 100% 100% 100% 100% 99% 99% 99% 101% 99% 100% 99% 99% 99%
Unweighted N (1,500) (313) (280) (594) (313) (1,088) (162) (165) (85) (275) (330) (552) (343)
Registered Primary Voter Party ID Ideology
Total Voters Dem Rep Dem Ind Rep Lib Mod Con
Extremely effective 8% 9% 11% 8% 11% 6% 7% 8% 9% 8%
Very effective 23% 24% 28% 20% 26% 22% 21% 29% 24% 19%
Somewhat effective 51% 51% 53% 49% 54% 50% 49% 53% 53% 48%
continued on the next page . . .
53

The Economist /YouGov PollApril 26 - 28, 2020 - 1500 US Adult citizens
continued from previous pageRegistered Primary Voter Party ID Ideology
Total Voters Dem Rep Dem Ind Rep Lib Mod Con
Not very effective 13% 11% 7% 15% 8% 16% 17% 9% 11% 17%
Not at all effective 5% 4% 1% 8% 1% 7% 7% 1% 4% 7%
Totals 100% 99% 100% 100% 100% 101% 101% 100% 101% 99%
Unweighted N (1,500) (1,222) (564) (337) (536) (584) (380) (449) (451) (457)
54

The Economist /YouGov PollApril 26 - 28, 2020 - 1500 US Adult citizens
14. Personal Worry About COVID-19Taking into consideration both your risk of contracting it and the seriousness of the illness, how worried are you personally about experiencing COVID-19?
Gender Education Income
Total Male Female HS or less Some college College grad Postgrad Under $50K $50-100K $100K or more
Very worried 22% 19% 24% 21% 21% 23% 22% 23% 20% 23%
Somewhat worried 42% 40% 44% 41% 40% 45% 48% 38% 45% 43%
Not too worried 27% 30% 23% 28% 27% 24% 24% 27% 27% 25%
Not worried at all 10% 12% 8% 10% 12% 8% 7% 11% 9% 9%
Totals 101% 101% 99% 100% 100% 100% 101% 99% 101% 100%
Unweighted N (1,495) (667) (828) (467) (531) (301) (196) (597) (442) (287)
Age Race Region
Total 18-29 30-44 45-64 65+ White Black Hispanic Other Northeast Midwest South West
Very worried 22% 17% 18% 27% 22% 21% 26% 21% 21% 22% 22% 21% 22%
Somewhat worried 42% 42% 49% 37% 43% 43% 29% 51% 44% 44% 44% 43% 36%
Not too worried 27% 29% 25% 26% 27% 28% 29% 18% 23% 26% 27% 25% 29%
Not worried at all 10% 13% 8% 10% 9% 9% 17% 9% 12% 8% 7% 11% 13%
Totals 101% 101% 100% 100% 101% 101% 101% 99% 100% 100% 100% 100% 100%
Unweighted N (1,495) (311) (279) (594) (311) (1,085) (161) (165) (84) (274) (329) (549) (343)
Registered Primary Voter Party ID Ideology
Total Voters Dem Rep Dem Ind Rep Lib Mod Con
Very worried 22% 24% 32% 15% 33% 18% 14% 31% 22% 12%
Somewhat worried 42% 41% 47% 34% 45% 42% 39% 47% 44% 37%
Not too worried 27% 26% 17% 37% 19% 28% 34% 18% 26% 35%
Not worried at all 10% 9% 4% 15% 3% 13% 14% 4% 8% 16%
Totals 101% 100% 100% 101% 100% 101% 101% 100% 100% 100%
continued on the next page . . .
55

The Economist /YouGov PollApril 26 - 28, 2020 - 1500 US Adult citizens
continued from previous pageRegistered Primary Voter Party ID Ideology
Total Voters Dem Rep Dem Ind Rep Lib Mod Con
Unweighted N (1,495) (1,218) (563) (335) (534) (584) (377) (449) (449) (455)
56

The Economist /YouGov PollApril 26 - 28, 2020 - 1500 US Adult citizens
15. Stay-At-Home Order EffectivenessDo you think stay-at-home orders are effective at slowing the spread of COVID-19?
Gender Education Income
Total Male Female HS or less Some college College grad Postgrad Under $50K $50-100K $100K or more
Extremely effective 27% 23% 30% 24% 25% 31% 33% 25% 26% 30%
Very effective 32% 30% 33% 31% 32% 33% 32% 29% 37% 31%
Somewhat effective 30% 32% 28% 31% 29% 28% 29% 32% 25% 29%
Not very effective 9% 11% 7% 11% 8% 6% 5% 9% 10% 7%
Not at all effective 3% 4% 3% 3% 5% 2% 1% 4% 2% 3%
Totals 101% 100% 101% 100% 99% 100% 100% 99% 100% 100%
Unweighted N (1,491) (662) (829) (469) (528) (299) (195) (599) (442) (282)
Age Race Region
Total 18-29 30-44 45-64 65+ White Black Hispanic Other Northeast Midwest South West
Extremely effective 27% 23% 28% 27% 29% 26% 33% 29% 20% 31% 23% 27% 26%
Very effective 32% 28% 27% 30% 43% 33% 29% 29% 27% 29% 39% 30% 29%
Somewhat effective 30% 34% 36% 30% 18% 31% 21% 29% 35% 32% 30% 29% 28%
Not very effective 9% 11% 8% 9% 7% 7% 15% 10% 11% 7% 5% 10% 11%
Not at all effective 3% 3% 2% 4% 3% 3% 2% 4% 7% 1% 3% 3% 6%
Totals 101% 99% 101% 100% 100% 100% 100% 101% 100% 100% 100% 99% 100%
Unweighted N (1,491) (309) (278) (591) (313) (1,083) (160) (164) (84) (272) (329) (550) (340)
Registered Primary Voter Party ID Ideology
Total Voters Dem Rep Dem Ind Rep Lib Mod Con
Extremely effective 27% 31% 44% 18% 40% 23% 17% 42% 30% 14%
Very effective 32% 34% 37% 27% 39% 27% 30% 37% 31% 29%
Somewhat effective 30% 25% 16% 36% 18% 34% 37% 15% 30% 37%
continued on the next page . . .
57

The Economist /YouGov PollApril 26 - 28, 2020 - 1500 US Adult citizens
continued from previous pageRegistered Primary Voter Party ID Ideology
Total Voters Dem Rep Dem Ind Rep Lib Mod Con
Not very effective 9% 7% 1% 13% 3% 12% 11% 5% 6% 15%
Not at all effective 3% 3% 1% 6% 0% 5% 5% 0% 3% 5%
Totals 101% 100% 99% 100% 100% 101% 100% 99% 100% 100%
Unweighted N (1,491) (1,215) (561) (337) (533) (578) (380) (446) (445) (457)
58
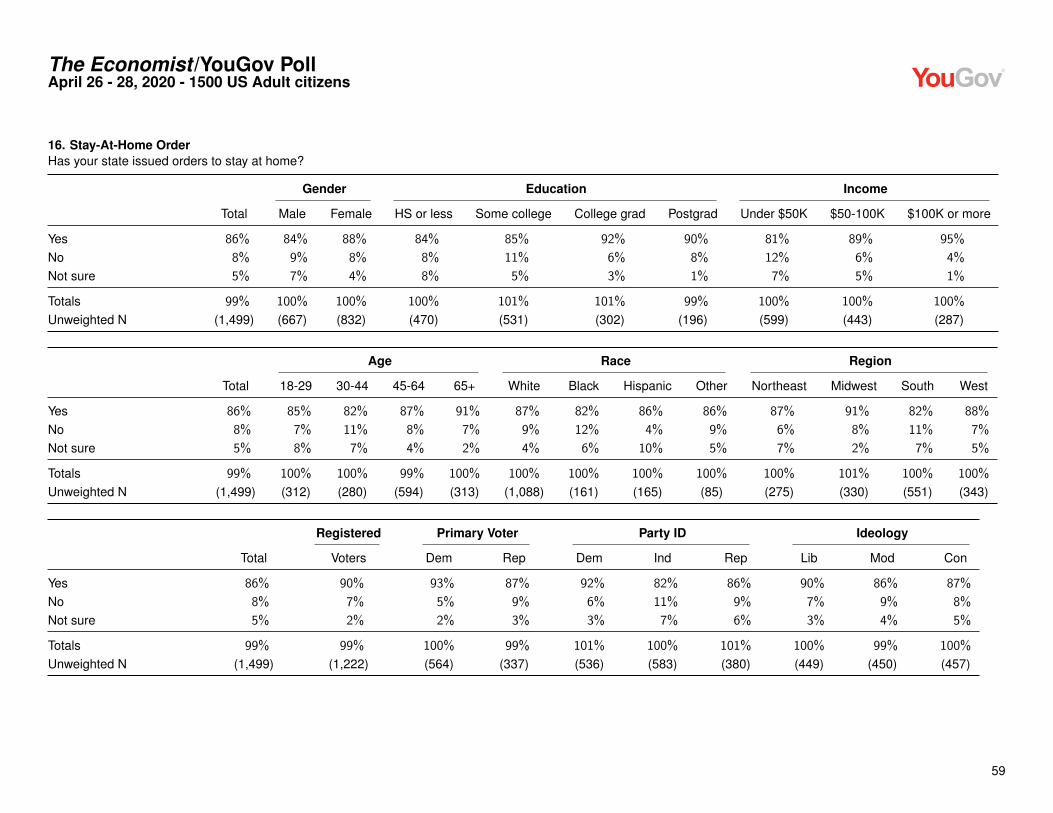
The Economist /YouGov PollApril 26 - 28, 2020 - 1500 US Adult citizens
16. Stay-At-Home OrderHas your state issued orders to stay at home?
Gender Education Income
Total Male Female HS or less Some college College grad Postgrad Under $50K $50-100K $100K or more
Yes 86% 84% 88% 84% 85% 92% 90% 81% 89% 95%
No 8% 9% 8% 8% 11% 6% 8% 12% 6% 4%
Not sure 5% 7% 4% 8% 5% 3% 1% 7% 5% 1%
Totals 99% 100% 100% 100% 101% 101% 99% 100% 100% 100%
Unweighted N (1,499) (667) (832) (470) (531) (302) (196) (599) (443) (287)
Age Race Region
Total 18-29 30-44 45-64 65+ White Black Hispanic Other Northeast Midwest South West
Yes 86% 85% 82% 87% 91% 87% 82% 86% 86% 87% 91% 82% 88%
No 8% 7% 11% 8% 7% 9% 12% 4% 9% 6% 8% 11% 7%
Not sure 5% 8% 7% 4% 2% 4% 6% 10% 5% 7% 2% 7% 5%
Totals 99% 100% 100% 99% 100% 100% 100% 100% 100% 100% 101% 100% 100%
Unweighted N (1,499) (312) (280) (594) (313) (1,088) (161) (165) (85) (275) (330) (551) (343)
Registered Primary Voter Party ID Ideology
Total Voters Dem Rep Dem Ind Rep Lib Mod Con
Yes 86% 90% 93% 87% 92% 82% 86% 90% 86% 87%
No 8% 7% 5% 9% 6% 11% 9% 7% 9% 8%
Not sure 5% 2% 2% 3% 3% 7% 6% 3% 4% 5%
Totals 99% 99% 100% 99% 101% 100% 101% 100% 99% 100%
Unweighted N (1,499) (1,222) (564) (337) (536) (583) (380) (449) (450) (457)
59

The Economist /YouGov PollApril 26 - 28, 2020 - 1500 US Adult citizens
17. Stay-At-Home Order Infringing On RightsDo you believe that a stay-at-home order is a violation of constitutional rights?
Gender Education Income
Total Male Female HS or less Some college College grad Postgrad Under $50K $50-100K $100K or more
Yes 21% 26% 17% 24% 22% 20% 14% 22% 20% 20%
No 65% 60% 70% 60% 65% 70% 77% 63% 69% 69%
Not sure 13% 13% 13% 16% 13% 11% 9% 16% 11% 11%
Totals 99% 99% 100% 100% 100% 101% 100% 101% 100% 100%
Unweighted N (1,499) (667) (832) (471) (531) (301) (196) (600) (443) (286)
Age Race Region
Total 18-29 30-44 45-64 65+ White Black Hispanic Other Northeast Midwest South West
Yes 21% 18% 20% 25% 20% 22% 15% 22% 29% 17% 16% 21% 31%
No 65% 67% 68% 61% 68% 65% 69% 63% 62% 68% 73% 65% 56%
Not sure 13% 15% 12% 13% 13% 13% 15% 15% 8% 16% 11% 14% 13%
Totals 99% 100% 100% 99% 101% 100% 99% 100% 99% 101% 100% 100% 100%
Unweighted N (1,499) (313) (280) (593) (313) (1,087) (162) (165) (85) (274) (330) (552) (343)
Registered Primary Voter Party ID Ideology
Total Voters Dem Rep Dem Ind Rep Lib Mod Con
Yes 21% 21% 7% 41% 7% 24% 36% 9% 16% 37%
No 65% 68% 86% 48% 84% 60% 50% 85% 71% 47%
Not sure 13% 10% 7% 11% 9% 16% 14% 6% 13% 16%
Totals 99% 99% 100% 100% 100% 100% 100% 100% 100% 100%
Unweighted N (1,499) (1,221) (564) (336) (536) (584) (379) (449) (451) (456)
60

The Economist /YouGov PollApril 26 - 28, 2020 - 1500 US Adult citizens
18. COVID-19 Personal RiskHow serious a risk is COVID-19 to your personal health?
Gender Education Income
Total Male Female HS or less Some college College grad Postgrad Under $50K $50-100K $100K or more
My single greatest healthrisk 19% 17% 20% 20% 17% 17% 19% 18% 18% 16%
A very serious risk, butnot my greatest risk 31% 28% 33% 28% 31% 32% 36% 31% 31% 32%
One of many risks I face 33% 37% 29% 30% 32% 38% 34% 32% 36% 32%
Not a risk 18% 18% 18% 22% 20% 13% 11% 19% 15% 20%
Totals 101% 100% 100% 100% 100% 100% 100% 100% 100% 100%
Unweighted N (1,499) (666) (833) (470) (531) (302) (196) (599) (443) (287)
Age Race Region
Total 18-29 30-44 45-64 65+ White Black Hispanic Other Northeast Midwest South West
My single greatest healthrisk 19% 15% 16% 18% 25% 18% 24% 16% 16% 19% 19% 20% 15%
A very serious risk, butnot my greatest risk 31% 24% 34% 31% 33% 30% 29% 39% 22% 33% 31% 30% 29%
One of many risks I face 33% 31% 33% 33% 34% 34% 25% 25% 41% 36% 33% 31% 32%
Not a risk 18% 30% 17% 18% 8% 17% 22% 19% 21% 13% 17% 19% 24%
Totals 101% 100% 100% 100% 100% 99% 100% 99% 100% 101% 100% 100% 100%
Unweighted N (1,499) (312) (280) (594) (313) (1,087) (162) (165) (85) (275) (330) (551) (343)
Registered Primary Voter Party ID Ideology
Total Voters Dem Rep Dem Ind Rep Lib Mod Con
My single greatest healthrisk 19% 20% 28% 12% 27% 16% 12% 28% 20% 10%
continued on the next page . . .
61

The Economist /YouGov PollApril 26 - 28, 2020 - 1500 US Adult citizens
continued from previous pageRegistered Primary Voter Party ID Ideology
Total Voters Dem Rep Dem Ind Rep Lib Mod Con
A very serious risk, butnot my greatest risk 31% 33% 40% 23% 38% 29% 25% 36% 31% 27%
One of many risks I face 33% 32% 25% 40% 25% 36% 38% 27% 30% 39%
Not a risk 18% 15% 7% 25% 11% 19% 26% 9% 18% 24%
Totals 101% 100% 100% 100% 101% 100% 101% 100% 99% 100%
Unweighted N (1,499) (1,221) (564) (337) (536) (584) (379) (448) (451) (457)
62

The Economist /YouGov PollApril 26 - 28, 2020 - 1500 US Adult citizens
19. Length Of OutbreakHow much longer do you think the current situation with COVID-19 outbreak will go on?
Gender Education Income
Total Male Female HS or less Some college College grad Postgrad Under $50K $50-100K $100K or more
A month or so 18% 19% 17% 18% 20% 16% 16% 18% 19% 17%
Several months 37% 37% 38% 37% 36% 37% 44% 32% 46% 44%
About a year 19% 21% 18% 17% 16% 28% 22% 21% 17% 23%
Longer 11% 10% 13% 10% 14% 10% 12% 11% 10% 9%
Not sure 14% 13% 15% 18% 14% 10% 6% 18% 7% 7%
Totals 99% 100% 101% 100% 100% 101% 100% 100% 99% 100%
Unweighted N (1,497) (665) (832) (469) (531) (302) (195) (598) (443) (286)
Age Race Region
Total 18-29 30-44 45-64 65+ White Black Hispanic Other Northeast Midwest South West
A month or so 18% 19% 13% 18% 23% 20% 11% 16% 14% 17% 15% 17% 23%
Several months 37% 35% 45% 36% 32% 38% 25% 45% 44% 38% 37% 36% 40%
About a year 19% 27% 19% 18% 14% 18% 24% 20% 23% 23% 26% 16% 15%
Longer 11% 8% 14% 12% 11% 12% 11% 7% 13% 9% 10% 13% 11%
Not sure 14% 12% 9% 16% 19% 12% 29% 12% 6% 12% 12% 18% 11%
Totals 99% 101% 100% 100% 99% 100% 100% 100% 100% 99% 100% 100% 100%
Unweighted N (1,497) (313) (278) (594) (312) (1,087) (162) (164) (84) (275) (330) (551) (341)
Registered Primary Voter Party ID Ideology
Total Voters Dem Rep Dem Ind Rep Lib Mod Con
A month or so 18% 19% 10% 34% 12% 17% 27% 9% 15% 29%
Several months 37% 40% 43% 34% 42% 32% 40% 38% 42% 35%
About a year 19% 18% 21% 14% 22% 21% 13% 28% 17% 15%
continued on the next page . . .
63

The Economist /YouGov PollApril 26 - 28, 2020 - 1500 US Adult citizens
continued from previous pageRegistered Primary Voter Party ID Ideology
Total Voters Dem Rep Dem Ind Rep Lib Mod Con
Longer 11% 11% 16% 4% 14% 13% 5% 14% 12% 6%
Not sure 14% 12% 9% 14% 11% 16% 15% 10% 13% 16%
Totals 99% 100% 99% 100% 101% 99% 100% 99% 99% 101%
Unweighted N (1,497) (1,221) (564) (336) (536) (583) (378) (449) (451) (455)
64

The Economist /YouGov PollApril 26 - 28, 2020 - 1500 US Adult citizens
20. Length Of Social DistancingWhen do you think it will be safe to end social distancing measures and re-open businesses as normal?
Gender Education Income
Total Male Female HS or less Some college College grad Postgrad Under $50K $50-100K $100K or more
It is safe right now 10% 12% 9% 10% 11% 10% 6% 10% 9% 11%
In about two weeks 6% 6% 6% 7% 6% 5% 7% 7% 5% 7%
In a month or so 21% 21% 21% 24% 21% 17% 17% 21% 25% 18%
In several months 34% 35% 32% 31% 31% 39% 41% 30% 36% 40%
In about a year or longer 14% 12% 15% 12% 13% 16% 16% 12% 15% 16%
Not sure 15% 13% 17% 15% 18% 13% 13% 20% 9% 8%
Totals 100% 99% 100% 99% 100% 100% 100% 100% 99% 100%
Unweighted N (1,498) (667) (831) (470) (531) (301) (196) (599) (443) (287)
Age Race Region
Total 18-29 30-44 45-64 65+ White Black Hispanic Other Northeast Midwest South West
It is safe right now 10% 8% 8% 12% 12% 11% 7% 9% 13% 5% 8% 10% 17%
In about two weeks 6% 7% 7% 5% 7% 6% 6% 11% 4% 6% 5% 6% 9%
In a month or so 21% 26% 21% 18% 21% 21% 23% 22% 11% 25% 24% 20% 15%
In several months 34% 35% 39% 31% 30% 34% 31% 38% 31% 37% 37% 33% 29%
In about a year or longer 14% 11% 11% 17% 15% 14% 12% 13% 20% 16% 14% 12% 15%
Not sure 15% 14% 14% 17% 16% 15% 22% 7% 20% 11% 13% 19% 15%
Totals 100% 101% 100% 100% 101% 101% 101% 100% 99% 100% 101% 100% 100%
Unweighted N (1,498) (311) (280) (594) (313) (1,088) (162) (164) (84) (274) (329) (552) (343)
Registered Primary Voter Party ID Ideology
Total Voters Dem Rep Dem Ind Rep Lib Mod Con
It is safe right now 10% 10% 3% 23% 2% 12% 17% 4% 7% 20%
continued on the next page . . .
65

The Economist /YouGov PollApril 26 - 28, 2020 - 1500 US Adult citizens
continued from previous pageRegistered Primary Voter Party ID Ideology
Total Voters Dem Rep Dem Ind Rep Lib Mod Con
In about two weeks 6% 7% 4% 8% 4% 7% 9% 4% 4% 11%
In a month or so 21% 20% 16% 23% 17% 21% 25% 14% 24% 24%
In several months 34% 36% 44% 28% 46% 28% 28% 45% 36% 26%
In about a year or longer 14% 14% 19% 8% 18% 14% 8% 20% 15% 7%
Not sure 15% 13% 14% 11% 14% 18% 13% 14% 15% 13%
Totals 100% 100% 100% 101% 101% 100% 100% 101% 101% 101%
Unweighted N (1,498) (1,222) (564) (337) (536) (582) (380) (448) (451) (457)
66

The Economist /YouGov PollApril 26 - 28, 2020 - 1500 US Adult citizens
21. End Social Distancing By May 1When do you think it will be safe to end social distancing measures and re-open businesses as normal?Compiled from answers about when people think it will be safe to end social distancing measures
Gender Education Income
Total Male Female HS or less Some college College grad Postgrad Under $50K $50-100K $100K or more
Before or by May 1 16% 18% 15% 17% 17% 15% 13% 17% 14% 18%
After May 1 68% 68% 68% 68% 65% 72% 74% 64% 76% 73%
Not sure 15% 13% 17% 15% 18% 13% 13% 20% 9% 8%
Totals 99% 99% 100% 100% 100% 100% 100% 101% 99% 99%
Unweighted N (1,498) (667) (831) (470) (531) (301) (196) (599) (443) (287)
Age Race Region
Total 18-29 30-44 45-64 65+ White Black Hispanic Other Northeast Midwest South West
Before or by May 1 16% 14% 16% 17% 19% 16% 13% 20% 17% 11% 13% 16% 26%
After May 1 68% 72% 71% 66% 65% 69% 65% 73% 63% 78% 74% 66% 59%
Not sure 15% 14% 14% 17% 16% 15% 22% 7% 20% 11% 13% 19% 15%
Totals 99% 100% 101% 100% 100% 100% 100% 100% 100% 100% 100% 101% 100%
Unweighted N (1,498) (311) (280) (594) (313) (1,088) (162) (164) (84) (274) (329) (552) (343)
Registered Primary Voter Party ID Ideology
Total Voters Dem Rep Dem Ind Rep Lib Mod Con
Before or by May 1 16% 17% 7% 31% 5% 19% 26% 8% 11% 30%
After May 1 68% 69% 79% 59% 81% 63% 61% 79% 74% 57%
Not sure 15% 13% 14% 11% 14% 18% 13% 14% 15% 13%
Totals 99% 99% 100% 101% 100% 100% 100% 101% 100% 100%
Unweighted N (1,498) (1,222) (564) (337) (536) (582) (380) (448) (451) (457)
67

The Economist /YouGov PollApril 26 - 28, 2020 - 1500 US Adult citizens
22. End Social Distancing By June 1When do you think it will be safe to end social distancing measures and re-open businesses as normal?Compiled from answers about when people think it will be safe to end social distancing measures
Gender Education Income
Total Male Female HS or less Some college College grad Postgrad Under $50K $50-100K $100K or more
Before or by June 1 37% 39% 35% 41% 38% 32% 30% 38% 40% 36%
After June 1 47% 47% 48% 43% 44% 55% 57% 42% 51% 55%
Not sure 15% 13% 17% 15% 18% 13% 13% 20% 9% 8%
Totals 99% 99% 100% 99% 100% 100% 100% 100% 100% 99%
Unweighted N (1,498) (667) (831) (470) (531) (301) (196) (599) (443) (287)
Age Race Region
Total 18-29 30-44 45-64 65+ White Black Hispanic Other Northeast Midwest South West
Before or by June 1 37% 40% 36% 35% 39% 37% 36% 42% 28% 36% 37% 36% 41%
After June 1 47% 46% 50% 48% 45% 47% 42% 52% 51% 53% 51% 45% 44%
Not sure 15% 14% 14% 17% 16% 15% 22% 7% 20% 11% 13% 19% 15%
Totals 99% 100% 100% 100% 100% 99% 100% 101% 99% 100% 101% 100% 100%
Unweighted N (1,498) (311) (280) (594) (313) (1,088) (162) (164) (84) (274) (329) (552) (343)
Registered Primary Voter Party ID Ideology
Total Voters Dem Rep Dem Ind Rep Lib Mod Con
Before or by June 1 37% 37% 23% 54% 23% 40% 51% 22% 35% 54%
After June 1 47% 50% 63% 36% 64% 42% 36% 65% 51% 33%
Not sure 15% 13% 14% 11% 14% 18% 13% 14% 15% 13%
Totals 99% 100% 100% 101% 101% 100% 100% 101% 101% 100%
Unweighted N (1,498) (1,222) (564) (337) (536) (582) (380) (448) (451) (457)
68

The Economist /YouGov PollApril 26 - 28, 2020 - 1500 US Adult citizens
23. Time Before Re-Opening EconomyWhen do you think it will be safe to fully re-open the economy nationally?
Gender Education Income
Total Male Female HS or less Some college College grad Postgrad Under $50K $50-100K $100K or more
It is safe right now 10% 13% 8% 11% 11% 11% 6% 11% 10% 12%
In about two weeks 5% 5% 5% 6% 4% 4% 5% 4% 3% 7%
In a month or so 16% 16% 16% 19% 16% 12% 13% 16% 19% 16%
In several months 35% 38% 33% 34% 32% 43% 41% 33% 40% 37%
In about a year or longer 16% 15% 17% 12% 18% 19% 25% 14% 19% 21%
Not sure 17% 12% 21% 19% 19% 12% 10% 22% 10% 8%
Totals 99% 99% 100% 101% 100% 101% 100% 100% 101% 101%
Unweighted N (1,494) (664) (830) (470) (528) (302) (194) (598) (443) (283)
Age Race Region
Total 18-29 30-44 45-64 65+ White Black Hispanic Other Northeast Midwest South West
It is safe right now 10% 9% 9% 12% 11% 11% 6% 11% 13% 5% 9% 9% 18%
In about two weeks 5% 3% 6% 5% 4% 4% 5% 9% 3% 3% 4% 5% 7%
In a month or so 16% 15% 16% 16% 18% 16% 17% 16% 12% 18% 17% 15% 14%
In several months 35% 42% 38% 32% 32% 36% 36% 36% 33% 40% 39% 35% 29%
In about a year or longer 16% 14% 16% 19% 15% 17% 11% 15% 25% 17% 16% 15% 17%
Not sure 17% 16% 15% 16% 20% 16% 25% 11% 14% 16% 14% 20% 14%
Totals 99% 99% 100% 100% 100% 100% 100% 98% 100% 99% 99% 99% 99%
Unweighted N (1,494) (312) (279) (591) (312) (1,086) (162) (161) (85) (275) (329) (550) (340)
Registered Primary Voter Party ID Ideology
Total Voters Dem Rep Dem Ind Rep Lib Mod Con
It is safe right now 10% 10% 2% 24% 1% 13% 17% 4% 8% 20%
continued on the next page . . .
69

The Economist /YouGov PollApril 26 - 28, 2020 - 1500 US Adult citizens
continued from previous pageRegistered Primary Voter Party ID Ideology
Total Voters Dem Rep Dem Ind Rep Lib Mod Con
In about two weeks 5% 5% 3% 8% 3% 4% 8% 2% 3% 8%
In a month or so 16% 17% 12% 21% 14% 15% 21% 10% 19% 21%
In several months 35% 36% 41% 28% 44% 30% 32% 41% 38% 29%
In about a year or longer 16% 18% 27% 8% 22% 19% 7% 28% 18% 7%
Not sure 17% 14% 15% 11% 16% 19% 14% 14% 14% 15%
Totals 99% 100% 100% 100% 100% 100% 99% 99% 100% 100%
Unweighted N (1,494) (1,216) (562) (335) (535) (581) (378) (446) (450) (456)
70

The Economist /YouGov PollApril 26 - 28, 2020 - 1500 US Adult citizens
24. Concern About A Local EpidemicHow concerned are you about a COVID-19 epidemic in the community where you live?
Gender Education Income
Total Male Female HS or less Some college College grad Postgrad Under $50K $50-100K $100K or more
Very concerned 21% 16% 26% 19% 21% 23% 26% 23% 21% 22%
Somewhat concerned 45% 44% 46% 44% 44% 50% 43% 43% 43% 50%
Not very concerned 25% 29% 20% 28% 24% 19% 24% 25% 26% 18%
Not concerned at all 10% 11% 8% 9% 12% 7% 7% 9% 9% 10%
Totals 101% 100% 100% 100% 101% 99% 100% 100% 99% 100%
Unweighted N (1,495) (665) (830) (468) (530) (301) (196) (598) (442) (286)
Age Race Region
Total 18-29 30-44 45-64 65+ White Black Hispanic Other Northeast Midwest South West
Very concerned 21% 18% 23% 25% 16% 19% 29% 29% 17% 28% 20% 20% 17%
Somewhat concerned 45% 47% 48% 43% 43% 46% 41% 41% 48% 45% 44% 48% 40%
Not very concerned 25% 25% 21% 22% 32% 25% 21% 23% 26% 21% 28% 24% 25%
Not concerned at all 10% 10% 8% 10% 9% 10% 9% 7% 9% 6% 8% 8% 18%
Totals 101% 100% 100% 100% 100% 100% 100% 100% 100% 100% 100% 100% 100%
Unweighted N (1,495) (312) (279) (592) (312) (1,084) (162) (164) (85) (272) (330) (551) (342)
Registered Primary Voter Party ID Ideology
Total Voters Dem Rep Dem Ind Rep Lib Mod Con
Very concerned 21% 23% 32% 12% 31% 19% 12% 31% 21% 11%
Somewhat concerned 45% 45% 53% 33% 53% 43% 38% 51% 50% 36%
Not very concerned 25% 23% 11% 37% 14% 27% 34% 15% 22% 36%
Not concerned at all 10% 9% 4% 19% 2% 11% 16% 4% 6% 17%
Totals 101% 100% 100% 101% 100% 100% 100% 101% 99% 100%
continued on the next page . . .
71

The Economist /YouGov PollApril 26 - 28, 2020 - 1500 US Adult citizens
continued from previous pageRegistered Primary Voter Party ID Ideology
Total Voters Dem Rep Dem Ind Rep Lib Mod Con
Unweighted N (1,495) (1,219) (563) (335) (536) (581) (378) (449) (449) (455)
72

The Economist /YouGov PollApril 26 - 28, 2020 - 1500 US Adult citizens
25. Local CasesHave there been any reported cases of COVID-19 in the community where you live?
Gender Education Income
Total Male Female HS or less Some college College grad Postgrad Under $50K $50-100K $100K or more
Yes 65% 60% 70% 57% 64% 74% 79% 59% 73% 71%
No 17% 19% 15% 19% 18% 13% 13% 18% 13% 19%
Not sure 18% 21% 15% 24% 17% 13% 8% 23% 14% 10%
Totals 100% 100% 100% 100% 99% 100% 100% 100% 100% 100%
Unweighted N (1,499) (667) (832) (470) (531) (302) (196) (599) (443) (287)
Age Race Region
Total 18-29 30-44 45-64 65+ White Black Hispanic Other Northeast Midwest South West
Yes 65% 62% 64% 70% 61% 71% 45% 50% 61% 66% 63% 62% 72%
No 17% 12% 19% 15% 22% 16% 24% 16% 19% 12% 16% 21% 14%
Not sure 18% 27% 16% 15% 17% 13% 32% 34% 20% 22% 21% 17% 14%
Totals 100% 101% 99% 100% 100% 100% 101% 100% 100% 100% 100% 100% 100%
Unweighted N (1,499) (313) (279) (594) (313) (1,088) (161) (165) (85) (275) (330) (551) (343)
Registered Primary Voter Party ID Ideology
Total Voters Dem Rep Dem Ind Rep Lib Mod Con
Yes 65% 71% 75% 70% 67% 63% 65% 74% 66% 62%
No 17% 17% 12% 20% 13% 18% 20% 9% 17% 23%
Not sure 18% 12% 13% 11% 20% 19% 16% 17% 17% 15%
Totals 100% 100% 100% 101% 100% 100% 101% 100% 100% 100%
Unweighted N (1,499) (1,222) (564) (337) (536) (583) (380) (449) (451) (457)
73

The Economist /YouGov PollApril 26 - 28, 2020 - 1500 US Adult citizens
26. Concern About A National EpidemicHow concerned are you about a COVID-19 epidemic here in the United States?
Gender Education Income
Total Male Female HS or less Some college College grad Postgrad Under $50K $50-100K $100K or more
Very concerned 50% 43% 56% 45% 50% 52% 60% 48% 49% 52%
Somewhat concerned 32% 33% 31% 34% 28% 35% 30% 32% 33% 32%
Not very concerned 13% 17% 8% 14% 14% 10% 6% 13% 14% 10%
Not concerned at all 6% 7% 5% 7% 7% 3% 4% 7% 3% 6%
Totals 101% 100% 100% 100% 99% 100% 100% 100% 99% 100%
Unweighted N (1,498) (666) (832) (470) (530) (302) (196) (600) (442) (287)
Age Race Region
Total 18-29 30-44 45-64 65+ White Black Hispanic Other Northeast Midwest South West
Very concerned 50% 42% 49% 52% 54% 49% 60% 48% 42% 54% 47% 51% 45%
Somewhat concerned 32% 38% 32% 29% 30% 33% 20% 36% 38% 33% 37% 31% 28%
Not very concerned 13% 12% 13% 13% 13% 13% 12% 8% 13% 9% 12% 12% 17%
Not concerned at all 6% 9% 6% 5% 4% 5% 9% 7% 7% 3% 4% 6% 10%
Totals 101% 101% 100% 99% 101% 100% 101% 99% 100% 99% 100% 100% 100%
Unweighted N (1,498) (313) (280) (594) (311) (1,087) (161) (165) (85) (274) (330) (551) (343)
Registered Primary Voter Party ID Ideology
Total Voters Dem Rep Dem Ind Rep Lib Mod Con
Very concerned 50% 54% 71% 33% 69% 45% 33% 71% 53% 30%
Somewhat concerned 32% 30% 25% 34% 27% 32% 39% 24% 32% 38%
Not very concerned 13% 12% 3% 25% 3% 17% 18% 4% 10% 22%
Not concerned at all 6% 4% 1% 9% 1% 7% 10% 1% 5% 9%
Totals 101% 100% 100% 101% 100% 101% 100% 100% 100% 99%
continued on the next page . . .
74

The Economist /YouGov PollApril 26 - 28, 2020 - 1500 US Adult citizens
continued from previous pageRegistered Primary Voter Party ID Ideology
Total Voters Dem Rep Dem Ind Rep Lib Mod Con
Unweighted N (1,498) (1,221) (563) (337) (535) (583) (380) (448) (451) (457)
75

The Economist /YouGov PollApril 26 - 28, 2020 - 1500 US Adult citizens
27. Describe Americans’ Thinking About COVID-19How would you describe the way most Americans are thinking about COVID-19?
Gender Education Income
Total Male Female HS or less Some college College grad Postgrad Under $50K $50-100K $100K or more
They are not taking therisks seriously enough 43% 37% 49% 41% 44% 46% 44% 45% 42% 41%
They are behavingappropriately 32% 33% 31% 32% 28% 32% 41% 26% 38% 38%
They are overreacting tothe actual risks ofcontracting the virus 18% 24% 13% 17% 22% 17% 13% 19% 16% 17%
Not sure 7% 6% 7% 10% 6% 5% 2% 9% 3% 5%
Totals 100% 100% 100% 100% 100% 100% 100% 99% 99% 101%
Unweighted N (1,496) (665) (831) (468) (531) (301) (196) (599) (441) (287)
Age Race Region
Total 18-29 30-44 45-64 65+ White Black Hispanic Other Northeast Midwest South West
They are not taking therisks seriously enough 43% 47% 41% 41% 46% 43% 43% 39% 54% 40% 45% 48% 36%
They are behavingappropriately 32% 25% 36% 31% 35% 33% 26% 32% 24% 38% 35% 28% 30%
They are overreacting tothe actual risks ofcontracting the virus 18% 16% 17% 22% 15% 18% 18% 20% 21% 13% 13% 18% 27%
Not sure 7% 12% 6% 6% 4% 6% 13% 9% 1% 9% 6% 6% 7%
Totals 100% 100% 100% 100% 100% 100% 100% 100% 100% 100% 99% 100% 100%
Unweighted N (1,496) (313) (279) (593) (311) (1,084) (162) (165) (85) (274) (330) (551) (341)
76

The Economist /YouGov PollApril 26 - 28, 2020 - 1500 US Adult citizens
Registered Primary Voter Party ID Ideology
Total Voters Dem Rep Dem Ind Rep Lib Mod Con
They are not taking therisks seriously enough 43% 45% 58% 24% 58% 42% 27% 57% 50% 24%
They are behavingappropriately 32% 33% 33% 37% 30% 28% 39% 30% 32% 37%
They are overreacting tothe actual risks ofcontracting the virus 18% 17% 5% 34% 7% 22% 26% 8% 13% 30%
Not sure 7% 5% 3% 4% 4% 8% 8% 5% 5% 9%
Totals 100% 100% 99% 99% 99% 100% 100% 100% 100% 100%
Unweighted N (1,496) (1,218) (563) (335) (535) (582) (379) (447) (451) (456)
77

The Economist /YouGov PollApril 26 - 28, 2020 - 1500 US Adult citizens
28. Economic RecessionDo you think COVID-19 will lead to an economic recession?
Gender Education Income
Total Male Female HS or less Some college College grad Postgrad Under $50K $50-100K $100K or more
Yes 68% 65% 71% 57% 69% 80% 81% 63% 76% 73%
No 11% 14% 8% 16% 9% 8% 8% 12% 9% 13%
Not sure 21% 21% 21% 27% 22% 11% 11% 25% 14% 13%
Totals 100% 100% 100% 100% 100% 99% 100% 100% 99% 99%
Unweighted N (1,496) (664) (832) (469) (531) (300) (196) (598) (443) (286)
Age Race Region
Total 18-29 30-44 45-64 65+ White Black Hispanic Other Northeast Midwest South West
Yes 68% 65% 72% 72% 61% 68% 62% 68% 79% 70% 68% 64% 73%
No 11% 14% 10% 10% 13% 12% 12% 12% 4% 10% 10% 13% 11%
Not sure 21% 21% 19% 19% 26% 20% 25% 20% 17% 20% 22% 23% 16%
Totals 100% 100% 101% 101% 100% 100% 99% 100% 100% 100% 100% 100% 100%
Unweighted N (1,496) (312) (278) (593) (313) (1,086) (161) (165) (84) (274) (330) (551) (341)
Registered Primary Voter Party ID Ideology
Total Voters Dem Rep Dem Ind Rep Lib Mod Con
Yes 68% 72% 84% 58% 76% 68% 58% 83% 69% 58%
No 11% 11% 4% 21% 7% 11% 17% 4% 11% 18%
Not sure 21% 18% 12% 21% 17% 21% 25% 13% 20% 24%
Totals 100% 101% 100% 100% 100% 100% 100% 100% 100% 100%
Unweighted N (1,496) (1,219) (563) (336) (536) (582) (378) (448) (450) (456)
78

The Economist /YouGov PollApril 26 - 28, 2020 - 1500 US Adult citizens
29. Are We In A RecessionDo you believe we are currently in an economic recession?
Gender Education Income
Total Male Female HS or less Some college College grad Postgrad Under $50K $50-100K $100K or more
Yes 57% 55% 59% 49% 57% 66% 65% 53% 63% 62%
No 20% 22% 18% 21% 22% 16% 22% 18% 25% 20%
Not sure 23% 23% 23% 30% 21% 18% 13% 29% 12% 18%
Totals 100% 100% 100% 100% 100% 100% 100% 100% 100% 100%
Unweighted N (1,487) (664) (823) (467) (526) (300) (194) (594) (439) (285)
Age Race Region
Total 18-29 30-44 45-64 65+ White Black Hispanic Other Northeast Midwest South West
Yes 57% 49% 61% 61% 53% 56% 55% 59% 66% 59% 55% 53% 63%
No 20% 20% 17% 22% 22% 22% 18% 13% 19% 17% 22% 22% 20%
Not sure 23% 31% 22% 18% 25% 22% 27% 28% 15% 24% 23% 25% 17%
Totals 100% 100% 100% 101% 100% 100% 100% 100% 100% 100% 100% 100% 100%
Unweighted N (1,487) (310) (278) (590) (309) (1,081) (162) (160) (84) (272) (328) (549) (338)
Registered Primary Voter Party ID Ideology
Total Voters Dem Rep Dem Ind Rep Lib Mod Con
Yes 57% 61% 70% 48% 65% 56% 48% 72% 59% 45%
No 20% 22% 15% 35% 15% 19% 28% 10% 19% 32%
Not sure 23% 17% 15% 17% 20% 25% 24% 18% 22% 23%
Totals 100% 100% 100% 100% 100% 100% 100% 100% 100% 100%
Unweighted N (1,487) (1,212) (561) (335) (533) (578) (376) (445) (445) (455)
79

The Economist /YouGov PollApril 26 - 28, 2020 - 1500 US Adult citizens
30. Effect Of RecessionHow serious of an effect do you think an economic recession would have on your personal financial situation?
Gender Education Income
Total Male Female HS or less Some college College grad Postgrad Under $50K $50-100K $100K or more
Very serious 23% 19% 26% 22% 26% 23% 17% 24% 22% 20%
Somewhat serious 40% 42% 38% 36% 37% 47% 50% 35% 46% 44%
Not very serious 21% 23% 19% 22% 20% 19% 27% 19% 21% 28%
Not serious at all 6% 7% 5% 8% 5% 6% 2% 8% 5% 4%
Not sure 10% 9% 11% 13% 12% 5% 5% 14% 5% 5%
Totals 100% 100% 99% 101% 100% 100% 101% 100% 99% 101%
Unweighted N (1,497) (666) (831) (468) (531) (302) (196) (598) (442) (287)
Age Race Region
Total 18-29 30-44 45-64 65+ White Black Hispanic Other Northeast Midwest South West
Very serious 23% 20% 24% 27% 17% 20% 27% 31% 24% 26% 23% 23% 18%
Somewhat serious 40% 44% 40% 36% 42% 42% 27% 42% 41% 41% 39% 40% 41%
Not very serious 21% 19% 20% 21% 25% 22% 21% 15% 18% 19% 24% 19% 24%
Not serious at all 6% 6% 5% 4% 10% 6% 12% 4% 4% 6% 6% 6% 8%
Not sure 10% 12% 11% 11% 6% 10% 13% 8% 13% 7% 9% 13% 9%
Totals 100% 101% 100% 99% 100% 100% 100% 100% 100% 99% 101% 101% 100%
Unweighted N (1,497) (312) (279) (593) (313) (1,086) (162) (164) (85) (274) (330) (551) (342)
Registered Primary Voter Party ID Ideology
Total Voters Dem Rep Dem Ind Rep Lib Mod Con
Very serious 23% 23% 23% 24% 22% 24% 20% 24% 26% 20%
Somewhat serious 40% 42% 44% 39% 47% 36% 38% 45% 38% 39%
Not very serious 21% 23% 22% 22% 19% 20% 24% 21% 20% 25%
continued on the next page . . .
80

The Economist /YouGov PollApril 26 - 28, 2020 - 1500 US Adult citizens
continued from previous pageRegistered Primary Voter Party ID Ideology
Total Voters Dem Rep Dem Ind Rep Lib Mod Con
Not serious at all 6% 6% 5% 9% 5% 7% 7% 4% 8% 7%
Not sure 10% 7% 6% 6% 7% 13% 10% 6% 9% 9%
Totals 100% 101% 100% 100% 100% 100% 99% 100% 101% 100%
Unweighted N (1,497) (1,221) (564) (337) (536) (584) (377) (448) (451) (455)
81

The Economist /YouGov PollApril 26 - 28, 2020 - 1500 US Adult citizens
31. How Long Before Economy RecoversIf there is an economic recession, how long do you believe it will take before the U.S. economy fully recovers from the effects of COVID-19?
Gender Education Income
Total Male Female HS or less Some college College grad Postgrad Under $50K $50-100K $100K or more
Less than one month 3% 3% 2% 4% 2% 2% 0% 4% 1% 1%
Three months or so 8% 9% 7% 8% 8% 8% 6% 7% 8% 9%
Six months or so 17% 19% 15% 20% 17% 12% 14% 17% 15% 17%
At least a year 38% 37% 38% 38% 36% 41% 37% 36% 41% 39%
Several years 33% 30% 35% 27% 35% 37% 41% 32% 34% 34%
Never 3% 3% 2% 4% 2% 1% 2% 4% 1% 0%
Totals 102% 101% 99% 101% 100% 101% 100% 100% 100% 100%
Unweighted N (1,494) (664) (830) (468) (529) (301) (196) (598) (441) (286)
Age Race Region
Total 18-29 30-44 45-64 65+ White Black Hispanic Other Northeast Midwest South West
Less than one month 3% 7% 2% 2% 0% 2% 5% 4% 0% 1% 3% 3% 3%
Three months or so 8% 7% 7% 8% 9% 8% 8% 9% 4% 7% 6% 9% 7%
Six months or so 17% 16% 17% 16% 18% 18% 12% 18% 12% 17% 16% 16% 18%
At least a year 38% 36% 38% 35% 44% 39% 36% 31% 38% 41% 40% 35% 37%
Several years 33% 30% 32% 38% 27% 31% 34% 35% 42% 33% 32% 33% 32%
Never 3% 4% 4% 2% 2% 2% 5% 3% 4% 1% 2% 4% 2%
Totals 102% 100% 100% 101% 100% 100% 100% 100% 100% 100% 99% 100% 99%
Unweighted N (1,494) (312) (278) (592) (312) (1,085) (159) (165) (85) (273) (330) (549) (342)
Registered Primary Voter Party ID Ideology
Total Voters Dem Rep Dem Ind Rep Lib Mod Con
Less than one month 3% 2% 1% 3% 2% 3% 3% 2% 2% 3%
continued on the next page . . .
82

The Economist /YouGov PollApril 26 - 28, 2020 - 1500 US Adult citizens
continued from previous pageRegistered Primary Voter Party ID Ideology
Total Voters Dem Rep Dem Ind Rep Lib Mod Con
Three months or so 8% 8% 5% 14% 6% 8% 10% 3% 6% 14%
Six months or so 17% 17% 12% 25% 12% 15% 26% 9% 14% 25%
At least a year 38% 38% 38% 37% 35% 39% 39% 41% 38% 34%
Several years 33% 34% 44% 19% 45% 32% 19% 45% 36% 20%
Never 3% 1% 0% 1% 0% 4% 3% 0% 3% 3%
Totals 102% 100% 100% 99% 100% 101% 100% 100% 99% 99%
Unweighted N (1,494) (1,219) (563) (335) (536) (580) (378) (448) (450) (456)
83

The Economist /YouGov PollApril 26 - 28, 2020 - 1500 US Adult citizens
32. National Unemployment ProblemHow serious a problem is unemployment in the U.S.?
Gender Education Income
Total Male Female HS or less Some college College grad Postgrad Under $50K $50-100K $100K or more
Very serious 61% 55% 68% 53% 69% 61% 70% 59% 68% 62%
Somewhat serious 29% 35% 23% 33% 22% 35% 20% 31% 24% 30%
A minor problem 5% 5% 5% 5% 5% 4% 8% 4% 6% 6%
Not a problem 1% 1% 1% 1% 1% 0% 0% 2% 0% 1%
Not sure 4% 5% 3% 7% 3% 1% 2% 4% 2% 1%
Totals 100% 101% 100% 99% 100% 101% 100% 100% 100% 100%
Unweighted N (1,496) (664) (832) (470) (530) (301) (195) (599) (441) (286)
Age Race Region
Total 18-29 30-44 45-64 65+ White Black Hispanic Other Northeast Midwest South West
Very serious 61% 47% 63% 67% 66% 62% 64% 54% 60% 61% 61% 62% 60%
Somewhat serious 29% 39% 31% 24% 23% 28% 25% 33% 31% 30% 30% 27% 29%
A minor problem 5% 5% 3% 6% 6% 6% 3% 2% 6% 4% 5% 5% 6%
Not a problem 1% 2% 1% 0% 1% 1% 0% 3% 0% 1% 1% 1% 1%
Not sure 4% 8% 3% 3% 4% 3% 8% 8% 3% 4% 4% 5% 3%
Totals 100% 101% 101% 100% 100% 100% 100% 100% 100% 100% 101% 100% 99%
Unweighted N (1,496) (311) (279) (594) (312) (1,085) (161) (165) (85) (275) (330) (549) (342)
Registered Primary Voter Party ID Ideology
Total Voters Dem Rep Dem Ind Rep Lib Mod Con
Very serious 61% 64% 74% 56% 72% 59% 52% 69% 67% 50%
Somewhat serious 29% 26% 21% 30% 23% 29% 34% 27% 25% 34%
A minor problem 5% 6% 3% 9% 4% 5% 7% 2% 4% 9%
continued on the next page . . .
84

The Economist /YouGov PollApril 26 - 28, 2020 - 1500 US Adult citizens
continued from previous pageRegistered Primary Voter Party ID Ideology
Total Voters Dem Rep Dem Ind Rep Lib Mod Con
Not a problem 1% 1% 0% 2% 0% 1% 2% 0% 1% 2%
Not sure 4% 3% 1% 3% 1% 6% 5% 2% 4% 5%
Totals 100% 100% 99% 100% 100% 100% 100% 100% 101% 100%
Unweighted N (1,496) (1,220) (564) (335) (536) (582) (378) (449) (450) (456)
85
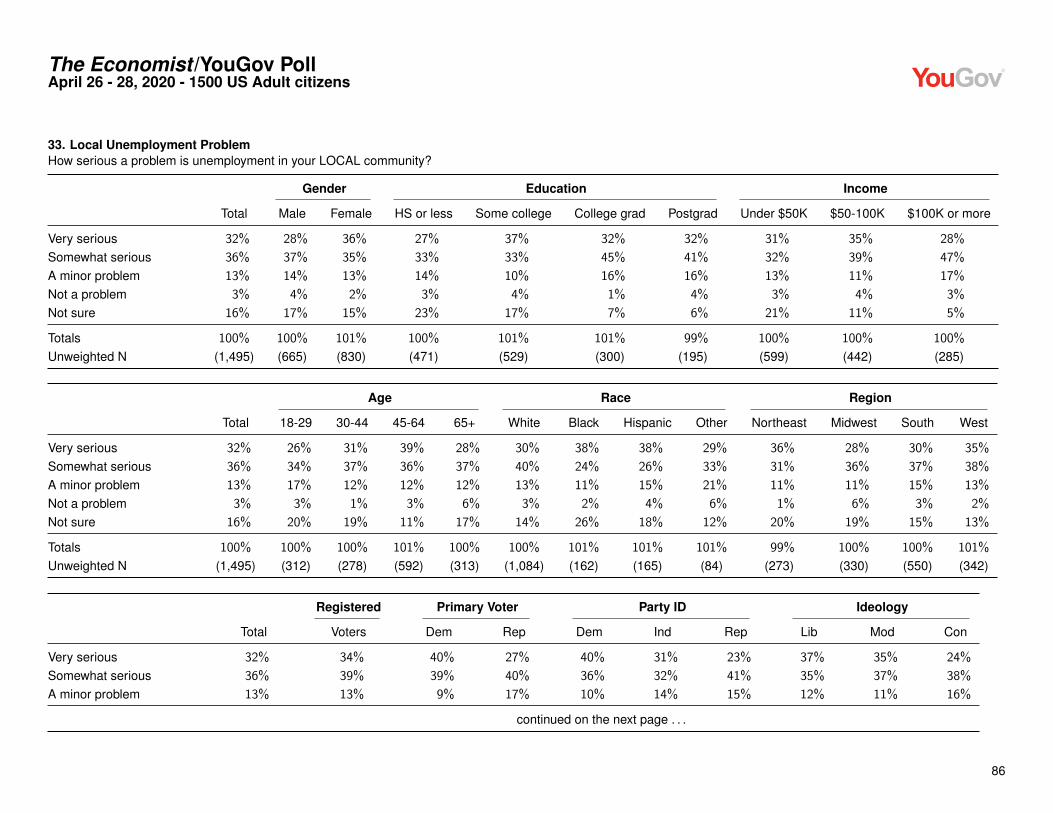
The Economist /YouGov PollApril 26 - 28, 2020 - 1500 US Adult citizens
33. Local Unemployment ProblemHow serious a problem is unemployment in your LOCAL community?
Gender Education Income
Total Male Female HS or less Some college College grad Postgrad Under $50K $50-100K $100K or more
Very serious 32% 28% 36% 27% 37% 32% 32% 31% 35% 28%
Somewhat serious 36% 37% 35% 33% 33% 45% 41% 32% 39% 47%
A minor problem 13% 14% 13% 14% 10% 16% 16% 13% 11% 17%
Not a problem 3% 4% 2% 3% 4% 1% 4% 3% 4% 3%
Not sure 16% 17% 15% 23% 17% 7% 6% 21% 11% 5%
Totals 100% 100% 101% 100% 101% 101% 99% 100% 100% 100%
Unweighted N (1,495) (665) (830) (471) (529) (300) (195) (599) (442) (285)
Age Race Region
Total 18-29 30-44 45-64 65+ White Black Hispanic Other Northeast Midwest South West
Very serious 32% 26% 31% 39% 28% 30% 38% 38% 29% 36% 28% 30% 35%
Somewhat serious 36% 34% 37% 36% 37% 40% 24% 26% 33% 31% 36% 37% 38%
A minor problem 13% 17% 12% 12% 12% 13% 11% 15% 21% 11% 11% 15% 13%
Not a problem 3% 3% 1% 3% 6% 3% 2% 4% 6% 1% 6% 3% 2%
Not sure 16% 20% 19% 11% 17% 14% 26% 18% 12% 20% 19% 15% 13%
Totals 100% 100% 100% 101% 100% 100% 101% 101% 101% 99% 100% 100% 101%
Unweighted N (1,495) (312) (278) (592) (313) (1,084) (162) (165) (84) (273) (330) (550) (342)
Registered Primary Voter Party ID Ideology
Total Voters Dem Rep Dem Ind Rep Lib Mod Con
Very serious 32% 34% 40% 27% 40% 31% 23% 37% 35% 24%
Somewhat serious 36% 39% 39% 40% 36% 32% 41% 35% 37% 38%
A minor problem 13% 13% 9% 17% 10% 14% 15% 12% 11% 16%
continued on the next page . . .
86

The Economist /YouGov PollApril 26 - 28, 2020 - 1500 US Adult citizens
continued from previous pageRegistered Primary Voter Party ID Ideology
Total Voters Dem Rep Dem Ind Rep Lib Mod Con
Not a problem 3% 3% 1% 7% 1% 3% 7% 1% 2% 7%
Not sure 16% 11% 11% 9% 14% 19% 14% 15% 14% 16%
Totals 100% 100% 100% 100% 101% 99% 100% 100% 99% 101%
Unweighted N (1,495) (1,219) (563) (336) (536) (581) (378) (449) (449) (456)
87

The Economist /YouGov PollApril 26 - 28, 2020 - 1500 US Adult citizens
34. Received A Stimulus CheckHave you received a payment from the government due to COVID-19 stimulus package?
Gender Education Income
Total Male Female HS or less Some college College grad Postgrad Under $50K $50-100K $100K or more
Yes 42% 44% 41% 41% 38% 51% 44% 41% 52% 37%
No 45% 42% 47% 41% 51% 42% 43% 46% 41% 48%
Prefer not to say 5% 5% 4% 6% 5% 2% 3% 6% 2% 3%
Not eligible for a payment 8% 9% 8% 11% 6% 5% 10% 7% 5% 12%
Totals 100% 100% 100% 99% 100% 100% 100% 100% 100% 100%
Unweighted N (1,495) (664) (831) (468) (530) (301) (196) (599) (441) (287)
Age Race Region
Total 18-29 30-44 45-64 65+ White Black Hispanic Other Northeast Midwest South West
Yes 42% 42% 46% 43% 38% 43% 33% 52% 42% 43% 44% 42% 41%
No 45% 36% 35% 49% 58% 47% 43% 35% 37% 42% 44% 46% 46%
Prefer not to say 5% 6% 7% 3% 3% 3% 9% 4% 14% 3% 3% 5% 6%
Not eligible for a payment 8% 17% 12% 4% 1% 7% 14% 9% 7% 11% 8% 7% 8%
Totals 100% 101% 100% 99% 100% 100% 99% 100% 100% 99% 99% 100% 101%
Unweighted N (1,495) (312) (278) (592) (313) (1,085) (161) (165) (84) (273) (330) (550) (342)
Registered Primary Voter Party ID Ideology
Total Voters Dem Rep Dem Ind Rep Lib Mod Con
Yes 42% 46% 49% 47% 46% 39% 43% 50% 42% 42%
No 45% 46% 43% 46% 44% 44% 48% 39% 43% 51%
Prefer not to say 5% 3% 2% 3% 3% 7% 3% 2% 5% 3%
Not eligible for a payment 8% 6% 6% 4% 7% 10% 6% 9% 9% 4%
Totals 100% 101% 100% 100% 100% 100% 100% 100% 99% 100%
continued on the next page . . .
88

The Economist /YouGov PollApril 26 - 28, 2020 - 1500 US Adult citizens
continued from previous pageRegistered Primary Voter Party ID Ideology
Total Voters Dem Rep Dem Ind Rep Lib Mod Con
Unweighted N (1,495) (1,219) (563) (336) (536) (579) (380) (449) (449) (456)
89

The Economist /YouGov PollApril 26 - 28, 2020 - 1500 US Adult citizens
35. Government StatisticsIn general, how many of the statistics reported by the government are reliable and accurate?
Gender Education Income
Total Male Female HS or less Some college College grad Postgrad Under $50K $50-100K $100K or more
None 7% 8% 5% 11% 6% 3% 3% 8% 3% 7%
A small portion 26% 26% 27% 28% 30% 19% 21% 32% 23% 20%
About half 29% 28% 30% 26% 29% 36% 30% 28% 30% 26%
Most 35% 34% 36% 32% 33% 39% 42% 30% 40% 44%
All 3% 4% 3% 4% 2% 2% 4% 3% 4% 3%
Totals 100% 100% 101% 101% 100% 99% 100% 101% 100% 100%
Unweighted N (1,496) (665) (831) (470) (529) (301) (196) (598) (442) (287)
Age Race Region
Total 18-29 30-44 45-64 65+ White Black Hispanic Other Northeast Midwest South West
None 7% 9% 7% 6% 5% 5% 17% 8% 2% 5% 5% 7% 9%
A small portion 26% 24% 24% 27% 29% 26% 36% 21% 18% 26% 26% 28% 23%
About half 29% 30% 31% 30% 24% 29% 23% 35% 29% 25% 30% 32% 29%
Most 35% 35% 33% 34% 39% 37% 22% 32% 45% 42% 36% 30% 35%
All 3% 2% 5% 3% 3% 3% 2% 4% 5% 2% 3% 3% 4%
Totals 100% 100% 100% 100% 100% 100% 100% 100% 99% 100% 100% 100% 100%
Unweighted N (1,496) (313) (278) (593) (312) (1,087) (161) (164) (84) (273) (328) (552) (343)
Registered Primary Voter Party ID Ideology
Total Voters Dem Rep Dem Ind Rep Lib Mod Con
None 7% 6% 5% 5% 5% 9% 6% 7% 7% 5%
A small portion 26% 24% 23% 25% 24% 28% 25% 20% 27% 27%
About half 29% 31% 30% 32% 27% 30% 30% 31% 29% 28%
continued on the next page . . .
90

The Economist /YouGov PollApril 26 - 28, 2020 - 1500 US Adult citizens
continued from previous pageRegistered Primary Voter Party ID Ideology
Total Voters Dem Rep Dem Ind Rep Lib Mod Con
Most 35% 36% 38% 34% 40% 30% 37% 36% 36% 37%
All 3% 3% 3% 3% 4% 3% 3% 5% 2% 3%
Totals 100% 100% 99% 99% 100% 100% 101% 99% 101% 100%
Unweighted N (1,496) (1,220) (562) (337) (534) (582) (380) (448) (449) (457)
91

The Economist /YouGov PollApril 26 - 28, 2020 - 1500 US Adult citizens
36. Census StatisticsDo you think the 2010 US Census accurately counted the number of people living in the United States or do you think there were more people or fewerpeople than the Census reported?
Gender Education Income
Total Male Female HS or less Some college College grad Postgrad Under $50K $50-100K $100K or more
More people living in US 52% 51% 54% 43% 54% 62% 65% 48% 57% 60%
The Census count isaccurate 13% 17% 10% 16% 11% 13% 13% 13% 15% 19%
Fewer people living in US 5% 5% 5% 5% 6% 4% 4% 6% 6% 3%
Don’t know 29% 27% 31% 37% 29% 21% 18% 33% 22% 18%
Totals 99% 100% 100% 101% 100% 100% 100% 100% 100% 100%
Unweighted N (1,492) (665) (827) (469) (527) (301) (195) (596) (439) (287)
Age Race Region
Total 18-29 30-44 45-64 65+ White Black Hispanic Other Northeast Midwest South West
More people living in US 52% 42% 46% 57% 61% 54% 49% 38% 63% 49% 56% 53% 50%
The Census count isaccurate 13% 17% 18% 11% 8% 13% 14% 17% 11% 18% 11% 12% 14%
Fewer people living in US 5% 7% 6% 5% 4% 4% 6% 9% 6% 4% 4% 6% 7%
Don’t know 29% 34% 31% 27% 27% 28% 32% 35% 20% 29% 28% 30% 30%
Totals 99% 100% 101% 100% 100% 99% 101% 99% 100% 100% 99% 101% 101%
Unweighted N (1,492) (311) (280) (591) (310) (1,082) (160) (165) (85) (274) (330) (548) (340)
Registered Primary Voter Party ID Ideology
Total Voters Dem Rep Dem Ind Rep Lib Mod Con
More people living in US 52% 58% 62% 61% 56% 47% 56% 58% 52% 53%
The Census count isaccurate 13% 12% 12% 12% 13% 14% 13% 11% 14% 14%
continued on the next page . . .
92

The Economist /YouGov PollApril 26 - 28, 2020 - 1500 US Adult citizens
continued from previous pageRegistered Primary Voter Party ID Ideology
Total Voters Dem Rep Dem Ind Rep Lib Mod Con
Fewer people living in US 5% 5% 6% 5% 5% 5% 5% 5% 5% 5%
Don’t know 29% 25% 20% 21% 26% 34% 26% 25% 28% 28%
Totals 99% 100% 100% 99% 100% 100% 100% 99% 99% 100%
Unweighted N (1,492) (1,218) (563) (336) (534) (581) (377) (447) (448) (456)
93

The Economist /YouGov PollApril 26 - 28, 2020 - 1500 US Adult citizens
37. Unemployment StatisticsThe government releases unemployment numbers on the first Friday of the month. Do you think the government numbers are accurate or do you think thereare more unemployed people or fewer unemployed people?
Gender Education Income
Total Male Female HS or less Some college College grad Postgrad Under $50K $50-100K $100K or more
More unemployed people 55% 53% 56% 48% 53% 65% 65% 57% 54% 59%
The government numbersare accurate 21% 27% 16% 22% 21% 19% 21% 17% 28% 26%
Fewer unemployedpeople 3% 2% 4% 4% 3% 2% 2% 4% 1% 3%
Don’t know 21% 18% 24% 26% 23% 14% 13% 23% 17% 11%
Totals 100% 100% 100% 100% 100% 100% 101% 101% 100% 99%
Unweighted N (1,492) (665) (827) (469) (527) (302) (194) (597) (440) (286)
Age Race Region
Total 18-29 30-44 45-64 65+ White Black Hispanic Other Northeast Midwest South West
More unemployed people 55% 45% 51% 60% 60% 56% 57% 38% 62% 51% 51% 58% 56%
The government numbersare accurate 21% 22% 23% 20% 20% 21% 18% 24% 17% 24% 23% 19% 19%
Fewer unemployedpeople 3% 3% 4% 3% 3% 3% 2% 7% 3% 3% 2% 4% 4%
Don’t know 21% 30% 22% 17% 17% 20% 22% 31% 18% 22% 24% 19% 21%
Totals 100% 100% 100% 100% 100% 100% 99% 100% 100% 100% 100% 100% 100%
Unweighted N (1,492) (312) (278) (591) (311) (1,083) (162) (163) (84) (270) (330) (550) (342)
Registered Primary Voter Party ID Ideology
Total Voters Dem Rep Dem Ind Rep Lib Mod Con
More unemployed people 55% 59% 70% 47% 64% 53% 45% 65% 56% 43%
continued on the next page . . .
94
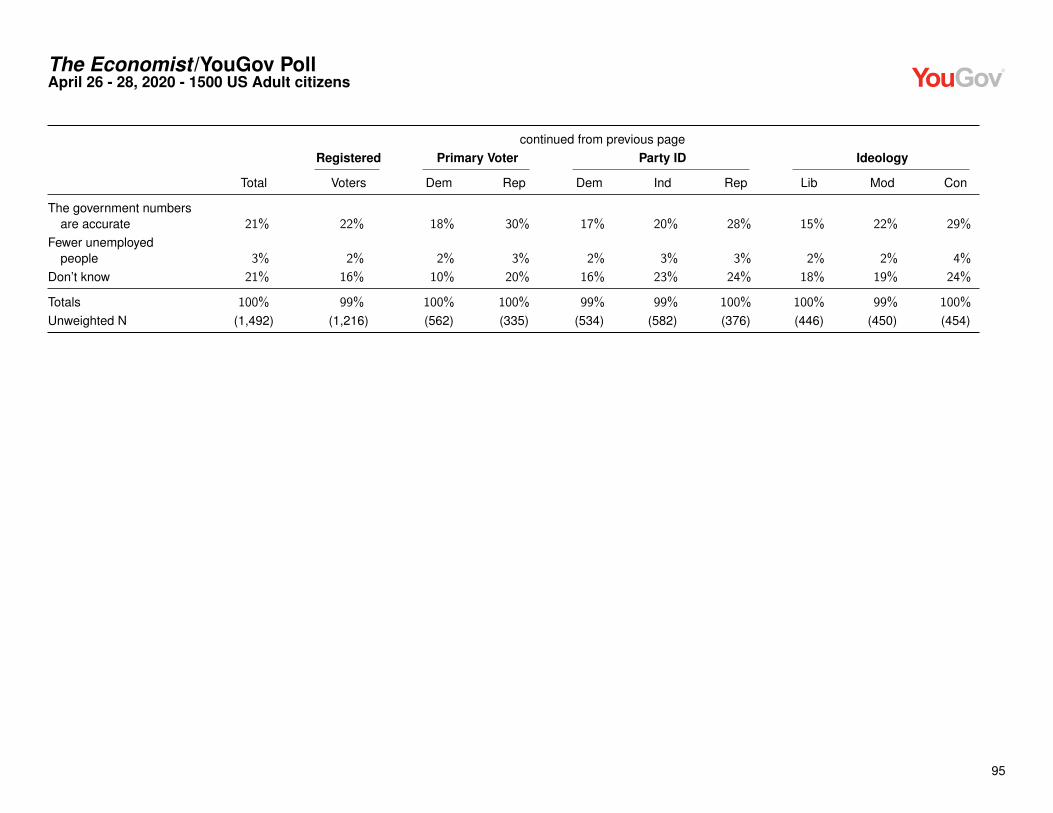
The Economist /YouGov PollApril 26 - 28, 2020 - 1500 US Adult citizens
continued from previous pageRegistered Primary Voter Party ID Ideology
Total Voters Dem Rep Dem Ind Rep Lib Mod Con
The government numbersare accurate 21% 22% 18% 30% 17% 20% 28% 15% 22% 29%
Fewer unemployedpeople 3% 2% 2% 3% 2% 3% 3% 2% 2% 4%
Don’t know 21% 16% 10% 20% 16% 23% 24% 18% 19% 24%
Totals 100% 99% 100% 100% 99% 99% 100% 100% 99% 100%
Unweighted N (1,492) (1,216) (562) (335) (534) (582) (376) (446) (450) (454)
95
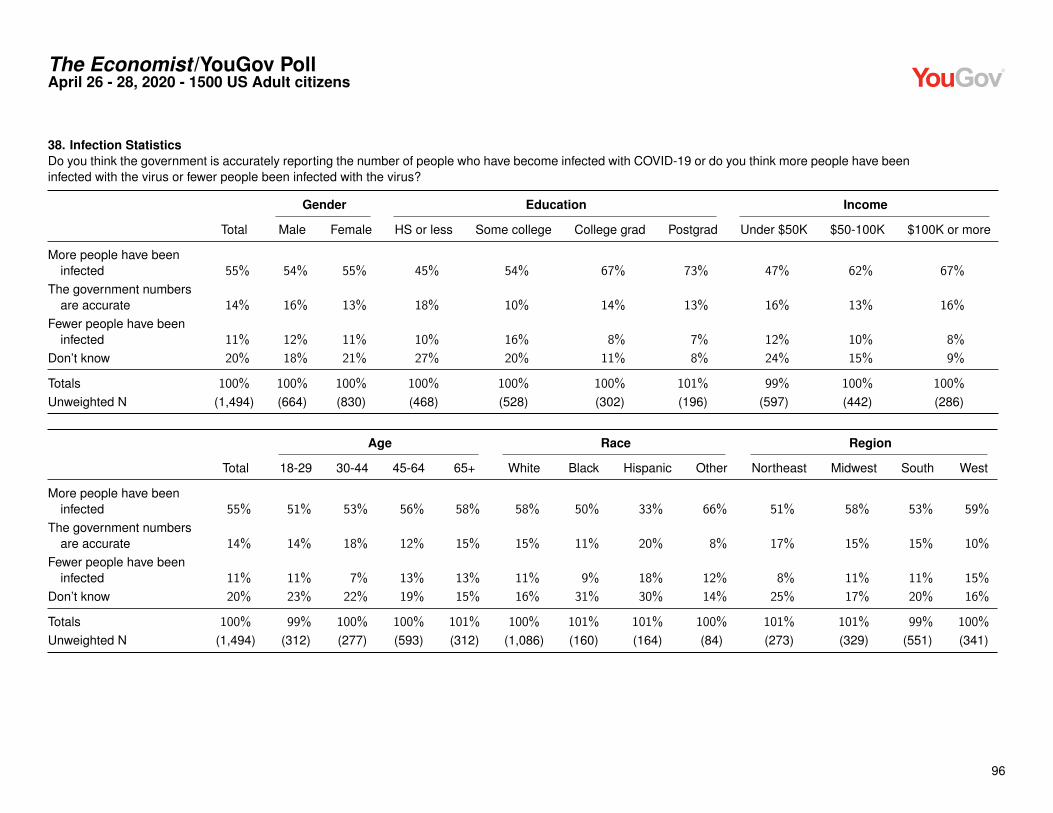
The Economist /YouGov PollApril 26 - 28, 2020 - 1500 US Adult citizens
38. Infection StatisticsDo you think the government is accurately reporting the number of people who have become infected with COVID-19 or do you think more people have beeninfected with the virus or fewer people been infected with the virus?
Gender Education Income
Total Male Female HS or less Some college College grad Postgrad Under $50K $50-100K $100K or more
More people have beeninfected 55% 54% 55% 45% 54% 67% 73% 47% 62% 67%
The government numbersare accurate 14% 16% 13% 18% 10% 14% 13% 16% 13% 16%
Fewer people have beeninfected 11% 12% 11% 10% 16% 8% 7% 12% 10% 8%
Don’t know 20% 18% 21% 27% 20% 11% 8% 24% 15% 9%
Totals 100% 100% 100% 100% 100% 100% 101% 99% 100% 100%
Unweighted N (1,494) (664) (830) (468) (528) (302) (196) (597) (442) (286)
Age Race Region
Total 18-29 30-44 45-64 65+ White Black Hispanic Other Northeast Midwest South West
More people have beeninfected 55% 51% 53% 56% 58% 58% 50% 33% 66% 51% 58% 53% 59%
The government numbersare accurate 14% 14% 18% 12% 15% 15% 11% 20% 8% 17% 15% 15% 10%
Fewer people have beeninfected 11% 11% 7% 13% 13% 11% 9% 18% 12% 8% 11% 11% 15%
Don’t know 20% 23% 22% 19% 15% 16% 31% 30% 14% 25% 17% 20% 16%
Totals 100% 99% 100% 100% 101% 100% 101% 101% 100% 101% 101% 99% 100%
Unweighted N (1,494) (312) (277) (593) (312) (1,086) (160) (164) (84) (273) (329) (551) (341)
96

The Economist /YouGov PollApril 26 - 28, 2020 - 1500 US Adult citizens
Registered Primary Voter Party ID Ideology
Total Voters Dem Rep Dem Ind Rep Lib Mod Con
More people have beeninfected 55% 62% 77% 48% 66% 52% 46% 70% 54% 46%
The government numbersare accurate 14% 14% 12% 17% 14% 11% 19% 13% 16% 16%
Fewer people have beeninfected 11% 11% 3% 24% 4% 14% 16% 4% 10% 19%
Don’t know 20% 13% 7% 12% 16% 22% 20% 13% 20% 19%
Totals 100% 100% 99% 101% 100% 99% 101% 100% 100% 100%
Unweighted N (1,494) (1,219) (562) (337) (533) (582) (379) (445) (451) (457)
97

The Economist /YouGov PollApril 26 - 28, 2020 - 1500 US Adult citizens
39. Death StatisticsDo you think the government is accurately reporting the number of people who have died from COVID-19 or do you think more people have died from thevirus or fewer people have died from the virus?
Gender Education Income
Total Male Female HS or less Some college College grad Postgrad Under $50K $50-100K $100K or more
More people have died 38% 38% 38% 34% 34% 47% 49% 36% 38% 44%
The government numbersare accurate 21% 22% 20% 21% 19% 22% 26% 20% 24% 26%
Fewer people have died 19% 21% 17% 18% 23% 17% 13% 19% 19% 18%
Don’t know 22% 19% 24% 27% 23% 15% 11% 25% 19% 13%
Totals 100% 100% 99% 100% 99% 101% 99% 100% 100% 101%
Unweighted N (1,494) (666) (828) (469) (529) (301) (195) (597) (442) (286)
Age Race Region
Total 18-29 30-44 45-64 65+ White Black Hispanic Other Northeast Midwest South West
More people have died 38% 38% 38% 38% 39% 37% 51% 31% 43% 34% 42% 39% 37%
The government numbersare accurate 21% 23% 22% 19% 22% 23% 13% 18% 21% 23% 23% 20% 18%
Fewer people have died 19% 15% 15% 23% 19% 20% 10% 19% 21% 16% 15% 18% 26%
Don’t know 22% 24% 24% 20% 20% 20% 26% 33% 16% 27% 20% 22% 19%
Totals 100% 100% 99% 100% 100% 100% 100% 101% 101% 100% 100% 99% 100%
Unweighted N (1,494) (313) (279) (591) (311) (1,082) (162) (165) (85) (272) (330) (550) (342)
Registered Primary Voter Party ID Ideology
Total Voters Dem Rep Dem Ind Rep Lib Mod Con
More people have died 38% 41% 64% 19% 60% 34% 17% 62% 40% 19%
The government numbersare accurate 21% 22% 16% 29% 15% 21% 28% 19% 22% 26%
continued on the next page . . .
98

The Economist /YouGov PollApril 26 - 28, 2020 - 1500 US Adult citizens
continued from previous pageRegistered Primary Voter Party ID Ideology
Total Voters Dem Rep Dem Ind Rep Lib Mod Con
Fewer people have died 19% 20% 6% 40% 5% 21% 33% 5% 15% 35%
Don’t know 22% 16% 13% 12% 20% 24% 22% 14% 24% 19%
Totals 100% 99% 99% 100% 100% 100% 100% 100% 101% 99%
Unweighted N (1,494) (1,219) (564) (334) (536) (582) (376) (448) (450) (454)
99

The Economist /YouGov PollApril 26 - 28, 2020 - 1500 US Adult citizens
40. Trump COVID-19 Job HandlingDo you approve or disapprove of Donald Trump’s handling of COVID-19 outbreak?
Gender Education Income
Total Male Female HS or less Some college College grad Postgrad Under $50K $50-100K $100K or more
Strongly approve 24% 26% 21% 26% 24% 20% 18% 21% 26% 24%
Somewhat approve 21% 19% 23% 20% 23% 18% 23% 20% 21% 26%
Somewhat disapprove 12% 14% 9% 12% 11% 15% 9% 14% 12% 10%
Strongly disapprove 37% 35% 38% 31% 37% 44% 48% 36% 36% 39%
Not sure 7% 5% 9% 11% 6% 4% 2% 9% 4% 2%
Totals 101% 99% 100% 100% 101% 101% 100% 100% 99% 101%
Unweighted N (1,495) (665) (830) (467) (531) (301) (196) (596) (443) (287)
Age Race Region
Total 18-29 30-44 45-64 65+ White Black Hispanic Other Northeast Midwest South West
Strongly approve 24% 16% 16% 26% 35% 27% 7% 21% 22% 21% 22% 24% 26%
Somewhat approve 21% 17% 23% 23% 17% 23% 14% 15% 11% 21% 22% 20% 20%
Somewhat disapprove 12% 20% 15% 9% 5% 10% 15% 17% 21% 14% 9% 12% 12%
Strongly disapprove 37% 34% 39% 35% 41% 33% 54% 40% 43% 37% 41% 35% 35%
Not sure 7% 13% 7% 6% 2% 7% 10% 8% 4% 7% 5% 8% 7%
Totals 101% 100% 100% 99% 100% 100% 100% 101% 101% 100% 99% 99% 100%
Unweighted N (1,495) (313) (277) (594) (311) (1,086) (160) (164) (85) (274) (329) (551) (341)
Registered Primary Voter Party ID Ideology
Total Voters Dem Rep Dem Ind Rep Lib Mod Con
Strongly approve 24% 26% 5% 62% 7% 18% 52% 10% 14% 48%
Somewhat approve 21% 20% 10% 25% 11% 22% 31% 6% 25% 31%
Somewhat disapprove 12% 10% 11% 6% 12% 15% 7% 10% 16% 7%
continued on the next page . . .
100

The Economist /YouGov PollApril 26 - 28, 2020 - 1500 US Adult citizens
continued from previous pageRegistered Primary Voter Party ID Ideology
Total Voters Dem Rep Dem Ind Rep Lib Mod Con
Strongly disapprove 37% 41% 72% 5% 66% 34% 5% 71% 38% 8%
Not sure 7% 3% 2% 1% 3% 11% 5% 2% 8% 5%
Totals 101% 100% 100% 99% 99% 100% 100% 99% 101% 99%
Unweighted N (1,495) (1,219) (564) (336) (535) (582) (378) (449) (449) (456)
101

The Economist /YouGov PollApril 26 - 28, 2020 - 1500 US Adult citizens
41. Trump COVID-19 Response TimingIn handling COVID-19, do you believe that Donald Trump...
Gender Education Income
Total Male Female HS or less Some college College grad Postgrad Under $50K $50-100K $100K or more
Acted too quickly 2% 1% 2% 2% 1% 2% 0% 2% 1% 1%
Acted at the appropriatetime 36% 40% 32% 39% 37% 32% 32% 33% 40% 39%
Waited too long to act 53% 50% 55% 45% 53% 61% 63% 51% 55% 54%
Not sure 10% 8% 11% 14% 9% 5% 5% 14% 4% 6%
Totals 101% 99% 100% 100% 100% 100% 100% 100% 100% 100%
Unweighted N (1,490) (662) (828) (465) (528) (301) (196) (597) (441) (287)
Age Race Region
Total 18-29 30-44 45-64 65+ White Black Hispanic Other Northeast Midwest South West
Acted too quickly 2% 3% 3% 1% 0% 1% 2% 2% 5% 2% 0% 2% 2%
Acted at the appropriatetime 36% 26% 31% 40% 46% 40% 15% 39% 26% 30% 35% 36% 43%
Waited too long to act 53% 56% 55% 50% 50% 50% 68% 50% 56% 56% 58% 51% 47%
Not sure 10% 15% 11% 9% 3% 8% 15% 10% 14% 11% 7% 11% 8%
Totals 101% 100% 100% 100% 99% 99% 100% 101% 101% 99% 100% 100% 100%
Unweighted N (1,490) (310) (277) (592) (311) (1,079) (161) (165) (85) (271) (329) (550) (340)
Registered Primary Voter Party ID Ideology
Total Voters Dem Rep Dem Ind Rep Lib Mod Con
Acted too quickly 2% 1% 1% 2% 1% 1% 3% 2% 2% 1%
Acted at the appropriatetime 36% 40% 10% 83% 13% 33% 69% 12% 30% 70%
Waited too long to act 53% 55% 87% 14% 83% 51% 19% 83% 57% 21%
continued on the next page . . .
102

The Economist /YouGov PollApril 26 - 28, 2020 - 1500 US Adult citizens
continued from previous pageRegistered Primary Voter Party ID Ideology
Total Voters Dem Rep Dem Ind Rep Lib Mod Con
Not sure 10% 4% 2% 2% 3% 15% 9% 4% 11% 8%
Totals 101% 100% 100% 101% 100% 100% 100% 101% 100% 100%
Unweighted N (1,490) (1,214) (563) (335) (534) (579) (377) (446) (448) (455)
103

The Economist /YouGov PollApril 26 - 28, 2020 - 1500 US Adult citizens
42. Congressional COVID-19 Job HandlingDo you approve or disapprove of Congress’ handling of COVID-19 outbreak?
Gender Education Income
Total Male Female HS or less Some college College grad Postgrad Under $50K $50-100K $100K or more
Strongly approve 6% 6% 6% 7% 6% 5% 7% 6% 5% 8%
Somewhat approve 28% 27% 29% 27% 27% 31% 31% 29% 32% 29%
Somewhat disapprove 28% 31% 26% 25% 26% 34% 35% 25% 32% 31%
Strongly disapprove 21% 24% 18% 18% 24% 21% 20% 19% 21% 22%
Not sure 17% 13% 20% 23% 16% 10% 7% 20% 10% 11%
Totals 100% 101% 99% 100% 99% 101% 100% 99% 100% 101%
Unweighted N (1,496) (665) (831) (469) (530) (302) (195) (598) (443) (285)
Age Race Region
Total 18-29 30-44 45-64 65+ White Black Hispanic Other Northeast Midwest South West
Strongly approve 6% 6% 4% 7% 7% 5% 10% 7% 4% 6% 5% 7% 6%
Somewhat approve 28% 21% 33% 28% 30% 28% 29% 30% 22% 32% 31% 26% 25%
Somewhat disapprove 28% 27% 31% 26% 30% 30% 24% 19% 37% 23% 28% 30% 31%
Strongly disapprove 21% 17% 15% 24% 26% 21% 17% 17% 30% 17% 21% 21% 24%
Not sure 17% 28% 17% 14% 8% 15% 20% 26% 7% 21% 15% 16% 14%
Totals 100% 99% 100% 99% 101% 99% 100% 99% 100% 99% 100% 100% 100%
Unweighted N (1,496) (313) (278) (593) (312) (1,087) (161) (163) (85) (275) (329) (550) (342)
Registered Primary Voter Party ID Ideology
Total Voters Dem Rep Dem Ind Rep Lib Mod Con
Strongly approve 6% 7% 8% 5% 8% 4% 7% 8% 5% 6%
Somewhat approve 28% 31% 37% 27% 35% 23% 28% 35% 30% 26%
Somewhat disapprove 28% 30% 27% 30% 27% 31% 25% 26% 33% 29%
continued on the next page . . .
104

The Economist /YouGov PollApril 26 - 28, 2020 - 1500 US Adult citizens
continued from previous pageRegistered Primary Voter Party ID Ideology
Total Voters Dem Rep Dem Ind Rep Lib Mod Con
Strongly disapprove 21% 23% 20% 31% 16% 22% 24% 20% 17% 26%
Not sure 17% 9% 8% 7% 13% 20% 15% 11% 15% 13%
Totals 100% 100% 100% 100% 99% 100% 99% 100% 100% 100%
Unweighted N (1,496) (1,219) (563) (336) (535) (582) (379) (447) (451) (457)
105

The Economist /YouGov PollApril 26 - 28, 2020 - 1500 US Adult citizens
43A. Favorability Of Officials Working On COVID-19 Response — Andrew CuomoDo you have a favorable or an unfavorable opinion of the following people or organizations?
Gender Education Income
Total Male Female HS or less Some college College grad Postgrad Under $50K $50-100K $100K or more
Very favorable 26% 24% 27% 19% 27% 27% 43% 22% 30% 32%
Somewhat favorable 21% 22% 20% 19% 19% 24% 26% 18% 23% 25%
Somewhat unfavorable 13% 16% 11% 13% 12% 17% 12% 13% 12% 16%
Very unfavorable 16% 17% 14% 16% 17% 14% 12% 14% 15% 18%
Don’t know 25% 21% 28% 33% 25% 19% 7% 32% 19% 9%
Totals 101% 100% 100% 100% 100% 101% 100% 99% 99% 100%
Unweighted N (1,497) (666) (831) (470) (530) (301) (196) (598) (443) (287)
Age Race Region
Total 18-29 30-44 45-64 65+ White Black Hispanic Other Northeast Midwest South West
Very favorable 26% 15% 22% 29% 35% 25% 36% 18% 24% 33% 23% 23% 25%
Somewhat favorable 21% 20% 23% 20% 20% 22% 19% 15% 17% 21% 21% 22% 18%
Somewhat unfavorable 13% 12% 17% 12% 13% 14% 11% 13% 17% 10% 14% 15% 13%
Very unfavorable 16% 13% 8% 19% 21% 18% 6% 14% 15% 13% 14% 16% 20%
Don’t know 25% 40% 29% 21% 11% 22% 28% 40% 28% 22% 29% 24% 24%
Totals 101% 100% 99% 101% 100% 101% 100% 100% 101% 99% 101% 100% 100%
Unweighted N (1,497) (312) (278) (594) (313) (1,086) (162) (165) (84) (274) (328) (552) (343)
Registered Primary Voter Party ID Ideology
Total Voters Dem Rep Dem Ind Rep Lib Mod Con
Very favorable 26% 32% 54% 9% 50% 17% 8% 47% 30% 6%
Somewhat favorable 21% 22% 21% 20% 21% 21% 20% 25% 24% 17%
Somewhat unfavorable 13% 14% 7% 23% 6% 14% 22% 7% 9% 23%
continued on the next page . . .
106

The Economist /YouGov PollApril 26 - 28, 2020 - 1500 US Adult citizens
continued from previous pageRegistered Primary Voter Party ID Ideology
Total Voters Dem Rep Dem Ind Rep Lib Mod Con
Very unfavorable 16% 18% 6% 38% 4% 14% 32% 3% 13% 33%
Don’t know 25% 15% 12% 10% 19% 33% 18% 18% 24% 21%
Totals 101% 101% 100% 100% 100% 99% 100% 100% 100% 100%
Unweighted N (1,497) (1,220) (563) (337) (535) (583) (379) (448) (449) (457)
107

The Economist /YouGov PollApril 26 - 28, 2020 - 1500 US Adult citizens
43B. Favorability Of Officials Working On COVID-19 Response — Gretchen WhitmerDo you have a favorable or an unfavorable opinion of the following people or organizations?
Gender Education Income
Total Male Female HS or less Some college College grad Postgrad Under $50K $50-100K $100K or more
Very favorable 13% 13% 12% 9% 11% 16% 24% 10% 15% 19%
Somewhat favorable 11% 10% 12% 8% 11% 16% 11% 9% 14% 12%
Somewhat unfavorable 9% 11% 7% 13% 6% 8% 6% 10% 5% 12%
Very unfavorable 13% 15% 10% 11% 14% 13% 13% 10% 13% 16%
Don’t know 55% 50% 59% 59% 58% 46% 45% 61% 52% 42%
Totals 101% 99% 100% 100% 100% 99% 99% 100% 99% 101%
Unweighted N (1,495) (664) (831) (467) (530) (302) (196) (596) (443) (287)
Age Race Region
Total 18-29 30-44 45-64 65+ White Black Hispanic Other Northeast Midwest South West
Very favorable 13% 8% 10% 14% 18% 14% 11% 10% 10% 13% 15% 10% 15%
Somewhat favorable 11% 8% 13% 12% 10% 11% 11% 13% 9% 10% 11% 12% 11%
Somewhat unfavorable 9% 12% 11% 7% 7% 7% 13% 14% 9% 11% 9% 7% 11%
Very unfavorable 13% 6% 6% 17% 21% 14% 5% 10% 20% 6% 12% 13% 18%
Don’t know 55% 67% 60% 50% 44% 54% 60% 52% 52% 60% 53% 59% 45%
Totals 101% 101% 100% 100% 100% 100% 100% 99% 100% 100% 100% 101% 100%
Unweighted N (1,495) (311) (278) (593) (313) (1,084) (162) (165) (84) (272) (330) (551) (342)
Registered Primary Voter Party ID Ideology
Total Voters Dem Rep Dem Ind Rep Lib Mod Con
Very favorable 13% 17% 32% 4% 27% 7% 4% 27% 12% 4%
Somewhat favorable 11% 12% 16% 9% 14% 9% 10% 13% 13% 7%
Somewhat unfavorable 9% 8% 6% 9% 7% 10% 10% 7% 8% 12%
continued on the next page . . .
108

The Economist /YouGov PollApril 26 - 28, 2020 - 1500 US Adult citizens
continued from previous pageRegistered Primary Voter Party ID Ideology
Total Voters Dem Rep Dem Ind Rep Lib Mod Con
Very unfavorable 13% 15% 4% 34% 3% 12% 26% 2% 10% 27%
Don’t know 55% 47% 42% 44% 49% 62% 51% 51% 57% 49%
Totals 101% 99% 100% 100% 100% 100% 101% 100% 100% 99%
Unweighted N (1,495) (1,219) (564) (336) (534) (583) (378) (448) (450) (455)
109

The Economist /YouGov PollApril 26 - 28, 2020 - 1500 US Adult citizens
43C. Favorability Of Officials Working On COVID-19 Response — Mike DeWineDo you have a favorable or an unfavorable opinion of the following people or organizations?
Gender Education Income
Total Male Female HS or less Some college College grad Postgrad Under $50K $50-100K $100K or more
Very favorable 7% 8% 7% 6% 7% 9% 14% 6% 8% 10%
Somewhat favorable 15% 18% 12% 14% 11% 19% 20% 13% 19% 19%
Somewhat unfavorable 8% 10% 5% 10% 5% 10% 3% 8% 6% 12%
Very unfavorable 5% 5% 5% 5% 4% 5% 4% 5% 4% 2%
Don’t know 65% 59% 71% 65% 72% 57% 59% 69% 64% 57%
Totals 100% 100% 100% 100% 99% 100% 100% 101% 101% 100%
Unweighted N (1,499) (666) (833) (470) (531) (302) (196) (599) (443) (287)
Age Race Region
Total 18-29 30-44 45-64 65+ White Black Hispanic Other Northeast Midwest South West
Very favorable 7% 6% 9% 6% 10% 8% 5% 5% 4% 7% 15% 4% 7%
Somewhat favorable 15% 12% 17% 14% 18% 15% 12% 14% 18% 14% 19% 12% 17%
Somewhat unfavorable 8% 6% 11% 8% 6% 6% 10% 13% 11% 7% 6% 9% 8%
Very unfavorable 5% 5% 3% 4% 6% 4% 7% 5% 9% 3% 4% 5% 5%
Don’t know 65% 71% 60% 68% 61% 66% 67% 64% 57% 70% 55% 70% 63%
Totals 100% 100% 100% 100% 101% 99% 101% 101% 99% 101% 99% 100% 100%
Unweighted N (1,499) (313) (279) (594) (313) (1,087) (162) (165) (85) (274) (330) (552) (343)
Registered Primary Voter Party ID Ideology
Total Voters Dem Rep Dem Ind Rep Lib Mod Con
Very favorable 7% 9% 10% 11% 8% 5% 11% 8% 8% 9%
Somewhat favorable 15% 16% 19% 15% 18% 13% 14% 19% 15% 14%
Somewhat unfavorable 8% 8% 8% 9% 7% 9% 6% 10% 6% 7%
continued on the next page . . .
110

The Economist /YouGov PollApril 26 - 28, 2020 - 1500 US Adult citizens
continued from previous pageRegistered Primary Voter Party ID Ideology
Total Voters Dem Rep Dem Ind Rep Lib Mod Con
Very unfavorable 5% 4% 4% 4% 5% 5% 4% 4% 6% 3%
Don’t know 65% 62% 58% 62% 63% 67% 66% 60% 65% 67%
Totals 100% 99% 99% 101% 101% 99% 101% 101% 100% 100%
Unweighted N (1,499) (1,221) (564) (337) (536) (584) (379) (449) (450) (457)
111

The Economist /YouGov PollApril 26 - 28, 2020 - 1500 US Adult citizens
43D. Favorability Of Officials Working On COVID-19 Response — Ron DeSantisDo you have a favorable or an unfavorable opinion of the following people or organizations?
Gender Education Income
Total Male Female HS or less Some college College grad Postgrad Under $50K $50-100K $100K or more
Very favorable 8% 11% 6% 8% 9% 11% 5% 8% 9% 9%
Somewhat favorable 13% 15% 10% 13% 12% 15% 11% 11% 11% 20%
Somewhat unfavorable 9% 12% 6% 12% 6% 8% 10% 9% 7% 13%
Very unfavorable 14% 14% 15% 10% 12% 21% 27% 10% 18% 19%
Don’t know 55% 47% 62% 57% 61% 46% 48% 61% 54% 39%
Totals 99% 99% 99% 100% 100% 101% 101% 99% 99% 100%
Unweighted N (1,495) (663) (832) (467) (530) (302) (196) (595) (443) (287)
Age Race Region
Total 18-29 30-44 45-64 65+ White Black Hispanic Other Northeast Midwest South West
Very favorable 8% 9% 4% 7% 14% 8% 6% 13% 7% 9% 6% 9% 9%
Somewhat favorable 13% 10% 13% 14% 13% 12% 15% 13% 10% 12% 13% 13% 13%
Somewhat unfavorable 9% 6% 14% 8% 9% 9% 9% 12% 9% 10% 6% 11% 8%
Very unfavorable 14% 12% 11% 17% 18% 15% 14% 11% 19% 10% 10% 16% 19%
Don’t know 55% 64% 57% 54% 46% 55% 57% 51% 55% 59% 64% 51% 51%
Totals 99% 101% 99% 100% 100% 99% 101% 100% 100% 100% 99% 100% 100%
Unweighted N (1,495) (312) (277) (593) (313) (1,084) (162) (164) (85) (273) (330) (550) (342)
Registered Primary Voter Party ID Ideology
Total Voters Dem Rep Dem Ind Rep Lib Mod Con
Very favorable 8% 10% 5% 19% 4% 7% 16% 3% 6% 19%
Somewhat favorable 13% 14% 10% 21% 11% 10% 19% 9% 14% 18%
Somewhat unfavorable 9% 9% 8% 10% 7% 10% 10% 8% 9% 8%
continued on the next page . . .
112

The Economist /YouGov PollApril 26 - 28, 2020 - 1500 US Adult citizens
continued from previous pageRegistered Primary Voter Party ID Ideology
Total Voters Dem Rep Dem Ind Rep Lib Mod Con
Very unfavorable 14% 18% 32% 5% 25% 13% 4% 29% 15% 3%
Don’t know 55% 49% 44% 46% 53% 59% 52% 51% 57% 52%
Totals 99% 100% 99% 101% 100% 99% 101% 100% 101% 100%
Unweighted N (1,495) (1,218) (564) (335) (535) (583) (377) (448) (450) (455)
113

The Economist /YouGov PollApril 26 - 28, 2020 - 1500 US Adult citizens
43E. Favorability Of Officials Working On COVID-19 Response — Gavin NewsomDo you have a favorable or an unfavorable opinion of the following people or organizations?
Gender Education Income
Total Male Female HS or less Some college College grad Postgrad Under $50K $50-100K $100K or more
Very favorable 14% 14% 14% 9% 12% 16% 30% 9% 17% 22%
Somewhat favorable 13% 17% 10% 13% 9% 19% 16% 11% 13% 19%
Somewhat unfavorable 8% 11% 6% 10% 6% 8% 7% 9% 7% 9%
Very unfavorable 11% 14% 9% 10% 12% 12% 10% 10% 11% 12%
Don’t know 54% 45% 62% 57% 61% 44% 37% 61% 53% 39%
Totals 100% 101% 101% 99% 100% 99% 100% 100% 101% 101%
Unweighted N (1,494) (665) (829) (467) (529) (302) (196) (596) (442) (286)
Age Race Region
Total 18-29 30-44 45-64 65+ White Black Hispanic Other Northeast Midwest South West
Very favorable 14% 9% 13% 15% 18% 14% 11% 16% 17% 14% 9% 10% 26%
Somewhat favorable 13% 15% 15% 11% 13% 14% 10% 14% 10% 13% 14% 11% 16%
Somewhat unfavorable 8% 6% 10% 9% 7% 7% 10% 16% 5% 9% 5% 9% 9%
Very unfavorable 11% 7% 9% 12% 16% 12% 7% 7% 17% 6% 9% 11% 18%
Don’t know 54% 62% 53% 54% 46% 54% 63% 47% 51% 58% 63% 59% 31%
Totals 100% 99% 100% 101% 100% 101% 101% 100% 100% 100% 100% 100% 100%
Unweighted N (1,494) (311) (277) (593) (313) (1,085) (159) (165) (85) (272) (330) (549) (343)
Registered Primary Voter Party ID Ideology
Total Voters Dem Rep Dem Ind Rep Lib Mod Con
Very favorable 14% 18% 33% 4% 29% 8% 4% 30% 14% 3%
Somewhat favorable 13% 15% 14% 18% 13% 12% 16% 13% 14% 15%
Somewhat unfavorable 8% 8% 5% 13% 5% 11% 8% 4% 7% 12%
continued on the next page . . .
114

The Economist /YouGov PollApril 26 - 28, 2020 - 1500 US Adult citizens
continued from previous pageRegistered Primary Voter Party ID Ideology
Total Voters Dem Rep Dem Ind Rep Lib Mod Con
Very unfavorable 11% 12% 4% 26% 3% 11% 22% 3% 9% 22%
Don’t know 54% 47% 45% 40% 51% 59% 50% 50% 56% 48%
Totals 100% 100% 101% 101% 101% 101% 100% 100% 100% 100%
Unweighted N (1,494) (1,219) (564) (336) (536) (581) (377) (447) (449) (456)
115

The Economist /YouGov PollApril 26 - 28, 2020 - 1500 US Adult citizens
43F. Favorability Of Officials Working On COVID-19 Response — Anthony FauciDo you have a favorable or an unfavorable opinion of the following people or organizations?
Gender Education Income
Total Male Female HS or less Some college College grad Postgrad Under $50K $50-100K $100K or more
Very favorable 35% 34% 36% 26% 34% 43% 54% 29% 42% 46%
Somewhat favorable 25% 29% 21% 25% 22% 27% 29% 23% 26% 32%
Somewhat unfavorable 11% 12% 9% 12% 11% 8% 8% 12% 10% 7%
Very unfavorable 6% 6% 7% 8% 7% 5% 1% 7% 4% 5%
Don’t know 23% 19% 27% 29% 26% 17% 8% 29% 18% 10%
Totals 100% 100% 100% 100% 100% 100% 100% 100% 100% 100%
Unweighted N (1,495) (662) (833) (468) (529) (302) (196) (595) (443) (287)
Age Race Region
Total 18-29 30-44 45-64 65+ White Black Hispanic Other Northeast Midwest South West
Very favorable 35% 26% 29% 36% 49% 36% 36% 28% 34% 37% 39% 32% 34%
Somewhat favorable 25% 22% 29% 24% 24% 27% 20% 19% 27% 27% 26% 25% 22%
Somewhat unfavorable 11% 9% 13% 11% 9% 10% 11% 15% 9% 7% 9% 12% 12%
Very unfavorable 6% 6% 7% 5% 7% 6% 7% 6% 11% 4% 5% 6% 10%
Don’t know 23% 37% 22% 24% 10% 22% 27% 32% 18% 24% 22% 24% 22%
Totals 100% 100% 100% 100% 99% 101% 101% 100% 99% 99% 101% 99% 100%
Unweighted N (1,495) (313) (278) (591) (313) (1,084) (161) (165) (85) (273) (330) (550) (342)
Registered Primary Voter Party ID Ideology
Total Voters Dem Rep Dem Ind Rep Lib Mod Con
Very favorable 35% 44% 61% 26% 53% 28% 23% 55% 38% 23%
Somewhat favorable 25% 26% 23% 28% 21% 25% 30% 23% 24% 31%
Somewhat unfavorable 11% 10% 3% 20% 5% 11% 17% 4% 9% 19%
continued on the next page . . .
116
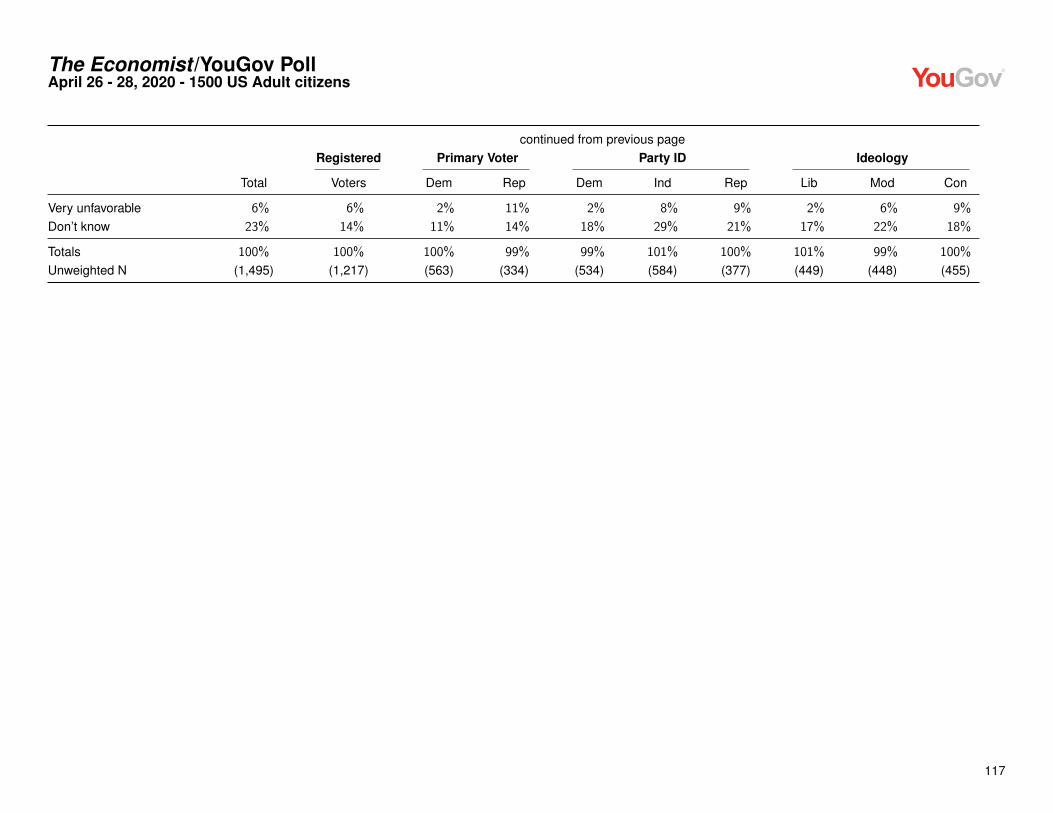
The Economist /YouGov PollApril 26 - 28, 2020 - 1500 US Adult citizens
continued from previous pageRegistered Primary Voter Party ID Ideology
Total Voters Dem Rep Dem Ind Rep Lib Mod Con
Very unfavorable 6% 6% 2% 11% 2% 8% 9% 2% 6% 9%
Don’t know 23% 14% 11% 14% 18% 29% 21% 17% 22% 18%
Totals 100% 100% 100% 99% 99% 101% 100% 101% 99% 100%
Unweighted N (1,495) (1,217) (563) (334) (534) (584) (377) (449) (448) (455)
117
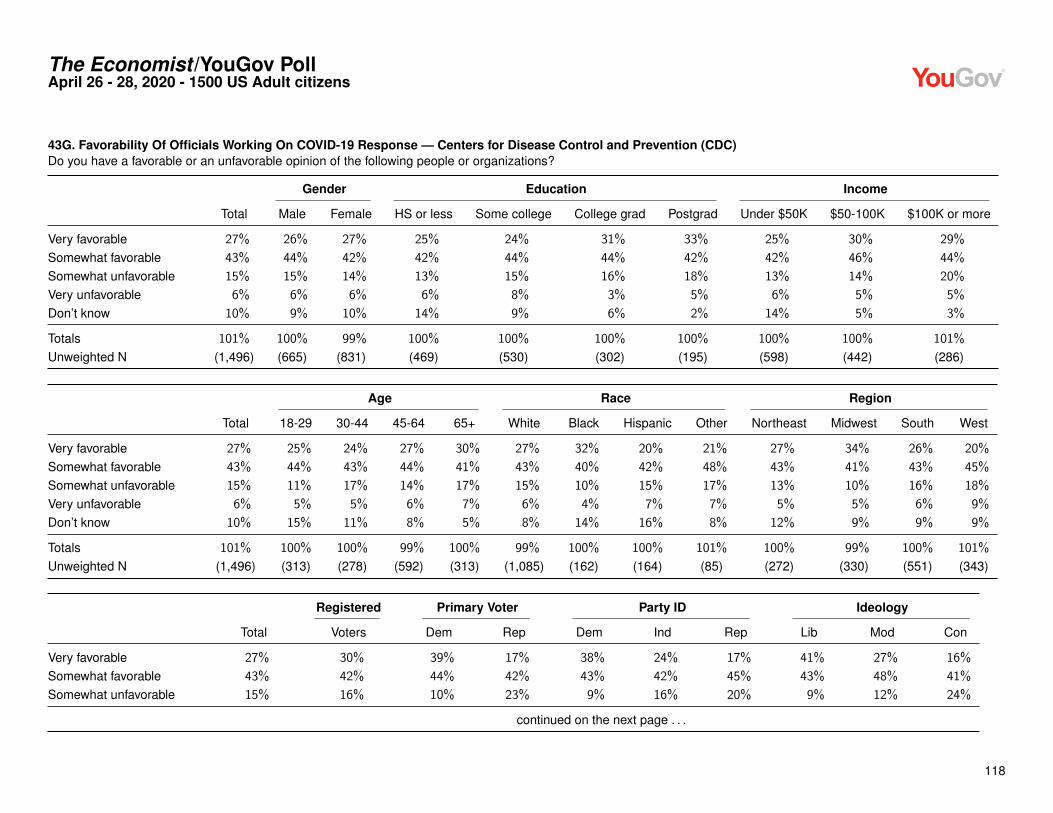
The Economist /YouGov PollApril 26 - 28, 2020 - 1500 US Adult citizens
43G. Favorability Of Officials Working On COVID-19 Response — Centers for Disease Control and Prevention (CDC)Do you have a favorable or an unfavorable opinion of the following people or organizations?
Gender Education Income
Total Male Female HS or less Some college College grad Postgrad Under $50K $50-100K $100K or more
Very favorable 27% 26% 27% 25% 24% 31% 33% 25% 30% 29%
Somewhat favorable 43% 44% 42% 42% 44% 44% 42% 42% 46% 44%
Somewhat unfavorable 15% 15% 14% 13% 15% 16% 18% 13% 14% 20%
Very unfavorable 6% 6% 6% 6% 8% 3% 5% 6% 5% 5%
Don’t know 10% 9% 10% 14% 9% 6% 2% 14% 5% 3%
Totals 101% 100% 99% 100% 100% 100% 100% 100% 100% 101%
Unweighted N (1,496) (665) (831) (469) (530) (302) (195) (598) (442) (286)
Age Race Region
Total 18-29 30-44 45-64 65+ White Black Hispanic Other Northeast Midwest South West
Very favorable 27% 25% 24% 27% 30% 27% 32% 20% 21% 27% 34% 26% 20%
Somewhat favorable 43% 44% 43% 44% 41% 43% 40% 42% 48% 43% 41% 43% 45%
Somewhat unfavorable 15% 11% 17% 14% 17% 15% 10% 15% 17% 13% 10% 16% 18%
Very unfavorable 6% 5% 5% 6% 7% 6% 4% 7% 7% 5% 5% 6% 9%
Don’t know 10% 15% 11% 8% 5% 8% 14% 16% 8% 12% 9% 9% 9%
Totals 101% 100% 100% 99% 100% 99% 100% 100% 101% 100% 99% 100% 101%
Unweighted N (1,496) (313) (278) (592) (313) (1,085) (162) (164) (85) (272) (330) (551) (343)
Registered Primary Voter Party ID Ideology
Total Voters Dem Rep Dem Ind Rep Lib Mod Con
Very favorable 27% 30% 39% 17% 38% 24% 17% 41% 27% 16%
Somewhat favorable 43% 42% 44% 42% 43% 42% 45% 43% 48% 41%
Somewhat unfavorable 15% 16% 10% 23% 9% 16% 20% 9% 12% 24%
continued on the next page . . .
118

The Economist /YouGov PollApril 26 - 28, 2020 - 1500 US Adult citizens
continued from previous pageRegistered Primary Voter Party ID Ideology
Total Voters Dem Rep Dem Ind Rep Lib Mod Con
Very unfavorable 6% 6% 3% 11% 4% 7% 8% 3% 5% 10%
Don’t know 10% 6% 5% 6% 7% 12% 10% 5% 8% 10%
Totals 101% 100% 101% 99% 101% 101% 100% 101% 100% 101%
Unweighted N (1,496) (1,219) (564) (336) (536) (582) (378) (448) (449) (456)
119

The Economist /YouGov PollApril 26 - 28, 2020 - 1500 US Adult citizens
43H. Favorability Of Officials Working On COVID-19 Response — World Health Organization (WHO)Do you have a favorable or an unfavorable opinion of the following people or organizations?
Gender Education Income
Total Male Female HS or less Some college College grad Postgrad Under $50K $50-100K $100K or more
Very favorable 21% 20% 23% 19% 20% 23% 33% 19% 24% 26%
Somewhat favorable 30% 28% 32% 28% 31% 31% 31% 32% 31% 30%
Somewhat unfavorable 16% 19% 14% 18% 12% 21% 15% 15% 17% 18%
Very unfavorable 19% 22% 16% 17% 23% 17% 20% 16% 20% 22%
Don’t know 13% 11% 15% 18% 14% 8% 2% 17% 9% 4%
Totals 99% 100% 100% 100% 100% 100% 101% 99% 101% 100%
Unweighted N (1,494) (664) (830) (467) (530) (302) (195) (596) (443) (287)
Age Race Region
Total 18-29 30-44 45-64 65+ White Black Hispanic Other Northeast Midwest South West
Very favorable 21% 17% 25% 22% 21% 21% 24% 22% 18% 21% 23% 21% 21%
Somewhat favorable 30% 34% 29% 30% 28% 29% 41% 21% 35% 32% 34% 29% 25%
Somewhat unfavorable 16% 20% 18% 14% 16% 18% 9% 13% 16% 18% 14% 18% 14%
Very unfavorable 19% 9% 13% 22% 30% 21% 8% 18% 21% 14% 17% 18% 27%
Don’t know 13% 19% 15% 13% 6% 11% 18% 25% 10% 14% 12% 13% 13%
Totals 99% 99% 100% 101% 101% 100% 100% 99% 100% 99% 100% 99% 100%
Unweighted N (1,494) (311) (277) (593) (313) (1,084) (162) (164) (84) (273) (330) (548) (343)
Registered Primary Voter Party ID Ideology
Total Voters Dem Rep Dem Ind Rep Lib Mod Con
Very favorable 21% 25% 39% 6% 36% 18% 8% 42% 21% 7%
Somewhat favorable 30% 27% 39% 13% 40% 29% 19% 37% 37% 16%
Somewhat unfavorable 16% 17% 10% 24% 10% 18% 22% 10% 17% 22%
continued on the next page . . .
120

The Economist /YouGov PollApril 26 - 28, 2020 - 1500 US Adult citizens
continued from previous pageRegistered Primary Voter Party ID Ideology
Total Voters Dem Rep Dem Ind Rep Lib Mod Con
Very unfavorable 19% 24% 6% 50% 3% 19% 39% 4% 13% 42%
Don’t know 13% 7% 6% 7% 10% 15% 13% 8% 11% 12%
Totals 99% 100% 100% 100% 99% 99% 101% 101% 99% 99%
Unweighted N (1,494) (1,218) (563) (337) (536) (581) (377) (448) (449) (455)
121

The Economist /YouGov PollApril 26 - 28, 2020 - 1500 US Adult citizens
44. COVID-19 A National EmergencyDo you think COVID-19 epidemic is a national emergency?
Gender Education Income
Total Male Female HS or less Some college College grad Postgrad Under $50K $50-100K $100K or more
Yes 80% 76% 84% 76% 80% 85% 89% 77% 84% 85%
No 13% 17% 8% 16% 13% 9% 8% 14% 10% 13%
Not sure 7% 7% 7% 8% 8% 5% 3% 8% 6% 3%
Totals 100% 100% 99% 100% 101% 99% 100% 99% 100% 101%
Unweighted N (1,492) (663) (829) (465) (530) (301) (196) (595) (441) (287)
Age Race Region
Total 18-29 30-44 45-64 65+ White Black Hispanic Other Northeast Midwest South West
Yes 80% 81% 82% 78% 82% 80% 82% 81% 78% 85% 87% 80% 70%
No 13% 9% 12% 15% 12% 13% 9% 14% 14% 10% 8% 11% 21%
Not sure 7% 10% 6% 7% 6% 7% 9% 5% 9% 5% 5% 9% 9%
Totals 100% 100% 100% 100% 100% 100% 100% 100% 101% 100% 100% 100% 100%
Unweighted N (1,492) (308) (278) (594) (312) (1,082) (162) (164) (84) (273) (329) (549) (341)
Registered Primary Voter Party ID Ideology
Total Voters Dem Rep Dem Ind Rep Lib Mod Con
Yes 80% 83% 95% 69% 95% 75% 70% 94% 85% 68%
No 13% 12% 4% 25% 3% 16% 20% 5% 9% 22%
Not sure 7% 5% 1% 6% 2% 9% 10% 2% 6% 10%
Totals 100% 100% 100% 100% 100% 100% 100% 101% 100% 100%
Unweighted N (1,492) (1,218) (563) (337) (535) (580) (377) (447) (448) (457)
122

The Economist /YouGov PollApril 26 - 28, 2020 - 1500 US Adult citizens
45. U.S. Containment Of OutbreakHow well do you think the U.S. is containing the COVID-19 outbreak?
Gender Education Income
Total Male Female HS or less Some college College grad Postgrad Under $50K $50-100K $100K or more
Very well 12% 12% 11% 13% 12% 10% 9% 11% 12% 11%
Somewhat well 39% 36% 41% 37% 41% 38% 36% 38% 43% 39%
Somewhat badly 27% 27% 27% 24% 24% 32% 37% 27% 26% 28%
Very badly 14% 16% 13% 12% 16% 14% 17% 13% 13% 17%
Not sure 9% 9% 8% 14% 7% 6% 1% 11% 5% 5%
Totals 101% 100% 100% 100% 100% 100% 100% 100% 99% 100%
Unweighted N (1,498) (666) (832) (471) (529) (302) (196) (599) (443) (287)
Age Race Region
Total 18-29 30-44 45-64 65+ White Black Hispanic Other Northeast Midwest South West
Very well 12% 10% 8% 14% 13% 12% 7% 15% 10% 11% 9% 12% 15%
Somewhat well 39% 29% 36% 42% 46% 40% 40% 35% 25% 40% 44% 37% 36%
Somewhat badly 27% 31% 29% 24% 25% 26% 28% 22% 41% 28% 28% 27% 25%
Very badly 14% 17% 15% 13% 12% 14% 13% 12% 19% 12% 14% 15% 14%
Not sure 9% 13% 12% 6% 5% 7% 12% 16% 5% 9% 6% 9% 10%
Totals 101% 100% 100% 99% 101% 99% 100% 100% 100% 100% 101% 100% 100%
Unweighted N (1,498) (313) (279) (594) (312) (1,087) (162) (164) (85) (275) (330) (552) (341)
Registered Primary Voter Party ID Ideology
Total Voters Dem Rep Dem Ind Rep Lib Mod Con
Very well 12% 14% 6% 27% 6% 11% 20% 7% 9% 21%
Somewhat well 39% 40% 32% 53% 29% 38% 52% 25% 40% 52%
Somewhat badly 27% 27% 35% 12% 37% 26% 16% 37% 28% 15%
continued on the next page . . .
123

The Economist /YouGov PollApril 26 - 28, 2020 - 1500 US Adult citizens
continued from previous pageRegistered Primary Voter Party ID Ideology
Total Voters Dem Rep Dem Ind Rep Lib Mod Con
Very badly 14% 15% 26% 2% 24% 13% 4% 26% 14% 4%
Not sure 9% 5% 2% 5% 5% 12% 9% 4% 9% 8%
Totals 101% 101% 101% 99% 101% 100% 101% 99% 100% 100%
Unweighted N (1,498) (1,221) (564) (336) (536) (583) (379) (449) (451) (456)
124

The Economist /YouGov PollApril 26 - 28, 2020 - 1500 US Adult citizens
46. Rate Federal HandlingHow well do you think the federal government has handled COVID-19 so far?
Gender Education Income
Total Male Female HS or less Some college College grad Postgrad Under $50K $50-100K $100K or more
Excellent 9% 8% 10% 9% 9% 8% 11% 9% 10% 11%
Good 26% 27% 25% 29% 24% 25% 20% 26% 29% 26%
Fair 26% 24% 27% 25% 26% 26% 28% 27% 27% 23%
Poor 33% 36% 31% 28% 35% 38% 40% 31% 32% 36%
Not sure 6% 5% 6% 10% 6% 2% 0% 7% 2% 4%
Totals 100% 100% 99% 101% 100% 99% 99% 100% 100% 100%
Unweighted N (1,492) (663) (829) (467) (531) (299) (195) (595) (443) (286)
Age Race Region
Total 18-29 30-44 45-64 65+ White Black Hispanic Other Northeast Midwest South West
Excellent 9% 7% 8% 9% 12% 9% 9% 10% 8% 9% 9% 9% 10%
Good 26% 22% 22% 29% 29% 28% 13% 29% 19% 28% 28% 25% 23%
Fair 26% 24% 30% 25% 23% 27% 23% 25% 19% 22% 24% 29% 25%
Poor 33% 35% 34% 32% 33% 32% 42% 27% 49% 36% 34% 31% 34%
Not sure 6% 11% 6% 5% 3% 4% 13% 9% 6% 6% 5% 6% 8%
Totals 100% 99% 100% 100% 100% 100% 100% 100% 101% 101% 100% 100% 100%
Unweighted N (1,492) (312) (275) (593) (312) (1,084) (161) (163) (84) (273) (327) (551) (341)
Registered Primary Voter Party ID Ideology
Total Voters Dem Rep Dem Ind Rep Lib Mod Con
Excellent 9% 10% 5% 21% 5% 8% 16% 5% 6% 16%
Good 26% 27% 12% 47% 16% 22% 44% 11% 25% 44%
Fair 26% 25% 24% 23% 22% 30% 25% 20% 30% 25%
continued on the next page . . .
125

The Economist /YouGov PollApril 26 - 28, 2020 - 1500 US Adult citizens
continued from previous pageRegistered Primary Voter Party ID Ideology
Total Voters Dem Rep Dem Ind Rep Lib Mod Con
Poor 33% 34% 57% 5% 54% 33% 9% 60% 35% 9%
Not sure 6% 4% 2% 4% 4% 7% 7% 3% 4% 6%
Totals 100% 100% 100% 100% 101% 100% 101% 99% 100% 100%
Unweighted N (1,492) (1,216) (562) (336) (534) (580) (378) (447) (448) (455)
126

The Economist /YouGov PollApril 26 - 28, 2020 - 1500 US Adult citizens
47. Describe Trump’s Thinking About COVID-19How would you describe the way Donald Trump is thinking about federal government policy concerning COVID-19?
Gender Education Income
Total Male Female HS or less Some college College grad Postgrad Under $50K $50-100K $100K or more
His policy is not takingthe risks seriouslyenough 42% 41% 43% 35% 40% 55% 53% 39% 45% 47%
His policy is appropriate 38% 39% 36% 39% 41% 32% 35% 33% 43% 42%
His policy is overreactingto the actual risksassociated with thevirus 7% 7% 6% 7% 6% 7% 5% 9% 4% 7%
Not sure 13% 12% 14% 19% 13% 6% 6% 19% 8% 4%
Totals 100% 99% 99% 100% 100% 100% 99% 100% 100% 100%
Unweighted N (1,496) (667) (829) (469) (529) (302) (196) (599) (442) (287)
Age Race Region
Total 18-29 30-44 45-64 65+ White Black Hispanic Other Northeast Midwest South West
His policy is not takingthe risks seriouslyenough 42% 45% 44% 39% 43% 40% 56% 39% 49% 47% 50% 38% 37%
His policy is appropriate 38% 27% 37% 41% 44% 43% 12% 37% 33% 33% 35% 41% 39%
His policy is overreactingto the actual risksassociated with thevirus 7% 8% 8% 6% 5% 5% 12% 7% 10% 5% 3% 7% 10%
Not sure 13% 20% 12% 14% 7% 12% 20% 16% 9% 14% 11% 14% 14%
Totals 100% 100% 101% 100% 99% 100% 100% 99% 101% 99% 99% 100% 100%
Unweighted N (1,496) (312) (278) (594) (312) (1,086) (162) (163) (85) (274) (329) (550) (343)
127

The Economist /YouGov PollApril 26 - 28, 2020 - 1500 US Adult citizens
Registered Primary Voter Party ID Ideology
Total Voters Dem Rep Dem Ind Rep Lib Mod Con
His policy is not takingthe risks seriouslyenough 42% 47% 79% 9% 72% 37% 13% 76% 46% 14%
His policy is appropriate 38% 40% 12% 79% 16% 33% 72% 15% 34% 67%
His policy is overreactingto the actual risksassociated with thevirus 7% 5% 4% 7% 3% 10% 5% 4% 7% 7%
Not sure 13% 8% 5% 4% 9% 19% 10% 5% 13% 12%
Totals 100% 100% 100% 99% 100% 99% 100% 100% 100% 100%
Unweighted N (1,496) (1,219) (563) (336) (534) (583) (379) (449) (449) (456)
128

The Economist /YouGov PollApril 26 - 28, 2020 - 1500 US Adult citizens
48. Rate State HandlingHow well do you think your state government has handled COVID-19 so far?
Gender Education Income
Total Male Female HS or less Some college College grad Postgrad Under $50K $50-100K $100K or more
Excellent 19% 18% 20% 19% 18% 20% 23% 17% 21% 23%
Good 38% 36% 39% 35% 36% 40% 47% 37% 41% 42%
Fair 23% 25% 21% 23% 24% 23% 20% 25% 19% 23%
Poor 14% 16% 13% 14% 16% 15% 10% 14% 17% 11%
Not sure 6% 5% 6% 9% 6% 1% 1% 8% 2% 2%
Totals 100% 100% 99% 100% 100% 99% 101% 101% 100% 101%
Unweighted N (1,495) (667) (828) (468) (530) (301) (196) (599) (442) (287)
Age Race Region
Total 18-29 30-44 45-64 65+ White Black Hispanic Other Northeast Midwest South West
Excellent 19% 17% 15% 21% 24% 18% 30% 15% 15% 18% 24% 16% 22%
Good 38% 32% 38% 38% 43% 39% 26% 41% 43% 45% 46% 33% 31%
Fair 23% 24% 26% 23% 19% 25% 17% 19% 23% 19% 18% 27% 26%
Poor 14% 17% 16% 13% 11% 15% 10% 16% 18% 13% 10% 17% 14%
Not sure 6% 11% 4% 5% 3% 3% 17% 9% 2% 5% 4% 7% 7%
Totals 100% 101% 99% 100% 100% 100% 100% 100% 101% 100% 102% 100% 100%
Unweighted N (1,495) (311) (278) (594) (312) (1,085) (161) (165) (84) (274) (330) (550) (341)
Registered Primary Voter Party ID Ideology
Total Voters Dem Rep Dem Ind Rep Lib Mod Con
Excellent 19% 22% 27% 19% 25% 18% 14% 28% 22% 13%
Good 38% 39% 40% 38% 41% 33% 40% 34% 43% 39%
Fair 23% 22% 20% 24% 21% 24% 24% 19% 23% 26%
continued on the next page . . .
129

The Economist /YouGov PollApril 26 - 28, 2020 - 1500 US Adult citizens
continued from previous pageRegistered Primary Voter Party ID Ideology
Total Voters Dem Rep Dem Ind Rep Lib Mod Con
Poor 14% 14% 12% 18% 10% 17% 16% 15% 10% 16%
Not sure 6% 2% 1% 0% 4% 8% 5% 4% 3% 6%
Totals 100% 99% 100% 99% 101% 100% 99% 100% 101% 100%
Unweighted N (1,495) (1,220) (564) (336) (535) (581) (379) (448) (450) (456)
130

The Economist /YouGov PollApril 26 - 28, 2020 - 1500 US Adult citizens
49. Rate Local HandlingHow well do you think your local government has handled COVID-19 so far?
Gender Education Income
Total Male Female HS or less Some college College grad Postgrad Under $50K $50-100K $100K or more
Excellent 18% 17% 19% 17% 16% 20% 26% 17% 21% 21%
Good 39% 37% 41% 36% 38% 44% 42% 38% 39% 43%
Fair 22% 25% 20% 23% 22% 22% 19% 22% 22% 24%
Poor 12% 12% 11% 11% 15% 10% 7% 12% 12% 9%
Not sure 9% 9% 9% 13% 9% 4% 6% 11% 7% 3%
Totals 100% 100% 100% 100% 100% 100% 100% 100% 101% 100%
Unweighted N (1,477) (655) (822) (463) (522) (298) (194) (591) (436) (283)
Age Race Region
Total 18-29 30-44 45-64 65+ White Black Hispanic Other Northeast Midwest South West
Excellent 18% 15% 15% 19% 23% 17% 29% 15% 14% 19% 18% 18% 17%
Good 39% 34% 42% 35% 45% 41% 28% 40% 37% 42% 45% 35% 36%
Fair 22% 24% 24% 24% 17% 23% 18% 24% 21% 19% 20% 24% 25%
Poor 12% 14% 10% 13% 8% 12% 8% 12% 16% 11% 8% 13% 13%
Not sure 9% 13% 9% 8% 7% 8% 17% 9% 12% 9% 9% 9% 10%
Totals 100% 100% 100% 99% 100% 101% 100% 100% 100% 100% 100% 99% 101%
Unweighted N (1,477) (307) (273) (587) (310) (1,074) (161) (159) (83) (270) (327) (544) (336)
Registered Primary Voter Party ID Ideology
Total Voters Dem Rep Dem Ind Rep Lib Mod Con
Excellent 18% 21% 27% 19% 24% 16% 14% 26% 19% 13%
Good 39% 41% 40% 41% 41% 36% 41% 38% 42% 40%
Fair 22% 22% 19% 23% 21% 24% 21% 17% 24% 24%
continued on the next page . . .
131

The Economist /YouGov PollApril 26 - 28, 2020 - 1500 US Adult citizens
continued from previous pageRegistered Primary Voter Party ID Ideology
Total Voters Dem Rep Dem Ind Rep Lib Mod Con
Poor 12% 12% 9% 15% 7% 13% 15% 11% 9% 14%
Not sure 9% 5% 4% 3% 6% 11% 10% 8% 6% 10%
Totals 100% 101% 99% 101% 99% 100% 101% 100% 100% 101%
Unweighted N (1,477) (1,204) (559) (331) (530) (574) (373) (443) (442) (453)
132

The Economist /YouGov PollApril 26 - 28, 2020 - 1500 US Adult citizens
50A. Trust In Medical Advice — Donald TrumpHow much do you trust medical advice from each of the following public health officials?
Gender Education Income
Total Male Female HS or less Some college College grad Postgrad Under $50K $50-100K $100K or more
Trust a lot 17% 21% 14% 20% 17% 14% 13% 18% 15% 20%
Trust somewhat 15% 16% 15% 17% 18% 8% 16% 12% 20% 18%
Neither trust nor distrust 11% 10% 11% 10% 9% 15% 9% 11% 12% 9%
Distrust somewhat 9% 10% 8% 11% 6% 9% 8% 9% 9% 9%
Distrust a lot 41% 38% 43% 31% 43% 49% 54% 40% 39% 43%
Not sure 7% 6% 9% 10% 7% 6% 1% 10% 4% 2%
Totals 100% 101% 100% 99% 100% 101% 101% 100% 99% 101%
Unweighted N (1,493) (663) (830) (467) (529) (302) (195) (595) (442) (287)
Age Race Region
Total 18-29 30-44 45-64 65+ White Black Hispanic Other Northeast Midwest South West
Trust a lot 17% 12% 8% 20% 28% 20% 6% 17% 12% 16% 18% 18% 18%
Trust somewhat 15% 11% 15% 19% 14% 17% 4% 16% 10% 13% 12% 17% 18%
Neither trust nor distrust 11% 13% 15% 8% 8% 11% 6% 13% 9% 12% 8% 8% 15%
Distrust somewhat 9% 11% 15% 6% 4% 9% 8% 9% 11% 13% 8% 9% 6%
Distrust a lot 41% 43% 39% 40% 41% 37% 59% 37% 54% 39% 47% 39% 38%
Not sure 7% 10% 8% 7% 5% 6% 17% 8% 4% 7% 6% 9% 5%
Totals 100% 100% 100% 100% 100% 100% 100% 100% 100% 100% 99% 100% 100%
Unweighted N (1,493) (310) (278) (593) (312) (1,084) (160) (164) (85) (275) (329) (549) (340)
Registered Primary Voter Party ID Ideology
Total Voters Dem Rep Dem Ind Rep Lib Mod Con
Trust a lot 17% 20% 4% 48% 4% 13% 40% 6% 8% 41%
continued on the next page . . .
133

The Economist /YouGov PollApril 26 - 28, 2020 - 1500 US Adult citizens
continued from previous pageRegistered Primary Voter Party ID Ideology
Total Voters Dem Rep Dem Ind Rep Lib Mod Con
Trust somewhat 15% 15% 5% 27% 8% 14% 26% 6% 16% 24%
Neither trust nor distrust 11% 9% 4% 11% 4% 13% 15% 3% 14% 14%
Distrust somewhat 9% 8% 7% 5% 7% 12% 6% 7% 11% 6%
Distrust a lot 41% 44% 78% 5% 71% 38% 7% 75% 45% 7%
Not sure 7% 4% 3% 3% 5% 10% 6% 3% 6% 8%
Totals 100% 100% 101% 99% 99% 100% 100% 100% 100% 100%
Unweighted N (1,493) (1,218) (563) (336) (534) (581) (378) (448) (448) (455)
134

The Economist /YouGov PollApril 26 - 28, 2020 - 1500 US Adult citizens
50B. Trust In Medical Advice — Mike PenceHow much do you trust medical advice from each of the following public health officials?
Gender Education Income
Total Male Female HS or less Some college College grad Postgrad Under $50K $50-100K $100K or more
Trust a lot 16% 18% 13% 16% 18% 12% 13% 13% 17% 20%
Trust somewhat 16% 15% 16% 16% 16% 15% 19% 14% 20% 15%
Neither trust nor distrust 14% 15% 13% 16% 11% 18% 14% 15% 15% 14%
Distrust somewhat 10% 12% 9% 10% 9% 12% 11% 11% 9% 14%
Distrust a lot 29% 27% 30% 23% 30% 33% 39% 28% 30% 30%
Not sure 15% 12% 18% 20% 16% 10% 3% 19% 9% 6%
Totals 100% 99% 99% 101% 100% 100% 99% 100% 100% 99%
Unweighted N (1,495) (664) (831) (469) (529) (301) (196) (598) (441) (287)
Age Race Region
Total 18-29 30-44 45-64 65+ White Black Hispanic Other Northeast Midwest South West
Trust a lot 16% 4% 6% 22% 28% 19% 6% 7% 11% 13% 17% 16% 15%
Trust somewhat 16% 14% 18% 15% 16% 17% 7% 21% 8% 14% 13% 17% 18%
Neither trust nor distrust 14% 16% 18% 13% 10% 15% 12% 15% 15% 15% 19% 12% 14%
Distrust somewhat 10% 15% 11% 10% 6% 10% 9% 10% 22% 16% 8% 9% 10%
Distrust a lot 29% 29% 30% 26% 32% 26% 42% 30% 33% 27% 29% 29% 30%
Not sure 15% 22% 18% 14% 8% 13% 24% 18% 10% 15% 13% 18% 12%
Totals 100% 100% 101% 100% 100% 100% 100% 101% 99% 100% 99% 101% 99%
Unweighted N (1,495) (312) (278) (594) (311) (1,084) (162) (164) (85) (274) (328) (551) (342)
Registered Primary Voter Party ID Ideology
Total Voters Dem Rep Dem Ind Rep Lib Mod Con
Trust a lot 16% 20% 4% 49% 3% 11% 38% 3% 7% 39%
continued on the next page . . .
135

The Economist /YouGov PollApril 26 - 28, 2020 - 1500 US Adult citizens
continued from previous pageRegistered Primary Voter Party ID Ideology
Total Voters Dem Rep Dem Ind Rep Lib Mod Con
Trust somewhat 16% 17% 9% 25% 11% 15% 23% 8% 17% 23%
Neither trust nor distrust 14% 13% 8% 15% 9% 16% 18% 9% 18% 15%
Distrust somewhat 10% 10% 14% 4% 13% 12% 3% 12% 13% 5%
Distrust a lot 29% 33% 60% 3% 53% 25% 5% 59% 28% 6%
Not sure 15% 8% 5% 4% 11% 20% 12% 8% 17% 11%
Totals 100% 101% 100% 100% 100% 99% 99% 99% 100% 99%
Unweighted N (1,495) (1,218) (564) (335) (536) (582) (377) (448) (448) (457)
136

The Economist /YouGov PollApril 26 - 28, 2020 - 1500 US Adult citizens
50C. Trust In Medical Advice — Anthony FauciHow much do you trust medical advice from each of the following public health officials?
Gender Education Income
Total Male Female HS or less Some college College grad Postgrad Under $50K $50-100K $100K or more
Trust a lot 35% 34% 36% 26% 36% 43% 55% 29% 41% 49%
Trust somewhat 24% 27% 21% 27% 20% 24% 29% 21% 26% 28%
Neither trust nor distrust 11% 12% 10% 13% 10% 11% 5% 12% 10% 8%
Distrust somewhat 6% 7% 5% 7% 6% 5% 5% 6% 7% 3%
Distrust a lot 6% 6% 6% 6% 7% 5% 2% 7% 4% 5%
Not sure 18% 13% 22% 22% 22% 13% 4% 24% 12% 7%
Totals 100% 99% 100% 101% 101% 101% 100% 99% 100% 100%
Unweighted N (1,497) (665) (832) (470) (530) (301) (196) (599) (442) (286)
Age Race Region
Total 18-29 30-44 45-64 65+ White Black Hispanic Other Northeast Midwest South West
Trust a lot 35% 23% 34% 35% 49% 38% 30% 24% 33% 36% 39% 33% 36%
Trust somewhat 24% 26% 23% 25% 22% 23% 22% 34% 24% 24% 28% 24% 21%
Neither trust nor distrust 11% 14% 11% 11% 6% 11% 10% 10% 10% 14% 8% 10% 10%
Distrust somewhat 6% 4% 8% 7% 6% 6% 5% 7% 6% 3% 4% 7% 9%
Distrust a lot 6% 3% 7% 6% 6% 5% 6% 6% 10% 5% 5% 6% 7%
Not sure 18% 30% 16% 17% 11% 17% 26% 19% 16% 18% 16% 20% 17%
Totals 100% 100% 99% 101% 100% 100% 99% 100% 99% 100% 100% 100% 100%
Unweighted N (1,497) (313) (278) (593) (313) (1,087) (162) (164) (84) (274) (329) (552) (342)
Registered Primary Voter Party ID Ideology
Total Voters Dem Rep Dem Ind Rep Lib Mod Con
Trust a lot 35% 43% 62% 26% 55% 28% 23% 55% 38% 23%
continued on the next page . . .
137
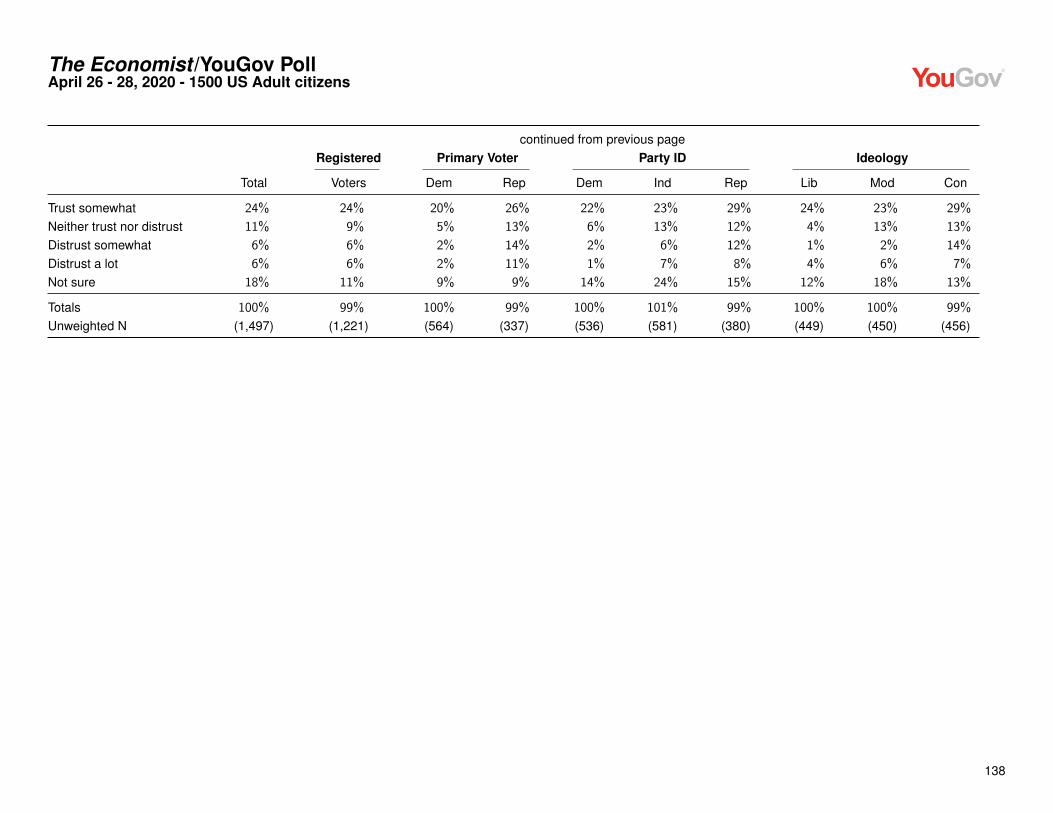
The Economist /YouGov PollApril 26 - 28, 2020 - 1500 US Adult citizens
continued from previous pageRegistered Primary Voter Party ID Ideology
Total Voters Dem Rep Dem Ind Rep Lib Mod Con
Trust somewhat 24% 24% 20% 26% 22% 23% 29% 24% 23% 29%
Neither trust nor distrust 11% 9% 5% 13% 6% 13% 12% 4% 13% 13%
Distrust somewhat 6% 6% 2% 14% 2% 6% 12% 1% 2% 14%
Distrust a lot 6% 6% 2% 11% 1% 7% 8% 4% 6% 7%
Not sure 18% 11% 9% 9% 14% 24% 15% 12% 18% 13%
Totals 100% 99% 100% 99% 100% 101% 99% 100% 100% 99%
Unweighted N (1,497) (1,221) (564) (337) (536) (581) (380) (449) (450) (456)
138

The Economist /YouGov PollApril 26 - 28, 2020 - 1500 US Adult citizens
50D. Trust In Medical Advice — Andrew CuomoHow much do you trust medical advice from each of the following public health officials?
Gender Education Income
Total Male Female HS or less Some college College grad Postgrad Under $50K $50-100K $100K or more
Trust a lot 19% 18% 20% 14% 22% 18% 28% 16% 22% 25%
Trust somewhat 19% 19% 20% 17% 17% 21% 31% 17% 22% 27%
Neither trust nor distrust 16% 19% 14% 18% 12% 23% 14% 16% 17% 17%
Distrust somewhat 9% 11% 8% 10% 8% 10% 11% 9% 9% 11%
Distrust a lot 15% 18% 13% 14% 17% 15% 13% 13% 17% 14%
Not sure 21% 16% 25% 27% 24% 12% 4% 28% 14% 8%
Totals 99% 101% 100% 100% 100% 99% 101% 99% 101% 102%
Unweighted N (1,493) (663) (830) (468) (528) (301) (196) (595) (442) (287)
Age Race Region
Total 18-29 30-44 45-64 65+ White Black Hispanic Other Northeast Midwest South West
Trust a lot 19% 10% 15% 22% 28% 19% 22% 20% 15% 25% 17% 17% 19%
Trust somewhat 19% 15% 22% 19% 22% 19% 22% 16% 17% 20% 19% 19% 19%
Neither trust nor distrust 16% 21% 19% 15% 10% 16% 14% 17% 22% 20% 18% 13% 18%
Distrust somewhat 9% 7% 12% 8% 12% 10% 8% 10% 7% 9% 9% 10% 9%
Distrust a lot 15% 10% 11% 18% 19% 17% 6% 11% 18% 10% 14% 17% 16%
Not sure 21% 36% 22% 17% 9% 19% 27% 25% 20% 16% 23% 23% 19%
Totals 99% 99% 101% 99% 100% 100% 99% 99% 99% 100% 100% 99% 100%
Unweighted N (1,493) (311) (277) (592) (313) (1,084) (161) (163) (85) (273) (330) (551) (339)
Registered Primary Voter Party ID Ideology
Total Voters Dem Rep Dem Ind Rep Lib Mod Con
Trust a lot 19% 23% 40% 7% 36% 14% 6% 36% 22% 6%
continued on the next page . . .
139

The Economist /YouGov PollApril 26 - 28, 2020 - 1500 US Adult citizens
continued from previous pageRegistered Primary Voter Party ID Ideology
Total Voters Dem Rep Dem Ind Rep Lib Mod Con
Trust somewhat 19% 22% 29% 11% 28% 15% 15% 29% 19% 14%
Neither trust nor distrust 16% 16% 10% 16% 11% 20% 18% 11% 18% 17%
Distrust somewhat 9% 10% 5% 17% 5% 11% 13% 4% 8% 16%
Distrust a lot 15% 17% 5% 40% 3% 14% 33% 4% 11% 31%
Not sure 21% 12% 11% 8% 18% 27% 16% 15% 22% 15%
Totals 99% 100% 100% 99% 101% 101% 101% 99% 100% 99%
Unweighted N (1,493) (1,217) (563) (336) (534) (581) (378) (447) (450) (455)
140
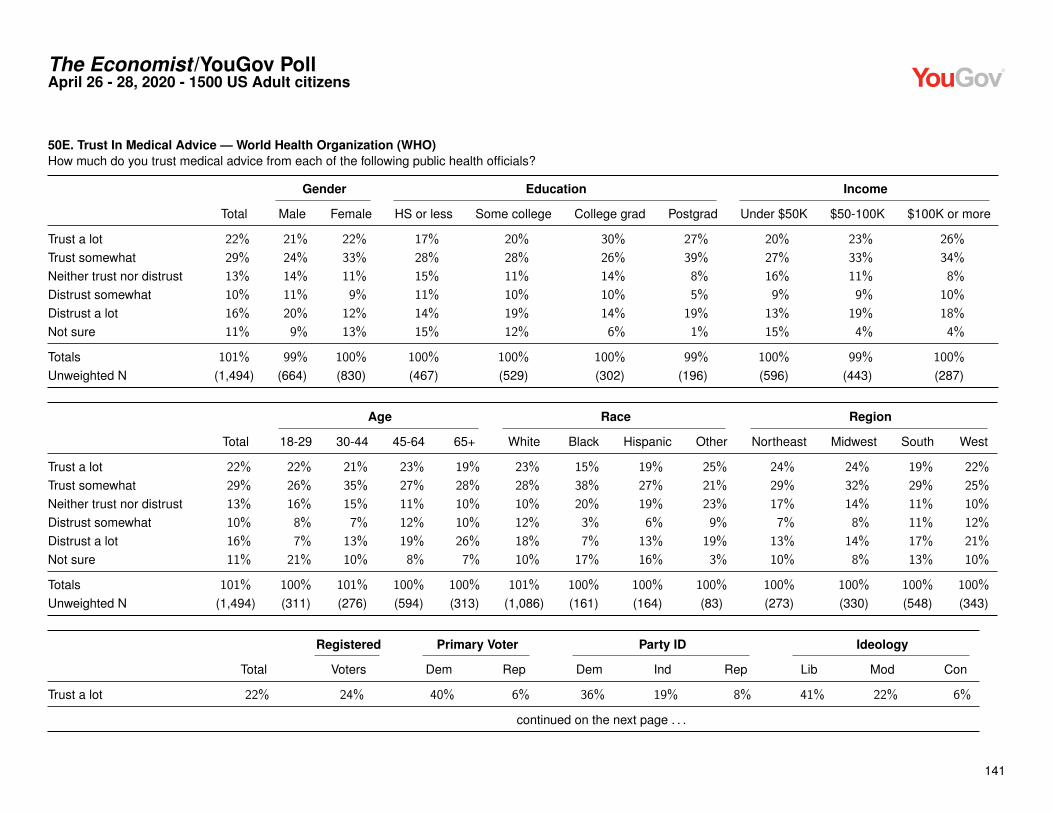
The Economist /YouGov PollApril 26 - 28, 2020 - 1500 US Adult citizens
50E. Trust In Medical Advice — World Health Organization (WHO)How much do you trust medical advice from each of the following public health officials?
Gender Education Income
Total Male Female HS or less Some college College grad Postgrad Under $50K $50-100K $100K or more
Trust a lot 22% 21% 22% 17% 20% 30% 27% 20% 23% 26%
Trust somewhat 29% 24% 33% 28% 28% 26% 39% 27% 33% 34%
Neither trust nor distrust 13% 14% 11% 15% 11% 14% 8% 16% 11% 8%
Distrust somewhat 10% 11% 9% 11% 10% 10% 5% 9% 9% 10%
Distrust a lot 16% 20% 12% 14% 19% 14% 19% 13% 19% 18%
Not sure 11% 9% 13% 15% 12% 6% 1% 15% 4% 4%
Totals 101% 99% 100% 100% 100% 100% 99% 100% 99% 100%
Unweighted N (1,494) (664) (830) (467) (529) (302) (196) (596) (443) (287)
Age Race Region
Total 18-29 30-44 45-64 65+ White Black Hispanic Other Northeast Midwest South West
Trust a lot 22% 22% 21% 23% 19% 23% 15% 19% 25% 24% 24% 19% 22%
Trust somewhat 29% 26% 35% 27% 28% 28% 38% 27% 21% 29% 32% 29% 25%
Neither trust nor distrust 13% 16% 15% 11% 10% 10% 20% 19% 23% 17% 14% 11% 10%
Distrust somewhat 10% 8% 7% 12% 10% 12% 3% 6% 9% 7% 8% 11% 12%
Distrust a lot 16% 7% 13% 19% 26% 18% 7% 13% 19% 13% 14% 17% 21%
Not sure 11% 21% 10% 8% 7% 10% 17% 16% 3% 10% 8% 13% 10%
Totals 101% 100% 101% 100% 100% 101% 100% 100% 100% 100% 100% 100% 100%
Unweighted N (1,494) (311) (276) (594) (313) (1,086) (161) (164) (83) (273) (330) (548) (343)
Registered Primary Voter Party ID Ideology
Total Voters Dem Rep Dem Ind Rep Lib Mod Con
Trust a lot 22% 24% 40% 6% 36% 19% 8% 41% 22% 6%
continued on the next page . . .
141

The Economist /YouGov PollApril 26 - 28, 2020 - 1500 US Adult citizens
continued from previous pageRegistered Primary Voter Party ID Ideology
Total Voters Dem Rep Dem Ind Rep Lib Mod Con
Trust somewhat 29% 29% 38% 18% 38% 26% 22% 35% 34% 20%
Neither trust nor distrust 13% 11% 9% 12% 12% 14% 12% 10% 11% 13%
Distrust somewhat 10% 10% 3% 18% 4% 9% 18% 3% 9% 18%
Distrust a lot 16% 20% 5% 43% 2% 17% 31% 4% 13% 34%
Not sure 11% 6% 4% 4% 8% 15% 9% 6% 11% 8%
Totals 101% 100% 99% 101% 100% 100% 100% 99% 100% 99%
Unweighted N (1,494) (1,220) (564) (336) (536) (579) (379) (448) (450) (457)
142

The Economist /YouGov PollApril 26 - 28, 2020 - 1500 US Adult citizens
50F. Trust In Medical Advice — Centers for Disease Control and Prevention (CDC)How much do you trust medical advice from each of the following public health officials?
Gender Education Income
Total Male Female HS or less Some college College grad Postgrad Under $50K $50-100K $100K or more
Trust a lot 29% 27% 31% 23% 30% 37% 36% 25% 33% 36%
Trust somewhat 39% 41% 37% 39% 36% 40% 46% 36% 45% 41%
Neither trust nor distrust 12% 12% 12% 15% 11% 10% 9% 15% 9% 11%
Distrust somewhat 7% 7% 7% 7% 8% 6% 7% 5% 7% 6%
Distrust a lot 5% 6% 5% 6% 7% 2% 2% 7% 3% 3%
Not sure 8% 7% 9% 12% 8% 5% 1% 10% 3% 2%
Totals 100% 100% 101% 102% 100% 100% 101% 98% 100% 99%
Unweighted N (1,497) (665) (832) (468) (531) (302) (196) (598) (443) (287)
Age Race Region
Total 18-29 30-44 45-64 65+ White Black Hispanic Other Northeast Midwest South West
Trust a lot 29% 30% 27% 30% 28% 31% 30% 22% 22% 27% 32% 30% 27%
Trust somewhat 39% 31% 43% 38% 44% 40% 37% 28% 47% 41% 43% 37% 37%
Neither trust nor distrust 12% 15% 12% 12% 9% 11% 10% 22% 14% 17% 11% 10% 13%
Distrust somewhat 7% 4% 7% 8% 7% 7% 5% 11% 7% 5% 4% 8% 9%
Distrust a lot 5% 4% 5% 5% 7% 5% 5% 4% 7% 3% 5% 5% 8%
Not sure 8% 16% 7% 6% 3% 7% 13% 13% 2% 7% 6% 10% 7%
Totals 100% 100% 101% 99% 98% 101% 100% 100% 99% 100% 101% 100% 101%
Unweighted N (1,497) (312) (278) (594) (313) (1,087) (162) (163) (85) (274) (330) (551) (342)
Registered Primary Voter Party ID Ideology
Total Voters Dem Rep Dem Ind Rep Lib Mod Con
Trust a lot 29% 33% 45% 20% 42% 25% 19% 44% 30% 17%
continued on the next page . . .
143

The Economist /YouGov PollApril 26 - 28, 2020 - 1500 US Adult citizens
continued from previous pageRegistered Primary Voter Party ID Ideology
Total Voters Dem Rep Dem Ind Rep Lib Mod Con
Trust somewhat 39% 41% 41% 40% 39% 36% 44% 39% 42% 40%
Neither trust nor distrust 12% 12% 9% 15% 9% 14% 13% 7% 10% 18%
Distrust somewhat 7% 7% 3% 12% 3% 7% 11% 3% 6% 11%
Distrust a lot 5% 5% 1% 10% 2% 8% 6% 3% 5% 8%
Not sure 8% 3% 1% 3% 5% 10% 8% 4% 6% 7%
Totals 100% 101% 100% 100% 100% 100% 101% 100% 99% 101%
Unweighted N (1,497) (1,220) (564) (336) (536) (582) (379) (448) (450) (457)
144

The Economist /YouGov PollApril 26 - 28, 2020 - 1500 US Adult citizens
51. Coronavirus Made In A LabDo you believe the following statement is true or false? The coronavirus was created in a laboratory.
Gender Education Income
Total Male Female HS or less Some college College grad Postgrad Under $50K $50-100K $100K or more
Definitely true 16% 16% 15% 19% 17% 10% 8% 18% 13% 13%
Probably true 29% 28% 29% 31% 27% 27% 28% 30% 28% 27%
Probably false 18% 19% 18% 12% 17% 27% 30% 15% 22% 25%
Definitely false 17% 16% 18% 13% 14% 22% 26% 13% 20% 23%
Not sure 21% 21% 20% 25% 25% 13% 8% 24% 18% 11%
Totals 101% 100% 100% 100% 100% 99% 100% 100% 101% 99%
Unweighted N (1,488) (665) (823) (465) (529) (300) (194) (593) (442) (287)
Age Race Region
Total 18-29 30-44 45-64 65+ White Black Hispanic Other Northeast Midwest South West
Definitely true 16% 16% 13% 15% 18% 15% 14% 20% 16% 11% 14% 18% 16%
Probably true 29% 25% 28% 31% 30% 29% 29% 28% 25% 30% 30% 30% 23%
Probably false 18% 22% 19% 17% 15% 20% 11% 14% 23% 19% 19% 16% 22%
Definitely false 17% 20% 21% 14% 14% 17% 11% 16% 25% 15% 22% 15% 17%
Not sure 21% 17% 19% 23% 23% 19% 35% 21% 11% 25% 14% 21% 22%
Totals 101% 100% 100% 100% 100% 100% 100% 99% 100% 100% 99% 100% 100%
Unweighted N (1,488) (308) (275) (593) (312) (1,083) (161) (160) (84) (272) (327) (550) (339)
Registered Primary Voter Party ID Ideology
Total Voters Dem Rep Dem Ind Rep Lib Mod Con
Definitely true 16% 16% 7% 33% 11% 12% 26% 8% 14% 26%
Probably true 29% 29% 18% 41% 18% 29% 41% 19% 26% 39%
Probably false 18% 20% 26% 11% 18% 21% 15% 23% 20% 15%
continued on the next page . . .
145

The Economist /YouGov PollApril 26 - 28, 2020 - 1500 US Adult citizens
continued from previous pageRegistered Primary Voter Party ID Ideology
Total Voters Dem Rep Dem Ind Rep Lib Mod Con
Definitely false 17% 18% 31% 4% 31% 13% 5% 35% 15% 5%
Not sure 21% 17% 18% 11% 22% 24% 13% 15% 25% 16%
Totals 101% 100% 100% 100% 100% 99% 100% 100% 100% 101%
Unweighted N (1,488) (1,216) (561) (337) (536) (573) (379) (447) (447) (457)
146

The Economist /YouGov PollApril 26 - 28, 2020 - 1500 US Adult citizens
52A. Heard Of Treatments — Ingesting or injecting disinfectantHow much have you heard about the following treatments or protocols for treating or preventing the spread of the virus that causes COVID-19?
Gender Education Income
Total Male Female HS or less Some college College grad Postgrad Under $50K $50-100K $100K or more
A lot 32% 29% 35% 25% 31% 41% 44% 25% 36% 39%
A little 39% 40% 39% 41% 40% 37% 37% 44% 41% 33%
Nothing at all 28% 31% 26% 34% 29% 22% 18% 32% 23% 28%
Totals 99% 100% 100% 100% 100% 100% 99% 101% 100% 100%
Unweighted N (1,500) (667) (833) (471) (531) (302) (196) (600) (443) (287)
Age Race Region
Total 18-29 30-44 45-64 65+ White Black Hispanic Other Northeast Midwest South West
A lot 32% 31% 26% 36% 34% 31% 33% 37% 37% 34% 35% 30% 33%
A little 39% 42% 47% 37% 33% 39% 37% 42% 45% 34% 40% 41% 40%
Nothing at all 28% 27% 27% 27% 33% 30% 31% 21% 18% 33% 25% 29% 26%
Totals 99% 100% 100% 100% 100% 100% 101% 100% 100% 101% 100% 100% 99%
Unweighted N (1,500) (313) (280) (594) (313) (1,088) (162) (165) (85) (275) (330) (552) (343)
Registered Primary Voter Party ID Ideology
Total Voters Dem Rep Dem Ind Rep Lib Mod Con
A lot 32% 38% 54% 20% 50% 29% 16% 50% 34% 16%
A little 39% 37% 33% 42% 32% 43% 43% 37% 36% 44%
Nothing at all 28% 25% 13% 38% 18% 28% 42% 12% 30% 39%
Totals 99% 100% 100% 100% 100% 100% 101% 99% 100% 99%
Unweighted N (1,500) (1,222) (564) (337) (536) (584) (380) (449) (451) (457)
147

The Economist /YouGov PollApril 26 - 28, 2020 - 1500 US Adult citizens
52B. Heard Of Treatments — Hydroxychloroquine (an anti-parasite and immunosuppressive drug used to treat malaria and some autoimmunediseases)How much have you heard about the following treatments or protocols for treating or preventing the spread of the virus that causes COVID-19?
Gender Education Income
Total Male Female HS or less Some college College grad Postgrad Under $50K $50-100K $100K or more
A lot 44% 44% 44% 31% 46% 53% 63% 33% 51% 60%
A little 36% 36% 36% 38% 37% 32% 34% 38% 37% 33%
Nothing at all 20% 20% 21% 31% 17% 15% 3% 29% 12% 8%
Totals 100% 100% 101% 100% 100% 100% 100% 100% 100% 101%
Unweighted N (1,500) (667) (833) (471) (531) (302) (196) (600) (443) (287)
Age Race Region
Total 18-29 30-44 45-64 65+ White Black Hispanic Other Northeast Midwest South West
A lot 44% 32% 36% 47% 59% 47% 32% 37% 47% 41% 42% 45% 46%
A little 36% 34% 42% 38% 28% 38% 23% 38% 37% 31% 39% 35% 40%
Nothing at all 20% 34% 22% 14% 14% 16% 45% 25% 15% 28% 19% 20% 15%
Totals 100% 100% 100% 99% 101% 101% 100% 100% 99% 100% 100% 100% 101%
Unweighted N (1,500) (313) (280) (594) (313) (1,088) (162) (165) (85) (275) (330) (552) (343)
Registered Primary Voter Party ID Ideology
Total Voters Dem Rep Dem Ind Rep Lib Mod Con
A lot 44% 55% 59% 55% 50% 38% 45% 50% 44% 44%
A little 36% 32% 26% 35% 29% 38% 41% 33% 35% 40%
Nothing at all 20% 14% 14% 10% 21% 24% 14% 18% 21% 16%
Totals 100% 101% 99% 100% 100% 100% 100% 101% 100% 100%
Unweighted N (1,500) (1,222) (564) (337) (536) (584) (380) (449) (451) (457)
148

The Economist /YouGov PollApril 26 - 28, 2020 - 1500 US Adult citizens
52C. Heard Of Treatments — UV-light exposureHow much have you heard about the following treatments or protocols for treating or preventing the spread of the virus that causes COVID-19?
Gender Education Income
Total Male Female HS or less Some college College grad Postgrad Under $50K $50-100K $100K or more
A lot 24% 23% 25% 17% 23% 31% 39% 17% 27% 35%
A little 45% 46% 43% 41% 47% 47% 48% 40% 53% 46%
Nothing at all 31% 31% 32% 42% 30% 23% 13% 43% 20% 19%
Totals 100% 100% 100% 100% 100% 101% 100% 100% 100% 100%
Unweighted N (1,500) (667) (833) (471) (531) (302) (196) (600) (443) (287)
Age Race Region
Total 18-29 30-44 45-64 65+ White Black Hispanic Other Northeast Midwest South West
A lot 24% 19% 20% 28% 28% 25% 19% 22% 32% 22% 24% 21% 31%
A little 45% 35% 46% 48% 48% 48% 27% 47% 43% 36% 41% 49% 49%
Nothing at all 31% 46% 34% 25% 24% 28% 53% 31% 26% 42% 35% 30% 20%
Totals 100% 100% 100% 101% 100% 101% 99% 100% 101% 100% 100% 100% 100%
Unweighted N (1,500) (313) (280) (594) (313) (1,088) (162) (165) (85) (275) (330) (552) (343)
Registered Primary Voter Party ID Ideology
Total Voters Dem Rep Dem Ind Rep Lib Mod Con
A lot 24% 29% 37% 27% 33% 19% 19% 34% 24% 20%
A little 45% 47% 41% 52% 37% 46% 52% 38% 45% 52%
Nothing at all 31% 23% 22% 21% 30% 34% 29% 28% 32% 28%
Totals 100% 99% 100% 100% 100% 99% 100% 100% 101% 100%
Unweighted N (1,500) (1,222) (564) (337) (536) (584) (380) (449) (451) (457)
149

The Economist /YouGov PollApril 26 - 28, 2020 - 1500 US Adult citizens
52D. Heard Of Treatments — Remdesivir (an antiviral drug not currently approved for any use)How much have you heard about the following treatments or protocols for treating or preventing the spread of the virus that causes COVID-19?
Gender Education Income
Total Male Female HS or less Some college College grad Postgrad Under $50K $50-100K $100K or more
A lot 13% 14% 12% 11% 11% 16% 23% 11% 13% 19%
A little 28% 28% 28% 24% 27% 35% 34% 23% 33% 36%
Nothing at all 59% 58% 59% 65% 62% 49% 43% 66% 54% 45%
Totals 100% 100% 99% 100% 100% 100% 100% 100% 100% 100%
Unweighted N (1,500) (667) (833) (471) (531) (302) (196) (600) (443) (287)
Age Race Region
Total 18-29 30-44 45-64 65+ White Black Hispanic Other Northeast Midwest South West
A lot 13% 11% 14% 13% 13% 12% 14% 16% 24% 9% 11% 15% 15%
A little 28% 25% 27% 29% 31% 30% 20% 31% 19% 31% 30% 24% 30%
Nothing at all 59% 64% 59% 58% 56% 59% 66% 52% 57% 60% 58% 61% 55%
Totals 100% 100% 100% 100% 100% 101% 100% 99% 100% 100% 99% 100% 100%
Unweighted N (1,500) (313) (280) (594) (313) (1,088) (162) (165) (85) (275) (330) (552) (343)
Registered Primary Voter Party ID Ideology
Total Voters Dem Rep Dem Ind Rep Lib Mod Con
A lot 13% 15% 19% 14% 16% 12% 11% 16% 13% 11%
A little 28% 31% 30% 30% 27% 28% 29% 29% 27% 33%
Nothing at all 59% 54% 51% 55% 58% 59% 60% 55% 60% 56%
Totals 100% 100% 100% 99% 101% 99% 100% 100% 100% 100%
Unweighted N (1,500) (1,222) (564) (337) (536) (584) (380) (449) (451) (457)
150

The Economist /YouGov PollApril 26 - 28, 2020 - 1500 US Adult citizens
52E. Heard Of Treatments — Azithromycin (an antibiotic used to treat bacterial infections)How much have you heard about the following treatments or protocols for treating or preventing the spread of the virus that causes COVID-19?
Gender Education Income
Total Male Female HS or less Some college College grad Postgrad Under $50K $50-100K $100K or more
A lot 16% 14% 18% 14% 14% 19% 25% 14% 16% 24%
A little 31% 29% 33% 25% 33% 36% 36% 27% 36% 36%
Nothing at all 53% 57% 49% 61% 53% 45% 39% 58% 48% 40%
Totals 100% 100% 100% 100% 100% 100% 100% 99% 100% 100%
Unweighted N (1,500) (667) (833) (471) (531) (302) (196) (600) (443) (287)
Age Race Region
Total 18-29 30-44 45-64 65+ White Black Hispanic Other Northeast Midwest South West
A lot 16% 10% 16% 18% 19% 16% 13% 22% 17% 14% 13% 17% 20%
A little 31% 26% 33% 33% 29% 33% 25% 24% 37% 26% 29% 32% 35%
Nothing at all 53% 64% 51% 48% 51% 51% 62% 54% 46% 60% 58% 51% 45%
Totals 100% 100% 100% 99% 99% 100% 100% 100% 100% 100% 100% 100% 100%
Unweighted N (1,500) (313) (280) (594) (313) (1,088) (162) (165) (85) (275) (330) (552) (343)
Registered Primary Voter Party ID Ideology
Total Voters Dem Rep Dem Ind Rep Lib Mod Con
A lot 16% 19% 20% 23% 19% 13% 19% 15% 15% 20%
A little 31% 36% 36% 38% 31% 30% 32% 34% 29% 35%
Nothing at all 53% 45% 44% 40% 50% 58% 49% 50% 56% 45%
Totals 100% 100% 100% 101% 100% 101% 100% 99% 100% 100%
Unweighted N (1,500) (1,222) (564) (337) (536) (584) (380) (449) (451) (457)
151

The Economist /YouGov PollApril 26 - 28, 2020 - 1500 US Adult citizens
52F. Heard Of Treatments — Kaletra (an antiretroviral drug used to treat HIV)How much have you heard about the following treatments or protocols for treating or preventing the spread of the virus that causes COVID-19?
Gender Education Income
Total Male Female HS or less Some college College grad Postgrad Under $50K $50-100K $100K or more
A lot 6% 7% 4% 7% 3% 6% 6% 6% 5% 7%
A little 24% 25% 23% 21% 24% 28% 23% 25% 21% 30%
Nothing at all 71% 68% 73% 72% 72% 66% 72% 69% 74% 63%
Totals 101% 100% 100% 100% 99% 100% 101% 100% 100% 100%
Unweighted N (1,500) (667) (833) (471) (531) (302) (196) (600) (443) (287)
Age Race Region
Total 18-29 30-44 45-64 65+ White Black Hispanic Other Northeast Midwest South West
A lot 6% 8% 6% 4% 5% 4% 8% 9% 9% 7% 4% 6% 6%
A little 24% 26% 22% 23% 23% 21% 24% 29% 41% 23% 25% 22% 26%
Nothing at all 71% 66% 72% 72% 72% 74% 68% 62% 50% 70% 71% 72% 69%
Totals 101% 100% 100% 99% 100% 99% 100% 100% 100% 100% 100% 100% 101%
Unweighted N (1,500) (313) (280) (594) (313) (1,088) (162) (165) (85) (275) (330) (552) (343)
Registered Primary Voter Party ID Ideology
Total Voters Dem Rep Dem Ind Rep Lib Mod Con
A lot 6% 5% 7% 6% 6% 6% 5% 7% 6% 4%
A little 24% 24% 22% 24% 24% 24% 22% 28% 22% 25%
Nothing at all 71% 71% 71% 71% 69% 71% 73% 64% 73% 71%
Totals 101% 100% 100% 101% 99% 101% 100% 99% 101% 100%
Unweighted N (1,500) (1,222) (564) (337) (536) (584) (380) (449) (451) (457)
152

The Economist /YouGov PollApril 26 - 28, 2020 - 1500 US Adult citizens
52G. Heard Of Treatments — Actemra (an immunosuppressive drug used to treat rheumatoid arthritis)How much have you heard about the following treatments or protocols for treating or preventing the spread of the virus that causes COVID-19?
Gender Education Income
Total Male Female HS or less Some college College grad Postgrad Under $50K $50-100K $100K or more
A lot 7% 9% 5% 8% 4% 9% 8% 7% 6% 14%
A little 21% 21% 21% 19% 21% 21% 26% 19% 21% 26%
Nothing at all 72% 70% 73% 72% 74% 70% 66% 75% 73% 60%
Totals 100% 100% 99% 99% 99% 100% 100% 101% 100% 100%
Unweighted N (1,500) (667) (833) (471) (531) (302) (196) (600) (443) (287)
Age Race Region
Total 18-29 30-44 45-64 65+ White Black Hispanic Other Northeast Midwest South West
A lot 7% 10% 7% 6% 6% 7% 9% 10% 3% 11% 4% 8% 6%
A little 21% 18% 24% 20% 24% 20% 17% 29% 23% 21% 21% 21% 21%
Nothing at all 72% 73% 69% 74% 71% 73% 74% 61% 74% 68% 75% 71% 73%
Totals 100% 101% 100% 100% 101% 100% 100% 100% 100% 100% 100% 100% 100%
Unweighted N (1,500) (313) (280) (594) (313) (1,088) (162) (165) (85) (275) (330) (552) (343)
Registered Primary Voter Party ID Ideology
Total Voters Dem Rep Dem Ind Rep Lib Mod Con
A lot 7% 7% 10% 6% 9% 5% 7% 8% 9% 5%
A little 21% 23% 20% 24% 21% 21% 22% 21% 19% 23%
Nothing at all 72% 69% 70% 70% 70% 74% 71% 71% 72% 72%
Totals 100% 99% 100% 100% 100% 100% 100% 100% 100% 100%
Unweighted N (1,500) (1,222) (564) (337) (536) (584) (380) (449) (451) (457)
153

The Economist /YouGov PollApril 26 - 28, 2020 - 1500 US Adult citizens
52H. Heard Of Treatments — Social distancingHow much have you heard about the following treatments or protocols for treating or preventing the spread of the virus that causes COVID-19?
Gender Education Income
Total Male Female HS or less Some college College grad Postgrad Under $50K $50-100K $100K or more
A lot 89% 88% 90% 85% 90% 95% 93% 84% 95% 92%
A little 7% 7% 7% 9% 7% 5% 6% 10% 4% 7%
Nothing at all 4% 5% 3% 7% 3% 0% 1% 6% 1% 1%
Totals 100% 100% 100% 101% 100% 100% 100% 100% 100% 100%
Unweighted N (1,500) (667) (833) (471) (531) (302) (196) (600) (443) (287)
Age Race Region
Total 18-29 30-44 45-64 65+ White Black Hispanic Other Northeast Midwest South West
A lot 89% 84% 87% 90% 95% 91% 83% 81% 95% 87% 92% 89% 88%
A little 7% 8% 8% 8% 4% 6% 10% 12% 4% 8% 4% 7% 9%
Nothing at all 4% 7% 5% 3% 2% 3% 8% 7% 1% 5% 4% 4% 4%
Totals 100% 99% 100% 101% 101% 100% 101% 100% 100% 100% 100% 100% 101%
Unweighted N (1,500) (313) (280) (594) (313) (1,088) (162) (165) (85) (275) (330) (552) (343)
Registered Primary Voter Party ID Ideology
Total Voters Dem Rep Dem Ind Rep Lib Mod Con
A lot 89% 92% 95% 91% 92% 86% 91% 93% 91% 88%
A little 7% 6% 4% 8% 6% 9% 5% 6% 6% 7%
Nothing at all 4% 2% 1% 2% 3% 5% 4% 1% 3% 6%
Totals 100% 100% 100% 101% 101% 100% 100% 100% 100% 101%
Unweighted N (1,500) (1,222) (564) (337) (536) (584) (380) (449) (451) (457)
154

The Economist /YouGov PollApril 26 - 28, 2020 - 1500 US Adult citizens
53A. Effectiveness Of Coronavirus Treatments — Ingesting or injecting disinfectantHow effective at treating coronavirus do you believe each of the following treatments are?
Gender Education Income
Total Male Female HS or less Some college College grad Postgrad Under $50K $50-100K $100K or more
Very effective 1% 1% 1% 1% 1% 3% 2% 1% 2% 2%
Possibly effective 4% 5% 4% 5% 4% 3% 2% 4% 4% 5%
Ineffective, but notdangerous 2% 2% 2% 4% 1% 1% 1% 4% 1% 0%
Dangerous 58% 55% 62% 50% 58% 67% 74% 53% 67% 62%
Not sure 6% 7% 5% 7% 7% 5% 4% 7% 4% 3%
Not heard of 28% 31% 26% 34% 29% 22% 18% 32% 23% 28%
Totals 99% 101% 100% 101% 100% 101% 101% 101% 101% 100%
Unweighted N (1,498) (665) (833) (470) (531) (301) (196) (599) (442) (287)
Age Race Region
Total 18-29 30-44 45-64 65+ White Black Hispanic Other Northeast Midwest South West
Very effective 1% 2% 3% 1% 0% 1% 2% 3% 2% 1% 1% 1% 2%
Possibly effective 4% 5% 7% 4% 1% 3% 6% 5% 10% 3% 4% 4% 5%
Ineffective, but notdangerous 2% 4% 2% 1% 0% 1% 2% 6% 3% 2% 0% 2% 4%
Dangerous 58% 51% 56% 63% 62% 60% 55% 47% 65% 53% 66% 59% 55%
Not sure 6% 11% 5% 5% 4% 5% 3% 17% 4% 8% 4% 5% 8%
Not heard of 28% 27% 27% 27% 33% 30% 31% 21% 18% 33% 25% 29% 27%
Totals 99% 100% 100% 101% 100% 100% 99% 99% 102% 100% 100% 100% 101%
Unweighted N (1,498) (313) (279) (594) (312) (1,087) (162) (164) (85) (274) (330) (552) (342)
155

The Economist /YouGov PollApril 26 - 28, 2020 - 1500 US Adult citizens
Registered Primary Voter Party ID Ideology
Total Voters Dem Rep Dem Ind Rep Lib Mod Con
Very effective 1% 2% 2% 1% 2% 1% 1% 2% 1% 1%
Possibly effective 4% 4% 3% 6% 3% 3% 6% 4% 4% 4%
Ineffective, but notdangerous 2% 1% 1% 1% 1% 3% 2% 1% 2% 3%
Dangerous 58% 64% 79% 48% 71% 58% 43% 76% 58% 45%
Not sure 6% 4% 2% 6% 4% 7% 7% 5% 4% 7%
Not heard of 28% 25% 14% 38% 18% 28% 42% 12% 30% 39%
Totals 99% 100% 101% 100% 99% 100% 101% 100% 99% 99%
Unweighted N (1,498) (1,220) (562) (337) (535) (583) (380) (448) (450) (457)
156

The Economist /YouGov PollApril 26 - 28, 2020 - 1500 US Adult citizens
53B. Effectiveness Of Coronavirus Treatments — Hydroxychloroquine (an anti-parasite and immunosuppressive drug used to treat malaria andsome autoimmune diseases)How effective at treating coronavirus do you believe each of the following treatments are?
Gender Education Income
Total Male Female HS or less Some college College grad Postgrad Under $50K $50-100K $100K or more
Very effective 6% 7% 5% 5% 7% 6% 6% 5% 4% 10%
Possibly effective 27% 25% 28% 28% 22% 31% 30% 22% 35% 29%
Ineffective, but notdangerous 7% 9% 5% 5% 8% 9% 11% 8% 7% 9%
Dangerous 23% 22% 24% 14% 24% 29% 37% 20% 24% 31%
Not sure 17% 17% 17% 16% 22% 11% 14% 17% 17% 15%
Not heard of 20% 20% 21% 31% 17% 15% 3% 29% 12% 8%
Totals 100% 100% 100% 99% 100% 101% 101% 101% 99% 102%
Unweighted N (1,500) (667) (833) (471) (531) (302) (196) (600) (443) (287)
Age Race Region
Total 18-29 30-44 45-64 65+ White Black Hispanic Other Northeast Midwest South West
Very effective 6% 4% 4% 7% 9% 7% 2% 7% 5% 4% 7% 5% 9%
Possibly effective 27% 19% 26% 31% 28% 30% 11% 27% 24% 26% 25% 26% 30%
Ineffective, but notdangerous 7% 11% 8% 5% 7% 6% 11% 6% 14% 4% 8% 8% 7%
Dangerous 23% 16% 20% 26% 28% 24% 20% 15% 31% 20% 24% 23% 24%
Not sure 17% 16% 20% 16% 14% 18% 11% 20% 11% 18% 18% 17% 15%
Not heard of 20% 34% 22% 14% 14% 16% 45% 25% 15% 28% 19% 20% 15%
Totals 100% 100% 100% 99% 100% 101% 100% 100% 100% 100% 101% 99% 100%
Unweighted N (1,500) (313) (280) (594) (313) (1,088) (162) (165) (85) (275) (330) (552) (343)
157

The Economist /YouGov PollApril 26 - 28, 2020 - 1500 US Adult citizens
Registered Primary Voter Party ID Ideology
Total Voters Dem Rep Dem Ind Rep Lib Mod Con
Very effective 6% 8% 2% 15% 2% 5% 12% 2% 3% 13%
Possibly effective 27% 30% 15% 51% 16% 25% 43% 14% 25% 41%
Ineffective, but notdangerous 7% 8% 9% 6% 8% 7% 7% 8% 8% 8%
Dangerous 23% 27% 48% 4% 41% 18% 7% 46% 24% 6%
Not sure 17% 14% 11% 14% 13% 20% 18% 12% 19% 16%
Not heard of 20% 14% 14% 10% 21% 24% 14% 18% 21% 16%
Totals 100% 101% 99% 100% 101% 99% 101% 100% 100% 100%
Unweighted N (1,500) (1,222) (564) (337) (536) (584) (380) (449) (451) (457)
158

The Economist /YouGov PollApril 26 - 28, 2020 - 1500 US Adult citizens
53C. Effectiveness Of Coronavirus Treatments — UV-light exposureHow effective at treating coronavirus do you believe each of the following treatments are?
Gender Education Income
Total Male Female HS or less Some college College grad Postgrad Under $50K $50-100K $100K or more
Very effective 7% 8% 6% 7% 7% 6% 10% 6% 8% 8%
Possibly effective 21% 21% 22% 18% 24% 21% 25% 17% 29% 25%
Ineffective, but notdangerous 15% 16% 14% 11% 14% 22% 22% 12% 16% 22%
Dangerous 11% 11% 12% 7% 10% 17% 19% 8% 13% 16%
Not sure 14% 13% 14% 15% 14% 12% 10% 14% 13% 10%
Not heard of 31% 31% 32% 42% 30% 23% 13% 43% 20% 19%
Totals 99% 100% 100% 100% 99% 101% 99% 100% 99% 100%
Unweighted N (1,499) (667) (832) (471) (530) (302) (196) (599) (443) (287)
Age Race Region
Total 18-29 30-44 45-64 65+ White Black Hispanic Other Northeast Midwest South West
Very effective 7% 6% 6% 9% 7% 7% 2% 13% 8% 4% 5% 7% 11%
Possibly effective 21% 13% 20% 25% 26% 24% 9% 17% 21% 15% 23% 21% 27%
Ineffective, but notdangerous 15% 12% 15% 18% 13% 16% 11% 12% 21% 16% 15% 15% 14%
Dangerous 11% 11% 12% 11% 13% 11% 13% 12% 12% 10% 10% 12% 13%
Not sure 14% 11% 13% 13% 17% 14% 12% 13% 13% 11% 12% 16% 14%
Not heard of 31% 47% 34% 25% 24% 28% 53% 32% 26% 42% 35% 30% 21%
Totals 99% 100% 100% 101% 100% 100% 100% 99% 101% 98% 100% 101% 100%
Unweighted N (1,499) (312) (280) (594) (313) (1,088) (162) (164) (85) (275) (330) (552) (342)
159

The Economist /YouGov PollApril 26 - 28, 2020 - 1500 US Adult citizens
Registered Primary Voter Party ID Ideology
Total Voters Dem Rep Dem Ind Rep Lib Mod Con
Very effective 7% 8% 4% 16% 4% 6% 12% 3% 4% 13%
Possibly effective 21% 24% 13% 40% 11% 21% 35% 12% 21% 35%
Ineffective, but notdangerous 15% 18% 24% 9% 20% 16% 8% 24% 14% 9%
Dangerous 11% 14% 25% 2% 23% 8% 2% 21% 14% 2%
Not sure 14% 13% 12% 12% 12% 15% 14% 12% 14% 12%
Not heard of 31% 23% 22% 21% 30% 34% 29% 28% 32% 28%
Totals 99% 100% 100% 100% 100% 100% 100% 100% 99% 99%
Unweighted N (1,499) (1,222) (564) (337) (535) (584) (380) (449) (450) (457)
160

The Economist /YouGov PollApril 26 - 28, 2020 - 1500 US Adult citizens
53D. Effectiveness Of Coronavirus Treatments — Remdesivir (an antiviral drug not currently approved for any use)How effective at treating coronavirus do you believe each of the following treatments are?
Gender Education Income
Total Male Female HS or less Some college College grad Postgrad Under $50K $50-100K $100K or more
Very effective 2% 1% 2% 1% 2% 1% 3% 2% 2% 1%
Possibly effective 16% 15% 17% 13% 14% 23% 19% 11% 22% 21%
Ineffective, but notdangerous 4% 5% 4% 3% 2% 6% 10% 3% 4% 8%
Dangerous 4% 4% 4% 5% 4% 4% 6% 5% 4% 4%
Not sure 15% 16% 14% 12% 16% 17% 20% 12% 15% 20%
Not heard of 59% 58% 59% 65% 62% 49% 43% 66% 54% 45%
Totals 100% 99% 100% 99% 100% 100% 101% 99% 101% 99%
Unweighted N (1,500) (667) (833) (471) (531) (302) (196) (600) (443) (287)
Age Race Region
Total 18-29 30-44 45-64 65+ White Black Hispanic Other Northeast Midwest South West
Very effective 2% 2% 2% 1% 1% 1% 3% 1% 3% 2% 1% 2% 1%
Possibly effective 16% 12% 18% 17% 15% 17% 8% 16% 23% 15% 18% 13% 20%
Ineffective, but notdangerous 4% 7% 3% 4% 3% 3% 5% 7% 5% 4% 5% 3% 5%
Dangerous 4% 3% 6% 4% 5% 4% 6% 4% 0% 2% 3% 5% 6%
Not sure 15% 13% 12% 16% 20% 15% 12% 20% 11% 17% 14% 16% 12%
Not heard of 59% 64% 59% 58% 56% 59% 66% 52% 57% 60% 58% 61% 55%
Totals 100% 101% 100% 100% 100% 99% 100% 100% 99% 100% 99% 100% 99%
Unweighted N (1,500) (313) (280) (594) (313) (1,088) (162) (165) (85) (275) (330) (552) (343)
161

The Economist /YouGov PollApril 26 - 28, 2020 - 1500 US Adult citizens
Registered Primary Voter Party ID Ideology
Total Voters Dem Rep Dem Ind Rep Lib Mod Con
Very effective 2% 2% 2% 3% 2% 1% 2% 1% 1% 2%
Possibly effective 16% 19% 18% 23% 14% 14% 21% 14% 16% 20%
Ineffective, but notdangerous 4% 4% 5% 4% 3% 6% 3% 6% 5% 2%
Dangerous 4% 5% 8% 2% 7% 4% 1% 7% 5% 1%
Not sure 15% 16% 17% 13% 17% 15% 13% 17% 13% 18%
Not heard of 59% 54% 51% 55% 58% 59% 60% 55% 60% 56%
Totals 100% 100% 101% 100% 101% 99% 100% 100% 100% 99%
Unweighted N (1,500) (1,222) (564) (337) (536) (584) (380) (449) (451) (457)
162

The Economist /YouGov PollApril 26 - 28, 2020 - 1500 US Adult citizens
53E. Effectiveness Of Coronavirus Treatments — Azithromycin (an antibiotic used to treat bacterial infections)How effective at treating coronavirus do you believe each of the following treatments are?
Gender Education Income
Total Male Female HS or less Some college College grad Postgrad Under $50K $50-100K $100K or more
Very effective 4% 4% 4% 3% 5% 3% 4% 4% 4% 6%
Possibly effective 18% 15% 20% 18% 18% 18% 15% 16% 21% 18%
Ineffective, but notdangerous 11% 11% 10% 6% 8% 18% 20% 8% 13% 17%
Dangerous 3% 2% 4% 2% 3% 5% 6% 2% 4% 4%
Not sure 12% 11% 12% 10% 14% 11% 16% 12% 9% 15%
Not heard of 53% 57% 49% 61% 53% 45% 39% 58% 48% 40%
Totals 101% 100% 99% 100% 101% 100% 100% 100% 99% 100%
Unweighted N (1,499) (666) (833) (471) (530) (302) (196) (600) (443) (286)
Age Race Region
Total 18-29 30-44 45-64 65+ White Black Hispanic Other Northeast Midwest South West
Very effective 4% 3% 4% 5% 3% 4% 2% 3% 9% 3% 4% 3% 6%
Possibly effective 18% 11% 20% 20% 18% 19% 11% 18% 19% 16% 17% 18% 20%
Ineffective, but notdangerous 11% 9% 13% 11% 9% 11% 8% 7% 12% 11% 6% 10% 15%
Dangerous 3% 3% 3% 3% 5% 3% 4% 5% 2% 1% 3% 4% 4%
Not sure 12% 11% 9% 14% 13% 12% 13% 13% 12% 10% 12% 14% 10%
Not heard of 53% 64% 51% 48% 51% 51% 62% 54% 46% 60% 58% 51% 45%
Totals 101% 101% 100% 101% 99% 100% 100% 100% 100% 101% 100% 100% 100%
Unweighted N (1,499) (313) (280) (593) (313) (1,088) (162) (164) (85) (275) (329) (552) (343)
163

The Economist /YouGov PollApril 26 - 28, 2020 - 1500 US Adult citizens
Registered Primary Voter Party ID Ideology
Total Voters Dem Rep Dem Ind Rep Lib Mod Con
Very effective 4% 5% 2% 8% 2% 3% 7% 2% 4% 7%
Possibly effective 18% 20% 14% 29% 13% 17% 25% 11% 15% 27%
Ineffective, but notdangerous 11% 13% 17% 12% 13% 10% 9% 17% 11% 7%
Dangerous 3% 4% 7% 1% 7% 2% 1% 7% 3% 1%
Not sure 12% 13% 15% 11% 15% 11% 9% 13% 12% 13%
Not heard of 53% 45% 44% 40% 50% 58% 49% 50% 56% 45%
Totals 101% 100% 99% 101% 100% 101% 100% 100% 101% 100%
Unweighted N (1,499) (1,221) (564) (336) (536) (584) (379) (449) (451) (456)
164

The Economist /YouGov PollApril 26 - 28, 2020 - 1500 US Adult citizens
53F. Effectiveness Of Coronavirus Treatments — Kaletra (an antiretroviral drug used to treat HIV)How effective at treating coronavirus do you believe each of the following treatments are?
Gender Education Income
Total Male Female HS or less Some college College grad Postgrad Under $50K $50-100K $100K or more
Very effective 1% 1% 1% 2% 1% 1% 2% 2% 1% 1%
Possibly effective 9% 10% 8% 9% 7% 14% 6% 7% 9% 16%
Ineffective, but notdangerous 3% 4% 3% 3% 5% 2% 4% 4% 3% 4%
Dangerous 3% 3% 3% 3% 3% 3% 3% 4% 2% 2%
Not sure 13% 13% 12% 12% 12% 14% 13% 13% 11% 14%
Not heard of 71% 68% 73% 72% 72% 66% 72% 70% 74% 63%
Totals 100% 99% 100% 101% 100% 100% 100% 100% 100% 100%
Unweighted N (1,499) (667) (832) (470) (531) (302) (196) (599) (443) (287)
Age Race Region
Total 18-29 30-44 45-64 65+ White Black Hispanic Other Northeast Midwest South West
Very effective 1% 1% 3% 1% 0% 1% 2% 4% 1% 1% 1% 1% 2%
Possibly effective 9% 8% 12% 7% 8% 8% 10% 8% 18% 9% 8% 9% 9%
Ineffective, but notdangerous 3% 3% 4% 3% 4% 3% 3% 6% 2% 6% 3% 3% 3%
Dangerous 3% 4% 1% 3% 3% 3% 3% 3% 5% 2% 1% 4% 4%
Not sure 13% 17% 8% 13% 13% 11% 14% 17% 24% 13% 15% 11% 12%
Not heard of 71% 66% 72% 72% 72% 74% 68% 62% 50% 70% 71% 72% 69%
Totals 100% 99% 100% 99% 100% 100% 100% 100% 100% 101% 99% 100% 99%
Unweighted N (1,499) (313) (279) (594) (313) (1,088) (162) (164) (85) (275) (330) (551) (343)
165

The Economist /YouGov PollApril 26 - 28, 2020 - 1500 US Adult citizens
Registered Primary Voter Party ID Ideology
Total Voters Dem Rep Dem Ind Rep Lib Mod Con
Very effective 1% 1% 2% 2% 2% 1% 2% 1% 1% 2%
Possibly effective 9% 9% 8% 12% 7% 9% 10% 8% 8% 10%
Ineffective, but notdangerous 3% 4% 5% 4% 4% 3% 3% 5% 3% 3%
Dangerous 3% 3% 3% 1% 4% 3% 2% 5% 3% 1%
Not sure 13% 12% 11% 11% 14% 13% 10% 17% 11% 12%
Not heard of 71% 71% 71% 71% 69% 71% 73% 64% 73% 71%
Totals 100% 100% 100% 101% 100% 100% 100% 100% 99% 99%
Unweighted N (1,499) (1,221) (564) (337) (536) (583) (380) (449) (451) (456)
166
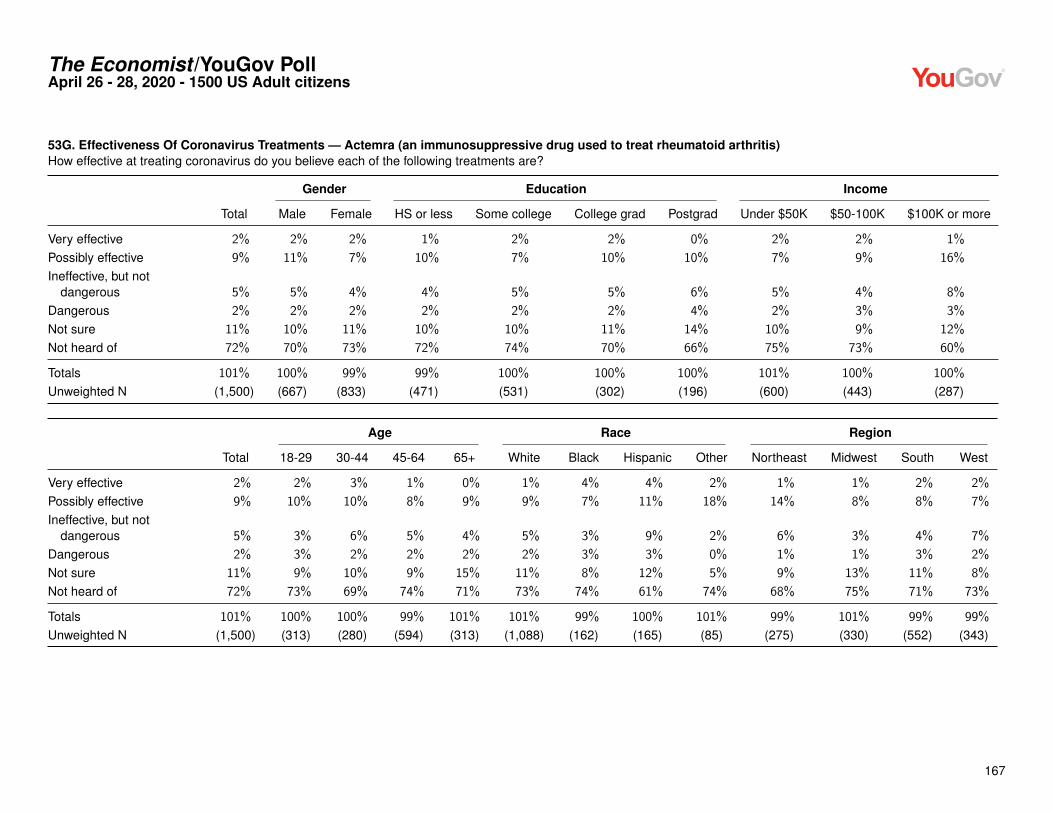
The Economist /YouGov PollApril 26 - 28, 2020 - 1500 US Adult citizens
53G. Effectiveness Of Coronavirus Treatments — Actemra (an immunosuppressive drug used to treat rheumatoid arthritis)How effective at treating coronavirus do you believe each of the following treatments are?
Gender Education Income
Total Male Female HS or less Some college College grad Postgrad Under $50K $50-100K $100K or more
Very effective 2% 2% 2% 1% 2% 2% 0% 2% 2% 1%
Possibly effective 9% 11% 7% 10% 7% 10% 10% 7% 9% 16%
Ineffective, but notdangerous 5% 5% 4% 4% 5% 5% 6% 5% 4% 8%
Dangerous 2% 2% 2% 2% 2% 2% 4% 2% 3% 3%
Not sure 11% 10% 11% 10% 10% 11% 14% 10% 9% 12%
Not heard of 72% 70% 73% 72% 74% 70% 66% 75% 73% 60%
Totals 101% 100% 99% 99% 100% 100% 100% 101% 100% 100%
Unweighted N (1,500) (667) (833) (471) (531) (302) (196) (600) (443) (287)
Age Race Region
Total 18-29 30-44 45-64 65+ White Black Hispanic Other Northeast Midwest South West
Very effective 2% 2% 3% 1% 0% 1% 4% 4% 2% 1% 1% 2% 2%
Possibly effective 9% 10% 10% 8% 9% 9% 7% 11% 18% 14% 8% 8% 7%
Ineffective, but notdangerous 5% 3% 6% 5% 4% 5% 3% 9% 2% 6% 3% 4% 7%
Dangerous 2% 3% 2% 2% 2% 2% 3% 3% 0% 1% 1% 3% 2%
Not sure 11% 9% 10% 9% 15% 11% 8% 12% 5% 9% 13% 11% 8%
Not heard of 72% 73% 69% 74% 71% 73% 74% 61% 74% 68% 75% 71% 73%
Totals 101% 100% 100% 99% 101% 101% 99% 100% 101% 99% 101% 99% 99%
Unweighted N (1,500) (313) (280) (594) (313) (1,088) (162) (165) (85) (275) (330) (552) (343)
167

The Economist /YouGov PollApril 26 - 28, 2020 - 1500 US Adult citizens
Registered Primary Voter Party ID Ideology
Total Voters Dem Rep Dem Ind Rep Lib Mod Con
Very effective 2% 2% 2% 2% 2% 1% 2% 2% 2% 2%
Possibly effective 9% 9% 7% 12% 7% 9% 12% 7% 10% 10%
Ineffective, but notdangerous 5% 5% 6% 6% 5% 4% 6% 5% 5% 5%
Dangerous 2% 3% 4% 1% 3% 2% 1% 4% 2% 0%
Not sure 11% 12% 12% 9% 13% 10% 8% 12% 10% 10%
Not heard of 72% 69% 70% 70% 70% 74% 71% 71% 72% 72%
Totals 101% 100% 101% 100% 100% 100% 100% 101% 101% 99%
Unweighted N (1,500) (1,222) (564) (337) (536) (584) (380) (449) (451) (457)
168

The Economist /YouGov PollApril 26 - 28, 2020 - 1500 US Adult citizens
53H. Effectiveness Of Coronavirus Treatments — Social distancingHow effective at treating coronavirus do you believe each of the following treatments are?
Gender Education Income
Total Male Female HS or less Some college College grad Postgrad Under $50K $50-100K $100K or more
Very effective 53% 48% 57% 45% 54% 56% 68% 46% 60% 63%
Possibly effective 30% 30% 30% 33% 27% 32% 24% 31% 31% 23%
Ineffective, but notdangerous 7% 10% 4% 6% 8% 6% 5% 8% 5% 9%
Dangerous 2% 1% 2% 3% 2% 0% 1% 3% 2% 0%
Not sure 5% 6% 3% 6% 5% 6% 1% 6% 2% 4%
Not heard of 4% 5% 3% 7% 3% 0% 1% 6% 1% 1%
Totals 101% 100% 99% 100% 99% 100% 100% 100% 101% 100%
Unweighted N (1,498) (666) (832) (470) (530) (302) (196) (600) (442) (287)
Age Race Region
Total 18-29 30-44 45-64 65+ White Black Hispanic Other Northeast Midwest South West
Very effective 53% 50% 53% 49% 61% 55% 46% 48% 50% 54% 61% 49% 51%
Possibly effective 30% 26% 27% 34% 31% 31% 30% 26% 30% 27% 29% 32% 30%
Ineffective, but notdangerous 7% 3% 9% 9% 4% 7% 8% 3% 12% 6% 4% 9% 6%
Dangerous 2% 4% 2% 1% 1% 1% 1% 6% 3% 1% 1% 2% 4%
Not sure 5% 10% 4% 4% 2% 4% 7% 10% 3% 7% 1% 5% 6%
Not heard of 4% 7% 5% 3% 2% 3% 8% 7% 1% 5% 4% 4% 4%
Totals 101% 100% 100% 100% 101% 101% 100% 100% 99% 100% 100% 101% 101%
Unweighted N (1,498) (313) (280) (593) (312) (1,086) (162) (165) (85) (275) (329) (552) (342)
169

The Economist /YouGov PollApril 26 - 28, 2020 - 1500 US Adult citizens
Registered Primary Voter Party ID Ideology
Total Voters Dem Rep Dem Ind Rep Lib Mod Con
Very effective 53% 59% 73% 46% 67% 47% 44% 67% 58% 42%
Possibly effective 30% 29% 21% 36% 23% 32% 36% 23% 28% 37%
Ineffective, but notdangerous 7% 7% 3% 12% 3% 7% 10% 4% 4% 10%
Dangerous 2% 1% 1% 2% 1% 2% 2% 0% 2% 2%
Not sure 5% 2% 1% 2% 3% 7% 4% 4% 4% 3%
Not heard of 4% 2% 1% 2% 3% 5% 4% 1% 3% 6%
Totals 101% 100% 100% 100% 100% 100% 100% 99% 99% 100%
Unweighted N (1,498) (1,221) (564) (336) (536) (583) (379) (449) (450) (456)
170

The Economist /YouGov PollApril 26 - 28, 2020 - 1500 US Adult citizens
54A. Re-Open Or Remain Closed — Public parksShould each of the following places be reopened, or remain closed out of concern for coronavirus?
Gender Education Income
Total Male Female HS or less Some college College grad Postgrad Under $50K $50-100K $100K or more
Definitely re-open 22% 27% 18% 22% 23% 21% 25% 21% 22% 28%
Probably re-open 36% 36% 36% 32% 37% 40% 42% 33% 41% 38%
Probably remain closed 21% 20% 23% 20% 21% 25% 20% 22% 22% 20%
Definitely remain closed 14% 13% 16% 17% 13% 13% 12% 16% 14% 11%
Not sure 6% 5% 7% 10% 7% 1% 1% 9% 2% 3%
Totals 99% 101% 100% 101% 101% 100% 100% 101% 101% 100%
Unweighted N (1,495) (664) (831) (469) (529) (302) (195) (598) (443) (284)
Age Race Region
Total 18-29 30-44 45-64 65+ White Black Hispanic Other Northeast Midwest South West
Definitely re-open 22% 22% 21% 25% 20% 23% 21% 17% 22% 16% 25% 21% 27%
Probably re-open 36% 25% 33% 38% 47% 39% 26% 27% 34% 38% 36% 35% 37%
Probably remain closed 21% 26% 22% 19% 20% 21% 18% 26% 24% 23% 20% 21% 22%
Definitely remain closed 14% 17% 17% 13% 9% 11% 22% 22% 19% 16% 15% 16% 10%
Not sure 6% 9% 7% 5% 4% 5% 14% 8% 1% 8% 5% 7% 5%
Totals 99% 99% 100% 100% 100% 99% 101% 100% 100% 101% 101% 100% 101%
Unweighted N (1,495) (311) (279) (592) (313) (1,085) (162) (163) (85) (275) (329) (550) (341)
Registered Primary Voter Party ID Ideology
Total Voters Dem Rep Dem Ind Rep Lib Mod Con
Definitely re-open 22% 23% 12% 38% 10% 26% 32% 12% 20% 33%
Probably re-open 36% 38% 39% 42% 35% 33% 42% 36% 37% 40%
Probably remain closed 21% 22% 26% 13% 24% 24% 15% 28% 21% 16%
continued on the next page . . .
171

The Economist /YouGov PollApril 26 - 28, 2020 - 1500 US Adult citizens
continued from previous pageRegistered Primary Voter Party ID Ideology
Total Voters Dem Rep Dem Ind Rep Lib Mod Con
Definitely remain closed 14% 13% 20% 5% 26% 10% 6% 21% 16% 5%
Not sure 6% 4% 3% 2% 5% 7% 5% 3% 6% 5%
Totals 99% 100% 100% 100% 100% 100% 100% 100% 100% 99%
Unweighted N (1,495) (1,218) (564) (334) (536) (583) (376) (447) (449) (456)
172

The Economist /YouGov PollApril 26 - 28, 2020 - 1500 US Adult citizens
54B. Re-Open Or Remain Closed — Golf coursesShould each of the following places be reopened, or remain closed out of concern for coronavirus?
Gender Education Income
Total Male Female HS or less Some college College grad Postgrad Under $50K $50-100K $100K or more
Definitely re-open 19% 22% 17% 16% 22% 20% 24% 18% 19% 26%
Probably re-open 37% 37% 37% 35% 39% 36% 34% 34% 44% 32%
Probably remain closed 16% 15% 16% 14% 15% 18% 18% 15% 15% 19%
Definitely remain closed 20% 18% 23% 22% 17% 22% 21% 21% 20% 19%
Not sure 8% 8% 8% 12% 8% 4% 3% 12% 3% 5%
Totals 100% 100% 101% 99% 101% 100% 100% 100% 101% 101%
Unweighted N (1,493) (661) (832) (468) (527) (302) (196) (598) (440) (285)
Age Race Region
Total 18-29 30-44 45-64 65+ White Black Hispanic Other Northeast Midwest South West
Definitely re-open 19% 17% 12% 24% 21% 21% 12% 12% 22% 13% 23% 18% 25%
Probably re-open 37% 24% 39% 38% 43% 40% 31% 25% 27% 36% 41% 34% 36%
Probably remain closed 16% 16% 18% 13% 18% 17% 12% 13% 13% 20% 9% 16% 17%
Definitely remain closed 20% 26% 24% 19% 14% 16% 28% 33% 36% 18% 21% 24% 15%
Not sure 8% 17% 7% 6% 3% 6% 16% 17% 2% 13% 6% 8% 7%
Totals 100% 100% 100% 100% 99% 100% 99% 100% 100% 100% 100% 100% 100%
Unweighted N (1,493) (313) (279) (590) (311) (1,084) (162) (162) (85) (274) (328) (551) (340)
Registered Primary Voter Party ID Ideology
Total Voters Dem Rep Dem Ind Rep Lib Mod Con
Definitely re-open 19% 22% 9% 40% 8% 20% 32% 9% 17% 34%
Probably re-open 37% 37% 34% 42% 32% 36% 43% 31% 38% 41%
Probably remain closed 16% 17% 22% 8% 22% 16% 8% 21% 20% 7%
continued on the next page . . .
173

The Economist /YouGov PollApril 26 - 28, 2020 - 1500 US Adult citizens
continued from previous pageRegistered Primary Voter Party ID Ideology
Total Voters Dem Rep Dem Ind Rep Lib Mod Con
Definitely remain closed 20% 19% 31% 8% 33% 18% 10% 34% 19% 11%
Not sure 8% 4% 5% 3% 6% 10% 7% 5% 6% 8%
Totals 100% 99% 101% 101% 101% 100% 100% 100% 100% 101%
Unweighted N (1,493) (1,216) (562) (333) (534) (583) (376) (448) (449) (453)
174

The Economist /YouGov PollApril 26 - 28, 2020 - 1500 US Adult citizens
54C. Re-Open Or Remain Closed — Tattoo parlorsShould each of the following places be reopened, or remain closed out of concern for coronavirus?
Gender Education Income
Total Male Female HS or less Some college College grad Postgrad Under $50K $50-100K $100K or more
Definitely re-open 6% 6% 5% 6% 5% 6% 5% 6% 5% 5%
Probably re-open 13% 16% 11% 15% 13% 13% 10% 13% 15% 12%
Probably remain closed 24% 26% 22% 24% 24% 23% 26% 23% 24% 25%
Definitely remain closed 49% 43% 54% 43% 50% 54% 58% 47% 52% 52%
Not sure 8% 8% 8% 12% 7% 4% 1% 10% 3% 6%
Totals 100% 99% 100% 100% 99% 100% 100% 99% 99% 100%
Unweighted N (1,496) (665) (831) (469) (530) (301) (196) (597) (442) (287)
Age Race Region
Total 18-29 30-44 45-64 65+ White Black Hispanic Other Northeast Midwest South West
Definitely re-open 6% 6% 6% 6% 4% 5% 6% 6% 7% 6% 4% 5% 8%
Probably re-open 13% 12% 16% 15% 9% 13% 17% 14% 17% 10% 17% 13% 14%
Probably remain closed 24% 21% 25% 24% 26% 27% 11% 20% 22% 22% 21% 26% 24%
Definitely remain closed 49% 44% 47% 47% 59% 49% 54% 42% 50% 51% 53% 47% 46%
Not sure 8% 17% 6% 8% 3% 6% 12% 19% 3% 11% 5% 8% 8%
Totals 100% 100% 100% 100% 101% 100% 100% 101% 99% 100% 100% 99% 100%
Unweighted N (1,496) (312) (280) (591) (313) (1,086) (161) (165) (84) (273) (330) (551) (342)
Registered Primary Voter Party ID Ideology
Total Voters Dem Rep Dem Ind Rep Lib Mod Con
Definitely re-open 6% 6% 3% 12% 2% 7% 8% 3% 6% 8%
Probably re-open 13% 13% 8% 20% 7% 15% 19% 11% 11% 18%
Probably remain closed 24% 24% 18% 29% 17% 26% 29% 17% 27% 29%
continued on the next page . . .
175

The Economist /YouGov PollApril 26 - 28, 2020 - 1500 US Adult citizens
continued from previous pageRegistered Primary Voter Party ID Ideology
Total Voters Dem Rep Dem Ind Rep Lib Mod Con
Definitely remain closed 49% 52% 69% 35% 69% 41% 36% 66% 52% 33%
Not sure 8% 4% 2% 5% 5% 10% 8% 4% 4% 12%
Totals 100% 99% 100% 101% 100% 99% 100% 101% 100% 100%
Unweighted N (1,496) (1,221) (564) (336) (536) (581) (379) (448) (450) (455)
176

The Economist /YouGov PollApril 26 - 28, 2020 - 1500 US Adult citizens
54D. Re-Open Or Remain Closed — Beauty salonsShould each of the following places be reopened, or remain closed out of concern for coronavirus?
Gender Education Income
Total Male Female HS or less Some college College grad Postgrad Under $50K $50-100K $100K or more
Definitely re-open 10% 11% 10% 10% 13% 10% 6% 12% 10% 9%
Probably re-open 24% 27% 22% 23% 26% 23% 27% 21% 27% 28%
Probably remain closed 23% 21% 24% 23% 22% 22% 24% 22% 24% 22%
Definitely remain closed 35% 32% 37% 31% 32% 41% 42% 34% 34% 36%
Not sure 8% 8% 8% 13% 6% 4% 1% 11% 4% 4%
Totals 100% 99% 101% 100% 99% 100% 100% 100% 99% 99%
Unweighted N (1,498) (665) (833) (470) (530) (302) (196) (599) (442) (287)
Age Race Region
Total 18-29 30-44 45-64 65+ White Black Hispanic Other Northeast Midwest South West
Definitely re-open 10% 10% 9% 12% 10% 11% 9% 8% 15% 9% 10% 9% 15%
Probably re-open 24% 17% 27% 27% 24% 27% 15% 19% 21% 17% 26% 26% 27%
Probably remain closed 23% 21% 20% 22% 29% 23% 18% 23% 24% 24% 27% 22% 20%
Definitely remain closed 35% 37% 35% 33% 33% 33% 43% 34% 40% 38% 34% 35% 31%
Not sure 8% 16% 9% 6% 3% 6% 15% 16% 1% 13% 4% 8% 8%
Totals 100% 101% 100% 100% 99% 100% 100% 100% 101% 101% 101% 100% 101%
Unweighted N (1,498) (313) (280) (593) (312) (1,086) (162) (165) (85) (274) (330) (551) (343)
Registered Primary Voter Party ID Ideology
Total Voters Dem Rep Dem Ind Rep Lib Mod Con
Definitely re-open 10% 11% 4% 21% 4% 11% 19% 3% 8% 18%
Probably re-open 24% 26% 14% 43% 13% 25% 37% 14% 25% 36%
Probably remain closed 23% 23% 27% 18% 25% 23% 19% 24% 24% 20%
continued on the next page . . .
177

The Economist /YouGov PollApril 26 - 28, 2020 - 1500 US Adult citizens
continued from previous pageRegistered Primary Voter Party ID Ideology
Total Voters Dem Rep Dem Ind Rep Lib Mod Con
Definitely remain closed 35% 36% 53% 16% 55% 29% 18% 56% 37% 17%
Not sure 8% 3% 2% 2% 4% 12% 7% 3% 7% 9%
Totals 100% 99% 100% 100% 101% 100% 100% 100% 101% 100%
Unweighted N (1,498) (1,220) (564) (336) (536) (584) (378) (448) (451) (456)
178

The Economist /YouGov PollApril 26 - 28, 2020 - 1500 US Adult citizens
54E. Re-Open Or Remain Closed — ChurchesShould each of the following places be reopened, or remain closed out of concern for coronavirus?
Gender Education Income
Total Male Female HS or less Some college College grad Postgrad Under $50K $50-100K $100K or more
Definitely re-open 16% 17% 14% 15% 17% 14% 14% 17% 13% 17%
Probably re-open 18% 19% 18% 20% 17% 16% 19% 17% 20% 17%
Probably remain closed 23% 23% 23% 20% 25% 25% 25% 24% 26% 21%
Definitely remain closed 36% 35% 36% 34% 33% 41% 40% 31% 38% 39%
Not sure 8% 7% 8% 11% 7% 4% 2% 10% 4% 6%
Totals 101% 101% 99% 100% 99% 100% 100% 99% 101% 100%
Unweighted N (1,490) (663) (827) (464) (530) (300) (196) (593) (441) (286)
Age Race Region
Total 18-29 30-44 45-64 65+ White Black Hispanic Other Northeast Midwest South West
Definitely re-open 16% 14% 13% 18% 15% 16% 14% 17% 13% 11% 13% 17% 21%
Probably re-open 18% 16% 17% 19% 20% 18% 17% 17% 20% 16% 18% 19% 18%
Probably remain closed 23% 22% 21% 24% 25% 26% 16% 15% 18% 26% 24% 22% 21%
Definitely remain closed 36% 36% 41% 33% 35% 34% 41% 37% 44% 35% 39% 35% 34%
Not sure 8% 13% 7% 6% 5% 6% 13% 13% 4% 11% 6% 7% 7%
Totals 101% 101% 99% 100% 100% 100% 101% 99% 99% 99% 100% 100% 101%
Unweighted N (1,490) (311) (276) (592) (311) (1,079) (162) (165) (84) (271) (330) (549) (340)
Registered Primary Voter Party ID Ideology
Total Voters Dem Rep Dem Ind Rep Lib Mod Con
Definitely re-open 16% 17% 5% 34% 5% 16% 28% 3% 12% 31%
Probably re-open 18% 18% 11% 26% 11% 19% 25% 11% 20% 23%
Probably remain closed 23% 24% 26% 19% 22% 26% 20% 21% 25% 21%
continued on the next page . . .
179

The Economist /YouGov PollApril 26 - 28, 2020 - 1500 US Adult citizens
continued from previous pageRegistered Primary Voter Party ID Ideology
Total Voters Dem Rep Dem Ind Rep Lib Mod Con
Definitely remain closed 36% 36% 56% 16% 57% 30% 18% 61% 37% 16%
Not sure 8% 5% 2% 6% 4% 9% 9% 3% 7% 10%
Totals 101% 100% 100% 101% 99% 100% 100% 99% 101% 101%
Unweighted N (1,490) (1,214) (561) (336) (531) (580) (379) (446) (445) (457)
180

The Economist /YouGov PollApril 26 - 28, 2020 - 1500 US Adult citizens
54F. Re-Open Or Remain Closed — RestaurantsShould each of the following places be reopened, or remain closed out of concern for coronavirus?
Gender Education Income
Total Male Female HS or less Some college College grad Postgrad Under $50K $50-100K $100K or more
Definitely re-open 11% 11% 10% 10% 13% 9% 12% 11% 10% 12%
Probably re-open 27% 30% 24% 26% 28% 28% 23% 26% 26% 27%
Probably remain closed 28% 26% 29% 28% 25% 31% 27% 28% 31% 22%
Definitely remain closed 29% 26% 31% 26% 29% 29% 36% 26% 30% 33%
Not sure 6% 6% 6% 9% 6% 3% 1% 8% 3% 5%
Totals 101% 99% 100% 99% 101% 100% 99% 99% 100% 99%
Unweighted N (1,491) (660) (831) (468) (528) (299) (196) (597) (441) (283)
Age Race Region
Total 18-29 30-44 45-64 65+ White Black Hispanic Other Northeast Midwest South West
Definitely re-open 11% 10% 11% 12% 9% 12% 6% 10% 13% 8% 9% 11% 15%
Probably re-open 27% 22% 26% 29% 28% 27% 25% 28% 24% 23% 23% 29% 29%
Probably remain closed 28% 29% 24% 28% 29% 29% 22% 24% 32% 30% 32% 26% 23%
Definitely remain closed 29% 25% 34% 27% 29% 28% 33% 30% 28% 31% 30% 28% 26%
Not sure 6% 13% 6% 4% 4% 5% 14% 7% 3% 8% 5% 6% 6%
Totals 101% 99% 101% 100% 99% 101% 100% 99% 100% 100% 99% 100% 99%
Unweighted N (1,491) (313) (278) (590) (310) (1,081) (162) (163) (85) (272) (328) (551) (340)
Registered Primary Voter Party ID Ideology
Total Voters Dem Rep Dem Ind Rep Lib Mod Con
Definitely re-open 11% 11% 4% 22% 3% 12% 19% 3% 11% 18%
Probably re-open 27% 28% 15% 43% 15% 30% 37% 16% 25% 39%
Probably remain closed 28% 29% 32% 21% 29% 29% 24% 31% 28% 23%
continued on the next page . . .
181

The Economist /YouGov PollApril 26 - 28, 2020 - 1500 US Adult citizens
continued from previous pageRegistered Primary Voter Party ID Ideology
Total Voters Dem Rep Dem Ind Rep Lib Mod Con
Definitely remain closed 29% 29% 45% 13% 48% 22% 15% 46% 29% 14%
Not sure 6% 3% 4% 2% 5% 7% 6% 4% 7% 5%
Totals 101% 100% 100% 101% 100% 100% 101% 100% 100% 99%
Unweighted N (1,491) (1,214) (563) (333) (536) (581) (374) (448) (449) (452)
182

The Economist /YouGov PollApril 26 - 28, 2020 - 1500 US Adult citizens
54G. Re-Open Or Remain Closed — CasinosShould each of the following places be reopened, or remain closed out of concern for coronavirus?
Gender Education Income
Total Male Female HS or less Some college College grad Postgrad Under $50K $50-100K $100K or more
Definitely re-open 6% 7% 5% 5% 7% 6% 5% 6% 5% 7%
Probably re-open 13% 16% 10% 15% 12% 9% 12% 12% 13% 14%
Probably remain closed 23% 24% 23% 23% 25% 23% 21% 24% 24% 23%
Definitely remain closed 51% 47% 56% 45% 51% 60% 59% 47% 56% 51%
Not sure 7% 7% 6% 12% 5% 3% 2% 10% 3% 4%
Totals 100% 101% 100% 100% 100% 101% 99% 99% 101% 99%
Unweighted N (1,497) (665) (832) (470) (530) (301) (196) (600) (441) (286)
Age Race Region
Total 18-29 30-44 45-64 65+ White Black Hispanic Other Northeast Midwest South West
Definitely re-open 6% 4% 6% 7% 5% 5% 3% 9% 11% 5% 4% 4% 10%
Probably re-open 13% 8% 13% 16% 12% 13% 15% 9% 15% 10% 10% 16% 13%
Probably remain closed 23% 18% 28% 23% 24% 25% 17% 22% 19% 22% 23% 25% 22%
Definitely remain closed 51% 56% 48% 48% 55% 51% 55% 48% 55% 52% 58% 49% 47%
Not sure 7% 14% 5% 5% 4% 6% 10% 13% 1% 10% 5% 6% 7%
Totals 100% 100% 100% 99% 100% 100% 100% 101% 101% 99% 100% 100% 99%
Unweighted N (1,497) (313) (279) (594) (311) (1,087) (161) (164) (85) (275) (329) (552) (341)
Registered Primary Voter Party ID Ideology
Total Voters Dem Rep Dem Ind Rep Lib Mod Con
Definitely re-open 6% 7% 3% 13% 2% 6% 10% 2% 6% 10%
Probably re-open 13% 13% 7% 20% 6% 12% 21% 6% 13% 19%
Probably remain closed 23% 24% 18% 30% 20% 24% 28% 17% 25% 28%
continued on the next page . . .
183

The Economist /YouGov PollApril 26 - 28, 2020 - 1500 US Adult citizens
continued from previous pageRegistered Primary Voter Party ID Ideology
Total Voters Dem Rep Dem Ind Rep Lib Mod Con
Definitely remain closed 51% 54% 71% 35% 69% 46% 37% 73% 51% 34%
Not sure 7% 3% 2% 2% 3% 11% 5% 3% 5% 9%
Totals 100% 101% 101% 100% 100% 99% 101% 101% 100% 100%
Unweighted N (1,497) (1,219) (563) (335) (535) (583) (379) (448) (449) (457)
184

The Economist /YouGov PollApril 26 - 28, 2020 - 1500 US Adult citizens
54H. Re-Open Or Remain Closed — BarsShould each of the following places be reopened, or remain closed out of concern for coronavirus?
Gender Education Income
Total Male Female HS or less Some college College grad Postgrad Under $50K $50-100K $100K or more
Definitely re-open 7% 8% 6% 7% 7% 5% 6% 7% 5% 9%
Probably re-open 15% 17% 13% 16% 15% 13% 14% 14% 16% 13%
Probably remain closed 25% 28% 23% 25% 25% 25% 25% 26% 25% 24%
Definitely remain closed 46% 40% 52% 41% 47% 52% 52% 44% 50% 48%
Not sure 7% 8% 6% 10% 6% 4% 2% 9% 4% 7%
Totals 100% 101% 100% 99% 100% 99% 99% 100% 100% 101%
Unweighted N (1,498) (666) (832) (470) (530) (302) (196) (599) (442) (287)
Age Race Region
Total 18-29 30-44 45-64 65+ White Black Hispanic Other Northeast Midwest South West
Definitely re-open 7% 6% 6% 7% 6% 7% 6% 5% 9% 5% 5% 7% 11%
Probably re-open 15% 10% 18% 18% 12% 15% 13% 15% 13% 11% 13% 17% 18%
Probably remain closed 25% 21% 24% 25% 30% 27% 16% 20% 25% 30% 25% 24% 21%
Definitely remain closed 46% 49% 46% 44% 49% 45% 51% 48% 52% 44% 53% 45% 44%
Not sure 7% 14% 6% 5% 3% 5% 14% 11% 1% 10% 4% 7% 7%
Totals 100% 100% 100% 99% 100% 99% 100% 99% 100% 100% 100% 100% 101%
Unweighted N (1,498) (313) (280) (593) (312) (1,087) (162) (164) (85) (274) (330) (552) (342)
Registered Primary Voter Party ID Ideology
Total Voters Dem Rep Dem Ind Rep Lib Mod Con
Definitely re-open 7% 7% 3% 14% 2% 8% 10% 4% 6% 11%
Probably re-open 15% 14% 6% 23% 7% 17% 22% 7% 16% 21%
Probably remain closed 25% 26% 21% 33% 20% 26% 30% 19% 26% 30%
continued on the next page . . .
185

The Economist /YouGov PollApril 26 - 28, 2020 - 1500 US Adult citizens
continued from previous pageRegistered Primary Voter Party ID Ideology
Total Voters Dem Rep Dem Ind Rep Lib Mod Con
Definitely remain closed 46% 48% 68% 26% 68% 39% 30% 68% 48% 28%
Not sure 7% 4% 2% 5% 3% 10% 7% 3% 4% 10%
Totals 100% 99% 100% 101% 100% 100% 99% 101% 100% 100%
Unweighted N (1,498) (1,220) (563) (336) (535) (584) (379) (449) (451) (456)
186

The Economist /YouGov PollApril 26 - 28, 2020 - 1500 US Adult citizens
54I. Re-Open Or Remain Closed — GymsShould each of the following places be reopened, or remain closed out of concern for coronavirus?
Gender Education Income
Total Male Female HS or less Some college College grad Postgrad Under $50K $50-100K $100K or more
Definitely re-open 9% 10% 8% 8% 11% 10% 7% 10% 8% 11%
Probably re-open 17% 21% 14% 19% 15% 18% 16% 16% 19% 15%
Probably remain closed 25% 25% 24% 25% 25% 24% 24% 25% 26% 27%
Definitely remain closed 42% 37% 47% 37% 44% 47% 51% 39% 45% 44%
Not sure 7% 7% 6% 12% 5% 1% 1% 10% 3% 3%
Totals 100% 100% 99% 101% 100% 100% 99% 100% 101% 100%
Unweighted N (1,494) (665) (829) (469) (528) (301) (196) (597) (441) (286)
Age Race Region
Total 18-29 30-44 45-64 65+ White Black Hispanic Other Northeast Midwest South West
Definitely re-open 9% 10% 9% 10% 7% 8% 13% 8% 12% 8% 8% 7% 13%
Probably re-open 17% 17% 17% 18% 17% 18% 15% 16% 17% 12% 15% 21% 17%
Probably remain closed 25% 23% 22% 24% 30% 27% 15% 20% 21% 27% 25% 23% 24%
Definitely remain closed 42% 37% 47% 42% 43% 42% 44% 43% 49% 42% 47% 42% 40%
Not sure 7% 13% 6% 5% 3% 5% 12% 13% 1% 11% 4% 6% 5%
Totals 100% 100% 101% 99% 100% 100% 99% 100% 100% 100% 99% 99% 99%
Unweighted N (1,494) (312) (279) (592) (311) (1,083) (162) (165) (84) (274) (329) (550) (341)
Registered Primary Voter Party ID Ideology
Total Voters Dem Rep Dem Ind Rep Lib Mod Con
Definitely re-open 9% 10% 4% 16% 3% 11% 13% 4% 10% 13%
Probably re-open 17% 17% 7% 28% 8% 19% 26% 9% 14% 27%
Probably remain closed 25% 24% 23% 25% 21% 26% 27% 18% 28% 27%
continued on the next page . . .
187

The Economist /YouGov PollApril 26 - 28, 2020 - 1500 US Adult citizens
continued from previous pageRegistered Primary Voter Party ID Ideology
Total Voters Dem Rep Dem Ind Rep Lib Mod Con
Definitely remain closed 42% 45% 64% 27% 64% 34% 28% 67% 43% 24%
Not sure 7% 3% 3% 3% 4% 10% 6% 2% 5% 9%
Totals 100% 99% 101% 99% 100% 100% 100% 100% 100% 100%
Unweighted N (1,494) (1,217) (564) (335) (535) (582) (377) (448) (449) (454)
188
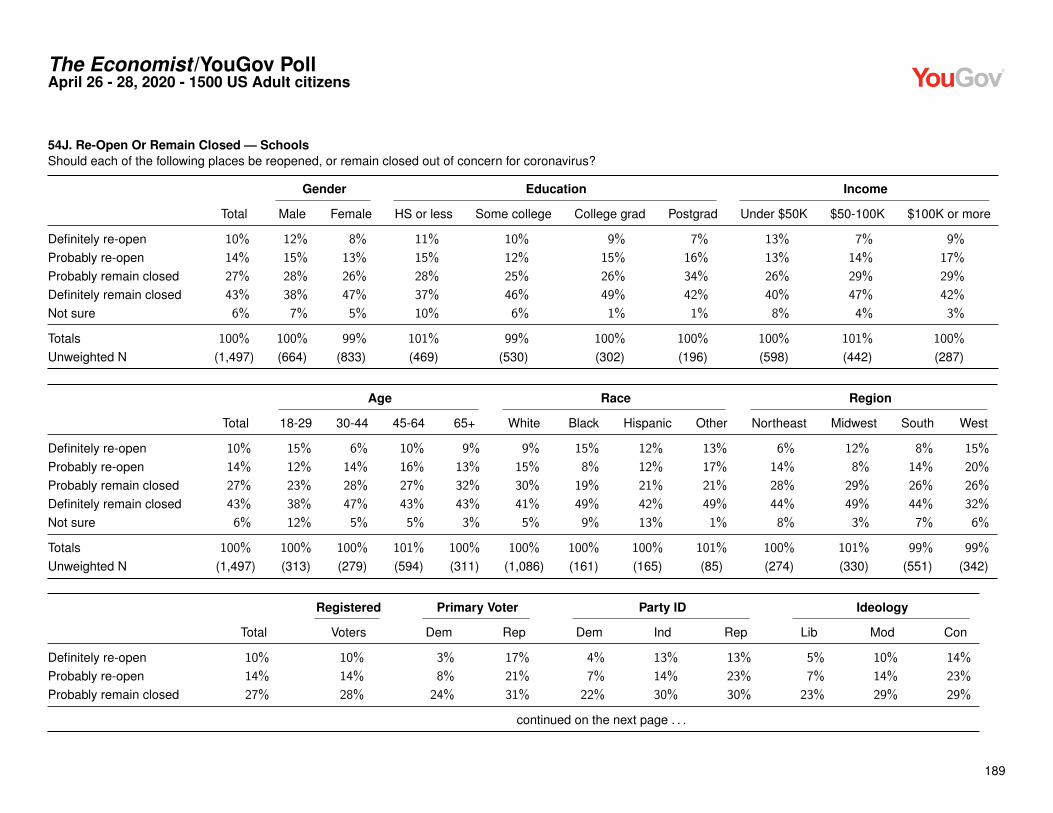
The Economist /YouGov PollApril 26 - 28, 2020 - 1500 US Adult citizens
54J. Re-Open Or Remain Closed — SchoolsShould each of the following places be reopened, or remain closed out of concern for coronavirus?
Gender Education Income
Total Male Female HS or less Some college College grad Postgrad Under $50K $50-100K $100K or more
Definitely re-open 10% 12% 8% 11% 10% 9% 7% 13% 7% 9%
Probably re-open 14% 15% 13% 15% 12% 15% 16% 13% 14% 17%
Probably remain closed 27% 28% 26% 28% 25% 26% 34% 26% 29% 29%
Definitely remain closed 43% 38% 47% 37% 46% 49% 42% 40% 47% 42%
Not sure 6% 7% 5% 10% 6% 1% 1% 8% 4% 3%
Totals 100% 100% 99% 101% 99% 100% 100% 100% 101% 100%
Unweighted N (1,497) (664) (833) (469) (530) (302) (196) (598) (442) (287)
Age Race Region
Total 18-29 30-44 45-64 65+ White Black Hispanic Other Northeast Midwest South West
Definitely re-open 10% 15% 6% 10% 9% 9% 15% 12% 13% 6% 12% 8% 15%
Probably re-open 14% 12% 14% 16% 13% 15% 8% 12% 17% 14% 8% 14% 20%
Probably remain closed 27% 23% 28% 27% 32% 30% 19% 21% 21% 28% 29% 26% 26%
Definitely remain closed 43% 38% 47% 43% 43% 41% 49% 42% 49% 44% 49% 44% 32%
Not sure 6% 12% 5% 5% 3% 5% 9% 13% 1% 8% 3% 7% 6%
Totals 100% 100% 100% 101% 100% 100% 100% 100% 101% 100% 101% 99% 99%
Unweighted N (1,497) (313) (279) (594) (311) (1,086) (161) (165) (85) (274) (330) (551) (342)
Registered Primary Voter Party ID Ideology
Total Voters Dem Rep Dem Ind Rep Lib Mod Con
Definitely re-open 10% 10% 3% 17% 4% 13% 13% 5% 10% 14%
Probably re-open 14% 14% 8% 21% 7% 14% 23% 7% 14% 23%
Probably remain closed 27% 28% 24% 31% 22% 30% 30% 23% 29% 29%
continued on the next page . . .
189

The Economist /YouGov PollApril 26 - 28, 2020 - 1500 US Adult citizens
continued from previous pageRegistered Primary Voter Party ID Ideology
Total Voters Dem Rep Dem Ind Rep Lib Mod Con
Definitely remain closed 43% 45% 63% 27% 64% 36% 26% 63% 44% 26%
Not sure 6% 3% 2% 4% 3% 8% 7% 2% 4% 9%
Totals 100% 100% 100% 100% 100% 101% 99% 100% 101% 101%
Unweighted N (1,497) (1,221) (564) (336) (535) (583) (379) (448) (451) (456)
190

The Economist /YouGov PollApril 26 - 28, 2020 - 1500 US Adult citizens
55. Congressional Work Away From The CapitolDo you believe members of Congress should be able to vote on bills and carry out their normal duties from their offices away from the Capitol in Washington,D.C.?
Gender Education Income
Total Male Female HS or less Some college College grad Postgrad Under $50K $50-100K $100K or more
Yes 61% 58% 63% 49% 60% 74% 80% 53% 67% 75%
No 17% 21% 14% 20% 18% 13% 10% 19% 18% 11%
Not sure 22% 21% 23% 30% 21% 13% 10% 28% 14% 15%
Totals 100% 100% 100% 99% 99% 100% 100% 100% 99% 101%
Unweighted N (1,493) (664) (829) (468) (528) (301) (196) (595) (442) (287)
Age Race Region
Total 18-29 30-44 45-64 65+ White Black Hispanic Other Northeast Midwest South West
Yes 61% 56% 66% 61% 59% 62% 55% 56% 67% 58% 68% 57% 63%
No 17% 16% 9% 20% 23% 19% 8% 18% 11% 16% 14% 19% 19%
Not sure 22% 28% 25% 18% 18% 19% 36% 26% 21% 26% 18% 24% 18%
Totals 100% 100% 100% 99% 100% 100% 99% 100% 99% 100% 100% 100% 100%
Unweighted N (1,493) (310) (277) (594) (312) (1,085) (160) (163) (85) (273) (330) (548) (342)
Registered Primary Voter Party ID Ideology
Total Voters Dem Rep Dem Ind Rep Lib Mod Con
Yes 61% 66% 80% 55% 75% 52% 56% 77% 63% 52%
No 17% 19% 9% 31% 8% 21% 24% 8% 15% 28%
Not sure 22% 15% 11% 14% 17% 27% 20% 15% 22% 20%
Totals 100% 100% 100% 100% 100% 100% 100% 100% 100% 100%
Unweighted N (1,493) (1,218) (564) (337) (532) (581) (380) (448) (450) (457)
191

The Economist /YouGov PollApril 26 - 28, 2020 - 1500 US Adult citizens
56. Respondents Biggest ConcernWhich one are you most concerned about?
Gender Education Income
Total Male Female HS or less Some college College grad Postgrad Under $50K $50-100K $100K or more
Protecting Americansfrom the health effectsof the COVID-19outbreak 68% 63% 73% 67% 65% 72% 72% 69% 69% 65%
Protecting Americansfrom the economiceffects of theCOVID-19 outbreak 32% 37% 27% 33% 35% 28% 28% 31% 31% 35%
Totals 100% 100% 100% 100% 100% 100% 100% 100% 100% 100%
Unweighted N (1,480) (663) (817) (457) (526) (301) (196) (588) (438) (287)
Age Race Region
Total 18-29 30-44 45-64 65+ White Black Hispanic Other Northeast Midwest South West
Protecting Americansfrom the health effectsof the COVID-19outbreak 68% 69% 71% 63% 71% 67% 78% 66% 58% 75% 69% 66% 64%
Protecting Americansfrom the economiceffects of theCOVID-19 outbreak 32% 31% 29% 37% 29% 33% 22% 34% 42% 25% 31% 34% 36%
Totals 100% 100% 100% 100% 100% 100% 100% 100% 100% 100% 100% 100% 100%
Unweighted N (1,480) (306) (276) (588) (310) (1,079) (159) (159) (83) (271) (328) (543) (338)
192

The Economist /YouGov PollApril 26 - 28, 2020 - 1500 US Adult citizens
Registered Primary Voter Party ID Ideology
Total Voters Dem Rep Dem Ind Rep Lib Mod Con
Protecting Americansfrom the health effectsof the COVID-19outbreak 68% 68% 87% 41% 87% 63% 51% 83% 77% 49%
Protecting Americansfrom the economiceffects of theCOVID-19 outbreak 32% 32% 13% 59% 13% 37% 49% 17% 23% 51%
Totals 100% 100% 100% 100% 100% 100% 100% 100% 100% 100%
Unweighted N (1,480) (1,210) (561) (334) (534) (570) (376) (447) (446) (448)
193

The Economist /YouGov PollApril 26 - 28, 2020 - 1500 US Adult citizens
57. Political Leaders Biggest ConcernWhich one do you think our political leaders are most concerned about?
Gender Education Income
Total Male Female HS or less Some college College grad Postgrad Under $50K $50-100K $100K or more
Protecting Americansfrom the health effectsof the COVID-19outbreak 23% 23% 22% 26% 22% 19% 20% 26% 22% 22%
Protecting Americansfrom the economiceffects of theCOVID-19 outbreak 26% 23% 29% 25% 27% 30% 23% 26% 26% 24%
Scoring points againstpolitical opponents 51% 54% 49% 49% 52% 52% 58% 49% 52% 54%
Totals 100% 100% 100% 100% 101% 101% 101% 101% 100% 100%
Unweighted N (1,489) (663) (826) (466) (526) (301) (196) (594) (442) (286)
Age Race Region
Total 18-29 30-44 45-64 65+ White Black Hispanic Other Northeast Midwest South West
Protecting Americansfrom the health effectsof the COVID-19outbreak 23% 26% 24% 24% 15% 22% 29% 20% 23% 32% 19% 20% 23%
Protecting Americansfrom the economiceffects of theCOVID-19 outbreak 26% 31% 31% 22% 23% 24% 27% 37% 35% 23% 30% 29% 21%
Scoring points againstpolitical opponents 51% 43% 45% 54% 62% 54% 44% 43% 42% 44% 51% 51% 57%
Totals 100% 100% 100% 100% 100% 100% 100% 100% 100% 99% 100% 100% 101%
continued on the next page . . .
194

The Economist /YouGov PollApril 26 - 28, 2020 - 1500 US Adult citizens
continued from previous pageAge Race Region
Total 18-29 30-44 45-64 65+ White Black Hispanic Other Northeast Midwest South West
Unweighted N (1,489) (311) (277) (592) (309) (1,083) (159) (163) (84) (273) (327) (548) (341)
Registered Primary Voter Party ID Ideology
Total Voters Dem Rep Dem Ind Rep Lib Mod Con
Protecting Americansfrom the health effectsof the COVID-19outbreak 23% 21% 17% 25% 18% 23% 27% 19% 20% 26%
Protecting Americansfrom the economiceffects of theCOVID-19 outbreak 26% 26% 31% 19% 38% 22% 19% 33% 32% 16%
Scoring points againstpolitical opponents 51% 53% 52% 55% 44% 55% 54% 48% 48% 57%
Totals 100% 100% 100% 99% 100% 100% 100% 100% 100% 99%
Unweighted N (1,489) (1,218) (562) (336) (534) (578) (377) (449) (448) (452)
195

The Economist /YouGov PollApril 26 - 28, 2020 - 1500 US Adult citizens
58. Knowledge Of CensusThis year, the Census Bureau is conducting a census to try to count every person living in the United States. How much have you heard or read about theefforts of the Census Bureau this year?
Gender Education Income
Total Male Female HS or less Some college College grad Postgrad Under $50K $50-100K $100K or more
A lot 41% 39% 43% 35% 41% 47% 52% 39% 43% 46%
A little 46% 48% 45% 47% 45% 47% 45% 45% 48% 50%
Nothing at all 13% 13% 12% 19% 14% 6% 3% 16% 9% 5%
Totals 100% 100% 100% 101% 100% 100% 100% 100% 100% 101%
Unweighted N (1,497) (665) (832) (468) (531) (302) (196) (599) (443) (286)
Age Race Region
Total 18-29 30-44 45-64 65+ White Black Hispanic Other Northeast Midwest South West
A lot 41% 29% 39% 44% 49% 41% 42% 41% 41% 38% 41% 43% 40%
A little 46% 47% 50% 46% 41% 50% 34% 38% 47% 48% 48% 44% 46%
Nothing at all 13% 23% 10% 10% 10% 10% 24% 21% 12% 13% 11% 13% 15%
Totals 100% 99% 99% 100% 100% 101% 100% 100% 100% 99% 100% 100% 101%
Unweighted N (1,497) (313) (279) (593) (312) (1,086) (162) (164) (85) (273) (329) (552) (343)
Registered Primary Voter Party ID Ideology
Total Voters Dem Rep Dem Ind Rep Lib Mod Con
A lot 41% 48% 59% 40% 55% 35% 33% 49% 45% 34%
A little 46% 44% 35% 51% 35% 49% 55% 41% 44% 54%
Nothing at all 13% 8% 7% 9% 10% 16% 11% 11% 10% 12%
Totals 100% 100% 101% 100% 100% 100% 99% 101% 99% 100%
Unweighted N (1,497) (1,221) (563) (337) (535) (582) (380) (449) (449) (457)
196

The Economist /YouGov PollApril 26 - 28, 2020 - 1500 US Adult citizens
59. Received Census QuestionnaireHas your household received instructions for the 2020 census in the mail yet?
Gender Education Income
Total Male Female HS or less Some college College grad Postgrad Under $50K $50-100K $100K or more
Yes 76% 74% 79% 65% 82% 81% 90% 69% 85% 83%
No 13% 14% 12% 18% 10% 13% 8% 16% 11% 12%
Not sure 10% 12% 9% 17% 9% 6% 2% 15% 4% 5%
Totals 99% 100% 100% 100% 101% 100% 100% 100% 100% 100%
Unweighted N (1,498) (666) (832) (470) (530) (302) (196) (598) (443) (287)
Age Race Region
Total 18-29 30-44 45-64 65+ White Black Hispanic Other Northeast Midwest South West
Yes 76% 57% 73% 84% 87% 81% 67% 61% 72% 75% 81% 74% 77%
No 13% 21% 13% 11% 10% 12% 13% 19% 13% 11% 13% 13% 16%
Not sure 10% 22% 14% 5% 3% 7% 20% 21% 15% 14% 6% 13% 8%
Totals 99% 100% 100% 100% 100% 100% 100% 101% 100% 100% 100% 100% 101%
Unweighted N (1,498) (313) (280) (593) (312) (1,086) (162) (165) (85) (273) (330) (552) (343)
Registered Primary Voter Party ID Ideology
Total Voters Dem Rep Dem Ind Rep Lib Mod Con
Yes 76% 84% 88% 83% 84% 69% 79% 80% 75% 77%
No 13% 11% 8% 14% 10% 16% 13% 11% 13% 16%
Not sure 10% 5% 4% 3% 6% 15% 8% 9% 11% 7%
Totals 99% 100% 100% 100% 100% 100% 100% 100% 99% 100%
Unweighted N (1,498) (1,222) (564) (337) (536) (582) (380) (449) (450) (457)
197

The Economist /YouGov PollApril 26 - 28, 2020 - 1500 US Adult citizens
60. Website Or Paper QuestionnaireThis year, the Census Bureau is directing some people to a website for data collection while others are getting the standard paper questionnaire. Which onedid you receive?
Gender Education Income
Total Male Female HS or less Some college College grad Postgrad Under $50K $50-100K $100K or more
Directions to a website 47% 48% 47% 44% 42% 53% 62% 41% 49% 61%
Standard paperquestionnaire 20% 21% 19% 27% 20% 15% 12% 27% 16% 16%
Both 30% 28% 31% 27% 35% 29% 25% 30% 32% 21%
Not sure 3% 3% 3% 3% 4% 4% 2% 2% 3% 2%
Totals 100% 100% 100% 101% 101% 101% 101% 100% 100% 100%
Unweighted N (1,175) (525) (650) (326) (425) (251) (173) (434) (381) (239)
Age Race Region
Total 18-29 30-44 45-64 65+ White Black Hispanic Other Northeast Midwest South West
Directions to a website 47% 51% 46% 49% 44% 53% 19% 35% 48% 46% 50% 44% 50%
Standard paperquestionnaire 20% 18% 21% 17% 25% 18% 34% 25% 14% 17% 20% 23% 18%
Both 30% 26% 29% 31% 31% 26% 47% 38% 36% 34% 28% 31% 26%
Not sure 3% 5% 4% 3% 0% 4% 0% 2% 2% 4% 1% 2% 6%
Totals 100% 100% 100% 100% 100% 101% 100% 100% 100% 101% 99% 100% 100%
Unweighted N (1,175) (192) (208) (504) (271) (887) (117) (111) (60) (209) (271) (430) (265)
Registered Primary Voter Party ID Ideology
Total Voters Dem Rep Dem Ind Rep Lib Mod Con
Directions to a website 47% 51% 57% 46% 49% 46% 48% 51% 48% 46%
Standard paperquestionnaire 20% 18% 16% 18% 21% 21% 17% 18% 20% 20%
continued on the next page . . .
198

The Economist /YouGov PollApril 26 - 28, 2020 - 1500 US Adult citizens
continued from previous pageRegistered Primary Voter Party ID Ideology
Total Voters Dem Rep Dem Ind Rep Lib Mod Con
Both 30% 29% 26% 32% 28% 30% 32% 27% 31% 31%
Not sure 3% 3% 1% 4% 3% 3% 3% 4% 2% 3%
Totals 100% 101% 100% 100% 101% 100% 100% 100% 101% 100%
Unweighted N (1,175) (1,015) (495) (279) (459) (407) (309) (374) (349) (370)
199

The Economist /YouGov PollApril 26 - 28, 2020 - 1500 US Adult citizens
61. Answering StatusCensus records indicate that many Americans have not yet had the opportunity to answer their 2020 U.S. Census forms. Which one of the followingstatements applies to your household?
Gender Education Income
Total Male Female HS or less Some college College grad Postgrad Under $50K $50-100K $100K or more
You have not had thechance to answer yet,but you plan to. 9% 9% 9% 10% 8% 11% 4% 12% 7% 10%
You have misplaced orlost the form. 2% 2% 2% 1% 2% 4% 1% 2% 3% 2%
You object to the Censusand don’t plan toanswer. 1% 1% 1% 1% 1% 0% 1% 0% 1% 2%
You have alreadyanswered, but have notyet submitted it. 2% 4% 1% 2% 1% 4% 2% 3% 2% 2%
You have alreadyanswered andsubmitted it. 86% 84% 87% 86% 87% 81% 91% 84% 88% 84%
Totals 100% 100% 100% 100% 99% 100% 99% 101% 101% 100%
Unweighted N (1,174) (523) (651) (326) (425) (251) (172) (434) (380) (240)
Age Race Region
Total 18-29 30-44 45-64 65+ White Black Hispanic Other Northeast Midwest South West
You have not had thechance to answer yet,but you plan to. 9% 22% 10% 7% 2% 8% 14% 11% 11% 14% 9% 6% 8%
You have misplaced orlost the form. 2% 4% 4% 1% 0% 1% 5% 3% 1% 2% 1% 3% 2%
continued on the next page . . .
200

The Economist /YouGov PollApril 26 - 28, 2020 - 1500 US Adult citizens
continued from previous pageAge Race Region
Total 18-29 30-44 45-64 65+ White Black Hispanic Other Northeast Midwest South West
You object to the Censusand don’t plan toanswer. 1% 1% 1% 1% 0% 1% 1% 2% 1% 0% 1% 1% 1%
You have alreadyanswered, but have notyet submitted it. 2% 7% 2% 1% 1% 2% 2% 1% 9% 3% 3% 1% 3%
You have alreadyanswered andsubmitted it. 86% 66% 83% 89% 97% 88% 78% 82% 78% 80% 86% 88% 86%
Totals 100% 100% 100% 99% 100% 100% 100% 99% 100% 99% 100% 99% 100%
Unweighted N (1,174) (192) (208) (504) (270) (885) (117) (111) (61) (209) (272) (430) (263)
Registered Primary Voter Party ID Ideology
Total Voters Dem Rep Dem Ind Rep Lib Mod Con
You have not had thechance to answer yet,but you plan to. 9% 8% 7% 11% 8% 9% 10% 10% 7% 11%
You have misplaced orlost the form. 2% 2% 3% 1% 4% 1% 1% 2% 3% 2%
You object to the Censusand don’t plan toanswer. 1% 1% 1% 2% 0% 1% 1% 0% 1% 1%
You have alreadyanswered, but have notyet submitted it. 2% 1% 1% 3% 1% 4% 2% 2% 3% 2%
You have alreadyanswered andsubmitted it. 86% 87% 88% 83% 87% 85% 85% 85% 86% 85%
continued on the next page . . .
201

The Economist /YouGov PollApril 26 - 28, 2020 - 1500 US Adult citizens
continued from previous pageRegistered Primary Voter Party ID Ideology
Total Voters Dem Rep Dem Ind Rep Lib Mod Con
Totals 100% 99% 100% 100% 100% 100% 99% 99% 100% 101%
Unweighted N (1,174) (1,013) (494) (279) (458) (409) (307) (372) (350) (369)
202

The Economist /YouGov PollApril 26 - 28, 2020 - 1500 US Adult citizens
62. Easy To AnswerWas the 2020 census easy or difficult to answer?
Gender Education Income
Total Male Female HS or less Some college College grad Postgrad Under $50K $50-100K $100K or more
Very easy 18% 14% 22% 14% 14% 25% ∗ 15% 19% ∗Fairly easy 19% 23% 17% 14% 20% 22% ∗ 14% 20% ∗Fairly difficult 4% 8% 1% 5% 5% 4% ∗ 4% 5% ∗Very difficult 6% 6% 6% 11% 5% 3% ∗ 8% 6% ∗Not sure; didn’t
personally answer 52% 49% 54% 56% 56% 47% ∗ 59% 49% ∗
Totals 99% 100% 100% 100% 100% 101% ∗ 100% 99% ∗Unweighted N (123) (55) (68) (37) (45) (31) (10) (53) (38) (27)
Age Race Region
Total 18-29 30-44 45-64 65+ White Black Hispanic Other Northeast Midwest South West
Very easy 18% 18% 18% 19% ∗ 12% ∗ ∗ ∗ 17% ∗ 22% ∗Fairly easy 19% 25% 19% 14% ∗ 26% ∗ ∗ ∗ 15% ∗ 14% ∗Fairly difficult 4% 3% 4% 5% ∗ 5% ∗ ∗ ∗ 0% ∗ 9% ∗Very difficult 6% 14% 2% 0% ∗ 2% ∗ ∗ ∗ 2% ∗ 3% ∗Not sure; didn’t
personally answer 52% 39% 56% 61% ∗ 55% ∗ ∗ ∗ 66% ∗ 52% ∗
Totals 99% 99% 99% 99% ∗ 100% ∗ ∗ ∗ 100% ∗ 100% ∗Unweighted N (123) (42) (34) (41) (6) (79) (22) (14) (8) (30) (25) (44) (24)
Registered Primary Voter Party ID Ideology
Total Voters Dem Rep Dem Ind Rep Lib Mod Con
Very easy 18% 19% 28% 18% 25% 16% 13% 22% 18% 14%
continued on the next page . . .
203

The Economist /YouGov PollApril 26 - 28, 2020 - 1500 US Adult citizens
continued from previous pageRegistered Primary Voter Party ID Ideology
Total Voters Dem Rep Dem Ind Rep Lib Mod Con
Fairly easy 19% 19% 19% 18% 18% 10% 33% 9% 25% 28%
Fairly difficult 4% 5% 8% 0% 7% 2% 3% 8% 2% 4%
Very difficult 6% 5% 2% 10% 6% 7% 6% 5% 2% 5%
Not sure; didn’tpersonally answer 52% 52% 43% 54% 44% 66% 46% 56% 53% 49%
Totals 99% 100% 100% 100% 100% 101% 101% 100% 100% 100%
Unweighted N (123) (107) (49) (30) (52) (38) (33) (43) (33) (38)
204

The Economist /YouGov PollApril 26 - 28, 2020 - 1500 US Adult citizens
63. Justification To Ask QuestionsDo you think the government has good reason to ask all the questions it does on the census, or do you think it asks for more information than it really needsto know?
Gender Education Income
Total Male Female HS or less Some college College grad Postgrad Under $50K $50-100K $100K or more
Has good reason to askall the question it doeson the census 57% 59% 54% 52% 54% 62% 71% 52% 64% 65%
Asks for more informationthan it needs to know 21% 22% 21% 21% 24% 19% 18% 22% 19% 23%
Not sure 22% 18% 25% 27% 22% 18% 11% 25% 17% 12%
Totals 100% 99% 100% 100% 100% 99% 100% 99% 100% 100%
Unweighted N (1,495) (663) (832) (470) (528) (301) (196) (598) (442) (285)
Age Race Region
Total 18-29 30-44 45-64 65+ White Black Hispanic Other Northeast Midwest South West
Has good reason to askall the question it doeson the census 57% 45% 54% 60% 67% 59% 48% 52% 49% 55% 60% 55% 58%
Asks for more informationthan it needs to know 21% 19% 25% 23% 17% 21% 23% 20% 32% 19% 19% 23% 23%
Not sure 22% 36% 22% 17% 16% 20% 29% 28% 19% 26% 21% 22% 19%
Totals 100% 100% 101% 100% 100% 100% 100% 100% 100% 100% 100% 100% 100%
Unweighted N (1,495) (312) (279) (592) (312) (1,083) (162) (165) (85) (273) (330) (549) (343)
205

The Economist /YouGov PollApril 26 - 28, 2020 - 1500 US Adult citizens
Registered Primary Voter Party ID Ideology
Total Voters Dem Rep Dem Ind Rep Lib Mod Con
Has good reason to askall the question it doeson the census 57% 62% 67% 61% 64% 49% 58% 59% 63% 55%
Asks for more informationthan it needs to know 21% 20% 18% 23% 19% 25% 19% 22% 19% 21%
Not sure 22% 18% 14% 16% 17% 26% 22% 19% 17% 23%
Totals 100% 100% 99% 100% 100% 100% 99% 100% 99% 99%
Unweighted N (1,495) (1,220) (563) (336) (535) (583) (377) (448) (449) (455)
206

The Economist /YouGov PollApril 26 - 28, 2020 - 1500 US Adult citizens
64. Importance Of AnsweringHow important do you think it is that you are counted in the census?
Gender Education Income
Total Male Female HS or less Some college College grad Postgrad Under $50K $50-100K $100K or more
Very Important 58% 56% 60% 47% 63% 60% 79% 54% 62% 68%
Somewhat Important 29% 30% 28% 33% 27% 32% 16% 29% 29% 27%
Not very Important 9% 10% 8% 14% 8% 7% 1% 12% 7% 3%
Unimportant 4% 4% 4% 6% 3% 1% 5% 5% 2% 2%
Totals 100% 100% 100% 100% 101% 100% 101% 100% 100% 100%
Unweighted N (1,496) (666) (830) (471) (530) (302) (193) (599) (443) (285)
Age Race Region
Total 18-29 30-44 45-64 65+ White Black Hispanic Other Northeast Midwest South West
Very Important 58% 39% 46% 65% 79% 62% 59% 38% 50% 58% 65% 54% 57%
Somewhat Important 29% 38% 36% 25% 17% 28% 23% 37% 33% 30% 24% 30% 30%
Not very Important 9% 16% 13% 7% 2% 7% 10% 19% 11% 9% 9% 10% 9%
Unimportant 4% 6% 5% 3% 2% 3% 8% 6% 6% 2% 2% 5% 4%
Totals 100% 99% 100% 100% 100% 100% 100% 100% 100% 99% 100% 99% 100%
Unweighted N (1,496) (313) (280) (591) (312) (1,084) (162) (165) (85) (274) (328) (552) (342)
Registered Primary Voter Party ID Ideology
Total Voters Dem Rep Dem Ind Rep Lib Mod Con
Very Important 58% 68% 75% 69% 69% 48% 59% 68% 60% 57%
Somewhat Important 29% 24% 21% 25% 22% 35% 29% 21% 27% 32%
Not very Important 9% 6% 4% 4% 8% 10% 9% 7% 11% 8%
Unimportant 4% 2% 1% 2% 1% 6% 3% 4% 3% 3%
Totals 100% 100% 101% 100% 100% 99% 100% 100% 101% 100%
continued on the next page . . .
207

The Economist /YouGov PollApril 26 - 28, 2020 - 1500 US Adult citizens
continued from previous pageRegistered Primary Voter Party ID Ideology
Total Voters Dem Rep Dem Ind Rep Lib Mod Con
Unweighted N (1,496) (1,219) (562) (336) (534) (583) (379) (447) (450) (457)
208

The Economist /YouGov PollApril 26 - 28, 2020 - 1500 US Adult citizens
65. 2020 Census StatisticsDo you think the 2020 US Census will accurately count the number of people living in the United States or do you think there will be more people or fewerpeople than the Census will report?
Gender Education Income
Total Male Female HS or less Some college College grad Postgrad Under $50K $50-100K $100K or more
More people living in USthan the Census willreport 59% 56% 62% 49% 61% 66% 75% 55% 67% 62%
The Census count willaccurate 9% 12% 7% 12% 5% 11% 9% 9% 7% 15%
Fewer people living in USthan the Census willreport 11% 13% 9% 11% 13% 10% 7% 10% 13% 10%
Don’t know 21% 19% 22% 29% 20% 13% 10% 27% 13% 13%
Totals 100% 100% 100% 101% 99% 100% 101% 101% 100% 100%
Unweighted N (1,491) (660) (831) (467) (526) (302) (196) (595) (441) (285)
Age Race Region
Total 18-29 30-44 45-64 65+ White Black Hispanic Other Northeast Midwest South West
More people living in USthan the Census willreport 59% 45% 50% 64% 74% 63% 45% 47% 63% 58% 62% 56% 63%
The Census count willaccurate 9% 10% 15% 7% 4% 9% 13% 7% 4% 8% 11% 10% 6%
Fewer people living in USthan the Census willreport 11% 15% 9% 12% 8% 10% 10% 17% 15% 12% 8% 12% 12%
Don’t know 21% 30% 26% 16% 14% 18% 32% 30% 18% 23% 19% 22% 20%
Totals 100% 100% 100% 99% 100% 100% 100% 101% 100% 101% 100% 100% 101%
Unweighted N (1,491) (309) (279) (591) (312) (1,079) (162) (165) (85) (272) (328) (549) (342)
209

The Economist /YouGov PollApril 26 - 28, 2020 - 1500 US Adult citizens
Registered Primary Voter Party ID Ideology
Total Voters Dem Rep Dem Ind Rep Lib Mod Con
More people living in USthan the Census willreport 59% 66% 70% 65% 61% 57% 61% 66% 57% 60%
The Census count willaccurate 9% 9% 8% 11% 9% 7% 12% 8% 9% 11%
Fewer people living in USthan the Census willreport 11% 10% 9% 12% 11% 11% 10% 9% 11% 12%
Don’t know 21% 15% 12% 12% 19% 25% 17% 17% 23% 17%
Totals 100% 100% 99% 100% 100% 100% 100% 100% 100% 100%
Unweighted N (1,491) (1,215) (563) (334) (533) (583) (375) (448) (449) (453)
210

The Economist /YouGov PollApril 26 - 28, 2020 - 1500 US Adult citizens
66. You Better Off NowAre you better off now than you were four years ago?
Gender Education Income
Total Male Female HS or less Some college College grad Postgrad Under $50K $50-100K $100K or more
Better off now 42% 43% 41% 38% 42% 46% 48% 32% 51% 56%
Better off four years ago 36% 37% 36% 36% 35% 39% 38% 40% 35% 29%
Not sure 22% 20% 23% 26% 23% 15% 14% 28% 14% 15%
Totals 100% 100% 100% 100% 100% 100% 100% 100% 100% 100%
Unweighted N (1,495) (664) (831) (469) (530) (300) (196) (597) (443) (285)
Age Race Region
Total 18-29 30-44 45-64 65+ White Black Hispanic Other Northeast Midwest South West
Better off now 42% 42% 39% 43% 41% 46% 23% 35% 38% 37% 40% 41% 48%
Better off four years ago 36% 28% 35% 40% 41% 34% 49% 37% 32% 38% 40% 36% 32%
Not sure 22% 30% 26% 17% 18% 19% 27% 28% 30% 25% 20% 23% 20%
Totals 100% 100% 100% 100% 100% 99% 99% 100% 100% 100% 100% 100% 100%
Unweighted N (1,495) (310) (278) (594) (313) (1,087) (160) (164) (84) (275) (328) (549) (343)
Registered Primary Voter Party ID Ideology
Total Voters Dem Rep Dem Ind Rep Lib Mod Con
Better off now 42% 46% 31% 71% 28% 39% 63% 27% 39% 63%
Better off four years ago 36% 37% 55% 19% 56% 31% 21% 55% 38% 19%
Not sure 22% 17% 14% 10% 16% 30% 17% 18% 23% 18%
Totals 100% 100% 100% 100% 100% 100% 101% 100% 100% 100%
Unweighted N (1,495) (1,218) (564) (335) (535) (582) (378) (449) (449) (456)
211

The Economist /YouGov PollApril 26 - 28, 2020 - 1500 US Adult citizens
67. Country Better Off NowIs the country better off now than it was four years ago?
Gender Education Income
Total Male Female HS or less Some college College grad Postgrad Under $50K $50-100K $100K or more
Better off now 30% 33% 28% 29% 31% 29% 38% 23% 34% 43%
Better off four years ago 49% 51% 48% 44% 48% 57% 55% 49% 52% 46%
Not sure 21% 16% 25% 27% 21% 15% 7% 28% 14% 11%
Totals 100% 100% 101% 100% 100% 101% 100% 100% 100% 100%
Unweighted N (1,493) (665) (828) (468) (530) (301) (194) (597) (440) (286)
Age Race Region
Total 18-29 30-44 45-64 65+ White Black Hispanic Other Northeast Midwest South West
Better off now 30% 23% 25% 34% 38% 36% 11% 20% 23% 27% 31% 29% 34%
Better off four years ago 49% 49% 50% 50% 47% 47% 60% 45% 62% 46% 52% 49% 49%
Not sure 21% 29% 26% 16% 15% 18% 29% 35% 15% 27% 17% 22% 17%
Totals 100% 101% 101% 100% 100% 101% 100% 100% 100% 100% 100% 100% 100%
Unweighted N (1,493) (311) (278) (592) (312) (1,084) (161) (164) (84) (273) (328) (550) (342)
Registered Primary Voter Party ID Ideology
Total Voters Dem Rep Dem Ind Rep Lib Mod Con
Better off now 30% 35% 10% 72% 9% 26% 63% 7% 25% 62%
Better off four years ago 49% 50% 79% 20% 73% 47% 22% 78% 51% 22%
Not sure 21% 15% 11% 7% 18% 27% 15% 14% 24% 16%
Totals 100% 100% 100% 99% 100% 100% 100% 99% 100% 100%
Unweighted N (1,493) (1,220) (563) (337) (535) (579) (379) (447) (450) (455)
212

The Economist /YouGov PollApril 26 - 28, 2020 - 1500 US Adult citizens
68. Support For Trump PoliciesHow often do you support or oppose President Trump’s policies?
Gender Education Income
Total Male Female HS or less Some college College grad Postgrad Under $50K $50-100K $100K or more
Always support PresidentTrump’s policies 11% 13% 10% 12% 13% 8% 9% 12% 12% 11%
Support PresidentTrump’s policies mostof the time, but opposea few 24% 25% 23% 25% 24% 22% 24% 20% 30% 27%
50/50 - Support oroppose PresidentTrump’s policies abouthalf of the time 13% 13% 13% 16% 12% 14% 8% 14% 14% 14%
Oppose PresidentTrump’s policies mostof the time, but supporta few 23% 24% 21% 18% 21% 30% 29% 23% 22% 26%
Always oppose PresidentTrump’s policies 21% 19% 22% 17% 21% 23% 29% 20% 19% 20%
Not sure 8% 5% 11% 11% 9% 3% 1% 12% 4% 2%
Totals 100% 99% 100% 99% 100% 100% 100% 101% 101% 100%
Unweighted N (1,498) (666) (832) (470) (530) (302) (196) (599) (443) (286)
Age Race Region
Total 18-29 30-44 45-64 65+ White Black Hispanic Other Northeast Midwest South West
Always support PresidentTrump’s policies 11% 9% 7% 12% 19% 14% 2% 9% 6% 10% 11% 10% 15%
continued on the next page . . .
213

The Economist /YouGov PollApril 26 - 28, 2020 - 1500 US Adult citizens
continued from previous pageAge Race Region
Total 18-29 30-44 45-64 65+ White Black Hispanic Other Northeast Midwest South West
Support PresidentTrump’s policies mostof the time, but opposea few 24% 15% 20% 30% 27% 28% 4% 23% 16% 20% 25% 25% 26%
50/50 - Support oroppose PresidentTrump’s policies abouthalf of the time 13% 20% 16% 11% 8% 13% 11% 23% 11% 21% 10% 13% 11%
Oppose PresidentTrump’s policies mostof the time, but supporta few 23% 28% 24% 20% 19% 21% 34% 14% 40% 22% 27% 22% 20%
Always oppose PresidentTrump’s policies 21% 14% 23% 21% 25% 18% 33% 22% 18% 19% 22% 21% 20%
Not sure 8% 13% 10% 6% 3% 6% 17% 9% 9% 8% 6% 9% 8%
Totals 100% 99% 100% 100% 101% 100% 101% 100% 100% 100% 101% 100% 100%
Unweighted N (1,498) (313) (280) (593) (312) (1,087) (161) (165) (85) (275) (329) (551) (343)
Registered Primary Voter Party ID Ideology
Total Voters Dem Rep Dem Ind Rep Lib Mod Con
Always support PresidentTrump’s policies 11% 13% 2% 34% 1% 7% 30% 3% 4% 27%
Support PresidentTrump’s policies mostof the time, but opposea few 24% 26% 5% 52% 7% 22% 48% 5% 19% 47%
continued on the next page . . .
214

The Economist /YouGov PollApril 26 - 28, 2020 - 1500 US Adult citizens
continued from previous pageRegistered Primary Voter Party ID Ideology
Total Voters Dem Rep Dem Ind Rep Lib Mod Con
50/50 - Support oroppose PresidentTrump’s policies abouthalf of the time 13% 10% 7% 5% 10% 18% 10% 7% 22% 10%
Oppose PresidentTrump’s policies mostof the time, but supporta few 23% 24% 38% 6% 33% 26% 5% 35% 27% 7%
Always oppose PresidentTrump’s policies 21% 24% 46% 2% 44% 14% 3% 47% 18% 2%
Not sure 8% 4% 3% 1% 5% 13% 4% 3% 10% 6%
Totals 100% 101% 101% 100% 100% 100% 100% 100% 100% 99%
Unweighted N (1,498) (1,220) (562) (337) (534) (584) (380) (449) (449) (457)
215

The Economist /YouGov PollApril 26 - 28, 2020 - 1500 US Adult citizens
69. Attention To 2020 ElectionHow much attention have you been paying to the 2020 election campaign for president?
Gender Education Income
Total Male Female HS or less Some college College grad Postgrad Under $50K $50-100K $100K or more
A lot 32% 37% 27% 23% 31% 38% 55% 23% 36% 46%
Some 31% 30% 31% 27% 31% 38% 29% 30% 31% 34%
Only a little 25% 24% 27% 32% 26% 16% 15% 29% 25% 16%
None at all 12% 9% 15% 18% 11% 7% 1% 18% 7% 4%
Totals 100% 100% 100% 100% 99% 99% 100% 100% 99% 100%
Unweighted N (1,494) (665) (829) (467) (531) (301) (195) (596) (443) (287)
Age Race Region
Total 18-29 30-44 45-64 65+ White Black Hispanic Other Northeast Midwest South West
A lot 32% 24% 23% 35% 45% 34% 27% 21% 37% 26% 32% 30% 40%
Some 31% 28% 34% 31% 28% 31% 34% 24% 33% 29% 41% 28% 26%
Only a little 25% 33% 29% 23% 17% 23% 27% 38% 22% 30% 17% 30% 22%
None at all 12% 15% 14% 10% 9% 11% 13% 16% 8% 14% 10% 12% 12%
Totals 100% 100% 100% 99% 99% 99% 101% 99% 100% 99% 100% 100% 100%
Unweighted N (1,494) (312) (277) (593) (312) (1,086) (161) (164) (83) (273) (329) (550) (342)
Registered Primary Voter Party ID Ideology
Total Voters Dem Rep Dem Ind Rep Lib Mod Con
A lot 32% 42% 52% 44% 43% 23% 32% 46% 27% 32%
Some 31% 33% 29% 34% 28% 29% 37% 27% 33% 36%
Only a little 25% 20% 16% 17% 22% 29% 23% 22% 28% 23%
None at all 12% 5% 3% 4% 7% 19% 8% 6% 12% 9%
Totals 100% 100% 100% 99% 100% 100% 100% 101% 100% 100%
continued on the next page . . .
216

The Economist /YouGov PollApril 26 - 28, 2020 - 1500 US Adult citizens
continued from previous pageRegistered Primary Voter Party ID Ideology
Total Voters Dem Rep Dem Ind Rep Lib Mod Con
Unweighted N (1,494) (1,219) (564) (337) (535) (579) (380) (449) (451) (456)
217

The Economist /YouGov PollApril 26 - 28, 2020 - 1500 US Adult citizens
70A. Favorability Of Politicians — Joe BidenDo you have a favorable or an unfavorable opinion of the following people?
Gender Education Income
Total Male Female HS or less Some college College grad Postgrad Under $50K $50-100K $100K or more
Very favorable 19% 18% 20% 17% 20% 17% 21% 20% 18% 18%
Somewhat favorable 23% 22% 25% 19% 23% 30% 28% 22% 22% 30%
Somewhat unfavorable 17% 17% 17% 17% 13% 22% 24% 16% 20% 18%
Very unfavorable 30% 36% 25% 31% 35% 25% 25% 27% 33% 32%
Don’t know 11% 8% 13% 16% 9% 6% 2% 15% 7% 2%
Totals 100% 101% 100% 100% 100% 100% 100% 100% 100% 100%
Unweighted N (1,493) (664) (829) (468) (529) (301) (195) (597) (442) (287)
Age Race Region
Total 18-29 30-44 45-64 65+ White Black Hispanic Other Northeast Midwest South West
Very favorable 19% 13% 15% 20% 27% 15% 42% 17% 9% 19% 23% 16% 20%
Somewhat favorable 23% 23% 30% 22% 17% 22% 28% 25% 29% 27% 18% 24% 23%
Somewhat unfavorable 17% 22% 24% 14% 11% 18% 7% 16% 34% 19% 19% 16% 16%
Very unfavorable 30% 24% 21% 34% 42% 36% 12% 21% 18% 22% 31% 32% 33%
Don’t know 11% 18% 11% 10% 3% 9% 10% 21% 10% 13% 9% 11% 8%
Totals 100% 100% 101% 100% 100% 100% 99% 100% 100% 100% 100% 99% 100%
Unweighted N (1,493) (311) (277) (593) (312) (1,085) (162) (163) (83) (274) (328) (551) (340)
Registered Primary Voter Party ID Ideology
Total Voters Dem Rep Dem Ind Rep Lib Mod Con
Very favorable 19% 23% 42% 4% 43% 10% 2% 30% 24% 7%
Somewhat favorable 23% 23% 33% 8% 33% 21% 14% 36% 23% 11%
Somewhat unfavorable 17% 16% 13% 14% 13% 22% 15% 17% 21% 14%
continued on the next page . . .
218

The Economist /YouGov PollApril 26 - 28, 2020 - 1500 US Adult citizens
continued from previous pageRegistered Primary Voter Party ID Ideology
Total Voters Dem Rep Dem Ind Rep Lib Mod Con
Very unfavorable 30% 34% 11% 71% 7% 28% 63% 13% 22% 61%
Don’t know 11% 4% 2% 3% 4% 19% 5% 3% 10% 8%
Totals 100% 100% 101% 100% 100% 100% 99% 99% 100% 101%
Unweighted N (1,493) (1,218) (564) (335) (535) (580) (378) (449) (449) (456)
219

The Economist /YouGov PollApril 26 - 28, 2020 - 1500 US Adult citizens
70B. Favorability Of Politicians — Stacey AbramsDo you have a favorable or an unfavorable opinion of the following people?
Gender Education Income
Total Male Female HS or less Some college College grad Postgrad Under $50K $50-100K $100K or more
Very favorable 14% 13% 15% 10% 14% 16% 27% 12% 16% 17%
Somewhat favorable 13% 16% 11% 9% 11% 23% 18% 11% 15% 20%
Somewhat unfavorable 7% 8% 6% 10% 4% 6% 10% 7% 7% 9%
Very unfavorable 18% 24% 12% 19% 17% 18% 14% 16% 16% 22%
Don’t know 48% 38% 56% 52% 53% 38% 32% 55% 45% 32%
Totals 100% 99% 100% 100% 99% 101% 101% 101% 99% 100%
Unweighted N (1,492) (664) (828) (468) (528) (301) (195) (595) (443) (287)
Age Race Region
Total 18-29 30-44 45-64 65+ White Black Hispanic Other Northeast Midwest South West
Very favorable 14% 11% 13% 13% 21% 14% 25% 9% 10% 10% 13% 14% 19%
Somewhat favorable 13% 14% 18% 10% 13% 13% 18% 9% 21% 16% 14% 13% 11%
Somewhat unfavorable 7% 6% 14% 6% 4% 6% 8% 13% 11% 6% 7% 8% 8%
Very unfavorable 18% 11% 7% 22% 28% 19% 6% 19% 16% 13% 15% 20% 20%
Don’t know 48% 58% 49% 48% 35% 48% 43% 50% 42% 54% 52% 45% 41%
Totals 100% 100% 101% 99% 101% 100% 100% 100% 100% 99% 101% 100% 99%
Unweighted N (1,492) (310) (277) (592) (313) (1,085) (162) (162) (83) (274) (327) (551) (340)
Registered Primary Voter Party ID Ideology
Total Voters Dem Rep Dem Ind Rep Lib Mod Con
Very favorable 14% 18% 35% 3% 33% 7% 2% 30% 14% 3%
Somewhat favorable 13% 15% 25% 6% 22% 11% 7% 22% 14% 6%
Somewhat unfavorable 7% 7% 5% 9% 5% 8% 9% 7% 8% 7%
continued on the next page . . .
220

The Economist /YouGov PollApril 26 - 28, 2020 - 1500 US Adult citizens
continued from previous pageRegistered Primary Voter Party ID Ideology
Total Voters Dem Rep Dem Ind Rep Lib Mod Con
Very unfavorable 18% 21% 4% 47% 4% 16% 37% 5% 12% 37%
Don’t know 48% 39% 31% 36% 36% 58% 46% 37% 51% 47%
Totals 100% 100% 100% 101% 100% 100% 101% 101% 99% 100%
Unweighted N (1,492) (1,218) (564) (336) (535) (578) (379) (449) (449) (457)
221

The Economist /YouGov PollApril 26 - 28, 2020 - 1500 US Adult citizens
70C. Favorability Of Politicians — Tammy BaldwinDo you have a favorable or an unfavorable opinion of the following people?
Gender Education Income
Total Male Female HS or less Some college College grad Postgrad Under $50K $50-100K $100K or more
Very favorable 6% 6% 5% 3% 4% 9% 16% 4% 7% 10%
Somewhat favorable 10% 12% 8% 9% 6% 15% 14% 9% 10% 15%
Somewhat unfavorable 7% 9% 6% 8% 6% 7% 9% 6% 7% 12%
Very unfavorable 9% 12% 7% 12% 11% 3% 6% 8% 8% 10%
Don’t know 68% 60% 74% 69% 72% 65% 55% 73% 68% 52%
Totals 100% 99% 100% 101% 99% 99% 100% 100% 100% 99%
Unweighted N (1,490) (664) (826) (466) (528) (301) (195) (594) (442) (287)
Age Race Region
Total 18-29 30-44 45-64 65+ White Black Hispanic Other Northeast Midwest South West
Very favorable 6% 7% 4% 5% 9% 6% 5% 5% 5% 5% 10% 4% 7%
Somewhat favorable 10% 9% 16% 8% 8% 9% 17% 8% 11% 7% 10% 10% 12%
Somewhat unfavorable 7% 7% 10% 7% 5% 7% 3% 8% 14% 9% 5% 7% 8%
Very unfavorable 9% 8% 5% 11% 13% 10% 4% 13% 12% 7% 10% 10% 9%
Don’t know 68% 70% 65% 70% 65% 68% 71% 67% 58% 72% 66% 69% 63%
Totals 100% 101% 100% 101% 100% 100% 100% 101% 100% 100% 101% 100% 99%
Unweighted N (1,490) (308) (277) (592) (313) (1,086) (162) (159) (83) (274) (328) (549) (339)
Registered Primary Voter Party ID Ideology
Total Voters Dem Rep Dem Ind Rep Lib Mod Con
Very favorable 6% 8% 14% 2% 13% 3% 1% 13% 6% 2%
Somewhat favorable 10% 11% 19% 4% 17% 8% 4% 16% 11% 5%
Somewhat unfavorable 7% 8% 4% 14% 5% 7% 11% 6% 7% 8%
continued on the next page . . .
222

The Economist /YouGov PollApril 26 - 28, 2020 - 1500 US Adult citizens
continued from previous pageRegistered Primary Voter Party ID Ideology
Total Voters Dem Rep Dem Ind Rep Lib Mod Con
Very unfavorable 9% 9% 3% 19% 3% 9% 19% 4% 6% 18%
Don’t know 68% 64% 60% 61% 62% 74% 64% 61% 70% 67%
Totals 100% 100% 100% 100% 100% 101% 99% 100% 100% 100%
Unweighted N (1,490) (1,215) (563) (335) (534) (577) (379) (446) (448) (457)
223
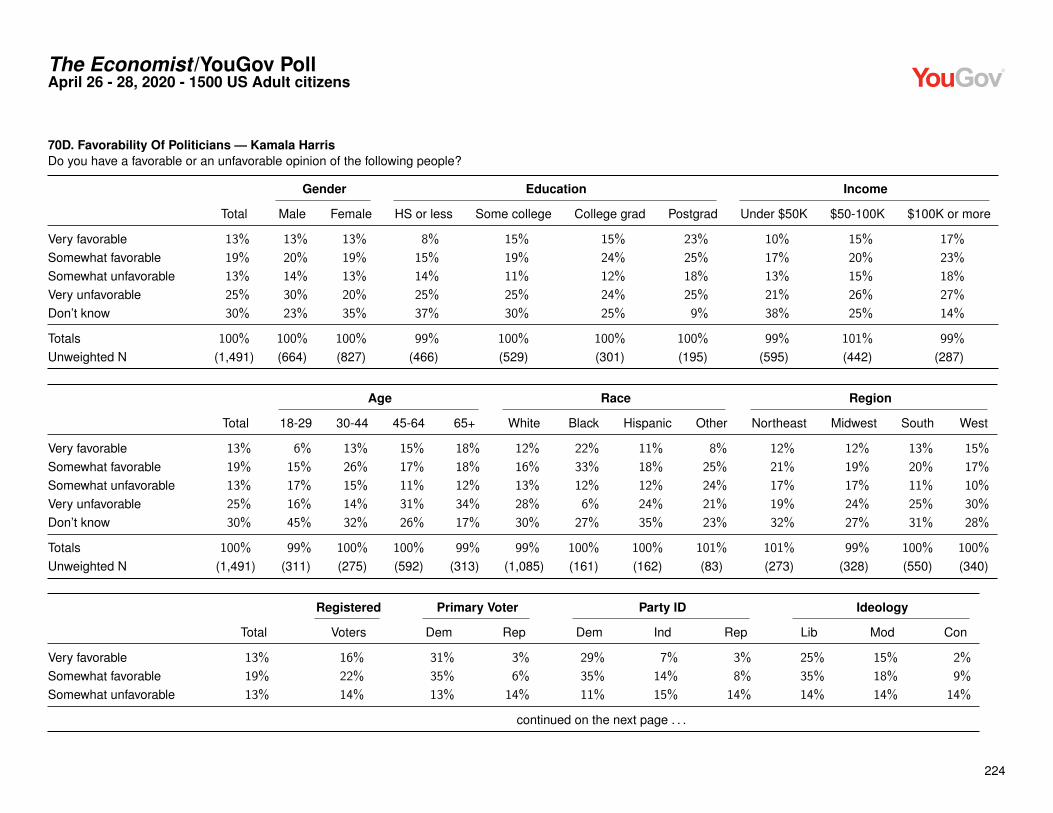
The Economist /YouGov PollApril 26 - 28, 2020 - 1500 US Adult citizens
70D. Favorability Of Politicians — Kamala HarrisDo you have a favorable or an unfavorable opinion of the following people?
Gender Education Income
Total Male Female HS or less Some college College grad Postgrad Under $50K $50-100K $100K or more
Very favorable 13% 13% 13% 8% 15% 15% 23% 10% 15% 17%
Somewhat favorable 19% 20% 19% 15% 19% 24% 25% 17% 20% 23%
Somewhat unfavorable 13% 14% 13% 14% 11% 12% 18% 13% 15% 18%
Very unfavorable 25% 30% 20% 25% 25% 24% 25% 21% 26% 27%
Don’t know 30% 23% 35% 37% 30% 25% 9% 38% 25% 14%
Totals 100% 100% 100% 99% 100% 100% 100% 99% 101% 99%
Unweighted N (1,491) (664) (827) (466) (529) (301) (195) (595) (442) (287)
Age Race Region
Total 18-29 30-44 45-64 65+ White Black Hispanic Other Northeast Midwest South West
Very favorable 13% 6% 13% 15% 18% 12% 22% 11% 8% 12% 12% 13% 15%
Somewhat favorable 19% 15% 26% 17% 18% 16% 33% 18% 25% 21% 19% 20% 17%
Somewhat unfavorable 13% 17% 15% 11% 12% 13% 12% 12% 24% 17% 17% 11% 10%
Very unfavorable 25% 16% 14% 31% 34% 28% 6% 24% 21% 19% 24% 25% 30%
Don’t know 30% 45% 32% 26% 17% 30% 27% 35% 23% 32% 27% 31% 28%
Totals 100% 99% 100% 100% 99% 99% 100% 100% 101% 101% 99% 100% 100%
Unweighted N (1,491) (311) (275) (592) (313) (1,085) (161) (162) (83) (273) (328) (550) (340)
Registered Primary Voter Party ID Ideology
Total Voters Dem Rep Dem Ind Rep Lib Mod Con
Very favorable 13% 16% 31% 3% 29% 7% 3% 25% 15% 2%
Somewhat favorable 19% 22% 35% 6% 35% 14% 8% 35% 18% 9%
Somewhat unfavorable 13% 14% 13% 14% 11% 15% 14% 14% 14% 14%
continued on the next page . . .
224

The Economist /YouGov PollApril 26 - 28, 2020 - 1500 US Adult citizens
continued from previous pageRegistered Primary Voter Party ID Ideology
Total Voters Dem Rep Dem Ind Rep Lib Mod Con
Very unfavorable 25% 30% 8% 63% 5% 23% 51% 7% 17% 53%
Don’t know 30% 18% 14% 14% 20% 41% 24% 19% 36% 22%
Totals 100% 100% 101% 100% 100% 100% 100% 100% 100% 100%
Unweighted N (1,491) (1,217) (564) (334) (534) (578) (379) (448) (449) (456)
225

The Economist /YouGov PollApril 26 - 28, 2020 - 1500 US Adult citizens
70E. Favorability Of Politicians — Amy KlobucharDo you have a favorable or an unfavorable opinion of the following people?
Gender Education Income
Total Male Female HS or less Some college College grad Postgrad Under $50K $50-100K $100K or more
Very favorable 11% 11% 11% 8% 11% 12% 17% 8% 13% 14%
Somewhat favorable 22% 22% 22% 17% 19% 33% 35% 19% 23% 35%
Somewhat unfavorable 15% 17% 13% 16% 13% 14% 18% 13% 17% 18%
Very unfavorable 16% 21% 12% 18% 18% 13% 12% 14% 17% 15%
Don’t know 36% 28% 43% 41% 40% 28% 18% 45% 30% 18%
Totals 100% 99% 101% 100% 101% 100% 100% 99% 100% 100%
Unweighted N (1,493) (665) (828) (468) (529) (301) (195) (597) (442) (287)
Age Race Region
Total 18-29 30-44 45-64 65+ White Black Hispanic Other Northeast Midwest South West
Very favorable 11% 7% 6% 11% 19% 11% 12% 7% 8% 9% 10% 10% 15%
Somewhat favorable 22% 22% 26% 19% 24% 22% 30% 15% 28% 26% 23% 20% 23%
Somewhat unfavorable 15% 15% 16% 13% 16% 16% 9% 14% 16% 15% 15% 15% 15%
Very unfavorable 16% 11% 10% 20% 22% 18% 8% 16% 18% 12% 18% 17% 17%
Don’t know 36% 45% 41% 36% 19% 33% 41% 47% 30% 39% 34% 38% 31%
Totals 100% 100% 99% 99% 100% 100% 100% 99% 100% 101% 100% 100% 101%
Unweighted N (1,493) (311) (277) (592) (313) (1,086) (162) (162) (83) (274) (328) (551) (340)
Registered Primary Voter Party ID Ideology
Total Voters Dem Rep Dem Ind Rep Lib Mod Con
Very favorable 11% 15% 27% 3% 22% 7% 3% 18% 15% 2%
Somewhat favorable 22% 26% 38% 11% 36% 18% 11% 37% 24% 11%
Somewhat unfavorable 15% 17% 13% 25% 9% 14% 23% 14% 9% 23%
continued on the next page . . .
226

The Economist /YouGov PollApril 26 - 28, 2020 - 1500 US Adult citizens
continued from previous pageRegistered Primary Voter Party ID Ideology
Total Voters Dem Rep Dem Ind Rep Lib Mod Con
Very unfavorable 16% 18% 6% 40% 5% 15% 32% 7% 11% 33%
Don’t know 36% 25% 17% 20% 28% 45% 30% 23% 41% 31%
Totals 100% 101% 101% 99% 100% 99% 99% 99% 100% 100%
Unweighted N (1,493) (1,218) (564) (335) (535) (579) (379) (448) (449) (457)
227

The Economist /YouGov PollApril 26 - 28, 2020 - 1500 US Adult citizens
70F. Favorability Of Politicians — Barack ObamaDo you have a favorable or an unfavorable opinion of the following people?
Gender Education Income
Total Male Female HS or less Some college College grad Postgrad Under $50K $50-100K $100K or more
Very favorable 37% 32% 42% 29% 38% 45% 47% 36% 38% 40%
Somewhat favorable 15% 16% 15% 16% 15% 17% 14% 16% 15% 17%
Somewhat unfavorable 10% 11% 10% 10% 12% 8% 9% 11% 9% 10%
Very unfavorable 30% 36% 25% 34% 29% 26% 29% 28% 33% 33%
Don’t know 7% 6% 8% 11% 6% 3% 1% 10% 4% 1%
Totals 99% 101% 100% 100% 100% 99% 100% 101% 99% 101%
Unweighted N (1,493) (664) (829) (468) (529) (301) (195) (596) (443) (287)
Age Race Region
Total 18-29 30-44 45-64 65+ White Black Hispanic Other Northeast Midwest South West
Very favorable 37% 40% 34% 35% 41% 31% 73% 29% 46% 42% 43% 35% 32%
Somewhat favorable 15% 18% 25% 13% 6% 15% 8% 22% 18% 17% 10% 16% 17%
Somewhat unfavorable 10% 12% 13% 10% 7% 11% 2% 14% 8% 9% 11% 10% 10%
Very unfavorable 30% 20% 21% 35% 44% 35% 13% 21% 25% 26% 28% 32% 33%
Don’t know 7% 11% 8% 8% 2% 7% 5% 13% 3% 6% 7% 7% 8%
Totals 99% 101% 101% 101% 100% 99% 101% 99% 100% 100% 99% 100% 100%
Unweighted N (1,493) (311) (277) (592) (313) (1,086) (162) (162) (83) (274) (327) (551) (341)
Registered Primary Voter Party ID Ideology
Total Voters Dem Rep Dem Ind Rep Lib Mod Con
Very favorable 37% 42% 76% 5% 77% 25% 6% 71% 40% 9%
Somewhat favorable 15% 13% 13% 10% 12% 22% 9% 14% 22% 9%
Somewhat unfavorable 10% 9% 4% 10% 3% 12% 16% 5% 12% 15%
continued on the next page . . .
228

The Economist /YouGov PollApril 26 - 28, 2020 - 1500 US Adult citizens
continued from previous pageRegistered Primary Voter Party ID Ideology
Total Voters Dem Rep Dem Ind Rep Lib Mod Con
Very unfavorable 30% 33% 6% 74% 4% 28% 65% 7% 22% 63%
Don’t know 7% 3% 1% 1% 4% 12% 3% 4% 4% 6%
Totals 99% 100% 100% 100% 100% 99% 99% 101% 100% 102%
Unweighted N (1,493) (1,218) (564) (336) (535) (579) (379) (449) (449) (457)
229

The Economist /YouGov PollApril 26 - 28, 2020 - 1500 US Adult citizens
70G. Favorability Of Politicians — Michelle ObamaDo you have a favorable or an unfavorable opinion of the following people?
Gender Education Income
Total Male Female HS or less Some college College grad Postgrad Under $50K $50-100K $100K or more
Very favorable 38% 32% 43% 30% 38% 45% 52% 37% 37% 43%
Somewhat favorable 17% 17% 17% 17% 16% 21% 14% 18% 18% 19%
Somewhat unfavorable 10% 12% 9% 13% 10% 6% 10% 11% 11% 9%
Very unfavorable 26% 31% 22% 29% 26% 24% 22% 23% 29% 27%
Don’t know 8% 8% 8% 11% 10% 3% 2% 11% 4% 2%
Totals 99% 100% 99% 100% 100% 99% 100% 100% 99% 100%
Unweighted N (1,491) (664) (827) (468) (529) (300) (194) (597) (441) (287)
Age Race Region
Total 18-29 30-44 45-64 65+ White Black Hispanic Other Northeast Midwest South West
Very favorable 38% 44% 34% 35% 40% 33% 71% 31% 37% 42% 38% 37% 35%
Somewhat favorable 17% 23% 23% 16% 8% 17% 7% 29% 26% 24% 16% 16% 15%
Somewhat unfavorable 10% 8% 14% 11% 8% 11% 6% 11% 5% 10% 9% 10% 12%
Very unfavorable 26% 16% 18% 31% 40% 31% 8% 19% 25% 19% 27% 28% 30%
Don’t know 8% 10% 12% 8% 3% 8% 9% 10% 7% 6% 10% 9% 8%
Totals 99% 101% 101% 101% 99% 100% 101% 100% 100% 101% 100% 100% 100%
Unweighted N (1,491) (311) (277) (591) (312) (1,084) (162) (162) (83) (274) (328) (550) (339)
Registered Primary Voter Party ID Ideology
Total Voters Dem Rep Dem Ind Rep Lib Mod Con
Very favorable 38% 43% 76% 8% 74% 28% 7% 71% 38% 12%
Somewhat favorable 17% 15% 13% 11% 14% 22% 14% 14% 24% 12%
Somewhat unfavorable 10% 9% 4% 13% 3% 14% 13% 5% 12% 13%
continued on the next page . . .
230

The Economist /YouGov PollApril 26 - 28, 2020 - 1500 US Adult citizens
continued from previous pageRegistered Primary Voter Party ID Ideology
Total Voters Dem Rep Dem Ind Rep Lib Mod Con
Very unfavorable 26% 29% 6% 67% 5% 22% 59% 6% 18% 56%
Don’t know 8% 4% 2% 2% 4% 13% 6% 4% 8% 6%
Totals 99% 100% 101% 101% 100% 99% 99% 100% 100% 99%
Unweighted N (1,491) (1,216) (562) (335) (533) (579) (379) (447) (448) (457)
231

The Economist /YouGov PollApril 26 - 28, 2020 - 1500 US Adult citizens
70H. Favorability Of Politicians — Elizabeth WarrenDo you have a favorable or an unfavorable opinion of the following people?
Gender Education Income
Total Male Female HS or less Some college College grad Postgrad Under $50K $50-100K $100K or more
Very favorable 18% 17% 19% 9% 18% 29% 31% 13% 22% 27%
Somewhat favorable 21% 19% 22% 16% 22% 25% 29% 19% 22% 25%
Somewhat unfavorable 13% 15% 11% 19% 10% 8% 9% 16% 14% 8%
Very unfavorable 30% 35% 25% 29% 32% 28% 27% 26% 30% 35%
Don’t know 18% 14% 23% 27% 18% 10% 5% 26% 13% 5%
Totals 100% 100% 100% 100% 100% 100% 101% 100% 101% 100%
Unweighted N (1,494) (665) (829) (468) (530) (301) (195) (597) (443) (287)
Age Race Region
Total 18-29 30-44 45-64 65+ White Black Hispanic Other Northeast Midwest South West
Very favorable 18% 17% 19% 18% 19% 18% 25% 13% 18% 22% 15% 17% 19%
Somewhat favorable 21% 19% 28% 18% 20% 18% 33% 17% 35% 24% 24% 19% 18%
Somewhat unfavorable 13% 16% 16% 11% 10% 13% 13% 12% 8% 15% 13% 14% 8%
Very unfavorable 30% 20% 18% 36% 42% 34% 10% 25% 25% 20% 30% 31% 35%
Don’t know 18% 28% 20% 18% 9% 16% 19% 33% 15% 18% 18% 19% 19%
Totals 100% 100% 101% 101% 100% 99% 100% 100% 101% 99% 100% 100% 99%
Unweighted N (1,494) (311) (277) (593) (313) (1,086) (162) (163) (83) (274) (328) (551) (341)
Registered Primary Voter Party ID Ideology
Total Voters Dem Rep Dem Ind Rep Lib Mod Con
Very favorable 18% 23% 42% 4% 38% 11% 5% 40% 18% 3%
Somewhat favorable 21% 23% 34% 7% 34% 18% 9% 35% 24% 8%
Somewhat unfavorable 13% 11% 9% 11% 7% 17% 14% 9% 14% 13%
continued on the next page . . .
232

The Economist /YouGov PollApril 26 - 28, 2020 - 1500 US Adult citizens
continued from previous pageRegistered Primary Voter Party ID Ideology
Total Voters Dem Rep Dem Ind Rep Lib Mod Con
Very unfavorable 30% 35% 7% 72% 5% 28% 62% 5% 24% 62%
Don’t know 18% 9% 9% 6% 15% 26% 11% 10% 20% 13%
Totals 100% 101% 101% 100% 99% 100% 101% 99% 100% 99%
Unweighted N (1,494) (1,219) (564) (336) (535) (580) (379) (449) (449) (457)
233

The Economist /YouGov PollApril 26 - 28, 2020 - 1500 US Adult citizens
71. Vote In 2020 Primary Or CaucusWill you vote or have you already voted in the Democratic or Republican Presidential primary or caucus in your state in 2020?Asked of registered voters
Gender Education Income
Total Male Female HS or less Some college College grad Postgrad Under $50K $50-100K $100K or more
Democraticprimary/caucus 45% 41% 48% 37% 41% 52% 56% 44% 45% 47%
Republicanprimary/caucus 29% 32% 26% 32% 29% 26% 23% 27% 31% 30%
Neither one 20% 22% 18% 21% 21% 18% 16% 20% 20% 16%
Not sure 7% 5% 9% 10% 9% 4% 5% 9% 3% 7%
Totals 101% 100% 101% 100% 100% 100% 100% 100% 99% 100%
Unweighted N (1,218) (569) (649) (309) (429) (287) (193) (418) (393) (274)
Age Race Region
Total 18-29 30-44 45-64 65+ White Black Hispanic Other Northeast Midwest South West
Democraticprimary/caucus 45% 53% 50% 39% 44% 39% 73% 43% 56% 42% 50% 44% 43%
Republicanprimary/caucus 29% 18% 24% 33% 32% 34% 4% 24% 22% 24% 30% 27% 33%
Neither one 20% 17% 13% 24% 20% 21% 9% 20% 20% 22% 15% 22% 18%
Not sure 7% 11% 14% 4% 4% 6% 14% 13% 2% 11% 5% 7% 6%
Totals 101% 99% 101% 100% 100% 100% 100% 100% 100% 99% 100% 100% 100%
Unweighted N (1,218) (239) (208) (505) (266) (880) (134) (134) (70) (221) (273) (435) (289)
234

The Economist /YouGov PollApril 26 - 28, 2020 - 1500 US Adult citizens
Registered Primary Voter Party ID Ideology
Total Voters Dem Rep Dem Ind Rep Lib Mod Con
Democraticprimary/caucus 45% 45% 100% 0% 87% 31% 5% 80% 47% 11%
Republicanprimary/caucus 29% 29% 0% 100% 1% 18% 75% 5% 16% 63%
Neither one 20% 20% 0% 0% 7% 39% 16% 9% 28% 21%
Not sure 7% 7% 0% 0% 5% 13% 5% 6% 9% 6%
Totals 101% 101% 100% 100% 100% 101% 101% 100% 100% 101%
Unweighted N (1,218) (1,218) (564) (337) (487) (402) (329) (411) (364) (391)
235

The Economist /YouGov PollApril 26 - 28, 2020 - 1500 US Adult citizens
72. Democratic Nominee PreferenceBetween Joe Biden and Bernie Sanders, who would you have preferred to be the Democratic nominee?Asked of those who will vote or have already voted in the Democratic presidential primary in their state
Gender Education Income
Total Male Female HS or less Some college College grad Postgrad Under $50K $50-100K $100K or more
Joe Biden 59% 60% 58% 63% 69% 49% 54% 59% 57% 56%
Bernie Sanders 32% 32% 32% 31% 25% 37% 36% 33% 36% 31%
Not sure 9% 8% 10% 6% 6% 14% 10% 8% 7% 13%
Totals 100% 100% 100% 100% 100% 100% 100% 100% 100% 100%
Unweighted N (563) (234) (329) (111) (188) (153) (111) (187) (190) (132)
Age Race Region
Total 18-29 30-44 45-64 65+ White Black Hispanic Other Northeast Midwest South West
Joe Biden 59% 33% 48% 66% 82% 57% 71% 65% 33% 58% 58% 60% 59%
Bernie Sanders 32% 57% 40% 26% 11% 33% 21% 34% 48% 32% 31% 32% 33%
Not sure 9% 10% 12% 9% 7% 10% 8% 1% 19% 10% 11% 8% 7%
Totals 100% 100% 100% 101% 100% 100% 100% 100% 100% 100% 100% 100% 99%
Unweighted N (563) (123) (107) (219) (114) (371) (97) (58) (37) (98) (134) (194) (137)
Registered Primary Voter Party ID Ideology
Total Voters Dem Rep Dem Ind Rep Lib Mod Con
Joe Biden 59% 59% 59% ∗ 66% 39% ∗ 53% 68% 52%
Bernie Sanders 32% 32% 32% ∗ 26% 50% ∗ 41% 19% 31%
Not sure 9% 9% 9% ∗ 8% 11% ∗ 6% 13% 17%
Totals 100% 100% 100% ∗ 100% 100% ∗ 100% 100% 100%
Unweighted N (563) (563) (562) (0) (424) (125) (14) (333) (173) (39)
236

The Economist /YouGov PollApril 26 - 28, 2020 - 1500 US Adult citizens
73. Effect Of Sanders EndorsementDoes Bernie Sanders’ endorsement make you more or less likely to vote for Joe Biden?
Gender Education Income
Total Male Female HS or less Some college College grad Postgrad Under $50K $50-100K $100K or more
More likely 12% 13% 12% 14% 11% 12% 12% 14% 7% 15%
No difference 61% 62% 60% 56% 59% 70% 73% 54% 73% 66%
Less likely 15% 16% 14% 15% 19% 12% 10% 17% 13% 14%
Not sure 11% 9% 13% 16% 11% 6% 4% 15% 6% 4%
Totals 99% 100% 99% 101% 100% 100% 99% 100% 99% 99%
Unweighted N (1,498) (666) (832) (470) (531) (302) (195) (599) (443) (286)
Age Race Region
Total 18-29 30-44 45-64 65+ White Black Hispanic Other Northeast Midwest South West
More likely 12% 23% 12% 9% 8% 8% 27% 22% 18% 12% 13% 12% 12%
No difference 61% 47% 66% 65% 65% 66% 49% 49% 52% 64% 64% 61% 58%
Less likely 15% 13% 7% 18% 23% 17% 8% 13% 12% 13% 15% 14% 20%
Not sure 11% 17% 16% 9% 4% 9% 15% 16% 19% 11% 8% 14% 10%
Totals 99% 100% 101% 101% 100% 100% 99% 100% 101% 100% 100% 101% 100%
Unweighted N (1,498) (313) (279) (594) (312) (1,087) (161) (165) (85) (274) (330) (551) (343)
Registered Primary Voter Party ID Ideology
Total Voters Dem Rep Dem Ind Rep Lib Mod Con
More likely 12% 13% 20% 5% 24% 9% 5% 21% 13% 6%
No difference 61% 66% 73% 62% 64% 59% 62% 67% 64% 61%
Less likely 15% 15% 3% 32% 3% 16% 28% 4% 13% 27%
Not sure 11% 6% 4% 2% 9% 16% 6% 8% 11% 7%
Totals 99% 100% 100% 101% 100% 100% 101% 100% 101% 101%
continued on the next page . . .
237

The Economist /YouGov PollApril 26 - 28, 2020 - 1500 US Adult citizens
continued from previous pageRegistered Primary Voter Party ID Ideology
Total Voters Dem Rep Dem Ind Rep Lib Mod Con
Unweighted N (1,498) (1,221) (563) (337) (535) (583) (380) (449) (450) (457)
238

The Economist /YouGov PollApril 26 - 28, 2020 - 1500 US Adult citizens
74. Sanders’s Role In GeneralDo you think Bernie Sanders should help Joe Biden win the general election in November?
Gender Education Income
Total Male Female HS or less Some college College grad Postgrad Under $50K $50-100K $100K or more
Should help Joe Bidenwin 32% 31% 33% 22% 34% 43% 42% 29% 32% 40%
Should help Joe Bidenwin only on certainconditions 12% 13% 12% 15% 9% 12% 13% 13% 12% 11%
Should not help JoeBiden win no matterwhat 23% 26% 21% 26% 23% 19% 22% 20% 26% 27%
Not sure 32% 30% 35% 37% 34% 26% 22% 37% 29% 21%
Totals 99% 100% 101% 100% 100% 100% 99% 99% 99% 99%
Unweighted N (1,495) (664) (831) (470) (529) (300) (196) (597) (442) (287)
Age Race Region
Total 18-29 30-44 45-64 65+ White Black Hispanic Other Northeast Midwest South West
Should help Joe Bidenwin 32% 26% 29% 34% 38% 29% 53% 28% 30% 36% 36% 27% 33%
Should help Joe Bidenwin only on certainconditions 12% 19% 19% 6% 9% 11% 11% 19% 23% 16% 12% 12% 11%
Should not help JoeBiden win no matterwhat 23% 16% 17% 26% 34% 27% 12% 16% 16% 18% 25% 24% 26%
Not sure 32% 39% 35% 34% 19% 33% 23% 37% 31% 31% 28% 37% 30%
Totals 99% 100% 100% 100% 100% 100% 99% 100% 100% 101% 101% 100% 100%
Unweighted N (1,495) (313) (280) (591) (311) (1,083) (162) (165) (85) (274) (329) (550) (342)
239

The Economist /YouGov PollApril 26 - 28, 2020 - 1500 US Adult citizens
Registered Primary Voter Party ID Ideology
Total Voters Dem Rep Dem Ind Rep Lib Mod Con
Should help Joe Bidenwin 32% 39% 69% 9% 64% 21% 8% 58% 35% 12%
Should help Joe Bidenwin only on certainconditions 12% 11% 12% 9% 11% 15% 10% 15% 11% 11%
Should not help JoeBiden win no matterwhat 23% 25% 8% 54% 7% 21% 47% 11% 17% 43%
Not sure 32% 24% 12% 28% 18% 42% 36% 16% 37% 34%
Totals 99% 99% 101% 100% 100% 99% 101% 100% 100% 100%
Unweighted N (1,495) (1,217) (564) (332) (536) (580) (379) (449) (451) (452)
240

The Economist /YouGov PollApril 26 - 28, 2020 - 1500 US Adult citizens
75. Effect Of Obama EndorsementDoes Barack Obama’s endorsement make you more or less likely to vote for Joe Biden?
Gender Education Income
Total Male Female HS or less Some college College grad Postgrad Under $50K $50-100K $100K or more
More likely 19% 19% 19% 17% 18% 24% 16% 19% 15% 20%
No difference 50% 50% 50% 43% 50% 54% 65% 44% 59% 56%
Less likely 22% 25% 19% 23% 23% 18% 18% 23% 21% 22%
Not sure 10% 7% 12% 16% 9% 4% 0% 14% 4% 3%
Totals 101% 101% 100% 99% 100% 100% 99% 100% 99% 101%
Unweighted N (1,492) (664) (828) (468) (528) (300) (196) (598) (440) (285)
Age Race Region
Total 18-29 30-44 45-64 65+ White Black Hispanic Other Northeast Midwest South West
More likely 19% 24% 19% 17% 15% 13% 41% 23% 26% 20% 17% 20% 16%
No difference 50% 44% 58% 49% 47% 53% 39% 42% 43% 52% 55% 49% 45%
Less likely 22% 15% 12% 25% 34% 25% 8% 15% 22% 18% 21% 20% 28%
Not sure 10% 18% 11% 9% 3% 8% 12% 20% 9% 10% 7% 11% 11%
Totals 101% 101% 100% 100% 99% 99% 100% 100% 100% 100% 100% 100% 100%
Unweighted N (1,492) (312) (277) (592) (311) (1,082) (162) (164) (84) (271) (330) (549) (342)
Registered Primary Voter Party ID Ideology
Total Voters Dem Rep Dem Ind Rep Lib Mod Con
More likely 19% 19% 33% 5% 39% 12% 4% 30% 22% 6%
No difference 50% 55% 61% 44% 51% 50% 48% 58% 52% 47%
Less likely 22% 23% 5% 50% 5% 20% 44% 7% 17% 40%
Not sure 10% 4% 1% 2% 5% 18% 4% 5% 9% 7%
Totals 101% 101% 100% 101% 100% 100% 100% 100% 100% 100%
continued on the next page . . .
241

The Economist /YouGov PollApril 26 - 28, 2020 - 1500 US Adult citizens
continued from previous pageRegistered Primary Voter Party ID Ideology
Total Voters Dem Rep Dem Ind Rep Lib Mod Con
Unweighted N (1,492) (1,214) (562) (333) (535) (582) (375) (447) (450) (453)
242

The Economist /YouGov PollApril 26 - 28, 2020 - 1500 US Adult citizens
76. Effect Of Warren EndorsementDoes Elizabeth Warren’s endorsement make you more or less likely to vote for Joe Biden?
Gender Education Income
Total Male Female HS or less Some college College grad Postgrad Under $50K $50-100K $100K or more
More likely 10% 9% 12% 6% 11% 15% 16% 10% 9% 13%
No difference 55% 58% 54% 53% 52% 60% 67% 51% 63% 58%
Less likely 22% 25% 19% 23% 25% 20% 15% 24% 21% 23%
Not sure 12% 8% 15% 18% 12% 5% 2% 15% 7% 5%
Totals 99% 100% 100% 100% 100% 100% 100% 100% 100% 99%
Unweighted N (1,490) (663) (827) (467) (527) (300) (196) (596) (440) (286)
Age Race Region
Total 18-29 30-44 45-64 65+ White Black Hispanic Other Northeast Midwest South West
More likely 10% 13% 8% 10% 11% 8% 21% 14% 11% 11% 8% 11% 10%
No difference 55% 50% 65% 53% 55% 57% 58% 47% 49% 57% 60% 54% 52%
Less likely 22% 16% 13% 28% 30% 26% 8% 18% 18% 20% 22% 22% 25%
Not sure 12% 21% 14% 9% 4% 10% 13% 20% 22% 12% 9% 13% 13%
Totals 99% 100% 100% 100% 100% 101% 100% 99% 100% 100% 99% 100% 100%
Unweighted N (1,490) (311) (276) (592) (311) (1,081) (161) (164) (84) (272) (329) (548) (341)
Registered Primary Voter Party ID Ideology
Total Voters Dem Rep Dem Ind Rep Lib Mod Con
More likely 10% 13% 21% 4% 23% 5% 3% 19% 11% 3%
No difference 55% 59% 70% 44% 63% 57% 45% 66% 61% 45%
Less likely 22% 23% 6% 50% 6% 19% 47% 8% 16% 44%
Not sure 12% 5% 3% 3% 8% 19% 6% 7% 11% 7%
Totals 99% 100% 100% 101% 100% 100% 101% 100% 99% 99%
continued on the next page . . .
243

The Economist /YouGov PollApril 26 - 28, 2020 - 1500 US Adult citizens
continued from previous pageRegistered Primary Voter Party ID Ideology
Total Voters Dem Rep Dem Ind Rep Lib Mod Con
Unweighted N (1,490) (1,216) (562) (334) (534) (580) (376) (448) (450) (452)
244
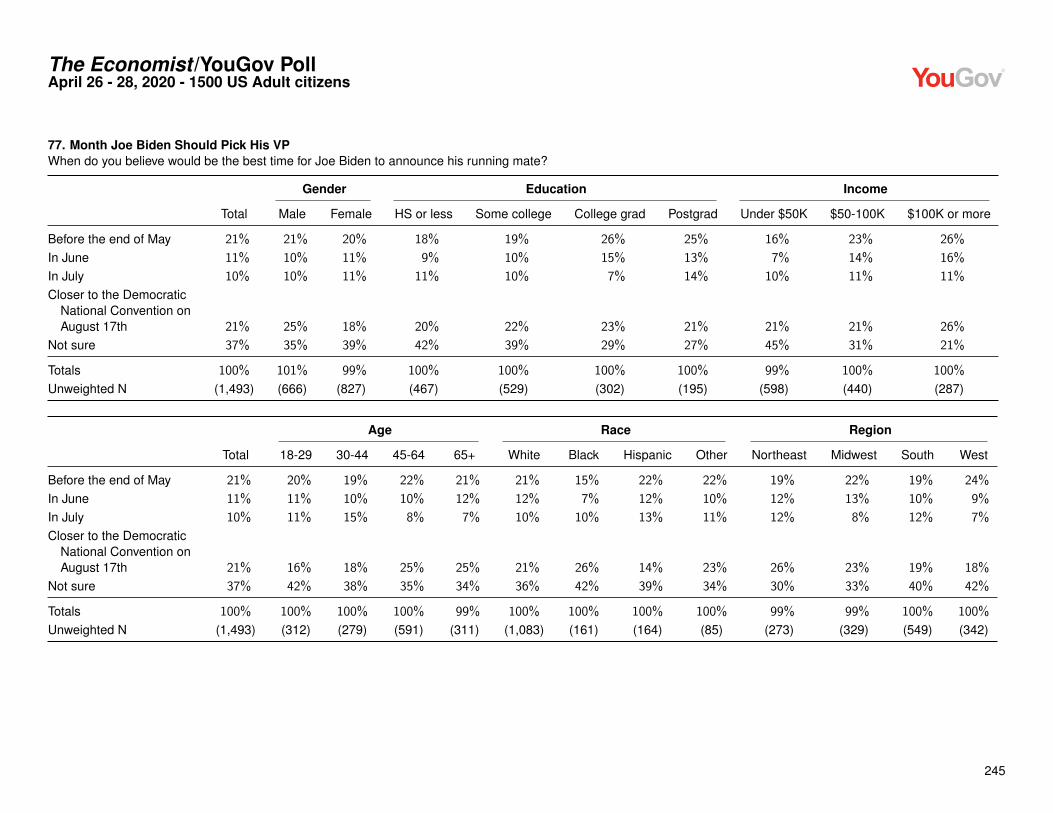
The Economist /YouGov PollApril 26 - 28, 2020 - 1500 US Adult citizens
77. Month Joe Biden Should Pick His VPWhen do you believe would be the best time for Joe Biden to announce his running mate?
Gender Education Income
Total Male Female HS or less Some college College grad Postgrad Under $50K $50-100K $100K or more
Before the end of May 21% 21% 20% 18% 19% 26% 25% 16% 23% 26%
In June 11% 10% 11% 9% 10% 15% 13% 7% 14% 16%
In July 10% 10% 11% 11% 10% 7% 14% 10% 11% 11%
Closer to the DemocraticNational Convention onAugust 17th 21% 25% 18% 20% 22% 23% 21% 21% 21% 26%
Not sure 37% 35% 39% 42% 39% 29% 27% 45% 31% 21%
Totals 100% 101% 99% 100% 100% 100% 100% 99% 100% 100%
Unweighted N (1,493) (666) (827) (467) (529) (302) (195) (598) (440) (287)
Age Race Region
Total 18-29 30-44 45-64 65+ White Black Hispanic Other Northeast Midwest South West
Before the end of May 21% 20% 19% 22% 21% 21% 15% 22% 22% 19% 22% 19% 24%
In June 11% 11% 10% 10% 12% 12% 7% 12% 10% 12% 13% 10% 9%
In July 10% 11% 15% 8% 7% 10% 10% 13% 11% 12% 8% 12% 7%
Closer to the DemocraticNational Convention onAugust 17th 21% 16% 18% 25% 25% 21% 26% 14% 23% 26% 23% 19% 18%
Not sure 37% 42% 38% 35% 34% 36% 42% 39% 34% 30% 33% 40% 42%
Totals 100% 100% 100% 100% 99% 100% 100% 100% 100% 99% 99% 100% 100%
Unweighted N (1,493) (312) (279) (591) (311) (1,083) (161) (164) (85) (273) (329) (549) (342)
245

The Economist /YouGov PollApril 26 - 28, 2020 - 1500 US Adult citizens
Registered Primary Voter Party ID Ideology
Total Voters Dem Rep Dem Ind Rep Lib Mod Con
Before the end of May 21% 23% 28% 24% 26% 17% 19% 27% 20% 19%
In June 11% 13% 15% 11% 14% 8% 10% 14% 10% 9%
In July 10% 11% 13% 7% 12% 10% 10% 9% 17% 6%
Closer to the DemocraticNational Convention onAugust 17th 21% 23% 23% 22% 22% 19% 23% 22% 21% 26%
Not sure 37% 29% 21% 36% 26% 46% 38% 28% 33% 40%
Totals 100% 99% 100% 100% 100% 100% 100% 100% 101% 100%
Unweighted N (1,493) (1,217) (563) (335) (536) (579) (378) (449) (451) (452)
246

The Economist /YouGov PollApril 26 - 28, 2020 - 1500 US Adult citizens
78. Female VP NomineeDo you think Joe Biden should select a woman to be the Democratic Party nominee for Vice-President?
Gender Education Income
Total Male Female HS or less Some college College grad Postgrad Under $50K $50-100K $100K or more
Yes 35% 32% 38% 27% 34% 42% 56% 31% 38% 46%
No 18% 18% 18% 23% 20% 10% 11% 21% 15% 13%
Not sure 47% 50% 44% 51% 46% 47% 33% 48% 47% 41%
Totals 100% 100% 100% 101% 100% 99% 100% 100% 100% 100%
Unweighted N (1,494) (666) (828) (469) (528) (302) (195) (599) (441) (286)
Age Race Region
Total 18-29 30-44 45-64 65+ White Black Hispanic Other Northeast Midwest South West
Yes 35% 37% 35% 33% 37% 34% 43% 36% 38% 39% 39% 35% 30%
No 18% 13% 18% 17% 25% 19% 15% 20% 13% 14% 19% 20% 19%
Not sure 47% 50% 47% 50% 39% 48% 43% 45% 49% 48% 42% 46% 52%
Totals 100% 100% 100% 100% 101% 101% 101% 101% 100% 101% 100% 101% 101%
Unweighted N (1,494) (312) (278) (592) (312) (1,084) (161) (164) (85) (274) (328) (550) (342)
Registered Primary Voter Party ID Ideology
Total Voters Dem Rep Dem Ind Rep Lib Mod Con
Yes 35% 41% 65% 15% 61% 26% 18% 59% 41% 15%
No 18% 18% 5% 38% 6% 18% 33% 8% 14% 32%
Not sure 47% 41% 29% 47% 33% 56% 49% 33% 45% 54%
Totals 100% 100% 99% 100% 100% 100% 100% 100% 100% 101%
Unweighted N (1,494) (1,218) (563) (335) (536) (580) (378) (449) (450) (454)
247

The Economist /YouGov PollApril 26 - 28, 2020 - 1500 US Adult citizens
79. Democratic VPOf the choices listed below, who do you think should be selected as the Democratic Party nominee for Vice-President if Joe Biden wins the nomination forPresident?
Gender Education Income
Total Male Female HS or less Some college College grad Postgrad Under $50K $50-100K $100K or more
Stacey Abrams 8% 8% 7% 8% 6% 8% 11% 9% 6% 7%
Tammy Baldwin 2% 2% 1% 2% 2% 0% 2% 1% 1% 3%
Kamala Harris 9% 10% 8% 7% 10% 10% 9% 7% 11% 10%
Amy Klobuchar 7% 7% 7% 3% 6% 11% 14% 5% 9% 10%
Elizabeth Warren 15% 13% 17% 11% 12% 22% 22% 14% 14% 19%
Gretchen Whitmer 2% 3% 2% 2% 2% 2% 2% 3% 1% 3%
Someone else 13% 17% 10% 11% 16% 13% 14% 12% 14% 15%
Not sure 45% 40% 49% 55% 45% 34% 25% 49% 43% 32%
Totals 101% 100% 101% 99% 99% 100% 99% 100% 99% 99%
Unweighted N (1,487) (661) (826) (469) (522) (300) (196) (597) (438) (285)
Age Race Region
Total 18-29 30-44 45-64 65+ White Black Hispanic Other Northeast Midwest South West
Stacey Abrams 8% 10% 9% 6% 7% 6% 16% 10% 5% 7% 5% 9% 7%
Tammy Baldwin 2% 1% 3% 2% 0% 2% 2% 2% 2% 2% 2% 1% 1%
Kamala Harris 9% 7% 8% 9% 10% 8% 14% 12% 9% 10% 9% 8% 9%
Amy Klobuchar 7% 5% 7% 7% 9% 8% 3% 4% 11% 4% 7% 7% 9%
Elizabeth Warren 15% 22% 18% 11% 10% 13% 21% 15% 18% 20% 13% 14% 12%
Gretchen Whitmer 2% 3% 1% 3% 3% 2% 2% 2% 0% 1% 4% 2% 3%
Someone else 13% 10% 11% 14% 18% 14% 10% 8% 21% 17% 14% 11% 14%
Not sure 45% 43% 43% 48% 43% 47% 32% 47% 35% 39% 46% 48% 43%
Totals 101% 101% 100% 100% 100% 100% 100% 100% 101% 100% 100% 100% 98%
Unweighted N (1,487) (309) (278) (589) (311) (1,079) (160) (164) (84) (275) (326) (545) (341)
248
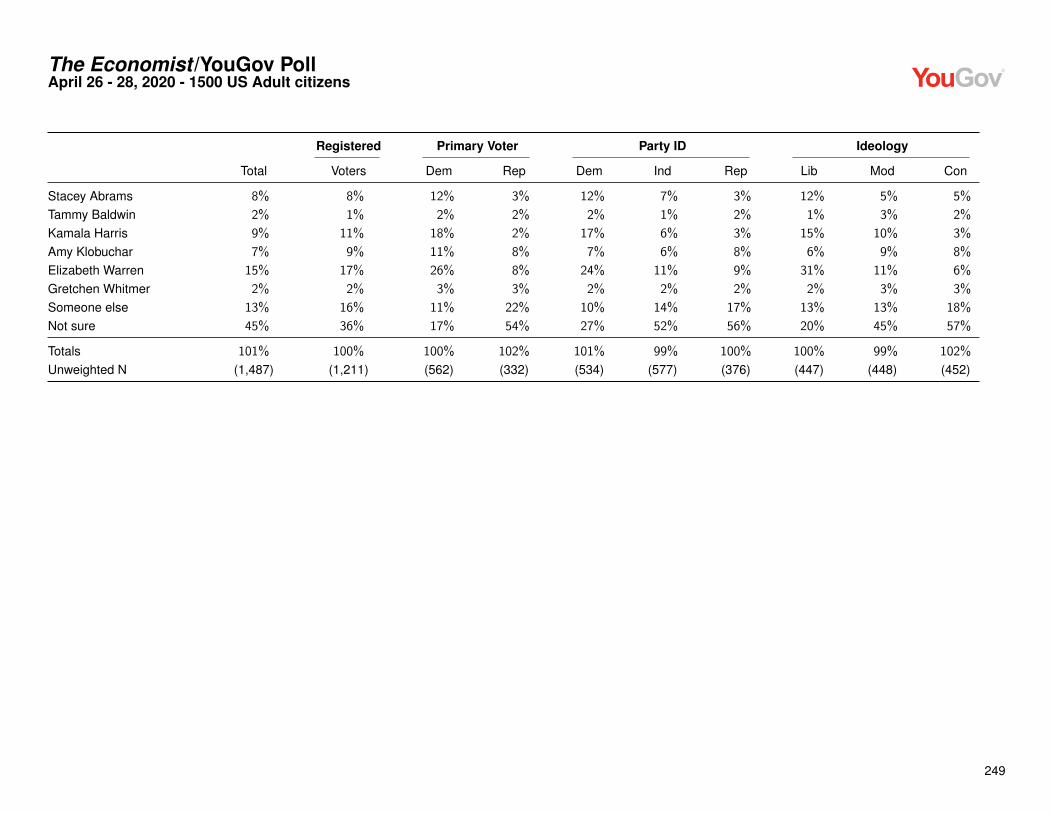
The Economist /YouGov PollApril 26 - 28, 2020 - 1500 US Adult citizens
Registered Primary Voter Party ID Ideology
Total Voters Dem Rep Dem Ind Rep Lib Mod Con
Stacey Abrams 8% 8% 12% 3% 12% 7% 3% 12% 5% 5%
Tammy Baldwin 2% 1% 2% 2% 2% 1% 2% 1% 3% 2%
Kamala Harris 9% 11% 18% 2% 17% 6% 3% 15% 10% 3%
Amy Klobuchar 7% 9% 11% 8% 7% 6% 8% 6% 9% 8%
Elizabeth Warren 15% 17% 26% 8% 24% 11% 9% 31% 11% 6%
Gretchen Whitmer 2% 2% 3% 3% 2% 2% 2% 2% 3% 3%
Someone else 13% 16% 11% 22% 10% 14% 17% 13% 13% 18%
Not sure 45% 36% 17% 54% 27% 52% 56% 20% 45% 57%
Totals 101% 100% 100% 102% 101% 99% 100% 100% 99% 102%
Unweighted N (1,487) (1,211) (562) (332) (534) (577) (376) (447) (448) (452)
249

The Economist /YouGov PollApril 26 - 28, 2020 - 1500 US Adult citizens
80. Trial Heat - Biden V TrumpIf an election for president were going to be held now and the Democratic nominee was Joe Biden and the Republican nominee was Donald Trump, wouldyou vote for...Asked of registered voters
Gender Education Income
Total Male Female HS or less Some college College grad Postgrad Under $50K $50-100K $100K or more
Joe Biden 47% 43% 50% 42% 45% 54% 50% 48% 45% 49%
Donald Trump 41% 45% 37% 48% 44% 35% 32% 37% 45% 41%
Other 4% 4% 4% 2% 4% 4% 8% 4% 4% 5%
Not sure 6% 5% 6% 5% 5% 5% 8% 7% 4% 4%
I would not vote 2% 2% 3% 3% 2% 2% 2% 3% 3% 0%
Totals 100% 99% 100% 100% 100% 100% 100% 99% 101% 99%
Unweighted N (1,218) (569) (649) (311) (429) (286) (192) (419) (393) (274)
Age Race Region
Total 18-29 30-44 45-64 65+ White Black Hispanic Other Northeast Midwest South West
Joe Biden 47% 54% 51% 43% 46% 41% 80% 51% 49% 49% 48% 47% 44%
Donald Trump 41% 26% 31% 48% 49% 48% 10% 34% 32% 38% 40% 41% 44%
Other 4% 9% 6% 3% 1% 4% 3% 6% 7% 4% 4% 3% 5%
Not sure 6% 7% 9% 5% 3% 6% 5% 5% 10% 7% 6% 5% 5%
I would not vote 2% 5% 4% 1% 1% 2% 3% 5% 2% 2% 2% 3% 2%
Totals 100% 101% 101% 100% 100% 101% 101% 101% 100% 100% 100% 99% 100%
Unweighted N (1,218) (240) (207) (505) (266) (880) (136) (133) (69) (223) (272) (435) (288)
Registered Primary Voter Party ID Ideology
Total Voters Dem Rep Dem Ind Rep Lib Mod Con
Joe Biden 47% 47% 86% 5% 88% 38% 4% 83% 53% 9%
continued on the next page . . .
250

The Economist /YouGov PollApril 26 - 28, 2020 - 1500 US Adult citizens
continued from previous pageRegistered Primary Voter Party ID Ideology
Total Voters Dem Rep Dem Ind Rep Lib Mod Con
Donald Trump 41% 41% 5% 91% 4% 40% 90% 5% 31% 84%
Other 4% 4% 5% 2% 2% 9% 2% 3% 7% 2%
Not sure 6% 6% 3% 2% 4% 9% 4% 6% 6% 5%
I would not vote 2% 2% 2% 0% 2% 4% 1% 3% 3% 1%
Totals 100% 100% 101% 100% 100% 100% 101% 100% 100% 101%
Unweighted N (1,218) (1,218) (564) (337) (490) (400) (328) (409) (366) (393)
251

The Economist /YouGov PollApril 26 - 28, 2020 - 1500 US Adult citizens
81. 2020 Election WinnerWho do you think will win the 2020 presidential election?
Gender Education Income
Total Male Female HS or less Some college College grad Postgrad Under $50K $50-100K $100K or more
Joe Biden 45% 42% 48% 41% 44% 54% 48% 49% 41% 44%
Donald Trump 55% 58% 52% 59% 56% 46% 52% 51% 59% 56%
Totals 100% 100% 100% 100% 100% 100% 100% 100% 100% 100%
Unweighted N (1,498) (667) (831) (470) (530) (302) (196) (598) (443) (287)
Age Race Region
Total 18-29 30-44 45-64 65+ White Black Hispanic Other Northeast Midwest South West
Joe Biden 45% 47% 50% 43% 41% 38% 78% 53% 53% 52% 47% 43% 41%
Donald Trump 55% 53% 50% 57% 59% 62% 22% 47% 47% 48% 53% 57% 59%
Totals 100% 100% 100% 100% 100% 100% 100% 100% 100% 100% 100% 100% 100%
Unweighted N (1,498) (312) (280) (594) (312) (1,087) (162) (164) (85) (275) (330) (550) (343)
Registered Primary Voter Party ID Ideology
Total Voters Dem Rep Dem Ind Rep Lib Mod Con
Joe Biden 45% 46% 79% 7% 78% 42% 10% 70% 51% 15%
Donald Trump 55% 54% 21% 93% 22% 58% 90% 30% 49% 85%
Totals 100% 100% 100% 100% 100% 100% 100% 100% 100% 100%
Unweighted N (1,498) (1,221) (564) (337) (536) (582) (380) (448) (450) (457)
252

The Economist /YouGov PollApril 26 - 28, 2020 - 1500 US Adult citizens
82. Senate ControlWhich party do you think will win majority control of the U.S. Senate in 2020?
Gender Education Income
Total Male Female HS or less Some college College grad Postgrad Under $50K $50-100K $100K or more
The Democratic Party 35% 33% 37% 31% 33% 43% 40% 34% 37% 35%
The Republican Party 41% 47% 36% 40% 43% 40% 41% 35% 46% 50%
Not sure 24% 20% 28% 29% 24% 16% 19% 30% 17% 15%
Totals 100% 100% 101% 100% 100% 99% 100% 99% 100% 100%
Unweighted N (1,493) (665) (828) (468) (528) (301) (196) (596) (441) (287)
Age Race Region
Total 18-29 30-44 45-64 65+ White Black Hispanic Other Northeast Midwest South West
The Democratic Party 35% 31% 39% 34% 35% 28% 61% 44% 43% 37% 39% 33% 32%
The Republican Party 41% 41% 32% 43% 48% 49% 11% 28% 36% 38% 42% 42% 42%
Not sure 24% 29% 29% 23% 16% 23% 29% 27% 21% 25% 19% 26% 25%
Totals 100% 101% 100% 100% 99% 100% 101% 99% 100% 100% 100% 101% 99%
Unweighted N (1,493) (311) (278) (592) (312) (1,085) (162) (163) (83) (275) (328) (548) (342)
Registered Primary Voter Party ID Ideology
Total Voters Dem Rep Dem Ind Rep Lib Mod Con
The Democratic Party 35% 39% 69% 7% 70% 24% 7% 62% 39% 11%
The Republican Party 41% 45% 17% 89% 12% 36% 84% 16% 34% 75%
Not sure 24% 15% 14% 4% 17% 40% 9% 22% 28% 14%
Totals 100% 99% 100% 100% 99% 100% 100% 100% 101% 100%
Unweighted N (1,493) (1,218) (562) (337) (534) (580) (379) (447) (450) (457)
253
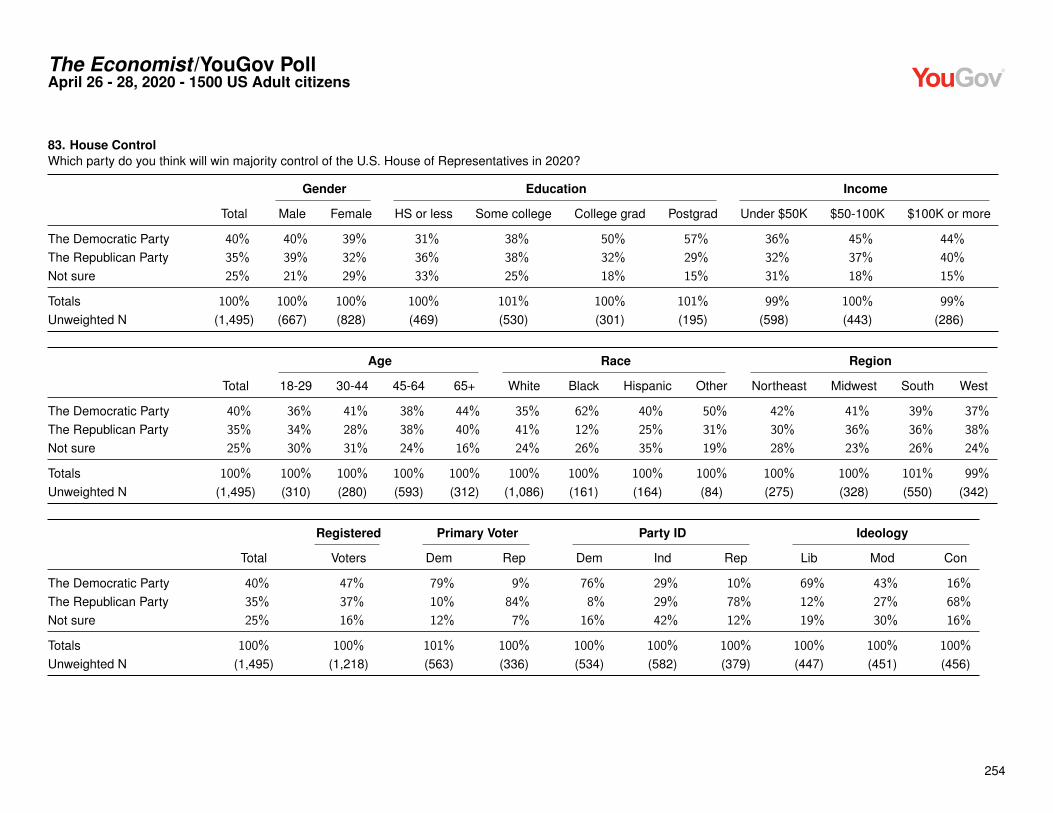
The Economist /YouGov PollApril 26 - 28, 2020 - 1500 US Adult citizens
83. House ControlWhich party do you think will win majority control of the U.S. House of Representatives in 2020?
Gender Education Income
Total Male Female HS or less Some college College grad Postgrad Under $50K $50-100K $100K or more
The Democratic Party 40% 40% 39% 31% 38% 50% 57% 36% 45% 44%
The Republican Party 35% 39% 32% 36% 38% 32% 29% 32% 37% 40%
Not sure 25% 21% 29% 33% 25% 18% 15% 31% 18% 15%
Totals 100% 100% 100% 100% 101% 100% 101% 99% 100% 99%
Unweighted N (1,495) (667) (828) (469) (530) (301) (195) (598) (443) (286)
Age Race Region
Total 18-29 30-44 45-64 65+ White Black Hispanic Other Northeast Midwest South West
The Democratic Party 40% 36% 41% 38% 44% 35% 62% 40% 50% 42% 41% 39% 37%
The Republican Party 35% 34% 28% 38% 40% 41% 12% 25% 31% 30% 36% 36% 38%
Not sure 25% 30% 31% 24% 16% 24% 26% 35% 19% 28% 23% 26% 24%
Totals 100% 100% 100% 100% 100% 100% 100% 100% 100% 100% 100% 101% 99%
Unweighted N (1,495) (310) (280) (593) (312) (1,086) (161) (164) (84) (275) (328) (550) (342)
Registered Primary Voter Party ID Ideology
Total Voters Dem Rep Dem Ind Rep Lib Mod Con
The Democratic Party 40% 47% 79% 9% 76% 29% 10% 69% 43% 16%
The Republican Party 35% 37% 10% 84% 8% 29% 78% 12% 27% 68%
Not sure 25% 16% 12% 7% 16% 42% 12% 19% 30% 16%
Totals 100% 100% 101% 100% 100% 100% 100% 100% 100% 100%
Unweighted N (1,495) (1,218) (563) (336) (534) (582) (379) (447) (451) (456)
254

The Economist /YouGov PollApril 26 - 28, 2020 - 1500 US Adult citizens
84. Economy Better If Biden ElectedDo you think the U.S. economy will get better, get worse or will it stay the same if Joe Biden is elected President in 2020?
Gender Education Income
Total Male Female HS or less Some college College grad Postgrad Under $50K $50-100K $100K or more
Get better 31% 29% 33% 25% 29% 39% 43% 29% 31% 38%
Get worse 36% 39% 34% 37% 40% 31% 31% 32% 42% 35%
Stay the same 14% 15% 13% 12% 13% 17% 18% 13% 14% 18%
Not sure 19% 17% 21% 26% 18% 13% 7% 25% 13% 9%
Totals 100% 100% 101% 100% 100% 100% 99% 99% 100% 100%
Unweighted N (1,490) (666) (824) (465) (531) (299) (195) (594) (442) (287)
Age Race Region
Total 18-29 30-44 45-64 65+ White Black Hispanic Other Northeast Midwest South West
Get better 31% 26% 33% 31% 34% 28% 51% 31% 29% 35% 32% 30% 28%
Get worse 36% 27% 23% 43% 49% 42% 11% 30% 33% 27% 39% 36% 43%
Stay the same 14% 19% 20% 10% 9% 13% 14% 15% 21% 16% 16% 13% 12%
Not sure 19% 29% 23% 15% 9% 17% 24% 24% 16% 22% 13% 22% 17%
Totals 100% 101% 99% 99% 101% 100% 100% 100% 99% 100% 100% 101% 100%
Unweighted N (1,490) (311) (276) (594) (309) (1,083) (161) (163) (83) (273) (328) (547) (342)
Registered Primary Voter Party ID Ideology
Total Voters Dem Rep Dem Ind Rep Lib Mod Con
Get better 31% 37% 63% 11% 61% 19% 12% 57% 37% 10%
Get worse 36% 40% 11% 80% 9% 33% 73% 10% 27% 74%
Stay the same 14% 13% 17% 5% 16% 17% 7% 19% 16% 6%
Not sure 19% 10% 10% 4% 14% 30% 8% 15% 21% 11%
Totals 100% 100% 101% 100% 100% 99% 100% 101% 101% 101%
continued on the next page . . .
255

The Economist /YouGov PollApril 26 - 28, 2020 - 1500 US Adult citizens
continued from previous pageRegistered Primary Voter Party ID Ideology
Total Voters Dem Rep Dem Ind Rep Lib Mod Con
Unweighted N (1,490) (1,216) (561) (336) (533) (580) (377) (446) (448) (456)
256
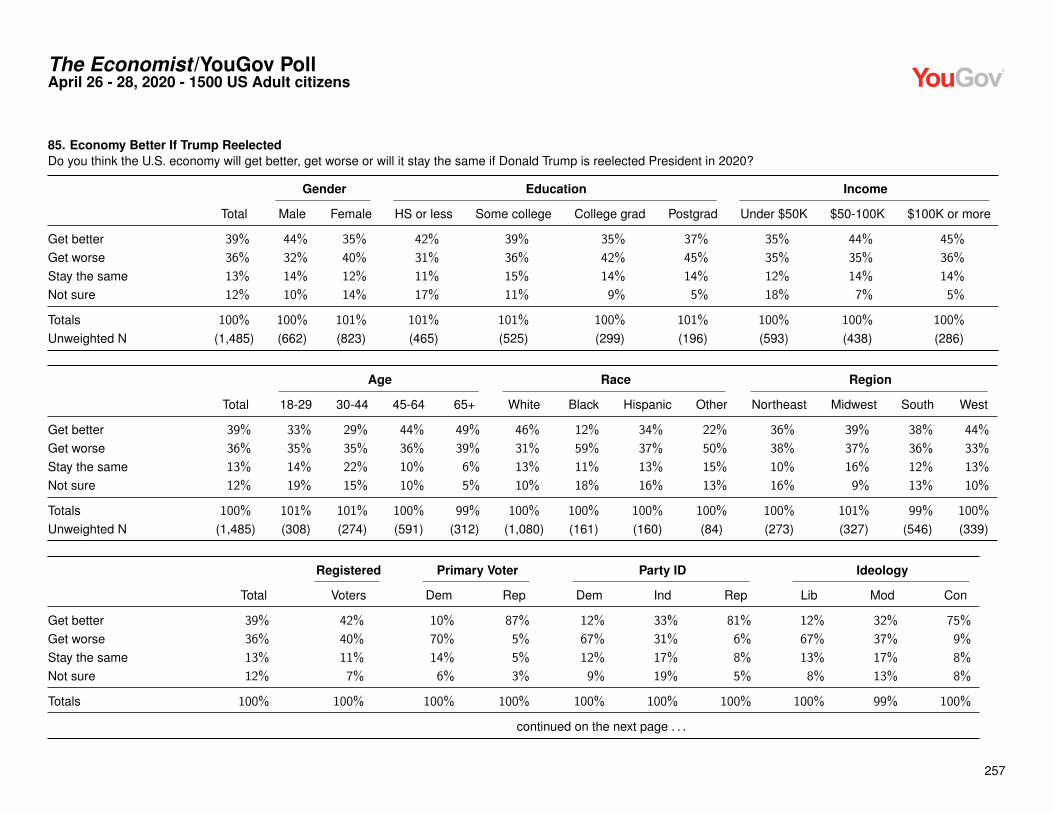
The Economist /YouGov PollApril 26 - 28, 2020 - 1500 US Adult citizens
85. Economy Better If Trump ReelectedDo you think the U.S. economy will get better, get worse or will it stay the same if Donald Trump is reelected President in 2020?
Gender Education Income
Total Male Female HS or less Some college College grad Postgrad Under $50K $50-100K $100K or more
Get better 39% 44% 35% 42% 39% 35% 37% 35% 44% 45%
Get worse 36% 32% 40% 31% 36% 42% 45% 35% 35% 36%
Stay the same 13% 14% 12% 11% 15% 14% 14% 12% 14% 14%
Not sure 12% 10% 14% 17% 11% 9% 5% 18% 7% 5%
Totals 100% 100% 101% 101% 101% 100% 101% 100% 100% 100%
Unweighted N (1,485) (662) (823) (465) (525) (299) (196) (593) (438) (286)
Age Race Region
Total 18-29 30-44 45-64 65+ White Black Hispanic Other Northeast Midwest South West
Get better 39% 33% 29% 44% 49% 46% 12% 34% 22% 36% 39% 38% 44%
Get worse 36% 35% 35% 36% 39% 31% 59% 37% 50% 38% 37% 36% 33%
Stay the same 13% 14% 22% 10% 6% 13% 11% 13% 15% 10% 16% 12% 13%
Not sure 12% 19% 15% 10% 5% 10% 18% 16% 13% 16% 9% 13% 10%
Totals 100% 101% 101% 100% 99% 100% 100% 100% 100% 100% 101% 99% 100%
Unweighted N (1,485) (308) (274) (591) (312) (1,080) (161) (160) (84) (273) (327) (546) (339)
Registered Primary Voter Party ID Ideology
Total Voters Dem Rep Dem Ind Rep Lib Mod Con
Get better 39% 42% 10% 87% 12% 33% 81% 12% 32% 75%
Get worse 36% 40% 70% 5% 67% 31% 6% 67% 37% 9%
Stay the same 13% 11% 14% 5% 12% 17% 8% 13% 17% 8%
Not sure 12% 7% 6% 3% 9% 19% 5% 8% 13% 8%
Totals 100% 100% 100% 100% 100% 100% 100% 100% 99% 100%
continued on the next page . . .
257

The Economist /YouGov PollApril 26 - 28, 2020 - 1500 US Adult citizens
continued from previous pageRegistered Primary Voter Party ID Ideology
Total Voters Dem Rep Dem Ind Rep Lib Mod Con
Unweighted N (1,485) (1,212) (561) (336) (531) (576) (378) (446) (444) (456)
258

The Economist /YouGov PollApril 26 - 28, 2020 - 1500 US Adult citizens
86. Confidence In Biden Handling Of CoronavirusAre you confident in Joe Biden’s ability to deal wisely with the COVID-19 outbreak, or are you uneasy about his approach?
Gender Education Income
Total Male Female HS or less Some college College grad Postgrad Under $50K $50-100K $100K or more
Confident 34% 34% 34% 28% 32% 43% 45% 32% 35% 38%
Uneasy 43% 48% 38% 43% 47% 35% 41% 38% 48% 44%
Not sure 24% 19% 28% 29% 21% 22% 14% 29% 17% 18%
Totals 101% 101% 100% 100% 100% 100% 100% 99% 100% 100%
Unweighted N (1,494) (665) (829) (467) (531) (302) (194) (597) (442) (287)
Age Race Region
Total 18-29 30-44 45-64 65+ White Black Hispanic Other Northeast Midwest South West
Confident 34% 31% 37% 32% 36% 29% 57% 39% 29% 37% 35% 33% 32%
Uneasy 43% 34% 32% 48% 54% 49% 15% 30% 45% 32% 43% 44% 49%
Not sure 24% 35% 31% 20% 10% 21% 28% 31% 26% 31% 22% 23% 19%
Totals 101% 100% 100% 100% 100% 99% 100% 100% 100% 100% 100% 100% 100%
Unweighted N (1,494) (310) (278) (594) (312) (1,086) (161) (164) (83) (275) (329) (547) (343)
Registered Primary Voter Party ID Ideology
Total Voters Dem Rep Dem Ind Rep Lib Mod Con
Confident 34% 39% 69% 8% 68% 22% 10% 64% 37% 10%
Uneasy 43% 46% 17% 85% 14% 43% 77% 19% 33% 77%
Not sure 24% 15% 15% 7% 18% 35% 13% 16% 29% 13%
Totals 101% 100% 101% 100% 100% 100% 100% 99% 99% 100%
Unweighted N (1,494) (1,220) (564) (337) (536) (579) (379) (448) (451) (455)
259

The Economist /YouGov PollApril 26 - 28, 2020 - 1500 US Adult citizens
87. Confidence In Biden Handling Of An Economic RecessionAre you confident in Joe Biden’s ability to deal wisely with an economic recession, or are you uneasy about his approach?
Gender Education Income
Total Male Female HS or less Some college College grad Postgrad Under $50K $50-100K $100K or more
Confident 33% 32% 34% 25% 35% 39% 44% 32% 33% 41%
Uneasy 45% 51% 40% 46% 48% 40% 43% 41% 52% 45%
Not sure 22% 17% 26% 29% 17% 21% 14% 27% 15% 14%
Totals 100% 100% 100% 100% 100% 100% 101% 100% 100% 100%
Unweighted N (1,482) (658) (824) (462) (527) (300) (193) (591) (440) (285)
Age Race Region
Total 18-29 30-44 45-64 65+ White Black Hispanic Other Northeast Midwest South West
Confident 33% 27% 36% 33% 35% 29% 57% 34% 25% 37% 35% 31% 31%
Uneasy 45% 39% 37% 49% 55% 51% 20% 36% 50% 35% 46% 48% 49%
Not sure 22% 35% 26% 18% 10% 20% 23% 30% 24% 29% 19% 21% 20%
Totals 100% 101% 99% 100% 100% 100% 100% 100% 99% 101% 100% 100% 100%
Unweighted N (1,482) (309) (275) (588) (310) (1,078) (161) (160) (83) (273) (326) (544) (339)
Registered Primary Voter Party ID Ideology
Total Voters Dem Rep Dem Ind Rep Lib Mod Con
Confident 33% 39% 67% 8% 66% 21% 10% 60% 40% 10%
Uneasy 45% 48% 20% 86% 18% 46% 78% 22% 34% 79%
Not sure 22% 14% 13% 6% 16% 33% 12% 18% 27% 11%
Totals 100% 101% 100% 100% 100% 100% 100% 100% 101% 100%
Unweighted N (1,482) (1,211) (562) (331) (532) (578) (372) (444) (449) (452)
260

The Economist /YouGov PollApril 26 - 28, 2020 - 1500 US Adult citizens
88A. Issue Importance — Jobs and the economyHow important are the following issues to you?
Gender Education Income
Total Male Female HS or less Some college College grad Postgrad Under $50K $50-100K $100K or more
Very Important 70% 68% 72% 68% 72% 68% 72% 66% 75% 73%
Somewhat Important 25% 26% 24% 24% 24% 29% 25% 27% 22% 23%
Not very Important 4% 5% 3% 6% 3% 2% 2% 5% 3% 3%
Unimportant 1% 1% 2% 2% 1% 1% 1% 2% 0% 1%
Totals 100% 100% 101% 100% 100% 100% 100% 100% 100% 100%
Unweighted N (1,500) (667) (833) (471) (531) (302) (196) (600) (443) (287)
Age Race Region
Total 18-29 30-44 45-64 65+ White Black Hispanic Other Northeast Midwest South West
Very Important 70% 55% 65% 77% 78% 70% 70% 64% 73% 72% 71% 69% 67%
Somewhat Important 25% 35% 28% 20% 19% 25% 26% 26% 21% 20% 24% 26% 29%
Not very Important 4% 9% 5% 2% 2% 4% 3% 8% 3% 7% 4% 4% 3%
Unimportant 1% 2% 3% 1% 0% 1% 1% 2% 3% 2% 2% 1% 1%
Totals 100% 101% 101% 100% 99% 100% 100% 100% 100% 101% 101% 100% 100%
Unweighted N (1,500) (313) (280) (594) (313) (1,088) (162) (165) (85) (275) (330) (552) (343)
Registered Primary Voter Party ID Ideology
Total Voters Dem Rep Dem Ind Rep Lib Mod Con
Very Important 70% 74% 68% 82% 66% 70% 73% 61% 73% 75%
Somewhat Important 25% 22% 29% 15% 30% 22% 24% 35% 21% 21%
Not very Important 4% 3% 2% 2% 4% 6% 2% 4% 4% 4%
Unimportant 1% 1% 0% 1% 0% 2% 1% 1% 1% 1%
Totals 100% 100% 99% 100% 100% 100% 100% 101% 99% 101%
continued on the next page . . .
261

The Economist /YouGov PollApril 26 - 28, 2020 - 1500 US Adult citizens
continued from previous pageRegistered Primary Voter Party ID Ideology
Total Voters Dem Rep Dem Ind Rep Lib Mod Con
Unweighted N (1,500) (1,222) (564) (337) (536) (584) (380) (449) (451) (457)
262
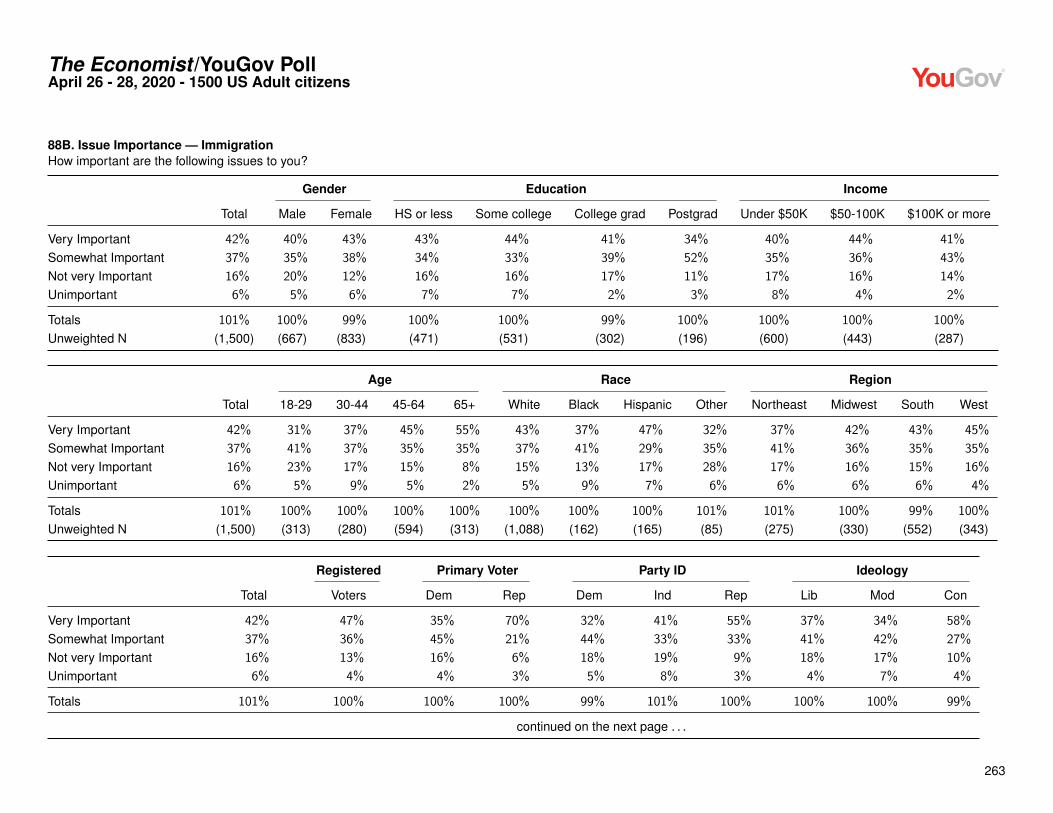
The Economist /YouGov PollApril 26 - 28, 2020 - 1500 US Adult citizens
88B. Issue Importance — ImmigrationHow important are the following issues to you?
Gender Education Income
Total Male Female HS or less Some college College grad Postgrad Under $50K $50-100K $100K or more
Very Important 42% 40% 43% 43% 44% 41% 34% 40% 44% 41%
Somewhat Important 37% 35% 38% 34% 33% 39% 52% 35% 36% 43%
Not very Important 16% 20% 12% 16% 16% 17% 11% 17% 16% 14%
Unimportant 6% 5% 6% 7% 7% 2% 3% 8% 4% 2%
Totals 101% 100% 99% 100% 100% 99% 100% 100% 100% 100%
Unweighted N (1,500) (667) (833) (471) (531) (302) (196) (600) (443) (287)
Age Race Region
Total 18-29 30-44 45-64 65+ White Black Hispanic Other Northeast Midwest South West
Very Important 42% 31% 37% 45% 55% 43% 37% 47% 32% 37% 42% 43% 45%
Somewhat Important 37% 41% 37% 35% 35% 37% 41% 29% 35% 41% 36% 35% 35%
Not very Important 16% 23% 17% 15% 8% 15% 13% 17% 28% 17% 16% 15% 16%
Unimportant 6% 5% 9% 5% 2% 5% 9% 7% 6% 6% 6% 6% 4%
Totals 101% 100% 100% 100% 100% 100% 100% 100% 101% 101% 100% 99% 100%
Unweighted N (1,500) (313) (280) (594) (313) (1,088) (162) (165) (85) (275) (330) (552) (343)
Registered Primary Voter Party ID Ideology
Total Voters Dem Rep Dem Ind Rep Lib Mod Con
Very Important 42% 47% 35% 70% 32% 41% 55% 37% 34% 58%
Somewhat Important 37% 36% 45% 21% 44% 33% 33% 41% 42% 27%
Not very Important 16% 13% 16% 6% 18% 19% 9% 18% 17% 10%
Unimportant 6% 4% 4% 3% 5% 8% 3% 4% 7% 4%
Totals 101% 100% 100% 100% 99% 101% 100% 100% 100% 99%
continued on the next page . . .
263

The Economist /YouGov PollApril 26 - 28, 2020 - 1500 US Adult citizens
continued from previous pageRegistered Primary Voter Party ID Ideology
Total Voters Dem Rep Dem Ind Rep Lib Mod Con
Unweighted N (1,500) (1,222) (564) (337) (536) (584) (380) (449) (451) (457)
264

The Economist /YouGov PollApril 26 - 28, 2020 - 1500 US Adult citizens
88C. Issue Importance — Climate change and the environmentHow important are the following issues to you?
Gender Education Income
Total Male Female HS or less Some college College grad Postgrad Under $50K $50-100K $100K or more
Very Important 44% 38% 50% 43% 39% 50% 51% 42% 44% 49%
Somewhat Important 28% 26% 29% 27% 31% 24% 25% 30% 28% 23%
Not very Important 16% 20% 13% 18% 14% 16% 14% 17% 17% 15%
Unimportant 12% 16% 9% 11% 15% 9% 10% 10% 12% 13%
Totals 100% 100% 101% 99% 99% 99% 100% 99% 101% 100%
Unweighted N (1,499) (667) (832) (471) (530) (302) (196) (600) (442) (287)
Age Race Region
Total 18-29 30-44 45-64 65+ White Black Hispanic Other Northeast Midwest South West
Very Important 44% 47% 46% 40% 45% 43% 47% 45% 47% 49% 39% 42% 48%
Somewhat Important 28% 27% 34% 28% 20% 25% 39% 28% 30% 28% 31% 30% 20%
Not very Important 16% 16% 15% 16% 19% 19% 10% 11% 11% 15% 20% 16% 16%
Unimportant 12% 9% 6% 16% 16% 13% 4% 16% 13% 9% 11% 12% 17%
Totals 100% 99% 101% 100% 100% 100% 100% 100% 101% 101% 101% 100% 101%
Unweighted N (1,499) (313) (279) (594) (313) (1,087) (162) (165) (85) (275) (330) (552) (342)
Registered Primary Voter Party ID Ideology
Total Voters Dem Rep Dem Ind Rep Lib Mod Con
Very Important 44% 45% 69% 14% 68% 43% 17% 74% 46% 16%
Somewhat Important 28% 26% 25% 26% 25% 29% 28% 21% 32% 29%
Not very Important 16% 16% 3% 30% 6% 16% 30% 2% 17% 28%
Unimportant 12% 13% 3% 30% 2% 12% 25% 2% 6% 27%
Totals 100% 100% 100% 100% 101% 100% 100% 99% 101% 100%
continued on the next page . . .
265

The Economist /YouGov PollApril 26 - 28, 2020 - 1500 US Adult citizens
continued from previous pageRegistered Primary Voter Party ID Ideology
Total Voters Dem Rep Dem Ind Rep Lib Mod Con
Unweighted N (1,499) (1,222) (564) (337) (536) (583) (380) (449) (451) (457)
266
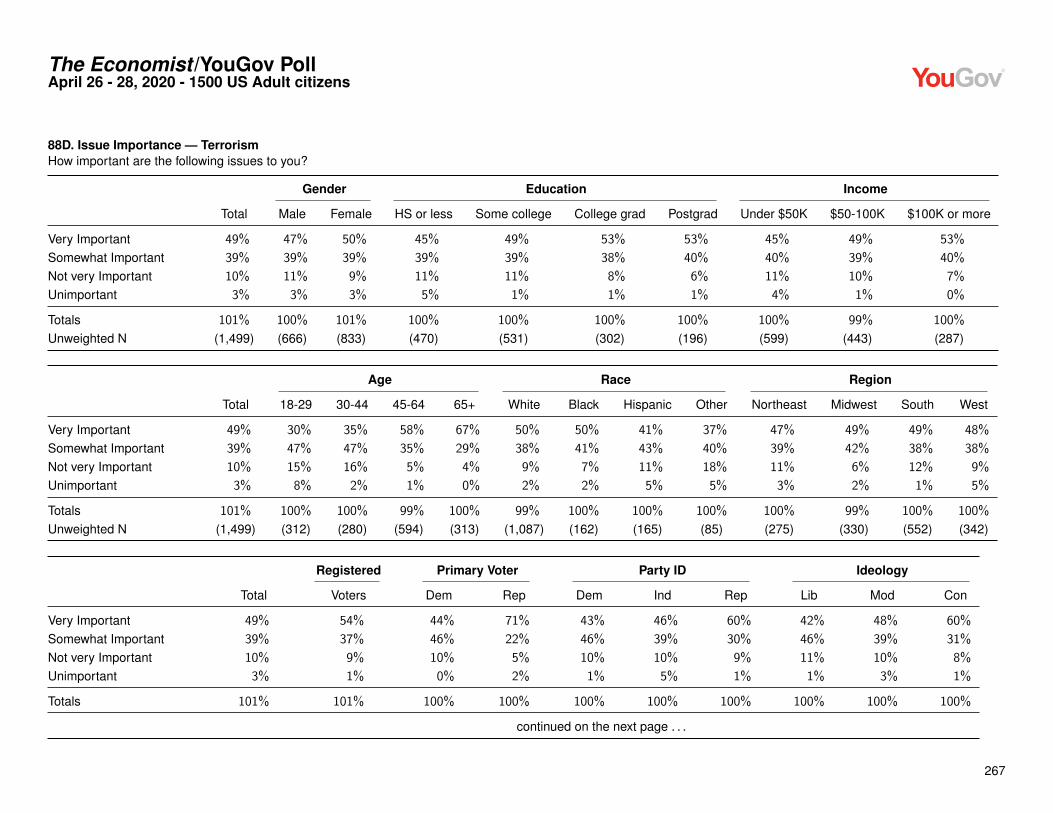
The Economist /YouGov PollApril 26 - 28, 2020 - 1500 US Adult citizens
88D. Issue Importance — TerrorismHow important are the following issues to you?
Gender Education Income
Total Male Female HS or less Some college College grad Postgrad Under $50K $50-100K $100K or more
Very Important 49% 47% 50% 45% 49% 53% 53% 45% 49% 53%
Somewhat Important 39% 39% 39% 39% 39% 38% 40% 40% 39% 40%
Not very Important 10% 11% 9% 11% 11% 8% 6% 11% 10% 7%
Unimportant 3% 3% 3% 5% 1% 1% 1% 4% 1% 0%
Totals 101% 100% 101% 100% 100% 100% 100% 100% 99% 100%
Unweighted N (1,499) (666) (833) (470) (531) (302) (196) (599) (443) (287)
Age Race Region
Total 18-29 30-44 45-64 65+ White Black Hispanic Other Northeast Midwest South West
Very Important 49% 30% 35% 58% 67% 50% 50% 41% 37% 47% 49% 49% 48%
Somewhat Important 39% 47% 47% 35% 29% 38% 41% 43% 40% 39% 42% 38% 38%
Not very Important 10% 15% 16% 5% 4% 9% 7% 11% 18% 11% 6% 12% 9%
Unimportant 3% 8% 2% 1% 0% 2% 2% 5% 5% 3% 2% 1% 5%
Totals 101% 100% 100% 99% 100% 99% 100% 100% 100% 100% 99% 100% 100%
Unweighted N (1,499) (312) (280) (594) (313) (1,087) (162) (165) (85) (275) (330) (552) (342)
Registered Primary Voter Party ID Ideology
Total Voters Dem Rep Dem Ind Rep Lib Mod Con
Very Important 49% 54% 44% 71% 43% 46% 60% 42% 48% 60%
Somewhat Important 39% 37% 46% 22% 46% 39% 30% 46% 39% 31%
Not very Important 10% 9% 10% 5% 10% 10% 9% 11% 10% 8%
Unimportant 3% 1% 0% 2% 1% 5% 1% 1% 3% 1%
Totals 101% 101% 100% 100% 100% 100% 100% 100% 100% 100%
continued on the next page . . .
267

The Economist /YouGov PollApril 26 - 28, 2020 - 1500 US Adult citizens
continued from previous pageRegistered Primary Voter Party ID Ideology
Total Voters Dem Rep Dem Ind Rep Lib Mod Con
Unweighted N (1,499) (1,221) (564) (337) (535) (584) (380) (449) (450) (457)
268

The Economist /YouGov PollApril 26 - 28, 2020 - 1500 US Adult citizens
88E. Issue Importance — EducationHow important are the following issues to you?
Gender Education Income
Total Male Female HS or less Some college College grad Postgrad Under $50K $50-100K $100K or more
Very Important 55% 49% 61% 51% 58% 58% 56% 58% 52% 53%
Somewhat Important 32% 35% 28% 33% 30% 30% 34% 29% 35% 37%
Not very Important 10% 11% 8% 9% 9% 12% 9% 9% 12% 9%
Unimportant 4% 5% 2% 6% 2% 1% 2% 5% 1% 1%
Totals 101% 100% 99% 99% 99% 101% 101% 101% 100% 100%
Unweighted N (1,500) (667) (833) (471) (531) (302) (196) (600) (443) (287)
Age Race Region
Total 18-29 30-44 45-64 65+ White Black Hispanic Other Northeast Midwest South West
Very Important 55% 51% 60% 54% 56% 53% 73% 51% 56% 54% 51% 61% 50%
Somewhat Important 32% 36% 23% 33% 34% 36% 15% 24% 27% 34% 36% 26% 35%
Not very Important 10% 7% 13% 10% 8% 9% 10% 11% 14% 7% 9% 10% 12%
Unimportant 4% 6% 4% 3% 2% 2% 2% 13% 3% 5% 4% 4% 2%
Totals 101% 100% 100% 100% 100% 100% 100% 99% 100% 100% 100% 101% 99%
Unweighted N (1,500) (313) (280) (594) (313) (1,088) (162) (165) (85) (275) (330) (552) (343)
Registered Primary Voter Party ID Ideology
Total Voters Dem Rep Dem Ind Rep Lib Mod Con
Very Important 55% 57% 67% 48% 66% 55% 43% 68% 54% 41%
Somewhat Important 32% 32% 28% 36% 25% 31% 41% 25% 33% 39%
Not very Important 10% 10% 5% 13% 7% 10% 13% 5% 8% 15%
Unimportant 4% 1% 0% 3% 3% 5% 3% 2% 4% 4%
Totals 101% 100% 100% 100% 101% 101% 100% 100% 99% 99%
continued on the next page . . .
269

The Economist /YouGov PollApril 26 - 28, 2020 - 1500 US Adult citizens
continued from previous pageRegistered Primary Voter Party ID Ideology
Total Voters Dem Rep Dem Ind Rep Lib Mod Con
Unweighted N (1,500) (1,222) (564) (337) (536) (584) (380) (449) (451) (457)
270

The Economist /YouGov PollApril 26 - 28, 2020 - 1500 US Adult citizens
88F. Issue Importance — Health careHow important are the following issues to you?
Gender Education Income
Total Male Female HS or less Some college College grad Postgrad Under $50K $50-100K $100K or more
Very Important 71% 64% 77% 67% 74% 73% 68% 72% 71% 68%
Somewhat Important 23% 30% 17% 26% 21% 21% 26% 22% 25% 25%
Not very Important 5% 5% 5% 6% 4% 5% 5% 5% 4% 6%
Unimportant 1% 1% 1% 1% 1% 1% 1% 1% 0% 0%
Totals 100% 100% 100% 100% 100% 100% 100% 100% 100% 99%
Unweighted N (1,498) (666) (832) (470) (530) (302) (196) (599) (442) (287)
Age Race Region
Total 18-29 30-44 45-64 65+ White Black Hispanic Other Northeast Midwest South West
Very Important 71% 64% 70% 72% 76% 71% 75% 63% 71% 72% 71% 73% 65%
Somewhat Important 23% 28% 23% 23% 20% 23% 22% 25% 20% 19% 26% 22% 28%
Not very Important 5% 7% 6% 4% 4% 5% 2% 11% 6% 7% 3% 5% 6%
Unimportant 1% 1% 1% 1% 0% 1% 1% 0% 3% 2% 0% 1% 1%
Totals 100% 100% 100% 100% 100% 100% 100% 99% 100% 100% 100% 101% 100%
Unweighted N (1,498) (313) (279) (593) (313) (1,087) (161) (165) (85) (274) (330) (551) (343)
Registered Primary Voter Party ID Ideology
Total Voters Dem Rep Dem Ind Rep Lib Mod Con
Very Important 71% 72% 85% 57% 84% 71% 54% 84% 74% 53%
Somewhat Important 23% 22% 13% 34% 14% 21% 38% 15% 21% 36%
Not very Important 5% 5% 2% 8% 2% 6% 8% 1% 4% 10%
Unimportant 1% 1% 0% 2% 0% 1% 1% 0% 1% 1%
Totals 100% 100% 100% 101% 100% 99% 101% 100% 100% 100%
continued on the next page . . .
271

The Economist /YouGov PollApril 26 - 28, 2020 - 1500 US Adult citizens
continued from previous pageRegistered Primary Voter Party ID Ideology
Total Voters Dem Rep Dem Ind Rep Lib Mod Con
Unweighted N (1,498) (1,222) (564) (337) (536) (582) (380) (449) (450) (457)
272

The Economist /YouGov PollApril 26 - 28, 2020 - 1500 US Adult citizens
88G. Issue Importance — Taxes and government spendingHow important are the following issues to you?
Gender Education Income
Total Male Female HS or less Some college College grad Postgrad Under $50K $50-100K $100K or more
Very Important 53% 53% 54% 52% 55% 54% 52% 52% 57% 58%
Somewhat Important 36% 36% 36% 34% 38% 38% 38% 36% 36% 36%
Not very Important 8% 9% 8% 10% 6% 7% 9% 9% 6% 5%
Unimportant 2% 3% 1% 4% 1% 1% 1% 3% 1% 0%
Totals 99% 101% 99% 100% 100% 100% 100% 100% 100% 99%
Unweighted N (1,500) (667) (833) (471) (531) (302) (196) (600) (443) (287)
Age Race Region
Total 18-29 30-44 45-64 65+ White Black Hispanic Other Northeast Midwest South West
Very Important 53% 38% 43% 61% 68% 55% 53% 43% 59% 52% 56% 53% 53%
Somewhat Important 36% 45% 43% 32% 27% 36% 36% 41% 30% 37% 37% 37% 33%
Not very Important 8% 12% 13% 5% 4% 7% 9% 13% 8% 9% 5% 9% 10%
Unimportant 2% 5% 2% 1% 1% 2% 2% 3% 4% 2% 2% 1% 3%
Totals 99% 100% 101% 99% 100% 100% 100% 100% 101% 100% 100% 100% 99%
Unweighted N (1,500) (313) (280) (594) (313) (1,088) (162) (165) (85) (275) (330) (552) (343)
Registered Primary Voter Party ID Ideology
Total Voters Dem Rep Dem Ind Rep Lib Mod Con
Very Important 53% 58% 50% 71% 47% 55% 58% 46% 55% 62%
Somewhat Important 36% 34% 40% 26% 39% 35% 35% 41% 35% 31%
Not very Important 8% 7% 8% 2% 14% 5% 6% 12% 7% 6%
Unimportant 2% 1% 1% 1% 1% 4% 1% 1% 3% 0%
Totals 99% 100% 99% 100% 101% 99% 100% 100% 100% 99%
continued on the next page . . .
273

The Economist /YouGov PollApril 26 - 28, 2020 - 1500 US Adult citizens
continued from previous pageRegistered Primary Voter Party ID Ideology
Total Voters Dem Rep Dem Ind Rep Lib Mod Con
Unweighted N (1,500) (1,222) (564) (337) (536) (584) (380) (449) (451) (457)
274

The Economist /YouGov PollApril 26 - 28, 2020 - 1500 US Adult citizens
88H. Issue Importance — Civil rights and civil libertiesHow important are the following issues to you?
Gender Education Income
Total Male Female HS or less Some college College grad Postgrad Under $50K $50-100K $100K or more
Very Important 53% 46% 59% 46% 57% 58% 55% 52% 50% 54%
Somewhat Important 33% 34% 33% 37% 30% 31% 35% 34% 37% 34%
Not very Important 11% 16% 7% 13% 12% 10% 8% 11% 12% 11%
Unimportant 3% 4% 1% 4% 2% 1% 2% 3% 2% 1%
Totals 100% 100% 100% 100% 101% 100% 100% 100% 101% 100%
Unweighted N (1,498) (667) (831) (471) (529) (302) (196) (599) (442) (287)
Age Race Region
Total 18-29 30-44 45-64 65+ White Black Hispanic Other Northeast Midwest South West
Very Important 53% 54% 57% 52% 48% 49% 75% 53% 50% 54% 55% 53% 48%
Somewhat Important 33% 32% 30% 34% 37% 36% 20% 29% 36% 34% 30% 33% 36%
Not very Important 11% 11% 9% 12% 13% 12% 4% 16% 10% 10% 14% 11% 12%
Unimportant 3% 3% 3% 2% 2% 3% 1% 2% 4% 2% 2% 3% 4%
Totals 100% 100% 99% 100% 100% 100% 100% 100% 100% 100% 101% 100% 100%
Unweighted N (1,498) (313) (280) (592) (313) (1,086) (162) (165) (85) (274) (330) (552) (342)
Registered Primary Voter Party ID Ideology
Total Voters Dem Rep Dem Ind Rep Lib Mod Con
Very Important 53% 54% 71% 38% 68% 53% 32% 71% 53% 37%
Somewhat Important 33% 33% 25% 43% 25% 31% 47% 25% 33% 41%
Not very Important 11% 10% 4% 15% 7% 12% 16% 4% 11% 19%
Unimportant 3% 2% 0% 4% 0% 3% 4% 1% 3% 3%
Totals 100% 99% 100% 100% 100% 99% 99% 101% 100% 100%
continued on the next page . . .
275

The Economist /YouGov PollApril 26 - 28, 2020 - 1500 US Adult citizens
continued from previous pageRegistered Primary Voter Party ID Ideology
Total Voters Dem Rep Dem Ind Rep Lib Mod Con
Unweighted N (1,498) (1,222) (564) (337) (535) (583) (380) (449) (450) (456)
276

The Economist /YouGov PollApril 26 - 28, 2020 - 1500 US Adult citizens
88I. Issue Importance — Gun controlHow important are the following issues to you?
Gender Education Income
Total Male Female HS or less Some college College grad Postgrad Under $50K $50-100K $100K or more
Very Important 43% 39% 47% 39% 47% 46% 39% 43% 40% 45%
Somewhat Important 31% 30% 31% 34% 27% 29% 32% 30% 34% 29%
Not very Important 16% 16% 16% 16% 15% 15% 20% 18% 14% 15%
Unimportant 10% 14% 7% 10% 10% 11% 9% 9% 11% 11%
Totals 100% 99% 101% 99% 99% 101% 100% 100% 99% 100%
Unweighted N (1,499) (667) (832) (471) (530) (302) (196) (599) (443) (287)
Age Race Region
Total 18-29 30-44 45-64 65+ White Black Hispanic Other Northeast Midwest South West
Very Important 43% 36% 38% 45% 53% 40% 62% 41% 48% 46% 41% 43% 44%
Somewhat Important 31% 38% 38% 27% 21% 31% 25% 37% 26% 28% 35% 31% 27%
Not very Important 16% 18% 19% 14% 14% 18% 10% 13% 17% 16% 16% 16% 17%
Unimportant 10% 8% 5% 14% 13% 12% 3% 9% 9% 10% 8% 10% 12%
Totals 100% 100% 100% 100% 101% 101% 100% 100% 100% 100% 100% 100% 100%
Unweighted N (1,499) (313) (280) (593) (313) (1,087) (162) (165) (85) (275) (330) (552) (342)
Registered Primary Voter Party ID Ideology
Total Voters Dem Rep Dem Ind Rep Lib Mod Con
Very Important 43% 48% 60% 37% 57% 37% 36% 61% 41% 34%
Somewhat Important 31% 27% 28% 26% 31% 30% 31% 28% 31% 30%
Not very Important 16% 14% 10% 15% 11% 20% 17% 10% 17% 18%
Unimportant 10% 10% 2% 23% 1% 13% 16% 1% 11% 18%
Totals 100% 99% 100% 101% 100% 100% 100% 100% 100% 100%
continued on the next page . . .
277

The Economist /YouGov PollApril 26 - 28, 2020 - 1500 US Adult citizens
continued from previous pageRegistered Primary Voter Party ID Ideology
Total Voters Dem Rep Dem Ind Rep Lib Mod Con
Unweighted N (1,499) (1,222) (564) (337) (535) (584) (380) (449) (451) (456)
278

The Economist /YouGov PollApril 26 - 28, 2020 - 1500 US Adult citizens
88J. Issue Importance — Crime and criminal justice reformHow important are the following issues to you?
Gender Education Income
Total Male Female HS or less Some college College grad Postgrad Under $50K $50-100K $100K or more
Very Important 44% 37% 50% 46% 46% 42% 32% 48% 40% 39%
Somewhat Important 44% 47% 41% 42% 42% 44% 54% 40% 46% 48%
Not very Important 10% 13% 8% 10% 10% 12% 11% 9% 12% 11%
Unimportant 2% 3% 1% 3% 2% 1% 2% 3% 2% 2%
Totals 100% 100% 100% 101% 100% 99% 99% 100% 100% 100%
Unweighted N (1,499) (667) (832) (471) (530) (302) (196) (599) (443) (287)
Age Race Region
Total 18-29 30-44 45-64 65+ White Black Hispanic Other Northeast Midwest South West
Very Important 44% 39% 46% 43% 46% 40% 65% 45% 46% 47% 37% 45% 44%
Somewhat Important 44% 43% 39% 45% 46% 47% 26% 41% 41% 39% 50% 43% 43%
Not very Important 10% 14% 12% 10% 6% 11% 6% 13% 9% 11% 9% 10% 11%
Unimportant 2% 4% 3% 1% 2% 2% 4% 1% 4% 3% 4% 1% 2%
Totals 100% 100% 100% 99% 100% 100% 101% 100% 100% 100% 100% 99% 100%
Unweighted N (1,499) (313) (280) (593) (313) (1,087) (162) (165) (85) (275) (330) (552) (342)
Registered Primary Voter Party ID Ideology
Total Voters Dem Rep Dem Ind Rep Lib Mod Con
Very Important 44% 44% 50% 39% 52% 43% 36% 52% 44% 35%
Somewhat Important 44% 44% 43% 47% 42% 42% 49% 41% 42% 48%
Not very Important 10% 10% 7% 9% 6% 12% 13% 5% 12% 14%
Unimportant 2% 2% 0% 4% 0% 3% 3% 2% 2% 3%
Totals 100% 100% 100% 99% 100% 100% 101% 100% 100% 100%
continued on the next page . . .
279

The Economist /YouGov PollApril 26 - 28, 2020 - 1500 US Adult citizens
continued from previous pageRegistered Primary Voter Party ID Ideology
Total Voters Dem Rep Dem Ind Rep Lib Mod Con
Unweighted N (1,499) (1,222) (564) (337) (535) (584) (380) (449) (451) (456)
280

The Economist /YouGov PollApril 26 - 28, 2020 - 1500 US Adult citizens
89. Most Important IssueWhich of these is the most important issue for you?
Gender Education Income
Total Male Female HS or less Some college College grad Postgrad Under $50K $50-100K $100K or more
Jobs and the economy 23% 27% 20% 24% 22% 23% 26% 19% 26% 30%
Immigration 7% 8% 6% 9% 7% 6% 3% 7% 6% 5%
Climate change and theenvironment 12% 11% 13% 9% 10% 17% 19% 10% 13% 13%
National Security andforeign policy 5% 6% 5% 4% 5% 6% 8% 4% 6% 6%
Education 6% 3% 8% 3% 6% 8% 8% 6% 6% 6%
Health care 28% 23% 33% 29% 30% 27% 26% 36% 22% 24%
Taxes and governmentspending 6% 8% 5% 7% 5% 7% 6% 5% 8% 7%
Civil rights and civilliberties 5% 5% 4% 3% 7% 5% 1% 4% 5% 5%
Gun control 4% 5% 3% 8% 4% 0% 1% 5% 3% 3%
Crime and criminaljustice reform 3% 3% 3% 4% 4% 1% 1% 3% 5% 1%
Totals 99% 99% 100% 100% 100% 100% 99% 99% 100% 100%
Unweighted N (1,427) (623) (804) (434) (511) (288) (194) (563) (431) (274)
Age Race Region
Total 18-29 30-44 45-64 65+ White Black Hispanic Other Northeast Midwest South West
Jobs and the economy 23% 19% 21% 29% 21% 24% 19% 20% 28% 22% 21% 25% 24%
Immigration 7% 7% 4% 7% 9% 7% 1% 13% 3% 6% 6% 7% 8%
Climate change and theenvironment 12% 17% 14% 9% 9% 13% 8% 12% 11% 13% 12% 11% 13%
National Security andforeign policy 5% 3% 4% 6% 8% 6% 2% 5% 2% 4% 5% 6% 5%
continued on the next page . . .
281

The Economist /YouGov PollApril 26 - 28, 2020 - 1500 US Adult citizens
continued from previous pageAge Race Region
Total 18-29 30-44 45-64 65+ White Black Hispanic Other Northeast Midwest South West
Education 6% 8% 9% 4% 3% 5% 6% 7% 7% 6% 5% 5% 7%
Health care 28% 25% 30% 30% 27% 27% 37% 24% 35% 29% 31% 31% 22%
Taxes and governmentspending 6% 1% 5% 8% 10% 7% 2% 9% 5% 9% 6% 7% 5%
Civil rights and civilliberties 5% 6% 5% 4% 4% 4% 11% 2% 2% 5% 5% 3% 5%
Gun control 4% 9% 2% 2% 6% 3% 9% 7% 1% 4% 5% 3% 5%
Crime and criminaljustice reform 3% 4% 6% 2% 2% 3% 5% 1% 6% 2% 4% 2% 5%
Totals 99% 99% 100% 101% 99% 99% 100% 100% 100% 100% 100% 100% 99%
Unweighted N (1,427) (295) (253) (572) (307) (1,048) (150) (149) (80) (254) (319) (528) (326)
Registered Primary Voter Party ID Ideology
Total Voters Dem Rep Dem Ind Rep Lib Mod Con
Jobs and the economy 23% 24% 15% 35% 14% 22% 36% 11% 22% 35%
Immigration 7% 7% 3% 15% 3% 7% 12% 2% 5% 14%
Climate change and theenvironment 12% 14% 21% 2% 20% 11% 2% 27% 10% 3%
National Security andforeign policy 5% 6% 4% 10% 3% 6% 8% 3% 6% 8%
Education 6% 6% 5% 5% 6% 6% 5% 4% 6% 4%
Health care 28% 27% 39% 12% 40% 25% 19% 40% 30% 16%
Taxes and governmentspending 6% 7% 4% 12% 2% 7% 10% 3% 5% 12%
Civil rights and civilliberties 5% 4% 4% 3% 5% 5% 2% 4% 6% 3%
Gun control 4% 4% 3% 4% 4% 5% 4% 4% 4% 3%
continued on the next page . . .
282

The Economist /YouGov PollApril 26 - 28, 2020 - 1500 US Adult citizens
continued from previous pageRegistered Primary Voter Party ID Ideology
Total Voters Dem Rep Dem Ind Rep Lib Mod Con
Crime and criminaljustice reform 3% 2% 2% 2% 2% 5% 1% 2% 6% 1%
Totals 99% 101% 100% 100% 99% 99% 99% 100% 100% 99%
Unweighted N (1,427) (1,179) (554) (326) (513) (556) (358) (435) (434) (437)
283

The Economist /YouGov PollApril 26 - 28, 2020 - 1500 US Adult citizens
90A. Favorability Of Individuals — Donald TrumpDo you have a favorable or an unfavorable opinion of the following people?
Gender Education Income
Total Male Female HS or less Some college College grad Postgrad Under $50K $50-100K $100K or more
Very favorable 28% 31% 24% 30% 30% 23% 21% 25% 30% 28%
Somewhat favorable 16% 15% 17% 17% 15% 13% 18% 14% 20% 19%
Somewhat unfavorable 10% 12% 8% 12% 8% 10% 9% 12% 7% 10%
Very unfavorable 42% 39% 44% 34% 42% 50% 52% 41% 41% 43%
Don’t know 5% 2% 7% 7% 4% 4% 0% 7% 3% 0%
Totals 101% 99% 100% 100% 99% 100% 100% 99% 101% 100%
Unweighted N (1,491) (663) (828) (467) (527) (302) (195) (593) (441) (287)
Age Race Region
Total 18-29 30-44 45-64 65+ White Black Hispanic Other Northeast Midwest South West
Very favorable 28% 18% 18% 33% 40% 33% 7% 23% 16% 24% 28% 28% 32%
Somewhat favorable 16% 13% 20% 17% 11% 17% 10% 18% 13% 15% 11% 17% 18%
Somewhat unfavorable 10% 13% 16% 8% 4% 9% 11% 15% 9% 16% 8% 10% 7%
Very unfavorable 42% 46% 41% 38% 43% 37% 62% 37% 57% 40% 49% 39% 40%
Don’t know 5% 11% 4% 3% 1% 3% 11% 7% 4% 5% 4% 6% 3%
Totals 101% 101% 99% 99% 99% 99% 101% 100% 99% 100% 100% 100% 100%
Unweighted N (1,491) (308) (279) (592) (312) (1,084) (161) (162) (84) (271) (329) (550) (341)
Registered Primary Voter Party ID Ideology
Total Voters Dem Rep Dem Ind Rep Lib Mod Con
Very favorable 28% 31% 5% 74% 5% 22% 65% 8% 16% 60%
Somewhat favorable 16% 13% 4% 17% 9% 19% 20% 5% 20% 20%
Somewhat unfavorable 10% 8% 9% 2% 10% 12% 7% 7% 13% 8%
continued on the next page . . .
284

The Economist /YouGov PollApril 26 - 28, 2020 - 1500 US Adult citizens
continued from previous pageRegistered Primary Voter Party ID Ideology
Total Voters Dem Rep Dem Ind Rep Lib Mod Con
Very unfavorable 42% 46% 81% 7% 73% 39% 6% 78% 45% 8%
Don’t know 5% 2% 1% 0% 3% 8% 2% 2% 5% 4%
Totals 101% 100% 100% 100% 100% 100% 100% 100% 99% 100%
Unweighted N (1,491) (1,215) (564) (336) (533) (581) (377) (447) (449) (456)
285

The Economist /YouGov PollApril 26 - 28, 2020 - 1500 US Adult citizens
90B. Favorability Of Individuals — Mike PenceDo you have a favorable or an unfavorable opinion of the following people?
Gender Education Income
Total Male Female HS or less Some college College grad Postgrad Under $50K $50-100K $100K or more
Very favorable 22% 23% 21% 21% 26% 19% 19% 19% 23% 26%
Somewhat favorable 19% 22% 16% 23% 16% 18% 19% 16% 26% 19%
Somewhat unfavorable 15% 18% 11% 13% 13% 19% 16% 14% 15% 19%
Very unfavorable 31% 29% 33% 25% 32% 35% 43% 31% 29% 33%
Don’t know 13% 8% 18% 18% 13% 8% 3% 19% 6% 3%
Totals 100% 100% 99% 100% 100% 99% 100% 99% 99% 100%
Unweighted N (1,491) (663) (828) (466) (528) (302) (195) (594) (442) (286)
Age Race Region
Total 18-29 30-44 45-64 65+ White Black Hispanic Other Northeast Midwest South West
Very favorable 22% 10% 13% 27% 35% 26% 9% 16% 11% 19% 22% 21% 26%
Somewhat favorable 19% 18% 21% 21% 16% 20% 12% 23% 22% 22% 18% 19% 19%
Somewhat unfavorable 15% 18% 17% 12% 12% 15% 15% 9% 22% 16% 19% 12% 12%
Very unfavorable 31% 31% 33% 30% 31% 29% 41% 35% 32% 32% 29% 31% 33%
Don’t know 13% 22% 15% 10% 6% 11% 22% 18% 13% 11% 12% 16% 10%
Totals 100% 99% 99% 100% 100% 101% 99% 101% 100% 100% 100% 99% 100%
Unweighted N (1,491) (309) (278) (592) (312) (1,084) (161) (162) (84) (272) (329) (551) (339)
Registered Primary Voter Party ID Ideology
Total Voters Dem Rep Dem Ind Rep Lib Mod Con
Very favorable 22% 27% 7% 64% 5% 16% 53% 6% 12% 52%
Somewhat favorable 19% 17% 8% 23% 11% 21% 26% 8% 23% 25%
Somewhat unfavorable 15% 14% 18% 7% 16% 16% 9% 14% 20% 10%
continued on the next page . . .
286

The Economist /YouGov PollApril 26 - 28, 2020 - 1500 US Adult citizens
continued from previous pageRegistered Primary Voter Party ID Ideology
Total Voters Dem Rep Dem Ind Rep Lib Mod Con
Very unfavorable 31% 35% 62% 3% 59% 26% 5% 67% 29% 6%
Don’t know 13% 7% 6% 2% 9% 20% 7% 6% 15% 8%
Totals 100% 100% 101% 99% 100% 99% 100% 101% 99% 101%
Unweighted N (1,491) (1,215) (563) (336) (532) (581) (378) (446) (448) (457)
287

The Economist /YouGov PollApril 26 - 28, 2020 - 1500 US Adult citizens
90C. Favorability Of Individuals — Nancy PelosiDo you have a favorable or an unfavorable opinion of the following people?
Gender Education Income
Total Male Female HS or less Some college College grad Postgrad Under $50K $50-100K $100K or more
Very favorable 16% 14% 18% 12% 17% 17% 26% 15% 17% 19%
Somewhat favorable 19% 19% 19% 12% 19% 30% 25% 17% 19% 25%
Somewhat unfavorable 14% 17% 11% 16% 11% 12% 15% 14% 16% 14%
Very unfavorable 40% 43% 37% 42% 43% 34% 34% 38% 43% 41%
Don’t know 11% 7% 15% 18% 10% 7% 0% 16% 5% 1%
Totals 100% 100% 100% 100% 100% 100% 100% 100% 100% 100%
Unweighted N (1,492) (662) (830) (467) (528) (302) (195) (594) (442) (286)
Age Race Region
Total 18-29 30-44 45-64 65+ White Black Hispanic Other Northeast Midwest South West
Very favorable 16% 7% 15% 19% 22% 14% 30% 14% 11% 16% 14% 16% 19%
Somewhat favorable 19% 24% 29% 14% 13% 17% 26% 23% 30% 22% 20% 20% 14%
Somewhat unfavorable 14% 18% 18% 13% 6% 13% 14% 18% 19% 21% 14% 10% 13%
Very unfavorable 40% 24% 28% 49% 54% 49% 10% 20% 28% 32% 41% 41% 43%
Don’t know 11% 27% 11% 6% 4% 7% 20% 25% 12% 9% 11% 13% 10%
Totals 100% 100% 101% 101% 99% 100% 100% 100% 100% 100% 100% 100% 99%
Unweighted N (1,492) (309) (279) (592) (312) (1,085) (161) (162) (84) (272) (329) (551) (340)
Registered Primary Voter Party ID Ideology
Total Voters Dem Rep Dem Ind Rep Lib Mod Con
Very favorable 16% 21% 41% 2% 39% 7% 3% 33% 17% 3%
Somewhat favorable 19% 19% 33% 3% 32% 17% 6% 34% 21% 7%
Somewhat unfavorable 14% 12% 12% 7% 12% 17% 11% 15% 16% 9%
continued on the next page . . .
288

The Economist /YouGov PollApril 26 - 28, 2020 - 1500 US Adult citizens
continued from previous pageRegistered Primary Voter Party ID Ideology
Total Voters Dem Rep Dem Ind Rep Lib Mod Con
Very unfavorable 40% 43% 9% 87% 6% 43% 76% 8% 36% 75%
Don’t know 11% 5% 6% 1% 10% 17% 4% 10% 10% 6%
Totals 100% 100% 101% 100% 99% 101% 100% 100% 100% 100%
Unweighted N (1,492) (1,214) (563) (336) (532) (582) (378) (446) (449) (457)
289

The Economist /YouGov PollApril 26 - 28, 2020 - 1500 US Adult citizens
90D. Favorability Of Individuals — Mitch McConnellDo you have a favorable or an unfavorable opinion of the following people?
Gender Education Income
Total Male Female HS or less Some college College grad Postgrad Under $50K $50-100K $100K or more
Very favorable 7% 8% 6% 8% 6% 6% 8% 7% 8% 8%
Somewhat favorable 17% 20% 15% 14% 20% 20% 17% 13% 20% 25%
Somewhat unfavorable 15% 19% 12% 15% 12% 20% 13% 15% 16% 14%
Very unfavorable 35% 35% 35% 28% 36% 39% 48% 32% 36% 42%
Don’t know 25% 18% 33% 34% 26% 15% 13% 33% 21% 11%
Totals 99% 100% 101% 99% 100% 100% 99% 100% 101% 100%
Unweighted N (1,486) (660) (826) (465) (526) (301) (194) (591) (439) (286)
Age Race Region
Total 18-29 30-44 45-64 65+ White Black Hispanic Other Northeast Midwest South West
Very favorable 7% 5% 7% 6% 11% 8% 4% 9% 5% 6% 6% 8% 8%
Somewhat favorable 17% 10% 10% 22% 26% 20% 11% 14% 9% 17% 17% 17% 20%
Somewhat unfavorable 15% 15% 22% 14% 9% 15% 11% 16% 27% 18% 16% 14% 13%
Very unfavorable 35% 26% 34% 35% 43% 36% 36% 27% 38% 33% 37% 34% 37%
Don’t know 25% 43% 27% 23% 10% 22% 38% 33% 20% 27% 24% 28% 22%
Totals 99% 99% 100% 100% 99% 101% 100% 99% 99% 101% 100% 101% 100%
Unweighted N (1,486) (309) (277) (591) (309) (1,080) (161) (161) (84) (272) (325) (550) (339)
Registered Primary Voter Party ID Ideology
Total Voters Dem Rep Dem Ind Rep Lib Mod Con
Very favorable 7% 9% 4% 19% 3% 5% 15% 2% 4% 16%
Somewhat favorable 17% 20% 7% 43% 9% 12% 37% 5% 15% 36%
Somewhat unfavorable 15% 15% 12% 11% 9% 19% 15% 9% 20% 15%
continued on the next page . . .
290

The Economist /YouGov PollApril 26 - 28, 2020 - 1500 US Adult citizens
continued from previous pageRegistered Primary Voter Party ID Ideology
Total Voters Dem Rep Dem Ind Rep Lib Mod Con
Very unfavorable 35% 40% 65% 12% 58% 32% 12% 63% 37% 13%
Don’t know 25% 16% 11% 14% 21% 32% 21% 20% 24% 21%
Totals 99% 100% 99% 99% 100% 100% 100% 99% 100% 101%
Unweighted N (1,486) (1,210) (562) (333) (531) (580) (375) (446) (448) (454)
291

The Economist /YouGov PollApril 26 - 28, 2020 - 1500 US Adult citizens
91A. Favorability Of Political Parties — The Democratic PartyDo you have a favorable or unfavorable opinion of the political parties?
Gender Education Income
Total Male Female HS or less Some college College grad Postgrad Under $50K $50-100K $100K or more
Very favorable 17% 16% 19% 15% 19% 17% 19% 18% 15% 16%
Somewhat favorable 24% 22% 26% 20% 23% 31% 32% 22% 28% 26%
Somewhat unfavorable 16% 17% 15% 13% 16% 19% 16% 16% 16% 20%
Very unfavorable 33% 40% 27% 35% 34% 30% 32% 30% 34% 36%
Don’t know 9% 6% 13% 17% 8% 3% 0% 13% 7% 2%
Totals 99% 101% 100% 100% 100% 100% 99% 99% 100% 100%
Unweighted N (1,479) (662) (817) (464) (524) (298) (193) (591) (440) (283)
Age Race Region
Total 18-29 30-44 45-64 65+ White Black Hispanic Other Northeast Midwest South West
Very favorable 17% 18% 13% 19% 19% 13% 40% 20% 11% 16% 16% 19% 16%
Somewhat favorable 24% 30% 29% 19% 21% 22% 33% 29% 32% 30% 26% 22% 22%
Somewhat unfavorable 16% 18% 21% 13% 10% 17% 8% 11% 23% 19% 15% 16% 13%
Very unfavorable 33% 21% 26% 39% 43% 40% 9% 24% 26% 25% 34% 34% 39%
Don’t know 9% 13% 11% 9% 6% 9% 10% 15% 8% 11% 9% 9% 10%
Totals 99% 100% 100% 99% 99% 101% 100% 99% 100% 101% 100% 100% 100%
Unweighted N (1,479) (304) (277) (590) (308) (1,074) (160) (161) (84) (271) (326) (544) (338)
Registered Primary Voter Party ID Ideology
Total Voters Dem Rep Dem Ind Rep Lib Mod Con
Very favorable 17% 20% 39% 2% 44% 5% 2% 34% 17% 6%
Somewhat favorable 24% 25% 42% 6% 41% 22% 8% 41% 28% 9%
Somewhat unfavorable 16% 14% 11% 12% 9% 21% 15% 14% 19% 13%
continued on the next page . . .
292

The Economist /YouGov PollApril 26 - 28, 2020 - 1500 US Adult citizens
continued from previous pageRegistered Primary Voter Party ID Ideology
Total Voters Dem Rep Dem Ind Rep Lib Mod Con
Very unfavorable 33% 36% 6% 79% 3% 33% 71% 7% 26% 67%
Don’t know 9% 4% 1% 1% 3% 19% 3% 3% 10% 5%
Totals 99% 99% 99% 100% 100% 100% 99% 99% 100% 100%
Unweighted N (1,479) (1,206) (561) (333) (530) (576) (373) (442) (446) (454)
293

The Economist /YouGov PollApril 26 - 28, 2020 - 1500 US Adult citizens
91B. Favorability Of Political Parties — The Republican PartyDo you have a favorable or unfavorable opinion of the political parties?
Gender Education Income
Total Male Female HS or less Some college College grad Postgrad Under $50K $50-100K $100K or more
Very favorable 17% 17% 16% 18% 17% 16% 12% 18% 15% 16%
Somewhat favorable 23% 27% 20% 24% 23% 23% 20% 19% 29% 30%
Somewhat unfavorable 15% 15% 15% 14% 16% 15% 19% 16% 15% 16%
Very unfavorable 35% 35% 34% 27% 35% 42% 48% 33% 34% 36%
Don’t know 10% 6% 14% 17% 9% 4% 1% 14% 7% 2%
Totals 100% 100% 99% 100% 100% 100% 100% 100% 100% 100%
Unweighted N (1,475) (659) (816) (458) (522) (300) (195) (586) (437) (286)
Age Race Region
Total 18-29 30-44 45-64 65+ White Black Hispanic Other Northeast Midwest South West
Very favorable 17% 13% 12% 17% 24% 21% 3% 10% 7% 14% 17% 17% 19%
Somewhat favorable 23% 22% 23% 25% 21% 25% 11% 27% 19% 22% 22% 25% 22%
Somewhat unfavorable 15% 21% 16% 12% 14% 15% 15% 13% 21% 18% 14% 15% 16%
Very unfavorable 35% 32% 36% 36% 35% 30% 57% 32% 45% 35% 39% 34% 32%
Don’t know 10% 13% 12% 10% 5% 8% 14% 17% 8% 11% 9% 10% 11%
Totals 100% 101% 99% 100% 99% 99% 100% 99% 100% 100% 101% 101% 100%
Unweighted N (1,475) (300) (277) (588) (310) (1,075) (158) (159) (83) (269) (329) (540) (337)
Registered Primary Voter Party ID Ideology
Total Voters Dem Rep Dem Ind Rep Lib Mod Con
Very favorable 17% 18% 2% 47% 2% 8% 48% 5% 10% 36%
Somewhat favorable 23% 23% 8% 43% 10% 23% 38% 8% 22% 39%
Somewhat unfavorable 15% 16% 18% 7% 15% 21% 8% 10% 24% 12%
continued on the next page . . .
294

The Economist /YouGov PollApril 26 - 28, 2020 - 1500 US Adult citizens
continued from previous pageRegistered Primary Voter Party ID Ideology
Total Voters Dem Rep Dem Ind Rep Lib Mod Con
Very unfavorable 35% 39% 70% 3% 67% 30% 3% 73% 34% 8%
Don’t know 10% 5% 2% 1% 5% 19% 3% 4% 11% 6%
Totals 100% 101% 100% 101% 99% 101% 100% 100% 101% 101%
Unweighted N (1,475) (1,204) (555) (336) (525) (572) (378) (444) (442) (454)
295
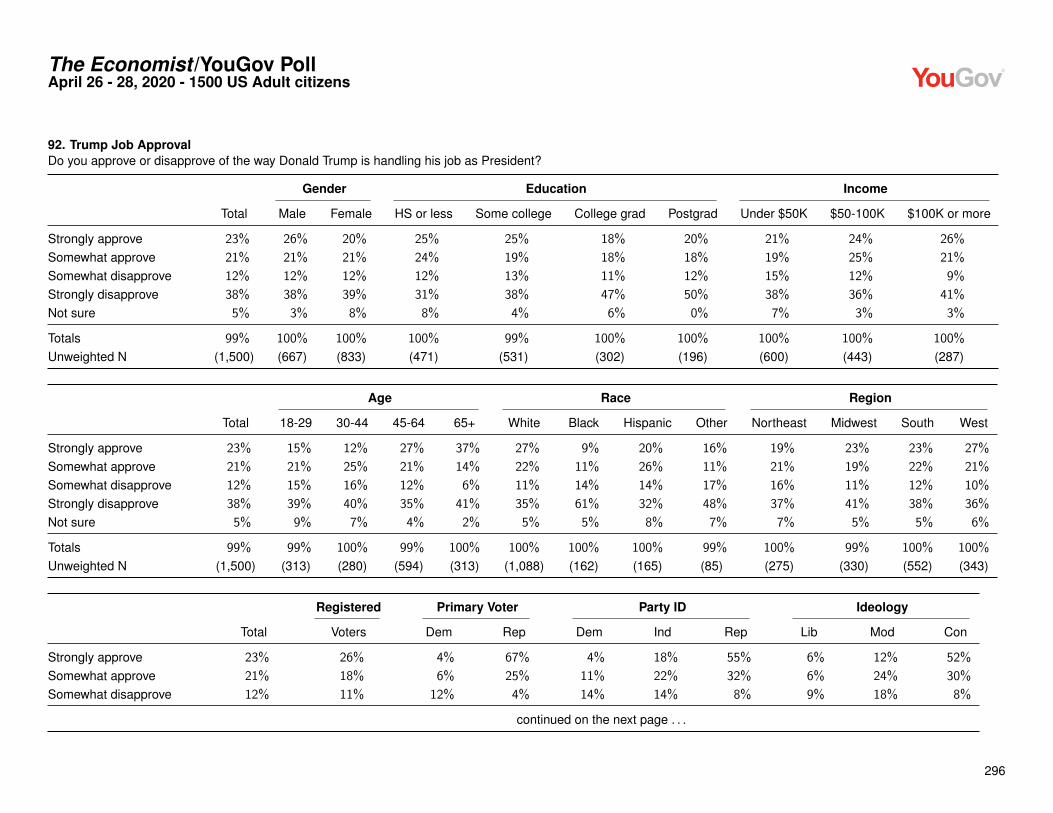
The Economist /YouGov PollApril 26 - 28, 2020 - 1500 US Adult citizens
92. Trump Job ApprovalDo you approve or disapprove of the way Donald Trump is handling his job as President?
Gender Education Income
Total Male Female HS or less Some college College grad Postgrad Under $50K $50-100K $100K or more
Strongly approve 23% 26% 20% 25% 25% 18% 20% 21% 24% 26%
Somewhat approve 21% 21% 21% 24% 19% 18% 18% 19% 25% 21%
Somewhat disapprove 12% 12% 12% 12% 13% 11% 12% 15% 12% 9%
Strongly disapprove 38% 38% 39% 31% 38% 47% 50% 38% 36% 41%
Not sure 5% 3% 8% 8% 4% 6% 0% 7% 3% 3%
Totals 99% 100% 100% 100% 99% 100% 100% 100% 100% 100%
Unweighted N (1,500) (667) (833) (471) (531) (302) (196) (600) (443) (287)
Age Race Region
Total 18-29 30-44 45-64 65+ White Black Hispanic Other Northeast Midwest South West
Strongly approve 23% 15% 12% 27% 37% 27% 9% 20% 16% 19% 23% 23% 27%
Somewhat approve 21% 21% 25% 21% 14% 22% 11% 26% 11% 21% 19% 22% 21%
Somewhat disapprove 12% 15% 16% 12% 6% 11% 14% 14% 17% 16% 11% 12% 10%
Strongly disapprove 38% 39% 40% 35% 41% 35% 61% 32% 48% 37% 41% 38% 36%
Not sure 5% 9% 7% 4% 2% 5% 5% 8% 7% 7% 5% 5% 6%
Totals 99% 99% 100% 99% 100% 100% 100% 100% 99% 100% 99% 100% 100%
Unweighted N (1,500) (313) (280) (594) (313) (1,088) (162) (165) (85) (275) (330) (552) (343)
Registered Primary Voter Party ID Ideology
Total Voters Dem Rep Dem Ind Rep Lib Mod Con
Strongly approve 23% 26% 4% 67% 4% 18% 55% 6% 12% 52%
Somewhat approve 21% 18% 6% 25% 11% 22% 32% 6% 24% 30%
Somewhat disapprove 12% 11% 12% 4% 14% 14% 8% 9% 18% 8%
continued on the next page . . .
296

The Economist /YouGov PollApril 26 - 28, 2020 - 1500 US Adult citizens
continued from previous pageRegistered Primary Voter Party ID Ideology
Total Voters Dem Rep Dem Ind Rep Lib Mod Con
Strongly disapprove 38% 42% 77% 4% 69% 37% 3% 76% 39% 7%
Not sure 5% 2% 1% 0% 3% 10% 3% 2% 8% 2%
Totals 99% 99% 100% 100% 101% 101% 101% 99% 101% 99%
Unweighted N (1,500) (1,222) (564) (337) (536) (584) (380) (449) (451) (457)
297

The Economist /YouGov PollApril 26 - 28, 2020 - 1500 US Adult citizens
93A. Trump Approval On Issues — Jobs and the economyDo you approve or disapprove of the way Donald Trump is handling these specific issues?
Gender Education Income
Total Male Female HS or less Some college College grad Postgrad Under $50K $50-100K $100K or more
Strongly approve 32% 36% 29% 35% 34% 27% 23% 29% 38% 32%
Somewhat approve 20% 21% 19% 19% 19% 20% 25% 18% 22% 24%
Somewhat disapprove 14% 15% 12% 15% 11% 16% 13% 14% 13% 14%
Strongly disapprove 26% 22% 30% 20% 28% 30% 37% 25% 25% 27%
No opinion 8% 6% 10% 11% 8% 6% 1% 13% 3% 3%
Totals 100% 100% 100% 100% 100% 99% 99% 99% 101% 100%
Unweighted N (1,481) (661) (820) (463) (523) (300) (195) (590) (438) (285)
Age Race Region
Total 18-29 30-44 45-64 65+ White Black Hispanic Other Northeast Midwest South West
Strongly approve 32% 23% 24% 37% 42% 37% 9% 32% 30% 29% 31% 32% 36%
Somewhat approve 20% 22% 20% 21% 16% 21% 16% 18% 16% 23% 21% 20% 16%
Somewhat disapprove 14% 19% 17% 12% 8% 12% 15% 19% 16% 17% 12% 14% 12%
Strongly disapprove 26% 23% 31% 23% 30% 23% 42% 27% 32% 24% 27% 27% 27%
No opinion 8% 13% 9% 7% 4% 7% 19% 4% 6% 7% 9% 8% 8%
Totals 100% 100% 101% 100% 100% 100% 101% 100% 100% 100% 100% 101% 99%
Unweighted N (1,481) (309) (273) (588) (311) (1,078) (160) (161) (82) (272) (324) (547) (338)
Registered Primary Voter Party ID Ideology
Total Voters Dem Rep Dem Ind Rep Lib Mod Con
Strongly approve 32% 34% 6% 78% 8% 29% 66% 11% 23% 63%
Somewhat approve 20% 20% 16% 15% 18% 21% 20% 10% 30% 21%
Somewhat disapprove 14% 12% 18% 4% 17% 17% 5% 20% 16% 5%
continued on the next page . . .
298

The Economist /YouGov PollApril 26 - 28, 2020 - 1500 US Adult citizens
continued from previous pageRegistered Primary Voter Party ID Ideology
Total Voters Dem Rep Dem Ind Rep Lib Mod Con
Strongly disapprove 26% 29% 56% 2% 52% 20% 4% 56% 23% 5%
No opinion 8% 4% 4% 1% 5% 12% 5% 4% 9% 6%
Totals 100% 99% 100% 100% 100% 99% 100% 101% 101% 100%
Unweighted N (1,481) (1,212) (559) (336) (530) (575) (376) (445) (443) (454)
299

The Economist /YouGov PollApril 26 - 28, 2020 - 1500 US Adult citizens
93B. Trump Approval On Issues — ImmigrationDo you approve or disapprove of the way Donald Trump is handling these specific issues?
Gender Education Income
Total Male Female HS or less Some college College grad Postgrad Under $50K $50-100K $100K or more
Strongly approve 30% 32% 28% 32% 33% 24% 23% 27% 33% 32%
Somewhat approve 17% 20% 13% 17% 16% 15% 19% 15% 20% 20%
Somewhat disapprove 11% 11% 10% 13% 10% 9% 8% 14% 9% 8%
Strongly disapprove 36% 32% 39% 28% 34% 46% 50% 33% 35% 38%
No opinion 7% 5% 9% 11% 7% 5% 0% 11% 3% 2%
Totals 101% 100% 99% 101% 100% 99% 100% 100% 100% 100%
Unweighted N (1,481) (662) (819) (464) (521) (300) (196) (590) (437) (286)
Age Race Region
Total 18-29 30-44 45-64 65+ White Black Hispanic Other Northeast Midwest South West
Strongly approve 30% 16% 20% 36% 45% 35% 10% 24% 23% 23% 31% 28% 38%
Somewhat approve 17% 18% 20% 18% 8% 18% 13% 17% 7% 24% 12% 18% 12%
Somewhat disapprove 11% 19% 10% 9% 6% 9% 13% 18% 17% 17% 12% 9% 8%
Strongly disapprove 36% 37% 39% 31% 38% 32% 49% 37% 45% 32% 40% 36% 34%
No opinion 7% 11% 10% 6% 3% 6% 14% 3% 8% 5% 6% 9% 8%
Totals 101% 101% 99% 100% 100% 100% 99% 99% 100% 101% 101% 100% 100%
Unweighted N (1,481) (306) (276) (588) (311) (1,079) (159) (160) (83) (270) (328) (546) (337)
Registered Primary Voter Party ID Ideology
Total Voters Dem Rep Dem Ind Rep Lib Mod Con
Strongly approve 30% 33% 7% 74% 8% 25% 64% 10% 22% 60%
Somewhat approve 17% 15% 8% 18% 9% 19% 22% 6% 21% 21%
Somewhat disapprove 11% 8% 11% 3% 12% 14% 5% 10% 14% 7%
continued on the next page . . .
300

The Economist /YouGov PollApril 26 - 28, 2020 - 1500 US Adult citizens
continued from previous pageRegistered Primary Voter Party ID Ideology
Total Voters Dem Rep Dem Ind Rep Lib Mod Con
Strongly disapprove 36% 40% 72% 4% 66% 32% 5% 73% 35% 7%
No opinion 7% 3% 2% 2% 4% 11% 5% 2% 7% 6%
Totals 101% 99% 100% 101% 99% 101% 101% 101% 99% 101%
Unweighted N (1,481) (1,208) (556) (335) (526) (577) (378) (445) (441) (456)
301

The Economist /YouGov PollApril 26 - 28, 2020 - 1500 US Adult citizens
93C. Trump Approval On Issues — Climate change and the environmentDo you approve or disapprove of the way Donald Trump is handling these specific issues?
Gender Education Income
Total Male Female HS or less Some college College grad Postgrad Under $50K $50-100K $100K or more
Strongly approve 16% 19% 14% 17% 20% 13% 10% 15% 17% 15%
Somewhat approve 16% 17% 14% 16% 13% 18% 18% 12% 22% 18%
Somewhat disapprove 14% 14% 13% 17% 11% 10% 14% 17% 12% 8%
Strongly disapprove 38% 35% 41% 29% 38% 48% 51% 33% 41% 43%
No opinion 16% 14% 18% 22% 17% 11% 6% 23% 9% 16%
Totals 100% 99% 100% 101% 99% 100% 99% 100% 101% 100%
Unweighted N (1,483) (662) (821) (464) (524) (300) (195) (590) (439) (287)
Age Race Region
Total 18-29 30-44 45-64 65+ White Black Hispanic Other Northeast Midwest South West
Strongly approve 16% 12% 8% 22% 21% 18% 7% 17% 12% 14% 16% 15% 21%
Somewhat approve 16% 9% 17% 18% 18% 18% 8% 12% 12% 20% 12% 16% 15%
Somewhat disapprove 14% 19% 17% 13% 7% 11% 20% 20% 18% 15% 12% 16% 10%
Strongly disapprove 38% 40% 36% 35% 43% 35% 48% 37% 51% 40% 42% 35% 38%
No opinion 16% 20% 22% 13% 12% 17% 17% 15% 6% 12% 17% 18% 16%
Totals 100% 100% 100% 101% 101% 99% 100% 101% 99% 101% 99% 100% 100%
Unweighted N (1,483) (306) (276) (588) (313) (1,078) (160) (161) (84) (271) (328) (547) (337)
Registered Primary Voter Party ID Ideology
Total Voters Dem Rep Dem Ind Rep Lib Mod Con
Strongly approve 16% 19% 4% 45% 4% 13% 36% 7% 8% 35%
Somewhat approve 16% 17% 5% 30% 8% 12% 30% 6% 16% 28%
Somewhat disapprove 14% 10% 8% 6% 12% 17% 11% 12% 17% 10%
continued on the next page . . .
302

The Economist /YouGov PollApril 26 - 28, 2020 - 1500 US Adult citizens
continued from previous pageRegistered Primary Voter Party ID Ideology
Total Voters Dem Rep Dem Ind Rep Lib Mod Con
Strongly disapprove 38% 44% 78% 5% 70% 34% 6% 73% 43% 7%
No opinion 16% 10% 4% 14% 6% 24% 17% 3% 16% 20%
Totals 100% 100% 99% 100% 100% 100% 100% 101% 100% 100%
Unweighted N (1,483) (1,212) (560) (336) (530) (575) (378) (446) (445) (455)
303

The Economist /YouGov PollApril 26 - 28, 2020 - 1500 US Adult citizens
93D. Trump Approval On Issues — TerrorismDo you approve or disapprove of the way Donald Trump is handling these specific issues?
Gender Education Income
Total Male Female HS or less Some college College grad Postgrad Under $50K $50-100K $100K or more
Strongly approve 28% 32% 24% 31% 27% 24% 25% 25% 29% 30%
Somewhat approve 19% 19% 20% 17% 21% 20% 18% 18% 23% 21%
Somewhat disapprove 10% 12% 9% 12% 10% 9% 11% 14% 9% 7%
Strongly disapprove 32% 30% 34% 25% 31% 41% 43% 28% 32% 35%
No opinion 11% 8% 14% 16% 11% 6% 3% 15% 7% 7%
Totals 100% 101% 101% 101% 100% 100% 100% 100% 100% 100%
Unweighted N (1,481) (661) (820) (465) (523) (298) (195) (591) (437) (284)
Age Race Region
Total 18-29 30-44 45-64 65+ White Black Hispanic Other Northeast Midwest South West
Strongly approve 28% 21% 16% 33% 38% 32% 9% 28% 15% 25% 26% 28% 31%
Somewhat approve 19% 18% 24% 19% 15% 19% 14% 22% 22% 19% 18% 21% 17%
Somewhat disapprove 10% 15% 11% 11% 5% 9% 17% 13% 15% 14% 11% 11% 5%
Strongly disapprove 32% 30% 34% 29% 36% 29% 46% 29% 41% 30% 36% 30% 33%
No opinion 11% 16% 15% 8% 5% 11% 13% 9% 7% 12% 9% 10% 14%
Totals 100% 100% 100% 100% 99% 100% 99% 101% 100% 100% 100% 100% 100%
Unweighted N (1,481) (309) (272) (589) (311) (1,082) (160) (158) (81) (270) (328) (545) (338)
Registered Primary Voter Party ID Ideology
Total Voters Dem Rep Dem Ind Rep Lib Mod Con
Strongly approve 28% 31% 7% 71% 8% 23% 59% 9% 18% 58%
Somewhat approve 19% 17% 9% 20% 14% 20% 24% 8% 25% 24%
Somewhat disapprove 10% 10% 12% 3% 12% 12% 7% 10% 14% 6%
continued on the next page . . .
304

The Economist /YouGov PollApril 26 - 28, 2020 - 1500 US Adult citizens
continued from previous pageRegistered Primary Voter Party ID Ideology
Total Voters Dem Rep Dem Ind Rep Lib Mod Con
Strongly disapprove 32% 36% 67% 4% 60% 27% 3% 68% 30% 4%
No opinion 11% 5% 5% 3% 6% 17% 7% 4% 13% 8%
Totals 100% 99% 100% 101% 100% 99% 100% 99% 100% 100%
Unweighted N (1,481) (1,209) (558) (333) (528) (578) (375) (445) (444) (452)
305

The Economist /YouGov PollApril 26 - 28, 2020 - 1500 US Adult citizens
93E. Trump Approval On Issues — EducationDo you approve or disapprove of the way Donald Trump is handling these specific issues?
Gender Education Income
Total Male Female HS or less Some college College grad Postgrad Under $50K $50-100K $100K or more
Strongly approve 17% 18% 16% 18% 17% 18% 10% 17% 16% 17%
Somewhat approve 21% 24% 19% 25% 22% 16% 17% 21% 24% 22%
Somewhat disapprove 13% 15% 12% 12% 12% 15% 19% 13% 14% 14%
Strongly disapprove 31% 29% 33% 24% 31% 40% 42% 29% 32% 33%
No opinion 17% 15% 20% 22% 18% 11% 12% 21% 13% 14%
Totals 99% 101% 100% 101% 100% 100% 100% 101% 99% 100%
Unweighted N (1,483) (663) (820) (465) (522) (301) (195) (589) (440) (286)
Age Race Region
Total 18-29 30-44 45-64 65+ White Black Hispanic Other Northeast Midwest South West
Strongly approve 17% 15% 10% 20% 22% 19% 8% 19% 9% 16% 15% 17% 19%
Somewhat approve 21% 18% 19% 24% 24% 23% 10% 23% 18% 21% 19% 21% 25%
Somewhat disapprove 13% 19% 16% 11% 8% 12% 13% 14% 27% 18% 14% 13% 10%
Strongly disapprove 31% 25% 35% 30% 34% 27% 50% 33% 33% 32% 32% 31% 29%
No opinion 17% 23% 20% 15% 12% 18% 19% 12% 13% 12% 19% 19% 17%
Totals 99% 100% 100% 100% 100% 99% 100% 101% 100% 99% 99% 101% 100%
Unweighted N (1,483) (307) (275) (589) (312) (1,079) (160) (161) (83) (271) (326) (547) (339)
Registered Primary Voter Party ID Ideology
Total Voters Dem Rep Dem Ind Rep Lib Mod Con
Strongly approve 17% 19% 4% 46% 6% 12% 38% 8% 9% 34%
Somewhat approve 21% 22% 8% 36% 11% 22% 34% 7% 20% 36%
Somewhat disapprove 13% 12% 15% 6% 13% 18% 7% 15% 20% 6%
continued on the next page . . .
306

The Economist /YouGov PollApril 26 - 28, 2020 - 1500 US Adult citizens
continued from previous pageRegistered Primary Voter Party ID Ideology
Total Voters Dem Rep Dem Ind Rep Lib Mod Con
Strongly disapprove 31% 36% 67% 4% 60% 24% 5% 62% 31% 7%
No opinion 17% 11% 6% 8% 10% 24% 16% 8% 21% 17%
Totals 99% 100% 100% 100% 100% 100% 100% 100% 101% 100%
Unweighted N (1,483) (1,211) (560) (335) (530) (577) (376) (446) (445) (453)
307

The Economist /YouGov PollApril 26 - 28, 2020 - 1500 US Adult citizens
93F. Trump Approval On Issues — Health careDo you approve or disapprove of the way Donald Trump is handling these specific issues?
Gender Education Income
Total Male Female HS or less Some college College grad Postgrad Under $50K $50-100K $100K or more
Strongly approve 19% 20% 18% 20% 20% 17% 16% 19% 18% 20%
Somewhat approve 22% 25% 19% 24% 22% 18% 18% 19% 26% 25%
Somewhat disapprove 13% 13% 13% 13% 12% 13% 16% 16% 14% 9%
Strongly disapprove 36% 35% 36% 28% 35% 46% 47% 33% 35% 40%
No opinion 10% 7% 13% 15% 11% 6% 3% 14% 8% 7%
Totals 100% 100% 99% 100% 100% 100% 100% 101% 101% 101%
Unweighted N (1,476) (661) (815) (462) (521) (298) (195) (586) (434) (286)
Age Race Region
Total 18-29 30-44 45-64 65+ White Black Hispanic Other Northeast Midwest South West
Strongly approve 19% 15% 15% 21% 25% 20% 8% 24% 18% 20% 17% 19% 20%
Somewhat approve 22% 17% 17% 27% 23% 26% 8% 16% 14% 16% 19% 24% 25%
Somewhat disapprove 13% 17% 17% 11% 7% 11% 17% 19% 14% 20% 13% 12% 9%
Strongly disapprove 36% 38% 36% 33% 39% 32% 55% 36% 47% 35% 40% 34% 34%
No opinion 10% 13% 15% 8% 6% 11% 12% 5% 9% 9% 11% 10% 12%
Totals 100% 100% 100% 100% 100% 100% 100% 100% 102% 100% 100% 99% 100%
Unweighted N (1,476) (307) (277) (584) (308) (1,073) (159) (161) (83) (272) (327) (540) (337)
Registered Primary Voter Party ID Ideology
Total Voters Dem Rep Dem Ind Rep Lib Mod Con
Strongly approve 19% 21% 5% 52% 6% 13% 43% 9% 10% 39%
Somewhat approve 22% 21% 6% 36% 10% 22% 36% 6% 20% 37%
Somewhat disapprove 13% 13% 14% 5% 14% 17% 7% 11% 19% 9%
continued on the next page . . .
308

The Economist /YouGov PollApril 26 - 28, 2020 - 1500 US Adult citizens
continued from previous pageRegistered Primary Voter Party ID Ideology
Total Voters Dem Rep Dem Ind Rep Lib Mod Con
Strongly disapprove 36% 39% 72% 4% 65% 32% 6% 71% 36% 6%
No opinion 10% 5% 4% 4% 5% 16% 9% 2% 15% 8%
Totals 100% 99% 101% 101% 100% 100% 101% 99% 100% 99%
Unweighted N (1,476) (1,204) (557) (331) (529) (575) (372) (445) (443) (450)
309

The Economist /YouGov PollApril 26 - 28, 2020 - 1500 US Adult citizens
93G. Trump Approval On Issues — Taxes and government spendingDo you approve or disapprove of the way Donald Trump is handling these specific issues?
Gender Education Income
Total Male Female HS or less Some college College grad Postgrad Under $50K $50-100K $100K or more
Strongly approve 20% 20% 20% 22% 22% 14% 14% 19% 22% 20%
Somewhat approve 23% 25% 20% 23% 21% 26% 20% 19% 27% 26%
Somewhat disapprove 14% 16% 12% 14% 13% 13% 19% 17% 12% 15%
Strongly disapprove 32% 31% 33% 25% 32% 40% 45% 29% 32% 36%
No opinion 11% 8% 14% 16% 11% 7% 1% 16% 8% 3%
Totals 100% 100% 99% 100% 99% 100% 99% 100% 101% 100%
Unweighted N (1,481) (661) (820) (464) (524) (298) (195) (590) (437) (286)
Age Race Region
Total 18-29 30-44 45-64 65+ White Black Hispanic Other Northeast Midwest South West
Strongly approve 20% 15% 13% 24% 27% 22% 9% 24% 14% 17% 21% 20% 22%
Somewhat approve 23% 22% 22% 24% 21% 25% 14% 19% 14% 19% 20% 25% 23%
Somewhat disapprove 14% 15% 19% 14% 8% 14% 14% 13% 21% 20% 14% 14% 9%
Strongly disapprove 32% 30% 33% 29% 38% 29% 47% 33% 39% 31% 36% 30% 32%
No opinion 11% 19% 12% 9% 6% 10% 16% 12% 12% 12% 9% 11% 13%
Totals 100% 101% 99% 100% 100% 100% 100% 101% 100% 99% 100% 100% 99%
Unweighted N (1,481) (309) (275) (589) (308) (1,078) (160) (160) (83) (271) (329) (545) (336)
Registered Primary Voter Party ID Ideology
Total Voters Dem Rep Dem Ind Rep Lib Mod Con
Strongly approve 20% 22% 4% 51% 7% 14% 45% 8% 12% 39%
Somewhat approve 23% 23% 11% 36% 12% 24% 33% 9% 24% 36%
Somewhat disapprove 14% 13% 13% 8% 13% 17% 12% 9% 21% 11%
continued on the next page . . .
310

The Economist /YouGov PollApril 26 - 28, 2020 - 1500 US Adult citizens
continued from previous pageRegistered Primary Voter Party ID Ideology
Total Voters Dem Rep Dem Ind Rep Lib Mod Con
Strongly disapprove 32% 36% 67% 3% 61% 27% 4% 69% 30% 5%
No opinion 11% 6% 5% 2% 7% 18% 6% 5% 13% 9%
Totals 100% 100% 100% 100% 100% 100% 100% 100% 100% 100%
Unweighted N (1,481) (1,209) (556) (335) (526) (576) (379) (444) (445) (453)
311

The Economist /YouGov PollApril 26 - 28, 2020 - 1500 US Adult citizens
93H. Trump Approval On Issues — Civil rights and civil libertiesDo you approve or disapprove of the way Donald Trump is handling these specific issues?
Gender Education Income
Total Male Female HS or less Some college College grad Postgrad Under $50K $50-100K $100K or more
Strongly approve 20% 21% 18% 22% 22% 16% 14% 19% 20% 19%
Somewhat approve 20% 21% 18% 19% 19% 21% 20% 16% 25% 23%
Somewhat disapprove 13% 15% 12% 14% 13% 12% 14% 17% 10% 11%
Strongly disapprove 32% 30% 33% 24% 32% 41% 44% 30% 31% 35%
No opinion 16% 12% 19% 21% 14% 11% 8% 18% 13% 11%
Totals 101% 99% 100% 100% 100% 101% 100% 100% 99% 99%
Unweighted N (1,459) (653) (806) (453) (516) (296) (194) (581) (432) (283)
Age Race Region
Total 18-29 30-44 45-64 65+ White Black Hispanic Other Northeast Midwest South West
Strongly approve 20% 15% 11% 23% 28% 21% 7% 25% 16% 17% 19% 19% 24%
Somewhat approve 20% 17% 17% 24% 18% 21% 10% 18% 18% 17% 16% 22% 21%
Somewhat disapprove 13% 16% 17% 11% 11% 12% 16% 16% 18% 16% 15% 12% 12%
Strongly disapprove 32% 27% 34% 31% 35% 28% 53% 27% 37% 32% 33% 32% 30%
No opinion 16% 25% 20% 11% 9% 16% 14% 14% 10% 18% 16% 16% 12%
Totals 101% 100% 99% 100% 101% 98% 100% 100% 99% 100% 99% 101% 99%
Unweighted N (1,459) (301) (271) (578) (309) (1,063) (157) (159) (80) (267) (322) (537) (333)
Registered Primary Voter Party ID Ideology
Total Voters Dem Rep Dem Ind Rep Lib Mod Con
Strongly approve 20% 22% 5% 54% 6% 15% 43% 9% 11% 40%
Somewhat approve 20% 20% 9% 30% 10% 19% 32% 6% 23% 31%
Somewhat disapprove 13% 12% 14% 6% 15% 16% 8% 12% 19% 8%
continued on the next page . . .
312

The Economist /YouGov PollApril 26 - 28, 2020 - 1500 US Adult citizens
continued from previous pageRegistered Primary Voter Party ID Ideology
Total Voters Dem Rep Dem Ind Rep Lib Mod Con
Strongly disapprove 32% 36% 68% 3% 62% 26% 3% 69% 30% 3%
No opinion 16% 10% 5% 8% 7% 24% 14% 4% 17% 17%
Totals 101% 100% 101% 101% 100% 100% 100% 100% 100% 99%
Unweighted N (1,459) (1,192) (548) (330) (520) (567) (372) (435) (440) (449)
313

The Economist /YouGov PollApril 26 - 28, 2020 - 1500 US Adult citizens
93I. Trump Approval On Issues — Gun controlDo you approve or disapprove of the way Donald Trump is handling these specific issues?
Gender Education Income
Total Male Female HS or less Some college College grad Postgrad Under $50K $50-100K $100K or more
Strongly approve 22% 24% 20% 24% 23% 17% 21% 21% 22% 24%
Somewhat approve 18% 20% 15% 19% 17% 19% 16% 15% 23% 21%
Somewhat disapprove 12% 15% 9% 12% 10% 13% 13% 14% 12% 10%
Strongly disapprove 33% 29% 37% 27% 34% 39% 41% 31% 31% 34%
No opinion 15% 11% 19% 18% 16% 12% 9% 20% 11% 12%
Totals 100% 99% 100% 100% 100% 100% 100% 101% 99% 101%
Unweighted N (1,463) (655) (808) (456) (516) (297) (194) (581) (434) (284)
Age Race Region
Total 18-29 30-44 45-64 65+ White Black Hispanic Other Northeast Midwest South West
Strongly approve 22% 16% 12% 26% 33% 25% 7% 21% 15% 17% 25% 22% 24%
Somewhat approve 18% 17% 19% 20% 14% 20% 8% 14% 15% 19% 16% 17% 19%
Somewhat disapprove 12% 18% 13% 10% 7% 10% 12% 17% 29% 13% 13% 12% 9%
Strongly disapprove 33% 29% 36% 31% 38% 29% 56% 34% 28% 37% 33% 32% 32%
No opinion 15% 21% 20% 13% 8% 15% 17% 13% 14% 14% 13% 17% 15%
Totals 100% 101% 100% 100% 100% 99% 100% 99% 101% 100% 100% 100% 99%
Unweighted N (1,463) (302) (272) (580) (309) (1,065) (158) (160) (80) (268) (321) (540) (334)
Registered Primary Voter Party ID Ideology
Total Voters Dem Rep Dem Ind Rep Lib Mod Con
Strongly approve 22% 24% 5% 58% 7% 16% 49% 8% 14% 46%
Somewhat approve 18% 18% 9% 25% 9% 17% 30% 7% 20% 27%
Somewhat disapprove 12% 11% 11% 4% 13% 14% 7% 11% 16% 7%
continued on the next page . . .
314

The Economist /YouGov PollApril 26 - 28, 2020 - 1500 US Adult citizens
continued from previous pageRegistered Primary Voter Party ID Ideology
Total Voters Dem Rep Dem Ind Rep Lib Mod Con
Strongly disapprove 33% 37% 69% 4% 64% 28% 4% 68% 33% 5%
No opinion 15% 10% 5% 8% 8% 24% 11% 6% 17% 15%
Totals 100% 100% 99% 99% 101% 99% 101% 100% 100% 100%
Unweighted N (1,463) (1,195) (550) (331) (521) (570) (372) (438) (439) (450)
315

The Economist /YouGov PollApril 26 - 28, 2020 - 1500 US Adult citizens
93J. Trump Approval On Issues — Crime and criminal justice reformDo you approve or disapprove of the way Donald Trump is handling these specific issues?
Gender Education Income
Total Male Female HS or less Some college College grad Postgrad Under $50K $50-100K $100K or more
Strongly approve 21% 24% 18% 25% 21% 17% 15% 21% 21% 22%
Somewhat approve 19% 20% 17% 19% 20% 14% 21% 17% 23% 17%
Somewhat disapprove 15% 17% 14% 12% 14% 19% 22% 15% 18% 19%
Strongly disapprove 27% 25% 29% 22% 29% 34% 31% 27% 25% 26%
No opinion 18% 14% 21% 22% 16% 16% 11% 20% 13% 17%
Totals 100% 100% 99% 100% 100% 100% 100% 100% 100% 101%
Unweighted N (1,463) (656) (807) (458) (514) (297) (194) (582) (434) (283)
Age Race Region
Total 18-29 30-44 45-64 65+ White Black Hispanic Other Northeast Midwest South West
Strongly approve 21% 19% 11% 24% 29% 23% 10% 26% 12% 18% 20% 19% 28%
Somewhat approve 19% 13% 19% 21% 20% 21% 11% 16% 12% 14% 17% 20% 20%
Somewhat disapprove 15% 16% 18% 15% 13% 16% 12% 11% 25% 20% 16% 12% 16%
Strongly disapprove 27% 24% 29% 26% 31% 24% 44% 29% 37% 28% 31% 29% 20%
No opinion 18% 28% 22% 15% 7% 17% 22% 19% 14% 19% 16% 19% 15%
Totals 100% 100% 99% 101% 100% 101% 99% 101% 100% 99% 100% 99% 99%
Unweighted N (1,463) (303) (273) (578) (309) (1,066) (157) (160) (80) (268) (322) (539) (334)
Registered Primary Voter Party ID Ideology
Total Voters Dem Rep Dem Ind Rep Lib Mod Con
Strongly approve 21% 23% 6% 53% 8% 17% 43% 9% 12% 43%
Somewhat approve 19% 20% 8% 31% 12% 17% 29% 6% 20% 30%
Somewhat disapprove 15% 15% 22% 5% 20% 16% 9% 19% 21% 8%
continued on the next page . . .
316

The Economist /YouGov PollApril 26 - 28, 2020 - 1500 US Adult citizens
continued from previous pageRegistered Primary Voter Party ID Ideology
Total Voters Dem Rep Dem Ind Rep Lib Mod Con
Strongly disapprove 27% 31% 57% 3% 51% 23% 4% 56% 28% 2%
No opinion 18% 11% 7% 8% 9% 26% 15% 9% 18% 17%
Totals 100% 100% 100% 100% 100% 99% 100% 99% 99% 100%
Unweighted N (1,463) (1,193) (550) (330) (521) (571) (371) (438) (440) (448)
317

The Economist /YouGov PollApril 26 - 28, 2020 - 1500 US Adult citizens
94. Trump Perceived IdeologyWould you say Donald Trump is...
Gender Education Income
Total Male Female HS or less Some college College grad Postgrad Under $50K $50-100K $100K or more
Very liberal 4% 3% 4% 3% 6% 3% 0% 5% 3% 2%
Liberal 6% 8% 4% 7% 5% 4% 4% 8% 3% 7%
Moderate 14% 15% 13% 13% 11% 18% 17% 11% 15% 19%
Conservative 31% 32% 30% 30% 31% 33% 35% 29% 35% 34%
Very conservative 21% 21% 20% 17% 22% 23% 22% 18% 23% 23%
Not sure 25% 21% 29% 29% 25% 18% 22% 30% 20% 15%
Totals 101% 100% 100% 99% 100% 99% 100% 101% 99% 100%
Unweighted N (1,495) (667) (828) (471) (529) (300) (195) (599) (439) (287)
Age Race Region
Total 18-29 30-44 45-64 65+ White Black Hispanic Other Northeast Midwest South West
Very liberal 4% 5% 3% 5% 2% 3% 4% 6% 5% 3% 2% 4% 4%
Liberal 6% 4% 9% 6% 2% 5% 9% 4% 10% 5% 4% 5% 8%
Moderate 14% 13% 16% 14% 12% 14% 7% 22% 10% 21% 7% 13% 15%
Conservative 31% 30% 24% 35% 35% 34% 17% 30% 27% 24% 37% 34% 29%
Very conservative 21% 25% 20% 16% 24% 20% 26% 15% 27% 21% 26% 16% 22%
Not sure 25% 23% 28% 25% 26% 24% 38% 22% 19% 25% 23% 28% 24%
Totals 101% 100% 100% 101% 101% 100% 101% 99% 98% 99% 99% 100% 102%
Unweighted N (1,495) (311) (279) (594) (311) (1,085) (162) (164) (84) (274) (329) (550) (342)
Registered Primary Voter Party ID Ideology
Total Voters Dem Rep Dem Ind Rep Lib Mod Con
Very liberal 4% 3% 3% 1% 5% 4% 1% 4% 4% 3%
continued on the next page . . .
318
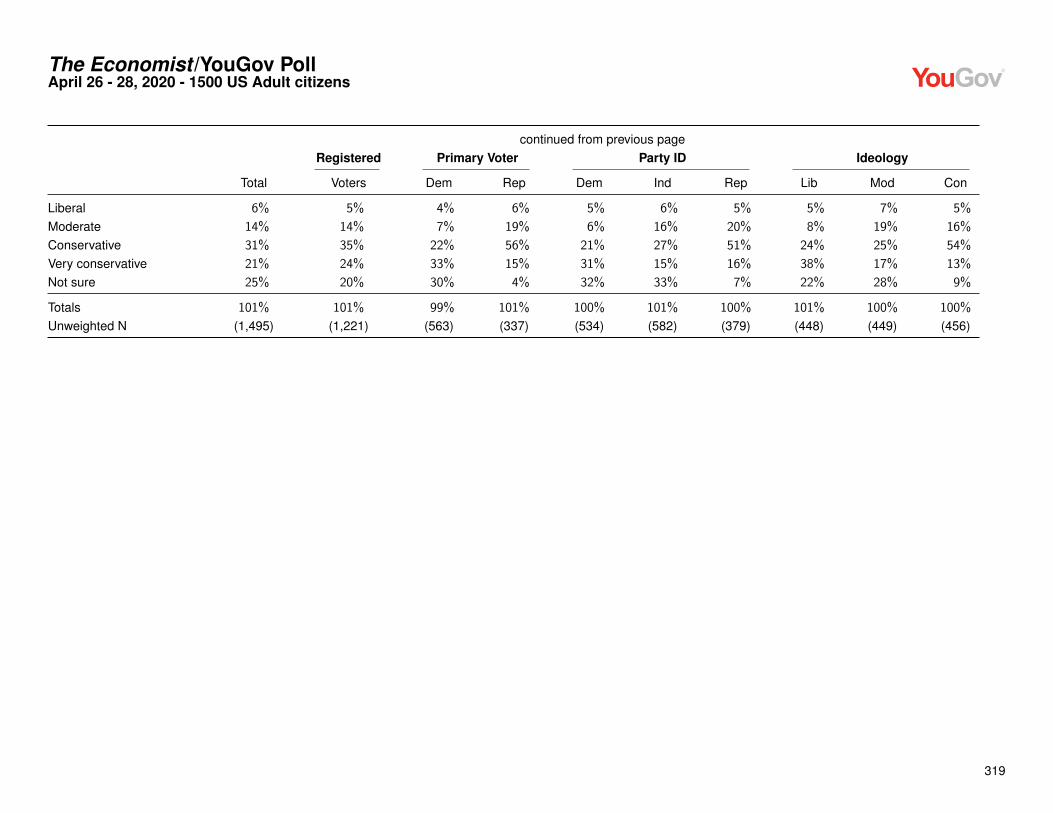
The Economist /YouGov PollApril 26 - 28, 2020 - 1500 US Adult citizens
continued from previous pageRegistered Primary Voter Party ID Ideology
Total Voters Dem Rep Dem Ind Rep Lib Mod Con
Liberal 6% 5% 4% 6% 5% 6% 5% 5% 7% 5%
Moderate 14% 14% 7% 19% 6% 16% 20% 8% 19% 16%
Conservative 31% 35% 22% 56% 21% 27% 51% 24% 25% 54%
Very conservative 21% 24% 33% 15% 31% 15% 16% 38% 17% 13%
Not sure 25% 20% 30% 4% 32% 33% 7% 22% 28% 9%
Totals 101% 101% 99% 101% 100% 101% 100% 101% 100% 100%
Unweighted N (1,495) (1,221) (563) (337) (534) (582) (379) (448) (449) (456)
319

The Economist /YouGov PollApril 26 - 28, 2020 - 1500 US Adult citizens
95. Trump Cares About People Like YouHow much do you think Donald Trump cares about the needs and problems of people like you?
Gender Education Income
Total Male Female HS or less Some college College grad Postgrad Under $50K $50-100K $100K or more
A lot 22% 25% 20% 23% 24% 20% 20% 19% 24% 24%
Some 18% 17% 18% 19% 17% 17% 17% 14% 23% 22%
Not much 13% 14% 13% 15% 13% 12% 7% 18% 8% 11%
Doesn’t care at all 40% 39% 41% 34% 40% 46% 55% 40% 41% 40%
Not sure 6% 5% 7% 10% 5% 5% 1% 9% 4% 2%
Totals 99% 100% 99% 101% 99% 100% 100% 100% 100% 99%
Unweighted N (1,499) (666) (833) (471) (530) (302) (196) (600) (442) (287)
Age Race Region
Total 18-29 30-44 45-64 65+ White Black Hispanic Other Northeast Midwest South West
A lot 22% 14% 15% 25% 34% 26% 5% 16% 22% 18% 22% 22% 26%
Some 18% 17% 17% 20% 15% 20% 11% 19% 7% 17% 18% 20% 16%
Not much 13% 19% 19% 9% 6% 12% 12% 18% 24% 12% 12% 14% 14%
Doesn’t care at all 40% 38% 42% 40% 42% 37% 64% 36% 41% 44% 43% 38% 38%
Not sure 6% 11% 6% 5% 3% 6% 8% 10% 6% 10% 5% 6% 6%
Totals 99% 99% 99% 99% 100% 101% 100% 99% 100% 101% 100% 100% 100%
Unweighted N (1,499) (312) (280) (594) (313) (1,087) (162) (165) (85) (275) (330) (552) (342)
Registered Primary Voter Party ID Ideology
Total Voters Dem Rep Dem Ind Rep Lib Mod Con
A lot 22% 26% 5% 64% 4% 16% 54% 6% 11% 51%
Some 18% 17% 7% 23% 9% 18% 27% 6% 20% 25%
Not much 13% 11% 12% 6% 12% 17% 10% 10% 19% 8%
continued on the next page . . .
320

The Economist /YouGov PollApril 26 - 28, 2020 - 1500 US Adult citizens
continued from previous pageRegistered Primary Voter Party ID Ideology
Total Voters Dem Rep Dem Ind Rep Lib Mod Con
Doesn’t care at all 40% 43% 77% 5% 72% 37% 6% 76% 43% 9%
Not sure 6% 2% 0% 2% 2% 11% 4% 2% 7% 7%
Totals 99% 99% 101% 100% 99% 99% 101% 100% 100% 100%
Unweighted N (1,499) (1,221) (564) (337) (535) (584) (380) (449) (451) (457)
321

The Economist /YouGov PollApril 26 - 28, 2020 - 1500 US Adult citizens
96. Trump LikabilityRegardless of whether you agree with him, do you like or dislike Donald Trump as a person?
Gender Education Income
Total Male Female HS or less Some college College grad Postgrad Under $50K $50-100K $100K or more
Like a lot 14% 17% 12% 15% 17% 11% 9% 15% 13% 15%
Like somewhat 17% 18% 15% 19% 17% 13% 13% 14% 22% 15%
Neither like nor dislike 16% 15% 16% 16% 16% 16% 13% 17% 15% 18%
Dislike somewhat 10% 10% 9% 10% 8% 13% 6% 11% 7% 11%
Dislike a lot 37% 33% 41% 29% 37% 42% 57% 34% 39% 39%
Not sure 7% 7% 7% 10% 6% 5% 2% 9% 5% 2%
Totals 101% 100% 100% 99% 101% 100% 100% 100% 101% 100%
Unweighted N (1,499) (666) (833) (471) (530) (302) (196) (600) (442) (287)
Age Race Region
Total 18-29 30-44 45-64 65+ White Black Hispanic Other Northeast Midwest South West
Like a lot 14% 8% 9% 15% 24% 17% 4% 10% 14% 11% 16% 13% 18%
Like somewhat 17% 14% 16% 19% 16% 19% 9% 15% 5% 12% 17% 19% 15%
Neither like nor dislike 16% 14% 22% 15% 11% 15% 13% 26% 16% 15% 15% 15% 19%
Dislike somewhat 10% 12% 11% 10% 4% 9% 10% 8% 15% 9% 10% 9% 10%
Dislike a lot 37% 38% 35% 36% 41% 35% 51% 32% 41% 41% 38% 36% 34%
Not sure 7% 13% 7% 5% 4% 6% 13% 8% 8% 11% 4% 8% 5%
Totals 101% 99% 100% 100% 100% 101% 100% 99% 99% 99% 100% 100% 101%
Unweighted N (1,499) (312) (280) (594) (313) (1,087) (162) (165) (85) (275) (330) (552) (342)
Registered Primary Voter Party ID Ideology
Total Voters Dem Rep Dem Ind Rep Lib Mod Con
Like a lot 14% 16% 3% 40% 3% 9% 36% 3% 9% 31%
continued on the next page . . .
322

The Economist /YouGov PollApril 26 - 28, 2020 - 1500 US Adult citizens
continued from previous pageRegistered Primary Voter Party ID Ideology
Total Voters Dem Rep Dem Ind Rep Lib Mod Con
Like somewhat 17% 16% 5% 32% 8% 13% 32% 8% 12% 31%
Neither like nor dislike 16% 14% 9% 14% 12% 18% 16% 7% 21% 16%
Dislike somewhat 10% 8% 6% 8% 8% 13% 7% 8% 11% 9%
Dislike a lot 37% 42% 75% 4% 66% 35% 5% 72% 39% 7%
Not sure 7% 3% 2% 2% 3% 12% 4% 2% 9% 7%
Totals 101% 99% 100% 100% 100% 100% 100% 100% 101% 101%
Unweighted N (1,499) (1,221) (564) (337) (535) (584) (380) (449) (451) (457)
323

The Economist /YouGov PollApril 26 - 28, 2020 - 1500 US Adult citizens
97. Trump Leadership AbilitiesWould you say Donald Trump is a strong or a weak leader?
Gender Education Income
Total Male Female HS or less Some college College grad Postgrad Under $50K $50-100K $100K or more
Very strong 30% 32% 29% 31% 34% 24% 24% 27% 35% 29%
Somewhat strong 22% 22% 21% 26% 18% 18% 21% 21% 22% 25%
Somewhat weak 16% 16% 17% 18% 15% 19% 9% 22% 12% 10%
Very weak 32% 30% 34% 25% 32% 38% 47% 31% 31% 35%
Totals 100% 100% 101% 100% 99% 99% 101% 101% 100% 99%
Unweighted N (1,489) (664) (825) (466) (528) (299) (196) (595) (440) (287)
Age Race Region
Total 18-29 30-44 45-64 65+ White Black Hispanic Other Northeast Midwest South West
Very strong 30% 22% 20% 36% 41% 36% 13% 19% 23% 27% 31% 27% 37%
Somewhat strong 22% 27% 24% 20% 17% 22% 18% 25% 13% 20% 20% 25% 19%
Somewhat weak 16% 25% 22% 12% 7% 14% 17% 26% 31% 23% 14% 16% 12%
Very weak 32% 26% 35% 32% 35% 29% 53% 30% 33% 30% 35% 32% 32%
Totals 100% 100% 101% 100% 100% 101% 101% 100% 100% 100% 100% 100% 100%
Unweighted N (1,489) (310) (278) (593) (308) (1,081) (161) (163) (84) (274) (330) (547) (338)
Registered Primary Voter Party ID Ideology
Total Voters Dem Rep Dem Ind Rep Lib Mod Con
Very strong 30% 33% 7% 76% 8% 26% 64% 8% 20% 63%
Somewhat strong 22% 18% 9% 16% 16% 23% 26% 13% 28% 21%
Somewhat weak 16% 14% 18% 5% 16% 23% 7% 15% 22% 9%
Very weak 32% 36% 67% 3% 61% 28% 3% 64% 31% 7%
Totals 100% 101% 101% 100% 101% 100% 100% 100% 101% 100%
continued on the next page . . .
324

The Economist /YouGov PollApril 26 - 28, 2020 - 1500 US Adult citizens
continued from previous pageRegistered Primary Voter Party ID Ideology
Total Voters Dem Rep Dem Ind Rep Lib Mod Con
Unweighted N (1,489) (1,216) (562) (336) (531) (579) (379) (447) (450) (455)
325

The Economist /YouGov PollApril 26 - 28, 2020 - 1500 US Adult citizens
98. Trump HonestyDo you think Donald Trump is honest and trustworthy, or not?
Gender Education Income
Total Male Female HS or less Some college College grad Postgrad Under $50K $50-100K $100K or more
Honest and trustworthy 32% 36% 28% 36% 32% 24% 28% 29% 33% 34%
Not honest andtrustworthy 53% 50% 57% 47% 52% 60% 65% 56% 50% 53%
Not sure 15% 14% 16% 16% 16% 16% 7% 15% 17% 12%
Totals 100% 100% 101% 99% 100% 100% 100% 100% 100% 99%
Unweighted N (1,496) (666) (830) (471) (530) (299) (196) (598) (441) (287)
Age Race Region
Total 18-29 30-44 45-64 65+ White Black Hispanic Other Northeast Midwest South West
Honest and trustworthy 32% 25% 25% 34% 43% 37% 12% 28% 24% 22% 34% 32% 38%
Not honest andtrustworthy 53% 59% 60% 50% 46% 48% 78% 55% 65% 57% 56% 53% 47%
Not sure 15% 16% 15% 17% 10% 16% 11% 17% 12% 20% 10% 15% 15%
Totals 100% 100% 100% 101% 99% 101% 101% 100% 101% 99% 100% 100% 100%
Unweighted N (1,496) (310) (279) (594) (313) (1,086) (162) (164) (84) (275) (329) (551) (341)
Registered Primary Voter Party ID Ideology
Total Voters Dem Rep Dem Ind Rep Lib Mod Con
Honest and trustworthy 32% 34% 7% 77% 8% 25% 71% 11% 23% 64%
Not honest andtrustworthy 53% 55% 90% 11% 85% 54% 13% 85% 59% 20%
Not sure 15% 11% 3% 12% 7% 21% 16% 4% 18% 16%
Totals 100% 100% 100% 100% 100% 100% 100% 100% 100% 100%
continued on the next page . . .
326

The Economist /YouGov PollApril 26 - 28, 2020 - 1500 US Adult citizens
continued from previous pageRegistered Primary Voter Party ID Ideology
Total Voters Dem Rep Dem Ind Rep Lib Mod Con
Unweighted N (1,496) (1,219) (563) (337) (533) (583) (380) (448) (450) (457)
327

The Economist /YouGov PollApril 26 - 28, 2020 - 1500 US Adult citizens
99. Trump Confidence In International CrisisAre you confident in Donald Trump’s ability to deal wisely with an international crisis, or are you uneasy about his approach?
Gender Education Income
Total Male Female HS or less Some college College grad Postgrad Under $50K $50-100K $100K or more
Confident 37% 41% 34% 43% 38% 29% 32% 33% 43% 40%
Uneasy 51% 49% 53% 41% 52% 61% 65% 51% 51% 52%
Not sure 12% 10% 13% 16% 10% 9% 3% 16% 6% 8%
Totals 100% 100% 100% 100% 100% 99% 100% 100% 100% 100%
Unweighted N (1,493) (664) (829) (469) (528) (300) (196) (597) (440) (287)
Age Race Region
Total 18-29 30-44 45-64 65+ White Black Hispanic Other Northeast Midwest South West
Confident 37% 31% 28% 42% 46% 42% 18% 34% 28% 29% 39% 38% 41%
Uneasy 51% 53% 57% 48% 48% 47% 72% 48% 67% 55% 54% 50% 45%
Not sure 12% 16% 15% 10% 6% 11% 9% 19% 6% 15% 6% 12% 13%
Totals 100% 100% 100% 100% 100% 100% 99% 101% 101% 99% 99% 100% 99%
Unweighted N (1,493) (311) (279) (591) (312) (1,084) (162) (163) (84) (275) (330) (551) (337)
Registered Primary Voter Party ID Ideology
Total Voters Dem Rep Dem Ind Rep Lib Mod Con
Confident 37% 40% 8% 87% 11% 32% 79% 11% 28% 74%
Uneasy 51% 55% 89% 12% 81% 50% 15% 83% 59% 18%
Not sure 12% 5% 3% 2% 8% 18% 7% 5% 14% 9%
Totals 100% 100% 100% 101% 100% 100% 101% 99% 101% 101%
Unweighted N (1,493) (1,217) (564) (336) (532) (583) (378) (448) (450) (455)
328

The Economist /YouGov PollApril 26 - 28, 2020 - 1500 US Adult citizens
100. Confidence In Trump Handling Of CoronavirusAre you confident in Donald Trump’s ability to deal wisely with the coronavirus outbreak, or are you uneasy about his approach?
Gender Education Income
Total Male Female HS or less Some college College grad Postgrad Under $50K $50-100K $100K or more
Confident 35% 37% 33% 38% 37% 28% 31% 31% 38% 39%
Uneasy 51% 49% 53% 40% 53% 62% 63% 50% 51% 52%
Not sure 14% 14% 14% 22% 10% 10% 6% 19% 11% 9%
Totals 100% 100% 100% 100% 100% 100% 100% 100% 100% 100%
Unweighted N (1,490) (666) (824) (466) (529) (300) (195) (594) (441) (286)
Age Race Region
Total 18-29 30-44 45-64 65+ White Black Hispanic Other Northeast Midwest South West
Confident 35% 26% 26% 41% 45% 40% 10% 33% 29% 27% 36% 36% 38%
Uneasy 51% 52% 56% 48% 49% 47% 72% 46% 66% 55% 55% 50% 44%
Not sure 14% 22% 19% 11% 6% 13% 18% 21% 6% 18% 9% 14% 18%
Totals 100% 100% 101% 100% 100% 100% 100% 100% 101% 100% 100% 100% 100%
Unweighted N (1,490) (309) (279) (592) (310) (1,081) (160) (165) (84) (274) (328) (547) (341)
Registered Primary Voter Party ID Ideology
Total Voters Dem Rep Dem Ind Rep Lib Mod Con
Confident 35% 39% 9% 84% 10% 29% 74% 11% 27% 68%
Uneasy 51% 54% 88% 11% 81% 52% 12% 84% 58% 16%
Not sure 14% 7% 3% 5% 9% 19% 14% 5% 15% 16%
Totals 100% 100% 100% 100% 100% 100% 100% 100% 100% 100%
Unweighted N (1,490) (1,213) (561) (335) (531) (582) (377) (448) (446) (456)
329

The Economist /YouGov PollApril 26 - 28, 2020 - 1500 US Adult citizens
101. Confidence In Trump Handling Of An Economic RecessionAre you confident in Donald Trump’s ability to deal wisely with an economic recession, or are you uneasy about his approach?
Gender Education Income
Total Male Female HS or less Some college College grad Postgrad Under $50K $50-100K $100K or more
Confident 40% 44% 37% 44% 43% 32% 36% 36% 47% 44%
Uneasy 46% 42% 49% 37% 45% 57% 57% 44% 46% 47%
Not sure 14% 14% 14% 19% 12% 11% 6% 20% 7% 9%
Totals 100% 100% 100% 100% 100% 100% 99% 100% 100% 100%
Unweighted N (1,491) (661) (830) (468) (528) (299) (196) (597) (439) (286)
Age Race Region
Total 18-29 30-44 45-64 65+ White Black Hispanic Other Northeast Midwest South West
Confident 40% 33% 32% 47% 47% 46% 16% 36% 31% 33% 41% 41% 45%
Uneasy 46% 47% 50% 43% 44% 42% 63% 45% 60% 51% 50% 43% 41%
Not sure 14% 20% 18% 10% 9% 12% 21% 19% 10% 16% 9% 16% 14%
Totals 100% 100% 100% 100% 100% 100% 100% 100% 101% 100% 100% 100% 100%
Unweighted N (1,491) (309) (277) (594) (311) (1,081) (161) (165) (84) (272) (329) (549) (341)
Registered Primary Voter Party ID Ideology
Total Voters Dem Rep Dem Ind Rep Lib Mod Con
Confident 40% 44% 11% 89% 14% 35% 81% 12% 34% 75%
Uneasy 46% 49% 83% 8% 76% 45% 10% 81% 49% 13%
Not sure 14% 7% 6% 3% 10% 20% 9% 7% 17% 12%
Totals 100% 100% 100% 100% 100% 100% 100% 100% 100% 100%
Unweighted N (1,491) (1,213) (562) (337) (533) (581) (377) (448) (448) (455)
330

The Economist /YouGov PollApril 26 - 28, 2020 - 1500 US Adult citizens
102. Trump Appropriate Twitter UseDo you think the way Donald Trump uses Twitter is appropriate or inappropriate for the President of the United States?
Gender Education Income
Total Male Female HS or less Some college College grad Postgrad Under $50K $50-100K $100K or more
Appropriate 24% 31% 18% 30% 24% 19% 15% 24% 23% 31%
Inappropriate 59% 52% 65% 49% 59% 70% 74% 58% 62% 58%
Not sure 17% 17% 17% 21% 17% 11% 11% 18% 15% 11%
Totals 100% 100% 100% 100% 100% 100% 100% 100% 100% 100%
Unweighted N (1,495) (664) (831) (471) (528) (300) (196) (597) (442) (286)
Age Race Region
Total 18-29 30-44 45-64 65+ White Black Hispanic Other Northeast Midwest South West
Appropriate 24% 23% 23% 24% 27% 25% 9% 34% 22% 22% 24% 23% 29%
Inappropriate 59% 57% 61% 58% 59% 57% 75% 45% 70% 61% 61% 60% 51%
Not sure 17% 21% 16% 17% 14% 17% 16% 21% 8% 17% 14% 17% 19%
Totals 100% 101% 100% 99% 100% 99% 100% 100% 100% 100% 99% 100% 99%
Unweighted N (1,495) (311) (277) (594) (313) (1,086) (162) (164) (83) (274) (329) (551) (341)
Registered Primary Voter Party ID Ideology
Total Voters Dem Rep Dem Ind Rep Lib Mod Con
Appropriate 24% 25% 7% 54% 10% 21% 47% 11% 15% 48%
Inappropriate 59% 63% 90% 26% 81% 59% 31% 84% 68% 29%
Not sure 17% 12% 3% 20% 9% 20% 21% 6% 17% 23%
Totals 100% 100% 100% 100% 100% 100% 99% 101% 100% 100%
Unweighted N (1,495) (1,217) (563) (337) (532) (583) (380) (447) (450) (457)
331

The Economist /YouGov PollApril 26 - 28, 2020 - 1500 US Adult citizens
103. Approval Of U.S. CongressOverall, do you approve or disapprove of the way that the United States Congress is handling its job?
Gender Education Income
Total Male Female HS or less Some college College grad Postgrad Under $50K $50-100K $100K or more
Strongly approve 4% 4% 4% 4% 5% 2% 3% 4% 4% 3%
Somewhat approve 17% 16% 18% 17% 16% 16% 17% 17% 17% 18%
Neither approve nordisapprove 19% 18% 20% 21% 19% 22% 13% 20% 20% 19%
Somewhat disapprove 26% 30% 23% 20% 25% 32% 40% 24% 29% 31%
Strongly disapprove 21% 23% 20% 19% 23% 21% 23% 17% 24% 24%
Not sure 13% 9% 16% 18% 13% 7% 4% 17% 7% 5%
Totals 100% 100% 101% 99% 101% 100% 100% 99% 101% 100%
Unweighted N (1,497) (665) (832) (470) (529) (302) (196) (600) (441) (287)
Age Race Region
Total 18-29 30-44 45-64 65+ White Black Hispanic Other Northeast Midwest South West
Strongly approve 4% 4% 4% 3% 4% 3% 6% 4% 3% 3% 2% 4% 5%
Somewhat approve 17% 17% 18% 15% 18% 17% 16% 18% 19% 12% 18% 19% 16%
Neither approve nordisapprove 19% 20% 21% 19% 18% 17% 23% 32% 12% 25% 19% 18% 16%
Somewhat disapprove 26% 22% 29% 25% 28% 29% 20% 14% 33% 23% 29% 27% 26%
Strongly disapprove 21% 14% 12% 27% 29% 23% 18% 11% 22% 22% 21% 21% 22%
Not sure 13% 23% 15% 10% 3% 11% 17% 21% 10% 15% 10% 11% 16%
Totals 100% 100% 99% 99% 100% 100% 100% 100% 99% 100% 99% 100% 101%
Unweighted N (1,497) (312) (278) (594) (313) (1,087) (161) (164) (85) (275) (330) (550) (342)
332

The Economist /YouGov PollApril 26 - 28, 2020 - 1500 US Adult citizens
Registered Primary Voter Party ID Ideology
Total Voters Dem Rep Dem Ind Rep Lib Mod Con
Strongly approve 4% 4% 4% 5% 5% 1% 6% 5% 3% 4%
Somewhat approve 17% 17% 20% 19% 20% 13% 20% 20% 15% 18%
Neither approve nordisapprove 19% 18% 18% 14% 21% 18% 19% 18% 23% 17%
Somewhat disapprove 26% 29% 32% 22% 28% 26% 24% 31% 28% 25%
Strongly disapprove 21% 26% 20% 36% 16% 23% 24% 17% 20% 29%
Not sure 13% 6% 6% 3% 10% 18% 7% 9% 12% 8%
Totals 100% 100% 100% 99% 100% 99% 100% 100% 101% 101%
Unweighted N (1,497) (1,220) (564) (337) (535) (582) (380) (449) (450) (457)
333

The Economist /YouGov PollApril 26 - 28, 2020 - 1500 US Adult citizens
104. Pelosi Job ApprovalDo you approve or disapprove of the way Nancy Pelosi is handling her job as the Speaker of the U.S. House of Representatives?
Gender Education Income
Total Male Female HS or less Some college College grad Postgrad Under $50K $50-100K $100K or more
Strongly approve 16% 15% 17% 12% 18% 17% 24% 14% 17% 19%
Somewhat approve 20% 19% 20% 15% 18% 29% 26% 19% 19% 27%
Somewhat disapprove 12% 14% 11% 16% 10% 11% 12% 14% 13% 11%
Strongly disapprove 36% 41% 32% 36% 40% 32% 33% 32% 43% 37%
Not sure 16% 11% 20% 22% 15% 12% 4% 21% 8% 6%
Totals 100% 100% 100% 101% 101% 101% 99% 100% 100% 100%
Unweighted N (1,490) (662) (828) (466) (527) (301) (196) (592) (441) (287)
Age Race Region
Total 18-29 30-44 45-64 65+ White Black Hispanic Other Northeast Midwest South West
Strongly approve 16% 8% 15% 18% 23% 14% 29% 11% 20% 14% 15% 15% 21%
Somewhat approve 20% 22% 31% 14% 14% 17% 27% 24% 28% 23% 19% 22% 13%
Somewhat disapprove 12% 15% 16% 12% 8% 13% 12% 14% 6% 16% 13% 11% 11%
Strongly disapprove 36% 20% 23% 46% 51% 44% 10% 18% 27% 29% 39% 36% 40%
Not sure 16% 35% 15% 11% 4% 11% 22% 33% 19% 18% 14% 15% 15%
Totals 100% 100% 100% 101% 100% 99% 100% 100% 100% 100% 100% 99% 100%
Unweighted N (1,490) (309) (276) (594) (311) (1,085) (160) (162) (83) (274) (329) (548) (339)
Registered Primary Voter Party ID Ideology
Total Voters Dem Rep Dem Ind Rep Lib Mod Con
Strongly approve 16% 20% 39% 3% 36% 8% 5% 32% 17% 4%
Somewhat approve 20% 20% 33% 4% 34% 17% 7% 37% 21% 7%
Somewhat disapprove 12% 12% 10% 7% 9% 16% 12% 13% 14% 10%
continued on the next page . . .
334

The Economist /YouGov PollApril 26 - 28, 2020 - 1500 US Adult citizens
continued from previous pageRegistered Primary Voter Party ID Ideology
Total Voters Dem Rep Dem Ind Rep Lib Mod Con
Strongly disapprove 36% 40% 8% 83% 5% 39% 70% 6% 31% 72%
Not sure 16% 9% 10% 3% 16% 21% 7% 12% 17% 8%
Totals 100% 101% 100% 100% 100% 101% 101% 100% 100% 101%
Unweighted N (1,490) (1,213) (562) (336) (530) (581) (379) (446) (449) (456)
335

The Economist /YouGov PollApril 26 - 28, 2020 - 1500 US Adult citizens
105. Mcconnell Job ApprovalDo you approve or disapprove of the way Mitch McConnell is handling his job as Majority Leader of the U.S. Senate?
Gender Education Income
Total Male Female HS or less Some college College grad Postgrad Under $50K $50-100K $100K or more
Strongly approve 7% 8% 6% 7% 8% 6% 5% 7% 7% 8%
Somewhat approve 20% 22% 17% 20% 17% 22% 20% 16% 23% 24%
Somewhat disapprove 14% 19% 10% 16% 11% 15% 18% 14% 13% 18%
Strongly disapprove 32% 31% 32% 21% 34% 38% 51% 26% 36% 39%
Not sure 27% 20% 34% 36% 30% 18% 6% 37% 21% 12%
Totals 100% 100% 99% 100% 100% 99% 100% 100% 100% 101%
Unweighted N (1,490) (664) (826) (469) (526) (300) (195) (596) (439) (285)
Age Race Region
Total 18-29 30-44 45-64 65+ White Black Hispanic Other Northeast Midwest South West
Strongly approve 7% 4% 6% 6% 12% 8% 5% 3% 6% 4% 8% 7% 10%
Somewhat approve 20% 14% 17% 21% 26% 20% 16% 22% 17% 23% 16% 21% 19%
Somewhat disapprove 14% 11% 18% 14% 15% 15% 11% 14% 21% 16% 17% 15% 11%
Strongly disapprove 32% 21% 30% 35% 37% 32% 33% 24% 35% 29% 34% 30% 33%
Not sure 27% 49% 28% 24% 9% 25% 36% 37% 22% 29% 26% 27% 27%
Totals 100% 99% 99% 100% 99% 100% 101% 100% 101% 101% 101% 100% 100%
Unweighted N (1,490) (310) (278) (591) (311) (1,082) (161) (163) (84) (272) (330) (548) (340)
Registered Primary Voter Party ID Ideology
Total Voters Dem Rep Dem Ind Rep Lib Mod Con
Strongly approve 7% 9% 4% 21% 3% 3% 17% 3% 2% 17%
Somewhat approve 20% 21% 9% 41% 11% 16% 35% 7% 19% 35%
Somewhat disapprove 14% 14% 11% 13% 8% 17% 18% 9% 18% 16%
continued on the next page . . .
336

The Economist /YouGov PollApril 26 - 28, 2020 - 1500 US Adult citizens
continued from previous pageRegistered Primary Voter Party ID Ideology
Total Voters Dem Rep Dem Ind Rep Lib Mod Con
Strongly disapprove 32% 38% 65% 9% 56% 28% 8% 61% 33% 10%
Not sure 27% 17% 12% 15% 21% 36% 21% 21% 28% 22%
Totals 100% 99% 101% 99% 99% 100% 99% 101% 100% 100%
Unweighted N (1,490) (1,214) (562) (335) (530) (581) (379) (447) (447) (456)
337

The Economist /YouGov PollApril 26 - 28, 2020 - 1500 US Adult citizens
106. Congressional Accomplishment - 5 PointDo you think the current Congress has accomplished more or less than Congress usually does at this point in its two-year term?
Gender Education Income
Total Male Female HS or less Some college College grad Postgrad Under $50K $50-100K $100K or more
A lot more than usual 3% 3% 4% 5% 3% 3% 2% 5% 2% 3%
Somewhat more thanusual 10% 11% 9% 10% 11% 7% 10% 10% 12% 7%
About the same 19% 20% 18% 19% 18% 20% 21% 18% 20% 22%
Somewhat less thanusual 17% 17% 17% 13% 17% 21% 24% 16% 17% 19%
A lot less than usual 28% 32% 25% 24% 28% 34% 32% 20% 35% 35%
Not sure 23% 16% 28% 29% 24% 15% 11% 30% 13% 13%
Totals 100% 99% 101% 100% 101% 100% 100% 99% 99% 99%
Unweighted N (1,488) (662) (826) (470) (523) (301) (194) (593) (440) (285)
Age Race Region
Total 18-29 30-44 45-64 65+ White Black Hispanic Other Northeast Midwest South West
A lot more than usual 3% 5% 5% 2% 3% 2% 10% 5% 4% 2% 3% 4% 4%
Somewhat more thanusual 10% 15% 10% 7% 10% 10% 7% 13% 8% 7% 9% 11% 11%
About the same 19% 20% 26% 18% 11% 18% 24% 16% 22% 23% 19% 19% 16%
Somewhat less thanusual 17% 12% 15% 19% 21% 18% 11% 17% 19% 16% 17% 18% 14%
A lot less than usual 28% 11% 17% 37% 45% 32% 20% 17% 26% 25% 32% 26% 31%
Not sure 23% 38% 28% 17% 10% 21% 27% 31% 20% 27% 20% 22% 24%
Totals 100% 101% 101% 100% 100% 101% 99% 99% 99% 100% 100% 100% 100%
Unweighted N (1,488) (308) (277) (590) (313) (1,083) (158) (164) (83) (272) (328) (547) (341)
338

The Economist /YouGov PollApril 26 - 28, 2020 - 1500 US Adult citizens
Registered Primary Voter Party ID Ideology
Total Voters Dem Rep Dem Ind Rep Lib Mod Con
A lot more than usual 3% 3% 4% 3% 5% 2% 4% 5% 2% 4%
Somewhat more thanusual 10% 10% 11% 12% 10% 8% 11% 10% 10% 10%
About the same 19% 18% 21% 14% 20% 19% 19% 21% 22% 16%
Somewhat less thanusual 17% 19% 17% 22% 14% 17% 19% 17% 17% 18%
A lot less than usual 28% 34% 32% 43% 28% 25% 33% 28% 27% 36%
Not sure 23% 15% 16% 7% 23% 28% 14% 18% 22% 17%
Totals 100% 99% 101% 101% 100% 99% 100% 99% 100% 101%
Unweighted N (1,488) (1,214) (561) (336) (530) (580) (378) (448) (445) (455)
339

The Economist /YouGov PollApril 26 - 28, 2020 - 1500 US Adult citizens
107. BlameWho is more to blame for Congress achieving less than usual?Asked if respondent says Congress accomplished less than usual
Gender Education Income
Total Male Female HS or less Some college College grad Postgrad Under $50K $50-100K $100K or more
Democrats in Congress 39% 43% 35% 47% 41% 32% 33% 41% 40% 39%
Republicans in Congress 30% 28% 32% 18% 27% 44% 41% 27% 31% 32%
Both equally 26% 26% 27% 30% 28% 22% 23% 27% 26% 28%
Neither 1% 1% 1% 2% 1% 1% 1% 3% 1% 0%
Not sure 3% 2% 4% 4% 3% 2% 3% 1% 2% 1%
Totals 99% 100% 99% 101% 100% 101% 101% 99% 100% 100%
Unweighted N (730) (378) (352) (203) (244) (168) (115) (240) (243) (168)
Age Race Region
Total 18-29 30-44 45-64 65+ White Black Hispanic Other Northeast Midwest South West
Democrats in Congress 39% 9% 29% 45% 48% 45% 10% 28% 28% 31% 38% 38% 50%
Republicans in Congress 30% 39% 37% 26% 28% 27% 49% 28% 43% 25% 37% 30% 27%
Both equally 26% 42% 28% 25% 22% 25% 36% 34% 19% 41% 21% 27% 21%
Neither 1% 2% 0% 2% 0% 1% 0% 3% 7% 1% 2% 1% 0%
Not sure 3% 7% 6% 1% 2% 2% 5% 7% 3% 3% 2% 4% 2%
Totals 99% 99% 100% 99% 100% 100% 100% 100% 100% 101% 100% 100% 100%
Unweighted N (730) (82) (90) (345) (213) (570) (59) (61) (40) (127) (163) (268) (172)
Registered Primary Voter Party ID Ideology
Total Voters Dem Rep Dem Ind Rep Lib Mod Con
Democrats in Congress 39% 42% 10% 79% 8% 35% 76% 5% 29% 75%
Republicans in Congress 30% 32% 66% 3% 64% 24% 3% 68% 29% 5%
continued on the next page . . .
340

The Economist /YouGov PollApril 26 - 28, 2020 - 1500 US Adult citizens
continued from previous pageRegistered Primary Voter Party ID Ideology
Total Voters Dem Rep Dem Ind Rep Lib Mod Con
Both equally 26% 23% 21% 17% 24% 34% 19% 21% 36% 19%
Neither 1% 1% 1% 0% 1% 2% 0% 2% 2% 0%
Not sure 3% 3% 2% 1% 2% 4% 2% 4% 4% 1%
Totals 99% 101% 100% 100% 99% 99% 100% 100% 100% 100%
Unweighted N (730) (652) (283) (221) (245) (266) (219) (223) (208) (273)
341

The Economist /YouGov PollApril 26 - 28, 2020 - 1500 US Adult citizens
108. Trend Of EconomyOverall, do you think the economy is getting better or worse?
Gender Education Income
Total Male Female HS or less Some college College grad Postgrad Under $50K $50-100K $100K or more
Getting better 13% 16% 11% 16% 11% 15% 10% 12% 16% 17%
About the same 15% 18% 13% 20% 13% 12% 13% 16% 15% 18%
Getting worse 58% 54% 62% 47% 64% 64% 69% 55% 62% 61%
Not sure 13% 11% 15% 18% 12% 8% 9% 17% 7% 5%
Totals 99% 99% 101% 101% 100% 99% 101% 100% 100% 101%
Unweighted N (1,491) (665) (826) (467) (528) (301) (195) (595) (440) (286)
Age Race Region
Total 18-29 30-44 45-64 65+ White Black Hispanic Other Northeast Midwest South West
Getting better 13% 14% 11% 14% 16% 15% 8% 9% 9% 16% 9% 15% 13%
About the same 15% 15% 20% 13% 14% 15% 17% 21% 12% 10% 16% 19% 15%
Getting worse 58% 49% 56% 64% 60% 60% 55% 44% 73% 59% 63% 54% 60%
Not sure 13% 21% 14% 9% 10% 10% 19% 27% 6% 15% 12% 13% 12%
Totals 99% 99% 101% 100% 100% 100% 99% 101% 100% 100% 100% 101% 100%
Unweighted N (1,491) (309) (279) (591) (312) (1,084) (161) (163) (83) (272) (329) (551) (339)
Registered Primary Voter Party ID Ideology
Total Voters Dem Rep Dem Ind Rep Lib Mod Con
Getting better 13% 15% 4% 35% 3% 13% 27% 2% 12% 26%
About the same 15% 15% 12% 20% 13% 13% 22% 10% 16% 21%
Getting worse 58% 61% 80% 36% 76% 55% 42% 80% 61% 39%
Not sure 13% 9% 4% 9% 8% 19% 10% 8% 11% 14%
Totals 99% 100% 100% 100% 100% 100% 101% 100% 100% 100%
continued on the next page . . .
342

The Economist /YouGov PollApril 26 - 28, 2020 - 1500 US Adult citizens
continued from previous pageRegistered Primary Voter Party ID Ideology
Total Voters Dem Rep Dem Ind Rep Lib Mod Con
Unweighted N (1,491) (1,216) (563) (335) (533) (581) (377) (448) (449) (455)
343

The Economist /YouGov PollApril 26 - 28, 2020 - 1500 US Adult citizens
109. Stock Market Expectations Over Next YearDo you think the stock market will be higher or lower 12 months from now?
Gender Education Income
Total Male Female HS or less Some college College grad Postgrad Under $50K $50-100K $100K or more
Higher 38% 42% 34% 35% 38% 39% 49% 30% 46% 46%
About the same 18% 18% 19% 17% 17% 21% 23% 20% 15% 26%
Lower 22% 19% 24% 20% 22% 28% 16% 20% 23% 19%
Not sure 22% 20% 24% 29% 23% 13% 12% 30% 16% 9%
Totals 100% 99% 101% 101% 100% 101% 100% 100% 100% 100%
Unweighted N (1,489) (665) (824) (470) (525) (300) (194) (594) (440) (287)
Age Race Region
Total 18-29 30-44 45-64 65+ White Black Hispanic Other Northeast Midwest South West
Higher 38% 31% 29% 44% 46% 43% 27% 25% 34% 35% 40% 34% 46%
About the same 18% 19% 26% 14% 16% 17% 23% 22% 18% 17% 15% 19% 20%
Lower 22% 24% 22% 23% 17% 20% 18% 27% 33% 22% 24% 22% 17%
Not sure 22% 27% 23% 19% 21% 20% 32% 26% 15% 25% 21% 24% 17%
Totals 100% 101% 100% 100% 100% 100% 100% 100% 100% 99% 100% 99% 100%
Unweighted N (1,489) (307) (278) (592) (312) (1,083) (161) (161) (84) (274) (328) (547) (340)
Registered Primary Voter Party ID Ideology
Total Voters Dem Rep Dem Ind Rep Lib Mod Con
Higher 38% 44% 28% 68% 27% 33% 60% 25% 33% 58%
About the same 18% 20% 24% 14% 22% 17% 16% 24% 19% 14%
Lower 22% 20% 29% 9% 30% 22% 10% 30% 27% 10%
Not sure 22% 16% 19% 9% 22% 28% 13% 22% 21% 18%
Totals 100% 100% 100% 100% 101% 100% 99% 101% 100% 100%
continued on the next page . . .
344

The Economist /YouGov PollApril 26 - 28, 2020 - 1500 US Adult citizens
continued from previous pageRegistered Primary Voter Party ID Ideology
Total Voters Dem Rep Dem Ind Rep Lib Mod Con
Unweighted N (1,489) (1,215) (563) (336) (533) (577) (379) (445) (451) (456)
345

The Economist /YouGov PollApril 26 - 28, 2020 - 1500 US Adult citizens
110. Stock OwnershipDo you personally (or jointly with a spouse), have any money invested in the stock market right now, either in an individual stock or in a mutual fund?
Gender Education Income
Total Male Female HS or less Some college College grad Postgrad Under $50K $50-100K $100K or more
Yes 42% 43% 40% 27% 37% 58% 77% 23% 53% 72%
No 58% 57% 60% 73% 63% 42% 23% 77% 47% 28%
Totals 100% 100% 100% 100% 100% 100% 100% 100% 100% 100%
Unweighted N (1,489) (664) (825) (470) (526) (298) (195) (596) (439) (285)
Age Race Region
Total 18-29 30-44 45-64 65+ White Black Hispanic Other Northeast Midwest South West
Yes 42% 33% 40% 42% 51% 44% 29% 34% 51% 36% 44% 40% 48%
No 58% 67% 60% 58% 49% 56% 71% 66% 49% 64% 56% 60% 52%
Totals 100% 100% 100% 100% 100% 100% 100% 100% 100% 100% 100% 100% 100%
Unweighted N (1,489) (310) (277) (590) (312) (1,082) (160) (163) (84) (272) (329) (547) (341)
Registered Primary Voter Party ID Ideology
Total Voters Dem Rep Dem Ind Rep Lib Mod Con
Yes 42% 51% 54% 52% 45% 35% 48% 46% 41% 49%
No 58% 49% 46% 48% 55% 65% 52% 54% 59% 51%
Totals 100% 100% 100% 100% 100% 100% 100% 100% 100% 100%
Unweighted N (1,489) (1,214) (561) (336) (531) (581) (377) (448) (448) (454)
346

The Economist /YouGov PollApril 26 - 28, 2020 - 1500 US Adult citizens
111. Change In Personal Finances Over Past YearWould you say that you and your family are...
Gender Education Income
Total Male Female HS or less Some college College grad Postgrad Under $50K $50-100K $100K or more
Better off financially thanyou were a year ago 21% 23% 19% 18% 23% 24% 21% 19% 23% 26%
About the samefinancially as you werea year ago 41% 42% 39% 43% 38% 41% 42% 40% 42% 42%
Worse off financially thanyou were a year ago 30% 27% 34% 26% 33% 33% 35% 31% 32% 29%
Not sure 8% 7% 8% 14% 6% 2% 2% 10% 3% 3%
Totals 100% 99% 100% 101% 100% 100% 100% 100% 100% 100%
Unweighted N (1,494) (664) (830) (470) (529) (301) (194) (598) (441) (287)
Age Race Region
Total 18-29 30-44 45-64 65+ White Black Hispanic Other Northeast Midwest South West
Better off financially thanyou were a year ago 21% 22% 21% 24% 15% 23% 19% 15% 13% 19% 17% 22% 24%
About the samefinancially as you werea year ago 41% 34% 40% 40% 49% 41% 41% 39% 39% 40% 49% 38% 38%
Worse off financially thanyou were a year ago 30% 27% 29% 32% 34% 30% 30% 28% 43% 31% 27% 32% 29%
Not sure 8% 18% 10% 4% 1% 6% 11% 18% 5% 9% 7% 7% 8%
Totals 100% 101% 100% 100% 99% 100% 101% 100% 100% 99% 100% 99% 99%
Unweighted N (1,494) (311) (278) (592) (313) (1,085) (162) (163) (84) (274) (329) (552) (339)
347

The Economist /YouGov PollApril 26 - 28, 2020 - 1500 US Adult citizens
Registered Primary Voter Party ID Ideology
Total Voters Dem Rep Dem Ind Rep Lib Mod Con
Better off financially thanyou were a year ago 21% 24% 18% 36% 15% 19% 31% 18% 15% 32%
About the samefinancially as you werea year ago 41% 43% 41% 45% 42% 39% 43% 39% 43% 43%
Worse off financially thanyou were a year ago 30% 29% 37% 17% 35% 32% 23% 33% 36% 20%
Not sure 8% 4% 4% 3% 8% 11% 3% 9% 6% 5%
Totals 100% 100% 100% 101% 100% 101% 100% 99% 100% 100%
Unweighted N (1,494) (1,218) (563) (337) (533) (581) (380) (448) (451) (456)
348

The Economist /YouGov PollApril 26 - 28, 2020 - 1500 US Adult citizens
112. Jobs In Six MonthsSix months from now do you think there will be...
Gender Education Income
Total Male Female HS or less Some college College grad Postgrad Under $50K $50-100K $100K or more
More jobs 31% 35% 27% 31% 31% 27% 34% 26% 36% 34%
The same amount of jobs 20% 20% 20% 21% 19% 21% 18% 21% 17% 24%
Fewer jobs 30% 29% 31% 26% 29% 39% 34% 29% 33% 31%
Not sure 19% 16% 22% 22% 21% 14% 15% 25% 13% 11%
Totals 100% 100% 100% 100% 100% 101% 101% 101% 99% 100%
Unweighted N (1,494) (666) (828) (471) (529) (300) (194) (599) (441) (286)
Age Race Region
Total 18-29 30-44 45-64 65+ White Black Hispanic Other Northeast Midwest South West
More jobs 31% 27% 20% 36% 38% 34% 20% 22% 24% 28% 32% 26% 40%
The same amount of jobs 20% 23% 27% 17% 14% 18% 28% 21% 23% 19% 21% 22% 16%
Fewer jobs 30% 28% 31% 32% 28% 30% 30% 30% 33% 30% 29% 31% 30%
Not sure 19% 23% 22% 15% 19% 18% 22% 27% 20% 23% 18% 21% 14%
Totals 100% 101% 100% 100% 99% 100% 100% 100% 100% 100% 100% 100% 100%
Unweighted N (1,494) (309) (279) (594) (312) (1,085) (162) (164) (83) (275) (329) (550) (340)
Registered Primary Voter Party ID Ideology
Total Voters Dem Rep Dem Ind Rep Lib Mod Con
More jobs 31% 33% 20% 59% 20% 26% 49% 18% 25% 50%
The same amount of jobs 20% 19% 19% 17% 18% 18% 25% 20% 24% 17%
Fewer jobs 30% 31% 43% 16% 43% 30% 15% 42% 32% 18%
Not sure 19% 16% 18% 8% 19% 26% 11% 20% 19% 15%
Totals 100% 99% 100% 100% 100% 100% 100% 100% 100% 100%
continued on the next page . . .
349

The Economist /YouGov PollApril 26 - 28, 2020 - 1500 US Adult citizens
continued from previous pageRegistered Primary Voter Party ID Ideology
Total Voters Dem Rep Dem Ind Rep Lib Mod Con
Unweighted N (1,494) (1,218) (564) (336) (534) (580) (380) (449) (450) (455)
350

The Economist /YouGov PollApril 26 - 28, 2020 - 1500 US Adult citizens
113. Worried About Losing JobHow worried are you about losing your job?
Gender Education Income
Total Male Female HS or less Some college College grad Postgrad Under $50K $50-100K $100K or more
Very worried 12% 11% 13% 10% 15% 15% 6% 13% 14% 10%
Somewhat worried 36% 38% 33% 36% 34% 42% 30% 38% 30% 35%
Not very worried 52% 51% 54% 54% 52% 43% 64% 49% 56% 54%
Totals 100% 100% 100% 100% 101% 100% 100% 100% 100% 99%
Unweighted N (884) (437) (447) (226) (306) (210) (142) (291) (307) (199)
Age Race Region
Total 18-29 30-44 45-64 65+ White Black Hispanic Other Northeast Midwest South West
Very worried 12% 13% 13% 12% 8% 11% 20% 11% 12% 13% 14% 13% 7%
Somewhat worried 36% 49% 41% 29% 14% 31% 27% 60% 50% 42% 34% 34% 35%
Not very worried 52% 38% 46% 59% 78% 58% 53% 29% 38% 45% 51% 54% 58%
Totals 100% 100% 100% 100% 100% 100% 100% 100% 100% 100% 99% 101% 100%
Unweighted N (884) (201) (200) (383) (100) (643) (81) (103) (57) (171) (194) (334) (185)
Registered Primary Voter Party ID Ideology
Total Voters Dem Rep Dem Ind Rep Lib Mod Con
Very worried 12% 12% 14% 11% 14% 13% 8% 13% 14% 8%
Somewhat worried 36% 33% 32% 29% 34% 40% 32% 44% 36% 28%
Not very worried 52% 55% 54% 60% 52% 47% 60% 43% 50% 64%
Totals 100% 100% 100% 100% 100% 100% 100% 100% 100% 100%
Unweighted N (884) (752) (360) (207) (316) (340) (228) (292) (271) (267)
351

The Economist /YouGov PollApril 26 - 28, 2020 - 1500 US Adult citizens
114. Job AvailabilityIf you lost your job, how hard would it be for you to find a new job that paid as much as you are making now?
Gender Education Income
Total Male Female HS or less Some college College grad Postgrad Under $50K $50-100K $100K or more
Very hard – I wouldprobably have to take apay cut. 31% 31% 31% 33% 32% 27% 30% 29% 32% 32%
Somewhat hard – It mighttake a while before Ifound a job that paid asmuch. 38% 40% 36% 33% 38% 41% 44% 38% 37% 42%
Not very hard 21% 22% 20% 25% 18% 20% 19% 20% 23% 19%
Not sure 10% 8% 13% 9% 12% 12% 7% 13% 8% 7%
Totals 100% 101% 100% 100% 100% 100% 100% 100% 100% 100%
Unweighted N (885) (437) (448) (226) (307) (210) (142) (292) (307) (199)
Age Race Region
Total 18-29 30-44 45-64 65+ White Black Hispanic Other Northeast Midwest South West
Very hard – I wouldprobably have to take apay cut. 31% 20% 29% 38% 37% 31% 23% 38% 30% 22% 40% 28% 36%
Somewhat hard – It mighttake a while before Ifound a job that paid asmuch. 38% 38% 47% 34% 23% 38% 49% 25% 43% 43% 34% 39% 35%
Not very hard 21% 29% 13% 20% 27% 22% 17% 22% 17% 24% 17% 23% 18%
Not sure 10% 13% 11% 7% 13% 9% 11% 15% 10% 10% 9% 10% 11%
Totals 100% 100% 100% 99% 100% 100% 100% 100% 100% 99% 100% 100% 100%
Unweighted N (885) (202) (200) (383) (100) (644) (81) (103) (57) (171) (194) (334) (186)
352

The Economist /YouGov PollApril 26 - 28, 2020 - 1500 US Adult citizens
Registered Primary Voter Party ID Ideology
Total Voters Dem Rep Dem Ind Rep Lib Mod Con
Very hard – I wouldprobably have to take apay cut. 31% 32% 32% 37% 30% 33% 30% 32% 30% 32%
Somewhat hard – It mighttake a while before Ifound a job that paid asmuch. 38% 38% 38% 36% 37% 37% 41% 39% 39% 35%
Not very hard 21% 21% 20% 19% 22% 18% 23% 21% 19% 24%
Not sure 10% 9% 10% 7% 11% 12% 6% 9% 12% 10%
Totals 100% 100% 100% 99% 100% 100% 100% 101% 100% 101%
Unweighted N (885) (752) (360) (207) (316) (341) (228) (292) (271) (267)
353

The Economist /YouGov PollApril 26 - 28, 2020 - 1500 US Adult citizens
115. Happy With JobHow happy would you say you are with your current job?
Gender Education Income
Total Male Female HS or less Some college College grad Postgrad Under $50K $50-100K $100K or more
Very happy 23% 22% 24% 14% 26% 25% 31% 16% 28% 29%
Happy 39% 40% 37% 39% 33% 46% 39% 36% 42% 40%
Neither happy norunhappy 29% 26% 33% 37% 28% 21% 24% 34% 23% 25%
Unhappy 7% 9% 5% 6% 10% 7% 5% 11% 6% 4%
Very unhappy 2% 3% 1% 3% 2% 1% 2% 3% 1% 2%
Totals 100% 100% 100% 99% 99% 100% 101% 100% 100% 100%
Unweighted N (887) (439) (448) (228) (307) (210) (142) (294) (307) (199)
Age Race Region
Total 18-29 30-44 45-64 65+ White Black Hispanic Other Northeast Midwest South West
Very happy 23% 15% 24% 25% 28% 26% 21% 7% 18% 23% 23% 22% 22%
Happy 39% 42% 38% 37% 40% 38% 42% 40% 36% 33% 36% 42% 42%
Neither happy norunhappy 29% 31% 29% 29% 25% 26% 28% 47% 30% 34% 29% 27% 28%
Unhappy 7% 8% 7% 8% 5% 7% 9% 5% 13% 8% 10% 8% 3%
Very unhappy 2% 3% 3% 2% 2% 3% 1% 1% 3% 2% 3% 1% 5%
Totals 100% 99% 101% 101% 100% 100% 101% 100% 100% 100% 101% 100% 100%
Unweighted N (887) (201) (200) (385) (101) (646) (81) (103) (57) (172) (193) (336) (186)
Registered Primary Voter Party ID Ideology
Total Voters Dem Rep Dem Ind Rep Lib Mod Con
Very happy 23% 27% 29% 29% 25% 21% 22% 23% 24% 24%
continued on the next page . . .
354

The Economist /YouGov PollApril 26 - 28, 2020 - 1500 US Adult citizens
continued from previous pageRegistered Primary Voter Party ID Ideology
Total Voters Dem Rep Dem Ind Rep Lib Mod Con
Happy 39% 38% 38% 40% 41% 35% 41% 40% 37% 41%
Neither happy norunhappy 29% 26% 24% 25% 27% 30% 30% 25% 30% 30%
Unhappy 7% 6% 7% 4% 5% 10% 5% 9% 7% 5%
Very unhappy 2% 2% 2% 2% 2% 4% 1% 3% 3% 1%
Totals 100% 99% 100% 100% 100% 100% 99% 100% 101% 101%
Unweighted N (887) (753) (361) (207) (317) (341) (229) (293) (270) (268)
355

The Economist /YouGov PollApril 26 - 28, 2020 - 1500 US Adult citizens
116. Generic Congressional VoteIf an election for U.S. Congress were being held today, who would you vote for in the district where you live?Asked of registered voters
Gender Education Income
Total Male Female HS or less Some college College grad Postgrad Under $50K $50-100K $100K or more
The Democratic Partycandidate 46% 41% 50% 38% 45% 52% 52% 47% 44% 48%
The Republican Partycandidate 38% 44% 33% 42% 40% 35% 30% 35% 41% 39%
Other 2% 2% 2% 2% 1% 2% 3% 2% 2% 2%
Not sure 13% 12% 13% 15% 12% 11% 12% 14% 12% 10%
I would not vote 2% 1% 2% 3% 1% 0% 2% 2% 2% 1%
Totals 101% 100% 100% 100% 99% 100% 99% 100% 101% 100%
Unweighted N (1,217) (567) (650) (309) (429) (287) (192) (421) (391) (273)
Age Race Region
Total 18-29 30-44 45-64 65+ White Black Hispanic Other Northeast Midwest South West
The Democratic Partycandidate 46% 52% 52% 41% 44% 40% 77% 47% 54% 49% 47% 47% 42%
The Republican Partycandidate 38% 22% 27% 47% 44% 44% 9% 30% 36% 31% 38% 38% 43%
Other 2% 2% 3% 1% 1% 2% 1% 2% 2% 2% 2% 2% 1%
Not sure 13% 18% 16% 10% 10% 13% 11% 18% 6% 16% 13% 11% 12%
I would not vote 2% 6% 2% 1% 0% 1% 3% 2% 2% 2% 0% 2% 1%
Totals 101% 100% 100% 100% 99% 100% 101% 99% 100% 100% 100% 100% 99%
Unweighted N (1,217) (241) (206) (506) (264) (878) (136) (133) (70) (223) (271) (435) (288)
356

The Economist /YouGov PollApril 26 - 28, 2020 - 1500 US Adult citizens
Registered Primary Voter Party ID Ideology
Total Voters Dem Rep Dem Ind Rep Lib Mod Con
The Democratic Partycandidate 46% 46% 86% 4% 90% 33% 4% 83% 50% 10%
The Republican Partycandidate 38% 38% 5% 92% 2% 31% 91% 7% 24% 81%
Other 2% 2% 1% 0% 0% 4% 1% 1% 2% 2%
Not sure 13% 13% 7% 4% 7% 28% 4% 8% 21% 7%
I would not vote 2% 2% 0% 0% 1% 4% 1% 2% 2% 0%
Totals 101% 101% 99% 100% 100% 100% 101% 101% 99% 100%
Unweighted N (1,217) (1,217) (562) (336) (489) (400) (328) (409) (366) (392)
357

The Economist /YouGov PollApril 26 - 28, 2020 - 1500 US Adult citizens
Sponsorship The Economist
Fieldwork YouGov
Interviewing Dates April 26 - 28, 2020
Target population US Adult Population
Sampling method Respondents were selected from YouGov’s opt-in Internet panel us-ing sample matching. A random sample (stratified by gender, age,race, education, and region) was selected from the 2016 AmericanCommunity Study. Voter registration was imputed from the November2016 Current Population Survey Registration and Voting Supplement.
Weighting The sample was weighted based on gender, age, race, education,and 2016 Presidential vote (or non-vote). The weights range from0.201 to 6.52, with a mean of one and a standard deviation of 0.764.
Number of respondents 15001222 (Registered voters)
Margin of error ± 3.2% (adjusted for weighting)± 3.2% (Registered voters)
Survey mode Web-based interviews
Questions not reported 25 questions not reported.
358