Embed Size (px)
Citation preview
Economics of Resilience Final Report 1
The Economics of Early Response and
Disaster Resilience:
Lessons from Kenya and Ethiopia
Courtenay Cabot Venton, Catherine Fitzgibbon,
Tenna Shitarek, Lorraine Coulter, Olivia Dooley
June 2012

Economics of Resilience Final Report 2
Acknowledgements
The study team is very grateful to the numerous experts who were willing to discuss the
study and feed in relevant data. Thank you to DFID Ethiopia and DFID Kenya for all of
their assistance with coordinating our visit. We would also like to acknowledge the
Pastoralist Welfare Organization in Ethiopia, who kindly arranged for field visits, and the
community members in Dire Dawa who graciously hosted us and shared their
experiences. Thanks to Andy Catley, Feinstein International Center, and Charlotte
Benson, Independent Consultant, who provided expert review.
Thanks also to Sophie Pongracz and Tim Waites from the Conflict, Humanitarian and
Security Department in DFID for commissioning and facilitating this work, and for their
inputs and expertise throughout.
This study has been funded by UKaid from the Department for International
Development. However, the views expressed do not necessarily reflect the
department’s official policies.

Economics of Resilience Final Report 3
Team Biographies
Courtenay Cabot Venton, freelance consultant, [email protected].
Courtenay is an economist, specializing in the economics of poverty reduction, disaster
risk reduction, and climate change adaptation. She has been working in the economics
of sustainable development for over 15 years. She was a senior consultant at
Environmental Resources Management (ERM) in London before becoming an
independent consultant. Courtenay acted as team leader for this assignment.
Catherine Fitzgibbon, freelance consultant, [email protected].
Catherine is based in Kenya and has worked in the region for many years, most recently
as Programme Quality and Design Director for Save the Children UK, Kenya Programme.
Previous to this, she was Head of Operations for Save the Children in Ethiopia. Catherine
acted as the Kenya expert for this research.
Tenna Shitarek, freelance consultant/FARM Africa, [email protected].
Tenna is based in Ethiopia and has more than 15 years experience in the delivery of
capacity building and livelihood improvement initiatives in Ethiopia, including evaluation
and assessment of projects, implementing monitoring and evaluation systems, data
collection and analysis. Tenna acted as the Ethiopia expert for this research.
Lorraine Coulter, Food Economy Group, [email protected].
Lorraine is a livelihoods specialist with expertise in analyzing quantitative and qualitative
livelihood systems information, with a focus on livelihoods modelling. She acted as HEA
technician for this research.
Olivia Dooley, freelance consultant/Partners In Health, [email protected].
Olivia acted as research assistant for this assignment, building on her work for Partners
In Health, and CERES on climate risk.

Economics of Resilience Final Report 4
TABLE OF CONTENTS
1 INTRODUCTION ..................................................................................................... 8 1.1 INTRODUCTION ........................................................................................................... 8 1.2 AIMS OF THE STUDY ................................................................................................... 10 1.3 SCOPE OF THE STUDY ................................................................................................. 10 1.4 OUTLINE OF THIS REPORT ............................................................................................ 10
2 DISASTER AND RESILIENCE IN KENYA AND ETHIOPIA ........................................... 12 2.1 HUMANITARIAN CRISES DUE TO DROUGHT ..................................................................... 12 2.2 PASTORALISM ........................................................................................................... 15 2.3 BUILDING RESILIENCE FOR PASTORALISTS IN THE FACE OF DROUGHT ................................... 18
3 KEY CONCEPTS, ANALYTICAL FRAMEWORK AND METHODOLOGY ........................ 21 3.1 KEY CONCEPTS .......................................................................................................... 21 WHAT DOES RESILIENCE MEAN? ............................................................................................ 21 RESILIENCE IS A PROCESS, NOT AN END PRODUCT ...................................................................... 22 3.2 ANALYTICAL FRAMEWORK ........................................................................................... 23 3.2.1 FIRST COMPONENT: COST COMPARISON OF RESPONSE ................................................... 24 THE HOUSEHOLD ECONOMY ANALYSIS (HEA) ......................................................................... 26 3.2.2 SECOND COMPONENT: VALUE FOR MONEY OF RESILIENCE INTERVENTIONS ........................ 29 3.3 METHODOLOGY ........................................................................................................ 29 3.3.1 DATA ANALYSIS – “TOP-DOWN APPROACH” ................................................................ 35 3.3.2 DATA ANALYSIS – “BOTTOM-UP APPROACH” ............................................................... 31 3.4 VARIATIONS BETWEEN THE TWO COUNTRIES ................................................................... 37 3.5 LIMITATIONS ............................................................................................................ 38
4 COST COMPARISON OF DROUGHT RESPONSE - KENYA......................................... 40 4.1 OVERVIEW ............................................................................................................... 40 4.2 KENYA – TOP-DOWN ASSESSMENT ............................................................................... 51 4.2.1 KENYA - WHAT IS THE COST OF LATE HUMANITARIAN RESPONSE? ................................... 51 4.2.2 KENYA - WHAT IS THE COST OF EARLY RESPONSE? ........................................................ 54 4.2.3 KENYA - WHAT IS THE COST OF RESILIENCE? ................................................................ 55 4.2.4 KENYA - COMPARISON OF NATIONAL LEVEL COSTS ........................................................ 56 4.3 KENYA – BOTTOM-UP ASSESSMENT ............................................................................. 40 4.3.1 KENYA - WHAT IS THE COST OF LATE HUMANITARIAN RESPONSE? ................................... 41 4.3.2 KENYA - WHAT IS THE COST OF EARLY RESPONSE? ........................................................ 43 4.3.3 KENYA - WHAT IS THE COST OF RESILIENCE? ................................................................ 43 4.3.4 KENYA - COST COMPARISON OF RESPONSE .................................................................. 44 4.3.5 KENYA - SECTOR-BASED COST BENEFIT ANALYSIS .......................................................... 47 LIVESTOCK INTERVENTIONS .................................................................................................. 47 WATER INTERVENTIONS ...................................................................................................... 48 EDUCATION ....................................................................................................................... 50
5 COST COMPARISON OF DROUGHT RESPONSE - ETHIOPIA .................................... 58 5.1 OVERVIEW ............................................................................................................... 58

Economics of Resilience Final Report 5
5.2 ETHIOPIA – TOP-DOWN ASSESSMENT ........................................................................... 67 5.2.1 ETHIOPIA - WHAT IS THE COST OF LATE HUMANITARIAN RESPONSE?................................ 67 5.2.2 ETHIOPIA - WHAT IS THE COST OF EARLY RESPONSE? .................................................... 70 5.2.3 ETHIOPIA - WHAT IS THE COST OF RESILIENCE? ............................................................ 71 5.2.4 ETHIOPIA - COMPARISON OF NATIONAL LEVEL COSTS .................................................... 72 5.3 ETHIOPIA – BOTTOM-UP ASSESSMENT .......................................................................... 58 5.3.1 ETHIOPIA - WHAT IS THE COST OF LATE HUMANITARIAN RESPONSE? ............................... 59 5.3.2 ETHIOPIA - WHAT IS THE COST OF EARLY RESPONSE? .................................................... 60 5.3.3 ETHIOPIA - WHAT IS THE COST OF RESILIENCE? ............................................................ 61 5.3.4 ETHIOPIA - COST COMPARISON OF RESPONSE .............................................................. 62 5.3.5 ETHIOPIA - SECTOR-BASED COST BENEFIT ANALYSIS ...................................................... 64 LIVESTOCK INTERVENTIONS .................................................................................................. 65 WATER ............................................................................................................................ 66
6 VALUE FOR MONEY OF RESILIENCE INTERVENTIONS ............................................ 74
7 CONCLUSIONS AND RECOMMENDATIONS ........................................................... 77 7.1 CONCLUSIONS ........................................................................................................... 77 7.2 RECOMMENDATIONS ................................................................................................. 79 7.3 AREAS FOR FURTHER WORK ......................................................................................... 80
Economics of Resilience Final Report 6
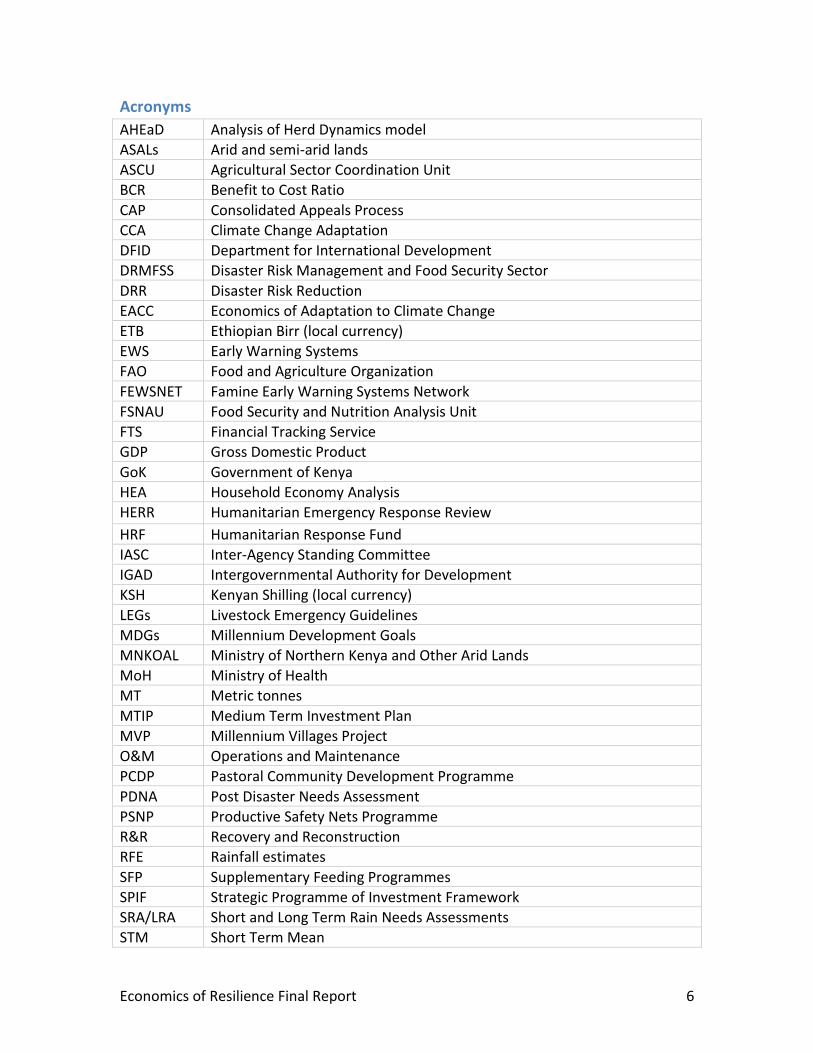
Acronyms
AHEaD Analysis of Herd Dynamics model
ASALs Arid and semi-arid lands
ASCU Agricultural Sector Coordination Unit
BCR Benefit to Cost Ratio
CAP Consolidated Appeals Process
CCA Climate Change Adaptation
DFID Department for International Development
DRMFSS Disaster Risk Management and Food Security Sector
DRR Disaster Risk Reduction
EACC Economics of Adaptation to Climate Change
ETB Ethiopian Birr (local currency)
EWS Early Warning Systems
FAO Food and Agriculture Organization
FEWSNET Famine Early Warning Systems Network
FSNAU Food Security and Nutrition Analysis Unit
FTS Financial Tracking Service
GDP Gross Domestic Product
GoK Government of Kenya
HEA Household Economy Analysis
HERR Humanitarian Emergency Response Review
HRF Humanitarian Response Fund
IASC Inter-Agency Standing Committee
IGAD Intergovernmental Authority for Development
KSH Kenyan Shilling (local currency)
LEGs Livestock Emergency Guidelines
MDGs Millennium Development Goals
MNKOAL Ministry of Northern Kenya and Other Arid Lands
MoH Ministry of Health
MT Metric tonnes
MTIP Medium Term Investment Plan
MVP Millennium Villages Project
O&M Operations and Maintenance
PCDP Pastoral Community Development Programme
PDNA Post Disaster Needs Assessment
PSNP Productive Safety Nets Programme
R&R Recovery and Reconstruction
RFE Rainfall estimates
SFP Supplementary Feeding Programmes
SPIF Strategic Programme of Investment Framework
SRA/LRA Short and Long Term Rain Needs Assessments
STM Short Term Mean

Economics of Resilience Final Report 7
ToT Terms of Trade
UNOCHA United Nations Office for the Coordination of Humanitarian Affairs
USD United States Dollar
VFM Value for Money
WFP World Food Programme
WHO World Health Organization
WSDP Water Sector Development Program

Economics of Resilience Final Report 8
1 Introduction
1.1 Introduction
The impacts of natural disasters and complex emergencies have been increasing over
recent decades, putting the humanitarian system under considerable pressure. In 2010
natural disasters affected more than 217 million people, killed more than 297,000
people and caused $123.9 billion in economic damages.1 The types, dimensions, and
dynamics of humanitarian crises are further increasing, in some cases exponentially.2 A
variety of factors are contributing to this increase, including climate change, increasing
vulnerability due to erosion of natural, social and economic capacities, and fluctuations
in the global economy.
The costs of humanitarian crises are equally growing – not only do disasters and
complex emergencies result in significant economic losses, but they also require
mobilization of large amounts of humanitarian aid from the international community.
According to a recent study on funding streams for emergency response, aid from
governments reached US$12.4 billion in 2010, the highest figure on record. At the same
time the CAP reached its highest ever figure of US$11.2 billion, double that of 2006. This
aid is heavily targeted to a few countries - over the past ten years, almost 50% of
humanitarian aid (amounting to just under US$90 billion) was consistently spent in just
nine countries.3
There is growing consensus that greater investment needs to be made in preparedness
to reduce the impacts of crises, and an even greater imperative for further work to build
the resilience of communities to be able to cope with these events themselves. The
scales need to tip, with greater emphasis placed on building capacities and reducing
vulnerabilities to allow countries and communities to reduce risk and recover
themselves, and thereby reduce the high levels of aid dependency that are becoming
systemic in some parts of the world.
And yet, despite a rhetoric that has called for reform for the past decade, only 4.2% of
total humanitarian aid in 2009 was for disaster prevention and preparedness. For every
1 Guha-Sapir, D. et al (2010). “Annual Disaster Statistical Review 2010: The numbers and trends.” Centre
for Research on the Epidemiology of Disasters (CRED), Brussels. 2 IFRC (2011). “World Disasters Report 2011: Focus on Hunger and Malnutrition.”
3 Kellet and Sweeney (2011).

Economics of Resilience Final Report 9
$100 spent on the top twenty humanitarian recipients over the past five years only 62
cents are spent on preparedness.4
It is widely held that, broadly speaking, investment in building the resilience of
communities to cope with risk in disaster prone regions is more cost-effective than the
ever-mounting humanitarian response. Yet little solid evidence exists to support this
claim. And while the past decade has seen significant attempts to reform the
humanitarian system – particularly initiatives to expedite funding for emergency
operations – efforts to increase the focus of humanitarian funding and response to risk
reduction, remains a challenge.5
The June 2011 UK Government Response to the Humanitarian Emergency Response
Review (HERR) presented disaster resilience as ‘a new and vital component to [the UK
Government’s] humanitarian and development work.’6 Building on this, the UK
Government’s Humanitarian Policy7 puts resilience at the centre of its approach to
addressing disasters, both natural and man-made. This includes commitments to embed
resilience-building in all DFID country programmes by 2015, integrate resilience into
their work on climate change and conflict prevention and improve the coherence of
their development and humanitarian work.
Following the UN General Assembly in September 2011, the UK has agreed to develop a
proposal on how resilience can be taken forward within the international system.
Evidence on the cost-effectiveness of disaster resilience will be crucial in progressing
this agenda.
4 Kellet and Sweeney (2011). 5 Ibid. 6 www.dfid.gov.uk/Documents/publications1/hum-emer-resp-rev-uk-gvmt-resp.pdf?epslanguage=en 7 “Saving lives, preventing suffering and building resilience”
Economics of Resilience Final Report 10
1.2 Aims of the Study
The purpose of this work is to support this agenda by providing the first step towards:
A solid evidence base on the cost effectiveness of building resilience to disasters
as compared with the cost of relief and early response.
Identify the types of interventions that can provide the highest “Value for
Money” (VfM); and
Incentivise donors, partner governments, multilaterals and implementing
agencies to invest in and work more on resilience to disasters.
1.3 Scope of the Study
The Horn of Africa, specifically Kenya and Ethiopia, were selected as a focus for this
study, with the aim that the methodology can be replicated elsewhere. The Horn
repeatedly suffers from disasters – complex emergencies8, droughts and floods are
prevalent. And yet relief and humanitarian aid remain the predominant response to
these crises. Kenya and Ethiopia were selected not only for their vulnerability to
disasters, but also for practical reasons (e.g. security issues).
Within these two countries, the study specifically focuses on response and resilience for
pastoralists in the face of drought. Pastoralism is one of the predominant livelihood
systems in the region, is highly dependent on livestock by definition and involves the
mobility of herds to access grazing and water. Pastoralism is a specialized livelihood
system that has persisted for centuries – one could argue that it has been one of the
most resilient livelihood systems because of the ability of pastoralists to adapt to
changing conditions. However, significant shifts in natural, socio-economic and
institutional conditions have resulted in high levels of vulnerability, and as a result
pastoralists are heavily impacted by drought.
1.4 Outline of this Report
This report is structured as follows:
Section 2 provides a brief overview of the local context in each country – with
specific reference to the history and impacts of drought, how this affects
pastoralists, as well as types of measures that are being used to build resilience.
Section 3 describes the analytical framework and methodology used to
undertake the analysis, in particular defining key concepts for the analysis.
Section 4 describes the findings from the Kenya analysis. 8 e.g. natural hazard and conflict combined, such as Somalia and South Sudan

Economics of Resilience Final Report 11
Section 5 describes the findings from the Ethiopia analysis.
Section 6 provides some initial evidence on the value for money of resilience
interventions.
Section 7 draws key conclusions and recommendations.
This report is supported by three studies:
The Kenya study, which focuses on data specific to Kenya;
The Ethiopia study, which focuses on data specific to Ethiopia; and
The Household Economy Analysis (HEA) study, which presents the detailed
results of modelling under the HEA, described in greater detail below.
This report is further supported by the following annexes:
Annex A: Consultations
Annex B: “Who What Where” of Resilience Activities
Annex C: Detailed Calculations
Annex D: Evidence on Value for Money of Resilience Interventions

Economics of Resilience Final Report 12
2 Disaster and Resilience in Kenya and Ethiopia
2.1 Humanitarian Crises due to Drought
The Horn of Africa is dominated by arid and semi-arid lands (ASALs). These areas are
characterized by low and irregular rainfall as well as periodic droughts. The droughts
can vary in intensity, but the region is no stranger to devastating conditions brought on
by weather, conflict, government neglect or a combination of each. Between 1900 and
2011, more than 18 famine periods were registered in the region’s history.9 In 1985 a
highly destructive drought in the area killed nearly 1 million people and in the last
decade major droughts have occurred in 2001, 2003, 2005/06, 2008/09 and 2011. The
most recent crisis—the 2011 drought—still affects large segments of the population.
Ethiopia and north and eastern Kenya are both vulnerable, with greater than a 40%
annual probability of moderate to severe drought during the rainy season.10 In Kenya,
over 80% of the land mass is defined as arid and semi-arid lands and in Ethiopia, 70% of
the country’s land is categorized as drylands.
Table 1: Historical Comparison of Drought Events in Kenya
Major drought
events
GoK11 and International
Humanitarian Aid Received (US$)
Number People
Affected12
2011 427.4m 3.75m
2009 432.5m 3.79m
2006 197m 2.97m
2003/2004 219.1m 2.23m
1998-2001 287.5m 3.2m
9 http://www.globalhumanitarianassistance.org/wp-content/uploads/2011/07/gha-food-
security-horn-africa-july-20111.pdf I 10 Horn of Africa Natural Probability and Risk Analysis, Bartel and Muller, June 2007. 11 Government of Kenya 12 Based on maximum numbers assessed for food aid assistance by government-led Kenya Food Security Steering Group (KFSSG). Data from Ministry of Northern Kenya.

Economics of Resilience Final Report 13
Table 2: Historical Comparison of Drought Events in Ethiopia
Major drought
events
International Humanitarian Aid
Received (US$)13
Number People
Affected14
2011 823m 4.5m
2008 1,078m 6.4m
2005 545m 2.6m
2003 496m 12.6m
In Kenya and Ethiopia droughts have a significant effect on the national economy. In
Kenya, the 1998-2000 drought was estimated to have had economic costs of $2.8
billion.15 More drastically, the Post Disaster Needs Assessment for the extended 2008-
2011 drought estimated the total damage and losses to the Kenyan economy at a
staggering $12.1 billion.16 In Ethiopia, Oxfam estimates that drought alone costs the
country $1.1 billion per year.17 By comparison, in 2011 Kenya’s GDP was $71 billion and
Ethiopia’s GDP was $95 billion.18 Figure 1 below shows how Gross Domestic Product
(GDP) growth tracks rainfall variability in Ethiopia.
In drought affected areas like the Horn of Africa, aid organizations have come to play a
significant role in providing humanitarian response. In Kenya and Ethiopia, food aid
comprises the majority of humanitarian aid. While food aid can save lives and fend off
famine, it also arrives with its own set of problems, mainly because it almost always
arrives late. During the 2006 drought, despite warnings that came as early as July 2005,
substantial interventions did not start until February 2006. Additionally, during the
recent 2011 drought, early warnings of poor rainfall were noted as early as May 2010.
In February of 2011, the Famine Early Warning Systems Network (FEWSNET) issued a
further warning that poor rains were forecasted for March to May. However, as Figure
2 shows, humanitarian funding did not increase significantly until the UN declared a
famine in July 2011. At this point, thousands had already suffered.
13 Financial Tracking Service of UNOCHA 14 Based on the CRED database (http://www.emdat.be) 15 Stockholm Environment Institute (2009). “Economics of Climate Change: Kenya”. 16 Republic of Kenya (2012) “Kenya Post Disaster Needs Assessment (PDNA): 2008-2011 Drought”. With technical support from the European Union, United Nations and World Bank. 17 Oxfam. (2011). “Briefing on the Horn of Africa Drought 2011: Disaster Risk Reduction –
fundamental to saving lives and reducing poverty.” 18 CIA World Factbook, https://www.cia.gov/library/publications/the-world-factbook/geos/ke.html.

Economics of Resilience Final Report 14
Figure 1: Economic Growth and Climate in Ethiopia19
When humanitarian aid is late, which occurs for a variety of reasons from lack of
understanding of the on the ground situation to organizational and administrative
delays, it not only directly affects lives but can also disrupt the market. By the time food
aid is mobilized and distributed, an affected region may have already passed their time
of need. With an influx of outside food sources, local market prices are then skewed.
Even when food aid is still needed, the delayed distribution can create problems. For
example, in Kenya during the 2011 drought, by the time food supplies were secured for
the full caseload of affected people, the short rains had arrived and the saturated road
network became impassable. Though humanitarian relief can and does help save lives,
long-term initiatives should be implemented to help communities deal with a crisis in
real time and to help prevent future crises.
19 De Jong, the World Bank (2005) in World Bank (2010) “The Economics of Adaptation to Climate Change: Ethiopia”. The World Bank Group, Washington, DC.

Economics of Resilience Final Report 15
Figure 2: Humanitarian Funding for Ethiopia, Somalia and Kenya, 2010/201120
2.2 Pastoralism
The drylands of the Greater Horn of Africa are inhabited by over 20 million pastoralists,
whose livelihood is dependent on movement with livestock.21 Pastoralism developed
out of the need to constantly adapt to the extreme climatic uncertainty and marginal
landscapes of the drylands, and has been practiced for centuries. Pastoralists have
sophisticated methods to optimize water and land, moving and selling animals to deal
with the effects of drought.
Yet, in recent years, the drylands of the Horn have become some of the most vulnerable
areas in the world. This is due in part to decades of political and economic
marginalisation, which has led to an erosion of the pastoral asset base. These structural
forces disrupt migration routes and access to dry season grazing areas, severely
curtailing pastoralists’ abilities to move animals to different pasture, a key mechanisms
for coping with drought. This is particularly true for poorer pastoralists, with smaller
herd sizes. Rather than address this marginalisation and reinforce adaptive capacities,
there has instead been a focus on providing emergency assistance, which has often
20 Save the Children, Oxfam (2012). “ A Dangerous Delay: The cost of late response to early warning in the 2011 drought in the Horn of Africa”. Data taken from OCHA Financial Tracking Service (FTS) 21 “Disaster Risk Reduction in the Drylands of the Horn of Africa” (2011). REGLAP Newsletter.

Economics of Resilience Final Report 16
been either too late or inappropriate, and which has further undermined sustainable
development in these areas.22
Pastoralists in Ethiopia are mainly found in seven regions including Afar, Somali, SNNP,
Oromia, Dire Dawa, Benshangul, Gumuz, and Gambella. The main livelihoods systems
include pastoralism, farming and ex-pastoralism – those who have dropped out of
pastoralism and now survive on petty income-earning activities.23 Pastoralists constitute
a minority in Ethiopia, with an estimated 12–15 million of Ethiopia’s 77 million people.24
Livestock in pastoral regions accounts for an estimated 40% or so of the country’s total
livestock population.25 The Intergovernmental Authority for Development (IGAD)
estimates that in 2008/09 the pastoral livestock population contributed 34.8 billion ETB
(Ethiopian Birr) out of the total national livestock value of 86.5 billion ETB to the
national economy. According to the Ministry of Agriculture, Ethiopia’s total livestock
population has reached more than 88 million—the largest in Africa—and the livestock
sub-sector contributes an estimated 12% to the total GDP and over 45% to the
agricultural GDP.
Pastoralism is also the dominant production system in the ASALs, which stretch across
the whole of northern Kenya (Turkana, Marsabit, Wajir and Mandera), much of eastern
Kenya and the southern rangelands (Laikipia, Narok, Kajiado). The ASALs are home to
about 10 million people and approximately 70% of the national livestock herd. In Kenya,
pastoralism makes a significant contribution to the economy with livestock production
accounting for 50% of agricultural GDP.26 However, the ASALs have the lowest
development indicators and the highest incidence of poverty in the country. Eighteen of
the 20 poorest constituencies in Kenya, where 74% - 97% of people live below the
poverty line, are in Northern Kenya. The highest rates of poverty are observed among
those who are no longer directly involved in pastoralism – as populations grow,
rangelands are reduced and both government and private sector investment in the
sector remains low so the proportion of the population able to make a viable living on
pastoralism is reducing. This trend is exacerbated by recurrent droughts and other
22 Ibid; HPG Briefing note (2006). “Saving Lives through Livelihoods”. 23 Behnke et al (2007). “Piloting the Productive Safety Net Programme in Pastoral Areas of Ethiopia, Revised Programme Proprosal.” 24 PFE (2006). Inclusion of a ‘Chapter on Pastoralism’. Ethiopia: Building on Progress: A Plan forAccelerated and Sustained Development to End Poverty (PASDEP). In Pantuliano, S. and M. Wekesa (2008). “Improving Drought Response in Pastoral Areas of Ethiopia”. Overseas Development Institute. 25 Pantuliano, S. and M. Wekesa (2008). Specifically pastoralists account for 20% of sheep, 25% of goats, 73% of cattle, and 100% of camel population in the country. Source: PFE, 2010 26 Agricultural GDP represents approximately 30% of total GDP.

Economics of Resilience Final Report 17
shocks leaving many dependent on casual labour, better-off clan members or
environmentally destructive activities such as firewood or charcoal sales.
Both arid and semi-arid districts experience chronic food insecurity and in the last
decade millions have become increasingly reliant on regular food relief. While the
economy of the arid districts is dominated by mobile pastoralism, in the better-watered
and better-serviced semi-arid areas a more mixed economy prevails, including rain-fed
and irrigated agriculture, agro-pastoralism, bio-enterprise and conservation or tourism-
related activities.
Pastoralism is adapted to dryland environments, and operates effectively as a
livelihoods system in low and highly variable rainfall conditions. On the one hand,
pastoralism as a system is growing in some ways, for instance as formal livestock export
markets are expanded. However, large sub-populations within pastoral areas i.e. poorer
households with few or no animals, are becoming increasingly vulnerable, for a variety
of reasons, including:
Declining sustainability as livestock holdings decrease for the poorer households,
and the human population grows.
Reduced rangelands due to overgrazing and tighter boundary controls and sale and
enclosure of lands for a range of uses such as settled agricultural, reserves and
conservancy. Wealthier pastoralists with larger herds control more land for
commercialized pastoralism.
Declining livestock and agricultural productivity due to low investment, poor
husbandry practices and technologies (despite a growing livestock export trade).
Environmental degradation and deterioration of natural resources to the point that
production may decline below recovery levels.
Loss of productive assets (livestock/farming/irrigated land) due to drought, floods,
disease and livestock theft, particularly for poorer households.
Breakdown of traditional institutions and social relations as migration patterns
change.
Limited access to markets for selling animals.
Low socio-economic empowerment of women and youth.
Geographic isolation in terms of infrastructure, communications and basic services.
Increasing impoverishment of some communities and more vulnerable
households.27
27 Ibid.

Economics of Resilience Final Report 18
In a drought, pastoral households sell animals in order to buy staple cereals. Because
everyone is selling, and there are few buyers, prices fall substantially. If the animals
have a buyer, this does not necessarily represent a loss to the overall economy, but their
low value represents a loss of a key capital asset to the seller household. Further, many
animals die from starvation. These pressures predominantly affect poorer households
with smaller herd sizes, and can be a common reason for household descent into
poverty.
2.3 Building Resilience for Pastoralists in the Face of Drought
For the purposes of this study, drought responses in Kenya and Ethiopia (and much of
the Horn) have been broadly categorised into the following:
1) Late humanitarian/emergency relief – Interventions that address the direct
impacts of a crisis or disaster on the target population. Primarily these take
place during the crisis itself although may continue after (often as a result of late
response).
2) Early / pre-planned responses – Interventions undertaken to prepare for,
mitigate or reduce the impact of the next anticipated/likely disaster. These may
be on-going activities or those which intensify or scale up as a crisis is becoming
evident. It assumes appropriate Early Warning systems (EWS) are in place and
responded to. Many of these activities overlap with the late humanitarian
activities, the key difference being the timing of implementation.
3) Disaster resilience activities – This category encompasses a broad range of
activities, each should fundamentally increase a community’s resilience to
disasters. The outcomes produced by these interventions should contribute to
reducing the impact of a drought so that external humanitarian relief is reduced,
less regularly required or, ideally, eliminated. The interventions listed in the table
overleaf are not exhaustive but indicative of the wide range of activities
considered ‘resilience’ building by many (views clearly vary). It should be noted
that many ‘normal’ development activities are included.
The table on the next page further expands on these categories by listing typical drought
response interventions in various sectors. As mentioned, the list is not exhaustive, but
merely illustrative, showing how relief interventions in one sector can become more
‘resilient’ as they move along the relief to development continuum.
Annex B contains a “who, what, where” of projects and programmes that are addressing
resilience in each of the countries.

Economics of Resilience Final Report 19
Table 3: Categories of Support for Drought Response Category Humanitarian/Emergency
Relief – when the disaster hits
Early response – anticipating the next
disaster
Disaster resilience – Increased ability to withstand
repeated disasters
Food / Cash
Transfers
Food aid in response to
twice yearly long/short
rains assessments and
emergency ‘flash’ appeals.
Emergency ad hoc cash
transfers (primarily by
NGOs).
Multi-year, planned food and/or cash
transfers assessed using ongoing
seasonal / EW assessments /
information. Levels and targeting
adjusted/upscaled as needs vary.
Food stores in place in all locations for
pre-positioning stocks.
Mechanisms in place to purchase local
food products for food aid, especially
when surpluses available.
Multi-year, planned food and/or cash transfers
provided for most vulnerable.
Distribution systems privatised and local food
commodities used whenever appropriate.
Effective
Early
Warning /
Food Security
Information
Systems
Timely, regular information analysed
into reports for use by local and
national stakeholders to trigger, upscale
and downscale activities.
Communities and districts contribute to
and receive EW/FSIS data and analysis
monthly. Supported to implement
drought contingency in plans.
Timely, regular information analysed into reports for
use by local and national stakeholders to plan and
organise on-going development and emergency
response.
Communities and districts active participation in
EW/FSIS data collection and regular use.
Develop and implement local contingency / resilience
building plans. On-going community development
support.
WASH
Water tankering,
emergency borehole
repairs, maintenance, fuel
subsidies.
Water user / management committees
and local Water Authorities implement
drought contingency plans with
reserved funds.
Implementation of Regional/District water strategies:
expansion of water pans, boreholes, shallow wells,
bikads etc.
Drip feed irrigation schemes where appropriate.
Ongoing training and capacity building support to
District Water Offices/ Water user association.
Nutrition and
Health
Outreach therapeutic and
supplementary feeding
programmes (OTP/SFP).
MoH supported to scale up facility-
based and outreach therapeutic and
supplementary feeding programmes
MoH supported to scale up high impact nutrition and
health interventions to all locations.
Trained and equipped community based health care

Economics of Resilience Final Report 20
Category Humanitarian/Emergency
Relief – when the disaster hits
Early response – anticipating the next
disaster
Disaster resilience – Increased ability to withstand
repeated disasters
Blanket supplementary
feeding programmes
(BSFPs).
Emergency vaccination
campaigns, cholera
response etc.
(OTP/SFP).
Early blanket supplementary feeding
programmes (BSFPs).
Pre-positioning of medical and nutrition
supplies.
Timely vaccination campaigns, cholera
response etc
workers able to provide basic preventative and curative
health care to remote communities.
Local health committees prioritising and planning local
health care.
Comprehensive coverage of facility-based and outreach
health and nutrition services (including NIDs), stock out
of medical and nutrition supplies.
Livestock
Fodder distribution and
water tankering, slaughter,
de-stocking.
Emergency deworming
and vaccination
campaigns.
Interventions as per Livestock
Emergency Guidelines (LEGs).
Timely facilitation of commercial de-
stocking, herd mobility and grazing
agreements.
Timely deworming and vaccination
campaigns with support of trained
cadres of community health workers.
A comprehensive livestock management strategy in
place, including components to support ex-pastoralists
who have to move out of the sector. Ongoing facilitation of livestock market facilities,
market information systems and linkages with buyers.
Fodder production and storage systems developed.
Communities facilitated to have on-going herd mobility
and grazing agreements.
Support comprehensive coverage of quality vet services
and drug supply able to implement regular deworming
and vaccination campaigns.
Livestock insurance schemes.
Education
School feeding
programmes
Water tankering to schools
and emergency sanitation
School feeding incorporated into single
food / cash pipeline planning.
School / community water and
sanitation clubs/ committees
implement school drought contingency
plans
Ensure comprehensive access to primary education via
traditional and alternative school provision.
Expand provision of boarding schools for pastoralists
(for girls and boys), teacher training and vocational and
technical colleges.
Infrastructure Road construction, electrification, improved
communication networks, expanded financial services
etc

Economics of Resilience Final Report 21
3 Key Concepts, Analytical Framework and Methodology
3.1 Key Concepts
What does resilience mean?
According to DFID, “disaster resilience is the ability of countries, communities and
households to manage change, by maintaining or transforming living standards in the
face of shocks or stresses - such as earthquakes, drought or violent conflict – without
compromising their long-term prospects.”
Or, in other words, according to John Twigg’s “characteristics of a disaster resilient
community”:
“A focus on resilience means putting greater emphasis on what communities can
do for themselves and how to strengthen their capacities, rather than
concentrating on their vulnerability to disaster or their needs in an
emergency.”28
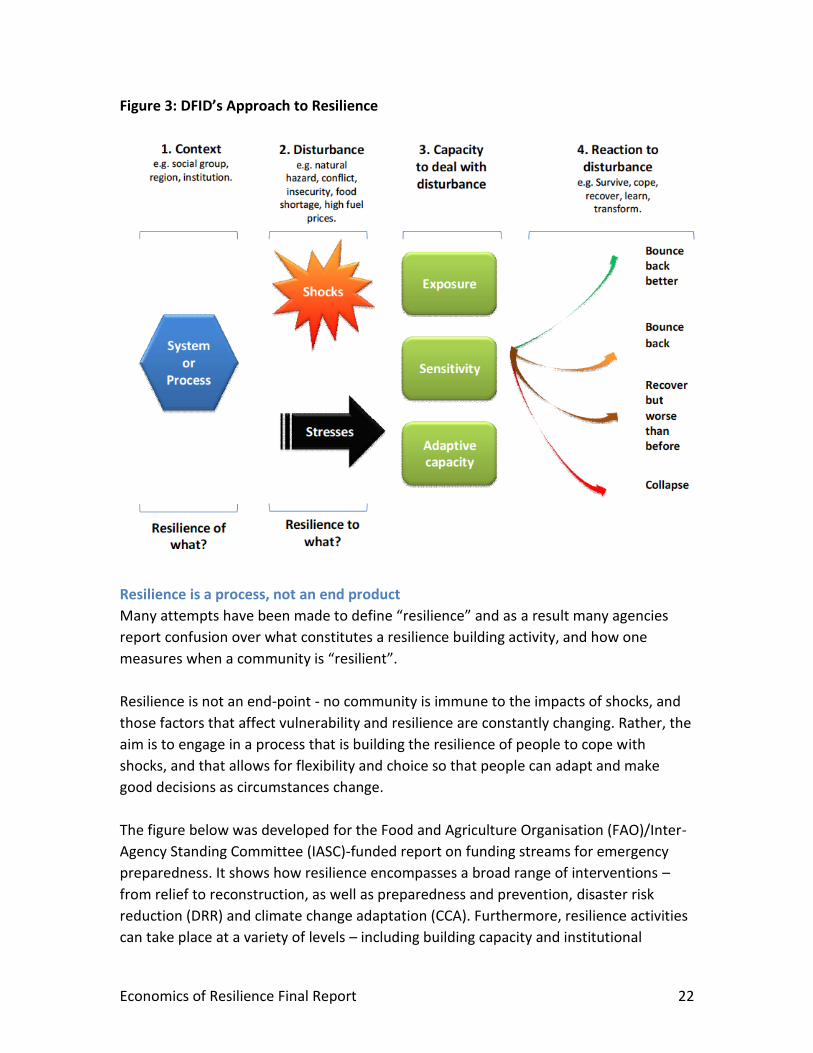
DFID’s definition of resilience is comprised of four elements:
Context – resilience of what?
Disturbance – resilience to what?
Capacity to deal with the disturbance – this includes the exposure to risk, the
sensitivity or degree to which a system will be impacted by the risk, and the adaptive
capacities of relevant actors.
Reaction to disturbance – in the best case, the reaction to a shock is to “bounce back
better”.
28 Twigg, J. (2007). “Characteristics of a Disaster Resilient Community”. For the DFID Disaster Risk
Reduction Interagency Coordination Group.
Economics of Resilience Final Report 22
Figure 3: DFID’s Approach to Resilience
Resilience is a process, not an end product
Many attempts have been made to define “resilience” and as a result many agencies
report confusion over what constitutes a resilience building activity, and how one
measures when a community is “resilient”.
Resilience is not an end-point - no community is immune to the impacts of shocks, and
those factors that affect vulnerability and resilience are constantly changing. Rather, the
aim is to engage in a process that is building the resilience of people to cope with
shocks, and that allows for flexibility and choice so that people can adapt and make
good decisions as circumstances change.
The figure below was developed for the Food and Agriculture Organisation (FAO)/Inter-
Agency Standing Committee (IASC)-funded report on funding streams for emergency
preparedness. It shows how resilience encompasses a broad range of interventions –
from relief to reconstruction, as well as preparedness and prevention, disaster risk
reduction (DRR) and climate change adaptation (CCA). Furthermore, resilience activities
can take place at a variety of levels – including building capacity and institutional
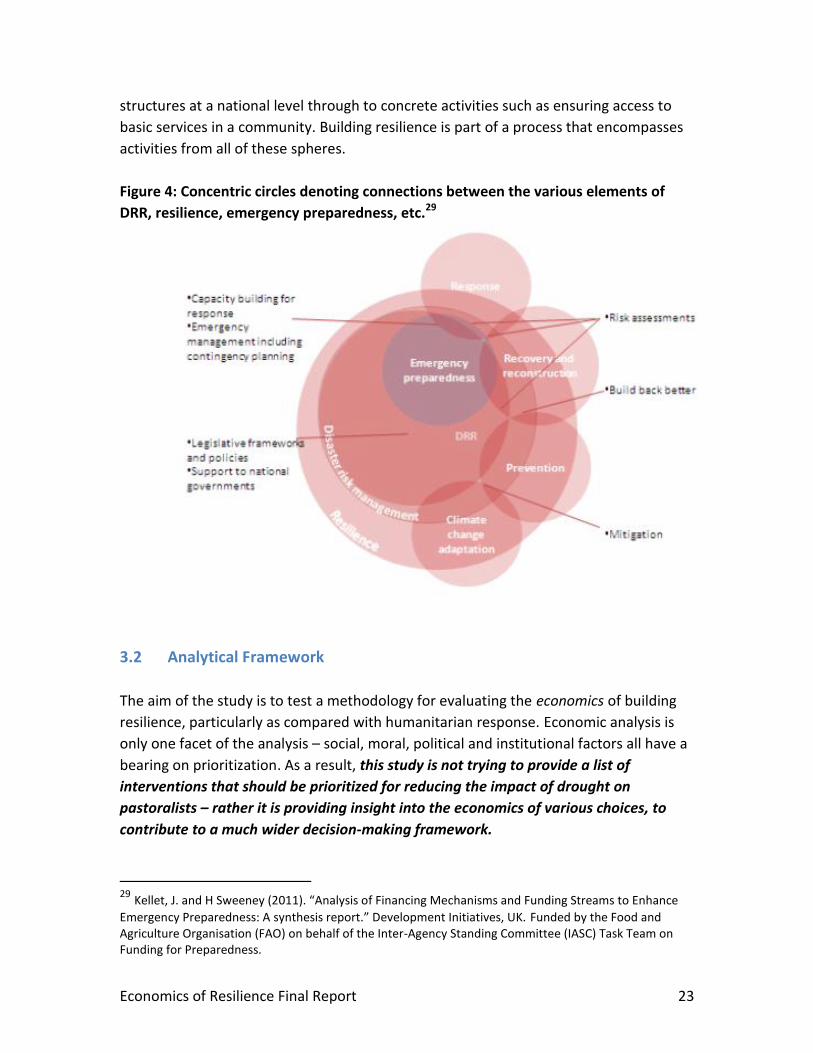
Economics of Resilience Final Report 23
structures at a national level through to concrete activities such as ensuring access to
basic services in a community. Building resilience is part of a process that encompasses
activities from all of these spheres.
Figure 4: Concentric circles denoting connections between the various elements of
DRR, resilience, emergency preparedness, etc.29
3.2 Analytical Framework
The aim of the study is to test a methodology for evaluating the economics of building
resilience, particularly as compared with humanitarian response. Economic analysis is
only one facet of the analysis – social, moral, political and institutional factors all have a
bearing on prioritization. As a result, this study is not trying to provide a list of
interventions that should be prioritized for reducing the impact of drought on
pastoralists – rather it is providing insight into the economics of various choices, to
contribute to a much wider decision-making framework.
29 Kellet, J. and H Sweeney (2011). “Analysis of Financing Mechanisms and Funding Streams to Enhance
Emergency Preparedness: A synthesis report.” Development Initiatives, UK. Funded by the Food and Agriculture Organisation (FAO) on behalf of the Inter-Agency Standing Committee (IASC) Task Team on Funding for Preparedness.

Economics of Resilience Final Report 24
Furthermore, the themes discussed in this report are subject to high levels of
uncertainty. For example, building resilience can mean many different things, to
different groups of people, and therefore estimating a cost of resilience is very
challenging. The approach in this paper has been to use conservative values throughout
(using the higher end of costs, and the lower end of benefits) to ensure that any
changes to the underlying assumptions and estimates only emphasize the overall
findings.
This study effectively has two components, each of which is discussed below:
The first is to compare the cost of drought under late humanitarian response,
against the cost of early response, against the cost of building resilience to
disasters. It should be noted that these categories are not mutually exclusive –
in this context many interventions are common to late and early response, with
the key difference being timing.
The second is to identify the types of interventions that build resilience to
disasters that can provide the highest “Value for Money” (in other words,
maximize benefits per unit of cost).
3.2.1 First Component: Cost comparison of response
The first component of this study seeks to compare the cost of late humanitarian
response, to early response, to building resilience to drought. While humanitarian action
is clearly required in certain situations, the overall goal is to ensure that human
populations can cope with crisis and continue to develop.
The analytical framework is built around three storylines to facilitate analysis.
Storyline A: Late response to drought results in humanitarian intervention. Food and
non-food aid are required to ensure that the population affected survives. Because a
humanitarian crisis has been reached, and response is late, loss of life and livestock are
excessive. Furthermore, while aid helps to ensure that people survive, a downward cycle
of asset depletion is evident, and the caseload for humanitarian intervention is seen to
increase over time (both in terms of the number of people requiring aid, and the
number of months that aid is required on average). When the next drought hits,
households have typically not recovered asset levels from the previous drought.
Storyline B: Early response is taken to ensure survival at the time of early warning of a
crisis. In this case, action is taken before the onset of significant livestock deaths.
Interventions are not necessarily different from those taken in Storyline A, but
importantly they are taken at the first signs of a potential drought. Food and other aid
Economics of Resilience Final Report 25
are still required to ensure that the population affected survives. However, the impact is
far less at this stage (populations have not yet reached destitution) and therefore per
capita intervention costs are smaller, and the duration that aid is required is shorter.
Furthermore, the unit cost of procuring and transporting food and other aid is much
cheaper. It is further assumed that 50% of excess adult animal deaths can be
commercially destocked and converted to sales through early intervention.30 Evidence
indicates that money raised through commercial destocking can then be used for other
coping mechanisms, such as buying food for human consumption, and feed or
veterinary services for remaining animals. It is also likely that a reduction in number of
animals will reduce pressure on existing water and forage supplies for the remaining
animals.
Storyline C: Investment is made in building the resilience of communities to cope with
drought on their own. If the investment is made to the extent required up front,
communities should be able to cope without external intervention for the foreseeable
future (ceteris paribus). Clearly, resilience is not a static event; it requires evolving and
adapting over time as a whole variety of factors can change to influence a community’s
coping capacity. It is also not expected that resilience will be built to a threshold that
allows a community to cope with any event, no matter how extreme. However, the
concept is to build resilience to a level that allows communities to cope with minimal
external humanitarian or early intervention, given existing conditions – i.e. drought
every few years.
The cost of building resilience cannot be estimated directly with any great certainty.
Resilience interventions, as detailed in the previous section, can represent a whole host
of activities, and the effectiveness of these activities at building transformational change
will vary depending on factors such as how they are implemented and the local context.
In addition, resilience activities will change over time as existing conditions change.
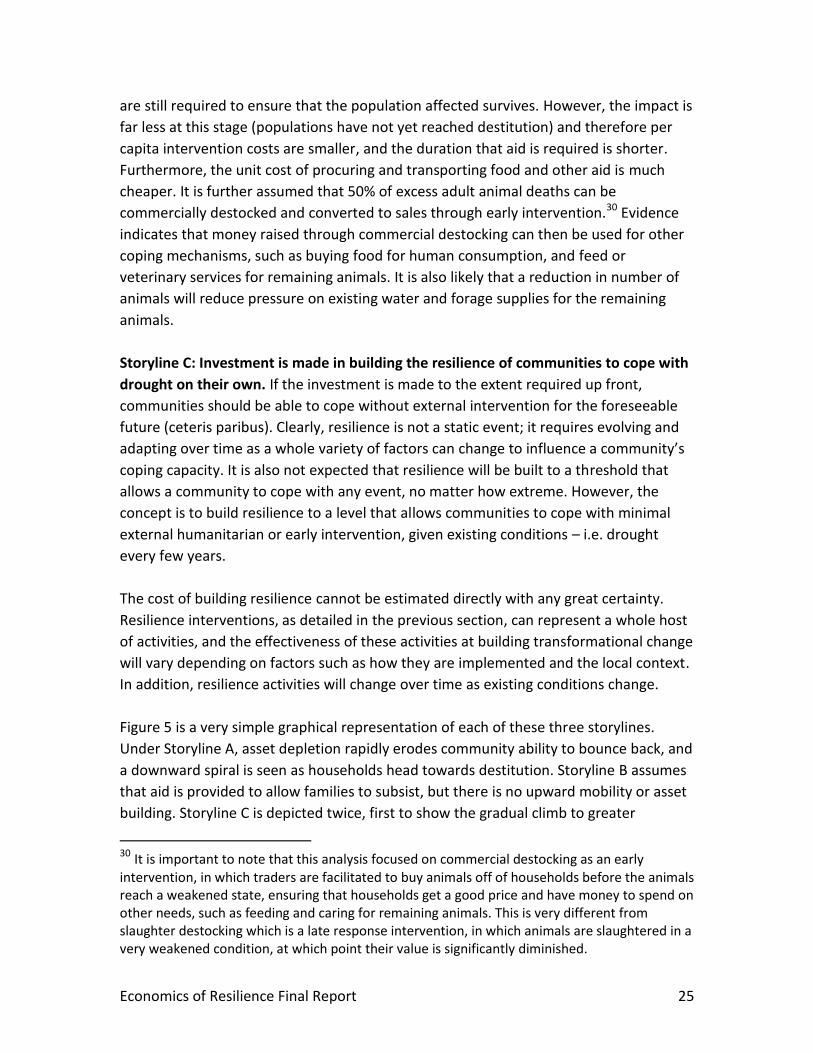
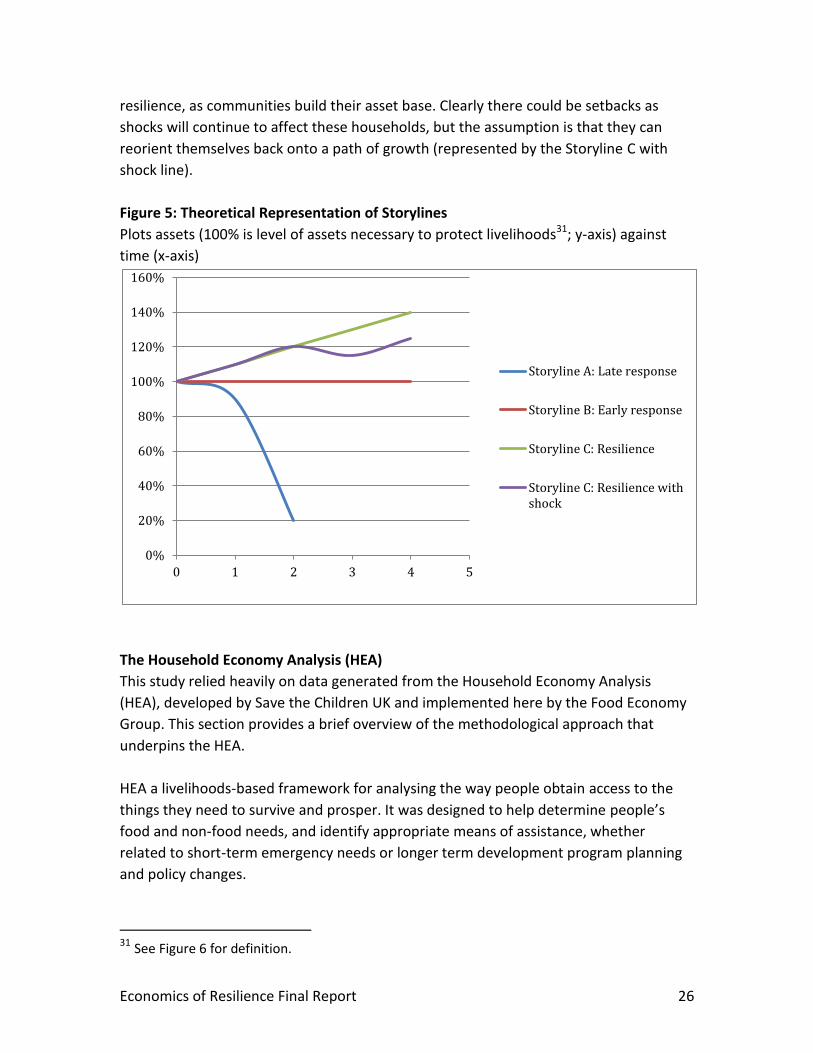
Figure 5 is a very simple graphical representation of each of these three storylines.
Under Storyline A, asset depletion rapidly erodes community ability to bounce back, and
a downward spiral is seen as households head towards destitution. Storyline B assumes
that aid is provided to allow families to subsist, but there is no upward mobility or asset
building. Storyline C is depicted twice, first to show the gradual climb to greater
30 It is important to note that this analysis focused on commercial destocking as an early intervention, in which traders are facilitated to buy animals off of households before the animals reach a weakened state, ensuring that households get a good price and have money to spend on other needs, such as feeding and caring for remaining animals. This is very different from slaughter destocking which is a late response intervention, in which animals are slaughtered in a very weakened condition, at which point their value is significantly diminished.
Economics of Resilience Final Report 26
resilience, as communities build their asset base. Clearly there could be setbacks as
shocks will continue to affect these households, but the assumption is that they can
reorient themselves back onto a path of growth (represented by the Storyline C with
shock line).
Figure 5: Theoretical Representation of Storylines
Plots assets (100% is level of assets necessary to protect livelihoods31; y-axis) against
time (x-axis)
The Household Economy Analysis (HEA)
This study relied heavily on data generated from the Household Economy Analysis
(HEA), developed by Save the Children UK and implemented here by the Food Economy
Group. This section provides a brief overview of the methodological approach that
underpins the HEA.
HEA a livelihoods-based framework for analysing the way people obtain access to the
things they need to survive and prosper. It was designed to help determine people’s
food and non-food needs, and identify appropriate means of assistance, whether
related to short-term emergency needs or longer term development program planning
and policy changes.
31 See Figure 6 for definition.
0%
20%
40%
60%
80%
100%
120%
140%
160%
0 1 2 3 4 5
Storyline A: Late response
Storyline B: Early response
Storyline C: Resilience
Storyline C: Resilience withshock
Economics of Resilience Final Report 27
HEA is based on the principle that an analysis of local livelihoods and how people make
ends meet is essential for a proper understanding of the impact – at a household level –
of hazards such as drought or conflict or market dislocation. These predictions at a
household level can then be used to guide wider institutional and policy analysis.
The objective of HEA-based analysis is to investigate the effects of external hazards and
shocks (whether negative or positive) on future access to food and income. Three types
of information are combined: (i) information on baseline access to food and income; (ii)
information on hazard (i.e. factors affecting access to food/income, such as livestock
production or market prices) and (iii) information on household level coping strategies
(i.e. the strategies households can use to protect and/or increase access to food or
income when exposed to a hazard).
HEA scenario analysis compares conditions in the reference year to conditions in the
current or modelled year, and assesses the impact of such changes on households’
ability to meet a set of defined minimum survival and livelihoods protection
requirements (see Figure 6).
In HEA outcome analysis, projected ‘total income’ – or the sum of all food and cash
income households secure, converted into a common unit or currency (either
percentage of kilocalories consumed (%kcals) or cash) – is compared against two
thresholds – a survival threshold and a livelihoods protection threshold. These
thresholds are defined on the basis of local patterns of expenditure. Figure 5
summarizes the components of each threshold.
A herd dynamics model – Analysis of Herd Dynamics (AHEaD) – developed by Mark
Lawrence of the Food Economy Group has been used to project herd losses and gains.
The model was developed in 2011-12 to capture the relationship between rainfall
(quality and quantity of rains by season) and herd dynamics components. Assumptions
about the relationships built into the model have been developed using HEA baseline
data on herd dynamics, baseline data and field information from the Food Security and
Nutrition Analysis Unit (FSNAU) of FAO, and secondary data on pastoral livestock
production in East Africa and the Horn of Africa.

Economics of Resilience Final Report 28
Figure 6: HEA Emergency Response Thresholds Compared to Total Income Levels
The Survival Threshold represents
the total income required to cover:
a) 100% of minimum food energy
needs (2100 kcals per person),
plus
b) The costs associated with food
preparation and consumption
(i.e. salt, soap, kerosene and/or
firewood for cooking and basic
lighting), plus
c) Any expenditure on water for
human consumption.
The Livelihoods Protection Threshold represents the total income required to sustain local
livelihoods. This means total expenditure to:
a) Ensure basic survival (above), plus
b) Maintain access to basic services (e.g. routine medical and schooling expenses), plus
c) Sustain livelihoods in the medium to longer term (e.g. regular purchases of seeds, fertilizer,
veterinary drugs, etc.), plus
d) Achieve a minimum locally acceptable standard of living (e.g. purchase of basic clothing,
coffee/tea, etc.)
The HEA methodology used in this analysis estimates deficits (measured in metric
tonnes (MT) of food required) and livestock losses for three drought scenarios (low,
medium and high), though the focus of this report is on the high magnitude drought
scenario, as this mimics the characteristics of the 2011 drought event. The methodology
further simulates three scenarios, to support the Storylines described above:
Late humanitarian response to drought, in line with Storyline A;
Early response using commercial destocking of 50% of excess adult animal
deaths, in line with Storyline B (B1); and
Early response using a combination of commercial destocking and early
interventions that can help to improve animal condition, also in line with
Storyline B (B2).
More detail around the methodology and parameters of the analysis is given in Section
3.3 below, as well as the HEA report that accompanies this report.

Economics of Resilience Final Report 29
3.2.2 Second Component: Value for Money of resilience interventions
The second component of this study is to identify the types of interventions that build
resilience to disasters that can provide the highest “Value for Money” (VfM).
The UK Government requires the spending programmes of government departments,
including DFID, to be justified according to the three concepts of economy, efficiency,
effectiveness and cost-effectiveness (referred to as the “3E framework”). These three
components define VfM of any given intervention:
Economy requires that the cost per unit of input (e.g. products, materials, fuel,
transport, salaries) be minimised, or at least kept within reasonable bounds.
Efficiency dictates that the cost per output (e.g. delivered complete service or
product, completed structure, person attended to, training course completed)
should also be minimised or kept within an acceptable range.
Effectiveness measures the cost of achieving the intended outcome of the
activity (e.g. lives saved, improved health, greater security, enhanced
livelihoods).
A final measure of cost effectiveness looks at the impact on poverty of a given
intervention measured against the cost of input.32
It was not possible within the scope of this study to perform a detailed analysis of value
for money evaluations on a range of resilience measures. The evidence to date suggests
that the benefits delivered by resilience measures vary depending on factors such as
context and how they are implemented. In other words, there is no “one size fits all”
approach. Section 6 of this report provides some initial thoughts and insight related to
VfM of resilience interventions, and could form the basis of a more detailed analysis.
3.3 Methodology
The study began with a scoping exercise, during which consultations were undertaken
with key experts working in related fields and/or the region. The aim was to gain a
better understanding of the key issues, and also to help focus the study and identify
how it could be structured to best address data availability/gaps and build on existing
work.
Data was collected through extensive consultation, both by phone/skype
teleconference, as well as through face-to-face meetings. The full project team spent a
32 Department for International Development (2011). “DFID’s Approach to Value for Money.”

Economics of Resilience Final Report 30
week in meetings in Nairobi and a week in Addis Ababa, as well as a field visit to Shinile
district in Ethiopia. Team leaders for Kenya and Ethiopia continued the data collection
exercise over successive weeks. Annex A contains a detailed list of all consultations – for
both the scoping phase as well as the country visits.
The data was then analysed from two perspectives, each of which are described in
greater detail below. In both cases, the data was evaluated using multiple sources to
allow the study team to triangulate and ensure that data was robust.
Bottom-up Analysis: The HEA modelling provided detailed data on the impacts
of drought events on household economies, over a five year period. This
approach used relevant data at a household level to compare costs of response
for a given area. It is the more detailed component of the analysis, because the
study team was able to gather much more detailed data at this level to build up
the storylines.
Top-down Analysis: There was also a reasonable amount of evidence on the
costs of response at a national level, aggregated for the country as a whole.
These costs are not necessarily specific to pastoralists (and indeed humanitarian
aid in drought has not been limited to pastoral areas), but rather represent the
cost of drought, measured in aid and losses, for each country.
In reality, late humanitarian response is the predominant approach, and is being applied
repeatedly with each event (an important exception to this is the Productive Safety Nets
Programme (PSNP) in Ethiopia, which is described in greater detail below). This will
continue for the next 20 years and beyond if practices don’t change. By contrast,
building resilience requires up front investment, which is usually justified because it
generates benefits for years.
In each case, figures were modelled over a 20-year lifetime (an analysis for 10 years is
also presented where applicable for comparison), discounted at 10%33, to then compare
costs across the three storylines. High magnitude droughts are estimated to occur every
3 to 5 years in Kenya and Ethiopia – a 5-year cycle is assumed in the modelling to be
conservative. The cost of aid is inflated by 5% with each drought event (every fifth year)
to reflect the increasing humanitarian caseload.34 Throughout the analysis, where a
range of values is applicable, the study team always picked values that would give a
33 Discount rates are used in these types of analysis to reflect the time preference for money – in other words, a dollar today is worth more to someone than a dollar tomorrow. 10% is in line with central bank rates in both countries, as well as rates used for development projects. 34 Data on increases in caseload were not available, but consultation with numerous stakeholders suggested that it is increasing by approximately 5% with each event.

Economics of Resilience Final Report 31
conservative outcome – in other words, if the underlying assumptions are tested, the
results should only become more pronounced. Annex C contains findings from
sensitivity analyses.
3.3.1 Data Analysis – “Bottom-up approach”
The bottom-up approach relied heavily on the HEA analysis and herd dynamic model.
The HEA model was undertaken for southern Ethiopia, which covers the majority of the
vulnerable population, equivalent to 2.8m affected people. HEA data in Kenya is much
more limited, and so the analysis was run for one livelihood zone - Wajir Southern
Grasslands in Northern Kenya, for a population of 367k.

Economics of Resilience Final Report 32
Box 1 contains more detail on the specific modelling parameters used in HEA analysis,
and full details of the HEA modelling specific to this study can be found in the HEA
report.
The outputs predict, for the relevant beneficiary population, the deficit measured in
metric tonnes (MT) of food, and excess animal deaths (e.g. those that would not have
died under normal conditions), as a result of the event. Because the model runs over
five years, it shows how an event in year one continues to have an impact on
households for successive years (in other words, a deficit in year 1 can require ongoing
food aid, albeit for a shorter time, in successive years, due to asset erosion). It can be
used, therefore, to quantify the need over 5 years as a result of an event in year 1. In
order to simplify the model, the cumulative impacts for all five years are summed and
represented as an impact in the drought year. Wherever possible, HEA statistics are
compared against other similar statistics to triangulate findings.
Storyline A: Cost of late humanitarian response
The cost of late humanitarian response is estimated using three components – food aid,
non-food aid, and livestock losses.
Estimating the cost of food and non-food aid:
HEA was used to model the total deficit under a humanitarian response for
households in southern Ethiopia and Wajir Grasslands in Northern Kenya, valued in
metric tonnes (MT) of food required. This estimate was multiplied by the cost per
MT to deliver food aid as estimated by the World Food Programme (WFP) for each
country ($845 Ethiopia, $889 Kenya)35, to get an estimate for the total cost of
response. Importantly, this analysis models the cost of filling household deficits –
this can be quite different from the actual aid supplied, which can often fall short of
need.
The Kenya Post Disaster Needs Assessment (PDNA)36 assessed the Kenya drought
from 2008-2011 and found that food aid over the four years accounted for 60-80%
of the total cost of response. Therefore food aid estimates are inflated by 25% (to be
conservative) to reflect the additional cost of non-food aid that is normally provided
in a humanitarian response (e.g. water, nutrition, health, etc).
35 The estimated cost of delivering food aid is based on figures from the WFP EMOPS costs for Kenya and Ethiopia, as presented in the 2011 DFID Nairobi paper “Value-for-Money in Humanitarian Aid for Kenya and Somalia.” The cost includes purchase, landside transport, storage and handling, and hence is a good representation of the total cost of delivering food aid. 36 Republic of Kenya (2012) “Kenya Post Disaster Needs Assessment (PDNA): 2008-2011 Drought”. With technical support from the European Union, United Nations and World Bank.

Economics of Resilience Final Report 33
Livestock losses are modelled using the herd dynamics model (AHEaD) and valued
using average animal values (see Table 437). It should be noted that a) these livestock
are lost over successive years as a result of the drought in the first year and b) the
average does not reflect the significant variation in livestock losses that will occur in
each household.
Table 4: Estimated Value of Livestock
Kenya38 Ethiopia39
Camel $513 $635
Cattle $323 $328
Shoat
(sheep/goat)
$33 $61
37 It is important to note that, while the most relevant livestock values were used, values are subject to high levels of fluctuation. 38 National Livestock Information System, Ministry of Livestock Development, Government of Kenya. Based on national average livestock prices from 2004-2010. 39 Data is taken from the Ethiopian Livestock Market Information System, for February to May
2012. http://www.lmiset.net/Pages/Public/Home.aspx
Economics of Resilience Final Report 34
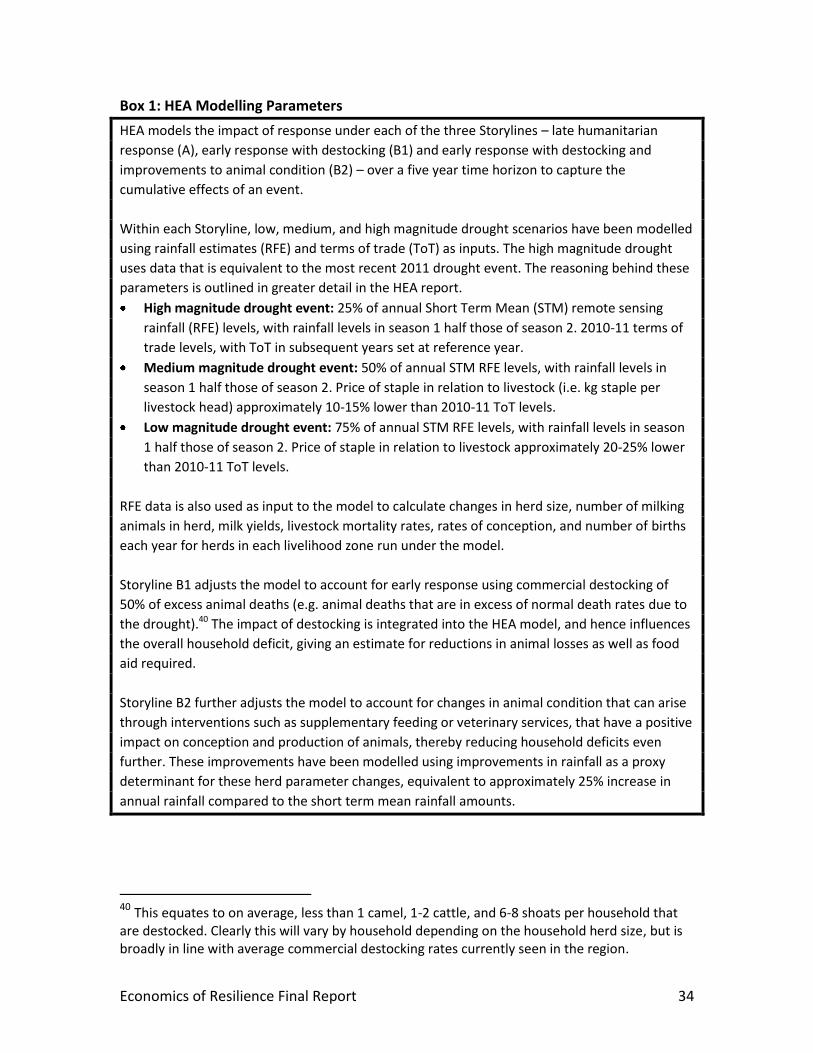
Box 1: HEA Modelling Parameters
HEA models the impact of response under each of the three Storylines – late humanitarian
response (A), early response with destocking (B1) and early response with destocking and
improvements to animal condition (B2) – over a five year time horizon to capture the
cumulative effects of an event.
Within each Storyline, low, medium, and high magnitude drought scenarios have been modelled
using rainfall estimates (RFE) and terms of trade (ToT) as inputs. The high magnitude drought
uses data that is equivalent to the most recent 2011 drought event. The reasoning behind these
parameters is outlined in greater detail in the HEA report.
High magnitude drought event: 25% of annual Short Term Mean (STM) remote sensing
rainfall (RFE) levels, with rainfall levels in season 1 half those of season 2. 2010-11 terms of
trade levels, with ToT in subsequent years set at reference year.
Medium magnitude drought event: 50% of annual STM RFE levels, with rainfall levels in
season 1 half those of season 2. Price of staple in relation to livestock (i.e. kg staple per
livestock head) approximately 10-15% lower than 2010-11 ToT levels.
Low magnitude drought event: 75% of annual STM RFE levels, with rainfall levels in season
1 half those of season 2. Price of staple in relation to livestock approximately 20-25% lower
than 2010-11 ToT levels.
RFE data is also used as input to the model to calculate changes in herd size, number of milking
animals in herd, milk yields, livestock mortality rates, rates of conception, and number of births
each year for herds in each livelihood zone run under the model.
Storyline B1 adjusts the model to account for early response using commercial destocking of
50% of excess animal deaths (e.g. animal deaths that are in excess of normal death rates due to
the drought).40 The impact of destocking is integrated into the HEA model, and hence influences
the overall household deficit, giving an estimate for reductions in animal losses as well as food
aid required.
Storyline B2 further adjusts the model to account for changes in animal condition that can arise
through interventions such as supplementary feeding or veterinary services, that have a positive
impact on conception and production of animals, thereby reducing household deficits even
further. These improvements have been modelled using improvements in rainfall as a proxy
determinant for these herd parameter changes, equivalent to approximately 25% increase in
annual rainfall compared to the short term mean rainfall amounts.
40 This equates to on average, less than 1 camel, 1-2 cattle, and 6-8 shoats per household that are destocked. Clearly this will vary by household depending on the household herd size, but is broadly in line with average commercial destocking rates currently seen in the region.

Economics of Resilience Final Report 35
Storyline B: Cost of early response
The HEA modelling undertaken for this study estimates the food deficit and number of
animals lost under late humanitarian response, as well as early response, using
commercial destocking of 50% of adult animals41 that would have otherwise died (this
results in a similar level of destocking on a per capita basis to actual evidence, though it
is clear that there is not the current capacity to do destocking at this level across either
country). The model uses a second early response scenario that combines a change in
rainfall as a proxy to estimate the potential impact of an improvement in animal
condition on household economies, combined with commercial destocking – the model
incorporates the reduction in aid costs and losses as a result. The food deficit and animal
losses are valued using the same approach defined above for Storyline A, with the
exception that food aid that is delivered early is typically less expensive. Hence the
estimated cost of delivering food aid under Ethiopia’s Productive Safety Nets
Programme (PSNP) is used, with a value of $487 per MT of food aid (2010/11).42
Storyline C: Cost of building resilience
The cost of building resilience is very difficult to estimate – most interventions can build
resilience, but their costs, and outcomes, can vary substantially depending on how they
are implemented and on the local context (to the extent that the same intervention can
build resilience in one community and erode it in another). The intention in this analysis
was to use best estimates for what it might cost to build resilience, in order to allow a
comparison with the cost of late humanitarian response, acknowledging that there is
significant uncertainty around these costs.
The analysis done for Kenya attempts to cost in detail a range of resilience building
measures necessary for pastoralists. The list includes a variety of livestock and WASH
interventions, as well as livelihoods diversification and investment in roads, with a total
estimate of $137 per capita per year43. This is considered an overestimate, as not every
41 Households do not typically destock young animals. 42 DFID (2012). “Ethiopia’s productive Safety Net Programme 2010-2014: A value for money assessment”. This estimate also includes internal transport, storage and handling costs. Other estimates suggest that the cost of food aid provided early could be even lower; for example, see World Bank (2009), “Project Appraisal Document for a Productive Safety Net APL III Project” which cites a cost of $422 per MT (2009 data). A “Cost Benefit Analysis of Africa Risk Capacity Facility” found that the cost could be even lower, citing an example of food aid in Niger where early food aid was 1/3 the cost of late food aid. 43 The figures that support this estimate can be found in Annex D, Table D1; in some cases an average is taken. They can be broken down as follows (per capita, per year): $24 livestock interventions; $25 WASH interventions; $60 livelihood interventions, $11 road interventions; $17 education support costs.

Economics of Resilience Final Report 36
household or community will require the full extent of this package of interventions. It
should further be noted that education was considered a very important component,
but official costs of education investment were exceptionally high and therefore are not
included here due to significant uncertainty around these figures.
According to the UN Millennium Project report “Investing in Development”, a typical
low income country in Sub Saharan Africa needs to increase public investments to an
average of $110 per capita per annum over a five to ten year period in order to meet
the Millennium Development Goals (MDGs). It can be assumed that communities that
have met the MDGs44 will be resilient to drought. This figure is not used in the analysis,
but provides a benchmark that suggests that the Kenya estimates are a reasonable
assumption. The Kenya costs are modelled for the first 10 years of analysis, in line with
the MDG assumption and representing a period of upfront investment. For simplicity it
is assumed that benefits will start immediately during the period of expenditure and
continue to accrue for another 10 years, reflecting the long-term impacts of building
resilience.
Further, added to these costs, is “residual risk”, i.e. on-going food aid and losses that will
continue to occur in a drought. Because there is little evidence as to the speed or
magnitude with which this change will take place, a very conservative assumption is
taken, to include 100% of the required aid under Storyline B2 in the first year, 50% in
year 5, and 25% each year thereafter, to reflect a decreasing reliance on aid.
3.3.2 Data Analysis – “Top-down approach”
Storyline A: Cost of late humanitarian response
As above, the cost of late humanitarian response is estimated using three components –
food aid, non-food aid, and livestock losses.
Estimating the cost of food and non-food aid:
The cost of food aid was estimated using national level figures on food aid
requirements. In the case of Kenya, food aid is estimated by using the short and
long-term rain needs assessments (SRA/LRA) and multiplying them by the estimated
cost per person of delivering food aid.45 Estimates for Ethiopia were estimated using
44 Eradication of extreme poverty and hunger, universal primary education, gender equality, reduced child mortality rates, improved health, access to safe water, environmental sustainability. 45 The estimated cost of delivering food aid is based on figures from the WFP EMOPS costs for Kenya and Ethiopia, as presented in the 2011 DFID Nairobi paper “Value-for-Money in Humanitarian Aid for Kenya and Somalia.”

Economics of Resilience Final Report 37
data from UNOCHA’s46 Financial Tracking Service (FTS) for humanitarian aid, using
figures specific to drought, and excluding the cost of refugee operations for the
major camps on the border with Somalia.
As above, food aid estimates are marked up to give a conservative estimate for the
additional cost of non-food aid.
Estimating livestock losses:
Aid is not the only cost incurred in a drought – numerous losses in lives, livestock, milk
and meat production, health impacts, and economic activity, all add to the economic
burden. The value of these losses can be hard to measure, but are significant, as once a
family gets past the initial stage of relief, they have to recover their livelihoods and asset
base, rebuild their herds, etc.
Livestock are the major asset holding of pastoralists, and are quantified as follows:
Additional losses from livestock are estimated using figures from the PDNA in Kenya.
The PDNA calculates the value of deaths of domestic animals as a result of the 2009
and 2011 droughts, as well as the decline in production of milk, meat, and other by-
products, and health care costs.
In Ethiopia, livestock losses are estimated using HEA estimates of excess deaths (i.e.
deaths that are additional to those that would occur normally/outside of drought
times) for Somali and Oromiya Regions of Ethiopia (referred to hereafter as
‘southern Ethiopia’). This is not comprehensive but covers a significant portion of
the area affected by drought. Animal deaths are estimated using data from the herd
model for camel, cattle, and sheep and goats (referred to collectively in the region as
shoats), and valued using average livestock prices for each. Annex C contains a
detailed explanation of these calculations.
Storyline B: Cost of early response
The early response storyline assumes that response is early enough to shorten the
amount of time that food aid is required, decrease the unit cost of food aid, and to
avoid some loss of livestock through schemes such as commercial destocking.
The HEA modelling estimates the food deficit and number of animals lost under
humanitarian and early response scenarios (see Storyline A: Cost of late humanitarian
response
The cost of late humanitarian response is estimated using three components – food aid,
non-food aid, and livestock losses.
46 United Nations Office for the Coordination of Humanitarian Affairs

Economics of Resilience Final Report 38
Estimating the cost of food and non-food aid:
HEA was used to model the total deficit under a humanitarian response for
households in southern Ethiopia and Wajir Grasslands in Northern Kenya, valued in
metric tonnes (MT) of food required. This estimate was multiplied by the cost per
MT to deliver food aid as estimated by the World Food Programme (WFP) for each
country ($845 Ethiopia, $889 Kenya), to get an estimate for the total cost of
response. Importantly, this analysis models the cost of filling household deficits –
this can be quite different from the actual aid supplied, which can often fall short of
need.
The Kenya Post Disaster Needs Assessment (PDNA) assessed the Kenya drought from
2008-2011 and found that food aid over the four years accounted for 60-80% of the
total cost of response. Therefore food aid estimates are inflated by 25% (to be
conservative) to reflect the additional cost of non-food aid that is normally provided
in a humanitarian response (e.g. water, nutrition, health, etc).
Livestock losses are modelled using the herd dynamics model (AHEaD) and valued
using average animal values (see Table 4). It should be noted that a) these livestock
are lost over successive years as a result of the drought in the first year and b) the
average does not reflect the significant variation in livestock losses that will occur in
each household.
Table 4: Estimated Value of Livestock
Kenya Ethiopia
Camel $513 $635
Cattle $323 $328
Shoat
(sheep/goat)
$33 $61

Economics of Resilience Final Report 39
Box 1 for greater detail). The percentage decrease in the cost of response under
Storylines B1 and B2 was applied to national level figures on the cost of humanitarian
response to estimate the potential change. The total cost also includes an estimate of
what it would cost to implement commercial destocking, as well as additional measures
to improve animal condition – it is not feasible to introduce commercial destocking
across the whole of the two countries; rather these costs are used as a proxy to account
for the cost associated with implementing an early response measure.
Storyline C: Cost of building resilience
It is very difficult to estimate how much it would cost to build resilience at a national
scale for each country – as discussed previously, resilience is a process, and can
encompass a very wide range of activities. Nonetheless, costed estimates from various
national development, disaster risk reduction, and adaptation plans are used to provide
a proxy for the cost of building resilience. Further to this, resilience measures will not
reduce the impact of drought completely, and hence a scaled continuation of residual
risk is included in the cost estimate.
Resilience activities also have many additional benefits that accrue outside of disaster
times, such as health and education improvements, increased income, etc. The top-
down analysis purely compares costs, whereas the bottom-up approach attempts to
incorporate some of the benefits of building resilience into the analysis.
3.4 Variations between the two countries
There are some important variations between the two country analyses below, which
should be carefully noted when interpreting the findings. It is important to note that the
differences mean that the cost figures are not comparable between the two countries:
The Kenya national level analysis incorporates findings from the Kenya PDNA on
losses associated with the 2009/2011 drought. These loss estimates are much higher
than the Ethiopia analysis, which had to rely on much more limited loss data. The
estimation of losses in Kenya is very comprehensive, covering a range of sectors.
Further, in relation to livestock, the analysis includes valuation of a full range of
animals and associated losses, as well as health costs to treat animals.
HEA baseline data is much more comprehensive for Ethiopia than Kenya. As a result,
the Ethiopia modelling was conducted for a population of 2.8 million, whereas the
Kenya modelling was conducted for a population of 347,000. The implication is that
the Ethiopia modelling covers a much wider range of households, poverty groups,
and pre-existing conditions. As a result, some of the impacts are different – for
instance, the impact of destocking is much greater in the Ethiopia model, because
destocking tends to have a greater impact on wealthier households with large herd

Economics of Resilience Final Report 40
sizes that can sell more animals, and the Ethiopia sample contained a wider range of
poverty groups. The Kenya modelling was undertaken for a livelihood zone in Wajir,
which is one of the most vulnerable.
Further to this, the baselines in Wajir were conducted in 2005/06, which was already
below average for rainfall. These act as the reference year for the rest of the
analysis. By contrast, the reference years for Ethiopia were almost entirely slightly
above normal in terms of rainfall. Not only is Wajir generally an area vulnerable to
drought and market shocks, they also have low total income and had a large deficit
in the reference year, and a very significant proportion of their total income came in
the form of food aid during the reference year. This makes for very high deficits,
faced by the majority of the population. It also usefully demonstrates how drought
affects a population that is still recovering from the previous drought. The result is
that deficits, and hence costs on a per capita basis are higher for Wajir than
southern Ethiopia.
3.5 Limitations
This type of study is very dependent on the availability of good data. Because this
analysis was so data intensive, the study team sought to gather the most robust data
possible, often comparing numerous sources. The study was also directed to some
degree by the data, designed to work with what was available. Data variability was
high – impact of droughts, livestock prices, costs of even simple measures such as
installing water access, all had widely differing estimates. To accommodate these
differences, the study team always took a conservative approach, such that any
sensitivity analysis (e.g. analysis that tests the assumptions underlying the model) is
likely to only accentuate the conclusions reached in this report. Annex C contains
sensitivity analyses that vary the following assumptions:
o The discount rate is reduced from 10% to 5%;
o The percentage of need averted by resilience measures is reduced to 75% in
the first year/drought, 25% in year 5, and 10% each year thereafter (from
100%/50%/25%/25%); and
o The potential benefits that can arise as a result of investing in resilience,
outside of reduced aid and losses, is increased from a ratio of 1.1:1 to 2:1.
The cost of resilience is particularly hard to estimate because “resilience” can cover
so many different activities. Hence the analysis relied heavily on proxy values to give
an indication of what could be achieved for a given cost.
The HEA modelling uses wealth groups (very poor, poor, etc) to estimate the impacts
of events on household economies. For the sake of simplicity, the data presented in
this report is aggregated and not presented by wealth group. However, as

Economics of Resilience Final Report 41
highlighted in the context section above, the impact of droughts on pastoralists can
vary significantly by wealth group. An analysis by wealth group could yield
interesting findings, but was not within the scope of this work.

Economics of Resilience Final Report 42
4 Cost Comparison of Drought Response - Kenya
4.1 Overview
This section presents the data and analysis for Kenya. As described in previous sections,
the analysis attempts to compare the cost of late humanitarian response, to early
response, to building resilience to drought in Kenya. The analysis is approached from
two perspectives – the first attempts to build up local or project level data (“bottom-up
approach”) for the Wajir southern grasslands, and the second uses national level
aggregated data on the cost of response (“top-down approach”). All costs and losses are
modelled over 20 years, using a 10% discount rate, and assuming a five-year drought
cycle for high magnitude events. The detailed outputs from the modelling, as well as
sensitivity analyses, can be found in Annex C.
4.2 Kenya – Bottom-Up Assessment
This analysis approaches the cost comparison from a bottom-up perspective – using
disaggregated project and sector level estimates to compare the cost of response. The
HEA and herd dynamics modelling estimates the food aid requirements and animal
losses for a high magnitude drought in Wajir Grasslands, assuming a drought in year 1,
and calculating losses over 5 years. This analysis is done for three storylines – Storyline
A, in which humanitarian aid arrives late; Storyline B1, in which early response uses
commercial destocking of 50% of adult animals that would have otherwise died47 ; and
Storyline B2, in which destocking is combined with additional early response measures,
such as supplementary feeding and veterinary services, which are assumed to improve
animal condition and hence conception and production. The destocking Storyline B1
results in similar levels of destocking on a household basis to levels actually seen in
previous events, and hence there is confidence around these figures. Storyline B2
attempts to simulate improved animal condition, using improved rainfall characteristics
to model the resulting change in production and consumption, and therefore provides
an initial indication of potential benefits only.
Table 5 below summarizes the findings for a high magnitude event, defined using the
characteristics of the most recent drought (2011). These data are used throughout the
analysis below. In the HEA modelling, early response brings some households out of a
deficit, and hence the number of beneficiaries declines in each scenario.
47 Note that the modelling accounts for adult and immature animal deaths, but only 50% of adults are destocked.

Economics of Resilience Final Report 43
Table 5: Summary of HEA Analysis for Kenya – Wajir Grasslands, high magnitude
drought (USD),
Scenario Number
Beneficiaries
(Year One)
Food
Deficit
MT Total
(5 years)
a. Costs of
Food and
Non-Food Aid
b. Value of
Excess Animal
Deaths
Total Losses
(a+b)
A 367,065
158,452
176,079,785
81,304,247
257,384,032
B1 313,039
144,743
88,122,944
61,880,697
150,003,641
B2 287,802
108,762
66,216,865
18,693,483
84,910,348
4.2.1 Kenya - What is the Cost of Late Humanitarian Response?
Estimating the cost of food and non-food aid:
The WFP estimates a cost of $889 per MT of food aid in Kenya. When this is multiplied
by the household deficit, measured in MT of food required in the HEA model, this
equates to a total cost of food aid per high magnitude drought in Wajir Grasslands of
$141m. This can be inflated to incorporate non-food aid requirements to a total of
$176m for a total beneficiary population of 367k as determined by the HEA modelling.
This figure is the total household deficit, measured in food aid, that results over five
years as a result of a drought in year one – the effects do not persist only in year one but
continue beyond, with the largest impact in year one but residual impacts in subsequent
years due to continuing deficits. In order to simplify the analysis, the impacts are
summed together and presented in the model in the first year. These costs are solely in
relation to a drought in year one, and do not account for the fact that other events are
likely to occur in the four subsequent years that could deepen this condition.
The per capita cost of food aid based on HEA data in year one alone is $186. For
comparison, on a per capita basis, it is estimated that food aid costs approximately $54
per person per year in Kenya.48 Inflated to reflect non-food aid costs, this would equate
to at least $68 per person per year. The HEA figure is significantly higher because the
HEA models costs for a high magnitude event whereas the WFP figures are averaged
over a longer time frame characterized by both good and bad drought years. Wajir is
48 Figure estimated in Kenya report, based on personal communication with WFP. This is cheaper than some other estimates but excludes supplementary WFP programmes such as school feeding, food for assets and supplementary feeding programmes.

Economics of Resilience Final Report 44
also one of the most vulnerable areas and therefore may be representative of the
higher end of costs, and this should be considered when interpreting these results.
It is also worth noting that the HEA modelling estimates the total cost of food aid that
would be required to fill the food deficit, whereas the WFP figures refer to the cost of
actual food aid delivered, and hence the findings could reflect a significant gap between
need and actual aid supplied. The aim of this analysis is to represent the full economic
cost, to the extent possible, and so the HEA figures are used here.
Estimating losses:
The herd dynamic model estimates the number of animals (camel, cattle, shoats) that
would die under a high magnitude drought. These animals are valued using the livestock
prices cited previously.
Livestock losses using HEA data are estimated at $81m in Wajir Grasslands for a high
magnitude drought. This is equivalent to $221 per person, over five years, or $44 per
year. By comparison, the PDNA estimates that livestock damage and losses averaged
$435 per person for 2008-2011, or approximately $110 per year per person (this is
specific to North Eastern Province). The HEA estimate is likely lower than the PDNA
estimate because the PDNA losses are calculated for two high magnitude droughts –
one in 2009 and one in 2011 (combined into one for the analysis), whereas the HEA
assumes a high magnitude drought only once in year one of the modelling. Further, the
HEA model shows lower excess deaths for Wajir on average, partly due to a higher
mortality rate (i.e. more deaths) in the reference year, in which the gu rains, which are
the main rains for pastoralists in northern Kenya, were only 50% of the short term mean
rainfall (STM) for 1996-2007.
Total cost of late humanitarian response
The total cost of late humanitarian response is estimated at $257m in a high magnitude
drought for a total population of 367k ($176m food aid plus $81m livestock losses). This
is assumed to occur every five years in the model.
4.2.2 Kenya - What is the Cost of Early Response?
Under HEA modelling, early response with commercial destocking of 50% of excess
adult mortality reduces total costs and losses by 42%, from $257m to $150m. When
the cost of destocking is incorporated, early response could save $107 million in a
single drought in Wajir Grasslands alone. This represents both the reduced need for
food aid and a lower unit cost of food aid (representing a 50% decrease), as well as a
reduction in animal losses (representing a 25% decrease). The cost of commercial

Economics of Resilience Final Report 45
destocking per household is approximately $4.50 per household, or $275k for the
affected population (this assumes that commercial traders are introduced to engage in
destocking, rather than NGOs or others buying the animals themselves, meaning that
costs are lower).49
When destocking is combined with improved animal condition, the decrease is much
more significant, with total costs and losses decreasing to $85m. When the costs of
introducing these early response measures are incorporated, the total savings are
anticipated to be $167m in a single event.
When these figures are considered in a single high magnitude drought, the cost of
introducing a destocking programme is $275k. Assuming an early response scenario that
also results in lower food aid costs as described previously, the total benefit (reduced
aid and avoided losses) is $107m for a population of 367k. When the costs of destocking
are offset against these benefits, the benefit to cost ratio is 390 : 1. In other words, for
every $1 spent on commercial destocking, $390 of benefits (avoided aid and animal
losses) are gained.
4.2.3 Kenya - What is the Cost of Resilience?
As described in the methodology, the estimated cost of a package of resilience building
measures for pastoralists laid out in the Kenya report, at $137 per person per year, over
10 years, is used for this analysis. This figure is applied to the total population under the
Wajir HEA modelling to arrive at a total proxy cost for building resilience of $50m per
year.
Because the effects of resilience interventions do not impact on the population
immediately, but rather take time to reduce vulnerability, the aid and losses from
Storyline B2 are assumed to persist – with full costs occurring in year 1 (in addition to
resilience costs), 50% in year 5, and 25% thereafter (to reflect the fact that there are
likely to always be segments of the population in need of aid). Annex C contains
sensitivity analysis to vary this assumption – while there is a high degree of confidence
that resilience will significantly reduce aid costs, there is very little evidence to suggest
49 The cost of commercial destocking is estimated at $4.5 per person (including overheads and
administrative costs), based on a Save the Children programme in Ethiopia. (Save the Children,
2008. “ Cost Benefit Analysis of Drought Response Interventions in Pastoral Areas of Ethiopia,
Draft Report). This figure is further confirmed by Catley A and Cullis A (2012) who estimate $4.5
per person as well based on a specific project budget.

Economics of Resilience Final Report 46
how much or how quickly this will reduce, and hence the estimates provided here are
purely based on expert opinion.
4.2.4 Kenya - Cost Comparison of Response
The following table compares the cost of response for each of the storylines, using the
HEA data modelled for Wajir grasslands, over the modelled beneficiary population of
367k. Clearly, this analysis could produce different results in other regions, but this gives
an indication of the different types of costs incurred.

Economics of Resilience Final Report 47
Table 6: Cost Comparison of Response for Storylines (USD million) – Wajir Grasslands
Storyline A Storyline B1 Storyline B2 Storyline C Storyline C – with benefits
Interventions Late Hum.
Response
Destocking Destocking + Improved
animal condition
Resilience Resilience with benefits
Aid costs -assumed
every fifth year.
$176m $88m $66m Residual risk: Full costs under B2
in year 0, decreased by 50% year
5, 25% carries on every event
thereafter
Residual risk: Full costs under
B2 in year 0, decreased by 50%
year 5, 25% carries on every
event thereafter
Losses (animal deaths)
– assumed every fifth
year.
$81m $62m $19m Residual risk: Full costs under B2
in year 0, decreased by 50% year
5, 25% carries on every event
thereafter
Residual risk: Full costs under
B2 in year 0, decreased by 50%
year 5, 25% carries on every
event thereafter
Cost of programme –
assumed every fifth
year.
$0.28m $5.8m $50m annually
($137 per capita for beneficiary
population)
$50m annually
($137 per capita for beneficiary
population)
Additional Benefits In addition to a reduction in aid costs
and losses, the additional income from
destocking can be used for other
household needs
EXTENSIVE: Additional benefits
from MDGs are extensive –
increased income through
education and ability to access
services, reduced morbidity and
mortality from health and food
security interventions, etc.
Valued at a return of $1.1 for
every $1 spent
Total Net Cost over 20
years, discounted at
10%
$606m $354m $214m $464m ($54m)
Total Net Cost over 10
years, discounted at
10%
$425m $248m $150m $451m $77m

Economics of Resilience Final Report 48
The modelling suggests that early response through commercial destocking in Wajir
alone would save over $250m in humanitarian aid and animal deaths discounted over
a 20-year period (this is for a population of approximately 367k). Under a scenario
where interventions are applied to improve animal condition, such as vet services, or
supplementary feeding, the difference could be as much as $392m. When this is
extrapolated to other regions, the total figures would be much higher.
The cost of building resilience is somewhat less than the cost of late humanitarian
response over 20 years ($464m and $606m respectively). However, this analysis takes
no account of the significant benefits that would arise from resilience interventions –
the costs and benefits will depend very much on the different types of interventions
that are used.
Sector specific cost benefit analysis of resilience interventions is used below to show
how the benefits, when quantified and incorporated into the analysis, significantly
offset the costs of resilience. The findings for three sectors – livestock, water and
education – offer evidence that the benefits are consistently higher than the costs,
ranging from just below breaking even, to $27 of benefit for every $1 spent. The
benefits quantified are very tangible – savings that contribute to a household’s
economy. If we assume that we only generate $1.1 of benefit, for every $1 spent on
resilience measures, a very conservative assumption, the net cost over 20 years is
converted to a benefit of $54m, as compared with aid and losses of $606m in late
humanitarian response. The sensitivity analysis contained in Annex C varies this to $2 of
benefit for every $1 spent. The model is very sensitive to this change, with net benefits
increasing further to $477m.
These factors are combined to model the “value for money” of investing in resilience.
The costs of building resilience are offset against the benefits – the reduced aid cost and
avoided losses of animals under Storyline B250. A very conservative assumption around
the additional benefits that would accrue from investments in resilience that deliver
significant health, education and other gains are further incorporated. When the costs
of building resilience are offset against the benefits, the benefit to cost ratio is 2.9 : 1.
In other words, for every $1 spent on resilience, $2.9 of benefit (avoided aid and
animal losses, development benefits) are gained. When this is modelled over a 10-year
time frame – in other words, within the context of two high magnitude droughts, every
$1 spent on resilience generates $2.0 in avoided losses.
50 It is likely that these avoided losses would be greater if communities are more resilient, but they represent a good proxy value.
Economics of Resilience Final Report 49
4.2.5 Kenya - Sector-based Cost Benefit Analysis
In order to investigate costs and benefits a bit further, this section presents both the
costs and benefits for various interventions that could contribute to building resilience.
Three sectors are considered – livestock, water and education.
It should be noted that this does not imply that these interventions will always
contribute to building resilience – it is essential that they are implemented in a
participatory way, with dedicated resources for maintenance over the longer term to
ensure that these measures are implemented well. There are many examples of these
types of interventions that do not deliver any benefits because of the way in which they
are implemented. Nor does the analysis suggest that there is the capacity, or
institutional and governance structures required, to take these to scale currently.
Rather, the intention is to show where there is an economic argument to invest further
in appropriately designed resilience interventions.
Livestock Interventions
Over the longer term, resilience can be built by ensuring that pastoralists have access to
functioning livestock markets, veterinary care, and adequate feed and water. The Kenya
report that supports this study estimates the cost per person of a more complete set of
long term livestock interventions, including livestock market support, comprehensive
vet care via private franchise, livestock insurance and peace building support, at a total
cost of approximately $24 per person per year (this is assumed to continue for 10 years,
and then decrease by half to $12 per person per year after year 10, as private networks
take hold).
The benefits of such a package of measures, under the assumption that they are
implemented well and ensuring that the livestock trade is working efficiently, would
include avoided costs of aid, and animal losses (these are assumed at 67% in the model,
based on HEA model estimates that livestock measures would result in this level of
benefit). There would also be numerous unquantifiable benefits, for instance increased
sense of security and confidence on the part of pastoralists, as a result of greater control
over how they manage their herd.
If not implemented well, some of these measures can result in greater conflict, for
example if markets are inappropriately cited, they can result in new tribal interactions.
Equally, there are numerous example of livestock market infrastructure being installed
without the appropriate management systems or commercial buyers in place and hence
a waste of money.

Economics of Resilience Final Report 50
Table 7: Benefits and Costs of Livestock Resilience Measures - Kenya
Package of Livestock Resilience Measures
Assumed population (HEA
beneficiaries)
367k
Cost for total population $8.8m each year
(reducing to $4.4m in year 10)
Benefits 67% of aid and excess mortality in a high
magnitude drought is avoided per
Storyline B2
Benefit to Cost Ratio (BCR) (20 years,
10% discount)
5.5 : 1
A full package of livestock interventions that build resilience would result in $5.5 of
benefit for every $1 spent. This analysis only considers benefits that accrue in a high
magnitude event, whereas clearly access to functioning livestock markets and effective
animal health can reap significant benefits in non-drought times as well.
Water Interventions
A key requirement for communities in the face of drought is access to water.
Humanitarian response largely involves the use of trucks to deliver water to
communities, a very expensive (but necessary) measure.
Community based water schemes can be considered as both an early response and/or
resilience building measure. As with all of these measures, how and where they are
implemented has a massive effect on whether they deliver benefits, and there is a great
deal of discussion around permanent water posts both building and eroding resilience.
However, assuming that these schemes are implemented appropriately, there is the
potential for significant gains. Three types of intervention are compared – shallow wells
(20m depth) with a handpump, drilled boreholes (100-160m) serving 1000 people,
schools and clinics, and drilled boreholes serving 5000 people, school and clinics. The
model assumes a 10% recurring cost to cover operations and maintenance (O&M) and
community capacity building. A further 50% of capital cost is allocated in year 10 to
account for overhaul/upgrade.
The additional benefits of access to clean water are numerous, and include decreased
incidence of water borne illness, reduced time collecting water, and increased
attendance at school. The analysis values reduced time collecting water, using Kenya
specific data and international standards for water access to be within half an hour
walking distance. The time spent collecting water is high in drought periods, when

Economics of Resilience Final Report 51
pastoralists often have to travel for a full day to get water on a regular basis, decreasing
in normal times.
Further to this, the World Health Organization (WHO) published a global study on the
costs and benefits of access to water and sanitation.51 The study estimates the benefits
for access to clean water for East Africa, and includes a range of benefits, including time
savings, increased productive days, avoided health costs, and avoided morbidity and
mortality. The benefits for time savings are excluded, given that these are calculated
separately for the study presented here, and the remainder used as a proxy for the
additional benefits.
Benefits will also include the reduced cost of food and non-food aid, as well as the
reduced loss of animals. It is not known how much clean water can contribute to this
reduction. Therefore, as a very conservative proxy, the avoided cost of emergency water
provision (such as water tankering) as one part of the aid package is included in the
model, estimated at $2 per person52. (See Annex C for greater detail on cost
calculations.)
Table 8: Benefits and Costs of Water Interventions
Shallow well Drilled Well, 5000
people
Drilled Well, 1000
people
Assumed population (HEA
beneficiaries)
367k 367k 367k
Cost for total population,
installation and O&M
(discounted over 20 years)
$3.2m $14.6m $73m
Benefits, including avoided cost
of water aid, time savings and
other benefits (discounted over
20 years)
$83m $83m $83m
BCR 26 : 1 6 : 1 1.1 : 1
51 Hutton, G. and L. Haller (2004). “Evaluation of the Costs and Benefits of Water and Sanitation Improvements at the Global Level.” World Health Organization, Geneva 52 ILRI (2010), “An Assessment of the Response to the 2008-2009 Drought in Kenya: A report to the European Union Delegation to the Republic of Kenya.” ILRI, Nairobi. This study found that water tankering averaged $2 per person, though it should be noted that the variation in cost is significant depending on distance and amount of water supplied. As cited in the Kenya report, the recent WESCOORD annual report listed all emergency WASH expenditure provided by GoK and other agencies during the 2011 drought, at a crude annual average cost of US$1.87 per head.

Economics of Resilience Final Report 52
All three water interventions yield positive benefit to cost ratios, suggesting that they
are value for money. The shallow well yields an estimated $26 of benefit for every $1
dollar spent. Even the drilled well serving only 1,000 people has a marginally higher
benefit than cost. The results help to demonstrate the importance of design parameters
in estimating value for money – for example, the more people that can benefit, the
greater the benefit to cost ratio. It also highlights the important of design being fit for
purpose – while the shallow wells have the highest ratio, the findings do not suggest
that shallow wells should be prioritized. Shallow wells can run dry in a drought, and are
only appropriate in areas with a higher water table. If they are used across the board,
the ratio can be reversed if they are not delivering water in a drought. By contrast, the
drilled wells, while more expensive, reach to a much greater depth and therefore are
more likely to be able to ensure water supply in a drought.
Education
This scenario uses Baringo in Kenya as an example of how education can transform
resilience by providing an internal safety net, as educated family members with paid
employment send home remittances in times of drought. Evidence from Baringo on
increases in incomes and decreases in reliance on food aid are used to construct this
scenario.
Box 2 contains more details on Baringo and the way that education is becoming a
pastoral risk management strategy. (See Annex C for greater detail).
Table 9: Costs and Benefits of Education
Assumptions Total
Assumed population (HEA
beneficiaries)
367k
Cost for total population
(discounted over 35 years)
Cost of constructing 412 schools @
$400k each; and $17 per person per
year for running costs.
$225m
Benefits
(discounted over 35 years, begin
to accrue in year 15)
Revenues increase by $360 per
household; 43% reduction in reliance on
food aid (per Baringo case study)
$90m
BCR 0.4 : 1
This scenario is modelled over 35 years, simply because benefits such as increased
revenues and decreased reliance on food aid cannot begin to be realized until a child
has completed their schooling. The comparison of benefits to costs of investing in
education yield a return of $0.4 to $1, suggesting that costs outweigh the benefits.
However, there are clearly many benefits in year 1 to 15 of investing in education that
were not accounted for in the model.
Economics of Resilience Final Report 53
Box 2: Education in Baringo, Kenya
Research on the education levels of pastoral households in Baringo in 1980 and 199953 found
that increased household education was becoming a critical component of pastoral risk
management strategies during drought. The research was based on interviews with pastoral
households in three communities Baringo in 1980 and again in 1999. At both times the
communities were experiencing severe drought but in the intervening period there had been
extensive investment in formal education54 services in the area. Consequently the average
number of household members who had completed primary education had risen from 3% to
18% and secondary from 0.3% to 7%. Over the same period the number of households who
reported having an ”income remitter with a salaried waged position” rose from approximately
9% to 26%. Total annual cash income increased from Ksh 27k to Ksh 56k in households with
secondary education, and those reliant on food aid dropped from 66% to 23%. The contribution
of livestock as a source of income reduced overall from 76% to 42%. The research also found
that financial and food security benefits were greatest for those household where someone had
completed secondary education.
4.3 Kenya – Top-Down Assessment
4.3.1 Kenya - What is the Cost of Late Humanitarian Response?
As described in the methodology, the cost of humanitarian response was estimated
using three components:
The cost of food aid;
The cost of non-food aid; and
Estimated losses.
Estimating the cost of food and non-food aid:
While data is collected on humanitarian appeals and levels of funding, these figures do
not necessarily reflect needs and hence the magnitude of the crisis. Humanitarian
appeal and funding amounts, by year, were compared with the figures from the short
and long rain assessment (SRA/LRA) data. These assessments are conducted twice
yearly, and report the number of people in need of food aid for the whole of the country
for 6 months. Figure 7 below maps appeal, funding, and SRA/LRA figures (the average of
the two represents the needs for a year). Given that the SRA/LRA figures represent
actual estimates of people in need, these figures are used in the model.
53 Little, P., A. Aboud and C. Lenachuru (2009). “Can Formal Education Reduce Risks for Drought-Prone Pastoralist?: A Case Study from Baringo District, Kenya”. Human Organisation 54 Baringo received disproportionately high investment during this time given it is the home district of the then President Daniel Arap Moi

Economics of Resilience Final Report 54
Figure 7: Humanitarian Appeals, Funding, and Estimated Need based on the
SRA/LRAs55
Cost of aid – estimate based on SRA/LRA :
The WFP estimates that the average yearly expenditure per capita on food aid in
Kenya is $5656, and this can be inflated to incorporate non-food aid to $70. The total
number of people in need for the whole of Kenya is multiplied by the WFP average
cost, and marked up to incorporate non-food aid costs. On this basis, average
requirements for food and non-food aid based on the SRA/LRA between 2000 and
2010 are a minimum of $131m per year, with the highest recorded need in 2009 at
$224m.
Cost of aid – appeal estimates: The Kenya PDNA has done a significant amount of
analysis around the 2009-2011 drought event. By comparison with the above
figures, it estimates aid through the Consolidated Appeals Process (CAP) for four
years (2008-1022) of $960m. When these funds are combined with Government of
Kenya (GoK) humanitarian spend, and averaged over the four years of analysis, the
estimate is $425m per year, significantly higher than the average estimated funds
required based on the SRA/LRA. These figures are summarized in Table 10 below.
55 Note that data for 2003, 2012 are missing for the SRA/LRA. 56 The estimated cost of delivering food aid is based on figures from the WFP EMOPS costs for Kenya and Ethiopia, as presented in the 2011 DFID Nairobi paper “Value-for-Money in Humanitarian Aid for Kenya and Somalia.” This is equivalent to the full cost of delivering food aid, including transportation and distribution costs.
$-
$50.00
$100.00
$150.00
$200.00
$250.00
$300.00
$350.00
$400.00
Appeal (USD Million)
Funding (USD Million)
SRA/LRA USD Million)

Economics of Resilience Final Report 55
Table 10: Humanitarian aid appeal amounts and GoK spend, 2008-2011
Data Amount (US$, millions)
Humanitarian Aid – allocated amount,
2008-2011 (PDNA)
$960
GoK humanitarian aid 2008-201157 $739
Total $1,699
Yearly average over 4 years $425
Estimating Losses
The PDNA further estimates the total damages (destruction of physical assets, e.g.
livestock and crops), losses (in flows to the economy)58, and needs (the financial
requirements to achieve economic recovery and reconstruction after the drought) as a
result of the 2009/2011 drought. These estimates are in addition to the cost of
humanitarian aid. The PDNA estimates these figures across all sectors, including
livestock, which represents the vast proportion of losses in the drought. Table 11 below
summarizes the findings. The cost modelling presented in this report uses the total
figures for damages and losses, to be consistent with the aid figures, which are for
drought as a whole (not specific to pastoralists – this is the focus of the bottom-up
analysis). Needs are not included in the analysis to eliminate the possibility of double
counting. The model assumes these losses every five years (in a high magnitude event).
Table 11: Damages, Losses, and Needs (2008-2011)
Data Total Amount
(USD, millions)
Livestock Sector
(USD, millions)
Livestock as a
% of Total
Damages and losses $12,100 $8,426 70%
Needs: estimated recovery
and reconstruction (R&R)
costs
$1,770 $1,282 72%
Source: PDNA, 2012
Total cost of late humanitarian response
Table 12 summarizes the costs and losses described above that are inputted to the
model. The combined impact of the average cost of humanitarian aid year on year, with
57 The GoK spent an average of $173m per year on humanitarian aid between 1999 and 2010. In the 2011 drought they spent $219m. 58 This is specifically defined as “changes in the normal flows of the economy that may arise in all sectors of economic and social activity due to the external shocks brought about by the disaster.”

Economics of Resilience Final Report 56
damages and losses in a major event (inflated by 5% every five years to reflect
increasing caseloads due to erosion of assets), results in a total economic cost of
humanitarian response of $29.8 billion discounted over 20 years.
Table 12: Summary Table of Cost of Humanitarian Aid and Losses
Amount (USD, millions)
Humanitarian Aid – yearly average $131m
Damages and Losses – every fifth year $12,100m
This is an underestimate for the following reasons:
It is believed that these types of events are increasing, and may be occurring as
often as every 3 years.
The figures recorded for total CAP and GoK spend between 2008 and 2011 are
four times higher than the figures used for this estimate.
The Economics of Climate Change Study in Kenya estimates that, due to
population growth and GDP changes, these economic impacts of drought could
increase by as much as five times by 2030 (in other words, they estimate losses
based on damages alone at $5-10 billion per event by 2030).59
While loss of livestock and livestock products are included for high magnitude
events every five years, clearly these losses also occur in medium and smaller
magnitude droughts, but the data was not available to quantify this.
4.3.2 Kenya - What is the Cost of Early Response?
The scenario of early response assumes that if aid is delivered on time, as a crisis is
becoming evident, that deficit levels are lower and therefore the magnitude of response
required is less, and the unit cost of delivering aid is decreased. It also assumes that
early response measures such as commercial destocking, early supplementary feeding,
and veterinary services can reduce mortality of animals, and increase conception and
milk production.
The HEA analysis for Wajir Grasslands estimates that early response through commercial
destocking alone can reduce the cost of food aid by 50% and the value of animal losses
by 24%. (These figures are conservative, and are higher if other interventions that
improve the condition of the animals are included – see the bottom up analysis for
greater detail). It is also estimated that it costs approximately $0.75 per person for
commercial destocking (see bottom up analysis for greater detail). If we apply these
figures to the 3.8 million people affected in the 2011 event, and adjust overall aid and
59 Stockholm Environment Institute (2009). “Economics of Climate Change: Kenya”.

Economics of Resilience Final Report 57
losses for the country as a whole according to the HEA analysis, the total cost
discounted over 20 years is $22.3 billion.
Similarly, when we apply the reductions in aid and losses that can occur under Storyline
B2 in the HEA modelling (food aid by 62% and animal losses by 77%), and incorporate
the cost of a package of destocking and measures to improve animal condition, the total
cost discounted over 20 years is $7.2 billion.
4.3.3 Kenya - What is the Cost of Resilience?
A variety of national level plans that aim to build resilience to drought are present in
Kenya, in addition to several documents that try to estimate the cost of measures that
build resilience. Table 13 summarizes these cost estimates.
Table 13: Estimates for Development/Disaster Risk Reduction (USD)
Plan/Policy Estimated Cost
Draft Eliminating drought – over 10 years 2.4 billion
MTIP for Northern Kenya and Arid Lands
(cost for 5 years, 2012-2016)
5.1 billion for 5 years
Economics of Climate Change 500 million per year
PDNA estimate for DRR (2012-2016) 2.1 billion
Draft Eliminating Drought Emergencies in Kenya – This Country Programme Paper
and Action Plan builds on the PDNA and the Kenyan Government’s commitment to
the IGAD-led Horn of Africa Drought Management Programme. Its production has
been co-ordinated by the Agricultural Sector Co-ordination Unit (ASCU) and provides
a 10-year estimate of investment required to end drought emergencies in Kenya. It
contains measures and cost estimates for activities under seven themes: peace and
security, humanitarian relief (linking relief to development, one year only),
infrastructure, building human capital, sustainable livelihoods, coordination and
institutional framework, and national drought contingency. It should be noted that
this document is still in draft form to be approved by government.
Medium Term Investment Plan (MTIP) for Ministry of Northern Kenya and Other
Arid Lands (MNKOAL). Published in February 2012, the MTIP for the Ministry of
Northern Kenya is a five-year plan that details the costs of implementing the Vision
2030 Development Strategy for Northern Kenya and other Arid Lands. It excludes
costs already included in the other sector MTIPs but includes additional activities not
highlighted by the Vision 2030 document.

Economics of Resilience Final Report 58
The Economics of Climate Change study in Kenya 2009 estimates the cost of
adaptation per year. This estimate includes adaptation to all disaster events
(includes flood, etc), and is therefore an overestimate compared with the figures
that are specific to drought. The study costs four categories of adaptation – two are
development activities that are targeted towards the large economic costs of
current climate variability (accelerating development to cope with existing impacts
and increasing social protection), and the second two are associated with tackling
future climate risk (building adaptive capacity and institutional strengthening, and
enhancing climate resilience, e.g. infrastructure design, flood protection measures).
The immediate needs (for 2012) for building adaptive capacity and starting to
enhance resilience (immediate priorities) are estimated at $100 – 150 million/year.
However, a much higher value of $500 million/year or more is warranted if the
categories of social protection and accelerated development (to address the current
adaptation needs) are included. This is the figure used here.60
The PDNA makes an estimate for costs of disaster risk reduction. However, the
methodology used to derive these estimates is not clear from the report, and the
figure is quite low relative to other figures.
The modelling assumes a cost of resilience at $500 million per year, which is an
approximate mid-point for the various studies above. It further assumes that residual
risk will occur, e.g. ongoing aid and losses that would occur under Storyline B2. These
are assumed to be 100% of aid and losses under early response in year 1, 50% in year 5
and 25% every fifth year thereafter (i.e. in each drought event). Modelled over 20 years,
the total discounted cost is $9.2 billion. Clearly, this estimate does not account for the
myriad of benefits that would occur from building resilience - benefits such as health
and education occur year round and can be substantial (these are brought in with
greater detail in the bottom-up analysis below).
4.3.4 Kenya - Comparison of National Level Costs
Table 14: Summary of National Level Cost Estimates over 20 years (discounted) -
Kenya
Humanitarian Early Response
(B1)
Early
Response (B2)
Resilience
USD million $29,771m $22,330m $7,168 $9,168m
60 Ibid.

Economics of Resilience Final Report 59
In other words, these findings suggest that late humanitarian response costs nearly $21 billion more than resilience building activities over 20 years.
When this analysis is conducted on a 10-year timeframe, the results are similar, and still
make a very strong case for greater investment in early response and resilience.
Table 15: Summary of National Level Cost Estimates over 10 years (discounted) -
Kenya
Humanitarian Early Response
(B1)
Early
Response (B2)
Resilience
USD million $20,891m $15,670m $5,033m $7,134m
This is clearly a rough estimate – the costs associated with each area of response could
vary significantly, particularly in relation to building resilience, where the evidence base
is thin. Further, these subdivisions of costs are somewhat artificial – humanitarian
response can be designed to build resilience and therefore ideally each type of response
needs to be part of a greater cycle of disaster management.
The individual cost estimates are considered to be conservative – the cost of late
humanitarian response is estimated using lower bound figures and is likely to be higher.
The cost of resilience will be offset by avoided losses, as resilience measures often result
in much wider gains, such as reductions in disease, improvements in education and
income, etc, that are not accounted for here.

Economics of Resilience Final Report 60
5 Cost Comparison of Drought Response - Ethiopia
5.1 Overview
This section presents the data and analysis for Ethiopia. As described in previous
sections, the analysis attempts to compare the cost of late humanitarian response, to
early response, to building resilience to drought in Ethiopia. The analysis is approached
from two perspectives – the first attempts to build up local or project level data
(“bottom-up approach”) for households in southern Ethiopia, and the second uses
national level aggregated data on the cost of response (“top-down approach”). All costs
and losses are modelled over 20 years, using a 10% discount rate, and assuming a five-
year drought cycle for high magnitude events. The detailed outputs from the modelling
can be found in Annex C, along with sensitivity analyses.
5.2 Ethiopia – Bottom-Up Assessment
This analysis approaches the cost comparison from a bottom-up perspective – using
disaggregated project and sector level estimates to compare the cost of response.
HEA modelling estimates the food aid requirements and animal losses for a high
magnitude drought in southern Ethiopia, assuming a drought in year 1, and calculating
losses over 5 years. This analysis is done for three storylines – Storyline A in which
humanitarian aid arrives late, Storyline B1 in which early response uses commercial
destocking of 50% of adult animals that would have otherwise died, and Storyline B2 in
which destocking is combined with additional early response measures, such as
supplementary feeding and veterinary services, which are assumed to improve animal
condition and hence conception and production. The destocking Storyline B1 results in
similar levels of destocking on a household basis to levels actually seen in previous
events, and hence there is confidence around these figures. Storyline B2 attempts to
simulate improved animal condition, using improved rainfall characteristics to model
the resulting change in production and consumption, and therefore provides an initial
indication of potential benefits only.
Table 16 below summarizes the findings for a high magnitude event, defined using the
characteristics of the most recent drought (2011). These data are used throughout the
analysis below. In the HEA modelling, early response brings some households out of a
deficit, and hence the number of beneficiaries declines in each scenario.
It should be noted that Southern Ethiopia covers a much larger area than the Kenya
modelling.

Economics of Resilience Final Report 61
Table 16: Summary of HEA Analysis for Southern Ethiopia (USD), high magnitude
drought
Scenario Number
Beneficiaries
Year One
Food
Deficit
MT Total
(5 years)
a. Costs of
Food and Non-
Food Aid
b. Excess
Animal Deaths
Total Losses
(a+b)
A 2,848,854
441,149 465,963,631
1,148,356,061
1,614,319,692
B1 1,787,978
273,281 166,379,903
783,148,375
949,528,278
B2 600,132
122,106
74,341,006
135,069,454
209,410,460
5.2.1 Ethiopia - What is the Cost of Late Humanitarian Response?
Estimating the cost of food and non-food aid:
The WFP estimates a cost of $845 per MT of food aid in Ethiopia. When this is multiplied
by the household deficit, measured in MT of food required in the HEA model, this
equates to a total cost of food aid per high magnitude drought for Southern Ethiopia of
$373m. This can be inflated to incorporate non-food aid requirements, to a total of
$466m for a total beneficiary population of 2.8m. This figure is the total household
deficit, measured in food aid, that results over five years as a result of a drought in year
one – with the largest impact in year one but residual impacts in subsequent years due
to continuing deficits. In order to simplify the analysis, the impacts are summed
together and presented in the model in the first year. These costs are solely in relation
to a drought in year one, and do not account for the fact that other events are likely to
occur in the four subsequent years that could deepen this condition.
Using the HEA modelled figures, the per capita cost of food aid in year one alone is
$104. For comparison, on a per capita basis, WFP estimates that food aid costs
approximately $77 per person per year in Ethiopia.61 When this is scaled up to include
the cost of non-food aid, this equates to a total cost of food and non-food aid of
approximately $96 per person per year, in line with the HEA model predictions.
61 The estimated cost of delivering food aid is based on figures from the WFP EMOPS costs for Kenya and Ethiopia, as presented in the 2011 DFID Nairobi paper “Value-for-Money in Humanitarian Aid for Kenya and Somalia.”

Economics of Resilience Final Report 62
Estimating losses:
The herd dynamic model estimates the number of animals (camel, cattle, shoats) that
would die under a high magnitude drought. These animals are valued using the livestock
prices cited previously. Livestock related losses are estimated at $1,148m for southern
Ethiopia for a high magnitude drought. This is equivalent to $403 per capita over five
years, or $81 per person per year – this is an average and clearly will differ significantly
by household.
Total cost of late humanitarian response
The total cost of late humanitarian response is estimated at $1,614m in a high
magnitude drought for a total population of 2.8m (equivalent to $466m in aid costs plus
$1,148m livestock losses). This is assumed to occur every five years in the model.
5.2.2 Ethiopia - What is the Cost of Early Response?
Under HEA modelling, early response with commercial destocking of 50% of excess
adult mortality reduces total costs and losses by 41%, from $1,614m to $950m. When
the cost of destocking is incorporated, early response could save $662m for southern
Ethiopia in one high magnitude drought event. This represents both the reduced need
for food aid and a lower unit cost of food aid (representing a 35% decrease), as well as
reduction in animal losses (representing a 68% decrease). The cost of commercial
destocking per household is approximately $4.50 per household (this assumes that
commercial traders are introduced to engage in destocking, rather than NGOs or
buying the animals themselves).62 The Feinstein International Center conducted a
similar comparison, for a single event (see
Box 3), and found that local food aid plus restocking cost 125 times more than
commercial destocking (note that their model assumes no food aid required with
commercial destocking, in contrast to the findings here which assume that deficits
persist though at a lower level).
When destocking is combined with improved animal condition, the decrease is much
more significant, with total costs and losses decreasing to $209m. When the costs of
destocking, veterinary services and supplementary feeding are incorporated, this is
equivalent to a saving of $1,303m in a single event.
62 The cost of commercial destocking is estimated at $4.5 per person (including overheads and
administrative costs), based on a Save the Children programme in Ethiopia. (Save the Children,
2008. “ Cost Benefit Analysis of Drought Response Interventions in Pastoral Areas of Ethiopia,
Draft Report). This figure is further confirmed by Catley A and Cullis A (2012) who estimate $4.5
per person as well based on a specific project budget.

Economics of Resilience Final Report 63
When these figures are considered in a single high magnitude drought, the cost of
introducing a destocking programme is $2.1m. Assuming an early response scenario that
also results in lower food aid costs as described previously, the total benefit (reduced
aid and avoided losses) is $665m, for a population of 2.8m. When the costs of
destocking are offset against these benefits, the benefit to cost ratio is 311 : 1. In other
words, for every $1 spent on commercial destocking, $311 of benefit (avoided aid and
animal losses) are gained.
Box 3: Money to Burn? Comparing the Costs and Benefits of Drought Responses in
Pastoralist Areas of Ethiopia63
A recently published paper from the Feinstein International Center compares the cost of two
drought response scenarios. The “food aid plus restocking” scenario involved provision of food
aid, substantial livestock herd depletion, followed by restocking. The “commercial destocking”
scenario involved a timely commercial destocking program at the onset of drought, without the
need for food aid or restocking. The scenarios were modelled for a household comprised of 6
people, with a herd size of 30 shoats. The cost of commercial destocking was estimated at $4.53
per household, the cost of local food aid plus restocking was $565 per household, and the cost
of imported food aid plus restocking was $620 per household.
Local food aid plus restocking costs 125 times more than commercial destocking, and
imported food aid plus restocking costs 137 times more than commercial destocking.
5.2.3 Ethiopia - What is the Cost of Resilience?
As described in the methodology, the Kenya study estimates the cost per person of a full
package of resilience measures for pastoralists, at $137 per capita per year, assumed to
be incurred for 10 years, and this figure is also used for the Ethiopia analysis. This figure
is applied to the total population under the southern Ethiopia HEA modelling to arrive
at a total cost of $390m per year.
63 Catley, A and A Cullis (2012). “Money to Burn? Comparing the Costs and Benefits of Drought Responses in Pastoralist Areas of Ethiopia.” The Journal of Humanitarian Assistance, Feinstein International Center.

Economics of Resilience Final Report 64
Box 4: Cost Comparison with the Pastoral Community Development Programme
The Pastoral Community Development Programme (PCDP) was a World Bank/Government of
Ethiopia programme that ran from 2003 to 2008. The programme specifically aimed to
sustainably improve the livelihoods of pastoralists living in the arid and semi-arid Ethiopian
lowlands, by increasing, stabilizing and diversifying incomes, improving infrastructure, and
increasing access to public services. The intention here is not to suggest that the PCDP is a model
for improving resilience – but rather to simply use the costs of the programme as an indication of
what was considered a reasonable investment cost for pastoral development.
The programme aimed to reach 450,000 households, at a total cost of $60m, equivalent to $130
per household, or approximately $22 per person. The parameters under the community
investment fund were:
Up to $600 per small community (defined as 100 people) was designated for micro-projects,
or $6 per person;
Up to $15k per larger community (defined as 500 households) was designated for micro-
projects, or $5 per person; and
Up to $75k was designated for inter-community subprojects for larger social infrastructure.
Clearly there is no clear rule for how many micro-projects would be required to build resilience.
However, if we consider the aid costs alone incurred under late humanitarian response,
estimated at $104 per capita, this money could have been spent on between 17 and 20 micro-
projects per person, per year under the PCDP.
Along similar lines, the PCDP comprehensively targeted a range of community development
interventions, at a cost of $22 per person. In other words, for every one person reached with
humanitarian aid, 5 people could have been reached under the PCDP.64
5.2.4 Ethiopia - Cost Comparison of Response
The following table compares the costs associated with each of the storylines presented
above, using HEA data for southern Ethiopia. Because the effects of resilience
interventions do not all impact the population immediately, but rather take time to
reduce vulnerability, the aid and losses from Storyline B2 are assumed to persist - with
full costs occurring in Year 1 (in addition to resilience costs), 50% in year 5, and 25%
thereafter (to reflect the fact that there are likely to always be segments of the
population in need of aid).
64 Clearly this does not suggest that the PCDP was implemented such that it achieved “resilience” for $22 per person – rather the aim is to compare the costs of resilience building programmes with humanitarian aid.
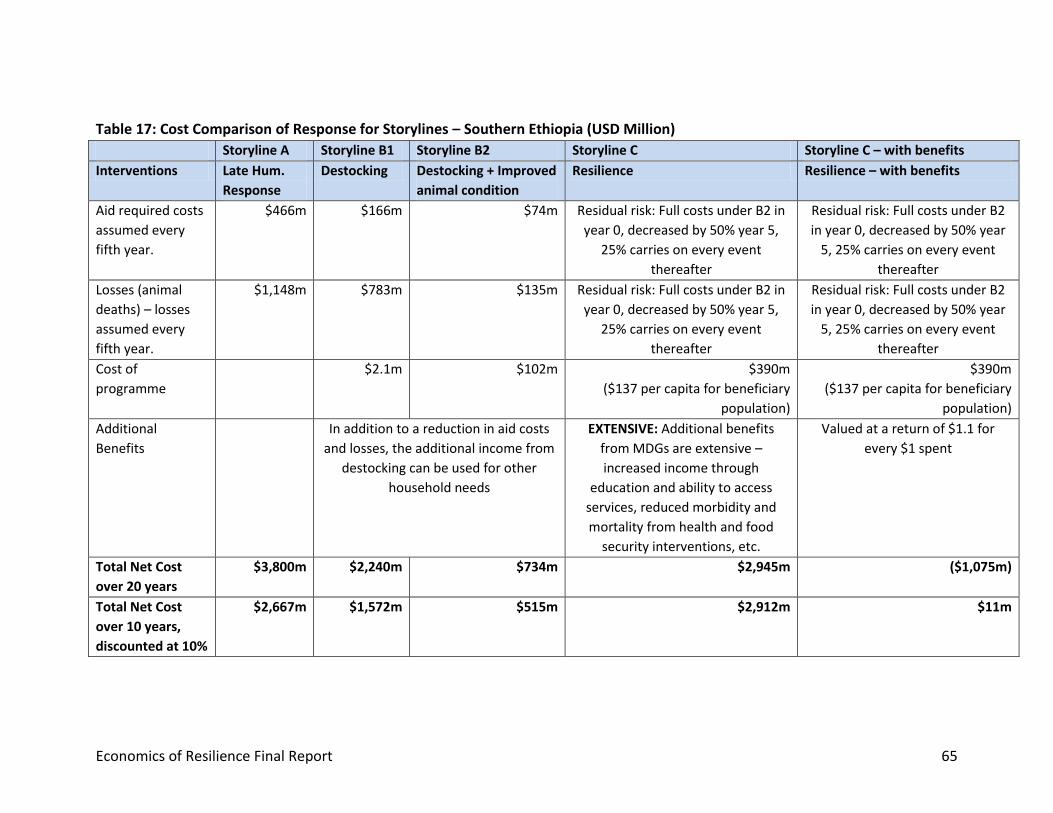
Economics of Resilience Final Report 65
Table 17: Cost Comparison of Response for Storylines – Southern Ethiopia (USD Million)
Storyline A Storyline B1 Storyline B2 Storyline C Storyline C – with benefits
Interventions Late Hum.
Response
Destocking Destocking + Improved
animal condition
Resilience Resilience – with benefits
Aid required costs
assumed every
fifth year.
$466m $166m $74m Residual risk: Full costs under B2 in
year 0, decreased by 50% year 5,
25% carries on every event
thereafter
Residual risk: Full costs under B2
in year 0, decreased by 50% year
5, 25% carries on every event
thereafter
Losses (animal
deaths) – losses
assumed every
fifth year.
$1,148m $783m $135m
Residual risk: Full costs under B2 in
year 0, decreased by 50% year 5,
25% carries on every event
thereafter
Residual risk: Full costs under B2
in year 0, decreased by 50% year
5, 25% carries on every event
thereafter
Cost of
programme
$2.1m $102m $390m
($137 per capita for beneficiary
population)
$390m
($137 per capita for beneficiary
population)
Additional
Benefits
In addition to a reduction in aid costs
and losses, the additional income from
destocking can be used for other
household needs
EXTENSIVE: Additional benefits
from MDGs are extensive –
increased income through
education and ability to access
services, reduced morbidity and
mortality from health and food
security interventions, etc.
Valued at a return of $1.1 for
every $1 spent
Total Net Cost
over 20 years
$3,800m $2,240m $734m $2,945m ($1,075m)
Total Net Cost
over 10 years,
discounted at 10%
$2,667m $1,572m $515m $2,912m $11m

Economics of Resilience Final Report 66
The modelling suggests that early response through commercial destocking in
southern Ethiopia would save $1.6 billion in humanitarian aid and losses over a 20-
year period, (this is for a population of approximately 2.8m). Under a scenario where
interventions are applied to improve animal condition, such as vet services, or
supplementary feeding, the difference could be as much as $3.1 billion.
The cost of building resilience is nearly $1billion less than late humanitarian response
(A). However, this analysis takes no account of the significant benefits that would arise
from resilience interventions – the costs and benefits will depend very much on the
different types of interventions that are used.
Sector specific cost benefit analysis is used below to show how the benefits, when
quantified and incorporated into the analysis, significantly offset the costs of resilience.
If we assume that we only generate $1.1 of benefit, for every $1 spent on resilience
measures, a very conservative assumption, the net cost over 20 years is converted to a
net benefit of $1.1 billion, presenting a very strong case for investing in resilience.
These factors are combined to model the “value for money” of investing in resilience.
The costs of building resilience are offset against the benefits – the reduced aid cost and
avoided losses of animals under Storyline B265, as well as a very conservative
assumption around the additional benefits that would accrue from investments in
resilience that deliver significant health, education and other gains. When the costs of
building resilience are offset against the benefits, the benefit to cost ratio is 2.8 : 1. In
other words, for every $1 spent on resilience, $2.8 of benefits (avoided aid and animal
losses, development benefits) are gained. When this is modelled over a 10-year time
frame – in other words, within the context of two high magnitude droughts - every $1
spent on resilience generates $2 in avoided losses.
5.2.5 Ethiopia - Sector-based Cost Benefit Analysis
In order to investigate costs and benefits a bit further, this section presents both the
costs and benefits for various interventions that could contribute to building resilience.
Two sectors are considered – livestock and water.
It should be noted that this does not imply that these interventions will always
contribute to building resilience – it is essential that they are implemented in a
participatory way, with dedicated resources for maintenance over the longer term to
65 It is likely that these avoided losses would be greater if communities are more resilient, but they represent a good proxy value.

Economics of Resilience Final Report 67
ensure that these measures are implemented well. There are many examples of these
types of interventions that do not deliver any benefits because of the way in which they
are implemented.
Livestock Interventions
Over the longer term, resilience can be built by ensuring that pastoralists have access to
functioning livestock markets, veterinary care, and adequate feed and water. For the
Ethiopia analysis, the range of measures included in Scenario B2 are considered for
longer term resilience of livestock – e.g. access to commercial destocking (in other
words, in its fullest sense, functioning livestock markets), veterinary care, and access to
feed. These are valued using data gathered in the Ethiopia report, and are described in
greater detail in Annex C.
The benefits of such a package of measures, under the assumption that they are
implemented well and ensuring that the livestock trade is working well, would include
avoided costs of aid and animal losses . There would also be numerous unquantifiable
benefits, for instance increased sense of security and confidence on the part of
pastoralists, as a result of greater control over how they manage their herd.
If not implemented well, some of these measures can result in greater conflict, for
example if markets are inappropriately cited, they can result in new tribal interactions.
Equally, there are numerous examples of livestock market infrastructure being installed
without the appropriate management systems or commercial buyers in place and hence
a waste of money.
Table 18: Benefits and Costs of Livestock Resilience Measures - Ethiopia
Package of Livestock Resilience Measures
Assumed population (HEA beneficiaries) 2.8million
Cost for total population $102m per year; decreasing by half after 10
years.
Benefits 87% of aid and excess mortality losses in a
high magnitude drought are avoided in line
with Storyline B2
BCR (20 years, 10% discount) 3.8 : 1
A full package of livestock interventions that build resilience would result in at least $3.8
of benefit for every $1 spent. This analysis only considers benefits that accrue in a high
magnitude event, whereas clearly access to functioning livestock markets and effective
animal health can reap significant benefits in non-drought times as well.

Economics of Resilience Final Report 68
Water
A key requirement for communities in the face of drought is access to water.
Humanitarian response largely involves the use of trucks to deliver water to
communities, a very expensive (but necessary) measure.
Community based water schemes can be considered as both an early response and/or
resilience building measure. As with all of these measures, how and where they are
implemented has a massive effect on whether they deliver benefits, and there is a great
deal of discussion around permanent water posts both building and eroding resilience.
However, assuming that these schemes are implemented appropriately, there is the
potential for significant gains. Two types of intervention are compared – underground
water cisterns (a commonly used measure in drought-affected areas), and a full package
of water investment costs as costed in the Water Sector Development Program (WSDP),
of the Ministry of Water. Clearly, there are numerous other water measures that may
be appropriate, as described in the Kenya analysis. These were selected because cost
data was available for the analysis.
In the case of the underground cistern, the model assumes a 10% recurring O&M costs
for maintenance. A further 50% of capital cost is allocated in year 10 to account for
overhaul/upgrade.
The additional benefits of access to clean water are numerous, and include decreased
incidence of water borne illness, reduced time collecting water, and increased
attendance at school. The analysis values reduced time collecting water, using the
assumption that rural households typically travel over an hour to water sources, and
international standards for water access to be within half an hour walking distance. The
time spent collecting water is high in drought periods, when pastoralists often have to
travel for a full day to get water on a regular basis, decreasing in normal times.
Further to this, the WHO published a global study on the costs and benefits of access to
water and sanitation. The study estimates the benefits for access to clean water for East
Africa, and includes a range of benefits, including time savings, increased productive
days, avoided health costs, and avoided morbidity and mortality. The benefits for time
savings are excluded, given that these are calculated separately for this study, and the
remainder used as a proxy for the additional benefits.
Benefits will also include the reduced cost of food and non-food aid, as well as the
reduced loss of animals. It is not known how much clean water can contribute to this
reduction. Therefore, as a very conservative proxy, the avoided cost of water tankering

Economics of Resilience Final Report 69
as one part of the aid package (estimated at $2 per person66) is included in the model.
The Ethiopia report that accompanies this report uses a more complex modelling of
water deficits based on the HEA modelling, and estimates a cost of $7 per person if
everyone was provided with minimum water requirements – indicating that the avoided
cost could be higher. (See Annex C for full details.)
Table 19: Benefits and Costs of Water Interventions
Underground
Cistern/Tank
WSDP
Assumed population (HEA beneficiaries) 2.8m 2.8m
Cost for total population, installation and O&M
(discounted over 20 years)
$24m $119m
Benefits, including avoided cost of water aid,
time savings and other benefits (discounted
over 20 years)
$659m $659m
BCR 27 : 1 5.5 : 1
Both water interventions yield positive benefit to cost ratios, suggesting that they are
value for money. The underground cisterns yield an estimated $27 of benefit for every
$1 dollar spent. The more comprehensive water management plan yields a benefit of
$5.5 for every $1 spent. While the underground cistern yields the highest ratio, it is
likely that a variety of measures will be required. Furthermore, benefits will be
maximized when measures are implemented in a participatory manner, with full
community buy-in, and sufficient budget and resources to ensure that capacity and
O&M issues are addressed.
5.3 Ethiopia – Top-Down Assessment
5.3.1 Ethiopia - What is the Cost of Late Humanitarian Response?
As described in the methodology, the cost of late humanitarian response was estimated
using three components:
The cost of food aid;
The cost of non-food aid; and
Estimated losses.
66 ILRI (2010), “An Assessment of the Response to the 2008-2009 Drought in Kenya: A report to the European Union Delegation to the Republic of Kenya.” ILRI, Nairobi.
Economics of Resilience Final Report 70
Estimating the cost of food and non-food aid
There are a number of estimates for humanitarian aid in Ethiopia. These are described
in greater detail in the Ethiopia report, and are summarized here:
The Humanitarian Response Fund (HRF) for Ethiopia was established in March
2006 to harmonize and improve coordination of humanitarian and emergency
funding. According to HRF, during the last six years, the cost of drought related
humanitarian response was on average $351.7 million per year, which was
allocated only from the HRF (this figure excludes funding for refugee operations).
However, these figures obtained from OCHA on HRF utilisation do not include
emergency response interventions supported by other donors such as USAID/
OFDA. According to a USAID report on funding to the region, they have supplied
an additional $3.8 billion during the last 10 years (an average of more than $380
million per year).67 Since this funding was used mainly for drought related
emergencies, it increases Ethiopia’s average annual drought emergency cost to
more than $732.6 million per year.
According to the FTS at OCHA, emergency aid for droughts has averaged $509m
per year over the last 10 years. This figure was used in the modelling, because
the FTS is widely used for recording humanitarian aid and therefore considered
to be comprehensive.
It is also important to note that relief spending has changed over the last decade in
Ethiopia due to the Productive Safety Nets Programme (PSNP).
67 USAID (n.d.) “The Productive Safety Net Programme” USAID

Economics of Resilience Final Report 71
Table 20 below shows how relief figures alone may mask the total need as PSNP
transfers appear to have begun to displace relief spending.
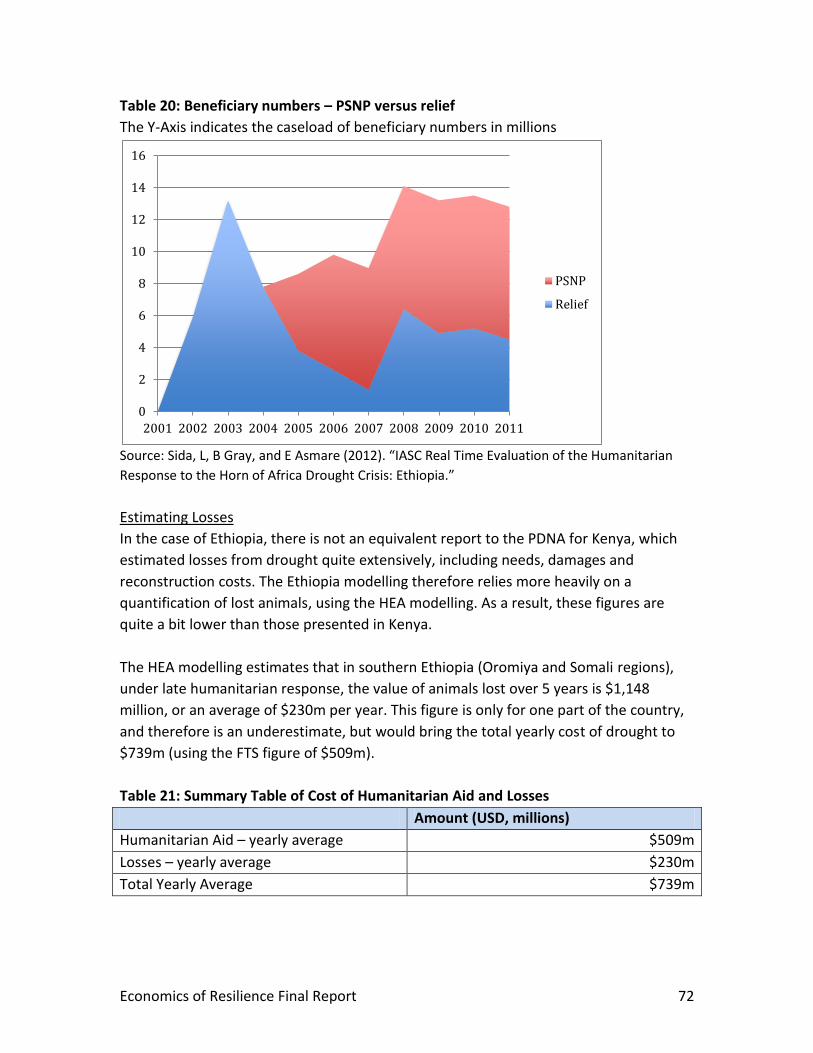
Economics of Resilience Final Report 72
Table 20: Beneficiary numbers – PSNP versus relief
The Y-Axis indicates the caseload of beneficiary numbers in millions
Source: Sida, L, B Gray, and E Asmare (2012). “IASC Real Time Evaluation of the Humanitarian
Response to the Horn of Africa Drought Crisis: Ethiopia.”
Estimating Losses
In the case of Ethiopia, there is not an equivalent report to the PDNA for Kenya, which
estimated losses from drought quite extensively, including needs, damages and
reconstruction costs. The Ethiopia modelling therefore relies more heavily on a
quantification of lost animals, using the HEA modelling. As a result, these figures are
quite a bit lower than those presented in Kenya.
The HEA modelling estimates that in southern Ethiopia (Oromiya and Somali regions),
under late humanitarian response, the value of animals lost over 5 years is $1,148
million, or an average of $230m per year. This figure is only for one part of the country,
and therefore is an underestimate, but would bring the total yearly cost of drought to
$739m (using the FTS figure of $509m).
Table 21: Summary Table of Cost of Humanitarian Aid and Losses
Amount (USD, millions)
Humanitarian Aid – yearly average $509m
Losses – yearly average $230m
Total Yearly Average $739m
0
2
4
6
8
10
12
14
16
2001 2002 2003 2004 2005 2006 2007 2008 2009 2010 2011
PSNP
Relief
Economics of Resilience Final Report 73
Total cost of late humanitarian response
The combined impact of the average cost of humanitarian aid year on year, with
estimated livestock losses, results in a total economic cost of humanitarian response of
$7.3 billion, discounted over 20 years.
These figures are an underestimate for the following reasons:
It is believed that these types of events are increasing, and may be occurring as
often as every 3 years.
This estimate does not include the loss of life, health costs and loss of education,
all of which represent a substantial economic loss.
While loss of livestock is included for high magnitude events every five years,
they are only estimated for the regions included in the HEA modelling.
Furthermore, these losses also occur in medium and smaller magnitude
droughts, but the data was not available to quantify this.
Further to this, the livestock loss figures presented here are significantly less
than those modelled under the PDNA in Kenya, which was able to account for
more categories of loss (such as economic flows from livestock loss). This
suggests that this more simple analysis may be underestimating the full
economic cost.
The PSNP is displacing some of the aid costs, providing essential needs earlier in
the lifecyle of a drought, but these costs are not included here.
5.3.2 Ethiopia - What is the Cost of Early Response?
The scenario of early response assumes that if aid is delivered on time, as a crisis is
becoming evident, that deficit levels are lower and therefore the magnitude of response
required is less, and the unit cost of providing that aid is less due to reduced
procurement, delivery and distribution costs. It also assumes that early response
measures such as commercial destocking, and measures that improve animal condition
(such as early supplementary feeding, and veterinary services) can reduce mortality of
animals, and increase conception and milk production.
HEA modelling for southern Ethiopia estimates that early response through commercial
destocking alone can reduce the cost of food aid by 64% and the value of animal losses
by 32%, as a result of household deficits decreasing through additional income from
destocking. (These figures are conservative, and are higher if other interventions that
improve the condition of the animals are included – see the bottom-up analysis for
greater detail). It is also estimated that it costs approximately $0.75 per person for
commercial destocking (see bottom up analysis for greater detail). When this
percentage reduction is applied to the total estimated cost of late humanitarian

Economics of Resilience Final Report 74
response, this would equate to $339m per year. Discounted over 20 years, this would
equate to a total cost of $3.3 billion.
Similarly, when we apply the reductions in aid and losses that can occur under Storyline
B2 in the HEA modelling (food aid by 84% and animal losses by 88%), and incorporate
the cost of a package of destocking and measures to improve animal condition, the total
cost discounted over 20 years is $1.4 billion.
5.3.3 Ethiopia - What is the Cost of Resilience?
A variety of national level plans that aim to build resilience to drought are present in
Ethiopia, and these are used as a proxy value for estimated costs for resilience.
The Disaster Risk Management and Food Security Sector (DRMFSS) of the
Government of Ethiopia was established to coordinate and lead on the
implementation of the disaster risk management approach of the Government. The
DRMFSS recently developed a Strategic Programme of Investment Framework (SPIF)
that guides identification of priority interventions and estimates investment cost of
disaster mitigation (or resilience building). Table 17 below details the various costs
included in the SPIF; approximately $324m over five years is allocated to resilience-
based components. The money allocated for five years of response could fund
approximately 15 years of resilience building measures.
The Government also has an Agriculture Sector Policy and Investment Framework. In
this framework, the Ministry of Agriculture committed, on average, $350m per
annum for disaster risk management, which constitutes more than 58% of
agriculture sector investment. This is a much higher estimate than the SPIF.
Table 22: SPIF Breakdown of Costs (USD)
Programme Component Total Budget (2010-2015) % of Total
Prevention (disaster risk profiling, information
mgmt support, DRM research)
10,422,655 1%
Prevention and mitigation (CBDRM,
mainstreaming, disaster programmes)
312,922,500 27%
Preparedness (rapid assessment) 1,845,500 <1%
Response (food and non food emergency
response)
807,589,799 71%
Recovery and rehabilitation 10,302,058 1%
Institutional strengthening 1,076,804 <1%
Grand Total 1,144,159,316

Economics of Resilience Final Report 75
For this analysis, the figure of $350m per year is used as this is more in line with the
Kenya estimates. It is also the higher estimate, and better to err on the side of over-
budgeting for resilience than under-budgeting. It further assumes that residual risk will
occur, e.g. ongoing aid and losses that would occur under Storyline B2. These are
assumed to be 100% of aid and losses under early response in the first five years, 50% in
the second five years and 25% thereafter (i.e. in each drought event). This would result
in a total discounted cost over 20 years of $4.0 billion. Clearly, this estimate does not
account for the myriad of benefits that would occur from building resilience - benefits
such as health and education occur year round and can be substantial (these are
brought in with greater detail in the bottom-up analysis below).
5.3.4 Ethiopia - Comparison of National Level Costs
Table 23: Summary of National Level Cost Estimates over 20 years - Ethiopia
Humanitarian Early Response
(B1)
Early
Response (B2)
Resilience
USD billion $7,254m $3,331m $1,426m $3,956m
In other words, these findings suggest that late humanitarian response costs $3.3
billion more than resilience building activities over 20 years. Further, resilience
activities would bring wider development gains and contributions to GDP growth, which
are not accounted for here but could offset a significant portion of the cost.
When this analysis is conducted on a 10-year timeframe, the outcome is similar.
However, as detailed in the bottom up analysis, the cost of resilience is reversed when
the benefits of building resilience are incorporated.
Table 24: Summary of National Level Cost Estimates over 10 years (discounted) -
Ethiopia
Humanitarian Early Response
(B1)
Early Response
(B2)
Resilience
USD billion $5,091m $2,338m $1,008m $2,964m
Box 5 below presents a costed plan for the Dhas District Disaster Management
Contingency Plan. The plan breaks out costs according to stages – normal, alert,
emergency and recovery. The emergency and recovery response is estimated to cost a
total of $3.2m. This is compared with an estimated $183,000 for alert stage
interventions, and $137,000 for resilience building measures. While there is no
indication of whether these activities are comprehensive for the full range of resilience
building activities that would be necessary, the magnitude of difference is substantial.
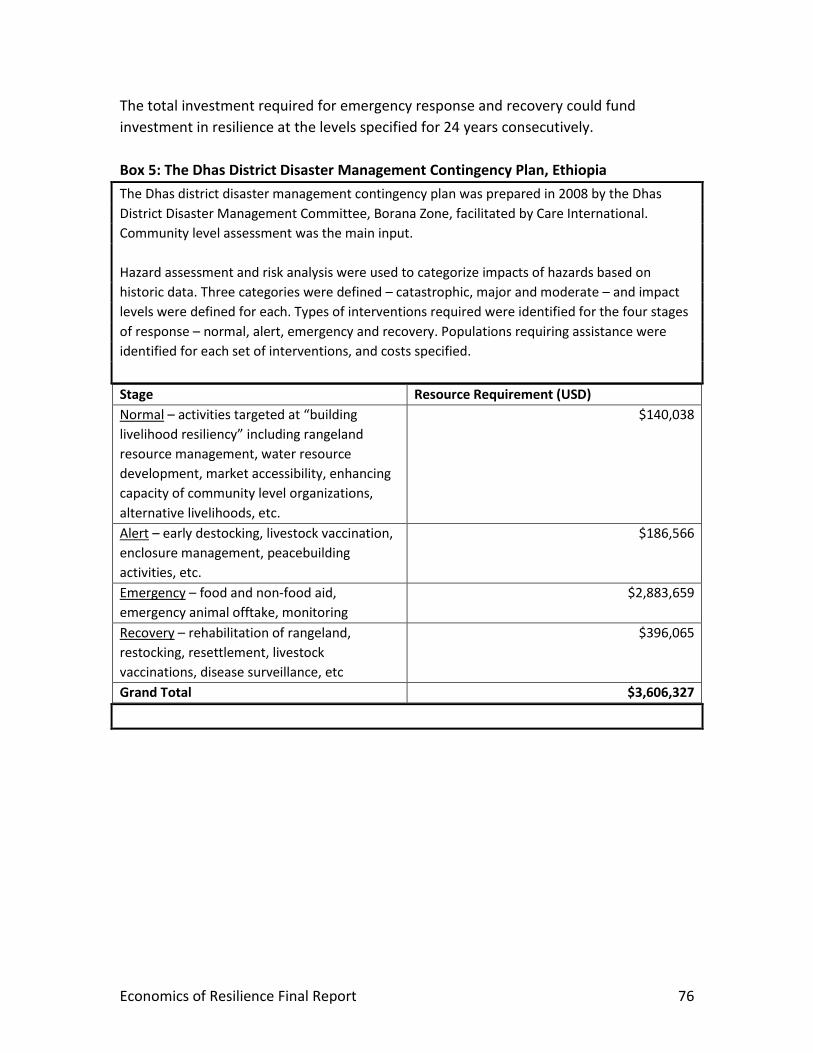
Economics of Resilience Final Report 76
The total investment required for emergency response and recovery could fund
investment in resilience at the levels specified for 24 years consecutively.
Box 5: The Dhas District Disaster Management Contingency Plan, Ethiopia
The Dhas district disaster management contingency plan was prepared in 2008 by the Dhas
District Disaster Management Committee, Borana Zone, facilitated by Care International.
Community level assessment was the main input.
Hazard assessment and risk analysis were used to categorize impacts of hazards based on
historic data. Three categories were defined – catastrophic, major and moderate – and impact
levels were defined for each. Types of interventions required were identified for the four stages
of response – normal, alert, emergency and recovery. Populations requiring assistance were
identified for each set of interventions, and costs specified.
Stage Resource Requirement (USD)
Normal – activities targeted at “building
livelihood resiliency” including rangeland
resource management, water resource
development, market accessibility, enhancing
capacity of community level organizations,
alternative livelihoods, etc.
$140,038
Alert – early destocking, livestock vaccination,
enclosure management, peacebuilding
activities, etc.
$186,566
Emergency – food and non-food aid,
emergency animal offtake, monitoring
$2,883,659
Recovery – rehabilitation of rangeland,
restocking, resettlement, livestock
vaccinations, disease surveillance, etc
$396,065
Grand Total $3,606,327

Economics of Resilience Final Report 77
6 Value for Money of Resilience Interventions
The analysis presented in the previous two sections focuses largely on a cost
comparison of late humanitarian response, early response and measures to build
resilience. Clearly, resilience interventions can often bring a multitude of benefits
outside of disaster times, but these are hard to capture in the analysis. Livestock, water,
and education interventions (in the case of Kenya) were investigated in greater detail to
give a sense of how the benefits of resilience can offset the costs.
Further to this discussion, and given that building resilience can involve many different
types of activities, there is a need to have greater clarity around which interventions to
implement first – which will deliver the greatest gains in the shortest timeframe? Which
deliver greatest benefit per unit of cost? In the face of limited budgets, should we
prioritize livestock or water or education investments in year one?
It was not within the scope of this study to do a detailed analysis of the relative value for
money of different resilience building interventions for pastoralists. And indeed, much
of the evidence to date suggests that the value for money of resilience depends on how
measures are implemented, rather than what is implemented.
International experience on the value for money of resilience interventions offers these
rules of thumb, which are highly applicable to the range of interventions presented
above68:
The value for money of resilience interventions is context specific, and depends on
how the intervention is implemented. Clearly, effective implementation requires
additional overheads, to ensure that feasibility studies, long term participatory
approaches, capacity building, monitoring and evaluation, etc are incorporated into
project design. But these marginal costs are minimal compared with the risk of a
project either delivering no benefits (water pump is broken and no one has the
money/knowledge to fix it) or delivering negative benefits (conflict over use of
pump).
Participatory approaches are key to realizing benefits. There are numerous
examples of development projects that, in theory, should deliver greater benefit
than cost, but which deliver a negative return, because they were not designed in
close participation with those who are key to its success. Inclusive, participatory
processes for producing and implementing development plans at community and
district levels are key to ensuring solutions fit local contexts and needs, and that
68 Cabot Venton, C (2010). “ Cost Benefit Analysis for Community Based Climate and Disaster Risk Management: Synthesis Report.” Tearfund, Oxfam America.

Economics of Resilience Final Report 78
benefits are delivered that outweigh costs. Similarly, interventions that intend to
build resilience are too often capital projects without any budget allocated for the
necessary operations and management – for example, one community visited had a
health centre built through an international donor, but no doctors or nurses to staff
it, and no supplies for treatment – a prime example of a complete waste of money.
A focus on interventions that bring wider development gains are generally going to
be more cost effective. These are often referred to as no/low regrets options. For
example, facilitating commercial destocking will clearly address immediate needs in
relation to drought years, but will also deliver benefits year on year by strengthening
market networks.
Inclusion of the private sector in the provision of services wherever possible.
Willingness to pay should not be ignored but facilitated as the private sector can
often provide many services cheaper and more sustainably than government or
NGOs. For example, pastoralists will pay for veterinary health care services if the
right enabling and regulatory environment is in place. The most sustainable water
programmes in the ASALs are operated on a cost-recovery basis. There are too many
examples where pro-bono humanitarian interventions have undermined longer-
term community or commercially led initiatives.
Soft (or non-structural) resilience measures are often more cost effective and more
robust in relation to uncertainties than hard (structural) resilience measures.
Infrastructure is often designed to a specific threshold – e.g. drilled boreholes for
deep wells can be expensive, and are drilled to a depth based on current knowledge
of groundwater depth. If these parameters change, for example groundwater tables
decrease due to over-extraction or climate change, expensive infrastructure can be
rendered useless. By contrast, soft resilience measures, such as rainwater
harvesting, or soil and water conservation techniques, are typically low cost and can
be adapted to deliver benefits in changing conditions.
The design of both soft and hard measures for risk reduction should be fit-for-
purpose to ensure returns. An intervention that works in one community will not
necessarily work in another community. Community participation in choice and
design of measures is critical in order to realize sustained benefits. The additional
costs associated with ensuring communities are supported to drive their own
development are not currently systematically quantified.
Resilience programming needs to take a holistic view, even if activities are only
undertaken in a subset of communities. Introducing agro-pastoralism for one group
of communities may increase their resilience by diversifying food sources and
income, but may erode resilience for other pastoralists by interrupting grazing
patterns and herd mobility.
Longer-term support can strengthen value for money arguments. Resilience and
development interventions are often programmed over one to three years, whereas

Economics of Resilience Final Report 79
sustained support, even if minimal (e.g. refresher training on health, for local
development committees / water user associations etc) can double or triple value
for money estimates by ensuring that benefits are sustained over the long term.
Annex D attempts to provide more detail specific to the value for money of resilience
interventions as examined in this study.
Table D1 in Annex D attempts to define the VfM of a range of potential adaptation
options, using DFID’s three categories – economy (cost per input) and effectiveness
(cost of achieving the intended outcome) are dealt with qualitatively, to identify
those factors that need to be considered to maximize VfM. The efficiency (cost per
beneficiary) is where most data was collected for this project, and best estimates are
noted in the table for comparative purposes.
Effectiveness is perhaps the most useful measure – it is outcome based, and as such
measures the wider benefits of an intervention, such as health benefits, reductions
in mortality and improved education and livelihood opportunities. Table D2 in Annex
D attempts to tease out some of the factors that affect both costs and benefits
related with different interventions, and reports on some of the anecdotal cost
benefit data that exists in the literature.

Economics of Resilience Final Report 80
7 Conclusions and Recommendations
7.1 Conclusions
The evidence above clearly points to three conclusions:
Early response is far more cost effective than late humanitarian response. The
assumptions used in this analysis were conservative, and the findings nonetheless
indicate that early response can decrease costs and losses substantially, with very high
benefit to cost ratios indicating tremendous potential to improve value for money.
Modelling of household level data for Wajir grasslands in Kenya suggests that early
response could save between $107m and $167m for a population of 367k in a single
event alone. In southern Ethiopia, with a beneficiary population of 2.8m, household
level data suggest that early response could save between $662m and $1.3billion in a
single event. A perceived risk in responding early is that humanitarian funds will be
released incorrectly to situations that turn out not to be a disaster. However, these
figures suggest that donors could mistakenly release funds two times in Kenya, and
seven times in Ethiopia, before the cost is even equivalent to the cost of humanitarian
aid in one event.
There is a great deal of uncertainty around the cost of building resilience.
Nonetheless, the estimates presented here suggest that, while the cost of resilience is
comparatively high, the wider benefits of building resilience can significantly outweigh
the costs, leading to the conclusion that investment in resilience is the best value for
money. The model accounts for the time lag in resilience benefits reducing
humanitarian cost, and therefore is a reasonable estimate of how the shift in balance
from humanitarian aid to resilience might look over time. The cost of resilience would
have to approach $200 per capita per year for 10 years (almost 50% higher than the
figure assumed in this paper) before the modelled costs of resilience begin to approach
the cost of humanitarian response.
Early response and resilience building measures should be the overwhelming priority
response to disasters. These two categories of response are not mutually exclusive –
indeed commercial destocking, if taken to its fullest extent, would represent a
functioning livestock marketing system, which would be considered a resilience building
measure. The findings in this study fully support an economic imperative for a shift to
greater early response and resilience building.

Economics of Resilience Final Report 81
There are many resilience-building measures that are likely to be value for money.
There are others that may be a complete waste of time and resources, particularly if not
designed and implemented well. Furthermore, an intervention that is value for money in
one context will be ineffective in another context. Hence there is a need for local
participatory analysis and community buy-in. More work needs to be done on the
relative VFM of different interventions, particularly quantifying benefits over the longer
term. This is especially true for expensive interventions such as education and roads,
which are essential basic services.
There are also a number of important conclusions that can be drawn from the HEA
modelling:
Drought recovery takes longer (or may be impossible) when a community is not
resilient. The HEA modelling shows that the impact of a drought is not only felt in the
drought year but for several years after. In fact, deficits persist beyond the drought year
throughout the entire 5-year scenario period at levels higher than reference year levels,
for both Storylines A and B1. Herd recovery also takes time – at least 5 to 6 subsequent
consecutive years of average rainfall levels – an infrequent occurrence in Ethiopia or
Kenya.
Destocking interventions alone are often not sufficient to meet deficit levels faced by
in-need households. One of the main reasons for this is that destocking primarily
benefits middle and better off households, who have more animals that could be
destocked and sold that would otherwise die. Poor households have very few animals to
begin with, and can usually only destock one or two animals at most – which is usually
not sufficient to meet the significant deficits faced mostly by those very households.
Other intervention types, such as supplementary feeding interventions, are required
to have an impact on animal mortality, conceptions, abortions, births, and milk
production rates. It is only these interventions that affect herd dynamics that will limit
herd mortality rates and buoy birth rates, which will in turn speed recovery periods so
that deficits in subsequent years are lower and resilience is higher.
These conclusions are mainly intuitive – most people can reason that resilience and
early response are likely to be more cost effective strategies than repeated
humanitarian aid and erosion of assets. So then why does response come late? A variety
of issues were mentioned in the literature and consultations:
Institutional inertia and rigidity – systems are set up for humanitarian response.
Procurement procedures in agencies are not responsive and flexible enough.

Economics of Resilience Final Report 82
Poor coordination amongst NGOs – many are trying to do the same thing and
lack of coordination results in late response.
Lack of evidence of disaster – donors don’t want to fund early and end up
funding a non-disaster.
Political will – it is more visible to fund a disaster, where results can be clearly
demonstrated, as compared with funding resilience, where the result is that the
disaster did not happen.
The following table shows just how little is spent on disaster preparedness.
Table 25: Donor Spend on DPP and DRR (USD)
Average annual
donor spend on
DPP
Average donor
spend on DPP
as a percentage
of
humanitarian
aid
Average annual
donor DPP
spend per
beneficiary of
the current
drought
Donor spend
on DRR as a
percentage of
total ODA
Kenya 2.22m 0.91% 59 cents 1.4%
Ethiopia 3.3m 0.59% 69 cents 0.9%
Source: Oxfam (2011), “Briefing on the Horn of Africa Drought 2011”. Donor spend figures
adapted from Global Humanitarian Assistance Report 2011.
7.2 Recommendations
“The separation of relief and development is both artificial and unhelpful. Not only are
the recipients the same, but also the underlying causes that create the need are the
same—the vulnerability of dryland communities. But what often takes place, are
emergency interventions that undermine development (for example some food aid and
water trucking interventions), and long term programming and investments that do not
pay sufficient attention to the inevitability of drought.”69
Funding models must be changed to integrate relief and development in a coherent
cycle.
The findings of this analysis fully support the HERR recommendation to change funding
models by increasing predictable multi-year funding. Humanitarian funding is often
restricted to a very short time frame, and has a clearly delineated humanitarian
mandate. Development financing is longer term but does not have the flexibility to be
69 REGLAP MAGAZINE, Disaster Risk Reduction in the Drylands of the Horn of Africa: Good practice examples from the ECHO DCM partners and Beyond, Edition Two, December 2011
Economics of Resilience Final Report 83
re-allocated in times of crisis. Too often, NGOs lament that they could do much more
with $1m over three years for a consistent and reliable water and sanitation
programme, as compared with $25m that has to be spent in six months for
humanitarian aid (for example). USAID has pioneered a crisis modifier in Ethiopia, in
which development funding can be shifted into a humanitarian mode when needed –
this was seen as a very successful innovation. These types of mechanisms need to be
more widespread. Along similar lines, funding should be allocated under an umbrella
mechanism that covers all four stages of drought cycle management – mitigation,
preparedness, relief and reconstruction.
In the short term, a more cost effective approach would be to prioritize early response
measures. Even if there is hesitation over whether a high magnitude drought will occur,
the cost difference is such that it will still be much more cost effective to invest in
measures such as commercial destocking, and measures to improve animal condition.
Further, these services as an early response measure also help to build resilience in the
longer term. Ways to take these types of interventions to scale should be investigated.
Spending on resilience needs to increase significantly, both in the short and the long
term. Current efforts to build resilience for pastoralists have remained largely at a
pilot/demonstration level. Donors and governments need to shift far greater portions of
funding into resilience, and in the short term this will also require continued funding to
humanitarian aid as asset depletion is reversed. The gap in general development
spending by governments and donors between the most drought affected areas and
other higher potential parts of the countries requires further examination. Findings can
be used to advocate for higher long term revenue and capital allocations to these areas.
Adequate resources and capacity must be committed to building resilience. Short-term
interventions, with no provision for long-term operations and maintenance, are
unsustainable. Value for money can be justified for many resilience interventions, but
these can quickly become a waste of money if they are not part of a longer-term plan of
support and founded on participatory approaches.
7.3 Areas for further work
Investigate innovative funding mechanisms that integrate development and relief,
such as the crisis modifier introduced by USAID in Ethiopia.
It would be useful to replicate and build on this work in another region experiencing
drought, to test the methodology, particularly given that HEA data is not available in
many areas and therefore a different approach may be required.

Economics of Resilience Final Report 84
Undertake a similar analysis within the context of a complex emergency (e.g. natural
hazard and conflict), as well as rapid onset disaster. These are likely to bring up a
very different set of issues to slow onset drought.
Develop a more systematic approach to determining the relative costs and benefits
of resilience measures, using both qualitative and quantitative data, so that
measures can be prioritized.
Conduct further research into the potential reductions in aid that can occur as a
result of building resilience. This analysis assumed a stage reduction, with full aid
and losses occurring in year 0, 50% in year 5, and 25% thereafter, but this was purely
based on expert opinion and the evidence base on this is very thin.
Expand the HEA and herd dynamic modelling to look at impacts by wealth group.
This could be very informative, both in terms of targeting of the PSNP/HSNP, as well
as showing the differential impacts by group.