Embed Size (px)
Citation preview
THE ECONOMICS OF CORN COB CELLULOSIC ETHANOL FOR NORTHWEST
IOWA
by
WILLIAM J. SCHANY
B.T. Northwest Missouri State University, 1997
A THESIS
Submitted in partial fulfillment of the requirements
for the degree
MASTER OF AGRIBUSINESS
Department of Agricultural Economics
College of Agriculture
KANSAS STATE UNIVERSITY
Manhattan, Kansas
2010
Approved by:
Major Professor Mike Woolverton
ABSTRACT
To meet the demand of the 2007 Energy Bill will require a new approach to ethanol
production in the United States. The question persists: how can the ethanol industry in the
United States produce 21 billion gallons of ethanol from cellulosic sources? This challenge
will require changes in the facilities currently manufacturing ethanol, the collection and
storage methods to which the Midwestern farmer is accustomed, and a drastic change in
farm production practices. Several different methods of cellulosic ethanol production are
being examined. One such method is to change the focus from starch based ethanol to
ethanol produced by harvest, collection, and manufacture from corn cobs. Research has
included surveys, development of economic models, and focus group meetings to
determine the feasibility of corn cobs as a viable raw material source for cellulosic ethanol.
Findings indicate that: corn cob collection is feasible for the Midwestern farmer.
According to the economic models presented in this thesis, Midwestern farmers can benefit
economically from the collection of corn cobs. Further, the collection of corn cobs allows
for current ethanol plants to be upgraded with new technology without major change in the
manufacturing processes. The focus of this research was to determine which method of
corn cob collection was preferable for Midwestern corn producers.

iii
TABLE OF CONTENTS
List of Figures ......................................................................................................................... iv
List of Tables ........................................................................................................................... v
Acknowledgments .................................................................................................................. vi
Chapter 1: INTRODUCTION .............................................................................................. 1
1.1 Ethanol .......................................................................................................................... 1
CHAPTER 2: CURRENT ETHANOL PRODUCTION .................................................. 3
2.1 Ethanol production cycle .............................................................................................. 3
CHAPTER 3: CELLULOSIC ETHANOL ......................................................................... 6
3.1 Benefits of using cobs .................................................................................................. 9
3.2 Problems associated with cobs ................................................................................... 12
3.3 Addressing the concerns of implement manufacturers ............................................. 13
3.4 Addressing the concerns of the producer ................................................................... 14
CHAPTER 4: METHODOLOGY ..................................................................................... 17
4.1 Net Present Value ....................................................................................................... 17
4.2 Internal Rate of Return ............................................................................................... 17
4.3 Payback period ........................................................................................................... 18
CHAPTER 5: ECONOMIC ANALYSIS OF USING CORN COBS ............................ 19
5.1 Corn cob mix .............................................................................................................. 19
5.2 Cob wagon .................................................................................................................. 23
CHAPTER 6: CONCLUSION ............................................................................................ 33
REFERENCES ..................................................................................................................... 36

iv
LIST OF FIGURES
Figure 2.1: Fuel Ethanol – Dry Mill Process Flow ............................................................. 5
Figure 3.1: The Future of Biofuels ........................................................................................ 7
Figure 3.2: RFS-Mandated Biofuels Volumes .................................................................... 8
Figure 3.3: RFS-Mandated Corn Ethanol and Advanced Biofuels Volumes ................. 9
Figure 3.4: Ethanol from Corn Cobs ................................................................................. 11
Figure 5.1: Corn Cob Mix ................................................................................................... 21
Figure 5.2: Collection Corn Cob Mix ................................................................................. 22
Figure 5.4: Rotary Screener ................................................................................................ 22
Figure 5.3: Cob Collections with Wagon ........................................................................... 24
v
LIST OF TABLES
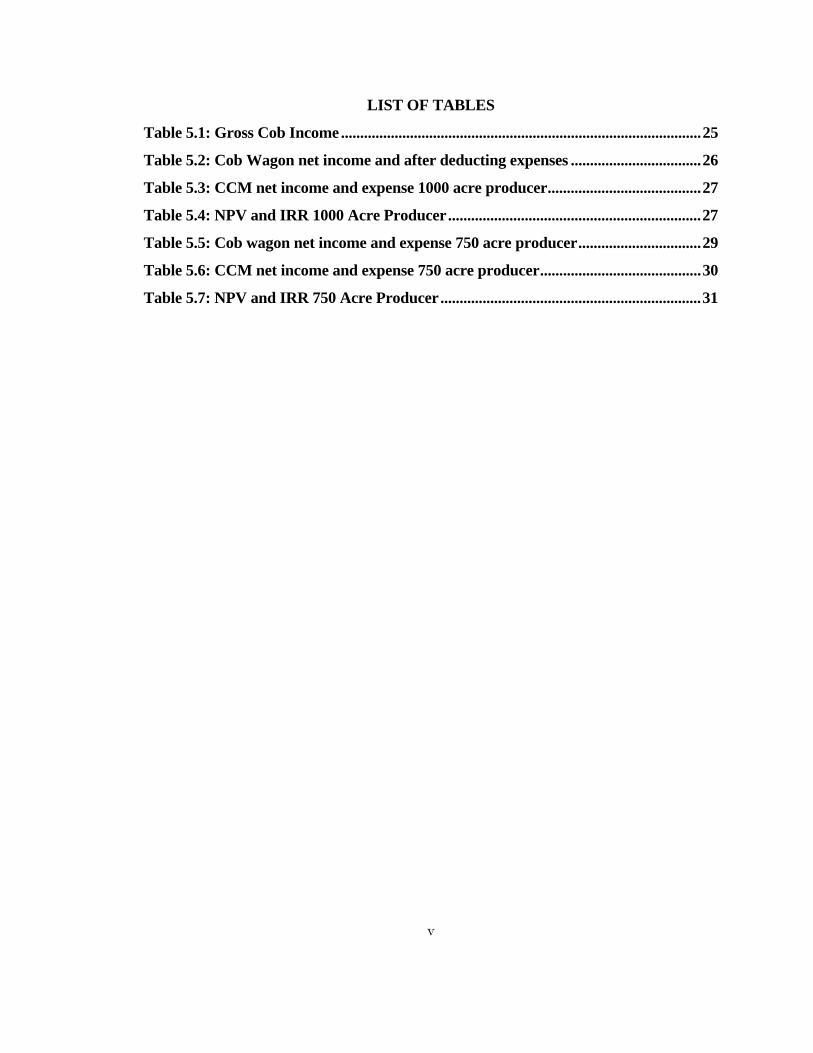
Table 5.1: Gross Cob Income .............................................................................................. 25
Table 5.2: Cob Wagon net income and after deducting expenses .................................. 26
Table 5.3: CCM net income and expense 1000 acre producer ........................................ 27
Table 5.4: NPV and IRR 1000 Acre Producer .................................................................. 27
Table 5.5: Cob wagon net income and expense 750 acre producer ................................ 29
Table 5.6: CCM net income and expense 750 acre producer .......................................... 30
Table 5.7: NPV and IRR 750 Acre Producer .................................................................... 31

vi
ACKNOWLEDGMENTS
The author wishes to thank the following individuals and business who made the
completion of this project a possibility: POET of Sioux Falls, South Dakota and POET
Biorefining of Emmetsburg, Iowa, Emmetsburg Liberty Team and the focus group for
cellulosic ethanol in Emmetsburg.

1
CHAPTER 1: INTRODUCTION
1.1 Ethanol
Ethanol has been used as a fuel source since the 1800s when German inventor Nikolaus
Otto built the first four stroke internal combustion engine (Energy kids, 2007). The need
for non-petroleum fuel during World War I provided demand that caused ethanol
production to increase in the early part of the 20th century. However, after World War II,
the price of oil dropped dramatically resulting in the cessation of ethanol production
(Energy kids, 2007). Today, the ethanol industry is a rapid growth segment of the energy
complex due to the increase in the price of crude oil and government incentives for
renewable fuels. Early growth in the ethanol industry in the U.S. can be attributed to the
United States’ policy to reduce dependence on foreign oil, the demand for petroleum based
products at reasonable prices, and the need to replace MTB’s with a cleaner oxygenate.
The two largest ethanol producers in the United States currently make up 27% of ethanol
production: POET based in Sioux Falls, South Dakota and Archer Daniels Midland,
headquartered in Decatur, Illinois. Total production of these two companies with planned
expansions is 1.539 billion gallons for POET and 1.620 billion gallons for ADM.
(Renewable Fuels Association, 2007). These two companies lead the ethanol market in
research and development.
The question of where the additional feedstock needed to make ethanol will come from to
meet increasing demands is a pressing question for United States ethanol producers. This
focus is most intense in the Midwestern states and for the farmers who produce in these

2
areas. According to Ethanol Producer magazine, the top five ethanol producing states in
2007 were, in order, Iowa, Nebraska, Illinois, Minnesota, and South Dakota (2007). 1
Midwestern farmers looking for sales outlets for their corn were the first to champion the
building of ethanol plants. Initially, the capital needed for the plants was raised by local
farmers. But larger companies stepped in as capital needs soared and the need for
managerial expertise increased. Companies such as POET and ADM funded and
constructed a large number of ethanol facilities in the United States and have purchased
other plants resulting in a consolidation of the industry.
Due to rapid growth of the U.S. ethanol industry, some major producers are looking for
alternative feedstocks for use in ethanol production. This is due to government incentives
for cellulosic feedstock including subsidies for the blending of ethanol, as well as increased
demand from the public for alternative fuels and government mandates. One of these
companies, POET, has partnered with the Department of Energy to develop a method to
meet the renewable fuels standards set forth by the Energy Bill of 2007. POET is investing
in a $200 million expansion to its Emmetsburg, Iowa production facility to be the first
commercial cellulosic ethanol producer to use corn cobs along with corn in the
manufacturing of ethanol.
1 Top ethanol states vary little in six months. (2007) Ethanol producer magazine. Retrieved Sep. 1, 2008, from http://www.ethanolproducer.com/article.jsp?article_id=2818.

3
CHAPTER 2: CURRENT ETHANOL PRODUCTION
2.1 Ethanol production cycle
There are two methods currently used to produce ethanol from corn in the United States:
dry milling and wet milling. Dry mill ethanol production is more energy efficient and less
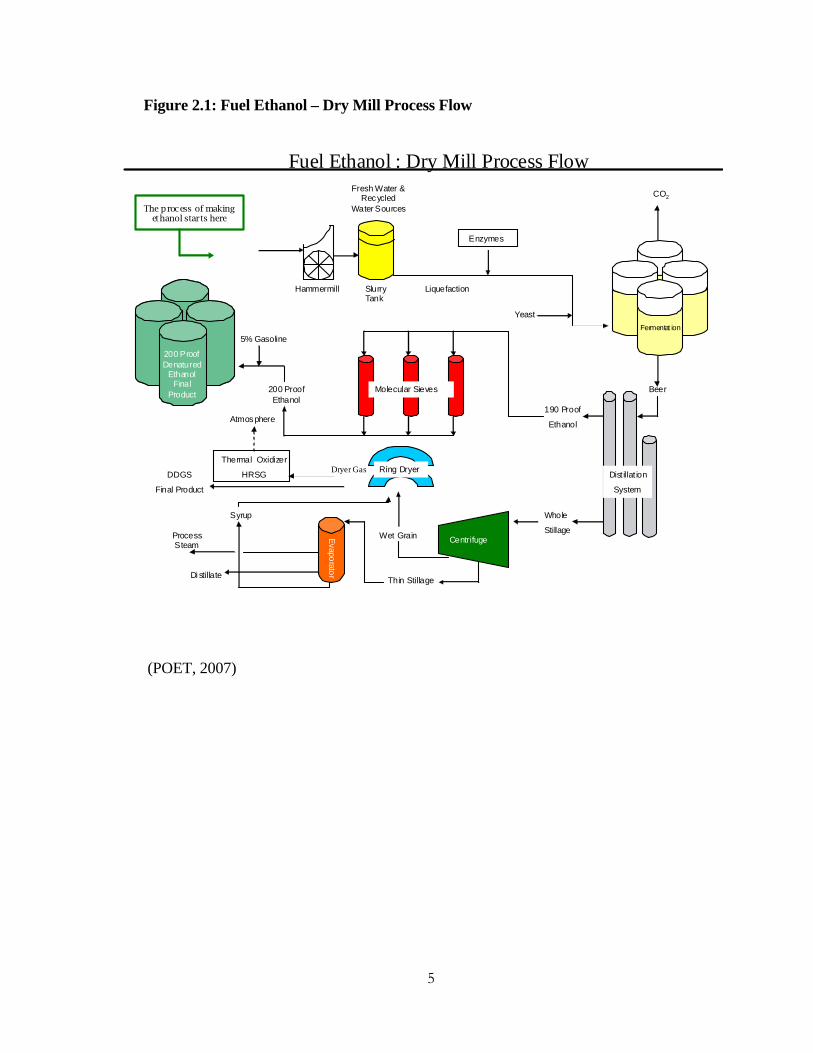
expensive than the wet mill process (Johnson, 2007). In a typical dry mill ethanol plant,
the process starts with corn being delivered via truck or rail by local producers. The corn is
stored at the facility until it is needed for the processing. Corn is then transferred to a
hammer mill where it is ground to a flour consistency (Figure 2.1). The corn flour is
conveyed into a slurry tank along with water and yeast. The pH of the slurry is controlled
by the use of sulfuric acid. The pH level is important to the overall process because the
optimal performance of yeast is obtained with a pH level between 4 and 4.5. The mash
mixture is then transferred into a fermentation tank along with enzymes and yeast. The
enzymes break corn starch down into the simple sugars that the yeast ferments into carbon
dioxide and ethanol. After 50 to 65 hours of fermentation, the yeast produces a beer that
contains 16% to 20% alcohol by volume (POET, 2007).
The beer is sent to the distillation process to separate the alcohol from the liquid. A series
of distillation columns boil the alcohol out of the water. This process continues until it
yields 190 proof (or 95%) alcohol. The 190 proof alcohol is then passed through a series of
molecular sieves. These sieves contain very small zeolite balls that are the size of a BB.
The sieve beads absorb the remaining water leaving 200 proof alcohol.

4
The slurry mixture contains solids called solubles. This mixture is sent through a series of
centrifuges that spin out these solubles. The solids are put through evaporators to remove
more water and thicken the solubles to a syrup. The plant can either sell the solids as wet
cake (65% moisture) to local cattle markets or send the solids through a series of dryers that
dry the material to 10% moisture. Solubles with this lower moisture percentage are called
Dried Distillers Grains with Solubles (DDGS). DDGS are then loaded on railcars or trucks
and sent to different feed markets.
5
Figure 2.1: Fuel Ethanol – Dry Mill Process Flow
(POET, 2007)
Atmosphere
DDGS
Final Product
Di stillate
Syrup
Wet Grain
Thin Stillage
Centrifuge
5% Gasoline
200 ProofEthanol
Molecular Sieves Beer
Dist illat ion
System
190 Proof
Ethanol
200 ProofDenatured
EthanolFinal
Product
200 ProofDenatured
EthanolFinal
Product
Whole
Stillage
Thermal Oxidizer
HRSG
CO2
Enzymes
Fermentat ion
Yeast
Liquefaction
The process of making ethanol starts here
Fresh Water & Recycled
Water Sources
Hammermill Slurry Tank
Fuel Ethanol : Dry Mill Process Flow
Dryer GasEvaporator
Process Steam
Ring Dryer

6
CHAPTER 3: CELLULOSIC ETHANOL
The energy bill signed by President Bush on December 19, 2007 set new standards for
renewable energies, and more importantly for this discussion, ethanol (see Figure 3.3). The
bill has many provisions, but one important provision is the limit on starch based ethanol
production of 15 billion gallons. The balance of the mandate, 21 billion gallons of ethanol,
must come from cellulosic sources. The total ethanol mandate for 2022 is five times more
than current ethanol plant production capacity (Renewable Fuels Standard, 2007).
Cellulosic ethanol is made from the cellulose contained in plant fibers. Ethanol is currently
produced from soft starches, such as corn. As of January 2009, 170 ethanol plants were in
operation producing 10.57 billion gallons of ethanol annually. There were 24 plants under
construction that will produce an additional 2.0 billion gallons of ethanol (RFA).
Production of soft starch ethanol will be capped at 15 billion gallons in 2015 as specified in
the 2007 energy bill (Figure 3.2) (POET, 2007). More than 4.2 billion bushels of corn are
used for ethanol production. Unless the United States can increase corn production by
2015, the other uses of corn, such as for human, export and animal consumption could
suffer from the mandate. The Energy Bill takes this into consideration with its cap of 15
billion gallons. Currently, there are no commercial cellulosic ethanol plants in operation in
the United States.
Cellulosic ethanol technology is rapidly developing, but is still expensive compared to
corn starch ethanol technology. The Department of Energy (DOE) estimates that cellulosic
ethanol production to be $2.20/gal, almost double the cost for corn based ethanol. The
7
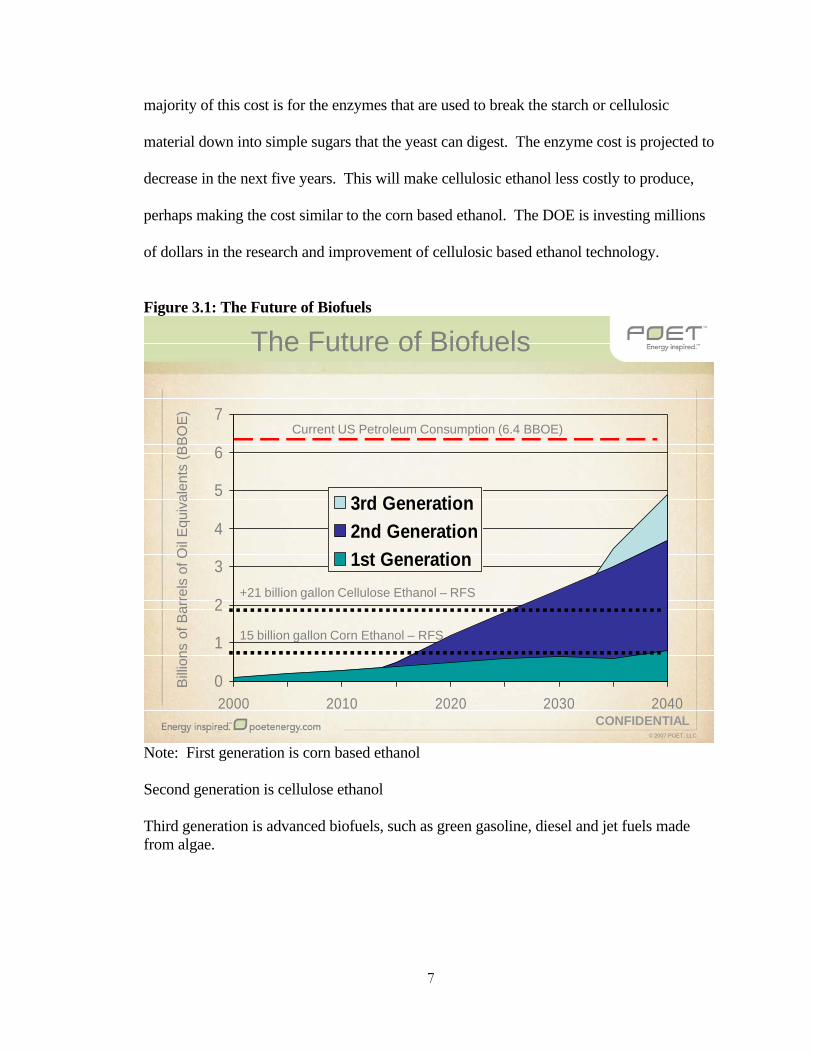
majority of this cost is for the enzymes that are used to break the starch or cellulosic
material down into simple sugars that the yeast can digest. The enzyme cost is projected to
decrease in the next five years. This will make cellulosic ethanol less costly to produce,
perhaps making the cost similar to the corn based ethanol. The DOE is investing millions
of dollars in the research and improvement of cellulosic based ethanol technology.
Figure 3.1: The Future of Biofuels
CONFIDENTIAL© 2007 POET, LLC
The Future of Biofuels
0
1
2
3
4
5
6
7
2000 2010 2020 2030 2040
3rd Generation2nd Generation1st Generation
Current US Petroleum Consumption (6.4 BBOE)
Billio
ns o
f Bar
rels
of O
il Eq
uiva
lent
s (B
BOE)
15 billion gallon Corn Ethanol – RFS
+21 billion gallon Cellulose Ethanol – RFS
Note: First generation is corn based ethanol Second generation is cellulose ethanol Third generation is advanced biofuels, such as green gasoline, diesel and jet fuels made from algae.
8
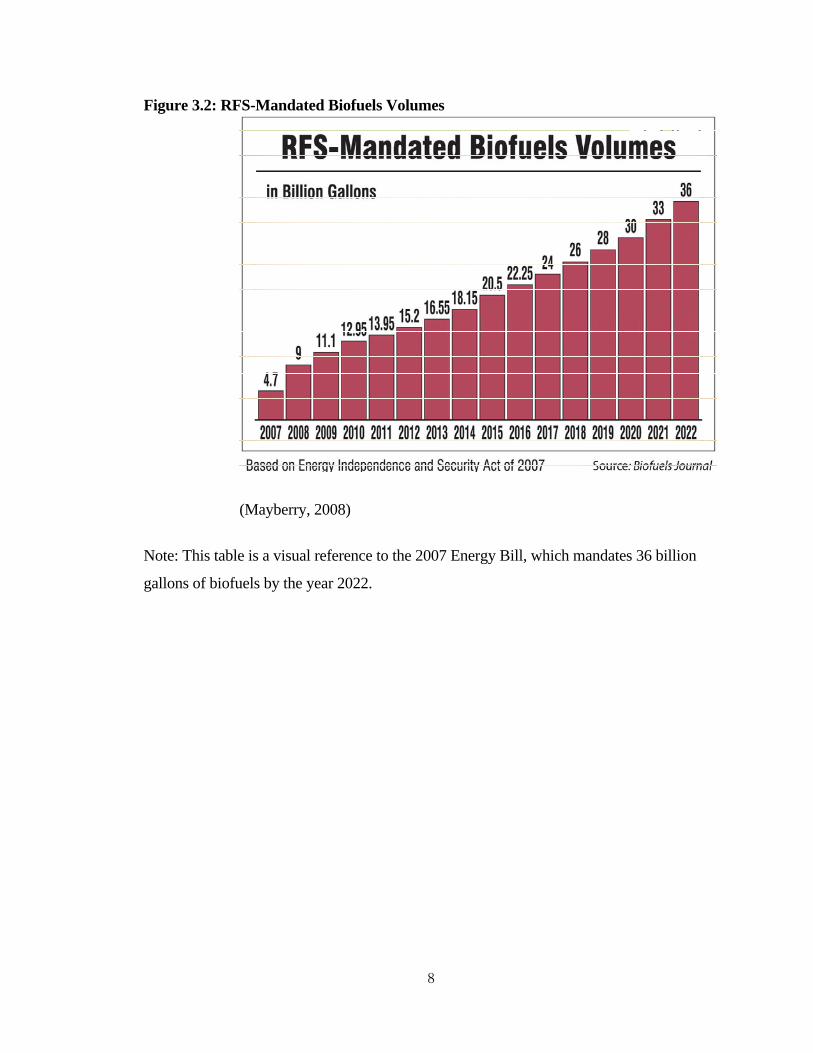
Figure 3.2: RFS-Mandated Biofuels Volumes
CONFIDENTIAL© 2007 POET, LLC
(Mayberry, 2008)
Note: This table is a visual reference to the 2007 Energy Bill, which mandates 36 billion
gallons of biofuels by the year 2022.

9
Figure 3.3: RFS-Mandated Corn Ethanol and Advanced Biofuels Volumes
CONFIDENTIAL© 2007 POET, LLC
Note: This table is a visual reference of the volumes of biofuels mandated by the
Renewable Fuels Standard.
(Mayberry, 2007)
3.1 Benefits of using cobs
There are numerous advantages to using corn cobs as the raw material for cellulosic
ethanol. The primary advantage is the huge supply of corn cobs. In 2008, the United
States produced 88 million acres of corn and corn cobs. However, up to now cobs have
been harvested from only seed corn acres which accounts for roughly 250,000 acres
(POET, 2007). Cob production and harvesting can fit into current Midwest practices.
Midwestern farmers do not have to start over learning how to produce different feedstocks
such as switch grass or muscanthes. Corn has been grown in the Midwest (for more than
150 years) and familiarity based on long experience offers a comfort level to corn farmers.
10
The technology also allows the producer to use the modern infrastructure developed over
the last twenty years to collect cobs as grain bins, tractor-trailers and combines can be used
in the process to with little or no modifications to the commonly used equipment. Seed
corn companies have spent years of research and millions of dollars on seed corn genetics
contributing to higher yields of corn. These higher yields provide the opportunity for
farmers to produce more corn and subsequently more cobs; however, research on using
corn cobs to produce ethanol has not received the funding that other potential sources of
cellulosic feedstock such as switchgrass and muscanthes have received.
Corn cobs can provide an ethanol plant with a more consistent feedstock compared to
alternatives such as corn stover (POET). Corn cobs are uniform, whereas corn stover is an
uneven mixture of stalks, leaves, and cobs. Consistency is an important input when
processing raw material for producing ethanol; the more consistent the feedstock, the more
efficient the production of ethanol. Each batch of cobs would be consistent and eliminate
the need for adjustment or for multiple processes. Corn cobs have a high carbohydrate
content that feeds the yeast to produce ethanol.
The process of producing ethanol from corn cobs is different than producing ethanol using
corn kernels and requires changes from the traditional method of using corn as the
feedstock. Existing ethanol plants need to be transformed into plants that will use both
kernels and cobs as feedstocks. The two feedstocks will be processed separately, but the
end result will be the production of ethanol. The following flow chart (3.4) shows the
method of producing ethanol using corn cobs too.

F
(P
A
et
tr
ef
to
sy
th
n
pl
w
w
b
co
Figure 3.4: E
POET, 2007)
An additional
thanol plants
ransportation
ffective use o
o alternative
ystems. Com
he cobs after
eed for natur
lants can be
waste water b
will still take
e greater. It
ome from a b
Ethanol from
)
l advantage t
s as corn. Th
n, equipment
of current in
cellulosic so
mplete utiliza
the ethanol
ral gas. Wat
reused, resul
being produc
the same am
is estimated
bushel of cor
m Corn Cob
to using cobs
his allows fo
t, farm to ma
frastructure l
ources that m
ation of cobs
has been pro
ter that is cur
lting in more
ed. Finally,
mount of ener
d that by usin
rn plus cobs
11
bs
s as a feedsto
r a more pro
arket roads, p
lowers the co
might require
s can also low
oduced can b
rrently being
e production
ethanol prod
rgy to produc
ng corn and c
(Mayberry,
ock is that th
oductive use
plant offices,
ost of cellulo
investment
wer ethanol p
be used in a s
g used to coo
of ethanol w
duced per acr
ce but the ou
corn cobs, 18
2007).
ey are the sa
of current in
plant scales
osic raw mat
in different l
plant costs.
solid fuel boi
l different pr
with the same
re of corn w
utput of ethan
8 percent mo
ame distance
nfrastructure:
, etc. The
terial compar
logistical
The waste fr
iler to offset
rocesses at th
e amount of
ill increase.
nol per acre w
ore ethanol w
from
red
rom
the
he
It
will
will

12
3.2 Problems associated with cobs
There are negative aspects of using corn cobs as a feedstock for ethanol. Cobs have been
collected for a long time, but these cobs are used for abrasives, fertilizer and insecticide
carriers and various other small-scale uses. Collection has been done mostly from seed
corn acres on a limited basis. Most modern American corn farmers have never collected
cobs. Producers tend to view the cob as a waste product. But many farmers have an
entrepreneurial attitude and an attractive price should provide enough encouragement for
them to collect cobs. POET facilities that are experimenting with cob use as a feedstock
are also working to educate and promote this alternative method of ethanol production
through focus groups, customer meetings and large scale public relations events. Overall,
interest from farmers is quite high, but some producers remain skeptical of the feasibility of
the process.
Equipment used to collect cobs is primitive and, for the most part, untested for commercial
use. The focus of the major equipment builders has been on the harvesting of corn. They
have designed the combine to be a highly specialized piece of machinery that can harvest
several crops with different headers. Equipment manufacturers have not designed
combines to harvest cobs. Specialized corn cob collection machinery would require
expensive development efforts and new factories and manufacturing equipment. However,
if profitable enough, equipment manufacturers will build cob collection capabilities into
their combines. The problem is until cobs are proven to be economically viable, the
manufacturers will be unwilling to commit resources to design and build cob collection
equipment. Equipment manufacturers are exploring cob collection methods to make sure
that they do not miss a new opportunity in equipment manufacturing.

13
Transportation of corn cobs is another issue. Corn cobs have a very low bulk density (17
lbs/ cu. ft. verses 45 lbs/cu. ft. for corn) resulting in high volumes of material to fill a truck
to the maximum axle weight. In Iowa, the legal gross weight of a truck is 80,000 lbs. The
low bulk density can cause a need for the use of very long and high sided trucks. Most
farmers now own a hopper bottomed grain truck that has short sides (Taylor, 2007). The
transportation of corn cobs is impractical with current trucks. Farmers may need to
purchase more specialized trailers with higher sides and longer trailer length.
3.3 Addressing the concerns of implement manufacturers
The adoption of cob collection is dependent on implement manufacturers. Because cob
technology is an entirely new method of production, major implement manufacturers have
a stake in the process. Two methods have been tested by POET: a cob caddy and a corn
cob mix. Uncertainty exists as to the method that will best meet the needs of farmers’
operations. Furthermore, equipment manufacturers need to be convinced that cob based
cellulosic ethanol production warrants investment in developing collection equipment.
Confidence will be gained through testing new equipment and testing modifications to
existing equipment and analyzing costs and returns. Demand for such equipment is
dependent on farmers’ acceptance. The endorsement of farmers will give implement
manufacturers the incentive to go ahead. POET is working with some of their
farmer/owners to test methods of cob collection to “find optimal solutions” (Corn cob
ethanol, 2007). Testing will determine if these collection methods work and analysis will
be done to see if they are economically viable. Local farmers will need to be convinced
that cob collection is profitable. Until testing is completed, farmers will remain skeptical.
Without a demonstration of full scale ethanol production from corn cobs and reliable

14
analysis to show a positive financial return for the equipment, implement manufactures will
resist producing corn cob harvesters. Both equipment manufacturers and farmers need
profit from cob based cellulosic ethanol production in order for the system to be adopted.
3.4 Addressing the concerns of the producer
POET must address farmers’ concerns about cob collection in order to gain their support.
Producers have indicated that they are concerned about collection and storage, as well as
logistics and infrastructure. POET is working to address farmers’ concerns including
different collection options that can be used to establish profitable collection and storage of
cobs.
Two possible solutions to the storage problem exist. The first is a ground pile. Corn cobs
could be collected and stored in a pile that remains on the bare ground open to the
elements. The cobs will be subjected to harsh weather conditions. The consequence of this
storage system has not yet been determined. The early indication is that corn cobs will
have quality deterioration. Potential solutions exist in the use of permanent structures, such
as machine sheds, hoop buildings and other corn crib type structures. The negative of this
type of storage is that if the structures don’t already exist the farmer is required to make
high capital investments with the potential for only low rates of return.
Transportation and logistics is another area that is unproven for cob based ethanol
production. On the face of it, transportation of cobs is more efficient and requires less
space than corn stover. The corn cob is the second densest part of the plant, with the corn
15
kernel being the densest. POET uses techniques to make cobs even denser to reduce the
space required to transport them (Corn cob ethanol, 2007). The infrastructure required to
transport cobs is already in place, but it is unknown if existing transportation capacity can
also handle the necessary volume of cobs.
Most of the solutions that have been presented are farmer dependent. As businessmen and
women, farmers have to be shown the profitability for them of corn cob ethanol production.
Issuing multi-year contracts for the purchase of corn cobs is one way to provide an
incentive for the farmer harvest of cobs. Focus groups have uncovered that POET would
share the risk and reward with farmers. Test harvests that allow farmers to try the
equipment and judge the efficiency while POET provides fuel and manpower is one way
POET can generate interest. Implement manufacturers have to know that farmers are
willing to pay for new equipment or modifications to current implements. Assurance could
result in more timely production or conversion of the equipment necessary to harvest corn
cobs.
Farmers in general are very efficient in their operations. The early versions of cob
collection equipment are not very efficient. The new equipment will be bulky and clumsy
at first but should become more efficient and streamlined as time goes by, the natural
progression of all new technologies. It will be the same for the price of the equipment:
high at first and then dropping as equipment manufactures develop and build a larger
volume of equipment. In most cases, the producer will need additional manpower and
equipment to harvest cobs too. Additional labor may be hard to find in rural areas. This

16
labor demand will more than likely be for temporary seasonal help for the fall harvest
which could make the prospect less desirable to many because of the scarce amount of
good help during that time of year. Additional costs to an operation for cob collection must
be factored in to determine profitability for farmers.
3.5 Addressing the concerns of current cob consumers
Currently only a handful of companies use corn cobs in the state of Iowa. The largest and
most notable is Green Products, located in Conrad, Iowa. They buy 50,000 tons to process
for many uses from bedding to pharmaceuticals. Best Cob, located in Independence, Iowa,
uses roughly 30,000 tons of cobs every year. Local cattle producers also use corn cobs for
bedding and, more importantly, feed. Currently those three business entities get all their
cobs from seed corn companies; none of the cobs come from field corn.

17
CHAPTER 4: METHODOLOGY
There are several different tools to analyze investment decisions. The main objective for
the producer is to determine if an investment will be profitable. The following methods are
used to evaluate cob harvesting equipment for the producer: Net Present Value (NPV),
Internal Rate of Return (IRR) and payback period.
4.1 Net Present Value
NPV is defined as the net present value of discounted cash flows associated with an
investment. The NPV method involves discounting all cash outflows and inflows to
present values. A dollar received in the present is more valuable than a dollar received in
the future due to the ability to reinvest that dollar. Present value decreases longer out the
dollar is in the future and the higher the discount rate. The NPV will determine the value
of the investment in today’s dollars. The formula for NPV is Rt/ (1+i) t where t is the time
of the cash flow, i is the discount rate (the rate of return that could be earned on an
alternative investment with similar risks, Rt is the net cash flow (the amount of cash, inflow
minus outflow) at time t. The decision rule is that if NPV is positive the investment should
be undertaken.
4.2 Internal Rate of Return
IRR is a rate of return used to measure and compare the profitability of investments. The
IRR of an investment is the interest rate which makes discounted cash inflows just equal to
discounted cash outflows. IRR can be used when firms set a minimum rate of return or
hurdle rate of return for investments.

18
4.3 Payback period
The payback period is the amount of time it takes for an investment to generate enough
cash flow to repay the original investment. Payback period is a simple calculation that only
takes into effect the cash inflows until the investment is repaid and does not take into effect
any future cash flows including cash flows beyond the payback period which could make
an investment better or worse.
All three methods will be used to assess the viability in cob collection methods on acres of
production only. I will include two years of subsidies which are currently in the current
farm bill. Future subsidies are not included.

19
CHAPTER 5: ECONOMIC ANALYSIS OF USING CORN COBS
The economics underlying corn cob collection is difficult to assess because there are
several unknowns in the process of cob collection. It will be necessary to make some
assumptions. There are two methods of cob collection currently being investigated by
POET Biorefining: corn cob mix and towing a cob cart behind the combine. POET has
stated that it will pick up the cobs at the farmers field and pay farmers between $30-60 per
dry ton (DT). The farmer is responsible for collecting and piling the cobs in one pile per
field. The 2008 Farm Bill has included a provision for a $45 per ton payment to farmers
for up to two years of the five year life of the Farm Bill (U.S. Department of Agriculture,
2008). Current cob yield estimates show that a harvest of 150 bushel per acre corn will
yield 0.634 DT of cobs per acre. These estimates take into account a 90% capture rate for
the cob. This yield is assumed through all cob collection methods and economic models.
5.1 Corn cob mix
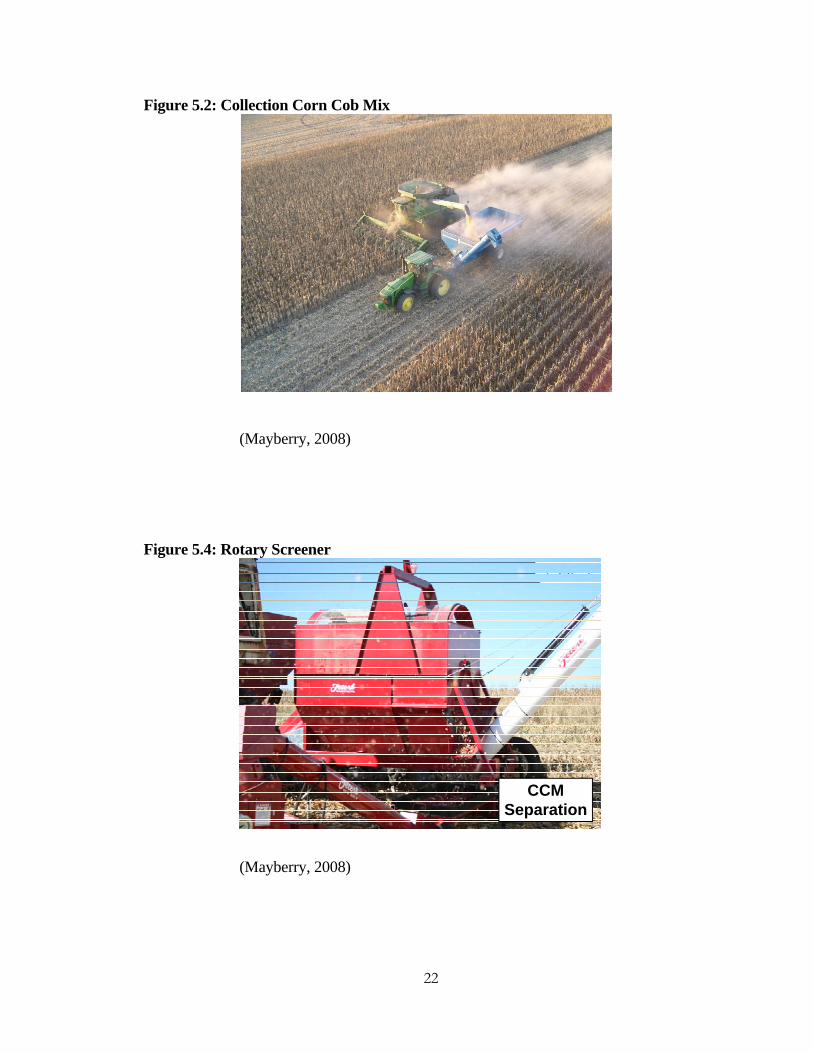
The first method of cob collection is the corn cob mix (CCM). This method is currently
used sparingly in Europe and by some cattle farmers in the United States. The CCM is
created by adjusting settings on the combine. The corn and the cobs are collected together
in the grain tank of the combine. After unloading the grain tank, the cobs and corn are
separated into corn and cobs for use in ethanol production. This can be done in several
different ways but the method most commonly used is a rotary screener. The screener
diverts the corn stream to the grain truck and the cobs to the ground. The screening can be
done anywhere that the farmer wants the cob pile, most often in the field. The CCM is a
very simple process and the only additional equipment needed is a rotary screener
20
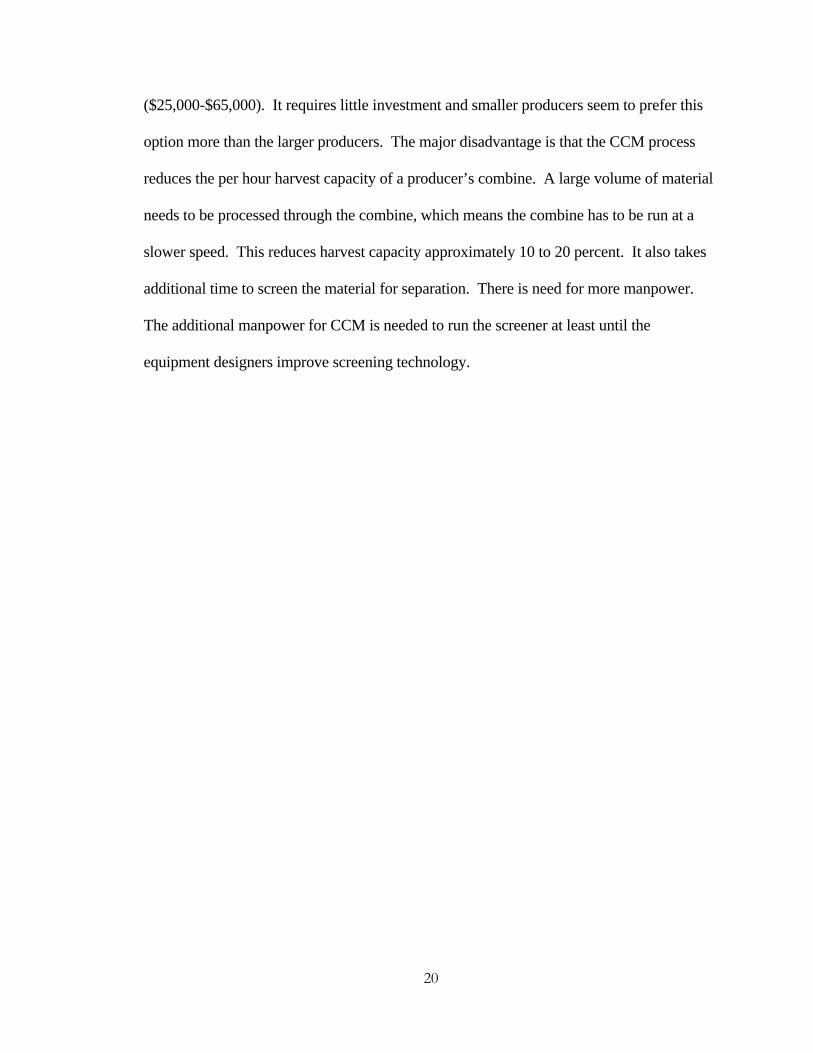
($25,000-$65,000). It requires little investment and smaller producers seem to prefer this
option more than the larger producers. The major disadvantage is that the CCM process
reduces the per hour harvest capacity of a producer’s combine. A large volume of material
needs to be processed through the combine, which means the combine has to be run at a
slower speed. This reduces harvest capacity approximately 10 to 20 percent. It also takes
additional time to screen the material for separation. There is need for more manpower.
The additional manpower for CCM is needed to run the screener at least until the
equipment designers improve screening technology.

21
Figure 5.1: Corn Cob Mix
(Mayberry, 2008)
22
Figure 5.2: Collection Corn Cob Mix
(Mayberry, 2008)
Figure 5.4: Rotary Screener
CCM Separation
(Mayberry, 2008)
23
5.2 Cob wagon
The other method of cob collection is to tow a cob wagon behind the combine. The
combine is set to harvest the grain from the plant in the normal way. The wagon behind the
combine then separates the cobs from the rest of the material. A combination of air
direction and speed causes lighter weight materials, the husk and the stalk, to blow away
from the heavier cobs back onto the field. The cobs are collected in the wagon until they
are dumped either into a collection wagon or in a pile at the end of the field. The main
advantage is that the combine does not have to slow down. The volume of material that
runs through the combine is no different than normal. Pulling a wagon behind the combine
is a disadvantage because producers are not accustomed to having something behind the
combine in the field. The wagon, at a certain point in collection, will need to be dumped
which takes time away from harvesting the crop.
With both collection systems, cobs are collected and stored in a pile at the end of the field
to be picked up at a later time by a third party and the corn is transported as normal either
to the local elevator or to farm storage.

24
Figure 5.3: Cob Collections with Wagon
(Mayberry, 2008)
5.3 Economics
There are several variables that need to be considered to develop an economic model.
POET estimates a 5 to 10 percent reduction in harvest capacity to collect cobs, which
results in a cost of $1.13 to $2.25 per acre, assuming the cost of running a combine to be
$22.50/acre. Pulling a cob cart or running a screener requires more fuel. POET estimates
that the farmer will use 0.4 gal more fuel per acre which will cost the farmer $1.60 per acre
at a diesel cost of $4.00. The cob cart or screener requires an extra 2 to 3 minutes to
unload; therefore increasing harvest time by 15 to 25 percent, costing roughly $3.50- $5.00
per acres. The following analysis will be completed for two different sized producers, 1000
acres and 750 acres.
Table 5.1 shows the gross income per acre for levels of harvested acres. No expenses have
been taken out.

25
Table 5.1: Gross Cob Income Gross income per acre for corn cobs, using conversion of .634 bone dry tones of cobs per acre
Corn Acres $40/ton $45/ton $50/ton $60/ton $70/ton $80/ton $90/ton
100 $2,536 $2,853 $3,170 $3,804 $4,438 $5,072 $5,706200 $5,072 $5,706 $6,340 $7,608 $8,876 $10,144 $11,412300 $7,608 $8,559 $9,510 $11,412 $13,314 $15,216 $17,118400 $10,144 $11,412 $12,680 $15,216 $17,752 $20,288 $22,824500 $12,680 $14,265 $15,850 $19,020 $22,190 $25,360 $28,530750 $19,020 $21,398 $23,775 $28,530 $33,285 $38,040 $42,795
1000 $25,360 $28,530 $31,700 $38,040 $44,380 $50,720 $57,0602000 $50,720 $57,060 $63,400 $76,080 $88,760 $101,440 $114,1203000 $76,080 $85,590 $95,100 $114,120 $133,140 $152,160 $171,1805000 $126,800 $142,650 $158,500 $190,200 $221,900 $253,600 $285,300
If a producer harvested 1000 acres of corn and received $45/ton for cobs his gross revenue
for that process would be $28,530 at $90/ton it would be $57,060.
26
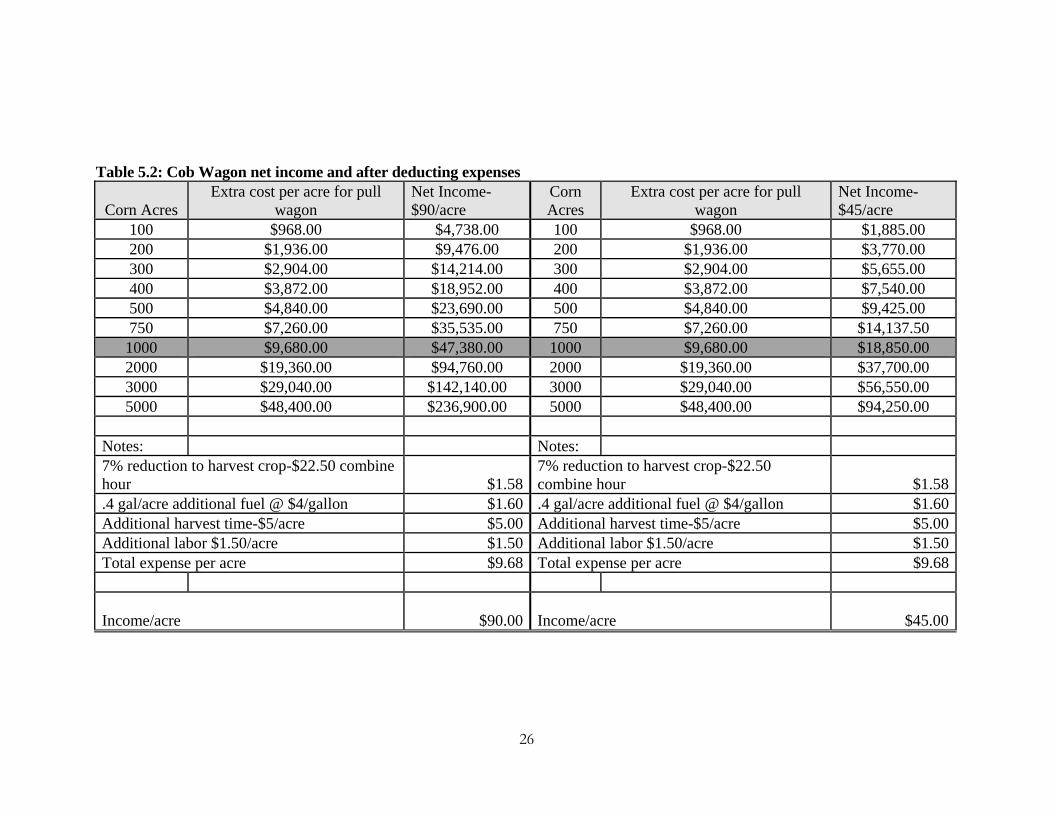
Table 5.2: Cob Wagon net income and after deducting expenses
Corn Acres Extra cost per acre for pull
wagon Net Income-$90/acre
Corn Acres
Extra cost per acre for pull wagon
Net Income-$45/acre
100 $968.00 $4,738.00 100 $968.00 $1,885.00 200 $1,936.00 $9,476.00 200 $1,936.00 $3,770.00 300 $2,904.00 $14,214.00 300 $2,904.00 $5,655.00 400 $3,872.00 $18,952.00 400 $3,872.00 $7,540.00 500 $4,840.00 $23,690.00 500 $4,840.00 $9,425.00 750 $7,260.00 $35,535.00 750 $7,260.00 $14,137.50 1000 $9,680.00 $47,380.00 1000 $9,680.00 $18,850.00 2000 $19,360.00 $94,760.00 2000 $19,360.00 $37,700.00 3000 $29,040.00 $142,140.00 3000 $29,040.00 $56,550.00 5000 $48,400.00 $236,900.00 5000 $48,400.00 $94,250.00
Notes: Notes: 7% reduction to harvest crop-$22.50 combine hour $1.58
7% reduction to harvest crop-$22.50 combine hour $1.58
.4 gal/acre additional fuel @ $4/gallon $1.60 .4 gal/acre additional fuel @ $4/gallon $1.60Additional harvest time-$5/acre $5.00 Additional harvest time-$5/acre $5.00Additional labor $1.50/acre $1.50 Additional labor $1.50/acre $1.50Total expense per acre $9.68 Total expense per acre $9.68 Income/acre $90.00 Income/acre $45.00

27
Table 5.3: CCM net income and expense 1000 acre producer Corn Acres Extra cost per acre for CCM
Net Income-$90/acre
Corn Acres Extra cost per acre for CCM
Net Income-$45/acre
100 $2,038.00 $3,668.00 100 $2,038.00 $815.00 200 $4,076.00 $7,336.00 200 $4,076.00 $1,630.00 300 $6,114.00 $11,004.00 300 $6,114.00 $2,445.00 400 $8,152.00 $14,672.00 400 $8,152.00 $3,260.00 500 $10,190.00 $18,340.00 500 $10,190.00 $4,075.00 750 $15,285.00 $27,510.00 750 $15,285.00 $6,112.50 1000 $20,380.00 $36,680.00 1000 $20,380.00 $8,150.00 2000 $40,760.00 $73,360.00 2000 $40,760.00 $16,300.00 3000 $61,140.00 $110,040.00 3000 $61,140.00 $24,450.00 5000 $101,900.00 $183,400.00 5000 $101,900.00 $40,750.00
Notes: Notes: 15% reduction to harvest Crop-$22.50 combine hour $3.38
15% reduction to harvest Crop-$22.50 combine hour $3.38
Run screener .06/bu * 175 bu/acre $10.50 Run screener .06/bu * 175 bu/acre $10.50Additional harvest time-$5/acre $5.00 Additional harvest time-$5/acre $5.00Additional labor $1.50/acre $1.50 Additional labor $1.50/acre $1.50Total expense per acre $20.38 Total expense per acre $20.38 Income/acre $90.00 Income/acre $45.00
27
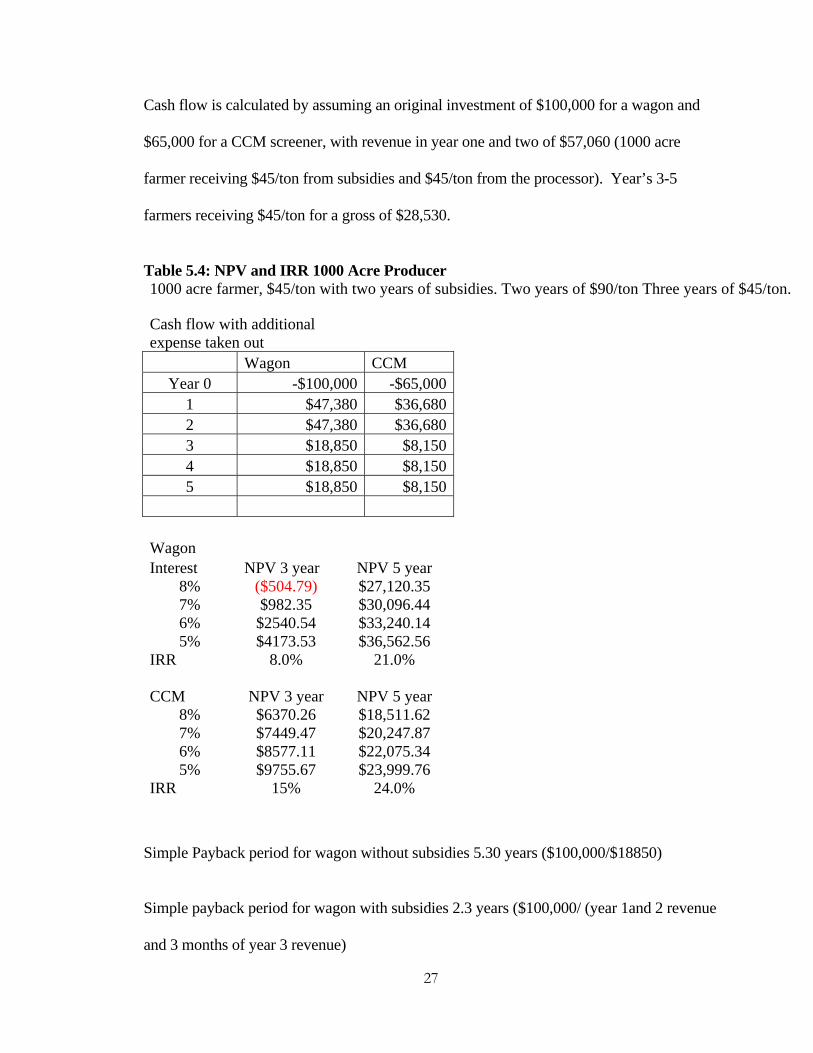
Cash flow is calculated by assuming an original investment of $100,000 for a wagon and
$65,000 for a CCM screener, with revenue in year one and two of $57,060 (1000 acre
farmer receiving $45/ton from subsidies and $45/ton from the processor). Year’s 3-5
farmers receiving $45/ton for a gross of $28,530.
Table 5.4: NPV and IRR 1000 Acre Producer 1000 acre farmer, $45/ton with two years of subsidies. Two years of $90/ton Three years of $45/ton.
Cash flow with additional expense taken out Wagon CCM
Year 0 -$100,000 -$65,000 1 $47,380 $36,6802 $47,380 $36,6803 $18,850 $8,1504 $18,850 $8,1505 $18,850 $8,150
Wagon Interest NPV 3 year NPV 5 year
8% ($504.79) $27,120.35 7% $982.35 $30,096.44 6% $2540.54 $33,240.14 5% $4173.53 $36,562.56
IRR 8.0% 21.0% CCM NPV 3 year NPV 5 year
8% $6370.26 $18,511.62 7% $7449.47 $20,247.87 6% $8577.11 $22,075.34 5% $9755.67 $23,999.76
IRR 15% 24.0%
Simple Payback period for wagon without subsidies 5.30 years ($100,000/$18850)
Simple payback period for wagon with subsidies 2.3 years ($100,000/ (year 1and 2 revenue
and 3 months of year 3 revenue)

28
Simple payback period for CCM Unit without subsides is 7.9 years ($65,000/8150)
Simple payback period for CCM Unit with subsides is 1.77 years ($65,000/36680)
This is just an example of a cash flow for one operation. Below is an example of a cash
flow for a 750 acre producer. Every operation will be different but cob collection can have
a positive effect for the right sized producer.
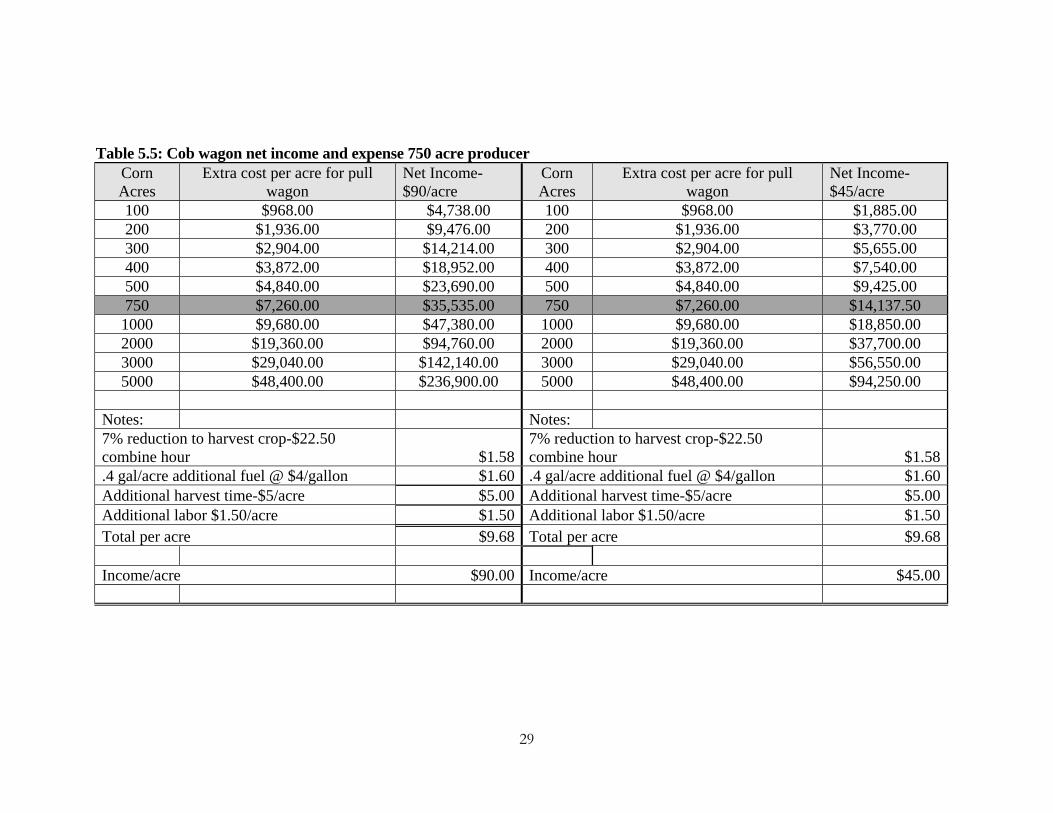
29
Table 5.5: Cob wagon net income and expense 750 acre producer Corn Acres
Extra cost per acre for pull wagon
Net Income-$90/acre
Corn Acres
Extra cost per acre for pull wagon
Net Income-$45/acre
100 $968.00 $4,738.00 100 $968.00 $1,885.00 200 $1,936.00 $9,476.00 200 $1,936.00 $3,770.00 300 $2,904.00 $14,214.00 300 $2,904.00 $5,655.00 400 $3,872.00 $18,952.00 400 $3,872.00 $7,540.00 500 $4,840.00 $23,690.00 500 $4,840.00 $9,425.00 750 $7,260.00 $35,535.00 750 $7,260.00 $14,137.50 1000 $9,680.00 $47,380.00 1000 $9,680.00 $18,850.00 2000 $19,360.00 $94,760.00 2000 $19,360.00 $37,700.00 3000 $29,040.00 $142,140.00 3000 $29,040.00 $56,550.00 5000 $48,400.00 $236,900.00 5000 $48,400.00 $94,250.00
Notes: Notes: 7% reduction to harvest crop-$22.50 combine hour $1.58
7% reduction to harvest crop-$22.50 combine hour $1.58
.4 gal/acre additional fuel @ $4/gallon $1.60 .4 gal/acre additional fuel @ $4/gallon $1.60Additional harvest time-$5/acre $5.00 Additional harvest time-$5/acre $5.00Additional labor $1.50/acre $1.50 Additional labor $1.50/acre $1.50Total per acre $9.68 Total per acre $9.68 Income/acre $90.00 Income/acre $45.00

30
Table 5.6: CCM net income and expense 750 acre producer Corn Acres Extra cost per acre for CCM
Net Income-$90/acre
Corn Acres Extra cost per acre for CCM
Net Income-$45/acre
100 $2,038.00 $3,668.00 100 $2,038.00 $815.00 200 $4,076.00 $7,336.00 200 $4,076.00 $1,630.00 300 $6,114.00 $11,004.00 300 $6,114.00 $2,445.00 400 $8,152.00 $14,672.00 400 $8,152.00 $3,260.00 500 $10,190.00 $18,340.00 500 $10,190.00 $4,075.00 750 $15,285.00 $27,510.00 750 $15,285.00 $6,112.50 1000 $20,380.00 $36,680.00 1000 $20,380.00 $8,150.00 2000 $40,760.00 $73,360.00 2000 $40,760.00 $16,300.00 3000 $61,140.00 $110,040.00 3000 $61,140.00 $24,450.00 5000 $101,900.00 $183,400.00 5000 $101,900.00 $40,750.00
Notes: Notes: 15% reduction to harvest Crop-$22.50 combine hour $3.38
15% reduction to harvest Crop-$22.50 combine hour $3.38
Run screener .06/bu * 175 bu/acre $10.50 Run screener .06/bu * 175 bu/acre $10.50Additional harvest time-$5/acre $5.00 Additional harvest time-$5/acre $5.00Additional labor $1.50/acre $1.50 Additional labor $1.50/acre $1.50Total expense per acre $20.38 Total expense per acre $20.38 Income/acre $90.00 Income/acre $45.00

31
Table 5.7: NPV and IRR 750 Acre Producer 750 acre farmer, $45/ton with two years of subsidies. Two years of $90/ton Three years of $45/ton.
Cash flow/additional expense taken out Wagon CCM
Year 0 -$100,000 -$65,0001 $35,535 $27,5102 $35,535 $27,5103 $14,138 $6,1134 $14,138 $6,1135 $14,138 $6,113
salvage $5,000 $2,500 Wagon Interest NPV 3 year NPV 5 year
8% ($23,526.74) ($2,078.52)7% ($22,627.72) ($13.72)6% ($21,679.50) $2,176.52 5% ($20,679.38) $4,500.75
IRR -9.0% 7.0% CCM NPV 3 year NPV 5 year
8% ($10,268.60) ($797.90) 7% ($9,599.81) $388.21 6% ($8,897.35) $1,641.98 5% ($8,159.44) $2,967.81
IRR -4.0% 7.0%
Table 5.5 is an example of a 750 acre producer. The smaller producer cannot make the
wagon work but does make a little income with the CCM unit over five years. The simple
payback period for the wagon without subsidies is 7.07 years ($100,000/$14,138). The
simple payback for the wagon with subsidies is just over 4 years. The simple payback for

32
the CCM unit without subsidies is 10.6 years ($65,000/$6113) and with subsidies is 3.7
years.
Table 5.4 and 5.7 show the difference that just 250 acres can have on a producers
operation. Net revenue will be very sensitive to acres farmed.
33
CHAPTER 6: CONCLUSION
The technology of collecting cobs for cellulosic ethanol has come a long way in a very
short amount of time. It is expected further advances will change the economics in the
future.
The CCM process was the first method used. At the time, it was thought to be the simplest
and most efficient method available to the producer. Research and technological advances
have shown otherwise. Although CCM is viable method, it is no longer the preferred
method. A major problem is that there is not commercial grade screener available today
for farmers to use on farm. Secondly, the amount of material that needs to be processed
through the combines is too great. Today’s combines will work with this process, but they
were not made for the application so there have been premature parts failures and possible
reduction in combine life. The solution seems to be to reduce the material processed by the
combine. CCM can be an option, but there obstacles.
A cob cart pulled by the combine seems to be the current method, but it shares some
efficiency problems with the CCM method of collection. A separate catch cart for the cobs
might work, but it would require another tractor, wagon, and person. Trials show that it is
difficult to run the extra cart. Ethanol processors prefer the cob cart because it produces
clean cobs that are easier to store and process. But the producers still have to be convinced
to use this method.
The smaller producers, less than 750 acres, are going to struggle to profitably cob with
either method. They may need to partner with other smaller producers in order to collect
cobs profitably. The data show that the larger producers, more than 750 acres, can make
34
either system work, but pulling the wagon would be preferred. With either system,
producers will need to have long term contracts in order for collecting cobs to be viable.
Other technologies such as square balers pulled by combines are being researched. This
method is similar to pulling a cob wagon, but it does not require additional labor. The baler
concept is more like a custom bale pickup operation. A farmer can combine his corn as
normal and the bales can be picked up at a later date. Farmers appear willing to adopt this
method of cob collection, because it requires little change in the way corn is harvested.
Plus, most farmers have had experience with bales
This is just one example of adoption of technology that has come about because of
cellulosic ethanol. The future of cellulosic ethanol depends on good working relationships
between ethanol producers and corn farmers.
The Renewable Fuels Standard requires the use of renewable fuels to produce 36 million
gallons of fuel by the year 2022. As the need for alternative energy sources continues to
increase, energy producers are mandated to use alternative methods to produce ethanol.
Although there are many variables to consider and much testing and research yet to be
done, the collection and processing of corn cobs is a fundamentally sound concept that
could allow the mandated goal to be reached. Increasing the value of an acre of corn by
utilizing what has been considered a waste product can benefit farmers by increasing profit
per acre for farming operations. A key to making cellulosic ethanol work will be to make
growing and collection cellulosic materials including corn cobs profitable for farmers.

35
As cellulosic ethanol mandates come into effect to meet the requirements of the RFS, all
ethanol plants will have to consider incorporating cellulosic technologies to make ethanol.
Facilities that are forward looking are researching alternative feed stocks and collection
methods now. They have to be prepared to meet government requirements and help the
U.S. become more energy secure. Technology will be developed to increase cellulosic
ethanol productive capacity to include many non-traditional feedstocks in ethanol
production. Cobs can be a vital part in the future of cellulosic ethanol.

36
REFERENCES
Corn cob ethanol. (2007). Biofuels journal. Retrieved August 30, 2007, from http://www.biofuelsjournal.com/info/search.php?site=BFJ&q=corn%20cob%20ethanol&view=articles&limit=25&offset=150
Corn cob feedstock education projects: a survey of Emmetsburg area landowners and
producers. (2007).
Energy kids. (2007). Retrieved Sep. 3, 2008, from http://www.eia.doe.gov
Johnson, A. (2007). Enzymes will help unlock door to efficient ethanol production. Farm and ranch guide. Retrieved Sep. 1, 2008 from http://www.farmandranchguide.com/articles/2007/04/26/ag_news/regional_news/local05.txt%20-%2047k
Mayberry, R. (2008). Project LIBERTY update. PowerPoint lecture presented at EBLT
focus group meeting, Emmetsburg, IA.
Murray, D. (2005). Ethanol’s potential: looking beyond corn. Earth Policy Institute. Retrieved November 25, 2007 from http://www.earth-policy.org/Updates/2005/Update49.htm
POET. (2007). LIBERTY panel. PowerPoint lecture presented at Iowa State University
biofuels conference, Ames, IA.
Renewable fuels standard. (2007). Retrieved September 20, 2007 from http://www.ethanolrfa.org/resource/standard/
Renewable Fuels Association. (2008). Retrieved September 22, 2008 from http://www.ethanolrfa.org
Schill, S. (2007). I-Farm allows ‘in silico’ biomass harvest. Retrieved October 21, 2007,
from http://www.ethanolproducer.com/article.jsp?article_id=3479&q=i%20farm%20allows%20in%20silico%20biomass%20harvest&category_id=3
Schany, W. (2008) Project Liberty update. PowerPoint lecture presented at EBLT focus
group meeting, Emmetsburg, IA
Smith, R. (2007). Research targeted at making cellulosic ethanol more cost effective. Southwest Farm Press. Retrieved October 21, 2007, from http://southwestfarmpress.com/mag/farming_research_targeted_making/index.html
Taylor, J. (2002). Bulk densities reference. [Msg 103]. Message posted to
http://www.powerandbulk.com/cgi-bin/yabb/YaBB.pl?num=1025783127/4

37
Top ethanol states vary little in six months. (2007). Ethanol producer magazine. Retrieved Sep. 1, 2008, from http://www.ethanolproducer.com/article.jsp?article_id=2818
U.S. Department of Agriculture. (2008) 2008 farm bill side-by-side. Washington, D.C.:
U.S. Department of Agriculture. Retrieved from Economic Research Service via: http://www.ers.usda.gov/FarmBill/2008/titles/titleixenergy.htm
Wisner, B., & Baumel, P. (2004). Will there be enough corn to supply future needs?
AgDM. Retrieved November 1, 2007, from http://www.extension.iastate.edu/agdm/articles/wisner/WisAug04.htm