Embed Size (px)
Citation preview


CBOA
S T U D Y
The Economics of Climate Change:A Primer
April 2003
The Congress of the United States # Congressional Budget Office

NoteCover photo courtesy of the National Aeronautics and Space Administration.
Preface
A scientific consensus is emerging that rising atmospheric concentrations of greenhousegases are gradually changing the Earth’s climate, although the magnitude, timing, and effectsof the alteration remain very uncertain. The prospect of long term climate change raises a varietyof domestic and international economic policy issues on which there is little accord. Considerabledisagreement exists about whether to control greenhouse gas emissions, and if so, how and byhow much; and whether to coordinate climate related polices at the international level, and ifso, through what mechanisms.
This Congressional Budget Office (CBO) study—prepared at the request of the Ranking Memberof the House Committee on Science—presents an overview of issues related to climate change,focusing primarily on its economic aspects. The study draws from numerous published sourcesto summarize the current state of climate science and provide a conceptual framework foraddressing climate change as an economic problem. It also examines public policy options anddiscusses the potential complications and benefits of international coordination. In keeping withCBO’s mandate to provide impartial analysis, the study makes no recommendations.
Robert Shackleton of CBO’s Macroeconomic Analysis Division wrote the study. CBO staffmembers Robert Dennis, Terry Dinan, Douglas Hamilton, Roger Hitchner, Arlene Holen, KimKowalewski, Mark Lasky, Deborah Lucas, David Moore, John Sturrock, Natalie Tawil, andThomas Woodward provided valuable comments and assistance, as did Henry Jacoby of theMassachusetts Institute of Technology and Thomas Schelling of the University of Maryland atCollege Park. The comments of Chris Webster and John Reilly of the Massachusetts Instituteof Technology and Mort Webster of the University of North Carolina at Chapel Hill wereparticularly helpful in developing the discussion of uncertainty.
Leah Mazade edited the study, and Christine Bogusz proofread it. Kathryn Winstead preparedthe study for publication, and Annette Kalicki produced the electronic versions for CBO’s Website.
Douglas Holtz EakinDirector
April 2003
This study and other CBO publicationsare available at CBO's Web site:
www.cbo.gov


1
2
3
4
CONTENTS
Summary and Introduction 1
Common Resources: Addressing a Market Failure 1
Balancing Competing Uses 2
Policy Options 3
International Coordination 3
The Scientific and Historical Context 5
The Greenhouse Effect, the Carbon Cycle,
and the Global Climate 5
Historical Emissions and Climate Change 9
What the Future May Hold 15
Potential Responses 19
Types of Uncertainty 20
The Economics of Climate Change 23
Common Resources and Property Rights 23
Economic Trade Offs 25
Distributional Issues 33
Trade-Offs Among Policy Options 35
Taxes and Permits: Similarities and Differences 36
The Distributional Effects of Regulation 37
Alternative Uses of Revenues 39
Regulation and Innovation 41
Ancillary Benefits of Greenhouse Gas Restrictions 42

vi THE ECONOMICS OF CLIMATE CHANGE: A PRIMER
5 International Coordination of Climate Policy 43
International Policy Considerations 43
International Institutions to Address Climate Change 46
Actions by the United States 49
Alternative Approaches 49
Appendix
Economic Models and Climate Policy 53
References 57

CONTENTS vii
Figures
1. The Atmospheric Energy Budget and the Greenhouse Effect 6
2. Carbon Dioxide and Temperature 8
3. The Carbon Cycle 10
4. Uncertainty in Projections of Regional Populationand Economic Growth 13
5. Uncertainty in Projections of Regional Carbon DioxideEmissions and Emissions Intensity 14
6. Range of Uncertainty in Economic and Carbon DioxideEmissions Projections 16
7. Historical and Projected Climate Change 17
Boxes
1. Discounting and the Distant Future 28
2. An Example of Integrated Assessment 30

1Summary and Introduction
Human activities—mainly deforestation and theburning of fossil fuels—are releasing large quantities ofwhat are commonly known as greenhouse gases. Theaccumulation of those gases is changing the compositionof the atmosphere and is probably contributing to a gradual warming of the Earth’s climate—the characteristicweather conditions that prevail in various regions of theworld. Scientists generally agree that continued populationgrowth and economic development over the next centurywill result in substantially more greenhouse gas emissionsand further warming unless measures are taken to constrain those emissions.
Despite the general consensus that some amount of warming is highly likely, extensive scientific and economic uncertainty makes predicting and evaluating its effects extremely difficult. Because climate is generally a regionalphenomenon, the effects of warming would vary by region. Moreover, some effects could be positive and somenegative. Some could be relatively minor and some severein their impact: warming could raise sea levels; expandthe potential range of tropical diseases; disrupt agriculture,forestry, and natural ecosystems; and increase the variability and extremes of regional weather. There is alsosome possibility of unexpected, abrupt shifts in climate.Actual outcomes will probably be somewhere in the middle of the range of possibilities, but the longer thatemissions grow unchecked, the larger the effects are likelyto be.
A variety of technological options are available to restrainthe growth of emissions, including improvements in theefficiency of people’s use of fossil energy, alternative energytechnologies such as nuclear or renewable power, methods
for removing greenhouse gases from smokestacks, andapproaches to sequestering gases in forests, soils, andoceans. But those alternatives are likely to be costly, andthey are unlikely to be widely implemented unless measures are taken to lower their price or to raise the price ofgreenhouse gas emissions.
This Congressional Budget Office (CBO) study presentsan overview of the issue of climate change, focusingprimarily on its economic aspects. The study draws frommany published sources to summarize the current stateof climate science. It also provides a conceptual frameworkfor considering climate change as an economic problem,examines public policies and the trade offs among them,and discusses the potential complications and benefits ofinternational coordination.
Common Resources: Addressinga Market FailureThe Earth’s atmosphere is a global, open access resourcethat no one owns, that everyone depends on, and thatabsorbs emissions from an enormous variety of naturaland human activities. As such, it is vulnerable to overuse,and the climate is vulnerable to degradation—a problemknown as the tragedy of the commons. The atmosphere’sglobal nature makes it very difficult for communities andnations to agree on and enforce individual rights to andresponsibilities for its use.
With rights and responsibilities difficult to delineate andagreements a challenge to reach, markets may not developto allocate atmospheric resources effectively. It may therefore fall to governments to develop alternative policies for
CHAPTER

2 THE ECONOMICS OF CLIMATE CHANGE: A PRIMER
addressing the risks from climate change. And becausethe causes and consequences of such change are global,effective policies will probably require extensive cooperation among countries with very different circumstancesand interests.
However, governments may also fail to allocate resourceseffectively, and international cooperation will be extremelyhard to achieve as well. Developed countries, which areresponsible for the overwhelming bulk of emissions, willbe reluctant to take on increasingly expensive unilateralcommitments while there are inexpensive opportunitiesto constrain emissions in developing countries. But developing nations, which are expected to be the chief sourceof emissions growth in the future, will also be reluctantto adopt policies that constrain emissions and therebylimit their potential for economic growth—particularlywhen they have contributed so little to the historical risein atmospheric greenhouse gas concentrations and maysuffer disproportionately more of the negative effects ifnothing is done.
Balancing Competing UsesThe atmosphere and climate are part of the stock ofnatural resources available to people to satisfy their needsand wants over time. From an economic point of view,climate policy involves measuring and comparing thevalues that people place on resources, across alternativeuses and at different points in time, and applying theresults to choose a course of action. An effective policywould balance the benefits and costs of using the atmosphere and distribute those benefits and costs among peoplein an acceptable way.
Uncertainty about the scientific aspects of climate changeand about its potential effects complicates the challengeof developing policy by making it difficult to estimate orbalance the costs of restricting greenhouse gas emissionsand the benefits of averting climate change. (Some of therisks involved, moreover, may be effectively impossibleto evaluate or balance in pecuniary terms.) Nevertheless,assessments of the potential costs and benefits of a warming climate typically conclude that the continued growthof emissions could ultimately cause extensive physical andeconomic damage. Many studies indicate significant benefits from undertaking research to better understand the
processes and economic effects of climate change and todiscover and develop new and better technologies to reduce or eliminate greenhouse gas emissions.
At the same time, such studies typically find relativelysmall net benefits from acting to reduce greenhouse gasemissions in the near term. In balancing alternative investments, they conclude that if modest restrictions on emissions were implemented today, they would yield net benefits in the future; however, more extensive restrictionswould crowd out other types of investment, reducing therate of economic growth and affecting current and futuregenerations’ material prosperity even more than theaverted change would. As income and wealth grow andtechnology improves, the studies say, future generationsare likely to find it easier to adapt to the effects of a changing climate and to gradually impose increasingly strictrestraints on emissions to avoid further alteration.
Those conclusions greatly depend, among other things,on how one balances the welfare of current generationsagainst that of future generations. In assessments of costsand benefits occurring at different points in time, thatprocess of weighting is typically achieved by using aninterest, or discount, rate to convert future values to present ones. But there is little agreement about how to discount costs and benefits over the long time horizonsinvolved in analyzing climate change.
Whatever weighting scheme is chosen, consistency callsfor applying it to all long term investment alternatives.For example, applying a lower discount rate to give moreweight to the welfare of future generations implies thatsociety should reduce its current consumption and increaseits overall rate of investment in productive physical andhuman capital of all kinds—not only those involved inensuring a beneficial future climate.
Government policies that deal with use of the atmosphereinevitably affect the distribution of resources. Inactionbenefits people who are alive today while potentially harming future generations. Reducing emissions now maybenefit future generations while imposing costs on thecurrent population and may benefit countries at relativelyhigher risk of adverse effects from warming while hurtingthose that stand to gain from it. Restraints on emissionswould impose costs on nearly everyone in the global
CHAPTER ONE SUMMARY AND INTRODUCTION 3
economy, but they would affect energy producing andenergy intensive industries, regions, and countries muchmore than they would others. However, many studies ofthe costs and benefits of climate change fail to highlightthe extent to which differences in geographic and economic circumstances complicate the balancing of interests.
Policy OptionsGovernments may respond to climate change by adoptinga “wait and see” approach, by pursuing research programsto improve scientific knowledge and develop technologicaloptions, by regulating greenhouse gas emissions, or byengaging in a combination of research and regulation. TheUnited States has invested in research and subsidized thedevelopment of carbon removal and alternative energytechnologies. Furthermore, some programs that were intended to achieve other goals, such as pollution reduction,energy independence, and the limitation of soil erosion,also discourage emissions or encourage the removal ofgreenhouse gases from the atmosphere. However, otherprograms have opposing effects.
Should a government decide to control emissions, it maychoose from a broad menu of regulatory approaches. Oneoption is direct controls, which set emissions standardsfor equipment and processes, require households and businesses to use specific types of equipment, or prohibit themfrom using others. A government could also adopt moreindirect, incentive based approaches, either singly or incombination—for example, by restricting overall quantities of emissions through a system of permits or by raisingthe price of emissions through fees or taxes. Incentivebased approaches are generally more cost effective thandirect controls as a means of regulating greenhouse gasemissions.
Uncertainty about the costs and benefits of regulationaffects the relative advantages of different incentive basedapproaches. Some research indicates that such uncertaintygives a system of emissions pricing economic advantagesover a quota system that fixes the quantity of emissions.Those advantages stem from two facts: both the costs andbenefits of reducing greenhouse gas emissions are uncertain; and the incremental costs—the additional costs ofreducing an additional ton of emissions—can be expectedto rise much faster than the incremental benefits fall.
Under those circumstances, the cost of guessing wrongabout the appropriate level of taxes—and, perhaps, of failing to reduce emissions enough in any given year—is likelyto be fairly low. But the cost of miscalculating the appropriate level of emissions—and perhaps imposing an overlyrestrictive and hence expensive limit—could be quite high.
A system of emissions pricing has several other advantagesover one of emissions quotas. Pricing could raise significant revenues that could be used to finance cuts in distortionary taxes—such as those on income—that discouragework and investment. Moreover, emissions pricing moreeffectively encourages the development of technologiesthat reduce or eliminate emissions than direct controlsor strict limits on emissions do.
Restricting greenhouse gas emissions would tend to reduceemissions of some conventional pollutants as well, yieldinga variety of ancillary benefits, such as improvements inhealth from better quality air and water. Those additionalbenefits would partly offset the costs of greenhouse gasregulations, particularly in developing countries that havesignificant problems with local pollution.
The distributional effects of emissions regulations woulddepend on the type and stringency of the regulations andcould be very large relative to how much the policy improved people’s well being. Those potential effects mightspur the affected parties to engage in rent seeking—vyingfor regulatory provisions that would provide them withtax exemptions, access to permits, and so on. An emissionspricing system (based either on taxes or on auctioned permits) would benefit different groups in different ways,depending on how the government returned the receiptsto the economy. Certain ways of using the revenues couldoffset some—but probably not all—of the costs of regulation. (For example, if the government issued permits freeof charge, even permit recipients who were heavily regulated could benefit from the regulation.)
International CoordinationBecause the causes and consequences of climate changeare global in nature, effective policies to deal with it willprobably require extensive international coordinationamong countries with very different circumstances andinterests. Coordination may involve formal treaties or

4 THE ECONOMICS OF CLIMATE CHANGE: A PRIMER
nonbinding agreements and could range from modestcommitments to engage in research to more extensiveprograms to restrict emissions, monitor compliance, andenforce penalties.
Effective international agreements typically involvestraightforward commitments and distribute costs in away that is acceptable to participating countries. Bindingcommitments with explicit penalties may be more likelythan nonbinding ones to ensure compliance, but nonbinding agreements may also significantly affect a nation’s actions. Many factors will influence the effectiveness of international cooperation, particularly the size and distributionof the costs and benefits of mitigating climate change andthe strength of conflicting interests. Successful cooperationwould entail frequent interaction among national representatives and link discussion of climate issues with thatof related problems.
An international system of emissions controls could drawon the same set of options that domestic regulation employs—direct controls, emissions taxes or permits, or ahybrid system—or it could allow each country to chooseits own independent system. Much of the internationaldebate in recent years has focused on strictly limitingemissions through national quotas, with or without theinternational trading of emissions rights. However, quantitative limits are likely to prove more costly than approaches that affect emissions indirectly by raising theirprice. And because there are low cost opportunities toreduce emissions throughout the world and because fossilfuels can be transported relatively easily, a system thatraised the price of emissions everywhere would probablybe more cost effective than one that applied only to alimited set of countries.
International cooperation on the issue of climate changehas been developing since the Intergovernmental Panelon Climate Change was created in 1988. And nearly allnations, including the United States, are signatories to theUnited Nations Framework Convention on ClimateChange, which commits them to undertake research andprevent dangerous changes in the Earth’s climate. In 1997,negotiators signed the Kyoto Protocol (a draft treaty) tothe convention, under which developed countries agreedto limit emissions while developing countries remained
exempt from restrictions. However, subsequent negotiations collapsed in 2000 over details of implementation,and the United States withdrew from the talks in 2001.Ironically, that withdrawal made some of the positionsthat the United States had advocated much more attractiveto the remaining parties and helped them reach agreementon nearly all outstanding implementation issues. TheEuropean Union and Japan ratified the protocol in mid2002; it will go into force if Russia follows suit.
The protocol’s implementation would establish a complexset of emissions rights for a limited set of developed countries for the period 2008 through 2012. It would also putinto place institutions to oversee international financialtransfers amounting to several billion dollars per year forthe purchase of emissions allowances, mainly among thedeveloped countries. However, the protocol would limitparticipating countries’ overall emissions by only a smallamount and would have essentially no effect on the growthof emissions in the United States and in developing countries.
Analysts have proposed a variety of alternatives to the provisions of the Kyoto Protocol to try to improve the potential effectiveness of international cooperation and broadenits appeal. Each alternative simultaneously addresses theproblems of limiting emissions and distributing the burden of regulation, which remain the crucial sources of disagreement. Each option reflects a distinct interpretationof the available evidence about the net benefits of avertingclimate change in different regions and for different generations, as well as practical concerns about how climatepolicy would affect the global economy.
Some analysts argue for a laissez faire approach becausethey believe that the amount of warming is likely to besmall and its effects largely benign, or that near termaction is unwarranted in the light of scientific uncertainty.Other researchers have proposed systems of emissions taxesor tradable emissions permits that would be auctioned atfixed prices. In general, the permits would apply to developed countries and exempt developing nations on thegrounds of equity. Still other analysts have proposed complex systems that are intended to impose roughly uniformemissions prices throughout the world yet ensure thatdeveloped countries bear most of the cost.

2The Scientific and Historical Context
Scientists have gradually realized that a variety ofhuman activities are changing the composition of the atmosphere and may significantly affect the global climate.1
During the past decade, scientific research has greatly improved the state of knowledge about climate change, butsubstantial uncertainty about critical aspects of climatescience remains and will persist in spite of continued progress. That uncertainty contributes to differences of opinionwithin the scientific community about the potential forsignificant climate change and about its possible effects.
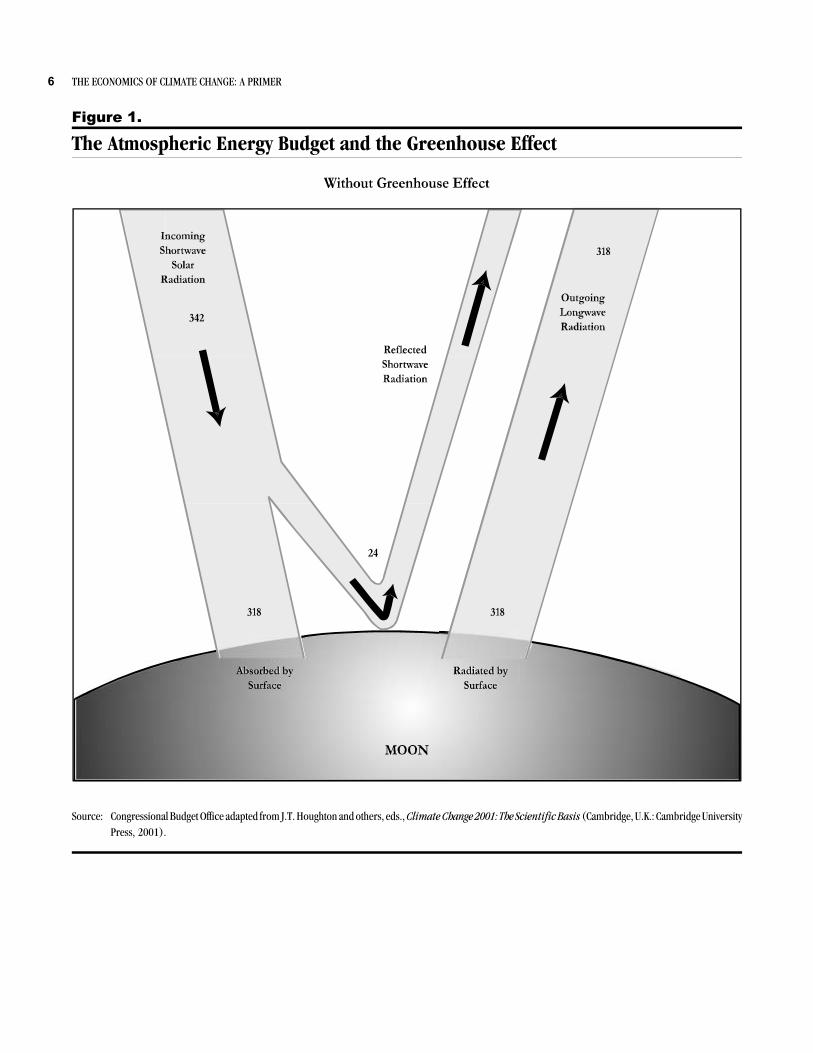
The Greenhouse Effect, the CarbonCycle, and the Global ClimateAs the Earth absorbs shortwave radiation from the Sunand sends it back into space as longwave radiation, naturally occurring gases in the atmosphere absorb some of theoutgoing energy and radiate it back toward the surface(see Figure 1). That phenomenon, which is called the“greenhouse” effect, currently warms the surface by anaverage of about 60º Fahrenheit (F), or 33º Celsius (C),creating the conditions for life as it exists on Earth. Watervapor is by far the most abundant greenhouse gas andaccounts for most of the warming effect. However, several
other trace gases also play a pivotal role in maintainingthe current climate because they not only act as greenhousegases themselves but also enhance the amount of watervapor in the atmosphere and thus amplify the effect. Thosetrace gases include carbon dioxide, methane (which alsocontains carbon), and nitrous oxide, as well as the manmade halocarbons, which contribute to the breakdownof stratospheric ozone and which, molecule for molecule,are very powerful greenhouse gases.2
The geologic record reveals dramatic fluctuations in greenhouse gas concentrations and in the Earth’s climate, onscales as long as millions of years and as short as just a fewyears. The record suggests a complicated relationshipbetween greenhouse gas concentrations and the Earth’sclimate. Warmer climates have usually been associatedwith higher atmospheric concentrations of greenhousegases and cooler climates with lower concentrations.(Figure 2 illustrates how carbon dioxide concentrationsand the antarctic climate have varied together over roughlythe past half million years.) However, the climate has oc
1. The discussion in this chapter is drawn mainly from a series ofreports prepared by the Intergovernmental Panel on ClimateChange, which summarize the current state of scientific and technical knowledge in that area. The most recent set of reports, whichare cited in detail in the reference list beginning on page 57, areHoughton and others (2001); McCarthy and others (2001); Metzand others (2001); and Watson and others (2001). Other sourcesare specifically noted. The Congressional Research Service (2001)provides another summary. For a short history of scientific researchon climate change, see Weart (1997).
2. Greenhouse gases differ in their ability to trap energy; they interactwith each other, and they stay in the atmosphere for different andvarying lengths of time. By convention, scientists apply a standardmetric to the gases by comparing their 100 year global warmingpotentials, or GWPs (the amount of warming that an incrementalquantity of a given gas would cause over the course of a century),with that of carbon dioxide. The convention is somewhat roughbecause the GWP of each gas is affected by the quantity of othergases, but it is used in international negotiations because of its simplicity. GWPs range from 1 for carbon dioxide to many thousandsfor halocarbons. Using 100 year GWPs, scientists convert quantitiesof other greenhouse gases to metric tons of carbon equivalent, ormtce.
CHAPTER
6 THE ECONOMICS OF CLIMATE CHANGE: A PRIMER
Figure 1.
The Atmospheric Energy Budget and the Greenhouse Effect
Source: Congressional Budget Office adapted from J.T. Houghton and others, eds., Climate Change 2001: The Scientific Basis (Cambridge, U.K.: Cambridge UniversityPress, 2001).

CHAPTER TWO THE SCIENTIFIC AND HISTORICAL CONTEXT 7
Figure 1.
Continued
Note: Numbers represent watts per meter squared (W/m2). With an atmosphere, 492 W/m2 (instead of 318 W/m2) reach the Earth’s surface because the atmosphereabsorbs radiation from the Earth and radiates it back. That process constitutes the greenhouse effect.
a. Includes thermals and evapotranspiration.

8 THE ECONOMICS OF CLIMATE CHANGE: A PRIMER
160
200
240
280
320
-450 -400 -350 -300 -250 -200 -150 -100 -50 0
Thousands of Years Before the Present
-12
-8
-4
0
4
-450 -400 -350 -300 -250 -200 -150 -100 -50 0
Thousands of Years Before the Present
Atmospheric Carbon DioxideCarbon Dioxide Concentration (Parts per million)Carbon Dioxide Concentration (Parts per million)
Temperature Over Antarcticaa
Temperature Relative to Present Climate (°C)
Figure 2.
Carbon Dioxide and Temperature
Source: Congressional Budget Office based on J. M. Barnola, C. Lorius Raynaud, and N.I. Barkov, “Historical CO2 Record from the Vostok Ice Core,” and J.R. Petitand others, “Historical Isotopic Temperature Record from the Vostok Ice Core,” in Department of Energy, Oak Ridge National Laboratory, Carbon DioxideInformation Analysis Center, Trends: A Compendium of Data on Global Change (2003), available at http://cdiac.esd.ornl.gov/trends/trends.htm.
a. Variations in antarctic temperatures are roughly double average global variations.

CHAPTER TWO THE SCIENTIFIC AND HISTORICAL CONTEXT 9
casionally been relatively warm while concentrations wererelatively low and cool while they were high. Moreover,climate change has occurred without alterations in greenhouse gas concentrations. Nevertheless, significant changesin concentrations appear to be nearly always accompaniedby changes in climate.3
The link between greenhouse gases and climate is greatlycomplicated by a variety of physical processes that obscurethe direction of cause and effect. Variations in the Sun’sbrightness and the Earth’s orbit affect the climate bychanging the amount of radiation that reaches the Earth.Clouds, dust, sulfates, and other particles from naturaland industrial sources affect the way radiation filters inand out of the atmosphere. Snow, ice, vegetation, and soilscontrol the amount of solar radiation that is directly reflected from the Earth’s surface. And the Earth’s vast oceancurrents, themselves partly driven by solar radiation,greatly influence climate dynamics. Moreover, the climatesystem exhibits so called threshold behavior: just as aminor change in balance can flip a canoe, relatively smallchanges sometimes can abruptly trigger a shift from onestable global pattern to a noticeably different one (Alleyand others, 2003).
Fluctuations in those physical processes affect the complexbalance among the reservoirs of carbon dioxide andmethane in the atmosphere and the larger reservoirs ofcarbon in the biosphere—which comprises soils, vegetation, and creatures—and in the oceans. Large quantitiesof carbon flow back and forth between those reservoirs,regulated by the seasons, winds, and ocean currents.4 Theflows maintain a rough equilibrium among the reservoirs,which all gradually adjust to other influences—and toinfluxes of carbon—over periods of decades to centuries.Other greenhouse gases, such as nitrous oxide, are partof similarly complex cycles.
In the absence of human activity, other, even larger reservoirs of carbon adjust only over thousands to millions
of years. They include fossil deposits of coal, oil, andnatural gas, which hold 10 to 20 times as much carbonas the atmosphere; deposits of methane hydrate in theocean floors, which contain perhaps 12 times as muchcarbon; and rocks that contain much more carbon thanall of the surface reservoirs, or “sinks,” combined (see Figure 3).
Over the past million and a half years, the Earth has experienced a period of “ice ages”—hundred thousand yearcycles of cooling and warming that are governed mainlyby variations in the Earth’s orbit around the Sun. Thatperiod, which is unusual in geologic history, has been accompanied by changes in greenhouse gas concentrationsthat interact with and magnify the effects of the orbitalvariations (Shackleton, 2000). Geologically speaking, themost recent ice age just ended: less than 20,000 years ago,large parts of North America and Eurasia were coveredby huge glaciers. Atmospheric concentrations of carbondioxide were only half of what they are today; averageglobal temperatures were roughly 7ºF to 9ºF (4ºC to 5ºC)lower; and the global climate was apparently drier andmuch more variable (Broecker and Hemming, 2001;Crowley, 1996; and Ganopolski and Rahmstorf, 2001).In addition, the trees and soils of the biosphere held perhaps one third less carbon than they do now; tropicalforests were much less extensive; and sea level was hundreds of feet lower.
All of recorded human history, as well as the developmentof agriculture, has occurred during a temporary interglacialperiod that began about 12,000 years ago and that hasbeen warmer and unusually stable by comparison withthe preceding cold period. Even during that stable interval,however, minor climatic changes have had substantial effects on preindustrial economies throughout the world.(For an extensive description of the effects of climatechange over history, see Lamb, 1995.)
Historical Emissions and Climate ChangeWith the onset of the industrial revolution more than twocenturies ago, people have begun to change the carboncycle significantly, increasing the amount of carbon dioxide in the atmosphere by about a third, or from roughly
3. See Falkowski and others (2000); Veizer, Godderis, and François(2000); Crowley and Berner (2001); and Zachos and others (2001).
4. Quantities of carbon in gases and elsewhere are measured in metrictons of carbon, or mtc. Mtc differs from mtce, which measureswarming potential rather than quantities of carbon.

10 THE ECONOMICS OF CLIMATE CHANGE: A PRIMER
Figure 3.
The Carbon Cycle
Source: Congressional Budget Office adapted from D. Schimel and others, "Radiative Forcing of Climate Change," Chapter 2 in J.T. Houghton and others, eds., ClimateChange 1995: The Science of Climate Change (Cambridge, U.K.: Cambridge University Press, 1996). The figure draws on data from Mustafa Babiker andothers, The MIT Emissions Prediction and Policy Analysis (EPPA) Model: Revisions, Sensitivities, and Comparisons of Results, Report no. 71 (Cambridge,Mass.: Massachusetts Institute of Technology Joint Program on the Science and Policy of Global Change, 2001); Department of Energy, Energy InformationAdministration, Annual Energy Review 2000, DOE/EIA-0384(2000) (November 2001); P. Falkowski and others, “The Global Carbon Cycle: A Test of OurKnowledge of Earth as a System,” Science, vol. 290, no. 5490 (October 13, 2000), pp. 291-296; J.T. Houghton and others, eds., Climate Change 2001: TheScientific Basis (Cambridge, U.K.: Cambridge University Press, 2001); R.A. Houghton and David L. Skole, “Carbon,” in B.L. Turner II and others, eds., TheEarth as Transformed by Human Action: Global and Regional Changes in the Biosphere over the Past 300 Years (Cambridge, U.K.: Cambridge UniversityPress, 1990), pp. 393-408; Keith A. Kvenvolden, “Potential Effects of Gas Hydrate on Human Welfare,” Proceedings of the National Academy of Sciences,vol. 96 (March 1999), pp. 3420-3426; Bert Metz and others, eds., Climate Change 2001: Mitigation (Cambridge, U.K.: Cambridge University Press, 2001);Edward D. Porter, Are We Running Out of Oil? Discussion Paper no. 81 (Washington, D.C.: American Petroleum Institute, December 1995); and World EnergyCouncil, Survey of Energy Resources, 19th ed. (London: World Energy Council, 2001), available at www.worldenergy.org/wec-geis/publications.
Note: Reservoirs of carbon are in billions of metric tons (shown in parentheses); flows of carbon (shown as arrows) are in billions of metric tons per year.

CHAPTER TWO THE SCIENTIFIC AND HISTORICAL CONTEXT 11
600 billion to 800 billion metric tons of carbon (mtc)—the highest amount in at least 400,000 years.5 About 30percent of the increase has come from cutting timber andclearing land for agriculture; the rest stems from extractingcoal, oil, and natural gas from the fossil reservoir andburning them.6 Atmospheric concentrations of methaneand nitrous oxide have also risen over the past two centuries—by about 150 percent and 16 percent, respectively—as a result of various agricultural and industrial activities. More recently, halocarbons have begun to accumulateas well. The combined effect of these additions to theatmosphere has been to enhance the greenhouse effectslightly by raising the amount of radiation at the Earth’ssurface by about 0.5 percent—with perhaps half of thatimpact offset by the effects of other human activities, suchas the cooling influence of sulfate emissions.
Current evidence indicates that since the mid 19th century, the average surface temperature of the Earth has risenby between 0.7ºF and 1.4ºF (0.4ºC and 0.8ºC). Thewarming trend has been most pronounced during the pastdecade and in higher latitudes. Ocean temperatures arealso rising, expanding the volume of water, and that expansion, combined with water from melting glaciers, hasraised global sea level by about four to 10 inches (10 to20 centimeters) over the past century.
Scientists generally agree that the observed warming isroughly consistent with the expected effects of changingconcentrations of greenhouse gases and other emissions.However, other phenomena also appear to be influencingthe Earth’s climate—for example, variations in the Sun’sbrightness and magnetic field, and poorly understoodfluctuations in the circulation of the oceans. As a result,
although scientists have dramatically improved theirunderstanding of the atmosphere, oceans, and climate inrecent years, they are uncertain about how much of theobserved warming is due to greenhouse gas emissions.They are even more uncertain about whether the warmingthat has occurred has caused more extreme weather, suchas more and bigger hurricanes, floods, and droughts.However, some evidence suggests that unusually warmconditions may have contributed to persistent droughtsin North America, Europe, and Asia between 1998 and2002 (Hoerling and Kumar, 2003).
Some researchers believe that if people immediately haltedemissions of greenhouse gases, gradual warming of theoceans would ultimately contribute to an additional warming of the atmosphere of between 0.9ºF and 2.7ºF, or0.5ºC and 1.5ºC (Mahlman, 2001, p. 8). Over the following centuries, the climate would return nearly to its preindustrial state, as the oceans gradually absorbed most ofthe extra carbon dioxide from the atmosphere and othergreenhouse gases broke down.
However, as the world’s population grows and the globaleconomy continues to industrialize, the pace of emissions—particularly of carbon dioxide—is accelerating. Theperiod since World War II has seen 80 percent of all carbon dioxide ever emitted from the burning of fossil fuels—and two thirds of the entire increase in atmosphericconcentrations (Marland, Boden, and Andres, 2002). During the 1990s, annual global emissions of greenhouse gasesran at about 10 billion metric tons of carbon equivalent(mtce; see footnote 2), and carbon dioxide concentrationsgrew by more than 4 percent. Fossil fuels accounted forabout 6 billion mtc per year; of that total, oil claimed ashare of 45 percent, natural gas, 20 percent; and coal, 35percent.7 Net deforestation contributed roughly 1 billionto 2 billion mtc annually (Watson and others, 2000,p. 32). About 2½ billion to 3 billion mtce per year ofother greenhouse gases, mostly methane, came from a widevariety of sources, mainly agricultural activities but also
5. Atmospheric concentrations of carbon dioxide are usually measuredin parts per million (ppm). In those terms, atmospheric carbondioxide has increased from about 280 ppm to about 370 ppm.
6. Estimates of emissions and reabsorption of carbon from land useare based on data for 1850 to 1990 from R.A. Houghton of theWoods Hole Research Center and an extrapolation based on datafrom Houghton and Skole (1990). Estimates of emissions fromfossil fuels are from Marland, Boden, and Andres (2002). Muchof the available data on greenhouse gas emissions, changes inatmospheric concentrations, and changes in temperature is availablefrom the Carbon Dioxide Information Analysis Center at http://cdiac.esd.ornl.gov/pns/pns_main.html. For a discussion of recentresearch, see Schimel and others (2001).
7. Coal contains about 80 percent more carbon per unit of energythan gas does, and oil contains about 40 percent more. For thetypical U.S. household, a metric ton of carbon equals about 10,000miles of driving at 25 miles per gallon of gasoline or about one yearof home heating using a natural gas fired furnace or about fourmonths of electricity from coal fired generation.

12 THE ECONOMICS OF CLIMATE CHANGE: A PRIMER
fossil fuel production, diverse industrial processes, andlandfills.
The international distribution of emissions from fossilfuels largely reflects the global pattern of economic development because fossil fuels have powered the dramaticincrease in industrial output and material well being thathas taken place in many nations over the past two centuries. In the United States, for instance, fossil fuels provided nearly 90 percent of all energy used in the 20thcentury, and they account for about 85 percent of theenergy used today. Developed, industrialized countries—the members of the Organisation for Economic Cooperation and Development (OECD) and of the formerSoviet bloc—are responsible for nearly 80 percent ofhistorical carbon emissions, even though they have onlyabout 20 percent of the world’s population. Historicallyspeaking, people in developed countries have emittedroughly 10 times more carbon per person than people indeveloping countries. Indeed, it is the technological accessto energy from fossil fuels that has helped make themroughly 10 times wealthier.
Yet the relationship between the use of fossil energy andeconomic prosperity is not a strict one. Countries thathave significant reserves of nonfossil energy, that rely onimports for much of their fuel supply, or that tax theconsumption of fuel tend to have lower emissions levels.Some high income countries have emissions levels perperson that are quite low: for instance, Sweden maintainsroughly the same standard of living as the United Statesdoes but emits only 30 percent as much carbon per person,largely by relying extensively on hydroelectric and nuclearpower. In contrast, countries that have large reserves offossil fuels or that subsidize their population’s consumption of fuel tend to have higher per capita emissions levels.Such nations include oil exporting countries and membersof the former Soviet bloc.
Nor is the relationship between economic growth andemissions a smooth one. Developing countries in the initial stages of industrialization tend to have fairly high levelsof emissions per dollar of output, because a large shareof their economic activity involves the energy intensivemanufacturing of metals, cement, and other basic commodities. In contrast, developed countries devote an increasing share of their resources to the production of lessenergy intensive outputs, including services. Economic
development therefore tends to involve rising energy intensity in its initial stages and falling energy intensity asthe efficiency of energy use and the service sector’s shareof economic activity grow (Holtz Eakin and Selden,1995). In the United States, for example, per capita emissions of carbon dioxide from fossil fuels grew nearly sevenfold between 1870 and 1920 but have grown by less thanone third since then and are roughly the same now as theywere 30 years ago.
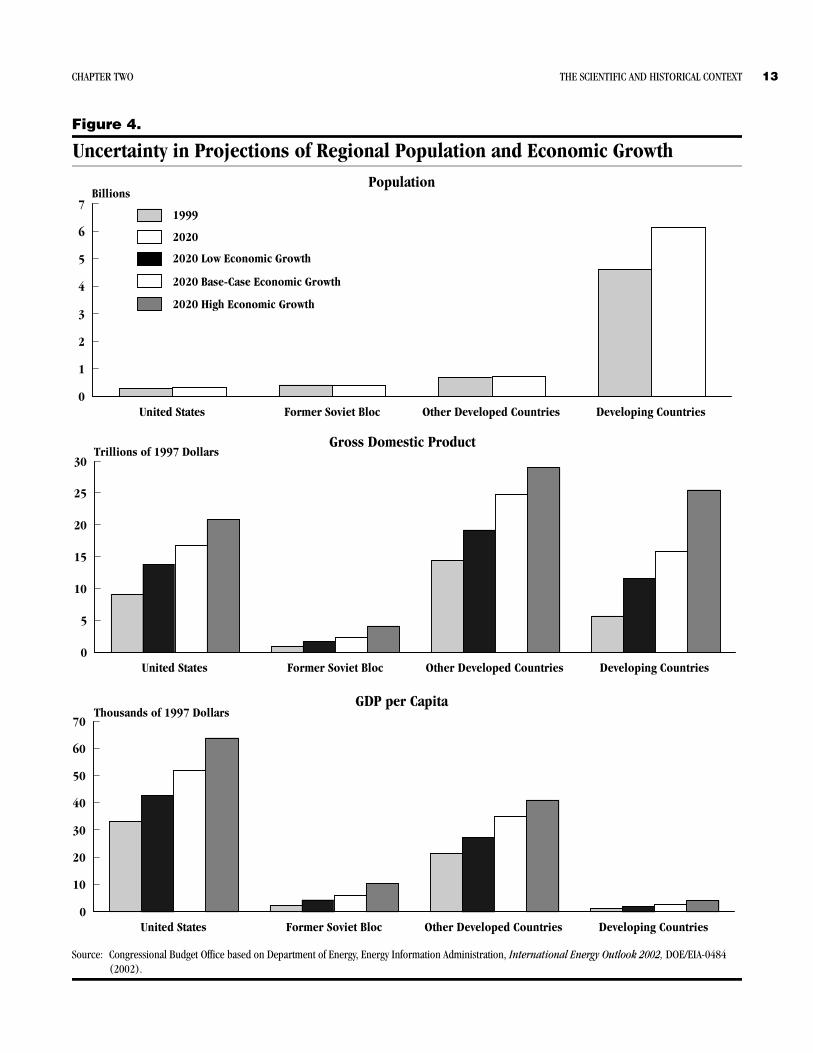
On a per person basis, OECD countries currently burnabout 3 mtc of fossil fuels per year—three times the worldaverage—with national figures ranging from over 5½ mtcper person for the United States to less than 1 mtc forMexico and Turkey.8 The former Soviet bloc countrieshad very high per capita emissions levels before their economic collapse but now average about 2 mtc per person—the figures range from nearly 3 mtc for Russia to less thana third of a ton for Armenia. Developing countries averageonly ½ mtc per capita annually—or one sixth the OECDaverage and only one tenth that of the United States. Thepoorest 2 billion people—one third of the world’s population—average less than a fifth of a ton annually, or theequivalent of about 80 gallons of gasoline. (Figures 4 and5 compare different regions’ populations, per capita economic activity, and per capita emissions, as well as rangesof uncertainty about those factors’ future growth.)
Because of their greater reliance on subsistence farmingand forestry, developing countries currently account formost of the world’s carbon dioxide and methane emissionsfrom land use. Even so, on a per capita basis, people indeveloping countries are responsible for far fewer greenhouse gas emissions than are their counterparts in the industrialized countries, and their total emissions levels arelower as well.
8. The United States accounts for nearly as many emissions as theformer Soviet bloc, the Middle East, Central and South America,and Africa combined. Use of fossil fuel in the United States is splitroughly into three categories: commercial and residential buildingsand appliances, industry, and transportation. More than a thirdof that fuel is used to generate electricity, two thirds of which goesto buildings and one third to industry (see Department of Energy,2002a). Other developed countries have somewhat different consumption patterns for fossil fuel, depending on their income levels,climates, and other factors.
CHAPTER TWO THE SCIENTIFIC AND HISTORICAL CONTEXT 13
Figure 4.
Uncertainty in Projections of Regional Population and Economic Growth
Source: Congressional Budget Office based on Department of Energy, Energy Information Administration, International Energy Outlook 2002, DOE/EIA-0484 (2002).
United States Former Soviet Bloc Other Developed Countries Developing Countries0
1
2
3
4
5
6
7
Population
United States Former Soviet Bloc Other Developed Countries Developing Countries0
5
10
15
20
25
30
United States Former Soviet Bloc Other Developed Countries Developing Countries0
10
20
30
40
50
60
70
Gross Domestic Product
GDP per Capita
1999
2020
2020 Low Economic Growth
2020 Base-Case Economic Growth
2020 High Economic Growth
Billions
Trillions of 1997 Dollars
Thousands of 1997 Dollars

14 THE SCIENTIFIC AND HISTORICAL CONTEXT
Figure 5.
Uncertainty in Projections of Regional Carbon Dioxide Emissions and Emissions Intensity
Source: Congressional Budget Office based on Department of Energy, Energy Information Administration, International Energy Outlook 2002, DOE/EIA-0484 (2002).
Note: All emissions are from fossil fuels.
Total Emissions
Emissions Intensity
1999
2020 Low Economic Growth
2020 Base-Case Economic Growth
2020 High Economic Growth
Billions of Metric Tons of Carbon
Metric Tons of Carbon Dioxide Emissionsper Thousand 1997 Dollars of GDP
Metric Tons of Carbon per PersonEmissions per Capita
United States Former Soviet Bloc Other Developed Countries Developing Countries0
0.1
0.2
0.3
0.4
0.5
0.6
0.7
0.8
0.9
United States Former Soviet Bloc Other Developed Countries Developing Countries0
1
2
3
4
5
6
7
United States Former Soviet Bloc Other Developed Countries Developing Countries0
1
2
3
4
5
6
CHAPTER TWO THE SCIENTIFIC AND HISTORICAL CONTEXT 15
What the Future May HoldRecent studies have estimated that the average globaltemperature is likely to rise by between 0.5ºF and 2.3ºF(0.3ºC and 1.3ºC) during the next 30 years (Zwiers,2002). Most of the warming during that period will bedue to emissions that have already occurred. Over thelonger term, the degree and pace of warming will dependmainly on future emissions. Given current trends in population, economic growth, and energy use, global emissionsare likely to increase substantially. The populations andeconomies of developing countries are growing rapidly,and their total greenhouse gas emissions could surpassthose of developed countries over the next generation orso—although on a per person basis, emissions from developing countries will continue at much lower levels thanemissions from developed countries for a long time tocome.
Even with substantial research, development, and adoptionof alternative energy technologies, fossil fuels are likelyto remain among the cheapest abundant energy resourcesfor many years. There are roughly 1,500 billion to 1,700billion mtc in proven coal, oil, and natural gas reservesthat can be extracted using current technology, along withan estimated 7,000 billion to 16,000 billion mtc in resources that might ultimately be recovered using advancedtechnology—not including reservoirs of methane hydrateunder the ocean.9 Without some sort of intervention, increasing levels of emissions—mainly of carbon dioxidefrom the use of fossil fuels—will continue to raise atmospheric concentrations of greenhouse gases for the foreseeable future.
To illustrate how concentrations might change over thenext century, a study for the Intergovernmental Panel onClimate Change presented a series of scenarios of greenhouse gas emissions, with cumulative carbon dioxideemissions from both developed and developing countriesranging from under 700 billion mtc to nearly 2,500 billion mtc (Nakiƒenoviƒ and Swart, 2000; see Figure 6). By2100, under the scenario with the lowest levels of emissions, atmospheric concentrations of carbon dioxide would
be about one third more than today’s levels; under thehigh emissions scenario, concentrations would be nearlytriple today’s. Under the more likely scenarios in themiddle of the range, carbon dioxide concentrations couldroughly double during the next century, to levels not seenin over 20 million years (Pearson and Palmer, 2000).Concentrations of other greenhouse gases are also likelyto grow by a considerable amount. Under the above rangeof emissions projections—to which the authors do notassign any probabilities—the average global temperaturecould rise over the next century by about 2ºF (1ºC) orby more than 9ºF (5ºC).10
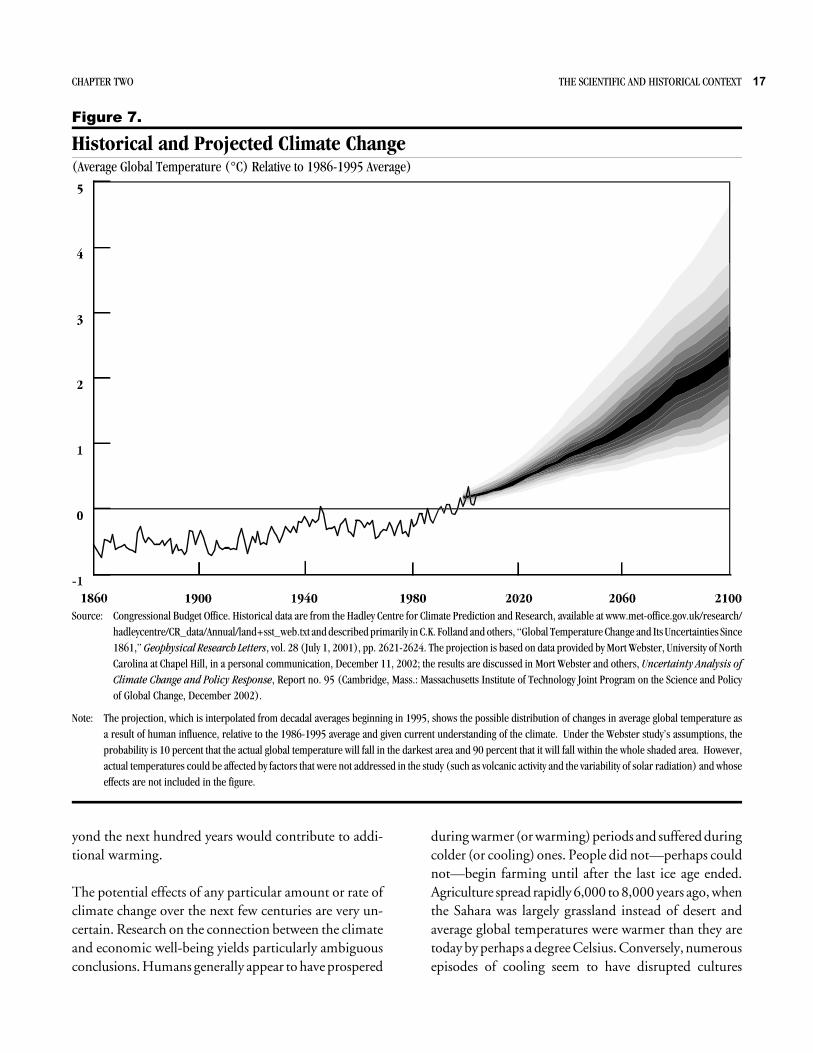
Other researchers have explicitly addressed a variety ofuncertainties in economic and climate forecasting; onerecent study projected an increase in the average globaltemperature of 4.3ºF (2.4ºC) between 1990 and 2100,with a 95 percent chance that the change will be between1.8ºF (1.0ºC) and 8.8ºF (4.9ºC) (Webster and others,2002; see Figure 7). The economic and physical factorsincluded in the study accounted for roughly similar sharesof the uncertainty surrounding the human contributionto warming by 2100. Other factors, including variationsin solar radiation and volcanic activity, could also influence the future climate in ways that are harder to quantify,but those factors were not included in the study.
At the low end of the projected range, the effects of climatechange would probably be relatively mild—although evenmodest warming might trigger an abrupt, larger thanexpected shift in weather patterns. At the high end of therange—an unlikely but possible prospect—the worldcould face an abrupt change in climate that would beroughly as large as the one at the end of the last ice agebut much more rapid. In the more plausible middle ofthe range, the effects of climate change might still be quitesignificant. Moreover, even if emissions were eliminatedbefore the end of the century, the oceans would continueto warm—and thus further warm the climate—for centuries thereafter. And, of course, continued emissions be
9. Those estimates are derived from Babiker and others (2001),Department of Energy (2001), Metz and others (2001), Porter(1995), and World Energy Council (2001).
10. The economic projections for developing countries that underlythose scenarios were criticized in an article appearing in the February 15, 2003, issue of The Economist. The criticism appears to bevalid but does not undermine the study’s main conclusions aboutthe range of possible climate change.

16 THE ECONOMICS OF CLIMATE CHANGE: A PRIMER
Figure 6.Range of Uncertainty in Economic and Carbon Dioxide Emissions Projections
Source: Congressional Budget Office based on Nebojša Nakiƒenoviƒ and Rob Swart, eds., Emission Scenarios (Cambridge, U.K.: Cambridge University Press, 2000).
Note: All emissions are from fossil fuels.
CHAPTER TWO THE SCIENTIFIC AND HISTORICAL CONTEXT 17
Figure 7.
Historical and Projected Climate Change(Average Global Temperature (°C) Relative to 1986-1995 Average)
Source: Congressional Budget Office. Historical data are from the Hadley Centre for Climate Prediction and Research, available at www.met-office.gov.uk/research/hadleycentre/CR_data/Annual/land+sst_web.txt and described primarily in C.K. Folland and others, “Global Temperature Change and Its Uncertainties Since1861,” Geophysical Research Letters, vol. 28 (July 1, 2001), pp. 2621-2624. The projection is based on data provided by Mort Webster, University of NorthCarolina at Chapel Hill, in a personal communication, December 11, 2002; the results are discussed in Mort Webster and others, Uncertainty Analysis ofClimate Change and Policy Response, Report no. 95 (Cambridge, Mass.: Massachusetts Institute of Technology Joint Program on the Science and Policyof Global Change, December 2002).
Note: The projection, which is interpolated from decadal averages beginning in 1995, shows the possible distribution of changes in average global temperature asa result of human influence, relative to the 1986-1995 average and given current understanding of the climate. Under the Webster study’s assumptions, theprobability is 10 percent that the actual global temperature will fall in the darkest area and 90 percent that it will fall within the whole shaded area. However,actual temperatures could be affected by factors that were not addressed in the study (such as volcanic activity and the variability of solar radiation) and whoseeffects are not included in the figure.
yond the next hundred years would contribute to additional warming.
The potential effects of any particular amount or rate ofclimate change over the next few centuries are very uncertain. Research on the connection between the climateand economic well being yields particularly ambiguousconclusions. Humans generally appear to have prospered
during warmer (or warming) periods and suffered duringcolder (or cooling) ones. People did not—perhaps couldnot—begin farming until after the last ice age ended.Agriculture spread rapidly 6,000 to 8,000 years ago, whenthe Sahara was largely grassland instead of desert andaverage global temperatures were warmer than they aretoday by perhaps a degree Celsius. Conversely, numerousepisodes of cooling seem to have disrupted cultures

18 THE ECONOMICS OF CLIMATE CHANGE: A PRIMER
throughout history. Europe prospered during a warmperiod that occurred in the Middle Ages, but it sufferedduring the colder Little Ice Age of between 300 and 800years ago.
Yet the past effects of climate change on preindustrialsocieties may not provide much information about itsfuture effects on technologically advanced societies—especially the effects of significantly greater warming.11
Researchers who study the sources of economic growthconsistently find that at least during the past half century,regions in temperate climates tended to prosper more thanregions in tropical ones, even after differences in levels ofincome and education, rates of saving and investment,and other factors were taken into account. (For example,Masters and McMillan, 2000, and Sala i Martin, 1997,discuss the positive correlation between temperate climateand economic development.)
When considered as a whole, the historical and statisticalevidence suggests that a warmer global climate—as wellas the period during which warming occurred—couldhave both beneficial and harmful effects. One global effectwould be generally harmful: sea levels would rise as glaciersmelted and the oceans warmed and expanded. The gradualinundation of seashores would create problems for countries (particularly low lying island nations), regions, andcities that were mostly near sea level. In the middle of therange of climate change described earlier, sea level wouldrise by up to 1½ feet (50 centimeters) over the next century. And even if emissions were eliminated after 2100,thermal expansion of the oceans could ultimately raise sealevel by roughly 6 feet (2 meters) over a few centuries.
Because climate is generally a regional phenomenon, however, the effects of climate change would vary by region—and be even more uncertain than the effects globally. Ifwarming followed recent patterns, it would tend to beconcentrated in colder areas and periods—near the poles,in the winter, and at night—but daylight temperatures
in the tropics during the summer would also rise.12 Asomewhat warmer Earth would probably have more rainfall, and the resulting moderately warmer, wetter climate—combined with more carbon dioxide in the atmosphere—would probably improve global agricultural productivity overall. Nevertheless, dramatic warming couldreduce the yields of important food crops in most of theworld. Shifts in weather patterns would probably causemore heat waves and droughts in some regions, whichwould substantially reduce their crop yields and suppliesof drinking water as well as exacerbate the effects of urbanair pollution. Other areas would experience more flooding.Moreover, as Alley and others (2003) discuss, the climate’sresponse to rising concentrations of greenhouse gases couldinvolve unexpectedly large and abrupt shifts, which wouldbe much more disruptive and costly to adapt to thanwould gradual changes.
People in developing countries are probably more vulnerable to the damaging effects of climate change thanare people in developed countries, in large part becausethey have fewer resources for coping with the impacts. Inaddition, a number of developing countries have largepopulations that are either concentrated in low lyingregions vulnerable to a rise in sea level or flooding or thatsubsist on marginal agricultural lands vulnerable todrought.
In contrast, industrial economies can draw on many moreresources to ease the adaptation to changes in climate.Moreover, recent comprehensive study of the potentialimpacts of climate change suggests that for a 4.5/F (2.5/C)increase in average global temperature, some developedcountries could actually experience economic benefitsbecause warming would improve climates for agriculture(Nordhaus and Boyer, 2000). The United States couldexperience a loss of about half a percent of total income;the poorest developing countries could experience lossesof more than 2.5 percent—and from much lower levelsof income per person than those of developed countries.
11. Moore (1998) describes the potentially beneficial effects of warmclimates. Richerson and others (2001) discuss the relationshipbetween warming and the development of farming. Lamb (1995)addresses the broader effects of climate over human history.
12. Until recently, evidence from fossils indicated that tropical weatherwas relatively insensitive to global climate change. However, research by Kump (2001) suggests that tropical regions are, indeed,affected.

CHAPTER TWO THE SCIENTIFIC AND HISTORICAL CONTEXT 19
But point estimates like those conceal a great deal of uncertainty. As an example, estimates of the effects on theUnited States of a rise of 4.5/F (2.5/C) in average globaltemperature range from a loss of 1.5 percent of grossdomestic product to a gain of 1.0 percent.13 For particulartemperate regions of the United States, the likely changesin temperature and rainfall and the possible intensity ofextreme weather conditions are very poorly understood.For example, recent reviews of the potential regional effects of climate change in the United States (NationalAssessment Synthesis Team, 2000, and Department ofState, 2002) found that rainfall and summer soil moisturemight rise significantly in much of the Midwest, or itmight fall significantly.
In addition, some researchers fear that climate changemight occur so rapidly that some types of plants—mostnotably, in marginal ecosystems such as alpine meadowsand barrier islands and in immobile ecosystems such ascoral reefs—would not be able to adapt to the altered climate and would disappear. Migratory animals, birds, andinsects could be similarly affected.14 Moreover, warmingwould probably increase the natural range of insect bornediseases that are now found mainly in warmer regions.
Finally, among the most worrisome possible consequencesof rising greenhouse gas concentrations is the potentialdisruption of deep ocean currents that strongly influencethe global climate. Those currents are directed partly bythermohaline circulation; that is, the evaporation or freezing of seawater in various regions leaves the remainingwater increasingly salty, and therefore dense, and it sinksinto the deep. Warmer weather could slow or even stopthe current pattern of thermohaline circulation by increasing rainfall and reducing the formation of sea ice in theNorth Atlantic.
Northern Europe appears to be particularly vulnerableto such a change because its relatively warm, rainy weatherdepends on the northerly flow of warm water from theGulf Stream, which in turn is linked to thermohalinecirculation in the North Atlantic. An abrupt halt of thatcirculation—such as the halt that occurred after the lastice age, as the climate warmed up—could seriously disruptthe flow of warm water into the North Atlantic, leadingto much colder weather in parts of North America andEurope for decades or centuries coupled with greaterwarming elsewhere in the world. (Clark and others, 2001,discuss that scenario.) Most climate models project thatthe North Atlantic thermohaline circulation will weakenduring the next century because of higher levels of rainfallin a warmer climate. However, they do not predict acomplete shutdown over that period.
Potential ResponsesTo control the long run growth of greenhouse gas concentrations in the atmosphere, countries could either limitemissions or develop means of drawing greenhouse gasesback out of the atmosphere after they were emitted. Onesignificant remedy would be to control the long rungrowth of fossil fuel use. There are many alternatives tocurrent patterns of energy use, including technologies thatcould make that use more efficient and others that couldexploit alternative energy sources—for example, solar energy, wind, biomass, and hydroelectric and nuclear power.However, expanding the reliance on any of those alternatives is relatively expensive compared with the market costof using fossil fuels. Restrictions on such use would therefore impose economic costs—costs that would rise withthe stringency of the restrictions and would climb particularly quickly if extensive controls were imposed in theshort run. Over the longer term, control of fossil fuel usewill depend on the development of relatively inexpensivealternative energy technologies (Edmonds, 2002).
Because plants absorb carbon dioxide from the atmosphere, countries could sequester carbon by planting andgrowing trees and partly offset emissions from the burningof fossil fuels. (Scholes and Noble, 2001, and McCarl andSchneider, 2001, discuss the role of sequestration in limiting carbon dioxide emissions.) In theory, the potentialfor sequestration in forests is very large: if people couldreplant all of the forest land around the world that has
13. Nordhaus (1994, 1998a,b), Nordhaus and Boyer (2000),Mendelsohn and Neumann (1999), and Moore (1998) discussthose cost estimates.
14. That problem could be aggravated by the environmental stressesof population growth and industrialization. As Field (2001)discusses, under an intermediate definition of appropriation, humanbeings already appropriate an estimated 10 percent to 55 percentof the energy transferred from plants to other life on Earth, andthat fraction is expected to grow in the future.

20 THE ECONOMICS OF CLIMATE CHANGE: A PRIMER
been cleared in the past two centuries and then leave theforests alone, the trees and soils could eventually trapmuch of the carbon that has accumulated in the atmosphere since the beginning of the industrial revolution.In practice, though, reforestation on that scale is infeasible:people need much of the land to grow crops and to liveon. Furthermore, people would continue to use fossil fuels,and all of the carbon sequestered in trees over severaldecades would be replaced in the atmosphere by the continued emissions. So carbon sequestration in forests andagricultural soils can only partially offset past and futurecarbon emissions from fossil fuels.
But forests can offer a partial alternative to fossil fuels asa source of energy. Although burning wood releases carboninto the atmosphere (and is relatively dirty and expensiveas well), the carbon is removed again as another tree growsin place of the one cut down, a cycle that could be repeated over and over. Thus, a wood lot capable of producing 1 mtc of renewable biomass fuel every 20 yearsor so could, over a century, replace 5 mtc from fossil fuelsthat would otherwise be emitted into the atmosphere.
Engineers have developed technologies to remove carbondioxide from the exhaust of a combustion process and tostore it underground or in the ocean. Those carboncapture technologies appear to be relatively straightforwardfor large emissions sources such as electric power generating plants, but they also significantly increase the costof generating power (Department of Energy, 1997).15
Geoengineering solutions, such as adding iron to oceansto fertilize the absorption of carbon by plankton, have alsobeen advanced. Some research suggests that iron fertilization may help reduce atmospheric concentrations of carbon dioxide, although its effectiveness and cost are veryuncertain, as are its potential side effects (Boyd and others,2000). Other geoengineering technologies, such as removing greenhouse gases directly from the atmosphere, areextremely expensive.
Some relatively simple and inexpensive options are available for controlling some emissions of greenhouse gasesother than carbon dioxide. However, controlling thosegases in a cost effective manner is considerably complicated by the fact that they come from so many differentand widespread agricultural, industrial, and other activities(Reilly, Jacoby, and Prinn, 2003).
Types of UncertaintyAs the preceding discussion emphasized, scientists andeconomists are very uncertain about the potential economic threat posed by a changing climate. Some of theuncertainty is scientific. For a given amount of greenhousegas emissions, what portion will accumulate in the atmosphere? How much will a given change in those concentrations affect the global climate? How will that globalchange be distributed throughout the world, and howrapidly will it occur? How much will regional climatechange affect sea level, agriculture, forestry, fishing, waterresources, disease risks, and natural ecosystems? Will risinggreenhouse gas concentrations increase the probability ofthreshold effects, which could suddenly shift the climateinto a significantly different global pattern?
Other sources of uncertainty are essentially economic.How rapidly will the world’s population and economiesgrow? How energy and land intensive will human activities be, and how much of the energy used for those activities will come from fossil fuels? How will policies tocontrol emissions of greenhouse gases or to encouragetechnological developments affect the accumulation ofgases in the atmosphere? And how much will those policiescost? At a deeper level, how will future generations valuethe effects of averting climate change? Future generationsare likely to be wealthier, on average, than people are todayand thus better able to adjust to changes in climate. Butthey might also have been willing to forgo some of theiraffluence to have their natural surroundings and climatepreserved.
Researchers’ increased understanding of climate changehas often uncovered areas of inquiry whose importancehad previously gone unrecognized. In that respect, greaterknowledge has sometimes served to expand the range ofscientific and economic unknowns, even as it has resolved
15. An extensive discussion of technological options and the costs ofcapturing and sequestering carbon dioxide from power plants canbe found at the Web site of the International Energy Agency’sGreenhouse Gas Research and Development Programme atwww.ieagreen.org.uk/index.htm.

CHAPTER TWO THE SCIENTIFIC AND HISTORICAL CONTEXT 21
specific issues (see Kerr, 2001, pp. 192 194). Because ofthat tendency, policymakers for the foreseeable future willcontinue to face great uncertainty in determining thepotential costs and effects of different policies to addressthe problem of climate change. Furthermore, policies that
explicitly take into account that range of uncertainty arelikely to be more effective than policies that do not.16
16. See Heal and Kriström (2002) for a more extensive discussion ofuncertainty and climate change.


3The Economics of Climate Change
The Earth’s atmosphere and climate are part of thestock of natural resources that are available to people tosatisfy their needs and wants over time. From an economicpoint of view, climate policy involves measuring and comparing people’s valuations of climate resources, acrossalternative uses and at different points in time, and applying the results to choose a best course of action. Effectiveclimate policy would balance the benefits and costs ofusing the atmosphere and climate and would distributethem among people in an acceptable way.
Common Resources and Property RightsProsperity depends not only on technological advancesbut also on developing legal, political, and economic institutions—such as private property, markets, contracts, andcourts—that encourage people to use resources to createwealth without fighting over or, in the case of renewableresources, significantly degrading them. The effectivenessof those institutions depends in part on characteristics ofthe resources. Market institutions do not work well whenresources have the characteristics of public goods—thatis, when it is difficult to prevent people from using theresources without paying for them (consumption is “nonexcludable”) and when the incremental cost of allowingmore users is near zero (consumption is “nonrival”).Market failures also arise when the many people using aresource affect each others’ use—for instance, when rushhour drivers create congestion and air pollution. (In thatcase, consumption is nonexcludable but rival.) Thosecharacteristics make property rights for public goods difficult to create and enforce. Private industry finds it relatively unprofitable to produce such goods, and consumershave relatively little incentive to maintain them.
The Earth’s oceans and air are particularly hard to carveup into private property, and in the ongoing process ofattempting to develop effective institutions to managethem, access to those resources has largely remained open—for the most part, no one owns them, anyone can usethem, and no one has to pay. For most of human history,open access to the oceans and air was appropriate becausethe world’s population was too small and its technologiestoo limited to deplete stocks of fish, degrade air quality,or affect the climate.
But population growth and advances in technology havechanged the way people use natural resources and madethem vulnerable to overuse, depletion, and degradation.If resources are free for the taking, people will tend tooveruse them; if nobody owns them, nobody will take careof them. That phenomenon is referred to as the tragedyof the commons: everyone wants to use free resources butwill degrade them if they do, to the detriment of all.
In the case of climate, people want to use the atmosphereto absorb greenhouse gases so that they may benefit fromcheap food and timber and from plentiful fossil energy.In the long run, however, that use may significantly degrade the climate.
An Example: Common Fishing ResourcesTo keep from overusing a common resource, people mustnegotiate and agree on rules about who may use it andhow much of which types of uses are acceptable. Fisheriesprovide a common, straightforward example of the problem: a fishing community may have to determine the sustainable level of fishing for each kind of fish and then limitcatches to those levels. Limits on fishing will reduce the
CHAPTER

24 THE ECONOMICS OF CLIMATE CHANGE: A PRIMER
market supply of fish and raise their market value. Peoplewho are allowed to keep fishing will reap a windfall profiton the fish they can legally catch. (Cheaters, or “freeriders,” who catch more than their allowance will also getwindfall profits.) In the meantime, anyone whose fishingis restricted is likely to sustain a loss.1 The community’schallenge is to reach a consensus about who gets to fishand how much; about whether, how, and how much tocompensate the losers to win their support; and about howto prevent free riders from catching extra fish and breakingdown the agreement. In short, the challenge is to negotiateand enforce a new set of property rights.
The task of developing and enforcing property rights generally falls to governments—and it may be further complicated if several countries are involved and internationalnegotiations are needed to resolve conflicts. Governmentsuse a variety of approaches to regulate fisheries, many ofwhich explicitly involve the technology of fishing. Forinstance, the government may restrict the size of fish thatcan be taken, prohibit the use of large dragnets, or requirethe use of handheld lines. Other regulatory strategies applymore directly to the market for fish. One alternative is tocreate and distribute a fixed number of fishing permitsthat limit recipients’ catches (see, for example, Newell,Sanchirico, and Kerr, 2002). Under that approach, fishermen may lose part of their previously unrestricted catch,but their losses are at least partly offset because greaterscarcity drives up the price of fish. Consumers lose bypaying more per fish for fewer fish. If the governmentauctions off the limited fishing rights to the highest bidders, fishermen will have to pay to fish; they will thus losethe profits they could have reaped from higher, scarcitydriven fish prices. However, the government will take inrevenue that it can use for various purposes, includingpartially compensating consumers and fishermen.
Whether it distributes or sells them, a government cancreate private fishing rights (which recipients can buy andsell on open markets) or common property rights (inwhich a restricted group of people own the fishery togetherand can exclude everyone else from fishing). A government
can also keep or appropriate the common resource as apublic property under public management and create ause right—such as a fishing license or a catch limit—thatgives recipients temporary or limited access to theresource.
Another alternative for the government is to sell use rightsby levying a tax on fishing activity or a “landing fee” onfish catches. Because the tax becomes a cost of catchingfish, fishermen will raise the market price of their fish,consumers will buy fewer fish as the price rises, and thegovernment will receive tax revenues. As the demand forfish falls, fishermen will make less money, and some ofthem will be pushed out of the market. As in the case ofauctioned rights, the government will receive revenues thatit can use to partially offset consumers’ and fishermen’slosses, and fishing will be maintained at a sustainable level.
A Second Example: Common Air ResourcesAs a resource problem, air pollution is typically more complicated than overfishing. Unlike markets for fish, inwhich a product actually changes hands, people generallydo not buy and sell air, so there is no market price thatreflects the value of air. In addition, modest air pollutionmay hurt only some especially sensitive people, or it maycontribute to health problems in ways that are hard totrace back to it. Pollution levels may have to be very highbefore many people notice a problem and demand aremedy. Moreover, there may be many different types ofemissions from a variety of sources, so it can be difficultor even impossible to trace particular problems to particular origins.
For example, regional air pollution may come from powerplants, factories, buildings, trucks, and cars. Emissionsfrom cars alone can involve millions of drivers, each having a minor effect on the health of millions of people,including each other. No practical way exists for eachinhabitant to bargain with each driver over the minoreffect that that driver has on him or her.
Nor is it simple to measure the economic trade offsinvolved. The benefits from less pollution—improvedhealth, better visibility, and so on—are certainly real butnotoriously difficult to evaluate because they are generallynot bought and sold in markets. The relative costs of reducing emissions from different sources can also be hardto determine. And the people who enjoy the benefits of
1. Under certain circumstances, limits on fishing may drive up themarket price for fish to such an extent that it raises the total valueof the catch. In that case, it may be easier to get fishers to agreeto restrictions—although limits will raise costs for consumers.

CHAPTER THREE THE ECONOMICS OF CLIMATE CHANGE 25
lower pollution levels may not be the ones who incur thecosts.
Those complexities make it very difficult to determinethe costs and benefits of reducing air pollution and tobalance or distribute them in a politically acceptable way.Nor is it easy to develop standard property rights for airresources. As a result, people find it extremely challengingto use private markets to resolve conflicts over the use ofair resources. The fundamental problem is transactioncosts—the costs of motivating and coordinating exchanges; too many parties are involved in too many interactions to negotiate agreement in private markets. Hightransaction costs force governments to come up with otherapproaches to managing air pollution.
The Atmosphere and ClimateThe problem of climate change involves very large transaction costs. Emissions come from the land and energyusing activities of practically everyone in the world, andthe potential burden of their effects will be borne throughout the world by generations of people who are not evenborn. Moreover, many of the potential impacts of climatechange—the disruption of ecosystems and extinction ofspecies, for instance—are themselves public in nature.
Those factors make it very hard—if not impossible—toclearly define individual rights and responsibilities formany of the activities that may contribute to climatechange and the effects that may come from it. Certaintypes of rights, such as rights to emit greenhouse gases byburning fossil fuels, could be delineated without greatdifficulty. Other rights, such as credits for carbon storedin the soil and trees of a forest stand or in the ocean, wouldbe more complicated to define. Still others—such as theright to enjoy a particular type of climate in a particularpart of the world at a particular time—would be impossible. Without clearly delineated, enforceable rights, individuals cannot easily bargain with one another in marketsto resolve their conflicting claims. And as Chapter 2 discussed, the scientific and economic uncertainty involvedmakes climate trade offs extremely difficult to evaluate.
In sum, policymakers may be faced with the extraordinarily complicated task of managing a resource that noone owns, that everyone depends on, and that providesa wide range of very different—and often public—benefitsto different people in different regions over very long
periods, benefits for which property rights would be verydifficult to define, agree on, and enforce. The causes andconsequences of climate change are international, and thatfact has several ramifications: governments will probablyhave to cooperate for any management approach to beeffective; for some time to come, they will have only veryimperfect information on which to base decisions; andtheir decisions may affect the world for centuries. If governments decided that the risks associated with climatechange called for action, they might have to persuadepeople to make sacrifices today to benefit future generations.
Reaching collective agreement on a policy involving useof the atmosphere and climate change is an immensechallenge because everyone has an incentive to “free ride.”A successful agreement need not require equal action byall parties, but an agreement of any kind will break downif some parties sacrifice to meet an overall goal and otherparties cheat, increasing their emissions in violation of thegoal. Moreover, without a clear sense of whether, when,and by how much emissions should be constrained,nations will find it very hard to agree on the appropriatelevel of action. Equally important, nations have very different historical and economic circumstances; they varywidely in their ability and willingness to bear the cost ofreducing emissions—or the possible costs of climatechange. These factors help explain the great difficultynations are experiencing in trying to reach agreement ona distribution of rights and responsibilities.
Further complicating any collective agreement is the factthat governments generally are not subject to the marketforces that drive competitive firms to efficiently providethe goods and services that consumers most want to buy.Instead, governments tend to represent coalitions of private and bureaucratic interests that often engage in rentseeking behavior—attempting to redirect the economy’sresources to their own advantage. As a result, governmentsdo not necessarily provide the public services most desiredby consumers; nor do they provide them at the lowest cost.There is consequently no guarantee that governments willbe better than markets at managing common resources.
Economic Trade-OffsEconomic valuation is inherently about measuring tradeoffs—among people and resources and across time. Re
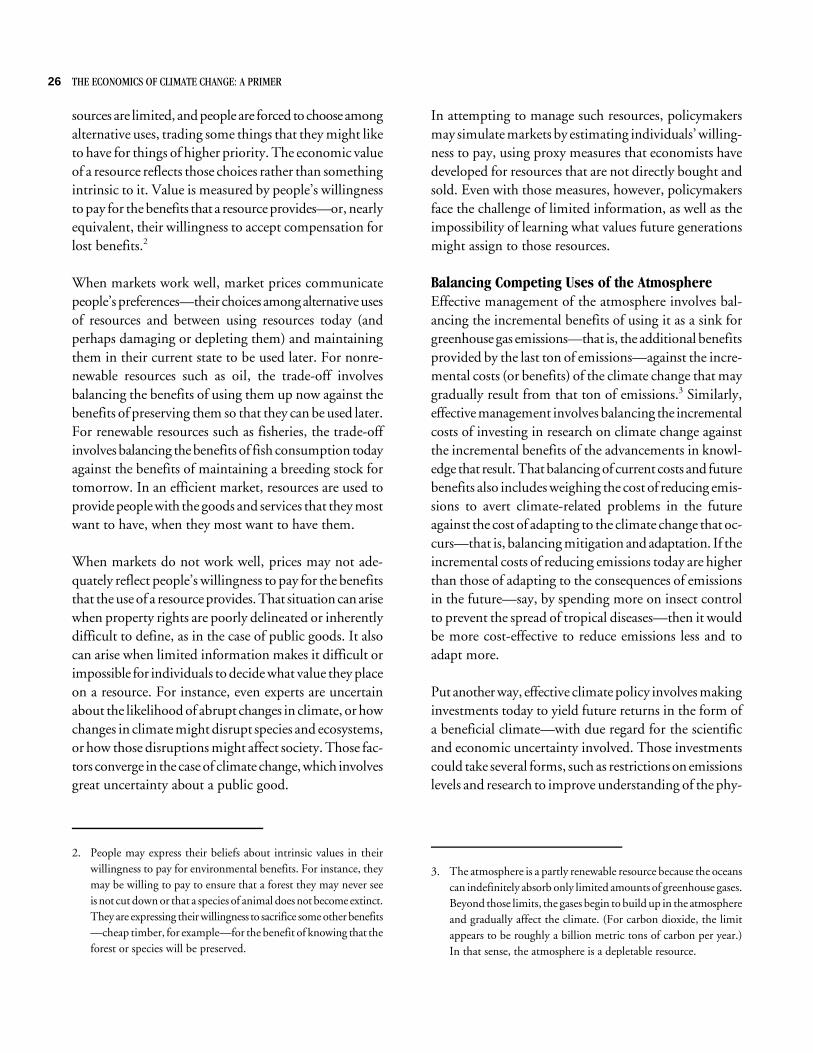
26 THE ECONOMICS OF CLIMATE CHANGE: A PRIMER
sources are limited, and people are forced to choose amongalternative uses, trading some things that they might liketo have for things of higher priority. The economic valueof a resource reflects those choices rather than somethingintrinsic to it. Value is measured by people’s willingnessto pay for the benefits that a resource provides—or, nearlyequivalent, their willingness to accept compensation forlost benefits.2
When markets work well, market prices communicatepeople’s preferences—their choices among alternative usesof resources and between using resources today (andperhaps damaging or depleting them) and maintainingthem in their current state to be used later. For nonrenewable resources such as oil, the trade off involvesbalancing the benefits of using them up now against thebenefits of preserving them so that they can be used later.For renewable resources such as fisheries, the trade offinvolves balancing the benefits of fish consumption todayagainst the benefits of maintaining a breeding stock fortomorrow. In an efficient market, resources are used toprovide people with the goods and services that they mostwant to have, when they most want to have them.
When markets do not work well, prices may not adequately reflect people’s willingness to pay for the benefitsthat the use of a resource provides. That situation can arisewhen property rights are poorly delineated or inherentlydifficult to define, as in the case of public goods. It alsocan arise when limited information makes it difficult orimpossible for individuals to decide what value they placeon a resource. For instance, even experts are uncertainabout the likelihood of abrupt changes in climate, or howchanges in climate might disrupt species and ecosystems,or how those disruptions might affect society. Those factors converge in the case of climate change, which involvesgreat uncertainty about a public good.
In attempting to manage such resources, policymakersmay simulate markets by estimating individuals’ willingness to pay, using proxy measures that economists havedeveloped for resources that are not directly bought andsold. Even with those measures, however, policymakersface the challenge of limited information, as well as theimpossibility of learning what values future generationsmight assign to those resources.
Balancing Competing Uses of the AtmosphereEffective management of the atmosphere involves balancing the incremental benefits of using it as a sink forgreenhouse gas emissions—that is, the additional benefitsprovided by the last ton of emissions—against the incremental costs (or benefits) of the climate change that maygradually result from that ton of emissions.3 Similarly,effective management involves balancing the incrementalcosts of investing in research on climate change againstthe incremental benefits of the advancements in knowledge that result. That balancing of current costs and futurebenefits also includes weighing the cost of reducing emissions to avert climate related problems in the futureagainst the cost of adapting to the climate change that occurs—that is, balancing mitigation and adaptation. If theincremental costs of reducing emissions today are higherthan those of adapting to the consequences of emissionsin the future—say, by spending more on insect controlto prevent the spread of tropical diseases—then it wouldbe more cost effective to reduce emissions less and toadapt more.
Put another way, effective climate policy involves makinginvestments today to yield future returns in the form ofa beneficial climate—with due regard for the scientificand economic uncertainty involved. Those investmentscould take several forms, such as restrictions on emissionslevels and research to improve understanding of the phy
2. People may express their beliefs about intrinsic values in theirwillingness to pay for environmental benefits. For instance, theymay be willing to pay to ensure that a forest they may never seeis not cut down or that a species of animal does not become extinct.They are expressing their willingness to sacrifice some other benefits—cheap timber, for example—for the benefit of knowing that theforest or species will be preserved.
3. The atmosphere is a partly renewable resource because the oceanscan indefinitely absorb only limited amounts of greenhouse gases.Beyond those limits, the gases begin to build up in the atmosphereand gradually affect the climate. (For carbon dioxide, the limitappears to be roughly a billion metric tons of carbon per year.)In that sense, the atmosphere is a depletable resource.
CHAPTER THREE THE ECONOMICS OF CLIMATE CHANGE 27
sical processes of climate change and to develop alternatives to fossil fuels.4
Climate policy thus involves balancing investments thatmay yield future climate related benefits against other,non climate related investments—such as education, thedevelopment of new technologies, and increases in thestock of physical capital—that are also beneficial. If climate change turned out to be relatively benign, a policythat restricted emissions at very high expense might divertfunds from other investments that could have yieldedhigher returns. Conversely, if climate change proved tobe a very serious problem, the same policy could yield amuch higher return.
Since resources devoted to climate policy would be diverted from other uses, the total benefit from all types ofinvestment would be greatest if the rates of return werethe same “at the margin”—that is, for the last dollar ofeach type of investment. However, efforts to ensure equalrates of return become extremely complicated in the caseof long term issues such as climate change. Few otherinvestments compare with climate policy in yielding anenormous variety of returns on a global scale and over suchlong periods, or in having returns that are as uncertain.Furthermore, very long time horizons render the resultsof cost benefit analyses extremely sensitive to the rate ofreturn that is assumed for the analysis.
The appropriate course of action—and the appropriatelevel of climate related investment—depends on how onebalances the competing interests of present and futuregenerations and how one accounts for the existing scientific and economic uncertainty. Those choices, in turn,are expressed in the desired rate of return on that investment—that is, the chosen discount rate (see Box 1). Whileanalysts have reached no consensus on what discount rateshould be applied, several of them have argued that itshould be lower than the rates assumed in typical costbenefit analyses, for several reasons:
• Society’s investment opportunities over the long termare uncertain;
• There are no centuries long financial markets in whichto invest risk free or from which to determine verylong term rates of return; and
• People’s attitudes toward the distant future may notbe correctly reflected in the assumption of a constantdiscount rate based on historical market returns.5
The challenge is to come up with valuations that reflectwhat people, taken together, may plausibly be said toconsider appropriate and that are also consistent with howpeople may actually be able to transfer resources acrosstime (by making investments today that yield income inthe future).
If lower discount rates are deemed appropriate for evaluating very long term costs and benefits, they justify takingmeasures to increase society’s rate of investment not onlyin preserving a benign climate but in expanding the stockof all types of long lasting capital. By increasing investment to the point at which the last investments all earnrates of return that are consistent with the lower discountrate, such measures would tend to reduce current generations’ consumption in order to provide more wealth forgenerations in the future.
Integrated Assessments of Costs and BenefitsOver the past 15 years, a large number of studies haveanalyzed the potential costs and benefits of averting climate change. Some researchers have attempted to incorporate the studies’ results in global and regional models ofeconomic growth and climate effects and have used themodels to conduct so called integrated assessments ofpolicy proposals related to climate change. They have alsoestimated the costs of emissions control policies that wouldyield the greatest net benefits in terms of economicgrowth, reduced emissions, and the resulting climateeffects.
4. To the extent that they encouraged research or reduced emissions,such investments might also yield benefits in the form of technological side effects, or “spillovers,” or a decline in conventional airpollution. And to the extent that greenhouse gas emissions alsocontribute to conventional pollution, the costs and benefits of abating such pollution need to be factored in as well.
5. Weitzman (1999, 2001) and Newell and Pizer (2001) discuss thatissue further; Cropper, Aydede, and Portney (1994) describe effortsto determine people’s attitudes toward intergenerational equityby measuring long term discount rates.
28 THE ECONOMICS OF CLIMATE CHANGE: A PRIMER
Box 1.
Discounting and the Distant FutureFor a variety of reasons, people place less value on thefuture than they do on the present; a dollar today isworth more to them than a dollar tomorrow. Thepractice of valuing future income less highly thancurrent income is called discounting. A person whogreatly devalues, or discounts, future consumption andhence does not save and invest much is said to have ahigh discount rate. A person who places great value onthe future is said to have a low discount rate.
Such valuations are expressed in the market as interestrates. Market interest rates balance everyone’s currentsupply of and demand for savings—they represent themarket’s summing up of society’s competing preferencesfor present and future income. Some people save partof their income, thus accumulating wealth; others spendmore than their income, making up the difference byborrowing or by running down their savings. Overall,savers outpace dissavers; thus, society as a whole savesa fraction of current income and invests it in activities—such as conducting research, building physicalcapital, and developing human skills—that will helpprovide goods and services in the future.1 Adjusted fortaxes and risk, interest rates also represent the marginalrate of return on investment (the rate on the last dollarof investment), or the rate—given the existing stock of
resources, capital, technology, and labor—at which savings can be converted into future income.
If people had less of a preference for current consumption (a lower time preference)—and thus lower discountrates—they would save and invest more of their currentincome. Because highly profitable investment opportunities are not unlimited, people’s pursuit of increasingly less profitable ones would drive down the marginalrate of return. Ultimately, their lower time preferencewould be reflected in a larger stock of capital, greateroutput and income, and lower interest rates. Conversely,greater preference for current income would be reflectedin lower future income and higher interest rates.
Economists who analyze public policy reason that if apublic investment is going to improve public welfare,it should produce rates of return similar to those of theprivate investments that it displaces. So in analyzing thecosts and benefits of policies intended to avert climate
1. Physical capital is land and the stock of products set aside tosupport future production and consumption. Human skills—education, training, work experience, and other attributes thatenhance the ability of the labor force to produce goods andservices—are sometimes referred to as human capital.
Those assessments and their findings are best thought ofas general illustrations rather than as exact calculationsof the cost of optimal policies. Analysts must make manysimplifying assumptions for such evaluations; consequently, every study excludes some potentially importantdimension—dealing with different gases, technologies,countries, generations, environments, and so forth. Nonetheless, integrated assessments provide a sense of the relative importance of different factors, highlight those ofgreatest importance, and help policymakers focus on thetrade offs involved.
Integrated assessments of the potential costs and benefitsof averting climate change typically find relatively smallnet benefits from stringent emissions controls in the nearterm, even though they conclude that the continued
growth of emissions could ultimately cause extensivephysical and economic damage. In balancing alternativeinvestments, the assessments conclude, modest restrictionson emissions today would yield net benefits in the future,but extensive restrictions would crowd out other types ofinvestment. The loss of that investment would in turnreduce the rate of economic growth and thus damage future generations’ material prosperity even more than theavoided climate change would have.
Integrated assessments generally conclude that the mostcost effective way to respond to the risks of climate changeis through a gradual process of adjustment. Several considerations support that conclusion (see Wigley, Richels,and Edmonds, 1996):

CHAPTER THREE THE ECONOMICS OF CLIMATE CHANGE 29
0 25 50 75 1000
100
200
300
400
500
600
700
800
900
10001,000
At 3 Percent
At 5 Percent
At 7 Percent
Years in the Future
At 2 Percent
The Present Discounted Value of $1,000
Dollars
Box 1.
Continuedchange, economists typically apply discount rates thatare similar to market interest rates, after adjusting fortaxes, risk, and inflation. Those discount rates reflectthe distributional choices that people in the economy,taken together, actually make.
However, conventional discounting arouses a great dealof controversy when it is applied to long term issuesbecause at discount rates that approximate market rates,even very large long term costs and benefits are dramatically devalued (see the figure).2 The choice of discount rate therefore makes a huge difference in thinkingabout long term problems such as climate change.
2. For instance, imagine a stream of income equal to your currentincome but beginning in the year 2200 and stretching into thedistant future. In one sense, that stream of income is not worthanything to you today because you will not be around to enjoyit. However, you might wish to make an investment today toensure that your descendants will have that income. If youevaluated that extended stream of income at a discount rate of2 percent, it would be worth one year of your present incometo you today. At 3 percent, it would be worth one month of yourcurrent income. At 5 percent, it would be worth half a day’sincome, and at 7 percent, it would be worth 10 minutes of
income.
Long term discounting has such a strong effect preciselybecause private investments yield relatively high ratesof return. As long as society continues to have extensiveopportunities for investment, it will be able to set asidemodest resources today, continuously reinvest the earnings, and have enormous wealth in the distant future.If income continues to grow at 20th century rates,future generations will have much greater resources thancurrent generations have to offset a climate related lossof well being.
Source: Congressional Budget Office.
• Much of the energy using capital stock is in the formof very long lived power plants, buildings, and machinery. Gradual adjustment would give people timeto use up the existing stock and replace it with moreefficient equipment.
• When viewed from the present, the cost of reducingemissions in the future is cheaper because of discounting.
• Technological change will probably lower the cost ofcontrolling emissions. (In addition, it might take a longtime to develop alternative technologies, and therewould be more incentive to engage in research and development over the long term if it was fairly certain that
the policies in place were gradually going to create alarge market for nonfossil energy.)
• People are likely to be wealthier in the future and therefore may find it easier to pay to reduce emissions. Ifincome and wealth grow and technology improves asexpected, future generations may find it relatively easyto cope with the impacts of climate change and togradually impose increasingly strict restraints on emissions to avert further change.
• At least for carbon dioxide, emissions that occur soonerrather than later will have more time to be absorbedfrom the atmosphere by the oceans. As a result, anygiven future target for concentrations could be met with

30 THE ECONOMICS OF CLIMATE CHANGE: A PRIMER
Box 2.
An Example of Integrated Assessment
A recent study by William Nordhaus, reported in 2000, illustrates how integrated assessment can be used to analyze thetrade offs involved in climate policy.1 Drawing on an extensivereview of the literature, the study concluded that modestwarming of up to 2.3º Fahrenheit (1.3º Celsius) would haveessentially no net impact on the world economy and mighteven yield some net benefits. But the study also concludedthat in the absence of efforts to reduce emissions, the averageglobal temperature would rise by about 3.6ºF (2.0ºC) overthe next century and by 6.1ºF (3.4ºC) over the next two centuries. Those changes would inflict damages—measured asa reduction in world economic output—of roughly 1.0 percent (about $1 trillion in 2000 dollars) in 2100 and about3.4 percent (nearly $7 trillion) in 2200. Such damages wouldinclude losses of agricultural land, forests, fisheries, andfreshwater resources; gradual inundation of coastal areas assea level rose; adverse effects on people’s health; and, to someextent, possibly catastrophic surprises.
Yet the study concluded as well that those significant damageswould have only a relatively minor economic impact becausethe world economy was likely to grow very rapidly over theperiod. Under the study’s “best guess” assumptions, costs andbenefits would be best balanced by imposing a charge todayon greenhouse gas emissions throughout the world of roughly$10 per metric ton of carbon (mtc) and gradually raising thatcharge at a pace related to the rate of global economic growth.2
(More rapid economic growth would lead to higher levelsof emissions and therefore require an emissions charge thatalso grew more rapidly.) By 2100, the study’s recommendedpolicy would have reduced global emissions by only about10 percent. The cumulative reduction in emissions over the
1. The estimates provided here, which are in 2000 dollars, comefrom Nordhaus’s DICE99 model, available as an Excel spreadsheet file at www.econ.yale.edu/~nordhaus/homepage/homepage.htm. The model is a recent update of the original DICE model(described in Nordhaus, 1994), which was one of the seminalintegrated assessments of climate change. Both models addressemissions only of carbon dioxide rather than of all greenhousegases, but the results roughly generalize to policies that includeall gases.
2. An emissions charge of $10 per mtc would add about $5 to theprice of a short ton of coal, about 2.5 cents to the price of a gallonof gasoline, and about 15 cents to the price of a thousand cubic
feet of natural gas.
century would have little effect on average global warming,reducing it from about 4.4ºF to 4.2ºF (2.5ºC to 2.4ºC).
The study found little net advantage in averting climatechange because the assessment balanced current prosperityagainst future prosperity and the future benefits of economicgrowth against the future benefits of a stable climate. To avertclimate change over the long run, society would have toreduce emissions both today and later. That policy wouldreduce current generations’ prosperity and slow the rate ofeconomic growth, thus leaving future generations less affluent,too. Given the contribution of fossil fuel use to both economicgrowth and climate change, the study found little benefit inslowing warming.
Sensitivity to AssumptionsThe study’s results were strongly influenced by its estimatesof how much warming would occur in the future and of theimpacts from such warming. Another important factor wasits assumptions about how future generations would valuethose effects. More rapid warming from a given quantity ofemissions would justify higher charges on emissions, as woulda higher level of damages from a given amount of warming.But if those greater damages occurred sufficiently far in thefuture, they would not justify higher charges on emissionstoday. For instance, if warming of more than 4.5ºF (2.5ºC)would cause an economic catastrophe, it would be costeffective to impose very high emissions charges as warmingapproached 4.5ºF toward the end of the century to force theeconomy to move away from its reliance on fossil energysources. Even in that case, however, the most cost effectiveapproach would still be to impose relatively small charges onemissions today and then raise them rapidly in the future.3
Like the results of all such assessments, the Nordhaus study’sfindings were also strongly tied to its assumptions about thesources of future growth and its weighing of the welfare ofcurrent generations against that of future generations.4 Apply
3. Keller and others (2000) come to a similar conclusion in a studythat explicitly considers the possibility of a shutdown of thermohaline circulation.
4. The study imposed a discount rate that gradually declined fromover 4 percent today to under 3 percent in 100 years. Those ratesled the model to assign a present value of about $25 billion—onefortieth the future value—to a trillion dollars of damages a century from now. The rates had two components. The first and
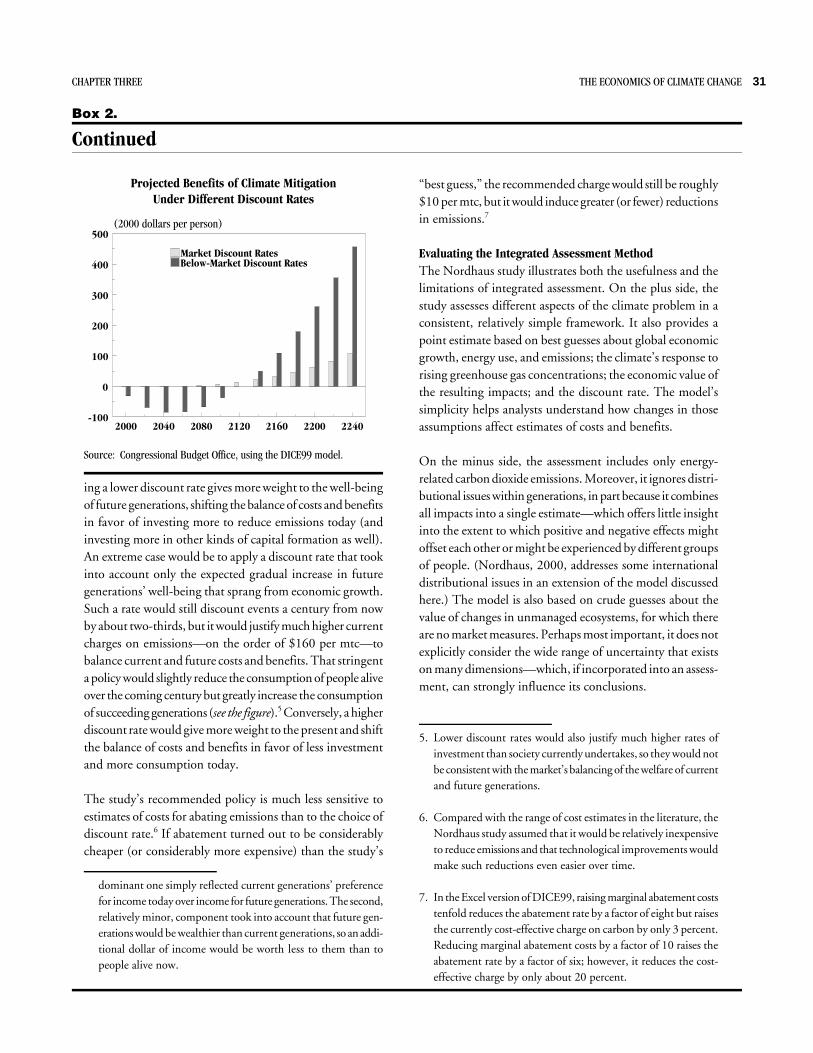
CHAPTER THREE THE ECONOMICS OF CLIMATE CHANGE 31
(2000 dollars per person)
2000 2040 2080 2120 2160 2200 2240-100
0
100
200
300
400
500
Market Discount RatesBelow-Market Discount Rates
Box 2.
Continued
Projected Benefits of Climate MitigationUnder Different Discount Rates
Source: Congressional Budget Office, using the DICE99 model.
ing a lower discount rate gives more weight to the well beingof future generations, shifting the balance of costs and benefitsin favor of investing more to reduce emissions today (andinvesting more in other kinds of capital formation as well).An extreme case would be to apply a discount rate that tookinto account only the expected gradual increase in futuregenerations’ well being that sprang from economic growth.Such a rate would still discount events a century from nowby about two thirds, but it would justify much higher currentcharges on emissions—on the order of $160 per mtc—tobalance current and future costs and benefits. That stringenta policy would slightly reduce the consumption of people aliveover the coming century but greatly increase the consumptionof succeeding generations (see the figure).5 Conversely, a higherdiscount rate would give more weight to the present and shiftthe balance of costs and benefits in favor of less investmentand more consumption today.
The study’s recommended policy is much less sensitive toestimates of costs for abating emissions than to the choice ofdiscount rate.6 If abatement turned out to be considerablycheaper (or considerably more expensive) than the study’s
dominant one simply reflected current generations’ preferencefor income today over income for future generations. The second,relatively minor, component took into account that future generations would be wealthier than current generations, so an additional dollar of income would be worth less to them than topeople alive now.
“best guess,” the recommended charge would still be roughly$10 per mtc, but it would induce greater (or fewer) reductionsin emissions.7
Evaluating the Integrated Assessment MethodThe Nordhaus study illustrates both the usefulness and thelimitations of integrated assessment. On the plus side, thestudy assesses different aspects of the climate problem in aconsistent, relatively simple framework. It also provides apoint estimate based on best guesses about global economicgrowth, energy use, and emissions; the climate’s response torising greenhouse gas concentrations; the economic value ofthe resulting impacts; and the discount rate. The model’ssimplicity helps analysts understand how changes in thoseassumptions affect estimates of costs and benefits.
On the minus side, the assessment includes only energyrelated carbon dioxide emissions. Moreover, it ignores distributional issues within generations, in part because it combinesall impacts into a single estimate—which offers little insightinto the extent to which positive and negative effects mightoffset each other or might be experienced by different groupsof people. (Nordhaus, 2000, addresses some internationaldistributional issues in an extension of the model discussedhere.) The model is also based on crude guesses about thevalue of changes in unmanaged ecosystems, for which thereare no market measures. Perhaps most important, it does notexplicitly consider the wide range of uncertainty that existson many dimensions—which, if incorporated into an assessment, can strongly influence its conclusions.
5. Lower discount rates would also justify much higher rates ofinvestment than society currently undertakes, so they would notbe consistent with the market’s balancing of the welfare of currentand future generations.
6. Compared with the range of cost estimates in the literature, theNordhaus study assumed that it would be relatively inexpensiveto reduce emissions and that technological improvements wouldmake such reductions even easier over time.
7. In the Excel version of DICE99, raising marginal abatement coststenfold reduces the abatement rate by a factor of eight but raisesthe currently cost effective charge on carbon by only 3 percent.Reducing marginal abatement costs by a factor of 10 raises theabatement rate by a factor of six; however, it reduces the costeffective charge by only about 20 percent.
32 THE ECONOMICS OF CLIMATE CHANGE: A PRIMER
somewhat greater total emissions over the next centuryif the bulk of the emissions occurred early on.
Box 2 on pages 30 and 31 summarizes findings from aparticularly well known integrated assessment modeldeveloped by William Nordhaus. The study illustrates howintegrated assessment can be used to provide a “best guess”of the climate policy that would yield the greatest netbenefits and how sensitive that sort of estimate is to theassumptions built into the assessment. However, the studydoes not explicitly consider the wide range of uncertaintyabout scientific and economic aspects of climate change—the topic of the next section.
Coping with UncertaintyThe extensive scientific and economic uncertainty discussed in Chapter 2 greatly complicates assessment of thecosts and benefits of averting climate change. No onewishes to undertake extensive, expensive actions to solvea problem that turns out to be relatively mild—or to takeno action to solve a problem that later proves catastrophic.Policymakers are thus forced to hedge their bets and prepare for more than one possible outcome, with the additional complication that whatever outcome occurs is likelyto be largely irreversible.6
In general, uncertainty about a problem may indicate theneed for more, or less, action to address it, depending onthe nature of the unknowns (Webster, 2002). The amountof appropriate action also depends on how risk aversepeople are—that is, how much they are willing to pay toavoid an uncertain but costly outcome. The greater theirdegree of risk aversion, the more people will be willingto sacrifice today to reduce the likelihood of adversechanges in climate.
Studies that explicitly account for uncertainty generallyrecommend greater effort to avert climate change thando analyses that do not account for it—mainly becausethe studies include the long term discount rate as an
uncertain variable.7 However, the way those studies treatuncertainty about the discount rate in effect simply appliesgreater weight to future generations and therefore recommends more action. Because the issue of discounting ismainly a distributional one, many analysts questionwhether it should be treated as a matter of uncertainty inthe same sense that, say, the sensitivity of the climate tocarbon dioxide concentrations is uncertain.
Another area of uncertainty—often ignored in economicanalyses—involves the actions of governments in the future. Integrated assessments that conclude that only modest actions are called for today assume that policymakerswill in fact take more stringent action in the future, shouldit prove prudent. However, governments may not be ableto commit themselves to increasingly stringent future policies. That problem is part of a broader difficulty in addressing long term challenges: current generations havefew means to constrain the behavior of succeeding generations.
Because of uncertainty and the long time frame involved,climate policy will inevitably involve a sequence of decisions. At each stage, policymakers would determine a nearterm plan, based on the information accumulated to thatdate and composed of both research to further improveknowledge and action to reduce risk. The informationuncovered during the succeeding period would set thestage for the following round of decisionmaking.
Because better information can help policymakers makebetter choices, there are likely to be benefits to conductingclimate related research and developing technologicaloptions to reduce the cost of controlling emissions. One
6. Climate policy involves a degree of irreversibility in both mitigationand impacts. On the one hand, expensive investments to reduceemissions will be impossible to recoup if warming proves modestor largely beneficial. On the other hand, emitted greenhouse gasesare likely to be difficult to withdraw from the atmosphere ifwarming proves to be very damaging.
7. An analysis of climate related uncertainty can be found inNordhaus (1994); two analyses that expand on that work are Pizer(1997) and Newell and Pizer (2001). Because small changes inthe discount rate can significantly shift the balance of current andfuture values, uncertainty about the discount rate dominates thoseanalyses. Under the studies’ assumptions, costs and benefits wouldbe balanced by imposing an international charge on greenhousegas emissions of roughly $15 to $20 per metric ton of carbonequivalent (in today’s dollars) and raising the charge gradually overtime. That estimate is nearly double the estimated charge whenuncertainty is not taken into account. Evidence from a wide varietyof estimates of mitigation costs suggests that such a charge wouldreduce global emissions by roughly 4 percent (Lasky, forthcoming).

CHAPTER THREE THE ECONOMICS OF CLIMATE CHANGE 33
recent analysis estimated that the potential benefits ofresearch to reduce uncertainty about the risks of climatechange could total roughly $1 billion to $2 billion per yearin 1990 dollars ($1.3 billion to $2.6 billion in 2002 dollars).8 About half of those benefits of research would comefrom better information about the value of damages fromdifferent amounts of climate change. Another quarterwould come from better information about how muchit would actually cost to reduce emissions. Relatively littleof the total benefit would come from better informationabout future growth of the global population or particularnations’ economies, or about the functioning of the climate system.
Other studies suggest that research to accelerate the development and deployment of low emissions technologiesmight yield net benefits, given the current range ofuncertainty about future technological advances (see, forexample, Papathanasiou and Anderson, 2001). The benefits would flow from lowering the cost of such technologies and thus making the transition to nonfossil energy less expensive than it would otherwise have been ifpotential damages from climate change had turned outto be large.
Distributional IssuesCrafting climate policy involves not only balancing costsand benefits but also distributing them—within andamong countries, regions, and generations. Policies thatbalance overall costs and benefits do not necessarily balance them for every person, and policies that maximizethe net benefits to society do not necessarily provide benefits to each individual. A policy may yield positive netbenefits by causing both very large aggregate losses andonly slightly larger aggregate gains.9
Distributional concerns are at the heart of much of thecontroversy about climate policy. For example, imposingcontrols on emissions today would cut coal mining companies’ profits but would benefit manufacturers of solarenergy equipment. Preventing climate change in the futuremight greatly benefit countries at very high risk of damagebut might actually hurt countries that stood to gain froma warmer climate. Similarly, emissions control policieswould impose costs on people today and yield benefitsto people in the future.10
Issues Among Generations Acting to prevent climate change today would place a burden on people now alive and would probably leave cominggenerations with a climate more similar to today’s—butwith somewhat less wealth—than they would have hadotherwise. In contrast, not acting would benefit peopletoday and probably yield somewhat more wealth in thefuture—but it might also leave the world with a differentand possibly worse climate for many generations to come.
Choosing among policies is not purely a matter of balancing costs and benefits but also a question of how todistribute the benefits of energy consumption, land use,and climate among generations. Policy recommendationsfrom the integrated assessments described earlier are verysensitive to such intergenerational choices. (Howarth,2001, provides an example of an integrated assessmentthat explicitly considers intergenerational equity.)
Instead of restricting emissions, current generations couldaddress these distributional concerns by making additionalcapital investments to benefit future generations, with theintention of offsetting potential future damages from climate change or of compensating future generations for
8. Nordhaus’s and Popp’s analysis (1997, pp. 1 47) measures onlythe expected benefits of research and not what the required studieswould cost.
9. In studying economic problems, economists seek policies that willimprove economic efficiency—that will make at least one personbetter off without making anyone worse off. Such policies aretermed Pareto improvements. However, many policy proposalswhose net benefits exceed their net costs also have substantialdistributional effects. That is, the improvements are worth more
than the losses, all told, but some people are made worse off evenwhile others are made better off. Economists refer to such policiesas potential Pareto improvements: in principle, the winners couldcompensate the losers for their losses and still be better off. Sucha policy passes a standard cost benefit test but could still makemany people worse off unless it also provided for their compensation.
10. Gradually rising emissions taxes or permit prices would also effectively imply a particular distribution of emissions rights across generations.
34 THE ECONOMICS OF CLIMATE CHANGE: A PRIMER
those damages. However, because of uncertainty aboutthe kind of damages climate change would cause, it is unclear whether (or how much) more capital would be necessary—or useful—to offset them. Also uncertain is whetherintervening generations would pass the additional resources on to subsequent generations or consume the resources themselves.
Concerns Within and Among CountriesDealing with the issue of climate change is likely to involvedifficult decisions about distributing costs and burdenswithin countries. Some workers and industries—coal producers, electric utilities, and others—would probably beara disproportionate share of the burden of restrictions ondomestic emissions, as would the regions of a country thatproduced fossil energy. (The Congressional Budget Officediscusses issues of equity in domestic climate policy in its2000 report on carbon allowance trading.)
Distributional concerns also dominate discussions of international climate policy and are likely to play at least as
important a role in its development as the balancing ofcosts and benefits will. Policymakers in many developingcountries emphasize that developed countries are responsible for the bulk of historical emissions and that manydeveloping countries are apparently more vulnerable to—and less able to cope with—the more damaging effectsof climate change. Such leaders tend to argue that developed countries should not only shoulder any near termburden of reducing emissions but also compensate developing countries for climate related damages. They alsotend to be skeptical of arguments that favor balancing neteconomic costs and benefits, recognizing that such reasoning may be used to gloss over both distributional issuesand disparities in impacts.
In contrast, other policymakers in both developed anddeveloping countries tend to be less concerned aboutclimate related issues because they believe that theirnations are not particularly vulnerable to potential changesin climate or will be able to adapt to whatever changes mayoccur.

4Trade-Offs Among Policy Options
Governments may respond to the challenge thatclimate change poses by adopting a “wait and see” approach or by pursuing research programs to improvescientific knowledge and develop technological options,regulating emissions, or engaging in a combination ofresearch and regulation. Should policymakers decide toact, they can choose from among a wide variety of approaches to regulate emissions and encourage the development of low emissions and emissions removal technologies.
Several characteristics of greenhouse gases make it possibleto lower the costs of regulation by allowing for a great dealof flexibility in controlling emissions. Different greenhousegases, measured in metric tons of carbon equivalent, haveessentially the same effect on climate; they mix uniformlythroughout the atmosphere and will only gradually affectthe climate as they accumulate over time. Consequently,which gas is controlled and where—and, to some extent,whether a given reduction in emissions occurs this yearor next—are immaterial. That principle is often referredto as “what, where, and when” flexibility in discussionsof climate policy.
Governments could control greenhouse gas emissions ina variety of ways. Under direct command and control regulation, the government could specify the types of equipment and technology that may be used, or it could specifyenergy efficiency or emissions standards for buildings,vehicles, and equipment. Alternatively, the governmentcould impose emissions taxes or fees, which would discourage emissions by increasing their cost. It could alsodirectly control emissions through a system of emissionspermits, or allowances, that would strictly limit the totalquantity of emissions.
Another option combining elements of taxes and permitswould be a hybrid permit system under which the government allocated a fixed quantity of permits but sold anunlimited number of additional permits at a set “trigger”price. In such a system, if the cost of reducing emissionsrose above the trigger price, emitters would simply buyadditional permits rather than reduce emissions further.The system would thus cap the incremental cost of emissions at the trigger price—acting, in effect, like a tax.
Although U.S. environmental regulations are largely ofthe command and control type, most economists agreethat as a general rule, taxes or permits—loosely termed“market based” systems—can control emissions whileoffering greater flexibility and lower costs. In contrast todirect controls, market based systems give firms andhouseholds stronger incentives to find low cost ways toreduce emissions through behavioral changes and innovative technologies.
In the case of carbon dioxide emissions from the burningof fossil fuels, the most direct approaches would involvetaxes or permits based on the carbon content of fossilfuels.1 Under either system, fossil fuel suppliers—pro
1. The quantity of carbon dioxide emitted is directly proportionateto the carbon content of fuels and is therefore easy to measure.Carbon taxes fall most heavily on coal, which is composed almostentirely of carbon; they fall somewhat less heavily on petroleumproducts and least heavily on natural gas because those fuels alsocontain hydrogen. An emissions tax of $100 per metric ton ofcarbon equivalent translates to roughly $50 per short ton of coal,25 cents per gallon of gasoline, and $1.50 per thousand cubic feetof natural gas. Other taxes on fuels—for instance, ad valorem (orvalue added) taxes in proportion to sales prices or energy taxes inproportion to the energy content of fuels—would not be targeted
CHAPTER
36 THE ECONOMICS OF CLIMATE CHANGE: A PRIMER
ducers and importers of coal, oil, and natural gas—wouldhave to pay taxes or acquire permits in proportion to thecarbon content of the fuel they sold. Such systems wouldbe relatively simple to administer, monitor, and enforceif they were applied at the point of import or first salebecause relatively few companies actually import orproduce fossil fuels. The system would impose price increases or restrictions on output that would filter downthe distribution chain, but it would avoid the administrative difficulties of a system that directly taxed “downstream” retailers and consumers.2
The relative ease of regulating energy related emissionscontrasts with the difficulties of regulating emissions frommost other sources, particularly the substantial fractionthat originates from forestry and farming. Because thoseother emissions come from many different kinds of mainlysmall sources under highly variable conditions, they tendto be much more difficult to track and measure. Althoughsome such emissions could be regulated in a cost effectivemanner (Reilly, Jacoby, and Prinn, 2003), controllingthose sources would generally require different and varyingapproaches. That could complicate the regulatory processand might easily swamp the relatively low engineeringcosts of controlling some non energy related emissions.
For instance, carbon emissions from fossil fuels could bepartly offset by paying landowners to plant trees to absorband sequester carbon, thus reducing net emissions. Sometree planting is already supported for other purposes, suchas soil conservation, and expanding those policies wouldbe relatively straightforward. However, for the purposesof carbon sequestration, such policies are complicated byissues that do not arise in regulating fossil fuels. Theyinclude the costs of monitoring tree growth to determinehow much carbon is absorbed and the difficulty of determining whether landowners would have grown the treesanyway. Another complicating factor is how sequestration
activities might ripple through markets and affect carbonflows on agricultural and forest land not dedicated tosequestration. For instance, a decision to set aside a certainamount of forest for sequestration might lead to anotherarea of forest being cleared that otherwise would haveremained untouched. In that case, the carbon sequesteredin the set aside area would simply be offset by clearingelsewhere.
Taxes and Permits: Similaritiesand DifferencesTaxes and permits affect a regulated activity in similarways as long as people can buy and sell the permits onopen markets. A tax on the carbon content of fuels directlyraises the price of those fuels for the end user; a strict permit system indirectly raises the price by reducing thequantity of fuel that suppliers can sell. (As noted earlier,a fixed price permit system works like a tax.) Either way,higher prices lead people to reduce their fuel consumptionand thus their emissions. So for any level of emissionsrestrictions in a permit system, there is a correspondingtax level that will achieve the same purpose. In principle,both approaches should lead to identical levels and pricesof emissions.
In practice, however, uncertainty about the costs andbenefits of restricting emissions can greatly influence therelative cost effectiveness of the two approaches. The government could impose a tax, expecting some level of reduced emissions; but emissions could end up higher orlower than it expected. Likewise, the government couldimpose a permit system with a cap on emissions and expect a given cost for meeting the cap; but that cost couldend up being much higher or lower. And in either case,the price might not be consistent with the uncertainbenefits of mitigating climate change. Which system ispreferable depends on which type of uncertainty is thegreatest and how rapidly costs rise—and benefits fall—asthe government tightens restrictions on emissions.
Some research indicates that climate related uncertaintygives an emissions tax (or fixed price permit system) significant economic advantages over a system of strictly fixedpermits, or allowances. Those advantages stem from twofactors: both the costs and benefits of reducing carbon
specifically toward the carbon content and would therefore besomewhat less cost effective in discouraging carbon emissions.
2. The characteristics of such emissions permit systems are discussedin greater detail in two studies published in 2000 and 2001 by theCongressional Budget Office. Another CBO study, published in2002, discusses the relative merits of different approaches toregulating gasoline consumption, including a carbon tax.

CHAPTER FOUR TRADE-OFFS AMONG POLICY OPTIONS 37
emissions are uncertain, and the incremental costs can beexpected to rise much faster than the incremental benefitsfall as regulation becomes more restrictive. Because climatechange will result only from the long term buildup ofgases over many years, incremental benefits are essentiallyflat in any given year; that is, the incremental benefits ofthe millionth ton of carbon reduced are essentially thesame as those of the billionth. In contrast, the incrementalcosts of reducing emissions are likely to rise sharply themore emissions are constrained.3 Thus, choosing to strictlylimit the quantity of emissions could prove very expensivecompared with the potential benefits, but choosing toimpose a tax whose level reflected the expected benefitsprobably would not. A pricing system—of either taxesor fixed price permits—is therefore likely to constrainemissions more cost effectively than will a system withfixed limits on emissions.4
The Distributional Effects of RegulationRegulatory systems generally create winners and losers,even when the benefits of less pollution are ignored. Balancing the distributional effects of such systems can bemore complicated and controversial than balancing theircosts and benefits. Economic analysis provides severaluseful insights about the distributional issues involved inregulating greenhouse gas emissions.5
Regulations Impose CostsRegulations come with a price: one way or another, someone ends up paying for the environmental benefits they
may generate. Households and firms, for instance, mayhave to make do with less energy, paying higher priceseither directly or indirectly (in the form of lower wages,salaries, and profits)—or both.
Some analysts have argued that the regulation of energymarkets might not be costly because energy conservationpays for itself. According to that point of view, people failto use energy efficiently, either because they do not makesensible decisions about energy use or because they arepoorly informed, or because they face a variety of marketfailures or barriers that deter them from making moresensible decisions or becoming better informed. Proponents of that view believe that the government may be ableto regulate energy use and emissions at a net savings tothe economy by providing information, overcomingmarket barriers, and correcting market failures—for example, by including energy efficiency requirements instandards governing buildings and appliances—and thatthe resulting energy savings may more than pay for theadditional costs of more efficient equipment.6
Although energy markets do not necessarily function withtextbook perfection—for instance, energy use producespollution, the electricity distribution system is largelycomposed of regulated monopolies, and the electricityindustry remains heavily regulated—neither are governments always able to correct energy market failures without imposing other costs that offset or even exceed thesavings that the corrections might achieve. For example,inefficient electricity consumption is sometimes the resultof regulations that are intended to prevent monopolybehavior by utilities. Nevertheless, governments may beable to intervene in some circumstances—for instance,by setting standards in markets in which reliable productinformation is hard to obtain or in situations in whichspecific regulatory failures may constrain businesses andhouseholds from making the most cost effective capital
3. In technical terms, price controls dominate when the marginal costcurve is steep or very uncertain and the marginal benefit curve isflat; quantity controls dominate when the marginal cost curve isflat or well understood and the marginal benefit curve is steep.A permit system would be more appropriate than a tax system ifthe unit cost of reducing emissions was relatively constant whilethe incremental damages from emissions increased very quicklywith rising emissions levels. Weitzman (1974) and Pizer (1997,1998, 1999) discuss these issues in more detail.
4. The balance could shift in favor of a strict permit system iftechnological advances made large reductions in emissions possibleat a low unit cost that was more or less fixed.
5. Congressional Budget Office (2000) discusses the distributionalimpacts of different control policies for greenhouse gases.
6. Sutherland (2000, pp. 89 112) examines the differences betweenthis “energy conservation” view and that of mainstream economics.A recent report from the energy conservation standpoint, preparedby five U.S. Department of Energy national laboratories, can befound in Interlaboratory Working Group (2000). The EnergyModeling Forum, in a 1996 report, offers a comprehensivediscussion of the difficulties of identifying and measuring marketfailures and barriers in the energy sector.
38 THE ECONOMICS OF CLIMATE CHANGE: A PRIMER
investments. Economists find it difficult, however, todetermine the circumstances in which standards clearlyinduce people to reduce their use of energy at no cost orwith net savings.7
Consumers Bear Most of the Direct Costsin the Long RunProducers who are required to pay a tax will not necessarily bear the burden of the tax if they can pass it on toothers. Characteristics of the markets for fossil fuels wouldenable producers to pass on most of the costs of emissionstaxes—or the burden of higher prices under a permit system—to consumers.8
Nevertheless, producers would still bear some of thosecosts in the short run. And many firms and workers inthe energy sector—coal mine operators and miners, oilcompanies, and electricity producers that rely on fossilfuels for generation—would bear a disproportionateburden in lost profits and wages. (In the oil sector, however, foreign oil producers would probably bear a significant portion of those losses.) So would companies andworkers in energy intensive industries such as petroleum
refining, primary metals, chemicals, and paper.9 In contrast, alternative energy suppliers would tend to benefitfrom higher demand for their products, as would naturalgas producers (since natural gas contains much less carbonper unit of energy than coal does).
Regulations and Taxes Have SubstantialDistributional EffectsA third important insight is that the distributional consequences of pricing and permit systems can be very largecompared with their costs and benefits. Whenever the government restricts something of value, people will bid upthe market price in trying to obtain it. The difference between the supply, or production, price and the highermarket price is known as a scarcity rent.
If the government restricts emissions by imposing a tax,it will receive the scarcity rent as tax revenues. By contrast,if it imposes a permit system and gives the permits away,the permits’ recipients will receive the scarcity rents ashigher profits—because they can either charge higherprices for the fuel they sell or sell the permit. The incomereceived as tax revenue or scarcity rents can be many timeslarger than the net efficiency loss.10 One important consequence of that fact is that efforts to restrict emissions mayencourage the affected parties to seek regulatory provisions7. In recent years, the U.S. government has tried to restrain the
growth of emissions through a system of voluntary programs thatattempt to identify opportunities for low cost or costless emissionsreductions and to promote them in the private sector. However,the programs have not been very successful in controlling emissions.For example, the Climate Change Action Plan developed in 1993by the Executive Office of the President projected that voluntaryprograms would nearly stabilize U.S. greenhouse gas emissions at1990 levels in 2000. (The plan is available at www.gcrio.org/USCCAP/toc.html.) In fact, emissions were roughly 12 percenthigher in 2000 than they had been at the beginning of the decade.The plan’s failure was due in part to unexpectedly high levels ofeconomic growth and low energy prices. Nevertheless, the voluntaryprograms’ successes are very difficult to evaluate because it is nearlyimpossible to determine what businesses and households wouldhave done in the absence of the program. Welch, Mazur, andBretschneider (2000) present a rigorous study that concludes thatone such program had relatively little effect on emissions.
8. The supply of fossil energy is fairly elastic: for example, coal suppliers can easily raise or lower their production in response to smallchanges in coal prices. Moreover, demand for fossil energy is fairlyinelastic because currently there are few cheap, plentiful substitutesfor it. Inelastic demand and elastic supply together imply thatenergy producers can pass on taxes to consumers.
9. The Department of Energy (1997) notes that those four industriesaccounted for about 22 percent of manufacturing gross productoriginating in 1994 but 78 percent of manufacturing energy use.Yuskavage (1996) also treats this issue; updated data can be foundat www.bea.doc.gov/bea/dn2/gpo.htm.
10. Tax revenues equal total emissions under the tax times the tax,whereas the net economic costs from the tax (called the efficiencyloss, or the deadweight loss) are roughly one half the tax times thereduction in emissions. A higher tax raises more revenues, but itreduces emissions even more; so the income loss rises faster thanthe tax revenues, and the ratio of revenues to income loss declines.For example, based on the analysis of the potential costs of theKyoto Protocol by Lasky (forthcoming), a reduction of 5 percentin U.S. carbon dioxide emissions in 2010 would involve direct costsof just over $1 billion but would raise almost $50 billion in revenues. However, a reduction of 15 percent would cost $12 billion(10 times as much) and raise over $150 billion in revenues (lessthan four times as much); a reduction of 30 percent would costalmost $60 billion and raise $330 billion in revenues. In thoseexamples, tax revenues (or permit values) are between six and 40times the direct costs.

CHAPTER FOUR TRADE-OFFS AMONG POLICY OPTIONS 39
that provide them with tax exemptions or access to permits—that is, they may engage in rent seeking behavior.For example, fossil fuel suppliers might advocate a systemin which they were given emissions permits free of charge—so that they would receive the entire scarcity rent resulting from the emissions limits.
Distributional Effects Depend on How theGovernment Regulates EmissionsUnder a system of taxes or auctioned permits, the government would receive revenues, and it could redistributesome of them in various ways—by cutting other taxes,reducing government debt, or funding new programs.11
Each method of “recycling,” or returning revenues to theeconomy, would benefit different groups of consumersand suppliers in different ways. Some of those approachescould offset some of the costs of regulation but probablynot all of them.
The case of permits is more complicated than that of taxesbecause permits can be distributed in different ways: thegovernment could auction them and receive revenues, itcould give the permits away, or it could use a combinationof the two approaches.12 Auctioned permits are similar
to emissions taxes in their distributional effects.13 Incontrast, freely allocated emissions permits would greatlybenefit their recipients, who could reap profits from thenow scarce right to sell fossil fuels (while passing on mostof the costs to fuel consuming businesses and households)or from the sale of permits to a fuel supplier. One possibleapproach to a permit system, known as grandfathering,would be to give all the permits to fossil fuel suppliers inproportion to their historical sales. Another method wouldbe to distribute permits free to households and requirethat fuel suppliers buy them. Suppliers would then includethe cost of the permits in the price of fuel. That approachwould spread regulatory costs more evenly across thepopulation but would also involve high transaction costs.
Alternative Uses of RevenuesMost government revenues are collected from income,payroll, and sales taxes, which tend to distort taxpayers’behavior by discouraging people from working or saving.The government also uses tax incentives to encouragecertain types of activities—for example, home ownership,through the home mortgage interest deduction. Suchsubsidies distort households’ and businesses’ behavior byencouraging greater spending on tax favored goods andservices, relative to spending on other items. In economicterms, taxes and tax incentives impose significant lossesof economic efficiency.14
In contrast, emissions restrictions are intended to correctexisting market failures—and thus improve economic efficiency—by discouraging harmful emissions. (When thoserestrictions take the form of taxes, they are referred to asPigouvian taxes.) Of course, the restrictions also discourage productive activity to some degree and so impose adirect cost on the economy. However, if the restrictions
11. Not all of the revenues from an emissions tax would be availablefor redistribution. The tax would curb economic activity, reducingother tax revenues and raising government spending for incomerelated programs. The tax would also raise the government’s costsfor purchasing fossil energy and energy intensive goods. As a consequence, some emissions tax revenues would be needed to coverhigher spending and lost revenues from other taxes. However,emissions tax revenues would generally be greater than policyinduced increases in government expenditures and revenue lossesfrom other taxes, so net government revenues available for redistribution would rise.
12. Regarding auctions of permits for greenhouse gas emissions,Crampton and Kerr (1998) show that a standard ascending clockauction is the most effective system to ensure that all bidders paya uniform price that reflects the market value of the standard emissions permit. Under that kind of system, the auction would beginat a low asking price, and in each succeeding round, the price wouldrise and bidders would reveal the number of permits they wantedto buy at that price. The process would continue until the numberof permits demanded was exactly equal to the number beingauctioned.
13. Even if the government gave permits away, it would collect somerevenues because permit recipients would pay taxes on their higherincome. However, the government would also lose revenues fromother taxes and would spend more on transfers, fossil energy, andenergy intensive goods.
14. Congressional Budget Office (1996) and Gravelle (1994) examinethe distorting effects of taxes on labor supply and on saving andinvestment, respectively.

40 THE ECONOMICS OF CLIMATE CHANGE: A PRIMER
were set at an appropriate level, their cost would be balanced by the benefits of lower levels of emissions.
But there is a catch: emissions controls—be they taxes,permits, or old fashioned command and control regulations—also interact with the existing tax system and tendto aggravate its distortions. For instance, emissions restrictions would raise the prices of energy intensive products,thus lowering real (inflation adjusted) wages and furtherdiscouraging people from working. Through that sort oftax interaction effect, any regulation that raised the pricesof products and lowered income would also imposeadditional, hidden costs by enhancing the distortionscaused by the existing tax system. The more distortionarythe existing system, the larger the interaction effect—andthe higher the hidden costs—tend to be.15
However, policymakers could offset at least part of theinteraction effect by using the revenues from the emissionstax (or auctioned permits) to reduce the marginal rates—the rate on an additional dollar of taxed activity—of someexisting distortionary taxes.16 Some analysts (for example,17
Jorgenson and Goettle, 2000, and Shackleton and others,1993) argue that emissions taxes could even yield a“double dividend” of fewer emissions and more outputif the revenues were used to eliminate particularly distortionary taxes in the current code—especially taxes that discourage saving and investment.17 The existing researchon the question is not definitive, however.
Emissions restrictions that raised revenues, coupled withreductions in distortionary marginal tax rates, would impose significantly lower economic costs than emissionscontrols would in two circumstances: if the controls didnot raise revenues (as in the cases of command and controlregulations or freely allocated permits) or if they returnedrevenues to the economy in ways that did not reduce distortionary marginal rates. Policymakers would face a tradeoff between using such revenues to offset some of thedistributional effects of emissions controls (by makingpayments to affected producers and consumers) and usingthe revenues to offset some of the controls’ effects on economic efficiency (by reducing marginal tax rates). As ageneral rule, policymakers cannot fully achieve both goals.
These points are true for any sort of regulation, but theyare particularly applicable to climate change policy becausegreenhouse gas regulations could involve so much money.The United States alone emits roughly 1.5 billion metrictons of carbon annually, so every dollar of tax per mtcwould raise up to $1.5 billion per year. A carbon tax of$100 per mtc would raise about 15 percent as much revenue as the individual income tax and nearly 80 percentas much as the corporate income tax. Those large amountssuggest that some of the revenues from a carbon tax couldbe used to finance cuts in marginal income tax rates.
Emissions could also be reduced by eliminating subsidiesand tax incentives that encouraged the production andconsumption of fossil fuels or that encouraged deforestation. In the United States, such subsidies and incentivesare fairly modest, and removing them would have relatively little impact on emissions (Congressional BudgetOffice, 1990).18 But many developing countries heavily
15. For discussions of the tax interaction effect, see CongressionalBudget Office (2001), Parry (1997, 2002), Parry and Bento (1999),Parry and Oates (1998), and Parry, Williams, and Goulder (1996).
16. That “revenue recycling” effect could be particularly strong in thepresence of tax incentives such as the home mortgage interestdeduction (see Parry, 2002). However, as discussed in Babiker,Metcalf, and Reilly (2002), if the existing tax system was sufficientlydistortionary, some forms of revenue recycling might actually enhance the interaction effect, so that the negative economic effectsof the emissions tax would actually outweigh the positive environmental benefits.
17. Proponents of the “strong” version of the hypothesis argue thatsubstituting appropriately set environmental fees for existing taxeswould more than offset the tax interaction effect and thus improveboth the environment and the economy. Proponents of the “weak”version argue that such a substitution would offset at least part ofthe tax interaction effect. The potential for a double dividend depends mainly on the distortions of the existing tax system and isthus more a statement about the existing system than about thebenefits of emissions taxes. In principle, policymakers could alsoreduce the existing system’s distortions by replacing it with other,less distortionary taxes. That alternative would tend to lower thepotential for a double dividend from an emissions tax.
18. Using a conservative definition, the Department of Energy’s EnergyInformation Administration (1992, 2000) estimates that federalsubsidies and tax incentives to the energy sector amounted to about

CHAPTER FOUR TRADE-OFFS AMONG POLICY OPTIONS 41
subsidize energy use and land development. In thoseeconomies, the elimination of subsidies might lead to bothreduced emissions and higher output.
Proposals for emissions taxes sometimes include a provision that the revenues be used for environmental purposes,such as an investment tax credit for energy efficient equipment. Some studies suggest that such tax credits are considerably more effective than equivalent energy pricechanges in encouraging users to purchase such equipment,perhaps because purchasers focus more on up front capitalcosts than on longer term operating costs or because theyare more uncertain about longer term costs (see Jaffe,Newell, and Stavins, 2000, pp. 51 52 and 63).
However, such tax credits also have disadvantages. Anemissions tax is intended to signal polluters to cut emissions; in effect, a tax credit for abatement distorts thatmessage. Tax credits can cost the government a great dealper unit of reduced emissions, since purchasers who wouldhave bought the equipment even without the credit receiveit, too. Taken together, the literature on environmentaltaxation and revenue recycling suggests that using revenuesfrom emissions taxes to finance a general reduction in taxeson all sorts of investment would be more cost effectivethan using them to target investments for environmentalpurposes (Oates, 1992; and Baumol and Oates, 1988).19
Regulation and InnovationTo a great extent, the cost of controlling greenhouse gasemissions and stabilizing atmospheric concentrations willultimately depend on technological developments overthe next century. Innovation that dramatically reduces thecost of producing energy from nonfossil sources or ofsequestering carbon dioxide emissions will ease the processof controlling emissions; innovation that tends to reduce
the cost of finding, extracting, and using fossil fuels willcomplicate it.
Although technological innovations over the long run areimpossible to predict with any reliability, relative energyprices have influenced the direction and pace of researchand development (R&D). For instance, when energyprices rose in the 1970s, not only did people use less energy and install more energy efficient capital goods butbusinesses shifted resources into the development ofenergy efficient equipment, more efficient ways of findingand extracting fossil fuels, and alternative energy sources(Newell, Jaffe, and Stavins, 1998; Jaffe, Newell, andStavins, 2000; and Popp, 2001).20
Emissions controls that raised the prices of fossil fuelswould be likely to have somewhat similar effects, tendingto redirect R&D efforts from finding more fossil fuels toimproving energy efficiency, developing alternative sourcesof energy, and removing greenhouse gases from the atmosphere. Over time, those efforts would tend to lower theincremental cost of controlling emissions, reducing thetax (or permit price) needed to achieve a given emissionstarget and inducing more reductions at a given tax rate.Moreover, emissions controls are likely to induce moreinnovation if they exact a payment from emitters, as emissions taxes and auctioned permits do. In contrast, companies would have less incentive to innovate under a system of freely allocated permits—and even less under acommand and control regulatory system.21
Although the inducement effect would tend to lessen theincremental costs of controlling emissions, analysis suggests that such benefits would be offset to some extent bythe costs of research and development (Goulder andSchneider, 1996). Some of the resources used to financeR&D projects would simply be redirected from the fossil
$7.3 billion in 1992 and $6.2 billion in 1999 (both in 1999 dollars)—or roughly 1 percent of total energy expenditures. Applyinga much broader definition, a study funded by the Alliance to SaveEnergy and reported by Koplow (1993) estimates that subsidiesin 1989 totaled from $21 billion to $36 billion in 1989 dollars—orfrom 5 percent to 8 percent of total energy expenditures.
19. Gravelle (1994, Chapter 5) provides a broader discussion of thecost effectiveness of investment tax credits.
20. Some research—for example, Nordhaus’s 1997 study—suggeststhat the innovation inducement effect of higher energy prices willnot be very large, compared with the more basic inducement tosubstitute capital and labor for energy.
21. Under certain circumstances, which are discussed at length inFischer, Parry, and Pizer (1998), freely allocated permits mayinduce more innovation than taxes or auctioned permits. However,the case of climate change does not involve such circumstances.

42 THE ECONOMICS OF CLIMATE CHANGE: A PRIMER
fuel sector, but some would probably be redirected fromother economic activities.
Basic research is often considered to be a public good.Private firms have relatively little incentive to undertakebasic scientific research on the functioning of the climateor on the costs and benefits of averting climate changebecause they cannot easily reap profits from the widespread, long term public benefits of learning about oraverting such change. Nor does industry have sufficientincentive to develop low emissions and emissions freeenergy technologies as long as the prices of fossil fuels donot reflect the potential costs of the damages to the climatethat fossil fuel use may cause. Because of the disparity between private incentives and public benefits, the government may be able to play a useful role by investing in—orencouraging private industry to invest in—basic andapplied R&D projects that will yield widespread publicbenefits. However, constraints on emissions would tendto enhance private incentives to undertake such projectsand weaken that rationale for government sponsoredresearch.
Ancillary Benefits of GreenhouseGas RestrictionsBy reducing the use of fossil fuels, restrictions on greenhouse gas emissions would also reduce emissions of otherpollutants such as sulfur dioxide from coal burning andnitrous oxide from automobiles. Those reductions, inturn, could yield a variety of benefits such as improve
ments in health, visibility, and water quality. Thus, thecosts of mitigating emissions of greenhouse gases wouldbe partially offset by the ancillary benefits of reducing theproblems caused by conventional pollutants.
In the United States, some economic studies (for example,Burtraw and others, 1999; and Burtraw and Toman,1997) have found that ancillary benefits from modestrestrictions on carbon dioxide emissions in the electricutility sector could offset a significant part of the restrictions’ cost. Those side benefits would include lower costsfor complying with current and impending regulationsthat restrict conventional air pollution, and health relatedbenefits from reduced emissions of conventional pollutantsthat are not already strictly controlled. More restrictivelimits on greenhouse gases could also lead to reductionsof conventional emissions beyond those already mandated,yielding further ancillary benefits. However, the moreemissions were reduced, the smaller the share of total coststhat the ancillary benefits would offset—mainly becausethe additional benefits from reducing conventional airpollutants would decline while the additional cost of reducing carbon emissions would continue to rise.
In developed countries that already control pollution,ancillary benefits from restricting greenhouse gas emissionsare likely to be similar to those found in the United States.But in developing countries with extensive conventionalpollution problems that remain unaddressed, ancillarybenefits—such as improvements in people’s health—couldbe significant.

5International Coordination of Climate Policy
Because the causes of climate change are global,the stabilization of greenhouse gas concentrations in theatmosphere will ultimately require international cooperation. However, the nature of the climate problem willmake agreement difficult to reach. Near term, concentrated costs of regulation combined with diffuse, longterm future benefits make it easy for countries to postponeaction. The scientific and economic uncertainty discussedin earlier chapters also makes it difficult to reach a consensus about the appropriate response. Although nationshave found it relatively easy to agree to expand, coordinate,and report climate related scientific and technological research, they have found it very hard to agree about whetherand how much to restrict the growth of greenhouse gasemissions.
That lack of agreement may stem in part from uncertainty,but it also reflects nations’ differing circumstances andconflicting interests. Policymakers in countries vulnerableto potential changes in climate favor dramatic action toavert warming, while policymakers whose countries appearto be less vulnerable are correspondingly less concerned.Countries with significant fossil fuel production or highlevels of emissions tend to oppose policies that would restrict the use of fossil fuels. Five countries (the UnitedStates, China, Russia, Saudi Arabia, and Canada) producemore than half of the world’s fossil carbon, and five countries (the United States, China, Russia, Japan, and India)account for about half of all fossil carbon consumption.Thus, a small group of nations can strongly influence thestructure and effectiveness of any agreement related toclimate change.
But the fundamental differences at the global level arebetween more and less affluent countries. Developedcountries have contributed the majority of historicalemissions, but countries that are now in the early stagesof development will account for the bulk of emissions overthe next century. Even so, on a per capita basis, developingcountries will continue to have much lower income andlevels of emissions than developed countries will have, andthey appear to be more vulnerable to damage from climatechange. As a consequence, policymakers in many developing countries favor significant action to reduce globalemissions—but only by developed nations. Put anotherway, they maintain that developed countries have alreadyused up a large portion of their rightful allotment of emissions and that developing countries now have a strongclaim to the bulk of emissions to be allowed in the future—those that are unlikely to cause serious damage to theclimate.
Because of the global nature of the climate problem andcompeting national interests, countries have little incentiveto act unilaterally to reduce emissions, and every nationhas an incentive to free ride and let other countriesshoulder most of the burden. As a result, the developmentof effective coordination of international climate policyis likely to be gradual, as was the 50 year process thatbrought the World Trade Organization to its currentform.
International Policy ConsiderationsIn addition to considering the nature of the climate changeproblem and the distribution of interests, policymakers
CHAPTER

44 THE ECONOMICS OF CLIMATE CHANGE: A PRIMER
who seek to foster effective international coordination maydraw from a wide range of past experience in the designand implementation of international environmental andother treaties, and of domestic regulatory systems as well.Some of the factors to be considered are purely international in scope. Other factors, which have been discussed in previous chapters, are common to domestic andinternational regulatory systems alike.
Cooperation among sovereign, independent nations caninvolve a variety of formal structures. Governments canagree to formal treaties, which are considered bindinginstruments under international law; or they can agree toless rigorous, nonbinding instruments—referred to as executive agreements in the United States—that serve asguidelines to action rather than as legal requirements.1
Cooperation can range from modest commitments toshare information and undertake coordinated research,to more extensive agreements to restrict emissions, monitor compliance, and enforce penalties.
Several other institutional considerations can influencethe effectiveness of international agreements (Victor andothers, 1998). Such agreements tend to be more effectivewhen they:
• Encourage relatively frequent interaction and extensivesharing of information among national delegates;
• Help link the solutions of related problems, such asclimate change and energy security or climate changeand biodiversity;
• Give countries incentives to continue to participateeven if other countries refuse to;
• Allow new countries to enter with relatively little effecton the system; and
• Distribute the cost of the response in a way that isacceptable to participating countries.
Regulatory ApproachesTo regulate the global growth of emissions, internationalnegotiators can draw on essentially the same set of optionsas domestic policymakers can: command and controlregulations, emissions taxes or permits, or a hybrid system.Negotiators would need to consider whether and how tocoordinate such policies among countries. Alternatively,they might allow each country to choose an independentsystem but still coordinate action in the form of agreedupon national targets.
As Victor and others (1998) have noted, agreements aremore likely to succeed if they involve commitments thatare relatively straightforward to apply and enforce. Nationsmay find it easier to commit to undertake research programs than to adopt uniform technologies, complex regulatory policies, or specific targets for emissions. Targetsmay be particularly difficult to decide on or achieve in theface of uncertainty about implementation costs.
Past international agreements have called for varying levelsof effort by different countries, but they have not usuallycalled for formally differentiated commitments. Instead,countries tend to interpret their commitments in waysthat reflect their different national circumstances anddomestic goals. Given the complexities that policymakersface in securing domestic political agreement about implementation, the more ambitious the commitments, themore varied the implementations are likely to be.
Countries with relatively large absolute or per capita emissions, or with large fossil fuel industries, are likely to insiston some degree of cost effectiveness before committingthemselves to restrictions on emissions—although politicaland distributional considerations may lead nations to ignore cost effectiveness. An international command andcontrol approach would be much more costly and difficultto monitor and enforce than would other approaches andis therefore unlikely to secure much backing.
Uniform international incentives are likely to be morecost effective than country specific regulations becauseevery country has at least some low cost opportunities toreduce emissions, whereas the incremental cost of controlling emissions in any given country is likely to risesteeply with increasingly tight restrictions. Developingcountries have particularly extensive low cost opportuni
1. This distinction is particularly important in the United States,where the terms of treaties, once ratified, take on the force of federallegislation within the U.S. legal system. Under international law,however, both types of agreements are considered binding.

CHAPTER FIVE INTERNATIONAL COORDINATION OF CLIMATE POLICY 45
ties, for several reasons: many of the costs of productionthere tend to be relatively low; energy use is rarely taxedand often subsidized; and energy efficiency is cheaper tobuild into new infrastructure in developing industries thanto retrofit in industries in developed nations. Restrictingemissions in only a few countries—particularly developedones—would therefore significantly raise the cost ofachieving almost any global goal for emissions.
Differences between countries’ emissions control policiescan also lead to “leakage” of energy consumption—andtherefore emissions—from one country to another. Forinstance, if only developed countries controlled emissions,they would consume less oil. International oil prices wouldfall in response, and developing countries would be ableto increase their oil consumption. Similarly, corporationsin emissions intensive industries could simply reduce theirinvestments in countries with stricter controls and increasetheir investments in countries with less strict or no controls, gradually transferring their production to them. Thatpotential leakage effect would raise the cost and reducethe effectiveness of more restrictive countries’ commitments.
Independent action would allow each country to tailorpolicies to its national circumstances. But a system of independent approaches would still require international agreement about what constituted an acceptable degree ofaction and of burden sharing. It would also be unlikelyto minimize emissions control costs, could lead to extensive leakage, and might present difficult problems inmonitoring and enforcement.
Much of the debate about international climate policy hasfocused on national quotas, or allowances, for emissions.Under such a system, nations would agree to allocate emissions rights in the form of strict limits, or caps. The limitscould apply to one , five , or 10 year periods, or indefinitely; nations would be free to meet the caps by usingthe domestic regulatory system of their choice. Some proposals would allow nations to trade emissions allowances.That feature would tend to equalize permit prices—andthus the incremental costs of mitigation—among participating countries and result in the most cost effectiveachievement of the overall emissions cap.
A system of quotas would make the international allocation of rights transparent. If quotas could be enforced,they would ensure that a strict emissions cap was met inparticipating countries. Given a strict limit, the international trading of emissions allowances could equalizeincremental costs, and the system would be relativelystraightforward to implement—at least it would be if itwas limited to carbon dioxide from fossil fuels—oncecountries determined how to allocate emissions allowancesdomestically.
However, an international cap on emissions could entailunnecessarily high costs if the cap was tighter than waswarranted for balancing the overall costs and benefits ofaverting climate change. That pitfall could be avoided byimplementing a hybrid permit system with a price cap—but only at the cost of abandoning strict emissionslimits and clear emissions rights.
In contrast to quotas, a price mechanism—a system ofuniform emissions taxes or fixed price permits—wouldguarantee equal incremental costs for emissions controlsat a fixed price without requiring any international tradingof emissions allowances. Furthermore, as discussed inChapter 4, price mechanisms are likely to constrain emissions more cost effectively than strict quotas, given theuncertainty about the net benefits of doing so.
But price mechanisms also present problems. A systemof taxes would not, by itself, address issues of internationalburden sharing. And maintaining strictly uniform taxeson emissions would be difficult in the face of fluctuatingexchange rates. Moreover, in negotiating a uniform pricemechanism, countries might want to consider the extensive variation in their existing energy taxes: even in theabsence of price or quantity based controls, the effectiveprice of carbon from fossil fuels differs significantly amongcountries and across fuels. Gasoline prices in westernEuropean countries, for example, are about three timeshigher, on average, than in the United States, largely because of taxes. In contrast, gasoline prices in many developing countries are lower. Countries that implicitly taxedemissions through their gasoline levies might argue thattheir existing systems constituted sufficient action and nofurther efforts were necessary.

46 THE ECONOMICS OF CLIMATE CHANGE: A PRIMER
ComplianceInternational agreements are particularly difficult to monitor and enforce because the parties to them are sovereignnations that tend to resist international oversight of domestic policies—and whose participation is ultimately voluntary. Few international environmental agreements haveprovisions for enforcement, and as a general rule, international organizations lack the jurisdiction or the resourcesto enforce them (General Accounting Office, 1999). Tomany observers, binding treaties with penalties seem morelikely than nonbinding ones to ensure compliance, andexperience shows that nearly all countries do, in fact, fulfilltheir binding commitments. However, given the uncertainty of politics and markets, governments cannot invariably ensure that they will be able to meet such commitments. They generally do so, not because they wouldface penalties for noncompliance but because they wouldnot have agreed in the first place to commitments thatthey were unlikely to fulfill.
Some observers argue that for a problem as complex asclimate change, international enforcement would requiresome form of penalty that involved trade and thereforeindirectly the World Trade Organization (WTO). Recentdecisions by the WTO have allowed nations to enforceenvironmental rules by penalizing imports on the basisof the processes used in their production (Victor, 2001,pp. 87 89). But some experts worry that entangling theWTO in complex environmental issues could endangerthe international trade system.
Yet experience also shows that countries tend to be morewilling to adopt clear, ambitious commitments when thosecommitments are nonbinding, especially when uncertaintyabout costs makes nations unwilling to accept bindingagreements that they might not be able to fulfill. (Escapeclauses in binding commitments can perform the samefunction.) Moreover, a nonbinding framework allowssubsets of countries to undertake deeper cooperation without excluding others from an agreement and promoteslearning by doing. The evidence thus suggests that inpractice, nonbinding agreements may significantly influence behavior (Victor and others, 1998, p. 685).
Restrictions on greenhouse gases vary in the ease withwhich emissions can be monitored and the limits on themenforced. Under binding agreements, carbon dioxide
emissions from the use of fossil fuels would be relativelyeasy to monitor, although in countries that had seriousproblems with law enforcement and tax evasion, compliance with the established limits could be difficult toachieve. For most other types of greenhouse gas emissions,the high costs of monitoring would reduce the likelihoodof strict compliance—or even of accurate documentation—in all countries.
International Institutions to AddressClimate ChangeInternational cooperation to address the prospect ofclimate change has been developing since 1988, when theUnited Nations and the World Meteorological Organization created the Intergovernmental Panel on ClimateChange (IPCC) to collect information and report onclimate related issues. Shortly thereafter, negotiationsbegan on the United Nations Framework Convention onClimate Change (FCCC), which was signed in 1992 andsubsequently ratified by nearly all the world’s nations. Theconvention provides for a permanent standing bureaucracydedicated to coordinating international climate policy andfor a Conference of the Parties to meet roughly once a yearto review and reconsider countries’ commitments in lightof the most recent findings on climate change.
The FCCC commits its signatories to undertake extensiveresearch (to better understand the climate system) and tostabilize atmospheric concentrations of greenhouse gasesat levels that would prevent dangerous climate change.The convention calls for managing the global climate ina manner that is both efficient and equitable, stipulatingthat climate related policies should be cost effective, butit also urges greater effort from a set of 35 developedcountries that are listed in the FCCC’s Annex I.2 However,the convention does not specify any targets for greenhousegas concentrations or a time frame for achieving stabiliza
2. Specifically, the document states that “policies and measures shouldbe cost effective so as to ensure global benefits at the lowest possiblecost. To achieve this, such policies and measures should take intoaccount different socio economic contexts, be comprehensive, coverall relevant sources, sinks and reservoirs of greenhouse gases andadaptation, and comprise all economic sectors” (United Nations,1997, article 3, section 3).
CHAPTER FIVE INTERNATIONAL COORDINATION OF CLIMATE POLICY 47
tion. Nor does it commit any country to specific limitson emissions or to specific actions to reduce emissions.
The Kyoto ProtocolAfter five years of international negotiations following theFCCC’s adoption, the third Conference of the Partiesadopted the 1997 Kyoto Protocol to the convention. Theprotocol calls for strict quantitative limits (or allowances)on emissions from 38 developed countries—largely thesame ones listed in Annex I of the convention.3 Thosecomplicated limits, which are specified in Annex B of theprotocol, are generally somewhat below the countries’1990 emissions levels and are scheduled to take effect during the so called First Budget Period, from 2008 to 2012.Non Annex B countries remain exempt from overall emissions constraints.
Under the protocol, countries are allowed a significantdegree of flexibility in meeting their commitments. Eachcountry may:
• Use any policies or technologies it prefers to meet itstargets;
• Achieve its overall target by reducing emissions overa “basket” of six different greenhouse gases rather thanjust reducing carbon dioxide emissions;
• Average its emissions across the entire five year periodrather than meet a specific target every year;
• Earn a limited quantity of credits (that is, additionalallowances) for forestry and agricultural projects thatsequester carbon;
• Receive credits by financing emissions reducing projects in other Annex B countries through a processcalled Joint Implementation;
• Receive credits by financing projects in non Annex Bcountries through another process known as the CleanDevelopment Mechanism;
• Buy, sell, or trade emissions allowances to an undetermined extent; and
• Join with other countries to reduce emissions as agroup.4
The protocol explicitly mentions that countries shouldpursue research and development programs but does notrequire a specific level of expenditures.
To enter into force, the Kyoto Protocol must be accepted,approved, acceded to, or ratified by at least 55 signatoriesto the convention, including countries that together in1990 accounted for at least 55 percent of total carbondioxide emissions from Annex I countries. In effect, theprovision means that the protocol must be ratified or approved by either the United States or Russia, which together accounted for over 50 percent of emissions fromAnnex I countries in that year. It also means that a handfulof countries with high levels of emissions could, if theyacted together, effectively veto the protocol.
Subsequent NegotiationsThe negotiations that followed those in Kyoto broughta substantial shift in direction. Talks collapsed in 2000over a dispute between U.S. and European delegates aboutthe use of international emissions trading and forestry programs to meet their commitments, with the United Statesarguing in favor of much greater flexibility than European
3. All of the countries listed in Annex B of the protocol are also listedin Annex I of the FCCC; however, a handful of Annex I countriesare not in Annex B. The protocol specifies an annual limit on emissions, measured as metric tons of carbon equivalent for each Annex B country. The limit is figured as a percentage of the country’sbase year emissions level. The base year is generally 1990, butcountries can choose 1995 as the base year for hydrofluorocarbons,perfluorocarbons, and sulfur hexafluoride. In addition, formerSoviet bloc nations, under some circumstances, can choose an alternate base year for all gases. The specified limits are 93 percent ofbase year emissions for the United States, 92 percent for thecountries of the old European Community, and 94 percent forJapan. The countries of the former Soviet bloc have limits rangingfrom 92 percent to 100 percent of their base year emissions levels.Other Annex B countries have limits ranging from 92 percent to108 percent of their base year emissions.
4. The countries of the European Union (EU), for example, intendto meet their individual targets as a group, with some countriesreducing emissions by more than the amount required by theirtargets to allow emissions to increase in other countries while stillmeeting the overall EU cap.
48 THE ECONOMICS OF CLIMATE CHANGE: A PRIMER
countries would accept. In early 2001, the Bush Administration indicated that it would not continue to negotiatethe terms of the protocol or submit the protocol to theSenate for ratification. Following the effective withdrawalof the United States from the process, the other partiesdecided to move ahead. In November 2001, they reachedagreement on nearly all outstanding implementationissues, largely along the more liberal lines of interpretationthat the United States had originally advocated. (WithoutU.S. participation to potentially drive up the demand foremissions credits, the liberal interpretation allowed theremaining parties to dramatically lower their likely implementation costs; Babiker and others, 2002, provide a detailed discussion.) The European Union ratified the protocol in May 2002, and Japan followed suit in June. Asof March 2003, 106 countries had ratified or acceded tothe protocol, and the ratifying countries accounted for44 percent of the carbon dioxide emissions from Annex Icountries in 1990 (United Nations, 2003). Ratificationby Russia would bring the treaty into force.
Assuming ratification under the current terms of the protocol, participating Annex B countries would probablybe able to meet their commitments at very little cost. Theywould have two sources of low cost emissions credits: theycould earn substantial credit for forestry projects, and theycould supplement reductions of domestic emissions withpurchases of emissions allowances and credits from othercountries. A few nations are expected to have substantialamounts of surplus emissions allowances during the 20082012 period—particularly Russia and the Ukraine: theiremissions fell dramatically during the economic collapseof the 1990s, and they have experienced substantial forestgrowth. (The expected surplus is often referred to as “hotair.”) Without U.S. participation to boost demand, theremaining Annex B countries will be able to buy the surplus allowances and forestry credits at a low cost and meettheir commitments without undertaking extensive domestic emissions reductions.
The upshot of these developments—assuming ratificationand implementation by the remaining parties and full useof the treaty’s many flexibility provisions—is that the protocol will result in relatively few commitments to undertake research, a complex set of emissions caps for a limited
set of developed countries for the 2008 2012 period, financial transfers among the parties amounting to severalbillion dollars per year for the purchase of emissions allowances, unlimited emissions rights for most countries, anda very limited reduction in the growth of global greenhouse gas emissions.
Implementation CostsThe international negotiations surrounding the protocolinspired a large number of analyses of the cost to theUnited States of meeting its proposed commitments. Suchanalyses are complicated by uncertainty about how thedetails of implementation might have been negotiated inan agreement that included the United States. In a recentreview of a number of studies, Lasky (forthcoming) hasestimated U.S. mitigation costs under three different setsof implementation rules.
• Under moderately restrictive implementation rules—that is, with some trading of emissions allowancesamong Annex B countries and modest reductions inemissions by non Annex B countries—Lasky estimatesthat the United States could have met its Kyoto commitment in 2010 for an incremental cost ranging from$44 to $245 per metric ton of carbon equivalent (in2002 dollars) and an overall economic cost of between0.4 percent and 1.5 percent of gross domestic product.
• Under a loose set of rules that permitted Annex Bcountries to pay for large emissions reductions in nonAnnex B countries and allowed extensive credit for thenet absorption of carbon dioxide by forests, the UnitedStates would have been able to meet its targets at almostno cost and with little effect on its economy.
• Under a very restrictive set of implementation rulesthat prohibited international trading of emissions allowances or credits and permitted only limited creditfor forestry projects, the United States could have facedincremental costs for emissions reductions rangingfrom $171 to $297 per mtce. Annual tax revenues (orthe annual value of auctioned emissions permits) couldhave totaled between $261 billion and $452 billion,and the policy might have reduced GDP by nearly2 percent.
CHAPTER FIVE INTERNATIONAL COORDINATION OF CLIMATE POLICY 49
Actions by the United StatesOver the past 15 years, the federal government has madesubstantial investments in research to understand theglobal climate system and the potential effects of climatechange, and to subsidize the development of carbonremoval and alternative energy technologies. The UnitedStates has also continued a variety of longstanding programs that tend to discourage emissions or encourage theremoval of greenhouse gases from the atmosphere—butthat were originally intended to achieve other goals, suchas pollution reduction, energy independence, and thelimitation of soil erosion. The programs include corporateaverage fuel economy (CAFE) standards, taxes on gasoline,air quality improvement programs, and the ConservationReserve Program. However, the United States has notadopted taxes or quotas that explicitly address the restraintof greenhouse gas emissions.
After negotiating and signing the Kyoto Protocol in 1997,the Clinton Administration did not offer it to the Senatefor ratification. It presented a plan for meeting the UnitedStates’ commitment, but many analysts raised concernsabout whether the plan could accomplish its goal. TheBush Administration, having withdrawn the United Statesfrom subsequent protocol negotiations, has largely continued the previous administration’s level of climaterelated expenditures: the President’s budget for fiscal year2003, for instance, proposed $4.5 billion of climaterelated spending, with $1.7 billion dedicated to climatescience (including potential impacts of climate change)and $1.3 billion to the development of energy and sequestration technologies.5 The Bush Administration currently
defines its goals in terms of a modest acceleration in therate of decline of emissions per dollar of GDP rather thanthe achievement of an emissions target at some point inthe future.6 In the meantime, and largely independentlyof federal action, some states and firms are adoptingpolicies that are intended to reduce their emissions.
Alternative ApproachesThe problems associated with the Kyoto Protocol haveinspired researchers to propose a variety of alternativepolicies for coordinating international efforts related toclimate change. Each approach represents a distinct interpretation of the available evidence about the likely benefitsand costs of climate change, the uncertainty surroundingit, and practical concerns about how climate policy wouldaffect domestic economies and the world economic system. Many of the approaches offer novel ways to addressthe simultaneous problems of limiting emissions and distributing the burden of regulation.
Some researchers (for example, Michaels, 2001) concludethat the rate of climate change is likely to be at the lowend of the current range of estimates and the effects largelybenign, and they argue for a laissez faire approach.7 Sucha policy would take no affirmative steps to avert potentialdamages from climate change or to develop institutionsto help coordinate international action.
Other analysts have proposed systems of emissions taxesor tradable emissions permits with fixed prices to limitthe costs of mitigation. One such proposal envisages a system of auctioned emissions permits for the United States
5. The Clinton Administration’s policies are enumerated in Congressional Budget Office (1998), and the Bush Administration’sin Executive Office of the President (2002). Relatively little scientific research is dedicated to understanding the potential effectsof climate change on society, the area that studies suggest wouldyield the largest economic benefits. According to the NationalScience and Technology Council (2001), the U.S. Global ChangeResearch Program allocated over 80 percent of its $1.6 billionbudget for fiscal year 2002 to basic climate science and less than20 percent to research on the human and ecosystem dimensionsof climate change.
The federal government spent approximately $69 billion (in 2001dollars) between 1978 and 2001 on energy related research anddevelopment, with expenditure levels currently running at roughly
one third of their pre 1980 level. Roughly 41 percent of the cumulative spending was focused on nuclear energy, 27 percent on fossilenergy, and 32 percent on conservation and renewable energy. SeeDepartment of Energy, Energy Information Administration (2000),Table C1, pp. 114 115, as well as the Budget of the United StatesGovernment for fiscal year 2003, p. 171.
6. The Administration has released a draft research plan for comments(Climate Change Science Program, 2002) and stated that it willrelease a revised plan in June 2003.
7. In this view, the Framework Convention on Climate Change andthe Kyoto Protocol are “based on a naive interpretation of . . .science” and their benefits are “undetectable.”
50 THE ECONOMICS OF CLIMATE CHANGE: A PRIMER
that would require producers to purchase permits for theright to sell fossil fuels. The permits would be requiredat the point of import or first sale, and the revenues wouldbe returned to households and states. The charge wouldstart at $25 per metric ton of carbon in 2002 and rise by7 percent per year (after inflation) through 2007.8 Thatapproach would be relatively cost effective, although itwould not be as cost effective as using the revenues to reduce distortionary preexisting taxes. The option wouldalso address distributional concerns but only at the domestic level. A similar system could be envisaged for othercountries, and several proposals for an international systemcall for both setting national targets for emissions andestablishing a maximum price (or “safety valve”) at whichgovernments provide additional permits for domesticemissions (see Aldy, Orszag, and Stiglitz, 2001, pp. 25 28;McKibbin and Wilcoxen, 2002, pp. 199 221; and Victor,2001, pp. 101 108).
Another researcher (Nordhaus, 1998) has proposed a system in which countries with per capita income of morethan $10,000 (in 1990 dollars) impose emissions taxeson domestic sales of fossil fuels. Under that approach,countries would use a complex voting scheme to decideon a price path for emissions over time, and developingcountries would join the system once their per capitaannual income rose above the trigger level. Participatingnations would enforce the system through duties on imports from nonparticipating countries, which would belevied on each such country in proportion to the carboncontent of its total exports. The approach has several advantages: it provides a method for deciding on a uniformemissions price in the face of conflicting views about theappropriate price and allows for gradual implementationand enforcement through international trade institutions.
For simplicity’s sake, the proposal ignores emissions fromnon fossil energy sources and exempts countries with lowper capita income for distributional reasons. The systemwould yield an estimated two thirds of the net benefitsthat could be realized by an ideal system covering onlyemissions from fossil energy use. Furthermore, nearly allregions would share in the system’s beneficial effects onthe climate.
An alternative approach (Bradford, 2002) differs from thepreceding one by advocating explicit emissions rights, theequivalent of a uniform international emissions tax, and,at the same time, a system of international burden sharingthat would be institutionally separate from the allocationof property rights. The approach calls for countries tonegotiate and agree on country specific, long term, projected “business as usual” trends in emissions. For eachcountry, its agreed upon trend would serve as its emissionsquota, which it could allocate domestically as it saw fit.Countries would also contribute financial resources to aninternational bank that would purchase and retire emissions allowances from their owners at a fixed, negotiatedprice, which could be renegotiated from time to time inthe light of new information. The approach thus involvesthree elements: allocating emissions, determining a pricetrajectory, and distributing burdens.9
Yet another proposal (McKibbin and Wilcoxen, 2000,2002) would create and distribute among nations tworelated types of explicit property rights for emissions. Along term emissions endowment, which would be validin only one country, would give its owner a permanentright to receive annual emissions permits. A limited number of endowments would be allocated to each countryon the basis of the Kyoto targets for domestic distribution.Each government could also sell an unlimited numberof permits every year at a price that would be fixed eachdecade by international agreement. There would be nointernational trading of emissions allowances or credits.
8. Kopp, Morgenstern, and Pizer (1997) describe the original proposalby Resources for the Future (RFF), a nonprofit research groupspecializing in environmental economics. Another version can befound in Sky Trust (2000). According to RFF researchers’estimates, the program would reduce U.S. emissions by roughly16 percent in 2007, yielding a substantial fraction of the emissionsreductions needed to meet the original U.S. commitment underthe Kyoto Protocol. Using Lasky’s (forthcoming) estimates of U.S.mitigation costs, that system would reduce emissions by between5 percent and 8 percent. A number of other proposed domesticprograms are described in detail in Congressional Budget Office(2000, 2001).
9. Short of controlling emissions directly, developed countries couldslow emissions growth in developing countries by helping financethe installation of energy efficient and non fossil energy technologies during the development process. Such a plan is proposedby Schelling (2002, p. 8).

CHAPTER FIVE INTERNATIONAL COORDINATION OF CLIMATE POLICY 51
The system would yield two distinct markets in everycountry: a market for permits, with the permits’ price fixedby international accord and their number determined bymarket demand; and a market for endowments, with thenumber of endowments set internationally and their pricedetermined by the market’s expectations about futurepermit prices. If the demand for permits in a country roseabove the number of endowments in a given year, the government would sell enough permits to meet demand atthe fixed price. If demand did not exceed the number ofendowments, the permits’ price would be lower.
To address developing countries’ distributional concerns,Annex I countries would receive endowment levels thatwere below their total current emissions; non Annex Icountries would receive endowments above their currentlevels. That distribution would lead to different prices forpermits and endowments in the two groups of countries.But even if developing countries’ permit prices were zeroin a given year, their endowments would reflect the permits’ expected future value—which would send a longterm signal to investors in those countries about the costof emissions in the future. That signal could help encourage investment in energy efficient technologies and processes in the long term and discourage emissions “leakage”from Annex I countries.
If the risks of climate change proved to be significant,countries could negotiate an increasingly higher worldprice for emissions that would gradually reduce each coun
try’s to the level of its endowments. After that, the country’s government would have to buy back endowmentsto further constrain emissions and be consistent with thenegotiated permit price.
By allowing different permit prices in different regions,possibly for an extended period, the proposed systemwould trade away some cost effectiveness to accommodatedistributional concerns. Governments could also addressdomestic distributional concerns through their allocationsof emissions endowments. At the same time, the systemwould build a constituency of endowment owners in bothdeveloped and developing countries who would holdproperty rights for emissions—and who would thereforebenefit from a rise in permit prices.
The system would be decentralized but coordinatedthrough the initial international allocation of endowmentsand the establishment of permit prices. As a result, problems in one country would generally not affect marketsfor permits and endowments in others. The system wouldbe flexible enough to adapt both to changing political andeconomic circumstances and to shifts in the rate of climatechange. Permit prices could be rapidly adjusted in response to new information, and endowment prices wouldadjust accordingly. Countries could enter the systemsimply by agreeing to an internationally negotiated emissions endowment and permit price, allocating their endowments domestically, and enforcing the fixed pricepermit system.


Economic Models and Climate Policy
The economics literature contains hundreds of estimates of the costs or benefits (or both) of slowing, mitigating, or adapting to changes in the global climate resulting from human activities. Those estimates are derivedmainly from a variety of computer models of economicactivity that have been developed for other purposes andadapted to climate policy analysis. The variety of analyticapproaches used makes it difficult even for modelers tointerpret the differences among results from differentstudies. Researchers and policymakers are forced to integrate information from many sources and develop a synthesis based on a range of studies and approaches, eachof which provides insight into some aspects of the problemwhile ignoring others.
Like their climate related counterparts, modern modelsof the economy are composed of systems of mathematicalequations that represent distinct but interacting processesin the real world and that are solved together to representthe simultaneous interaction of the parts within the whole.Even the most complex models of the physical climateor the economy inevitably lack detail. For example, manystudies focus on the costs of mitigating climate changeand ignore the potential benefits. Others focus only oncosts in one sector or only on certain kinds of costs. Engineering studies evaluate the direct costs associated withadopting specific efficient technologies but tend to ignorelarger scale economic issues such as macroeconomic costsand impacts on international trade. Economic studies attempt to include a wider range of direct and indirect economic costs associated with emissions controls or withthe effects of climate change, but they tend to use simplerepresentations of technology. Some integrated assessmentstudies go further and try to incorporate both the costsof mitigation and the economic impacts of climate change.But to capture those very large scale aspects of the prob
lem, they rely on simplistic representations of manyeconomic and environmental details.
Types of ModelsEconomic analyses yield a wide range of cost estimatesfor a given climate change mitigation policy, but mostof the variation in results is due to identifiable differencesin the approaches and assumptions that the studies use.Many analyses use one of several “top down” approachesthat represent the entire economy in an internally consistent way: they account for more or less all production andconsumption; inputs of capital, labor, and energy; investment, taxes, and government spending; internationaltrade; prices; interest and exchange rates; and so on. Topdown approaches allow researchers to account for manyof the indirect economic effects of climate change policiesthat would primarily affect markets for energy; but theyoften ignore important details involving the gradual turnover of energy using equipment, the choice of equipment,energy market barriers, and other factors. Nevertheless,they tend to produce fairly reasonable projections of overall energy use and thus emissions.
In contrast, “bottom up” models draw on engineering coststudies to represent the details of specific energy relatedtechnologies, but they tend to include much less detailabout nonenergy sectors and other aspects of the economy.Unless constrained to do otherwise, bottom up modelsalways choose the most cost effective technologies (froman engineering standpoint)—and therefore tend to produce rather unrealistic results.
Top down modeling approaches, which as a class aresometimes referred to as macroeconomic models, generallyfall into one of two groups. The traditional macro
APPENDIX
54 THE ECONOMICS OF CLIMATE CHANGE: A PRIMER
econometric, or “macro,” forecasting models that makeup the first group are particularly useful in simulating thegradual adjustment of the economy to various kinds ofshocks, such as changes in monetary and fiscal policy,higher energy prices, and exchange rate fluctuations.Macro models are particularly helpful in studying shortterm (for example, five year) responses and adjustmentsto economic shocks, but they do not represent specificmarkets in detail. Nor do they represent forward lookingexpectations and behavior—an important element of economic activity, as discussed in the next section.
In contrast, computable general equilibrium (CGE)models, which form the second group, are useful in analyzing long term responses to policies, over a decade ormore. State of the art CGE models incorporate forwardlooking behavior, fairly detailed markets for specific factorsand products, some types of gradual adjustment, aspectsof long run growth and technological progress, and detailed representations of the tax system and of internationaltrade and finance. Some CGE models also include different groups and generations of households so that they cananalyze the distributional impacts of climate change policies. Their disadvantage is that they do not capture gradualadjustments or elements of the business cycle very well.In particular, they have a hard time representing the gradual process through which industries and households replace equipment that is outmoded by policy shifts (aswhen consumers replaced cars that used leaded gas) andthe gradual process through which a market economy adjusts to the economywide inflation that could result fromsignificant increases in energy prices brought on by restricting emissions.
Many researchers combine several different models withina single modeling framework. For example, the EnergyInformation Administration’s National Energy ModelingSystem integrates a set of models of particular energy sectors, a national macroeconometric model, and an international econometric model. Other frameworks addmodels of the agriculture and forestry sectors to simulateflows of carbon dioxide and methane in those areas of theeconomy. Models that treat in detail the economy’senergy or carbon intensive subsectors tend to providegreater insight into those sectors’ responses to climate policies than do less complex approaches.
Treatment of ExpectationsOne of the most complicated aspects of economics is thatpeople decide what to do today in part on the basis of theirexpectations about the future. Modeling people’s expectations is crucial to forecasting, but there is no simple formula to describe how people form them. Economiststypically model expectations in one of two almost polarways. One method represents behavior as adaptive: in thatrepresentation, people do not have an explicit understanding of how the economy will evolve and simplyextrapolate from past experience into the future. The otherapproach represents people’s behavior as forward looking,which is also termed model consistent or rational: in thatrepresentation, people correctly anticipate the future evolution of the economy unless the modeler engineers anexplicit shock.
The assumption of adaptive behavior, which is generallyused in macroeconometric models, yields forecasts inwhich people fail to anticipate known developments—forexample, they will fail to prepare for a change in policythat is announced 10 years in advance. In contrast, theassumption of forward looking behavior, which is usedin a number of sectoral and general equilibrium models,yields forecasts in which people perfectly anticipate alldevelopments. Both assumptions are extreme, and theyyield significantly different results.
When models with adaptive expectations are used to estimate the costs of a tax on emissions or a permit system,they tend to produce somewhat higher cost estimates thanmodels with forward looking expectations, all else beingequal. That happens because people in forward lookingmodels have time to adapt to any policy that is announcedin advance. Modelers who use adaptive expectations adjustfor that limitation by gradually phasing in the policy, tosimulate the anticipation of forward looking individuals.A more difficult problem for models that use adaptive expectations is how to represent the gradual turnover of thecapital stock in response to a policy shift. A few modelerscombine adaptive and forward looking assumptions,yielding results that in many ways are between the twoextremes.

APPENDIX ECONOMIC MODELS AND CLIMATE POLICY 55
Technological ChangeTo model future economic growth and the effects of emissions restrictions, modelers have to guess what kinds oftechnologies are going to be available at various pointsin the future and simulate their effects under scenariosthat include and exclude policies to reduce emissions.Forecasting the use of particular technologies for the nearto medium term is relatively straightforward, for two reasons: much of the capital stock (especially energy usingcapital) lasts a long time, and innovations usually take afairly long time to make their way into the market. Nevertheless, analysts have often failed in the past to anticipatetechnological advances that seem fairly obvious in retrospect, such as the relatively rapid development of the Internet in the 1990s, or—an innovation that is closer to theissue of climate change—the adoption of natural gaspowered combined cycle electricity generation. As forecasters look forward over two or more decades, their abilityto anticipate technological developments becomes increasingly weak.
Most models represent the pace and direction of technological change in a fairly simple way because the underlying forces of change are not well understood. The modelstypically assume that independent developments will gradually reduce the amount of capital, labor, and, in particular, energy required to produce goods and services. Theprocess of reducing energy inputs per unit of output isoften represented by a parameter called the autonomousenergy efficiency improvement (AEEI) parameter.1 Forgiven rates of growth of gross domestic product andenergy prices, an assumption of a higher AEEI impliesthat energy efficiency will improve more quickly and
emissions will grow less quickly. A lower AEEI impliesthe reverse. Such a model can be used to analyze howchanges in energy prices might encourage more or less useof energy, relative to the autonomous trend. Somewhatmore complex models extend that basic process by projecting a menu of technologies that are expected to beavailable in the future and then analyzing how changesin energy prices would encourage people to switch to moreenergy efficient types of equipment.
However, as discussed in Chapter 4, technological developments also respond to shifts in relative prices. Virtuallyno model simulates the effect of energy prices on theautonomous trend or on the menu of available technologies. Although the size of that so called inducementeffect is controversial, cost estimates that ignore it probably overestimate the incremental cost of reducingemissions over the longer run—say, 20 years or more.
Integrated AssessmentA consistent analysis of both the costs and benefits ofpolicies related to climate change requires a modelingframework with certain characteristics: it should covernational and international greenhouse gas emissions frommany sectors of the economy; it should translate emissionsof greenhouse gases into changes in the atmospheric andglobal climate; and it should evaluate the impacts ofclimate change on people and ecosystems. A number ofso called integrated assessment models are under development, as are simplified reduced form models based onmore complicated frameworks. To analyze distributionalissues, some models separate the world into a number ofregions or include several overlapping generations ofhouseholds. A few of the models also incorporate a rangeof uncertainty in their choice of parameters or in theirsolution procedures (see Chapter 3).
1. The simpler models also use the same representation to accountfor the fact that as people’s income rises, they use more and moreof it to buy services that do not require as much energy to produceas do manufactured goods.


References
The references cited in this study, organized by chapter, are listed below.
Chapter 2
Alley, R.B., and others. 2003. “Abrupt Climate Change.” Science, vol. 299 (March 28), pp. 2005 2010.
Babiker, Mustafa, and others. 2001. The MIT Emissions Prediction and Policy Analysis (EPPA) Model: Revisions, Sensitivities,and Comparisons of Results. Report no. 71. Cambridge, Mass.: Massachusetts Institute of Technology Joint Programon the Science and Policy of Global Change.
Boyd, Philip W., and others. 2000. “A Mesoscale Phytoplankton Bloom in the Polar Southern Ocean Stimulated by IronFertilization.” Nature, vol. 407 (October 12), pp. 695 702.
Broecker, Wally S., and Sidney Hemming. 2001. “Climate Swings Come into Focus.” Science, vol. 294 (December 14),pp. 2308 2309.
Carbon Dioxide Information Analysis Center. 2000. Trends Online: A Compendium of Data on Global Change. Oak Ridge,Tenn.: Department of Energy, Oak Ridge National Laboratory, Carbon Dioxide Information Analysis Center. Availableat http://cdiac.esd.ornl.gov/trends/trends.htm.
Clark, Peter U., and others. 2001.“The Role of the Thermohaline Circulation in Abrupt Climate Change.” Nature, vol. 415(February 21), pp. 863 869.
Congressional Research Service. 2001. Global Climate Change Briefing Book. March 8. Available at www.congress.gov/brbk/html/ebgcc1.shtml.
Crowley, Thomas J. 1996. “Remembrance of Things Past: Greenhouse Lessons from the Geologic Record.” Consequences,vol. 2, no. 1, pp. 2 12.
Crowley, Thomas J., and Robert A. Berner. 2001. “CO2 and Climate Change.” Science, vol. 292 (May 4), pp. 870 872.
Department of Energy. 1997. CO2 Capture, Reuse, and Storage Technologies for Mitigating Global Climate Change: A WhitePaper. DOE Order no. DE AF22 96PC01257. Prepared by Howard Herzog and others at the Massachusetts Instituteof Technology Energy Laboratory. January.

58 THE ECONOMICS OF CLIMATE CHANGE: A PRIMER
Department of Energy, Energy Information Administration. 2001. Annual Energy Review 2000. DOE/EIA 0384 (2000).
Department of Energy, Energy Information Administration. 2002a. Annual Energy Review 2001. DOE/EIA 0384(2001).November.
Department of Energy, Energy Information Administration. 2002b. International Energy Outlook 2002. DOE/EIA 0484(2002). March.
Department of State. 2002. United States Climate Action Report 2002. May.
The Economist, “Economics Focus: Hot Potato, the Intergovernmental Panel on Climate Change Had Better Check ItsCalculations,” February 15, 2003, p. 72.
Edmonds, J. 2002. “Atmospheric Stabilization: Technology Needs, Opportunities, and Timing.” Pp. 47 57 in J.A. Riggs,ed., U.S. Policy on Climate Change: What Next? Aspen, Colo.: Aspen Institute. Available at www.aspeninstitute.org/aspeninstitute/files/Img/EdmondsEEEClimate.pdf.
Falkowski, P., and others. 2000. “The Global Carbon Cycle: A Test of Our Knowledge of Earth as a System.” Science,vol. 290, no. 5490 (October 13), pp. 291 296.
Field, Christopher B. 2001.“Sharing the Garden.” Science, vol. 294 (December 21), pp. 2491 2492.
Ganopolski, Andrey, and Stefan Rahmstorf. 2001. “Rapid Changes of Glacial Climate Simulated in a Coupled ClimateModel.” Nature, vol. 409 (January 11), pp. 153 158.
Heal, Geoffrey, and Bengt Kriström. 2002. “Uncertainty and Climate Change.” Environmental and Resource Economics,vol. 22, pp. 3 39.
Hoerling, Martin, and Arun Kumar. 2003. “The Perfect Ocean for Drought.” Science, vol. 299 (January 31), pp. 691 694.
Holtz Eakin, Douglas, and Thomas M. Selden. 1995. “Stoking the Fires? CO2 Emissions and Economic Growth.” Journalof Public Economics, vol. 57 (January), pp. 85 101.
Houghton, J.T., and others, eds. 2001. Climate Change 2001: The Scientific Basis. Cambridge, U.K.: Cambridge UniversityPress.
Houghton, R.A., and David L. Skole. 1990. “Carbon.” In B.L. Turner II and others, eds., The Earth as Transformed byHuman Action: Global and Regional Changes in the Biosphere over the Past 300 Years. Cambridge, U.K.: CambridgeUniversity Press, pp. 393 408.
Kerr, Richard A. 2001. “Rising Global Temperature, Rising Uncertainty.” Science, vol. 292, no. 5515 (April 13), pp. 192 194.
Kump, Lee R. 2001. “Chill Taken Out of the Tropics.” Nature, vol. 413 (October 4), pp. 470 471.
Kvenvolden, Keith A. 1999. “Potential Effects of Gas Hydrate on Human Welfare.” Proceedings of the National Academyof Sciences, vol. 96 (March), pp. 3420 3426.
Lamb, H.H. 1995. Climate, History, and the Modern World. 2nd ed. New York: Routledge.
REFERENCES 59
Mahlman, Jerry D. 2001. “The Long Time Scales of Human Caused Climate Warming: Further Challenges for the GlobalPolicy Process.” Paper prepared for the Pew Center on Global Climate Change Workshop on the Timing of ClimateChange Policies. October. Available at www.pewclimate.org/events/timing_presentations.cfm.
Marland, G., T.A. Boden, and R.J. Andres. 2002. “Global, Regional, and National Fossil Fuel CO2 Emissions.” In Trends:A Compendium of Data on Global Change. Oak Ridge, Tenn.: Oak Ridge National Laboratory, Carbon DioxideInformation Analysis Center.
Masters, William A., and Margaret S. McMillan. 2000. “Climate and Scale in Economic Growth.” CID Working Paperno. 48. Cambridge, Mass.: Center for International Development at Harvard University.
McCarl, Bruce A., and Uwe A. Schneider. 2001. “Greenhouse Gas Mitigation in United States Agriculture and Forestry.”Science, vol. 294 (December 21), pp. 2481 2482.
McCarthy, James J., and others, eds. 2001. Climate Change 2001: Impacts, Adaptation, and Vulnerability. Cambridge, U.K.:Cambridge University Press.
Mendelsohn, Robert O., and James E. Neumann, eds. 1999. The Impact of Climate Change on the United States Economy.Cambridge, U.K.: Cambridge University Press.
Metz, Bert, and others, eds. 2001. Climate Change 2001: Mitigation. Cambridge, U.K.: Cambridge University Press.
Moore, Thomas Gale. 1998. Climate of Fear: Why We Shouldn’t Worry About Global Warming. Washington, D.C.: CatoInstitute.
Nakiƒenoviƒ, Nebojša, and Rob Swart, eds. 2000. Emission Scenarios. Cambridge, U.K.: Cambridge University Press.
National Assessment Synthesis Team. 2000. Climate Change Impacts on the United States: The Potential Consequences ofClimate Variability and Change. Cambridge, U.K.: Cambridge University Press.
National Science and Technology Council, Committee on Environment and Natural Resources, Subcommittee on GlobalChange Research. 2001. Our Changing Planet: The FY2002 United States Global Change Research Program. September.Available at www.gcrio.org/ocp2002/.
Nordhaus, William D. 1994. Managing the Global Commons: The Economics of Climate Change. Cambridge, Mass.: MITPress.
Nordhaus, William D., ed. 1998a. Economic and Policy Issues in Climate Change. Washington, D.C.: Resources for theFuture Press.
Nordhaus, William D. 1998b. “New Estimates of the Economic Impacts of Climate Change.” Unpublished paper,Department of Economics, Yale University. December. Available at www.econ.yale.edu/~nordhaus/homepage/climatewrite.htm.
Nordhaus, William D., and Joseph Boyer. 2000. Warming the World: Economic Models of Global Warming. Cambridge,Mass.: MIT Press.
60 THE ECONOMICS OF CLIMATE CHANGE: A PRIMER
Pearson, Paul N., and Martin R. Palmer. 2000. “Atmospheric Carbon Dioxide Concentrations over the Past 60 MillionYears.” Nature, vol. 406 (August 17), pp. 695 699.
Porter, Edward D. 1995. “Are We Running Out of Oil?” Discussion Paper no. 81. Washington, D.C.: American PetroleumInstitute. December.
Reilly, John M., Henry D. Jacoby, and Ronald G. Prinn. 2003. Multi Gas Contributors to Global Climate Change: ClimateImpacts and Mitigation Costs of Non CO2 Gases. Arlington, Va.: Pew Center on Global Climate Change. February.
Richerson, Peter J., and others. 2001. “Was Agriculture Impossible During the Pleistocene but Mandatory During theHolocene? A Climate Change Hypothesis.” American Antiquity, vol. 66, no. 3 (July), pp. 387 411.
Sala i Martin, Xavier. 1997. “I Just Ran Two Million Regressions.” American Economic Review, vol. 87, no. 2 (May),pp. 178 183.
Schimel, D. S., and others. 2001. “Recent Patterns and Mechanisms of Carbon Exchange by Terrestrial Ecosystems.” Nature,vol. 414 (November 8), pp. 169 172.
Scholes, R.J., and I.R. Noble. 2001. “Storing Carbon on Land.” Science, vol. 294 (November 2), pp. 1012 1013.
Shackleton, N. J., 2000. “The 100,000 Year Ice Age Cycle Identified and Found to Lag Temperature, Carbon Dioxide,and Orbital Eccentricity.” Science, vol. 289, no. 5486 (September 15), pp. 1897 1902.
Veizer, Ján, Yves Godderis, and Louis M. François. 2000. “Evidence for Decoupling of Atmospheric CO2 and GlobalClimate During the Phanerozoic Eon.” Nature, vol. 408 (December 7), pp. 698 701.
Watson, Robert T., and others, eds. 2000. Land Use, Land Use Change, and Forestry. Cambridge, U.K.: Cambridge UniversityPress.
Watson, Robert T., and others, eds. 2001. Climate Change 2001: Synthesis Report. Cambridge, U.K.: Cambridge UniversityPress.
Weart, Spencer R. 1997. “The Discovery of the Risk of Global Warming.” Physics Today, vol. 50, no. 1 (January), pp. 34 40.
Webster, Mort, and others. 2002. Uncertainty Analysis of Climate Change and Policy Response. Report no. 95. Cambridge,Mass.: Massachusetts Institute of Technology Joint Program on the Science and Policy of Global Change. December.
World Energy Council. 2001. Survey of Energy Resources, 19th Edition. London: World Energy Council. Available atwww.worldenergy.org/wec geis/publications/default/launches/ser/ser.asp.
Zachos, James, and others. 2001. “Trends, Rhythms, and Aberrations in Global Climate 65 Ma to Present.” Science, vol. 292(April 27), pp. 686 693.
Zwiers, Francis W. 2002. “The 20 Year Forecast,” Nature, vol. 416 (April 18) , pp. 690 691.

REFERENCES 61
Chapter 3
Congressional Budget Office. 2000. Who Gains and Who Pays Under Carbon Allowance Trading? The Distributional Effectsof Alternative Policy Designs. June.
Cropper, Maureen L., Sema K. Aydede, and Paul R. Portney. 1994. “Preferences for Life Saving Programs: How the PublicDiscounts Time and Age.” Journal of Risk and Uncertainty, vol. 8, pp. 243 265.
Heal, Geoffrey, and Bengt Kriström. 2002. “Uncertainty and Climate Change.” Environmental and Resource Economics,vol. 22, pp. 3 39.
Howarth, Richard B. 2001. “Climate Rights and Economic Modeling.” Pp. 315 336 in Darwin Hall and Richard B.Howarth, eds. The Long Term Economics of Climate Change: Beyond a Doubling of Greenhouse Gas Concentrations.Amsterdam: Elsevier Science B.V.
Keller, Klaus, and others. 2000. Preserving the Ocean Circulation: Implications for Climate Policy. Working Paper no. 7476.Cambridge, Mass.: National Bureau of Economic Research. January.
Lasky, Mark. Forthcoming. The Economic Costs of Reducing Emissions of Greenhouse Gases: A Survey of Economic Models.CBO Technical Paper.
Newell, Richard, and William Pizer. 2001. Discounting the Benefits of Climate Change Mitigation: How Much Do UncertainRates Increase Valuations? Arlington, Va.: Pew Center on Global Climate Change. December.
Newell, Richard, James Sanchirico, and Suzi Kerr. 2002. Fishing Quota Markets. Discussion Paper 02 20. Washington,D.C.: Resources for the Future. August.
Nordhaus, William D. 1994. Managing the Global Commons: The Economics of Climate Change. Cambridge, Mass.: MITPress.
Nordhaus, William D. 2000. Warming the World: Economic Models of Global Warming. Cambridge, Mass.: MIT Press.
Nordhaus, William D., and David Popp. 1997. “What Is the Value of Scientific Knowledge? An Application to GlobalWarming Using the PRICE Model.” Energy Journal, vol. 18, no. 1, pp. 1 47.
Papathanasiou, Demetrios, and Dennis Anderson. 2001. “Uncertainties in Responding to Climate Change: On the EconomicValue of Technology Policies for Reducing Costs and Creating Options.” Energy Journal, vol. 22, no. 3, pp. 79 114.
Pizer, William A. 1997. Prices vs. Quantities Revisited: The Case of Climate Change, Working Paper no. 98 02. Washington,D.C.: Resources for the Future. October.
Webster, M.D. 2002. “The Curious Role of ‘Learning’ in Climate Policy: Should We Wait for More Data?” Energy Journal,vol. 23, no. 2, pp. 97 119.
Weitzman, Martin L. 1999. “Just Keep Discounting, But. . . .” In Paul R. Portney and John P. Weyant, eds., Discountingand Intergenerational Equity. Washington, D.C.: Resources for the Future, pp. 23 29.
Weitzman, Martin L. 2001.“Gamma Discounting.” American Economic Review, vol. 91, no. 1, pp. 260 271.

62 THE ECONOMICS OF CLIMATE CHANGE: A PRIMER
Wigley, T.M.L., R. Richels, and J.A. Edmonds. 1996. “Economic and Environmental Choices in the Stabilization ofAtmospheric CO2 Concentrations.” Nature, vol. 379 (January 18), pp. 240 243.
Chapter 4
Babiker, Mustafa H., Gilbert E. Metcalf, and John Reilly. 2002. Tax Distortions and Global Climate Policy. Report no. 85.Cambridge, Mass.: Massachusetts Institute of Technology Joint Program on the Science and Policy of Global Change.May.
Baumol, William J., and Wallace E. Oates. 1988. The Theory of Environmental Policy. 2nd ed. Cambridge, U.K.: CambridgeUniversity Press.
Burtraw, Dallas, and Michael Toman. 1997. The Benefits of Reduced Air Pollutants in the United States from GreenhouseGas Mitigation Policies. Discussion Paper 98 01 REV. Washington, D.C.: Resources for the Future. November.
Burtraw, Dallas, and others. 1999. Ancillary Benefits of Reduced Air Pollution in the United States from Moderate GreenhouseGas Mitigation Policies in the Electricity Sector. Discussion Paper 99 51. Washington, D.C.: Resources for the Future.September.
Congressional Budget Office. 1990. Energy Use and Emissions of Carbon Dioxide: Federal Spending and Credit Programsand Tax Policies. CBO Paper. December.
Congressional Budget Office.1996. Labor Supply and Taxes. CBO Memorandum. January.
Congressional Budget Office. 2000. Who Gains and Who Pays Under Carbon Allowance Trading? The Distributional Effectsof Alternative Policy Designs. June.
Congressional Budget Office. 2001. An Evaluation of Cap and Trade Programs for Reducing U.S. Carbon Emissions. June.
Congressional Budget Office. 2002. Reducing Gasoline Consumption: Three Policy Options. November.
Crampton, Peter, and Suzi Kerr. 1998. Tradable Carbon Allowance Auctions: How and Why to Auction. Washington, D.C.:Center for Clean Air Policy. March.
Department of Energy. 1997. Manufacturing Consumption of Energy 1994. DOE/EIA 0512(94). December.
Department of Energy, Energy Information Administration. 1992. Federal Energy Subsidies: Direct and Indirect Interventionsin Energy Markets. DOE/EIA SR/EMEU/92 02.
Department of Energy, Energy Information Administration. 2000. Federal Financial Interventions and Subsidies in EnergyMarkets,1999: Energy Transformation and End Use. DOE/EIA SR/OIAF/2000 02. May. Available at www.eia.doe.gov/oiaf/servicerpt/subsidy1/pdf/sroiaf(2000)02.pdf.
Department of Energy, Energy Information Administration. 2002. Federal Financial Interventions and Subsidies in EnergyMarkets, 1999: Primary Energy. DOE/EIA SR/OIAF/99 03. September. Available at www.eia.doe.gov/oiaf/servicerpt/subsidy/pdf/sroiaf(99)03.pdf.

REFERENCES 63
Energy Modeling Forum. 1996. Markets for Energy Efficiency. EMF Report no. 13, vol. 1. Stanford, Calif.: StanfordUniversity. September.
Executive Office of the President. 1993. The Climate Change Action Plan. October. Available at www.gcrio.org/USCCAP/toc.html.
Fischer, Carolyn, Ian W.H. Parry, and William A. Pizer. 1998. Instrument Choice for Environmental Protection WhenTechnological Innovation Is Endogenous. Discussion Paper no. 99 04. Washington, D.C.: Resources for the Future. October.
Goulder, Lawrence H., and Steven H. Schneider. 1996. Induced Technological Change, Crowding Out, and the Attractivenessof Carbon Dioxide Emissions Abatement. Stanford, Calif.: Stanford University Institute for International Studies. October.
Gravelle, Jane G. 1994. The Economic Effects of Taxing Capital Income. Cambridge, Mass.: MIT Press.
Interlaboratory Working Group. 2000. Scenarios for a Clean Energy Future. ORNL/CON 476 and LBNL 44029. OakRidge, Tenn., and Berkeley, Calif.: Oak Ridge National Laboratory and Lawrence Berkeley National Laboratory.November.
Jaffe, Adam B., Richard G. Newell, and Robert N. Stavins. 2000. Technological Change and the Environment. DiscussionPaper 00 47. Washington, D.C.: Resources for the Future. October.
Jorgenson, Dale W., and Richard J. Goettle. 2000. The Role of Substitution in Understanding the Costs of Climate ChangePolicy. Arlington, Va.: Pew Center on Global Climate Change. September.
Koplow, Douglas N. 1993. Federal Energy Subsidies: Energy, Environmental, and Fiscal Impacts. Washington, D.C.: TheAlliance to Save Energy.
Lasky, Mark. Forthcoming. The Economic Costs of Reducing Emissions of Greenhouse Gases: A Survey of Economic Models.CBO Technical Paper.
Newell, Richard G., Adam B. Jaffe, and Robert N. Stavins. 1998. The Induced Innovation Hypothesis and Energy SavingTechnological Change. Discussion Paper 98 12 (revised). Washington, D.C.: Resources for the Future. October.
Nordhaus, William D. 1997. “Modeling Induced Innovation in Climate Change Policy.” Paper presented at theIIASA/NBER Workshop on Induced Technical Change and the Environment, International Institute for Applied SystemsAnalysis, Laxenburg, Austria, June 26 27.
Oates, Wallace B. 1992. “Taxation and the Environment: A Case Study of the United States.” Unpublished manuscript.Department of Economics, University of Maryland, College Park. May.
Parry, Ian W.H. 1997. Revenue Recycling and the Costs of Reducing Carbon Emissions. Climate Issues Brief no. 2. Washington,D.C.: Resources for the Future. June.
Parry, Ian W.H. 2002. Adjusting Carbon Cost Analyses to Account for Prior Tax Distortions. Discussion Paper 02 47.Washington, D.C.: Resources for the Future. August.
Parry, Ian W.H., and Antonio Miguel Bento. 1999. Tax Deductible Spending, Environmental Policy, and the “Double Dividend”Hypothesis. Discussion Paper 99 24. Washington, D.C.: Resources for the Future. February.

64 THE ECONOMICS OF CLIMATE CHANGE: A PRIMER
Parry, Ian W.H., and Wallace E. Oates. 1998. Policy Analysis in a Second Best World. Discussion Paper 98 48. Washington,D.C.: Resources for the Future. September.
Parry, Ian W.H., Roberton C. Williams III, and Laurence H. Goulder. 1996. When Can Carbon Abatement Policies IncreaseWelfare? The Fundamental Role of Distorted Factor Markets. Discussion Paper 97 18. Washington, D.C.: Resources forthe Future. December.
Pizer, William A. 1997. Prices vs. Quantities Revisited: The Case of Climate Change. Working Paper no. 98 02. Washington,D.C.: Resources for the Future. October.
Pizer, William A. 1998. Optimal Choice of Policy Instrument and Stringency Under Uncertainty: the Case of Climate Change.Working Paper no. 98 XX. Washington, D.C.: Resources for the Future. August.
Pizer, William A. 1999. Choosing Price or Quantity Controls for Greenhouse Gases. Climate Issues Brief no. 17. Washington,D.C.: Resources for the Future. July.
Popp, David. 2001. Induced Innovation and Energy Prices. Working Paper no. 8284. Cambridge, Mass.: National Bureauof Economic Research. May.
Reilly, John M., Henry D. Jacoby, and Ronald G. Prinn. 2003. Multi Gas Contributors to Global Climate Change: ClimateImpacts and Mitigation Costs of Non CO2 Gases. Arlington, Va.: Pew Center on Global Climate Change. February.
Shackleton, Robert G., and others. 1993. “The Efficiency Value of Carbon Tax Revenues.” Energy Modeling Forum WorkingPaper no. 128. Stanford, Calif.: Energy Modeling Forum, Stanford University. January.
Sutherland, Ronald J. 2000. “‘No Cost’ Efforts to Reduce Carbon Emissions in the United States: An Economic Perspective.”Energy Journal, vol. 21, no. 3, pp. 89 112.
Weitzman, Martin L. 1974. “Prices vs. Quantities.” Review of Economic Studies, vol. 41, no. 4 , pp. 477 491.
Welch, Eric W., Allan Mazur, and Stuart Bretschneider. 2000. “Voluntary Behavior by Electric Utilities: Levels of Adoptionand Contribution of the Climate Challenge Program to the Reduction of Carbon Dioxide.” Journal of Policy Analysisand Management, vol. 19, no. 3, pp. 407 425.
Yuskavage, Robert E. 1996. “Improved Estimates of Gross Product by Industry, 1959 94.” Survey of Current Business,vol. 76, no. 8, pp. 133 155. August. Updated data can be found at www.bea.doc.gov/bea/dn2/gpo.htm.
Chapter 5
Aldy, Joseph E., Peter R. Orszag, and Joseph E. Stiglitz. 2001. Climate Change: An Agenda for Collective Action. Preparedfor the Pew Center on Global Climate Change Workshop on the Timing of Climate Change Policies. October. Availableat www.pewclimate.org/events/timing_presentations.cfm.
Babiker, Mustafa H., and others. 2002. The Evolution of a Climate Regime: Kyoto to Marrakech. Report No. 82. Cambridge,Mass.: Massachusetts Institute of Technology Joint Program on the Science and Policy of Global Change. February.
REFERENCES 65
Bradford, David F. 2002. “Improving on Kyoto: Greenhouse Gas Control as the Purchase of a Global Public Good.” April30. Available at www.wws.princeton.edu/~bradford/globalpublicghgcontrol01.pdf.
Budget of the United States Government, Fiscal Year 2003: Analytical Perspectives, p. 171.
Climate Change Science Program. 2002. Strategic Plan for the Climate Change Science Program. November 19. Availableat www.climatescience.gov/library/stratplan2003/default.htm.
Congressional Budget Office. 1990. Energy Use and Emissions of Carbon Dioxide: Federal Spending and Credit Programsand Tax Policies. CBO Paper. December.
Congressional Budget Office. 1996. Labor Supply and Taxes. CBO Memorandum. January.
Congressional Budget Office. 1998. Climate Change and the Federal Budget. CBO Memorandum. August.
Congressional Budget Office. 2000. Who Gains and Who Pays Under Carbon Allowance Trading? The Distributional Effectsof Alternative Policy Designs. June.
Congressional Budget Office. 2001. An Evaluation of Cap and Trade Programs for Reducing U.S. Carbon Emissions. June.
Department of Energy, Energy Information Administration. 2000. Federal Financial Interventions and Subsidies in EnergyMarkets, 1999: Energy Transformation and End Use. DOE/EIA SR/OIAF/2000 02. May. Available at www.eia.doe.gov/oiaf/servicerpt/subsidy1/pdf/sroiaf(2000)02.pdf.
Executive Office of the President. 2002. Global Climate Change Policy Book. Available at www.whitehouse.gov/news/releases/2002/02/climatechange.html.
General Accounting Office. 1999. International Environment: Literature on the Effectiveness of International EnvironmentalAgreements. GAO/RCED 99 148. May.
Kopp, Raymond, Richard Morgenstern, and William Pizer. 1997. Something for Everyone: A Climate Policy That BothEnvironmentalists and Industry Can Live With. September. Available at www.weathervane.rff.org/features/ feature015.html.
Kopp, Raymond, and others. 1999. A Proposal for Credible Early Action in United States Climate Policy. February. Availableat www.weathervane.rff.org/features/feature060.html.
Lasky, Mark. Forthcoming. The Economic Costs of Reducing Emissions of Greenhouse Gases: A Survey of Economic Models.CBO Technical Paper.
McKibbin, Warwick. 2000. Moving Beyond Kyoto. Policy Brief no. 66. Washington, D.C.: Brookings Institution. October.Available at www.brook.edu/comm/policybriefs/pb066/pb66.htm.
McKibbin, Warwick, and Peter Wilcoxen. 2000. The Next Step for Climate Change Policy. Background Paper no. 1.Washington, D.C.: Brookings Institution. February. Available at www.brook.edu/dybdocroot/views/papers/mckibbin/climate.htm.
McKibbin, Warwick, and Peter Wilcoxen. 2002. “The Role of Economics in Climate Change Policy.” Journal of EconomicPerspectives, vol. 16, no. 2 (Spring), pp. 107 130.
66 THE ECONOMICS OF CLIMATE CHANGE: A PRIMER
Michaels, Patrick. 2001.“Global Warming.” Chapter 47 in Edward H. Crane and David Boaz, eds., Cato Handbook forCongress: Policy Recommendations for the 107th Congress. Washington, D.C.: Cato Institute.
National Science and Technology Council, Committee on Environment and Natural Resources, Subcommittee on GlobalChange Research. 2001. Our Changing Planet: The FY2002 United States Global Change Research Program. September.Available at www.gcrio.org/ocp2002/.
Nordhaus, William D. 1998. “Is the Kyoto Protocol a Dead Duck? Are There Any Live Ducks Around? Comparison ofAlternative Global Tradable Emissions Regimes.” Unpublished paper, version 073198a.wpd. July 31. Available fromthe author at [email protected].
Schelling, Thomas C. 2002 .“What Makes Greenhouse Sense? Time to Rethink the Kyoto Protocol.” Foreign Affairs, vol. 81,no. 3 (May/June), pp. 2 9.
Sky Trust. 2000. The Sky Trust Economy Wide Proposal to Reduce U.S. Carbon Emissions. June. Available at www.cfed.org/sustainable_economies/common_assets/.
United Nations. 1992. United Nations Framework Convention on Climate Change. Available at http://unfccc.int/resource/docs/convkp/conveng.pdf.
United Nations. 1997. Kyoto Protocol to the United Nations Framework Convention on Climate Change. Available athttp://unfccc.int/resource/docs/convkp/kpeng.pdf.
United Nations. 2000. A Guide to the Climate Change Convention and Its Kyoto Protocol. Available at unfccc.int/resource/guideconvkp p.pdf.
United Nations. 2003. Kyoto Protocol Status of Ratification. March 20. Available at unfccc.int/resource/kpstats.pdf.
Victor, David G., and others, eds. 1998. The Implementation and Effectiveness of International Environmental Commitments.Cambridge, Mass.: MIT Press.
Victor, David G. 2001. The Collapse of the Kyoto Protocol and the Struggle to Slow Global Warming. Princeton, N.J.: PrincetonUniversity Press.