Embed Size (px)
Citation preview
THE ECONOMIC IMPACT OF WASTE DISPOSAL
AND DIVERSION IN CALIFORNIA
A REPORT TO THE CALIFORNIA INTEGRATED WASTE MANAGEMENT BOARD
By George Goldman and Aya Ogishi Department of Agricultural and Resource Economics
University of California, Berkeley
April 4, 2001

ACKNOWLEDGEMENTS This project was funded by the California Integrated Waste Management Board.
A number of local public agencies and private firms provided information to assist in the
development of production factors. The authors are grateful for their support. The contributors
are listed in Appendix A.
The authors of the report can be contacted at:
George Goldman
Aya Ogishi
Cooperative Extension, Dept. of Agricultural and Resource Economics
321 Giannini Hall
University of California, Berkeley
Berkeley, CA, 94720-3310
510-642-6461

i
TABLE OF CONTENTS EXECUTIVE SUMMARY……..……………………………………………………………...VI SUMMARY FINDINGS.............................................................................................................VI
1 INTRODUCTION................................................................................................................. 1
1.1 THE DEVELOPMENT OF THE WASTE DIVERSION INDUSTRY AND WASTE ECONOMICS .. 1 1.2 STUDY OBJECTIVES............................................................................................................ 4 1.3 STUDY METHODS AND LIMITATION .................................................................................. 8 1.4 STUDY ORGANIZATION ...................................................................................................... 9
2 LITERATURE REVIEW .................................................................................................. 11
2.1 COSTS OF DISPOSAL AND DIVERSION .............................................................................. 11 2.2 ECONOMIC IMPACTS ........................................................................................................ 13 2.3 INFRASTRUCTURE FOR DIVERSION INDUSTRIES ............................................................. 15
3 DATA COLLECTION ....................................................................................................... 18
3.1 SECONDARY DATA COLLECTION..................................................................................... 18 3.1.1 Generators and Collection.................................................................................... 18 3.1.2 Waste Industry ...................................................................................................... 21 3.1.3 Recycling Brokers, Processors, and Manufacturers............................................. 24
3.2 SURVEY METHODS AND DATA COLLECTION .................................................................. 29
4 ECONOMIC IMPACT MODELING............................................................................... 33
4.1 INPUT-OUTPUT MODEL: IMPLAN SYSTEM................................................................... 34 4.2 DATA ............................................................................................................................... 37
4.2.1 Material Flow ....................................................................................................... 37 4.2.2 Output ................................................................................................................... 39 4.2.3 Cost of Operations ................................................................................................ 41
4.3 STUDY LIMITATIONS......................................................................................................... 43 4.4 ESTIMATION PROCEDURES .............................................................................................. 43
5 IMPLAN RESULTS ........................................................................................................... 45
5.1 ECONOMIC IMPACT OF DISPOSAL ACTIVITIES IN THE DISPOSAL-ONLY MODELS ........ 45 5.2 ECONOMIC IMPACTS OF DISPOSAL AND DIVERSION ACTIVITIES IN THE DISPOSAL-DIVERSION MODELS................................................................................................................. 47 5.3 COMPARISON OF ECONOMIC MODEL RESULTS.............................................................. 48 5.4 ECONOMIC IMPACTS OF DIVERSION ACTIVITIES............................................................ 48
6 INTERPRETATION OF RESULTS ................................................................................ 57
6.1. STUDY IMPLICATION FROM THE TWO SCENARIOS ......................................................... 57 6.2. AVERAGE ECONOMIC IMPACTS PER TON FOR CHANGES IN DISPOSAL VERSES DIVERSION................................................................................................................................ 58 6.3 IMPORTANT NOTES ON USING THE ECONOMIC IMPACT RESULTS................................ 61 6.4 HYPOTHETICAL EXAMPLE USING THE STUDY FINDINGS ............................................... 62
ii
7 SUGGESTIONS FOR FURTHER RESEARCH............................................................. 65
8 APPENDIXES..................................................................................................................... 69
8.1 APPENDIX A: DATA CONTRIBUTORS............................................................................... 71 8.2 APPENDIX B: REFERENCES FOR PUBLISHED LITERATURE............................................. 72 8.3 APPENDIX C: DATA SOURCES.......................................................................................... 75 8.4 APPENDIX D COPY OF A TYPICAL SURVEY INSTRUMENT............................................... 77 8.5 APPENDIX E WASTE FLOW CHARTS ............................................................................... 85
LIST OF TABLES Table 3.1 Estimated Municipal Solid Waste Disposed in California by Material Type, 1999..... 19 Table 3.2 Estimated Volume Handled at Waste-Board Permitted Facilities, 1999...................... 23 Table 3.3 Average Tipping Fees by Facility Type, 1999 ............................................................. 24 Table 3.4 CRV Rate for Major Container Types.......................................................................... 25 Table 3.5 CRV Volumes Collected by Major Material Type, 1998............................................. 26 Table 3.6 Estimated Disposal Recovery Rates and Volumes by Material Types, 1999............... 26 Table 3.7 Average Scrap Value per Ton by Material Type in Los Angeles................................. 27 Table 4.1 Regional Output by Sector, 1999.................................................................................. 40 Table 4.2 Data Sources for Operation Costs................................................................................. 42 Table 4.3 Producer Price Index and Earnings............................................................................... 42 Table 5.1 Economic Impacts Of All 1999 Waste Generation Going Only To Disposal .............. 46 Table 5.2 Economic Impacts of All Waste Generation Going to Both Diversion and Disposal at
1999 Rates............................................................................................................................. 47 Table 5.3 Economic Impacts of Diversion Sectors in California ................................................. 50 Table 5.4 Economic Impacts of Diversion Sectors in the Northern California Region (A)......... 51 Table 5.5 Economic Impacts of Diversion Sectors in the Bay Area Region (B).......................... 52 Table 5.6 Economic Impacts of Diversion Sectors in the Central Coast Region (C)................... 53 Table 5.7 Economic Impacts of Diversion Sectors in the Central Valley Region (D) ................. 54 Table 5.8 Economic Impacts of Diversion Sectors in the Southern California Region (E) ......... 55 Table 5.9 Economic Impacts of Diversion Sectors in the Eastern California Region (F) ............ 56 Table 6.1 Average Economic Impacts of Additional Waste Disposal and Diversion in 1999..... 60

iii
LIST OF FIGURES
Figure 1-1 Map of Waste Regions in California……………………………….……………….. .6 Figure 1-2 Generalized Waste and Recyclables Material Flow…………………………………..7 Figure 4-1 California 1999 Waste and Recyclables Volume Flow (in million tons) ………......36 Figure 8-1 California 1999 Material Flow from Generators (in million tons……………….…..86 Figure 8-2 California 1999 Material Flow from Waste Haulers………………………………...87 Figure 8-3 California 1999 Material Flow from Yardwaste Collectors………………….…......88 Figure 8-4 California 1999 Material Flow from Recycling Collectors…………………………89 Figure 8-5 California 1999 Material Flow from Transfer Station………………….…..…..…...90 Figure 8-6 California 1999 Material Flow from MRF……..………………..…………………..91 Figure 8-7 California 1999 Material Flow from Compost Facilities (in million tons)………….92 Figure 8-8 California 1999 Material Flow to End Use (in million tons)..………….………...…93 Figure 8-9 California 1999 Material Flow from Brokers (in million tons)……………………..94

iv
ABBREVIATED TERMS
ADC Alternative Daily Landfill Cover CalMAX CIWMB California Materials Exchange Database CIWMB California Integrated Waste Management Board CRV California Redemption Value DOR/DOC Division of Recycling, Department of Conservation DRS CIWMB Statewide Disposal Tonnage Reporting System IMPLAN Impact Analysis for Planning MRF Material Recovery Facility SWIS CIWMB Solid Waste Information System Database TS Transfer Station WASTE BOARD California Integrated Waste Management Board WCD CIWMB Waste Characterization Database WTE Waste to Energy Facility
ECONOMIC TERMS
Costs of production: all costs of materials and services used, and salaries and wages paid to employees, in the production of goods and services Direct effects: initial changes in employment, income and output resulting in the regional economic sectors that supply the inputs for production. Economic sectors: all economic activities are categorized and assigned to groups. Each economic activity is assigned to only one sector. Indirect effects: subsequent changes in employment, income, and output in all economic sectors resulting from changes in the initial sectors. Induced effects: subsequent changes in employment, income, and output in all economic sectors as the result of personal consumption after changes in the initial sectors. Input-output models: models of a given geographic area’s economy for a fixed period of time, usually a calendar year. The models define all economic activity into sectors and calculate the effect of spending to produce one dollar's worth of output in one economic sector, on all subsequent spending stimulated by the original dollar, and the total resulting production output by all sectors in the economy. Inputs: things such as energy and labor that will be used in the production of goods and services.

v
Job impact: a measure of how the economic sectors of interest influence the total number of jobs created within a year throughout all economic sectors. A job is defined by the average number of hours worked by employees in each economic sector. Multiplier effects: the total economic impacts resulting from the initial change in spending, on all sectors in the economy. They include all direct, indirect, and induced effects of the economic activities. Outputs: the goods and services produced using the inputs. Output impact: a measure of how the economic sectors of interest influence the total of all sales in all sectors of the economy. Total income impact: a measure of how the economic sectors of interest influence the total income for all persons in the economy. Value-added: value of goods and services minus the costs of inputs (excluding labor) used by the sectors in producing the goods or providing the services. Value-added impact: a measure of how the economic sectors of interest influence the value-added in all sectors of the economy. Total sales: all sales and revenues of an economic sector generated from all activities within the sector.

vi
EXECUTIVE SUMMARY
This document is the first attempt to estimate the economic impacts of the waste disposal and
diversion system in California. The study develops a general model of the flows of selected
disposed and diverted materials in the state, and uses economic impact analysis to estimate
xstatewide and regional economic impacts (in terms of total sales, value-added, total income, and
jobs) for disposal and diversion activities.
Summary Findings
While additional work is needed to better define and refine the inputs used in this study, the
results to date suggest that disposal and diversion activities have a significant impact on the
California economy. The analysis estimates that the 1999 direct and indirect economic impacts
of solid waste disposal and diversion were:
♦ Over $9 billion in sales
♦ Over $21 billion in total output impacts
♦ Almost $8 billion in total income impacts
♦ Almost $11 billion in value-added impacts, and
♦ Over 179,000 additional jobs impact
In addition, the results show that diverting solid waste has a significantly higher impact on the
economy than disposing it. When material is diverted rather than disposed in California:
♦ Total sales and value-added impacts more than double,
♦ Output impacts and total income impacts nearly double, and

vii
♦ The jobs impact nearly doubles.
As shown in the following table, the average impacts of choosing to divert rather than dispose
waste are substantial.
1999 Average Impacts Statewide for Additional Disposal or Diversion
Disposed
Diverted
Additional Gain from Diversion
(Difference) Total Sales ($/ton)
$119
$254
$135
Output Impact ($/ton)
$289
$564
$275
Total Income Impact ($/ton)
$108
$209
$101
Value-added Impact ($/ton)
$144
$290
$146
Jobs Impact (Jobs/1,000 tons)
2.46
4.73
2.27
While the relative impacts for individual jurisdictions vary because of differences in material
flows and business and industrial infrastructures, generally, diversion in California generates
larger economic impacts than disposal. The statewide economic impacts from disposal and
diversion at 1999 rates were estimated to be 17 to 20 percent higher than the impacts if all the
waste had been disposed. The California waste disposal sectors would have generated a total
output impact (all sales in all sectors of the economy) of $18.08 billion to the economy if all
waste generation were disposed. The disposal sectors would have also generated a value-added
viii
impact (the increase in the value of goods and services sold by all sectors of the economy minus
the costs of inputs (excluding labor) of $8.99 billion and created 154,200 jobs. With both
disposal and diversion sectors operating at the 1999 rate of diversion, the combined sectors
would have generated a total output impact of $21.20 billion, produced a value-added impact of
$10.74 billion, and created 179,300 jobs.
The study also looked at the economic impacts in the six regions of California. According to the
analysis, in five out of the six regions waste diversion and disposal at 1999 rates would have a
greater economic stimulation effect than if all the waste went to disposal. The one exception is
the Eastern California region, which does not have much infrastructure that supports diversion-
related business; so most recyclables are delivered out of the region for further processing.
The added positive impacts of diversion come from sales of the separated recyclable materials;
their processing into feedstock, sales of energy for transformation and biomass products, and the
value-added in manufacturing that uses recycled feedstock. Creating markets to accept more
recyclable and compostable materials would be the key to stimulating more economic activities
and higher impacts in the state.
Typically, for every average ton of waste disposed in 1999, the study estimated that $108 in total
income impacts and $144 in value-added impacts would be generated in the state economy.
Whereas, for every average ton of waste diverted, $209 in total income impacts and $290 in
value-added impacts would be generated. Also, about 2.5 total jobs would be added in the

ix
economy for every additional 1,000 tons of waste disposed, while about 4.7 jobs would be added
if the same volume of waste had been diverted as recyclables.
The highest average economic impacts from diversion are in the Central Valley, Southern
California, and Bay Area regions. These regions have more agricultural, business, and industrial
infrastructure relative to the other regions, and a high percentage of the output generated by the
waste industries are re-spent in the same regions. Also, relatively more recycling manufacturers
are located in these areas and they create more value-added and jobs within the regions. In all
three regions, total average output impacts are over $200 per ton more if the waste is diverted
rather than disposed.
Generally, the IMPLAN economic analysis software worked well as a tool to measure the
economic impacts of waste disposal and diversion data. The waste flow model and impact
results relied on “best estimates” from available sources for disposal and diversion volumes, cost
allocations, and revenues. Some materials and practices could not be completely quantified.
The lack of complete, reliable and up-to-date data is a major barrier to better analysis in the
waste industry; with more accurate data, the precision of the results could be improved.
The economic impacts presented in this study understate economic impacts from diversion
because we used a conservative estimation approach (particularly in relation to activity in the
manufacturing sectors). The main trends, however, are clear and similar to those studies in other
states. Compared with waste disposal, waste diversion activities result in a large increase in
economic impacts and job creation.

1
1 Introduction
1.1 The Development of the Waste Diversion Industry and Waste Economics
Waste Diversion
In 1989, the California legislature passed the California Integrated Waste Management Act (AB
939), which required all jurisdictions in the state to reduce the amount of their solid waste
disposed in landfills by 25 percent by the year 1995 and 50 percent by the year 2000. The total
amount of waste generated in the state in 1990 was approximately 51 million tons, and the
statewide waste diversion rate in 1990 was estimated to be 17 percent (CIWMB, 2000b). The
California Integrated Waste Management Board (Waste Board) reports that the diversion rate has
increased since the enactment of AB 939. The goal of 25 percent diversion rate was met on
schedule by most jurisdictions in 1995 as required, and the statewide diversion rate in 1999 was
37 percent (CIWMB, 2000b).
The Waste Board has employed the conservation tenets of "reduce, reuse, and recycle" to reach
the State's diversion goals. It has educated consumers and producers on waste reduction methods
and helped businesses and governments develop markets for commonly discarded raw materials
and biodegradable materials. Jurisdictions throughout California have increased the number and
scope of their diversion programs to meet the waste reduction target. These activities not only
have an environmental impact on the communities involved, but also have an important
economic dimension.

2
Source reduction means redesigning products and processes so that less material is used to
achieve the same function. Manufacturers can use less packaging around their products, office
workers can conserve paper by making double-sided copies, and consumers can select products
that last longer and produce less waste. Another major waste diversion activity is reuse. There
are numerous resale and thrift shops, repair shops, classified newspaper ads, and garage sales
that service and sell used clothes, electronics, automobiles, furniture, and other items. The
emerging market for used items traded or auctioned on the Internet also falls in this category.
Recycling activities represent a large part of the state’s diversion activity. Consumers can
recycle cans and bottles, commercial firms can recycle shipping cardboard and unsold food, and
manufacturers can recycle their own scrap materials. At the waste industry level, there are 42
active Waste Board-permitted material recovery facilities (MRFs) in California that sort and
consolidate recyclable materials as of June 2000 (CIWMB, 2000e). There are also thousands of
recycling brokers and processors that trade source-separated and consolidated materials, and treat
materials to create feedstock for manufacturers to use as inputs for their products. Materials are
exchanged widely within and across the state and even across national borders. There are also
114 active Waste-Board-permitted composting facilities in the state that develop agricultural and
landscaping products as of June 2000 (CIWMB, 2000e).
Government sponsored activities include curbside collection of recyclables and yard wastes
offered along with the waste collection services in most cities. Currently, the state has a
recycling "deposit-refund" program on beverage containers, and the Division of Recycling;

3
Department of Conservation (DOR/DOC) estimates that the 75 percent of all beverage containers
were returned for refund and marketed as recyclable materials in 1997. More than 650,000 tons
of materials have been diverted from landfills and over $5.5 million have been saved since 1992
through CalMAX, the Waste Board sponsored service that promotes exchanges of recyclable
materials (Waste Board, 2000i).
Economics
While some diversion activities were already incorporated as traditional parts of the economy, as
shown by the 17 percent statewide diversion rate in 1990, the mandates of AB939 greatly
expanded the number and scale of diversion opportunities offered by communities throughout
the state. The Act has resulted in an increase in the amount of material shifted from disposal-
based economic activities to new diversion-based activities and infrastructure, and the marketing
of new sources of locally produced alternative feedstock for use by the state’s manufacturers and
agricultural producers.
In addition to the avoidance of the environmental costs of operation and long-term maintenance
of bioactive landfill sites, there are real economic benefits to diverting materials from disposal.
Landfills in California charged an average tipping fee of $35 per ton for disposal of waste in
1999 (CIWMB, 2000h). The diversion of waste from landfills saves communities from paying
the tipping fees, and the additional diversion activities create jobs, add revenues, and help
stimulate other economic sectors. Unfortunately, to date, there has been no tool available in
California at the state or local level that would allow the examination or measurement of the
economic impact of solid waste disposal or diversion.

4
This is the first time a study has been done that estimated economic impacts for California waste
generation. Although we would need better data and further analysis before suggesting that the
results be used as the basis for specific investment and policy-making, it can be regarded as
support of the concept that waste diversion is not only good for the environment, but also good
for the state and regional economies of California.
1.2 Study Objectives
This study divides California into 6 economic regions (with an additional out-of-state region) as
shown in the map (see Figure 1-1), and estimates both the direct and indirect economic impacts
of waste disposal and diversion activities for the year 1999.
The specific objectives of the study are to:
1) Develop a general model of solid waste and diverted materials flow in the state.
2) Select and test economic impact software for the analysis of waste disposal and
diversion in California.
3) Estimate the economic impacts of disposal and diversion activities for the state and
regions. That is to say, how much additional economic activity is stimulated for each
average ton disposed, recycled, or composted?
4) Compare the economic impacts of disposal and diversion activities. That is, what
would be the economic impacts of replacing a disposal-only scenario with disposal
and diversion?

5
5) Discuss how economic impact study results can be used to support decision-making
about waste management.
6) Suggest data improvement and further research in the area of waste economics.

6
Figure 1-1 Map of Waste Regions in California

7
Transfer MRF Station
Generator
Recycling Broker/ Recycler
Hauler
Scavengers
WTE / BIOMASS
MSW Landfill
Compost Facility
ADC
MRF -Clean /Dirty /Hybrid
Recycle
Out of State Sales
End Users
Figure 1-2 Generalized 1999 Waste and Recyclables Flow
Out of State Disposal
LEGEND ………. Diversion ______ Disposal

8
1.3 Study Methods and Limitation
Waste generated at residences, businesses, and institutions passes through multiple economic
sectors, such as collection, transportation, and processing, to reach its final destination. Figure 1-
2 shows the general flows of materials for waste disposal and diversion; the solid arrows indicate
the typical municipal solid waste (MSW) flow, and the dotted arrows indicate the flow for
recovered materials. The economic sectors analyzed in this study are:
Waste/Recyclables Haulers Transfer Stations/Material Recovery Facilities Waste to Energy Facilities Waste Disposal Facilities Composting Facilities Recycling Brokers/Processors Recycling Manufacturers
This study concentrates on recycling activities for diversion because secondary data and
production components have not yet been developed to quantify source reduction and reuse.
Savings from implementing source reduction practices, such as using e-mail to distribute
information rather than paper copies, are available for additional spending on new products and
services. However, there are no accepted measurement standards or secondary data yet available
to estimate the amount and value of economic activity in this area of behavior.
It is also difficult to specify which activities are considered ‘reuse.’ For example, repairing and
reselling used cars are a normal part of the ownership cycle, but it can also be considered reuse
in some sense, since the vehicles were not disassembled for parts and ground up for scrap. More
work needs to be done in the area of life-cycle analysis of products before commonly accepted
economic definitions can be developed to allow the collection of meaningful data. In addition,

9
waste sent to inert material facilities and waste tire facilities were not included in this study. To
this extent, the study underestimates the actual impact of all diversion. The model, however,
could accommodate these activities if sufficient data could be obtained.
The tonnage volume and cost data was collected primarily from secondary data sources, such as
the Department of Commerce, waste industry studies, and Waste Board databases. Data from
our survey contributors and other industry studies were used to assign quantitative values to
production components (labor, rent, and equipment, for example) for all the sectors.
1.4 Study Organization
Chapter 2 presents and summarizes previous studies done in other states on measuring economic
impacts of waste disposal and waste diversion activities. It also presents studies done on waste
issues in California. Chapter 3 identifies the sources for the secondary data used in this report
and describes the survey data collection methods. Chapter 4 describes how the collected data are
used and economic impacts are estimated. The results of analysis are presented in Chapter 5 and
interpreted in Chapter 6. Chapter 6 also discusses how economic impact data could be used
hypothetically to help a jurisdiction support a decision on local waste diversion. Chapter 7
makes suggestions for further research.


11
2 Literature Review This chapter summarizes past studies that analyzed waste disposal and diversion activities and
estimated their costs or impacts in California or elsewhere. This chapter also discusses studies
that examined market development for diverted materials.
2.1 Costs of Disposal and Diversion
Most recent economic studies of waste disposal and diversion presented case studies and
compared the costs of waste collection and disposal with the costs of collection and processing
of recyclable materials in different communities.
Platt and Morris (1993), who studied 15 different communities throughout the United States,
estimated that the collection and disposal costs of residential solid waste fell in the range of $40
and $170 per ton, while the net costs of source-separated curbside recycling and composting
were between $35 and $120 per ton. Net recycling costs include costs of collection and
processing minus revenues from the sales of recyclables. They found that the net recycling costs
were lower than the collection and disposal costs in most communities, and argued that recycling
could be relatively more expensive if the communities experienced high startup program costs,
low level of initial material recovery, additional system design needs, and low costs of
landfilling.
Deyle and Schade (1991) also compared the long-term cost of municipal enterprise curbside
recycling of mixed residential and commercial materials to that of waste disposal in landfills for

12
four large and small communities in Oklahoma. They found that net recycling cost less than
landfill disposal when the landfill tipping fees were more than $35 per ton in the large cities and
$60 per ton in the small ones. A nationwide survey by Folz in 1992 suggested that when the
tipping fee was $33 per ton, the cost of recycling was the same as that of disposal, assuming an
equal scale and efficiency of recycling and disposal collection programs. In cities where
recycling is mandatory, which results in higher participation and recovery amounts, recycling
was competitive at tipping fees as low as $14 per ton. Folz (1999) also reported that in 1996, the
average net recycling costs for curbside programs in 158 cities were $30 less per ton than the
average costs for collection and disposal of solid waste.
The State of North Carolina analyzed the full costs of solid waste management for 15 selected
local governments by considering operating costs, costs of capital expenditures, revenues from
sales of recyclables, and indicators of efficiency (North Carolina DEHNR, 1997). Of the 15
jurisdictions, 6 of the 8 that had household recycling rates of more than 12 percent found that the
net recycling cost was less than that of solid waste collection and disposal. A similar study in
Washington showed that in 1992, the net per-ton costs of residential recycling in three large
study cities were lower than the costs of disposal by $25 to $65 per ton (Sound Resource
Management Group, Inc., 1993). A fourth city had a mix of residential and commercial waste
and the net savings advantage of recycling was $13 per ton over disposal. The comparative cost
advantage of recycling would increase as the market demand for recyclables and landfill-tipping
fees rise as expected in coming years.

13
2.2 Economic Impacts
Besides calculating the costs of recycling and other diversion activities and comparing them with
the disposal costs, some studies also discussed the direct and indirect impacts of an increased
level of waste diversion on the number of jobs created and sales of recyclable materials
processed and manufactured. The States of Maine, Nebraska, Florida, North Carolina,
Minnesota, Washington, and Arizona conducted state studies from 1993 to 1998 to examine
direct economic activities and impacts associated with recycling. Similar studies covered larger
areas such as southern or northeastern parts of the United States (Roy F. Weston 1994, 1996).
All the studies found that recycling increased the net employment level and value-added in the
study areas. Based on previous studies, Quigley (1988) reported that, with conservative
estimates, one job would be created in the collection and processing sectors per 800 tons of
materials recycled, while one job would be created per 600 tons with moderate estimates, and
one job would be created per 400 tons with liberal estimates.
Platt and Morris (1993) estimated that just the processing alone of recycled materials directly
created 9 jobs for every 15,000 tons of recovered materials (1 job for every 1667 tons), compared
to 2 jobs created with incineration (1 job for every 7,500 tons) and 1 job created with landfilling
(1 job for every 15,000 tons). Platt and Morris also indicated that recycling would attract new
industries such as scrap-based manufacturing, further increasing the number of jobs created
through recycling. Studies done in the Northeast (Roy F. Weston, Inc., 1994), South (Roy F.
Weston, Inc., 1996), and Washington (Sound Resource Management Group, Inc., 1993) showed
that most of the increase in recycling jobs was in the manufacturing sectors. Arizona also
reported that the collection, processing, and end user sectors together generated $604 in value-

14
added per ton of materials recycled and created 4.6 jobs for every 1,000 tons (1 job for every 217
tons) of recyclables (Arizona Department of Commerce, National Marketing Division, 1996).
Using their own Recycling Job Model, North Carolina showed that the direct jobs created due to
recycling far outweighed the jobs lost through reduced tonnage landfilled (North Carolina
DEHNR, 1995b). The model treated recycling as a part of the material flow in the entire North
Carolina economy, and the increase in recycling flow resulted in the decrease in the material
flow in solid waste and virgin material uses. By correlating the employment level and tons of
materials managed in each sector, the model showed that for every 100 jobs created from
processing and manufacturing of recycled materials in the state, the solid waste, timber
harvesting, and industrial sand extraction sectors lost only 13 jobs. This result may overestimate
the relative impacts of recycling since most virgin materials came from outside North Carolina,
and most job losses occurred outside the state.
Some studies also evaluated total economic impacts, including the direct, indirect and induced
impacts. A study in Maine estimated the total economic impacts including indirect economic
impacts from recycling using the input-output IMPLAN software (Land & Water Associates and
Market Decisions, Inc, 1993). They estimated that the total economic impacts per ton of
recyclables were $1,539 in value-added, and 10.22 jobs created for every 1,000 tons of materials
recycled (1 job for every 98 tons). Of the total impacts, the manufacturing sectors in Maine
account for large economic impacts, generating $1,365 in value-added and 7.90 jobs per 1000
tons (1 job for every 127 tons). The Florida study used a similar input-out model, Regional
Input-Output Modeling System II (RIMS II), and the Minnesota study used the REMI model

15
software to estimate the scale of total economic impact. Florida estimated that 13,000 jobs
existed in recycling industries and 28,558 jobs (including the 13,000) were created in the overall
economy from recycling in 1995 (Florida Department of Commerce, Division of Economic
Development. 1996). Minnesota estimated the economic impacts of recycling manufacturing
were $1,197 per ton in value-added, with 16.14 new jobs created for every 1,000 tons of
recyclables (1 job for every 62 tons) (Minnesota Office of Environmental Assistance, 1997).
While there were differences in the assumptions used in each of the models, the overall trends
from each study were similar. Recycling created additional jobs in the economy, and the indirect
effects throughout the economy were 2 to 3 times the direct effects of the initial spending.
2.3 Infrastructure for Diversion Industries
Sell et al (1998), using data from 1984, 1993, and 1994, examined the total economic and fiscal
impacts of waste developments in rural western states, including Colorado, Nebraska, Oklahoma,
Texas, and Utah. They show that waste diversion operating and siting regions experienced larger
gains in population, employment, and income, relative to the non-development sites. The studies
in Washington and North Carolina also examined the potential growth of the recycling industry.
The study in North Carolina examined the employment trend, capital demand, and need for
technical and business assistance, associated with recycling business. It indicated that the
recycling business has been growing rapidly in recent years and the implementation of waste
reduction laws and recycling programs by local governments were the main factors for this
growth. North Carolina also reported increased opportunities for its recycling firms to expand
their businesses overseas, particularly to Asia, because of their rapidly growing economies
16
(North Carolina DEHNR, 1995a). The Washington study showed that the recycling industry,
specifically manufacturers of recycled-content products, was providing opportunities for
increased capital investment, employment, and growth (Sound Resource Management Group,
Inc., 1993).
Remear (1991) listed several barriers to economic development from recycling, which included
the under-valued public benefits of recycling facilities, under-investment in research and
development, variable recycled-product demand, and regulatory uncertainties.
Previous California studies characterized the disposal and diversion status and examined
diversion policy options in the state. A 1991 Disposal Cost Fee Study, done by a consultant for
the Waste Board, reported diversion rates for the state for different materials, discussed the costs
of disposal and diversion activities, and the environmental benefits. However, the results of
subsequent CIWMB research were not consistent with those found in 1991. . California Futures
(1993) discussed the costs and benefits of different market development options by considering
the potential value of materials diverted, jobs created, and the costs of collection, recycling,
manufacturing, and administration.
As seen in the studies discussed above, recycling was found to be cost-effective, to increase the
net employment level and total value-added in the economy, and to have the potential for further
growth. Scarlett (1993) showed that among various case studies there were large differences in
recycling costs. She argued that it was necessary to estimate the total costs of recycling more
accurately by including all related direct and indirect costs involved in all stages of recycling

17
processes. Prior studies lack a comprehensive analysis of the total economic impact of recycling
and did not consider economic impact of source reduction or other waste diversion activities
because of limited model designs or the inability to find good data.
The current study focuses on disposal and diversion activities in California, but like previous
studies it lacks data about some forms of diversion. The report updates the past California
studies wherever possible, and examines how current diversion activities affect the regional
economies.

18
3 Data Collection This chapter discusses types of relevant data available. Chapter 4 then explains how and where
these data were used in the study. A majority of the data that was useful for this study was found
in documents and database published by and maintained at the California Integrated Waste
Management Board (Waste Board), the Division of Recycling, Department of Conservation
(DOR/DOC), Federal and local governments, and waste and recycling industry associations.
Wherever possible, we obtained data from California sources for the study year, 1999, but some
data came from other states that have a different waste and diversion infrastructure, and/or from
other years than 1999. These data were used for estimation of 1999 California numbers only
when the California sources were unable to supply the data. Some industry representatives in
California were also surveyed to cross check data accuracy. Many of these data sources were
combined or averaged and used as the inputs for the economic model.
3.1 Secondary Data Collection
3.1.1 Generators and Collection
In a study of disposal practices and materials in the waste stream, the Waste Board estimated the
amounts of waste disposed from different sources in California in 1999 (CIWMB, 2000g). Of
the total disposed, 48.8 percent of the waste stream was contract-hauled commercial waste, 38.1
percent was contract-hauled residential waste, 10.5 percent was self-hauled commercial waste

19
such as small businesses roofers and landscape maintenance services, and 2.6 percent was self-
hauled residential waste such as rural areas without curbside service (CIWMB, 2000g). Table
3.1 summarizes the waste characterization of businesses, residences and self-haulers for 1999 in
California.
Table 3.1 Estimated Municipal Solid Waste Disposed in California by Material Type, 1999
Material Types Residential
Waste (in 1,000 tons )
Commercial Waste
(in 1,000 tons )
Self-Haul Waste3
(in 1,000 tons )
Total
(in 1,000 tons ) Paper 3,918
(27%) 7,151 (39%)
268 (5%)
11,337 (30%)
Glass 576 (4%)
441 (2%)
50 (1%)
1,067 (3%)
Metal 660 (5%)
1,101 (6%)
522 (11%)
2,284 (6%)
Plastic 1,263 (9%)
1,801 (10%)
272 (6%)
3,337 (9%)
Organics1 6,423 (45%)
5,738 (31%)
1,020 (21%)
13,181 (35%)
Other2 1,434 (10%)
2,086 (11%)
2,776 (57%)
6,295 (17%)
Total 14,273 (100%)
18,318 (100%)
4,909 (100%)
37,500 (100%)
1. Includes food, yardwaste, agricultural waste, textile, and other composite organic 2. Includes construction and demolition, special waste, mixed residue, and other materials 3. Includes self-haul from residential and commercial sources
Source: CIWMB Waste Characterization Database (2000g)
The State government publishes annual reports on revenues and expenditures for the refuse
enterprises in the state, counties, and cities. The 1995-1996 fiscal year Counties Annual Report
(State of California, 1996a) specifies the amounts of revenue and expenditure for refuse
enterprises operated by county governments. The report shows that county governments in
California received combined revenues of over $438 million from their own refuse enterprises

20
during the fiscal year of 1995-1996. The 1995-1996 fiscal year Cities Annual Report (State of
California, 1996b) specifies revenue and expenditure information on refuse enterprises operated
by city governments. The total solid waste operation revenues for all city governments in
California were over $1 billion.
The Counties Annual Report and Cities Annual Report also show that many cities and counties
contract refuse collection services to private companies. In fiscal year 1995-1996, about 60
percent of cities designated all or part of the services to the private sector, while larger cities
tended to have their own operations. Less than 40 percent of cities with population under 10,000
had city operated solid waste collection, while more than 60 percent of cities with population
over 50,000 had city operated waste collection.
Several reports showed that the typical residential service charge for collection was about $15 to
$17 per month per household (Hilton Farnkoph & Hobson, LLC, Contra Costa County Website).
Because the average number of persons per household in California was 2.94 (1999 California
Statistical Abstract), we calculated that the annual service charge was about $61.2 to $69.4 per
person. Annual volume per capita of residential disposal was 0.45 tons in 1998 (CIWMB,
2000j), and we estimated that the annual disposal fee per ton from residential collection was
about $136 to $154. The 1997 California Waste Survey (Alder, et al, 1998) also calculated
commercial and residential waste collection costs of waste hauling companies. It estimated that
22 percent of the total costs went to drivers’ salaries and fringe benefits, and 25 percent was
allocated to disposal tipping fees paid at the landfill gates. Since the average tipping fee in the
state was $35 in 1999, the collection cost was estimated to be $140 per ton. These estimates on

21
collection charges were cross-checked with an industry-related expert using multiple sources of
information, who found that residential collection fees were about $100-140 and commercial
waste collection fees were about $80-$100 per ton.
Miller (1993) estimated that the residential collection cost of recyclable materials on a typical
suburban route were $96,122 for a 23 yard-capacity vehicle operated by one person in 1992, and
the recycling cost ranged between $90 to $150 per ton. In Seattle, contract prices for recyclables
collection and processing in 1993 were $81 per ton on average (Miller, 1993). According to our
industry-related expert, recycling collection fees can be as high as $200 per ton, and greenwaste
collection fees are about $130-140 per ton.
3.1.2 Waste Industry The Waste Board maintains two databases regarding waste volumes and flows in California: the
Disposal Reporting System (DRS) and the Solid Waste Information System (SWIS). The DRS
database specifies jurisdictions of origin and final destinations of California waste (2000d). It
includes disposal volumes of all waste at all California and out of state Board-permitted landfills,
the volumes processed at all Board-permitted Waste To Energy (WTE) facilities, and volumes
designated as Alternative Daily Cover (ADC) use at California landfills. The SWIS database
also maintains information on facilities that are required to file operating permits with the Waste
Board (2000f). As of June, 2000 it contained data on daily permitted capacity of materials
handled at 176 active landfills, 42 Material Recovery Facilities (MRFs), 306 transfer stations, 3
Board-permitted transformation facilities, and 114 compost facilities (CIWMB, 2000e).

22
Table 3.2 presents estimated volumes of waste and recyclable materials handled at different
Waste-Board permitted facilities. The SWIS database was used to estimate the volumes of waste
handled at transfer stations, MRFs, and composting facilities, and the DRS database was used to
obtain volumes of waste that were delivered to landfills and WTE facilities. The DRS disposal
data do not exactly match the data in the Waste Characterization Database (WCD); the DRS
reported that the total amount of waste disposed in 1999 was 38.3 million tons, while the WCD
survey study estimated that it was 37.5 million tons as shown in Table 3.1. Because the DRS
disposal data tracks all disposal volume flow from generation to final disposal, it was more
suitable for regional analysis.
If all facilities in California operated 365 days at the average 45 percent capacity of SWIS-
permitted throughput1 in 1999, approximately 17.8 million tons were handled at the transfer
stations, 7.5 million tons were handled at the MRFs, and 5.0 million tons were handled at
compost facilities (CIWMB, 2000f). The DRS reports that 36.4 million tons were disposed at
landfills in California, 2.2 million tons were recycled as ADC at the landfill sites, 0.9 million
tons were transformed at Board-permitted WTE facilities, and 1 million tons were transported
out of state for disposal in 1999 (CIWMB, 2000d).
1 We used the conversion factors of 1000 lbs. per cubic yard (or 2 cubic yards per ton) for compacted waste delivered to landfills, and 500 lbs. per cubic yard (or 4 cubic yards per ton) for uncompacted waste delivered to transfer stations, MRFs, transformation facilities, and compost facilities (CIWMB, 2000). A 45 percent capacity baseline was obtained by comparing the permitted capacity in the SWIS database with the landfill volumes reported by the Waste Board.
23
These two database do not contain all waste facilities. Those facilities with small-scale
operations are not required to obtain permits and are not included in the SWIS databases. Some
facilities also receive permits from other agencies. For example, most biomass WTE facilities
obtain permits from the Air Board; some inert material sites have mining permits. There were 90
non-Board permitted waste-to-energy facilities listed as having active permits in February 2000
(California Energy Commission, 2000). The Waste Board estimated that 1.6 million tons of
yardwaste were burned for energy in California at their facilities in 1999 (CIWMB, Organics
Section 2000).
Table 3.2 Estimated Volume Handled at Waste-Board Permitted Facilities, 1999
Facility Types Estimated Volume
Handled (in Million Tons)
Landfills (Disposal) 2 36.4 Landfills (ADC uses) 2 2.2 WTEs 2 0.9 Transfer Stations 1 17.8 MRFs 1 7.5 Compost Facilities 1 5.0 Out of State Disposal 2 1.0
Source: 1. CIWMB, SWIS Database (2000f); 2. DRS Database (2000d)
The Waste Board (2000h) also has information on tipping fees charged at different facilities in
1999 as specified in Table 3.3. The average landfill-tipping fee in the state for compacted waste
was $35.6 per ton and for uncompacted waste was $34.6 per ton, but the fees varied by facility,
ranging from $3.50 to $72.75. Facilities that collect construction and demolition materials
charged relatively lower fees, while small facilities located in rural areas tended to charge higher
fees.

24
Table 3.3 Average Tipping Fees by Facility Type, 1999
Facility Type Compact
rate($/ton) Uncompacted Rate($/ton)
Landfills $ 35.6 $ 34.6 Transfer Stations $ 46.2 $ 45.4 MRFs $ 41.6 $ 45.0 MRF/Transfer Stations $ 45.7 $ 42.0 WTE Facilities $ 34.8 $ 31.2 Compost Facilities $ 37.6 -
Source: CIWMB (2000h)
Several past studies estimated the costs of operations at different facilities. Using data from
Idaho, Bolton (1995) estimated that in 1994 about 36 percent of the total cost of landfill
operations went to employment compensation, and insurance accounted for about 24 percent.
Biocycle (1994) estimated that the average cost of composting waste materials was between
$3.96 and $10.28 per ton using medium technology with a screener and shredder. The costs
depended on the volume of the waste stream ranging from 10,000 to 100,000 tons per year. The
facilities with higher volumes were more cost-efficient at processing the materials.
3.1.3 Recycling Brokers, Processors, and Manufacturers
The Waste Characterization Database, the Waste Board’s market guides (1996a; 1996b), and
other data were used to estimate the 1999 volumes of recyclable materials handled by recyclers
(Waste Board, 2000a; Waste Board, 2000g). Table 3.6 summarizes these disposal and recovery
volumes and recovery rates by material types. An estimated 19.0 million tons of waste generated
in California was recovered in 1999. An estimated 8.8 million tons of organic waste were sent to
compost facilities and WTE facilities or used as ADC, so that recyclers handled approximately
10.2 million tons of California generated material. Total waste generated in the state was
25
estimated as approximately 56.4 million tons. This estimate is lower than the generation volume
estimated by the Waste Board at 59.7 million tons, since source reduction, reuse, and recycling
of material types included in the ‘other’ category in Table 3.6, were not counted in our
estimation. Also, we used the 37.4 million ton figure from the DRS as the disposal tonnage.
The DOR/DOC runs the recycled beverage container program and keeps a record of volumes of
materials collected in all counties. In this program, the Department collects redemption
payments from beverage distributors and pays back recyclers the California Redemption Value
(CRV) specified in Table 3.4 when the containers are returned. Redemption payments not
claimed are used to help other recycling-related activities, such as paying increased handling fees
to recyclers, funding local curbside programs for cities and counties, and providing recycling
grants. Table 3.5 describes the volumes of redemption materials collected by material type in
California.
Table 3.4 CRV Rate for Major Container Types
Container Type CRV per
container ($) Less than 24 ounces 0.025 Aluminum 24 ounces or more 0.050 Less than 24 ounces 0.025 Glass 24 ounces or more 0.050 Less than 24 ounces 0.025 Plastic 24 ounces or more 0.050
Source: DOR/DOC, Payment and Processing System (2000a)

26
Table 3.5 CRV Volumes Collected by Major Material Type, 1998
Material Type Volumes (in Tons)
Aluminum 118,900 Glass 330,600 Plastic 30,700
Source: DOR/DOC, Payment and Processing System (1999a)
The DOR/DOC also has names of operators and their locations for 526 curbside programs, 1,118
drop-off centers, and 3,020 recycling centers in California as of September 2000. The
DOR/DOC lists do not cover all recycling brokers, but only those who collect redemption
materials; so some metals and paper and paperboard materials, that do not have redemption
values, are excluded from being listed. The lists, however, contain valuable information tracking
the economic activities of a large percentage of brokers and processors.
Table 3.6 Estimated Disposal Recovery Rates and Volumes by Material Types, 1999
Materials Materials as
Percent of Disposal 1
Percent of Generation Disposed
Total Volumes Disposed in California2
(in 1,000 tons)
Percent of Generation Recovered
Total Volumes Recovered
(in 1,000 tons)
Paper 30 69 11,305 313 5,079 Glass 3 57 1,064 433 804 Metal 6 36 2,277 644 4,048 Plastic 9 91 3,327 93 337 Organic 35 62 13,143 38 8,750 Other 12 - 6,277 - Total 100 37,394 19,018
1. CIWMB WCD (2000g) 2. CIWMB DRS 3. Estimated from the Waste Board Market Guides (1996) 4. Steel Recycling Institute (2000); Aluminum Association (2000) 5. CIWMB Organics Section (2000)

27
It is difficult to estimate the volumes of materials handled by recycling manufacturers, as
numerous manufacturers use virgin and recycled material feedstock alternately and recyclables
flow in and out of regions quite frequently and erratically, depending on the prices for the
materials. Recycling data came from previous reports, industry organization summaries and
contacts, and the 1997 U.S. Census of Manufactures. The average scrap values of recyclable
materials are specified in Table 3.7.
Table 3.7 Average Scrap Value per Ton by Material Type in Los Angeles
(Between January 12, 1996 and June 9, 2000)
Material Type Average $ Per Ton
Steel 28 Aluminum 614 Glass 30 Plastic 186 Paper 52
Source: Waste News (various years)
The Waste Board Market Guides (CIWMB, 1998a; CIWMB, 1998b) and various industry
reports list the main end users of different recycled materials. For each manufacturing sector
identified as an end user, the US Census lists material types used in the manufacturing of
different products. This was used to estimate the percentage of recycled and virgin materials
used in the manufacturing sectors. The Census data cover the whole United States and do not
often provide data specific to California. The values of manufactured products using recycled
materials were estimated based on the percentage of manufacturing operations located within the
state, as listed in the IMPLAN input-output database.

28
According to the Aluminum Association (2000), 9.3 billion pounds of aluminum were recycled
in 1999 in the United States, and 2.0 billion pounds came from used beverage cans. Secondary
smelters consumed 43 percent of scrap aluminum, primary producers used 39 percent, and 18
percent went to other uses. In California, integrated aluminum smelters producing can sheet
material and secondary smelters producing remelt secondary ingot (RSI) are the main end users
of used aluminum cans (CIWMB, 1998b). Can sheet producers and die casters use RSI.
67 million tons of steel was recycled in 1999 in the United States (Steel Recycling Institute,
2000), and copper and steel producers, iron foundries, and exporters were main end users of the
recycled steel. Most recycled steel was used in electric arc furnace and basic oxygen furnace
facilities. The electric arc furnace (EAF) process uses almost 100 percent recycled steel to
produce structural beams, steel plates, and reinforcement bars. The basic oxygen furnace (BOF)
process uses 25 percent recycled steel to produce automotive fenders, encasements of
refrigerators, and packaging like soup cans, five-gallon pails, and 55 gallon drums (Steel
Recycling Institute, 2000).
Paper values differ by different types; computer printout and high-grade paper have the highest
resale values, while mixed paper has little value. The amount of paper and paperboard recycled
in 1998 in the United States was 45 million tons, and the American Forest and Paper Association
(1999) estimated 68.5 percent of old newspapers, 75.2 percent of old corrugated materials, 35.1
percent of printing-writing papers, and 41.8 percent of office papers are recovered. Most
recovered paper is used for newsprint, paperboard, containerboard, tissue, and printing-writing
papers, or is exported out of country.

29
Nearly 2 million tons of glass waste was generated in California, and about 800,000 tons of the
total was recovered in California in 1996. Of the all the glass waste recovered, more than
425,000 tons were estimated to be redemption value glass (CIWMB, 1998a). Most recovered
glass cullet is used in the production of glass containers and fiberglass.
Of all plastic materials, only PET bottles had California redemption values until January of 2000,
and the recycling rates for these materials were significantly higher than other types. The
DOR/DOC estimated that 65 percent of redemption plastic bottles were recycled in 1999. The
Container Recycling Institute estimated that in 1997, only 40 percent of PET plastic bottles in the
Unites States were recycled; of these 46 percent were collected through curbside and drop-off
programs, and 54 percent were collected through a deposit program. Recycled plastics were
used in different manufacturing products, but the only large end users identified were plastic
bottle manufacturers.
3.2 Survey Methods and Data Collection A survey was prepared and mailed to a sample of waste haulers and operators of landfills,
transfer stations, material recovery facilities (MRFs), and waste-to-energy and biomass facilities,
as well as to some selected recyclers and brokers in California, for the purpose of estimating the
regional volumes and flows of waste materials and cost and revenue allocation. An example of
the survey is found in Appendix D. In many cases, the same company operates waste hauling
services, transfer stations and MRFs, and waste disposal facilities, thus a survey package with
five different surveys (Waste Collection, Transfer Station/MRF, Disposal Facility, Composting

30
Facility, and Recycling Broker/Processing surveys), was mailed to a sample of operators in the
Waste Board’s SWIS database between June and July 2000. A WTE/Biomass facility survey
was then mailed separately to biomass and Board-permitted WTE facility operators, while a
Recycling Broker/Processing survey was mailed to a sample of those who were identified as the
collectors of CRV materials on DOR/DOC recycler list.
The main purpose of the survey was to collect information on regional material flows and cost
allocations that were unavailable in previous studies and reports. As discussed earlier, the
secondary data on the recycling brokers and processors sectors are particularly limited. Survey
procedures ensured that all operators, regardless of size, had a chance to be included in the
survey; however, large operators were sampled more heavily than small operators, as they were
more likely to have detailed information. Survey data were reviewed for reasonableness, and
representatives of the waste industries reviewed summaries of the data.
Since all operations involved in the waste and diversion industries were not included in the
sample, survey estimates are subject to sampling variability. For example, as discussed in
Section 3.1.3, the DOR/DOC recycler list includes only those who accept CRV materials, thus
non-CRV brokers are underrepresented in the sample. Survey results are also subject to non-
sampling errors such as failure to respond to a given question, mistakes in reporting, or
processing the data. The effects of these errors cannot be measured directly. They were
minimized through quality controls in the data collection process and through a careful review of
all reported data for consistency and reasonableness.

31
The survey results were used mainly to cross check and adjust the secondary and IMPLAN data.
The individual results were aggregated over operations and not used separately in the analysis.


33
4 Economic Impact Modeling To analyze the economic impacts of the disposal and diversion sectors, the total impacts of all
the revenue and spending of these sectors on all sectors in the economy must be captured. For
example, whenever the disposal and diversion sectors expend money such as purchasing
equipment, they rely on a whole network of other economic sectors. To support the initial
purchase, the equipment retailer stocks models and parts from manufacturers, which are
transported, warehoused, and then sold and maintained locally. The spending from the initial
purchase is distributed to many other sectors, and subsequently re-spent by the receiving sectors
for their own needs. Also, each of the businesses in the supply chain produces waste and
recyclable materials, which are handled by the waste disposal and diversion sectors. Because
these interconnected transactions are present in the economy, the sectors of initial concern
eventually interact with all other sectors in the economy. The sum of all the indirect and induced
effects of the economic activities is called a “multiplier effect.”
This chapter discusses how the economic impact model was used. Because consistent state and
regional data were limited, the state and regional outputs of each economic sector and costs of
operations are calculated using various methods. The details of the model and data used are
described in the following sections.

34
4.1 Input-Output Model: IMPLAN System
Regional and national input-output models are an established method in economics. They are
used to describe different region’s and country’s economies, and to estimate the economic effects
of policy changes and different resource uses. Input-output models are models of a given
geographic area’s economy for a fixed period of time, usually a calendar year. The inputs are
things that will be used in the production of goods and services. The outputs are the goods and
services produced using the inputs. An input-output model classifies all economic activity into
sectors and calculates the effect of one dollar's worth of sales in any economic sector, on all
subsequent spending stimulated by the original dollar, and the total resulting output by all sectors
in the economy. The U. S. Department of Commerce develops a national input-output model
every five years.
For any region, the IMPLAN software system creates an input-output model and estimates the
total economic impacts of the sectors of interest by using the input-output relationships to derive
multipliers for sales, employment, income, and value-added. The IMPLAN model for the United
States has 522 economic sectors, and every economic activity is assigned to one sector and that
sector only. In the IMPLAN system, multiplier effects are separated into three categories: direct,
indirect, and induced effects. The direct effects refer to the changes in employment, income, and
output in the sector that has the initial change. The indirect effects refer to the subsequent
changes in all other sectors in the economy as the result of the change in the initial sectors. The
induced effects include all impacts when personal consumption is added to the model.
35
For example, suppose a baseball team decides to construct a new stadium in Northern California
that costs $100 million. If the indirect sales multiplier for the construction sector is 0.5 and the
induced multiplier is 0.6, then we estimate that an additional $50 million is generated in sales in
all other sectors in the region, and another $60 million is generated in sales from the additional
spending by consumers.

Transfer MRF Station 17.8
Generator 56.4
Recycling Broker/ Recycler
7.5
Hauler 46.0
Scavengers
WTE / Biomass 2.5
MSW Landfill 38.6
Compost Facility 5.0
ADC 2.2
MRF -Clean /Dirty /Hybrid 7.5
Recycle
Out of State Sales 6.1
End Users 8.2
R )
Out of State Disposal 1.0
LEGEND ………. Diversion
Figure 4-1 California 1999 Waste and ecyclables Volume Flow (in million tons
36 ______ Disposal

37
4.2 Data This section discusses how and where data described in Chapter 3 are used in the economic
impact model. All secondary data described in Chapter 3 were included or referenced for the
analysis. The survey results were used mainly to cross check and adjust the secondary and
IMPLAN data. The individual results were aggregated over operations and not used separately
in the analysis.
4.2.1 Material Flow
Figure 4-1 above and Figures 8-1 through 8-9 in Appendix E show our estimate of the disposal
and recyclables flows from one sector to the next in California. The SWIS, DRS, and Waste
Characterization Study data, as well as the survey results, which were discussed in Chapter 3,
were used to estimate the percentages of the volume flows. The charts track material flows from
their generation to their end uses, with procedures used to reduce double counting and estimation
errors. Whenever regional flow data was not available, the state estimates of material flow were
used as a proxy for all regions.
Waste haulers were assumed to collect all waste handled at the transfer stations, compost
facilities, and MRFs, as well as the non-self-hauled waste brought directly to in-state and out-of-
state disposal sites, and the amount of waste delivered to WTE/ biomass-to-energy facilities.
The Waste Board (2000g; 2000f) estimates that approximately 13.1 percent of waste materials
were delivered to the landfills by self-haulers and 30.2 million tons were delivered to in-state
transfer stations, compost facilities, or MRFs in 1999, as discussed in Section 3.1. Some 86.9

38
percent of the total disposed waste was non-self hauled; of this, 13.8 million tons were estimated
to have been delivered by haulers directly to in-state and out-of-state disposal sites, and 1.6
million tons to biomass-to-energy facilities. The total tonnage collected in California by haulers
was thus estimated to be 46.0 million tons in 1999, as shown in Figure 8.1. Further detail is
shown in Figures 8.2 to 8.4.
We also assumed that compost facilities sold 90 percent of their material as compost products
within the region and delivered 10 percent outside the region. The statewide material flow from
compost facilities is shown in Figure 8.7. The World Resource Foundation (1997) estimates that
dirty (mixed waste) MRFs typically have recycling rates of 10 to 30 percent of the quantities
processed, while clean (source-separated) MRFs typically have recycling rates of 85 to 97
percent. Based on this data and the survey results, we assumed that MRFs delivered half of the
waste they received to landfills and sold the other half to recyclers; and of the amount sold to
recyclers, 50 percent of the materials were sold inside the region and 50 percent outside. The
statewide material flow from MRFs is shown in Figure 8.6.
Note that in statewide or regional analysis, when materials are transported out of the study area,
they are regarded as “exports” from the study area. Only the values of goods produced and
services occurring before exporting count as economic impacts. The “exports” category includes
“out of state disposal” of disposed materials and “out of state sales” of diverted materials in
Figure 4.1 and 8.1 to 8.9.

39
4.2.2 Output
State and regional output estimates were also calculated from the DRS, SWIS database, and
Waste Characterization Study. Table 4.1 summarizes the state and regional outputs of different
sectors in 1999. The volumes of waste collected in each region were multiplied by the estimated
per-ton collection value of $140, based on the 1999 California Waste Survey and industry
estimates. For recycling collection, we multiplied volumes handled at MRFs by the estimated
recycling collection value of $178 per ton, and for yardwaste collection, we multiplied the total
volumes handled at compost and biomass WTE facilities by the estimated collection value of
$140 per ton. These collection value estimates were crosschecked with an industry expert as
explained earlier in Chapter 3.
For the transfer stations and landfills, almost all income came from tipping fees. The volumes
handled at these facilities were multiplied by their corresponding tipping fees to derive their total
outputs. Tables 3.2 and 3.3 in the previous chapter presented the volumes and average tipping
fees at different facilities in state. For WTE and biomass facilities, the Environmental Defense
Fund (1990), and our survey results, were used to estimate that 37 percent of total sales came
from tipping fees, 58 percent came from energy sales, and 5 percent came from the other
sources.2 MRFs received income from tipping fees and material sales; the survey results
indicated that they sell the materials at an average of $30 per ton. Compost facilities received
income from tipping fees and compost sales; based on the survey results, compost products were
assumed to have been sold at $10 per ton. Compost was estimated to shrink in volume by 55
2 We assumed that 500 lbs. of waste generates 1-kilowatt hour of energy, and the electricity value is $0.11 per k/hr. (EDF, 1990, and survey results).

40
percent during the compost process (Biocycle 1994), thus only the fraction of volumes processed
at the facilities were sold as composts.
To calculate the state output of the recycling brokerage and processing sector, the market prices
of recyclable materials were multiplied by their volumes. The prices were presented in Table
3.7, and volumes of materials recovered in the state were estimated in Table 3.6. Regional
outputs of the sector were calculated from the state output and the waste disposal ratio in each
region from the WCD.
Table 4.1 Regional Output by Sector, 1999
Sector
State (in $1,000)
Northern California Region (A) (in $1,000)
Bay Area Region (B)
(in $1,000)
Central Coast
Region (C) (in $1,000)
Central Valley
Region (D) (in $1,000)
Southern California Region (E) (in $1,000)
Eastern California Region (F) (in $1,000)
Waste Collection
4,469,216
110,359
854,306
169,341
543,089
2,786,937
5,185
Recycling Collection
1,329,491
29,563
309,655
48,464
352,982
588,826
-
Yardwaste Collection
918,400
42,924
212,074
52,580
310,941
299,836
-
Transfer Station
821,167
38,958
197,592
10,857
127,035
445,910
815
MRFs 443,807
9,869
103,368
16,178
117,832
196,560
-
Compost Facility
221,392
10,352
51,123
12,675
74,956
72,826
-
ADC 153,287
4,420
60,707
5,636
5,002
77,344
178
Landfills 1,273,436
27,536
239,696
550,644
164,741
789,415
1,385
Incineration 234,429
7,055
34,841
8,638
77,726
106,161
-
Recycling Broker
619,910
23,386
147,352
20,763
120,475
307,366
568
Recycling Manufacturers
19,403,448
388,506
3,505,771
283,754
1,940,122
13,277,120
7,251
Source: CIWMB SWIS; DRS; DOR/DOC

41
This study considered only the manufacturers that use recyclable materials extensively in their
production. Their recyclable material uses were estimated from the 1997 IMPLAN data and the
1997 Census of Manufactures. The IMPLAN model has county level sales data for all
manufacturing sectors. The amounts of sales values that are attributed to recyclable materials
were calculated using the Census’ percentage of costs of recyclable materials used versus the
costs of virgin materials for different sectors. Note that many manufacturers not included in the
study use some recyclable materials, so the dollar volume and impacts of manufacturers in the
study are underestimated.
4.2.3 Cost of Operations
Waste disposal and diversion sectors are not specified in the current IMPLAN system. Waste-
related industries were assumed to have similar costs of production to those of existing sectors in
the IMPLAN system, ant then were adjusted with cost information obtained from various data
sources summarized in Table 4.2. Because the secondary cost data came from different years, all
employment compensation data were adjusted to a common year using average hourly earnings
for production workers and all other cost data using the Producer Price Index (PPI) for finished
goods as in Table 4.3.
The survey served as a good tool to collect data on cross-regional material flows and detailed
costs of operations information. The survey results on the flows also allowed us to assign input
costs to sectors that were delivering waste or buying recyclables. The operations cost data were
also used to modify the cost data in the IMPLAN system.

42
Table 4.2 Data Sources for Operation Costs
Study Sectors
Data Sources Year of Data
Waste Collection Alder et al (1998) 1997 Recyclables Collection Miller (1993)
EDF (1991) -
Yardwaste Collection Alder et al (1998), Waste Board (2000)
1997 2000
Transfer Stations Survey 1999 MRFs Tellus (1991) 1990 Composting Facilities Biocycle (1994)
Survey
1999 Landfills Bolton (1995);
Survey 1994 1999
WTE Facilities Tellus (1991) Survey 1999
Recyclers Survey 1999 Recycling Manufacturers Census of Manufacturers
IMPLAN data 1997 1997
Table 4.3 Producer Price Index and Earnings
Year PPI Earnings
($/Hour) 1989 113.6 9.66 1990 119.2 10.01 1991 121.7 10.32 1992 123.2 10.57 1993 124.7 10.83 1994 125.5 11.12 1995 127.9 11.43 1996 131.3 11.82 1997 131.8 12.28 1998 130.7 12.78
Sources: Bureau of Labor Statistics

43
4.3 Study limitations Because of limited secondary data and survey participation, as well as variations in input uses
from facility to facility, we were constrained to use the same input allocation factors for labor
and other inputs for all regions. The volumes of recyclables used in the manufacturing sectors
were estimated from the material uses described in the national Census of Manufacturers, and no
direct survey of manufacturers was conducted. We assumed that same industries used the same
percentage of recyclable materials (versus virgin materials) across the region, which best
approximates real input uses. Some facilities were known to use more recyclable materials than
others even in the same industries, but this was not captured in the study.
4.4 Estimation Procedures Basic economic models were constructed for the State of California and for each of the regions,
and then customized by introducing variables for each of two scenarios. The first scenario
assumes that all the waste generated in the state and the regions in 1999 went to disposal and
there was no diversion activity. The second scenario assumes that both disposal and diversion
occurred at the estimated 1999 rates.
In the disposal-only model, output values for the sectors were calculated by multiplying the
volumes of waste generated by per-ton collection costs, transfer costs, or average tipping fees.
According to the DRS (CIWMB, 2000d), 97.5 percent of waste disposed in the state went to
landfills and WTE facilities in the same region. Based on these assumptions, the total economic
impacts of the disposal sectors were estimated for California and for each region.

44
The next set of models reduced the amount of waste going to disposal sectors and included
diversion sectors. These models most resemble the current disposal and diversion situations in
California. Combined impacts of the diversion and disposal sectors for California and each
region were estimated, using data on output values, material flows, and costs of production, as
specified in Chapters 3 and 4. Economic impacts of each diversion activity were also identified
and estimated.
The combined disposal and diversion models were then compared with the disposal-only models
to analyze the net impacts of having diversion sectors in the economy instead of having all the
waste disposed at landfills.

45
5 IMPLAN Results This chapter presents the estimates of the economic impacts of the waste disposal and diversion
sectors in disposal-only models and disposal-diversion models. The results of models with all
generation going to disposal sectors are presented first for all of California along with regional
analysis. Total economic impacts from disposal-diversion models for all of California and all
regions are then presented. These two models are then compared, and the impacts from selected
diversion activities of the second sets of models are shown.
5.1 Economic Impact of Disposal Activities in the Disposal-Only Models This section considers the economic impacts of having all waste generated in California and each
region going only to disposal. The economic sectors included in these models are waste
collection, transfer stations, landfills, and WTE facilities. Table 5.1 presents the result of the
estimated economic impacts. The second column displays the total sales of the disposal sectors
adjusted to remove any double counting, and the third to sixth columns display the multiplier
effects of the sectors. One of the multiplier effects is output impact, which is a measure of how
the disposal sectors influence total sector sales in the economy. The third column of Table 5.1
shows that the California waste disposal sectors add a total output impact of $18.08 billion to the
economy if all generation is disposed.
The total income impact in column four measures the amount of total income for all persons in
the economy attributed to the disposal-related economic sectors, which are estimated as $6.83
billion. This is also part of the value-added impact in column five which measures the increase

46
in the value of goods and services sold by all sectors of the economy, minus the costs of inputs
(excluding labor), used by the sectors in providing the services. Value added impacts from
disposal models are shown at $8.99 billion. The last of the multiplier effects in the sixth column
is the job impacts, which shows that 154,200 jobs are created in all sectors of the economy.
Regional multiplier effects are also presented in Table 5.1. Because most waste is disposed in
the same regions as the points of waste generation, economic impacts of disposal sectors are
closely correlated with the volumes of waste generated in each region. The Southern California
region (E) has the most population and commercial sectors, and the largest volumes of waste
generated within the region. The table shows that the region has the largest output from disposal
sectors as well as largest multiplier effects. Total output of disposal sector is $4.14 billion, and
the region generates $9.58 billion in sales impacts, $3.61 billion in total income impacts, $4.72
billion in value-added impacts, and creates 82,000 jobs in the economy.
Table 5.1 Economic Impacts Of All 1999 Waste Generation Going Only To Disposal
Impact on Economy Region Estimated Final
Sales 1999 (in $1,000) Output
(in $1,000) Total Income (in $1,000)
Value Added (in $1,000)
Number of Jobs (1,000)
All California 7,515,696 18,076,597 6,829,702 8,994,681 154.2 Northern California Region (A)
219,668 494,410 181,429 236,808 5.0
Bay Area Region (B)
1,564,876 3,641,847 1,409,767 1,851,560 29.4
Central Coast Region (C)
294,476 637,213 242,831 313,009 5.9
Central Valley Region (D)
1,290,260 2,916,988 1,082,145 1,421,334 27.2
Southern California Region (E)
4,137,992 9,580,721 3,608,171 4,722,769 82.0
Eastern California Region (F)
6,625 12,206 4,439 5,780 0.1

47
5.2 Economic Impacts of Disposal and Diversion Activities in the Disposal-Diversion Models
This section discusses the economic impacts of models when both disposal and diversion sectors
are operating at the 1999 rate of diversion. As seen in Table 5.2, columns three, five and six,
these combined sectors are generating a total output impact of $21.20 billion, producing value-
added impacts of $10.74 billion and creating 179,300 jobs. The Southern California, Bay Area,
and Central Valley regions specifically are experiencing large impacts, gaining $5.63 billion,
$2.21 billion, and $1.76 billion in value-added, and creating 95,800, 33,900, and 32,200 jobs,
respectively.
Table 5.2 Economic Impacts of All Waste Generation Going to Both Diversion and Disposal at 1999 Rates
Impact on Economy Region Estimated Final
Sales 1999 (in $1,000) Output
(in $1,000) Total Income (in $1,000)
Value Added (in $1,000)
Number of Jobs (1,000)
All California 9,179,872 21,202,264 7,899,570 10,739,242 179.3 Northern California Region (A) 238,636 517,463 188,817 257,180 5.2 Bay Area Region (B) 1,904,847 4,223,924 1,627,949 2,207,142 33.9 Central Coast Region (C) 315,926 666,276 255,873 337,601 6.2 Central Valley Region (D) 1,597,169 3,462,420 1,292,609 1,755,819 32.2 Southern California Region (E) 5,117,327 11,347,974 4,168,314 5,634,805 95.8 Eastern California Region (F) 5,944 10,726 3,890 5,223 0.1

48
5.3 Comparison of Economic Model Results When comparing the two tables above, certain differences become apparent. Statewide, all the
measures of impact are higher for the combined disposal and diversion models. Total output
impacts are $3.13 billion or about 17 percent higher than the disposal-only model, value-added
impacts are $1.74 billion or about 19 percent higher and job creation is 25,000 jobs or about 16
percent higher.
The Southern California, Bay Area, and Central Valley regions specifically are experiencing
large differences, gaining $1.77 billion, $0.58 billion, and $0.55 billion in output impacts, $0.91
billion, $0.36 billion, and $0.33 billion in value-added impacts, and creating 13,800, 4,500, and
5,100 jobs, respectively. There will be more analysis of the results in Chapter 6.
5.4 Economic Impacts of Diversion Activities In addition to estimating the total impacts of disposal and diversion, the economic impacts of
each diversion activity used in the models were identified and individually estimated for the state
and for all the regions using the estimated diversion rate for 1999. The statewide diversion rate
was 37 percent, and this number varied by region based on material flows.
Because MRFs, composting facilities, and recycling manufacturers receive recyclable materials
from other sectors, we considered only the additional output above the costs of recycling and
yardwaste collection and recyclable feedstock in estimating their impacts on the economy. This
approach was used to avoid double counting of the sales and impacts.

49
As seen in Table 5.3, having diversion sectors in the economy leads to large impacts on output,
total income, value-added, and employment in the state. Total output impacts of the diversion
sectors in California are estimated to be $10.15 billion, and diversion sectors are also generating
$3.76 billion in total income impacts, $5.22 billion in value-added impacts, and creating 85,200
jobs. Recycling manufacturers, especially iron and steel related and nonferrous metals
industries, are generating large economic impacts in California.
Tables 5.3 to 5.9 present regional total sales and multiplier effects from their different diversion
activities. The Southern California region (E) has the largest output and multiplier effects from
all diversion activities. The total output, income, and value-added impacts are $4.80 billion,
$1.72 billion, and $2.40 billion, respectively, and 39,900 jobs are created in the region. The
Central Valley region (D) has the most output and multiplier effects from yardwaste collection
and composting facilities, since they are located in the area where agriculture is the main
economic activity. The Northern California region (A) has relatively higher economic impacts
from paper-related recycling manufacturing. There are little multiplier effects in the Eastern
California region (F) since there are relatively few diversion activities.

50
Table 5.3 Economic Impacts of Diversion Sectors in California
Impact on Estimated Final
Sales1, 1999 (in $1,000) Output
(in $1,000) Total Income (in $1,000)
Value Added (in $1,000)
Number of Jobs (in 1,000)
Recycling Collection and MRFs
1,353,202
3,189,964
1,363,288
1,768,215
27.5
Yardwaste Collection and Compost Facility
953,494
2,301,649
858,354
1,139,786
19.6
Recyclers 619,910
1,209,503
460,250
754,360
12.0
Collection and Transformation Facility
160,482
372,759
146,102
193,655
3.3
Recycling Manufacturers Paper, Cardboard-related
158,197
322,724
87,791
139,063
2.1 Plastics related
50,382
105,744
31,850
47,149
0.8 Glass related
287,200
594,162
201,004
296,177
4.9 Iron and Steel related
528,892
1,095,434
342,947
490,680
8.4 Nonferrous Metals
469,787
962,857
266,053
392,453
6.5 California Total 4,581,547 10,154,797 3,757,638 5,221,667 85.2
1. Estimated final sales are calculated by adjusting for the costs of recycling and yardwaste collection and recyclable feedstock sales to avoid double counting.

51
Table 5.4 Economic Impacts of Diversion Sectors in the Northern California Region (A)
Impact on Estimated Final
Sales1, 1999 (in $1,000) Output
(in $1,000) Total Income (in $1,000)
Value Added (in $1,000)
Number of Jobs (in 1,000)
Recycling Collection and MRFs
30,090
65,603
27,689
35,525
0.7
Yardwaste Collection and Compost Facility
44,583
100,582
36,277
47,907
1.0
Recyclers 23,386
43,701
16,202
26,767
0.5
Collection and Transformation Facility
-
-
-
-
-
Recycling Manufacturers Paper, Cardboard-related
15,625
29,827
8,401
13,335
0.2 Plastics related
273
538
144
214
<0.1 Glass related
5,938
10,598
3,382
5,099
0.1 Iron and Steel related
982
1,891
593
825
<0.1 Nonferrous Metals
139
263
86
119
<0.1 Regional Total 121,017 253,003 92,773 129,791 2.5 California Total 4,581,547 10,154,797 3,757,638 5,221,667 85.2
1. Estimated final sales are calculated by adjusting for the costs of recycling and yardwaste collection and recyclable feedstock sales to avoid double counting.

52
Table 5.5 Economic Impacts of Diversion Sectors in the Bay Area Region (B)
Impact on Estimated Final
Sales1, 1999 (in $1,000) Output
(in $1,000) Total Income (in $1,000)
Value Added (in $1,000)
Number of Jobs (in 1,000)
Recycling Collection and MRFs
315,178
713,326
312,608
403,921
5.8
Yardwaste Collection and Compost Facility
220,178
513,066
195,814
259,450
4.1
Recyclers 147,352
277,949
107,730
176,480
2.7
Collection and Transformation Facility
-
-
-
-
-
Recycling Manufacturers Paper, Cardboard-related
24,432
47,625
13,690
21,775
0.3 Plastics related
7,955
16,000
5,167
7,637
0.1 Glass related
82,865
164,162
57,255
83,918
1.3 Iron and Steel related
155,220
304,074
100,458
142,048
2.1 Nonferrous Metals
49,230
94,940
30,123
43,574
0.1 Regional Total 1,002,409 2,131,143 822,845 1,138,803 16.9 California Total 4,581,547 10,154,797 3,757,638 5,221,667 85.2
1. Estimated final sales are calculated by adjusting for the costs of recycling and yardwaste collection and recyclable feedstock sales to avoid double counting.
53
Table 5.6 Economic Impacts of Diversion Sectors in the Central Coast Region (C)
Impact on Estimated Final
Sales1, 1999 (in $1,000) Output
(in $1,000) Total Income (in $1,000)
Value Added (in $1,000)
Number of Jobs (in 1,000)
Recycling Collection and MRFs
49,329
104,109
45,468
57,661
1.0
Yardwaste Collection and Compost Facility
54,589
118,043
44,336
57,660
1.1
Recyclers 20,764
36,825
14,098
23,178
0.4
Collection and Transformation Facility
-
-
-
-
-
Recycling Manufacturers Paper, Cardboard-related
63
109
31
47
<0.1 Plastics related
926
1,610
482
700
<0.1 Glass related
2,302
3,979
1,338
1,962
<0.1 Iron and Steel related
1,341
2,383
529
783
<0.1 Nonferrous Metals
5,923
9,646
2,281
3,290
0.1 Regional Total 135,237 276,703 108,563 145,282 2.6 California Total 4,581,547 10,154,797 3,757,638 5,221,667 85.2
1. Estimated final sales are calculated by adjusting for the costs of recycling and yardwaste collection and recyclable feedstock sales to avoid double counting.

54
Table 5.7 Economic Impacts of Diversion Sectors in the Central Valley Region (D)
Impact on Estimated Final
Sales1, 1999 (in $1,000) Output
(in $1,000) Total Income (in $1,000)
Value Added (in $1,000)
Number of Jobs (in 1,000)
Recycling Collection and MRFs
359,278
799,068
338,660
438,208
7.5
Yardwaste Collection and Compost Facility
322,823
729,071
266,654
353,934
6.8
Recyclers 120,475
223,518
83,957
138,975
2.4
Collection and Transformation Facility
51,179
111,501
42,856
56,792
1.1
Recycling Manufacturers Paper, Cardboard-related
24,467
46,020
11,362
18,175
0.3 Plastics related
3,546
6,692
1,903
2,833
0.1 Glass related
87,033
166,059
56,680
82,816
1.5 Iron and Steel related
45,991
86,638
24,600
35,137
0.7 Nonferrous Metals
23,353
42,178
10,308
15,314
0.3 Regional Total 1,038,145 2,210,745 836,981 1,142,184 20.7 California Total 4,581,547 10,154,797 3,757,638 5,221,667 85.2
1. Estimated final sales are calculated by adjusting for the costs of recycling and yardwaste collection and recyclable feedstock sales to avoid double counting.

55
Table 5.8 Economic Impacts of Diversion Sectors in the Southern California Region (E)
Impact on Estimated Final
Sales1, 1999 (in $1,000) Output
(in $1,000) Total Income (in $1,000)
Value Added (in $1,000)
Number of Jobs (in 1,000)
Recycling Collection and MRFs
599,328
1,357,186
581,606
748,818
11.7
Yardwaste Collection and Compost Facility
311,322
720,958
268,055
353,181
6.2
Recyclers 307,366
578,453
220,486
362,203
5.8
Collection and Transformation Facility
109,300
244,144
95,242
125,285
2.2
Recycling Manufacturers Paper, Cardboard-related
93,610
180,749
47,713
75,628
1.2 Plastics related
37,641
74,407
22,050
32,479
0.6 Glass related
109,063
215,169
70,673
104,549
1.8 Iron and Steel related
325,358
650,538
200,990
286,359
5.2 Nonferrous Metals
391,141
779,697
210,878
310,650
5.3 Regional Total 2,284,128 4,801,301 1,717,691 2,399,152 39.9 California Total 4,581,547 10,154,797 3,757,638 5,221,667 85.2
1. Estimated final sales are calculated by adjusting for the costs of recycling and yardwaste collection and recyclable feedstock sales to avoid double counting.

56
Table 5.9 Economic Impacts of Diversion Sectors in the Eastern California Region (F)
Impact on Estimated Final
Sales1, 1999 (in $1,000) Output
(in $1,000) Total Income (in $1,000)
Value Added (in $1,000)
Number of Jobs (in 1,000)
Recycling Collection and MRFs
-
-
-
-
-
Yardwaste Collection and Compost Facility
-
-
-
-
-
Recyclers 568
891
325
563
<0.1
Collection and Transformation Facility
-
-
-
-
-
Recycling Manufacturers Paper, Cardboard-related
- -
-
-
-
Plastics related 36
1
<1
<1
<0.1
Glass related -
-
-
-
-
Iron and Steel related -
-
-
-
-
Nonferrous Metals -
-
-
-
-
Regional Total 604 945 383 583 0.1 California Total 4,581,547 10,154,797 3,757,638 5,221,667 85.2
1. Estimated final sales are calculated by adjusting for the costs of recycling and yardwaste collection and recyclable feedstock sales to avoid double counting.

57
6 Interpretation of Results
This chapter discusses the implications of the results obtained from two scenarios in Chapter 5,
presents the economic impacts of an average ton of waste sent to disposal or diversion beyond
the 1999 diversion rate, and discusses how the study findings can be hypothetically used in
project decisions.
6.1. Study Implication from the Two Scenarios
The previous chapter estimated how much the disposal and diversion sectors affected the
economy in California and each of six regions in 1999 for two different scenarios. When all
waste is disposed, large impacts are created in the California economy because collection and
landfill sectors require more labor and other inputs to operate. When waste is diverted, the
economic impacts related to disposal are lost, due to the decreased amount of waste collection
and disposal activities; however, additional large economic impacts are created from diversion
activities. In all the regions except for the Eastern California region, when the impacts of limited
disposal are combined together with those of diversion, the total surpasses the economic impacts
produced by the disposal only model. There is a lack of recycling infrastructure and facilities in
the Eastern California region which leads to the movement of waste and materials into other
regions and out-of-state.
Because different regions have different economic activities and business and industrial
infrastructures, the economic impacts from different diversion activities vary as seen in Tables

58
5.3 through 5.9. For example, the Northern California region has more forestry industries, and
thus has relatively more paper-related manufacturing activities. The Central Valley region has
more agricultural sectors that make more use of greenwaste as compost for crop production.
The findings in Chapter 5 suggest that diversion is good for the California economy, as it creates
additional economic impacts compared to the disposal-only model. When waste was diverted at
the 1999 rate, we found that at least 17 to20 percent higher economic impacts were created in
output, value-added, and job creation. The actual impacts would be larger if all manufacturing
sectors could be identified and captured in the study. The economic impacts would also increase
when the diversion business and industrial infrastructures become more established, as seen in
the Southern California and Bay Area regions. Creating markets to accept more recyclable and
compostable materials would be the key to stimulating more economic activities and higher
impacts in the state.
6.2. Average Economic Impacts per Ton for Changes in Disposal verses Diversion
Table 6.1 summarizes the average economic impacts of each additional ton of waste disposed or
diverted beyond the present diversion rate for the state and each region. We divided the total
output, income, value-added, and jobs generated in the disposal and diversion sectors by the tons
of waste disposed and diverted to derive the average impacts. ‘Average’ impacts were used in
the study instead of ‘marginal’ because marginal impact function could not be estimated from
IMPLAN system.
59
In California as a whole, the total economic impacts per ton from diversion are close to twice as
much as the impacts from disposal. Typically, a change of one additional ton of waste disposed
in California would generate $289 of total output in the state economy from all the multiplier
effects, while a change in one additional ton of waste diverted as recyclables would generate as
much as $564 in the economy. For every ton of waste disposed, $108 in total income and $144
in value-added would be created in the state economy, while for every ton of waste diverted,
$209 in total income and $290 in value-added would be created. As defined in the previous
chapter, “value-added” is the output minus all material costs (except labor) used in production.
Table 6.1 also shows that only 2.46 jobs would be created for every 1,000 tons of waste disposed
(1 job for every 400 tons), while 4.73 jobs would be created if the same volume of waste is
diverted as recyclables (1 job for every 213 tons).
The main findings of this study are similar to those of the past studies presented in Chapter 2.
The waste diversion activities result in a large increase in economic impacts and job creation.
Some past studies, however, resulted in higher indirect economic impacts and jobs created,
mainly in the manufacturing industries. The differences between our work and those of other
studies resulted from our conservative estimation methods of impacts in the manufacturing
sectors. Other studies examined a sample of manufacturers and applied the rates of their
recycled materials uses across the state, while this study used Census results to estimate the rates
and volumes of recycled material uses for manufacturers. As the result, this study covers the
entire state and is more consistent across regions in estimating impacts, but it may not capture
some manufacturers’ impacts, compared to other survey-oriented studies.

60
Table 6.1 Average Economic Impacts of Additional Waste Disposal and Diversion in 1999
Impacts on Regional Economy Region Total Sales
1999 ($/ton) Output
($/ton) Total Income
($/ton) Value Added
($/ton) Number of Jobs (Per
1,000 tons) Disposed 119 289 108 144 2.46 All California Diverted 254 564 209 290 4.73 Disposed 115 260 94 125 2.62 Northern
Region (A) Diverted 186 388 143 199 3.90 Disposed 118 275 106 140 2.22 Bay Area
Region (B) Diverted 224 476 184 254 3.78 Disposed 115 250 94 123 2.30 Central Coast
Region (C) Diverted 189 387 152 203 3.61 Disposed 105 241 88 118 2.23 Central Valley
Region (D) Diverted 276 587 222 303 5.49 Disposed 123 287 108 142 2.46 Southern
Region (E) Diverted 265 557 200 278 4.62 Disposed 131 241 87 114 2.42 Eastern
Region (F) Diverted 55 85 31 51 0.92
The study also found that the economic impacts varied by region. Average waste diversion
would stimulate the regional economies more than disposal in all regions but the Eastern
California region. As discussed earlier, the Eastern California region does not have much
infrastructure that supports recycling business, and most recyclables are delivered out of the
region for further processing and use in manufacturing. Economic impacts from diversion are
the highest in the Central Valley, Southern California, and Bay Area regions. These regions
have more business and industrial and/or agricultural infrastructure relative to other regions, and
a high percentage of the outputs generated by the diversion activity are re-spent in the same
regions. Relatively more recycled material users and/or recycling manufacturers are located in
these areas, and they create more value-added and jobs within the regions. As seen in Table 6.1,
the Central Valley region’s total output impacts are close to $350 per ton more when the waste is

61
diverted than when disposed. In the Southern region the difference is $270 per ton, and in the
Bay Area it is $200 per ton.
6.3 Important Notes on Using the Economic Impact Results In making the use of the study findings above, one must realize that the study results are based
on the reliability of secondary data sources and survey answers as well as various assumptions
that were made along the way as explained earlier in the report. In addition, not all economic
factors were or could be quantified, and some that were are only our best estimates. When given
a choice of data or method, we used the more conservative estimate. To this extent, this study is
not a precision tool, and it has likely resulted in the underestimation of actual economic impacts.
Although the trends are clear, decision-makers must use the study findings carefully.
The study assumed the same cost functions for all regions for all disposal and diversion sectors
as explained in Chapter 4. But there are some variations in input costs such as land and
transportation costs, and some facility designs are more labor intensive and others feature unique
processes, locally fabricated machinery, and special relationships between companies. This is
especially true of the waste industry, which is currently in a period of rapid change featuring
much experimentation and consolidation.
The study also did not evaluate economic impacts for each local jurisdiction separately within
the region nor included all manufacturing sectors that existed in the region. Different
communities even in the same region would benefit differently from any spending depending on
their share of the regional business and industrial infrastructure. Generally, the more commercial

62
and industrial business infrastructure in a community, the bigger the share of the original
expenditure will be captured, and the more likely that portions of subsequent rounds of re-
spending will be spent there or stay in the community. It was also not possible to track the flow
of all recyclable materials with the scope of this study, and some recycling manufacturers were
left out of the study that might generate large local economic impacts in a particular community.
An economic impact estimate is only an advisory tool for general planning purposes, and should
not be used alone to make critical monetary decisions. But it can provide insight into the relative
merits of different paths of development.
6.4 Hypothetical Example Using the Study Findings
This section describes in hypothetical terms how economic impact data could be used as an
advisory tool at the local government level. Suppose a jurisdiction located in the Bay Area
region (B) is faced with the problem of determining whether to fund a recycling program that
costs $50,000, but can divert 1,000 tons of waste from landfills.
We recommend that you do not use the data in Table 6.1 for an actual analysis. But, if one had
more precise local data showing that, for example, one ton of waste disposed in a landfill in the
Bay Area region (B) generates $118 in total output in the disposal sectors (which include waste
collection, transfer stations, landfills, and WTE biomass), and it also generates $275 in total sales
in the regional economy after all multiplier effects are accounted for. Total income impacts, and
63
value-added impacts in the region are $106, $140 respectively per ton, and 2.22 jobs would be
created region-wide per 1,000 tons of waste disposed.
When the same waste is diverted as recyclables in the region, $224 per ton would be generated in
the combined disposal and diversion sectors, $476 per ton would be added to the total output of
the regional economy after the multiplier effects, and $184 per ton in total income impacts and
$254 per ton in value-added impacts would be stimulated in the regional economy. In addition,
for every 1,000 tons of waste diverted, 3.78 jobs would be created in the region.
Since the new recycling program is estimated to divert 1,000 tons of waste as recyclables from
landfills, the net increase in the economic impacts, when comparing diversion to disposal would
be calculated as follows:
Average for each 1,000 tons
Total Income Impacts = (184 – 106) x 1,000 = $78,000
Value-Added Impacts = (254 – 140) x 1,000 = $114,000
Jobs Creation Impacts = (3.78 – 2.22) x 1 = 1.56 jobs
The increase in total income and value-added impacts are larger than the recycling program cost;
therefore, the program would provide a positive benefit for the region. This is one method of
benefit-cost analysis. To examine the full range of benefits and costs (including environmental
and social) and their distribution would require more data and analysis. It should be noted that
the program cost may be a public expenditure, but the total income will be a private benefit. In

64
addition, the job creation and resulting taxes will be spread throughout the region but the costs of
the program may accrue to a single jurisdiction. It is important to examine and quantify the
distribution and value of the impacts. No one would ever fund a program based on a single piece
of evidence, but economic impacts are one indicator that may provide insight in an overall
analysis of the question by decision makers.

65
7 Suggestions for Further Research
Although this is the first input-output analysis of the solid waste industry done in California there
are many areas where standardized definitions and improved accuracy of data inputs could
improve the economic analysis of the waste disposal and diversion sectors.
The regional geographic areas defined in this study are “best guesses” based on general
economic experience and the opinion of Waste Board staff and members of the waste industry.
Hard data is needed about the size, shape and number of waste disposal and diversion regions in
California. Waste geography is sensitive to demand factors and transportation costs, but periodic
consistent tracking of the origins and flows of waste and recyclable materials would reveal
valuable information about the basic behavior of material volumes under differing economic
conditions.
The tonnage and cost data in this study have been collected primarily from secondary data
sources, such as the Waste Board databases, the U.S. Department of Commerce, and waste
industry studies and estimates. The Waste Board databases were very helpful, but their scope
was limited to Board-permitted sites and many of the smaller facilities are not required to submit
data. Much of the permit data was also in poorly identified amounts (tons/pounds/cubic yards),
was not up to date, or lacked a standard conversion factor. Additional data about the total
amount of diverted materials in California, especially non-CRV materials, would be especially
helpful.

66
As explained in Chapter 4, not all manufacturers using recycled materials were included in the
study, as there is only limited census data on the use of recycled materials and only in certain
industries. A survey of recycled material volume and use by manufacturers during local waste
audits could be valuable in determining the flow and end uses of materials.
In discussing the draft survey with potential participants, the authors were struck with how
frequently both disposal and diversion related businesses, big and small, did not have good
knowledge of their revenue and cost allocations and had to rely on traditional “rules of thumb” or
rough experience to determine outlay percentages for such things as labor, equipment, or
insurance costs. Fortunately, some firms did have the data or were willing to do research. This
lack of fundamental business data may be evidence of how recently the diversion industry has
emerged and/or the rapid changes taking place in the industry. Many of those contacted
expressed a sincere desire for better estimates on operations data. The development of better and
more standardized accounting methods would be helpful to the waste industry, especially small
operators.
The Waste Board’s hierarchy starts with source reduction, but this form of diversion was not
included in the study because it is very difficult to assign economic values and obtain volume
data in this area of behavior. There is no secondary data yet available from the government or
the waste industry to measure the amount and value of the economic activities.. A survey of
waste generators would be necessary to gain a sample of practices by industry type and an
estimate of the average dollar savings. It may be difficult to determine where the savings are

67
applied without a longitudinal study, as the saved expenditures may not be distinct, or the
alternate spending may not occur in the same time period.
The economic impacts from reuse industries were also not captured in the study. It was not
possible to specify which activities are considered ‘reuse’, as it is vaguely defined in State
statutes and regulations, and there are no secondary estimates for many types of reuse. More
work needs to be done in the area of economic life-cycle analysis of products before commonly
accepted economic-based definitions can be developed to allow the collection of meaningful
data.
In addition, overall environmental benefits and costs from waste diversion have not been
discussed in this study. Much work needs to be done to develop standard measurement methods,
and the volume and economic value of environmental protection in California.
Case studies are also not included because it was not possible to gain sufficient cooperation from
local governments and waste and diversion industries. At least one county has, however,
expressed interest in further research.


69
8 Appendixes

71
8.1 Appendix A: Data Contributors
Public agencies and private firms in California provided survey response data, document review
comments, or other information to assist in the development of this study. The authors are very
grateful for their support. For reasons of business confidentiality, not all the firms that
cooperated with the study wished to be publicly recognized.
Please note that no support data or economic estimates listed should be construed to represent the
data submitted by any one of these contributors for their regions. Confidential business revenue
and expenditure production factors used in this study were masked and are presented as summary
averages only. Any data errors or misstatements in the study reflect the Authors’ opinions only.
The following firms were among those that assisted in the study.
Alco Iron & Metal Company Alliance Metals Bigfoot Recycling Calaveras County Public Works City of Long Beach - SERRF City of San Diego Environmental Services Department Guziks Good Humus County Sanitation Districts of Los Angeles County Sonoma County Integrated Waste Division Waste Management Inc.

72
The authors would like to also recognize the Waste Board and University of California, Berkeley
staff who provided data or other assistance to this project.
Vicki Adamu
Skip Amirine
Nancy Carr
Howard Levenson
Vijay Pradhan
Chris Schmidle
John Sitts
8.2 Appendix B: References for Published Literature Arizona Department of Commerce, National Marketing Division. 1996. Arizona Recycling Market Development Study: Summary Report. Phoenix, Arizona. Butterfield, David W. and Kubursi, Atif A. 1993. Regional Economic Effects of Recyclingin Ontario. Canadian Journal of Regional Science XVI (3), 413-431. Cal Recovery Inc. 1992. Economic Development Study for Industries Utilizing Recyclable Materials. Prepared for City of San Jose, Office of Environmental Management. California Futures. 1993. Cost-Benefit Analysis of Six Market Development Policy Options, Draft Report. A Report Prepared for the California Integrated Waste Management Board. California Integrated Waste Management Board (CIWMB). 1995. Recycling Market Development Zone Loan Program Evaluation: Report to the Legislature. City of Sacramento Office of Economic Development, Department of Planning and Development. 1991. The Economics of Recycling, Sacramento: A Case Study. Sacramento, California. Deyle, Robert E. and Schade, Bernd F. 1991. Residential recycling in Mid-America: The cost effectiveness of curbside programs in Oklahoma. Resources, Conservation and Recycling 5: 305-327.

73
Environmental Defense Fund (EDF). 1990. Recycling and incineration: Evaluating the Choices. Edited by Richard Demison and John Rustan. Florida Department of Commerce, Division of Economic Development. 1996. Recycling Creates Jobs in Florida. Tallahassee, Florida. Folz, David. 1999. Recycling Policy and Performance: Trends in Participation, Diversion, and Costs. Public Works Management and Policy. October. Folz, David. 1992. The Economics of Municipal Recycling: A Preliminary Analysis. Department of Political Science, University of Tennessee, Knoxville, Tennessee. Paper presented at the Southeastern Conference on Public Administration, Montgomery, Alabama, October 7-9, 1992. Hanley, Nick and Slark, Rick. 1994. Cost-Benefit Analysis of Paper Recycling: A Case Study and Some General Principles. Journal of Environmental Planning and Management 37(2), 189-197. Highfill, Jannett and McAsey, Michael. 1997. Municipal Waste Management: Recycling and Landfill Space Constraints. Journal of Urban Economics 41, 118-136. Holman, Walter R. 1992. Economics of Statewide Recycling: A Critical Review of the California Experience. Journal of Environmental Systems 20(4): 323-342 King County Department of Natural Resources, Soil Waste Division. 1996. Summary Report of 1995 Surveys of Washington State Recycled Material Collectors and Haulers, Transporters, Processors, and End-Users. Washington. May. Land & Water Associates and Market Decisions, Inc. 1993. Recycling and the Maine Economy. Prepared for the Maine Waste Management Agency. April. Lea, W. Reid. 1996. Plastic incineration versus recycling: a comparison of energy and landfill cost savings. Journal of Hazardous Materials 47: 295-302 Lea, Reid and Tittlebaum, Marty. 1993. Energy cost savings associated with municipal solid waste recycling. Journal of environmental engineering 119(6): 1196-1216 Local Government Commission. 1992. Capturing the Local Economic Benefit of Recycling: A Strategy Manual for Local Governments. Sacramento, California. Minnesota Office of Environmental Assistance. 1997. Minnesota's Value-Added Recycling Manufacturing Industries: An Economic and Environmental Profile. Saint Paul, Minnesota. July.

74
Nebraska Department of Economic Development, Recycling Economic Development Advocate. 1997. Economic Impact of Recycling in Nebraska. Lincoln, Nebraska. October. North Carolina Department of Environment, Health and Natural Resources (DEHNR). 1997. Analysis of the Full Costs of Solid Waste Management for North Carolina Local Government. Raleigh, North Carolina. February. North Carolina Department of Environment, Health and Natural Resources (DEHNR). 1995a. North Carolina Recycling Business Study: Employment, Capital Demands, and Technical Assistance Needs. Raleigh, North Carolina. July. North Carolina Department of Environment, Health and Natural Resources (DEHNR). 1995b. The Impact of Recycling on Jobs in North Carolina. Raleigh, North Carolina. July. Platt, Brenda A, and Morris, David. 1993. The Economic Benefits of Recycling. Washington, D.C. Institute for Local Self-Reliance. January. Powell, Jane C., A.L. Craighill, J.P. Parfitt, and R.K. Turner. 1996. A Lifecycle Assessment and Economic Valuation of Recycling. Journal of Environmental Planning and Management 39(1), 97-112. Quigley, John. Employment Impact of Recycling. Biocycle. March, 1988 Reamer, Andrew D. 1991. Creating Jobs from Trash. Commentary. 20-29 Rennie, Caroline and MacLean, Alair. 1989. Salvaging the future: waste-based production. Institute for Local Self-Reliance. Washington D.C. Roy F. Weston, Inc. 1994. Value Added to Recyclable Materials in the Northeast. Prepared for the Northeast Recycling Council, Council of State Governments. Wilmington, Massachusetts. May 8. Roy F. Weston, Inc. 1996. Economic Benefits of Recycling in the Southern States. Prepared for the Southern States Energy Board. Norcross, Georgia. August. Scarlett, Lynn. 1993. Recycling costs: Cleaning away some smoke. Solid Waste & Power 7(4): 12-17 Sell, Randall S, FL Leistritz, SH Murdock, S. Spies, S. White, RS Krannich, K. Wrigley, and JD Wulfhorst. 1998. Economic and Fiscal Impacts of Waste and Non-waste Development in Rural United States. Impact Assessment and Project Appraisal 16(1): 3-13. Sound Resource Management Group, Inc. 1993. The Economics of Recycling and Recycled Materials (Revised Final Report). Prepared for the Clean Washington Center, A Division of the Department of Trade and Economic Development. Seattle, Washington. June 30.

75
Wong, Judith and Edwards, Harry W. 1995. Waste Prevention Saves Money: Industry Case Studies. Presented at the Solid Waste Association of North America’s 6th Annual Waste Reduction, Prevention, Recycling and Composting Symposium, Denver, Colorado.
8.3 Appendix C: Data Sources 1999 California Statistical Abstract. Alder, Green & Hasson LLP. 1997 California Waste Industry Survey. Los Angeles. Aluminum Association, Inc. Recycling Facts. Website. Biocycle. Composting Source Separated Organics. The JG Press, Inc. Emmaus, Pennsylvania. 1994. California Energy Commission. Operational Power Plants (1000kW (0.1MW) and Above). February, 2000 California Integrated Waste Management Board (CIWMB). 2000a. Estimated Average 1990 Waste Stream Composition including Diversion of Excluded Waste Types. CIWMB. 2000b. Estimated California Waste Tonnages and Diversion Rates. September 8, 2000, CIWMB Website CIWMB. 2000c. 1999 Landfill Tonnage Report (CIWMB Website) CIWMB. 2000d. Disposal Reporting System Database CIWMB. 2000e. Second Quarter 2000- General SWIS Data Report, July 10. CIWMB. 2000f. Solid Waste Information System database CIWMB. 2000g. Waste Characterization Database CIWMB. 2000h. 1999 Tipping Fees at California Solid Waste Disposal Facilities CIWMB. 2000i. California Material Exchange. CIWMB. 2000j. Estimated Disposal Rates for California Residents. September 8. CIWMB. 1998a. Glass Marketing Guide. CIWMB. 1998b. Metal Containers Marketing Guide.

76
CIWMB. 1994 Secondary Materials Market Assessment Study. Prepared by R.W. Beck and Associates. Division of Recycling, Department of Conservation (DOR/DOC). 1999a. Payment and Processing System DOR/DOC. 2000. Curbside Program CIWMB Organics Section 2000. Miller, Chaz. The Cost of Recycling at the Curb. Waste Age, National Solid Wastes Management Association. 1993. National Solid Waste Association. 1992. The Cost to Recycle at a Materials Recovery Facility. Roy F. Weston, Inc. 1992. The Cost to Recycle at a Materials Recovery Facility (MRF) Prepared for the National Solid Wastes Management Association. State of California. 1996a. The Counties Annual Report: Fiscal Year 1995-1996.
State of California. 1996b. The Cities Annual Report: Fiscal Year 1995-1996.
Templeton, S., Brown, C., Goldman, G., Yoo, S, and Pradhan, V. An Analysis of the Horticultural Economy in California. Department of Agricultural and Resource Economics, University of California, Berkeley. May, 1999. US Census Bureau. 1999. 1997 Economic Census. Manufacturing, Industry Series. Various sectors. Waste News. Commodity Prices for Los Angeles. Various issues from January, 1996 to June, 2000. World Resource Foundation. 1997. “Technical Brief from the World Resource Foundation: Material Reclamation Facilities.

77
8.4 Appendix D Copy of a Typical Survey Instrument
Each respondent in the survey sample was provided with an appropriate survey form for collection, MRF/transfer station, disposal, brokerage, composting and/or waste to energy. They were also given general directions, a map of the regions, a glossary of terms, an addressed return envelope, and a contact phone number for questions. Each respondent also received a follow up phone call.
Please fill out this questionnaire if you collect refuse, recyclables, green wastes, and/or other materials from residences, businesses, and any other establishments. If you also operate transfer stations, material recovery facilities (MRF), landfills, recycling buyback centers, and/or drop-off centers, please report information regarding these activities separately from your collection activities by filling out other questionnaires in your survey package in addition to this questionnaire. Waste Collection Survey In this questionnaire, please provide us with information regarding your collection services of refuse, recyclable, and green waste materials for the most recent year of operations in California for which you have complete data. If you do not have a complete year, please estimate the average or typical tonnage volumes you collect or dollars you expend in a year. All the information you provide us will be handled in a strictly confidential manner. Please provide us with information about you and your employer. Respondent's Name: ____________________________________________________ Respondent's Title: ____________________________________________________ Company Name: ____________________________________________________
Address: ____________________________________________________ Contact Phone Number ____________________________________________________ If you would like your company name to appear on our acknowledgment page, please specify how you would like it to read. If you do not fill in this line, your company's participation will remain anonymous.
Name: ____________________________________________________ If you would like to receive a copy of our completed report, please indicate where we should send the report:
Address: ____________________________________________________ City/Zip ____________________________________________________ Please see the state map included in the survey package and note all regions in which you operate (Please circle all letters that apply): Regions: A B C D E F Please complete a questionnaire for all California regions that you circled above, but report data from each region separately. If you have operations in more than one region, please copy this questionnaire as needed. Please note that terms in boldface are defined in the glossary in your survey package.

78
Data in this questionnaire comes from: Region: ______________________ (Please specify one region only) Year: ______________________ (Fiscal or Calendar year Collection Services Q1. Please estimate the percent of your total annual tonnage volume that comes from each of the following collection services you provide in the region you specified (Please include volumes of all refuse, recyclables, and green waste materials; Please do not include volumes collected from drop-off centers or buyback centers). ` Residential Waste Collection __________________ % Commercial Waste Collection __________________ % Industrial Waste Collection __________________ % Institutional Waste Collection __________________ % Q2. Please provide following information relative to materials that you collected from all your residential service areas in the region: Materials Collected
Annual Volume Collected (tons)
Names of All Counties You Serve in Region Specified
Number of Homes and Multi-units Housing Complexes You Serve
Refuse
___________________ homes ___________________ multi-units complexes
Recyclables
___________________ homes ___________________ multi-units complexes
Green Waste
___________________ homes ___________________ multi-units complexes
Other (Please Specify) __________
___________________ homes ___________________ multi-units complexes

79
Q3. Please provide following information relative to materials that you collected from all your commercial/ industrial/ institutional service areas in the region: Annual Volume
Collected (tons) Names of All Counties You Serve in Region Specified
Number of Accounts Served
Market Share of Your Business in the Region (%)
Refuse
Recyclables
Green Waste
Tires
Other (Please Specify) ___________

80
Q4. Please provide following information about the next destination of materials that you collected from all your collection services in the region (The example below shows that 2,000 tons of materials you handled were sent to landfills, 30% of the materials was shipped to Region A and C, and 15% was shipped outside California): Destination of Materials You Handled
Annual Tonnage Percent Shipped Outside the Region but in California
Region(s) beside Your Own that You Send Waste to
Percent Shipped Outside California
(Example) Landfills
2,000 tons
30%
A, C
15%
Transfer Station/ MRF
Landfills
Waste-to-Energy Facility (Waste Board Permitted)
Waste-to-Energy Facility (Not Waste Board Permitted)
Recycling Brokers/ Processors
Composting Facilities
Other (Please Specify) ______________________
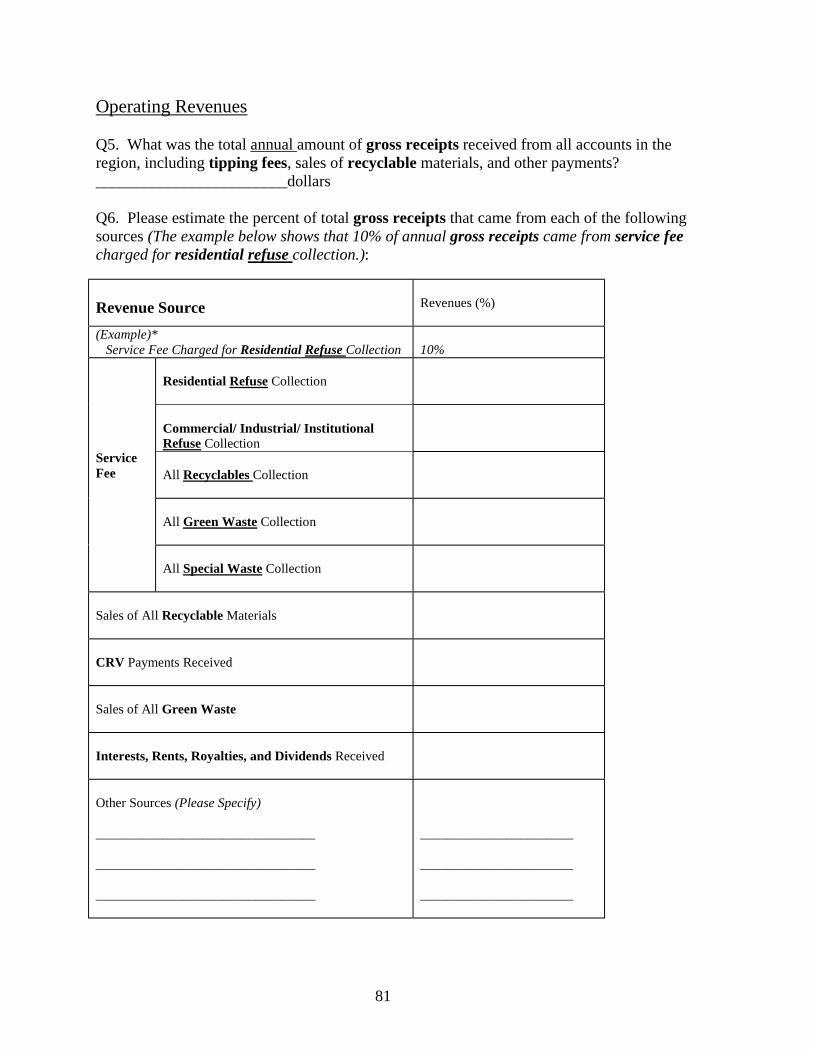
81
Operating Revenues Q5. What was the total annual amount of gross receipts received from all accounts in the region, including tipping fees, sales of recyclable materials, and other payments? ________________________dollars Q6. Please estimate the percent of total gross receipts that came from each of the following sources (The example below shows that 10% of annual gross receipts came from service fee charged for residential refuse collection.): Revenue Source
Revenues (%)
(Example)* Service Fee Charged for Residential Refuse Collection
10%
Residential Refuse Collection
Commercial/ Industrial/ Institutional Refuse Collection
All Recyclables Collection
All Green Waste Collection
Service Fee
All Special Waste Collection
Sales of All Recyclable Materials
CRV Payments Received
Sales of All Green Waste
Interests, Rents, Royalties, and Dividends Received
Other Sources (Please Specify) _________________________________ _________________________________ _________________________________
_______________________ _______________________ _______________________
82
Operating Expenses for Year Q7. Please estimate your total annual expenditures in the region for all items in the following table (If you do not know the exact amounts, please make a best estimate): Expenditure Items
Expenditure for Year (Dollars)
Tipping Fees Paid to Landfills or Other Facilities
CRV Paid to Customers
Labor Costs for All Employees
Fringe Benefits for All Employees
Operating Equipment and Operating Materials Purchased or Leased for Use for Your Operations Trucks, Loaders, etc ______________________________ dollars Handling and Processing Equipment ______________________________ dollars Office Equipment ______________________________ dollars Containers/ Bins ______________________________ dollars Other Materials ______________________________ dollars Equipment Maintenance and Repair Outside Contracted Services (Including labor and parts): ________________________ dollars In-house Maintenance and Repair, Material Costs (Not including labor costs) ________________________ dollars Fuel and Oil Expenses
Land Purchased during the Survey Year
Ongoing Construction Expenditures for Facilities (Not Include Routine Maintenance Costs)

83
Q7 (cont'd) Expenditure Items
Expenditure for Year (Dollars)
Facility Maintenance and Repair Outside Contracted Services (Including labor and parts): ________________________ dollars In-house Maintenance and Repair, Material Costs (Not including labor costs) ________________________ dollars Rental or Lease Costs for Land and Facility Uses
Insurance Costs
Water Uses
Utilities besides Water
Property Taxes
Indirect Business Taxes
Contracted Transportation Costs
Loan and Interest Payments
Office Supplies
Franchise Fees, Business Licenses and Operating Permits
Consulting and Professional Services
Others (Please Specify) ___________________________________________ ___________________________________________
_________________________________ _________________________________
Thank you very much for your time and cooperation. Please remember to fill out additional questionnaires for other regions and other activities


85
8.5 Appendix E Waste Flow Charts

Generator 56.4
Recycling Broker/ Recycler
5.6 Scavengers
MSW Landfill 4.3
Recycle
Out of StateDisposal 0.1
81.5%
10.0%
8.1%Hauler 46.0
0.2%
Transfer MRF Station
WTE / Biomass 0.1
Compost Facility
ADC 0.3
MRF -Clean /Dirty /Hybrid
Out of State Sales
End Users
0.5%
0.2%
LEGEND ………. Diversion ______ Disposal
86Figure 8-1 California 1999 Material Flow fromGenerators (in million tons)

87
Transfer MRF Station 17.8
Generator
Recycling Broker/ Recycler
Waste Hauler 31.9
Scavengers
WTE / Biomass 0.3
MSW Landfill 13.4
Compost Facility
ADC 0.8
MRF -Clean /Dirty /Hybrid
Recycle
Out of State Sales
End Users
1.2%
55.7%
42.0%
1.1%
2.6%
Out of State Disposal 0.4
Figure 8-2 California 1999 Material Flow from Waste Haulers (in million tons)
LEGEND ………. Diversion ______ Disposal

Transfer MRF Station
Generator
Recycling Broker/ Recycler
1.1 Hauler
Scavengers
WTE / Biomass 1.6
MSW Landfill
Compost Facility 5.0
ADC
MRF -Clean /Dirty /Hybrid
Recycle
Out of State Sales
End Users
Recycling
Yardwaste Hauler 6.6
24.4%
75.6%
Out of State Disposal
LEGEND ………. Diversion ______ Disposal
Figure 8- 3 California 1999 Material Flow fromYardwaste Collectors (in million tons)
88

Transfer MRF Station
Generator
Recycling Broker/ Recycler
1.2 Hauler
Scavengers
WTE / Biomass
MSW Landfill
Compost Facility
ADC
MRF -Clean /Dirty /Hybrid 7.5
Recycle
Out of State Sales
End Users
Recycling
Recycling Hauler 7.5
100.0%
Out of State Disposal
LEGEND ………. Diversion
Figure 8-4 California 1999 Material Flow from
Recycling Collectors (in million tons)
89 ______ Disposal
90
Transfer MRF Station 17.8
Generator
Recycling Broker/ Recycler
Hauler
Scavengers
WTE / Biomass 0.4
MSW Landfill 16.9
Compost Facility
ADC 1.1
MRF -Clean /Dirty /Hybrid
Recycle
Out of State Sales
End Users
Figure 8-5 California 1999 Material Flow from Transfer Stations (in million tons)
2.4%
2.8%
94.8%
6.0%
Out of State Disposal 0.5
LEGEND ………. Diversion ______ Disposal

Transfer MRF Station
Generator
Recycling Broker/ Recycler
1.9
Hauler
Scavengers
WTE
MSW Landfill 3.7
Compost Facility
ADC
MRF -Clean /Dirty /Hybrid 7.5
Recycle
Out of State Sales 1.9
End Users
50.0%
25.0%
25.0%
Out of State Disposal
LEGEND ………. Diversion ______ Disposal
Figure 8-6 California 1999 Material Flow fromMaterial Recovery Facilities (in million tons)
91
Transfer MRF Station
Generator
Recycling Broker/ Recycler
Hauler
Scavengers
WTE
MSW Landfill
Compost Facility 5.0
ADC
MRF -Clean /Dirty /Hybrid
Recycle
Out of State Sales 0.5
End Users 4.5
10.0%
90.0%
Out of State Disposal
LEGEND ………. Diversion ______ Disposal
Figure 8-7 California 1999 Material Flow fromCompost Facilities (in million tons)
92

Transfer MRF Station
Generator
Recycling Broker/ Recycler
Hauler
Scavengers
WTE 2.5
MSW Landfill 38.6
Compost Facility
ADC 2.2
MRF -Clean /Dirty /Hybrid
Recycle
Out of State Sales 6.1
End Users 8.2
1.8%
68.4%
10.9% 14.6%
3.9% 4.4%
Out of State Disposal 1.0
LEGEND ………. Diversion
Figure 8-8 California 1999 Material Flowto End Use (in million tons)
93 ______ Disposal

94
Transfer MRF Station
Generator 5.6
Recycling Broker/ Recycler
7.5
Hauler
Scavengers
WTE / Biomass
MSW Landfill
Compost Facility
ADC
MRF -Clean /Dirty /Hybrid 1.9
Recycle
Out of State Sales 3.8
End Users 3.8
Figure 8-9 California 1999 Material Flow from Brokers (in million tons)
50.0%
50.0%
Out of State Disposal
LEGEND ………. Diversion ______ Disposal