Embed Size (px)
Citation preview

The Economic Impact of the Aviation Industry on the New York–New Jersey Metropolitan RegionOctober 2005

1
TABLE OF CONTENTS
EXECUTIVE SUMMARY ……………………………………………………… 1
INTRODUCTION ……………………………………………………… 3 SECTION 1: OPERATING IMPACT OF THE AVIATION INDUSTRY Direct Operating Impact …………………………………………………… 6 Direct Operating Impact by Airport. ……………………………… 7 Total Operating Impact…………………………………………………….. 9 Total Operating Impact by Airport. ……………………………… 11 Supporting Industries. ……………………………………………………… 12
Economic Impact of Air Cargo. …………………………………………… 12 Direct and Total Impact of Air Cargo by Airport ………………… 14
SECTION 2: ECONOMIC IMPACT FROM INVESTMENT IN AIRPORT INFRASTRUCTURE Investment Background …………………………………………………… 15 Direct and Total Impact from Investment Spending……………………. 16
SECTION 3: ECONOMIC IMPACT OF AIR VISITORS TO THE REGION Profile of Air Visitors ……………………………………………………… 17 Direct and Total Impact of Air Visitors…………………………………… 17
SECTION 4: QUALITATIVE BENEFITS AND TRENDS IN THE AVIATION INDUSTRY Qualitative Regional Benefits of the Aviation Industry ………………… 20 Trends Affecting the Future Regional Impact of the Aviation Industry... 20
SECTION 5: SUMMARY …….….………………………………………………… 22 APPENDIX A: COUNTRIES OF DESTINATION SERVED BY EWR, JFK AND LGA ………. ………………………………………………… 24 APPENDIX B: GLOSSARY OF TERMS ………………………………………… 25 APPENDIX C: THE PORT AUTHORITY REGIONAL INPUT- OUTPUT
MODEL ……………………………………………………………… 26

1
EXECUTIVE SUMMARY
The aviation industry anchored around JFK International Airport, Newark Liberty International Airport, and LaGuardia Airport has been a significant driver of the New York–New Jersey metropolitan region’s economy. In providing air transportation services to domestic and international destinations directly to more than 200 cities in 70 countries, the industry contributes to the economic well being of the region’s nearly 20 million people.
In 2004, the regional airport system served approximately 94 million air passengers and
allowed the handling of almost three million tons of cargo. The impact of these activities accounted for:
♦ 278,890 total jobs ♦ $13.1 billion in wages ♦ $37.1 billion in sales or economic activity
Over the 2000-2004 period the Port Authority, along with its business partners at the
airports, invested $7.4 billion, or an average of nearly $1.5 billion annually, on infrastructure enhancements at the airports. Investment made at the airports generated:
♦ 14,500 total jobs ♦ $724 million in wages ♦ $2.4 billion in sales or economic activity
An estimated 16.9 million domestic and international visitors came to the region by air in
2004. Empirically, visitors’ spending on shopping, lodging, meals, entertainment and local transportation represents the major secondary benefit of the air transportation system. Tourism expenditure in 2004 supported:
♦ 192,280 jobs ♦ $6.6 billion in wages ♦ $17.6 billion in sales or economic activity
The combined impact of aviation operations, airport investment and tourism resulted in:
♦ 485,670 jobs, or 5.5 percent of the region’s non-farm jobs ♦ $20.5 billion in wages ♦ $57 billion in sales or economic activity
The region’s aviation industry generates other benefits as well as costs not quantified in
this report. Chief among the qualitative factors:
Air travel facilitates globalization now occurring in many industries as firms internationalize their investments, supply and production chains and their customers. Continued growth in international trade and foreign direct investment is expected to expand the reach of globalization and, consequently, the use of air travel for business purposes.

2
Low-cost carriers have significantly increased domestic price competition in the last four years. This has increased the welfare of air travelers and enhanced economic growth as savings from low ticket prices are spent on other parts of the economy.
The increased use of the AirTrain system by air passengers and airport
employees to access JFK and Newark airports along with the phasing in of newer and quieter aircraft has been beneficial to the environment. However, noise pollution, which affects communities immediately surrounding the airports, still needs to be monitored to ensure that mandated noise restrictions are maintained.
The aviation industry has engaged in community outreach programs, from aiding
schools and universities to providing employment counseling to local individuals, in an effort to promote economically stable and prosperous communities
Following the terrorist attacks of 9/11, airport security has become a major issue,
necessitating investment in infrastructure upgrade, new information technologies and employee training. While this expenditure benefits regional suppliers engaged in security operations and reduces the threat of terrorism, the provision of security imposes higher costs to consumers, carriers and airport operators.
Strategic actions taken in the next few years will be critical to the vitality of the
aviation industry. Internal competition among carriers and external competition from new technologies such as E-conferencing will require continued restructuring, especially in the areas of bilateral and multilateral alliances and code sharing, if the industry is to continue to play its historical role as one of the fundamental pillars of economic growth.

3
INTRODUCTION JFK International, Newark Liberty International, and LaGuardia airports constitute one of
the world’s premier air transportation systems. In 2004, the airports supported over 1,500 daily departing flights to more than 200 cities in 70 countries. The services rendered by a host of airport providers in facilitating travel and trade form the basis for the region’s aviation industry, one that contributes in a very consequential manner to the region’s welfare and helps to maintain the area as a thriving metropolis.
Each of the three airports plays a pivotal role in the region’s air transportation network.
JFK International Airport (JFK) is a major gateway for international travelers and provides medium- and long-distance flights to domestic and international markets. LaGuardia Airport (LGA) functions as the center for short-haul business trips, with a majority of the passengers originating from or destined for the region. Newark Liberty International Airport (EWR) complements both JFK and LaGuardia airports with a blend of domestic and international service in short- and long-haul markets.
In 2004, the airports handled 1.1 million domestic and international flights carrying 93.9
million passengers, or 12.4 percent of the nation’s aviation passenger traffic, and three million short tons of cargo, or 14.4 percent of U.S. air cargo volume. The purpose of this study is to translate the 2004 performance into its economic impact on the 26-county New York-New Jersey metropolitan region.
The ensuing analysis quantifies the regional economic effects by looking at three major
activities. First, it analyzes the operational impact of on- and off-airport firms that cater to airport users. Second, it assesses the economic benefits from investment in airport infrastructure. Third, it evaluates the contribution made by air visitors to the region. The report also explores the major qualitative benefits and costs of the industry and highlights some of the trends that are likely to affect future regional impact.
Economic estimates of the aviation industry are conducted for the geographical region
consisting of 26 counties in the states of New York and New Jersey. The New York segment encompasses: Bronx, Dutchess, Kings, Nassau, New York, Orange, Putnam, Queens, Richmond, Rockland, Suffolk, and Westchester. The New Jersey area consists of Bergen, Essex, Hudson, Hunterdon, Mercer, Middlesex, Monmouth, Morris, Ocean, Passaic, Somerset, Sussex, Union and Warren counties.
BOX 1: AIRPORTS AT A GLANCE (2004)
Category EWR JFK LGA Land Area (in acres) 2,027 4,930 680 Runways 3 4 2 Gates 114 96 72 Cargo Area (millions of rentable square feet) 1.3 4.5 0.06 Terminal Area (millions of square feet) 3.1 6.2 1.4
Accumulated Port Authority and PFC Investment (in Millions) $3,700 $4,848 $1,202

FIG. 1: MAP OF COUNTRIES SERVED BY DIRECT FLIGHTS
Countries of destination (See Appendix A for the list of the countries.)
4
FROM EWR, JFK AND LGA

Bergen
Bronx
Monmouth
Mid
dles
ex
Hunterdon
Somerset
NY
Kings
Hudson Queens
Richmond
Essex
Nassau
Suffolk
Rockland
Westchester
Passaic
Warren
Dutchess
Mercer
Morris
Ocean
Sussex
Union
OrangePutnam
FIG. 2: MAP OF THE 26-COUNTY NEW YORK-NEW JERSEY METROPOLITAN REGION
METROPOLITAN REGION AT A GLANCE IN 2004
Population
Non-farm Jobs
19.7
8.8 Million
Million
Retail Sales $248.2 Billion
Personal Income
Area 8,380 Square Miles
$861.3 Billion
Gross Domestic Product $1,064.1 Billion
Thirty percent of the adult population has at leasta Bachelor's Degree.
5
BOX 2: THE NEW YORK-NEW JERSEY 26- COUNTY
(All monetary figures are in 2004 dollars)

6
SECTION 1: OPERATING IMPACT OF THE AVIATION INDUSTRY
Operating activities at JFK, Newark, and LaGuardia airports consist of both on- and off-airport services rendered to passengers and shippers of air cargo. These services produce a sizeable direct economic contribution and an equally important ripple effect throughout the economy.
Direct Operating Impact
The movement of passengers and cargo by air takes place through direct services provided by firms and government agencies located on the airports and by a host of businesses located off the airports. Classic examples of establishments delivering direct on-airport services include: domestic and foreign-flag airlines catering to travelers and shippers; airport tenants performing services ranging from aircraft maintenance to retailing; and public agencies engaged in air traffic control, providing security and maintaining airport infrastructure.
Direct off-airport services consist of the arrangement, movement, distribution, and
documentation associated with air transportation. Businesses providing these essential services include air ticket agencies, on-line ticketing sites, freight forwarders, distributors of airfreight, truck transportation, banking and insurance. The marketing functions of airlines and the regional headquarters activities of public agencies also supply off-airport aviation services.
BOX 3: MAJOR PROVIDERS OF DIRECT AVIATION SERVICES
Airlines and Tenants Brokerage, Distribution and U.S. Flag Carriers Financial Services Foreign Flag Carriers Freight Forwarders Supplemental Carriers Custom House Brokers Aviation Services Export/Import Services Dining & Refreshments Services Banking Services Consumer & Professional Services Insurance Services Vending Services Airline Marketing Airline Ticketing Airline Ticket Agencies Landside Access On-line Ticketing Sites Taxi Services AirTrain JFK Public Agencies AirTrain Newark Federal Aviation Administration Limousine Services Immigration & Naturalization Service Hotel-Airport Courtesy Transport Port Authority of NY & NJ Truck Transport of Air Cargo Transportation Security Administration Off-Airport Parking U.S. Customs
U.S. Department of Agriculture U.S. Postal Service

7
The direct economic impact resulting from aviation operations in 2004 amounted to 137,880 jobs, $7.2 billion in wages and $23.1 billion in sales or economic activity. Air carriers, tenants, and brokerage and wholesale distribution accounted for 75 percent of the direct impact.
Table 1
DIRECT IMPACT OF THE AVIATION INDUSTRY
IMPACT CATEGORY JOBS WAGES SALES
ON AIRPORT
Airlines 42,510 2,409 10,101 Tenants & Government 39,330 1,831 5,801
Sub Total 81,840 $4,240 $15,902 OFF AIRPORT
Landside Access 11,220 463 1,377 Air Ticket Agencies 10,130 457 765 Truck Transportation 4,340 186 548 Banking & Insurance 1,680 127 569 Brokerage & Distribution 22,730 1,399 3,029 Airline Marketing & Government 5,940 359 960
Sub Total 56,040 $2,991 $7,248 Grand Total 137,880 $7,231 $23,150
All monetary values are in millions of 2004 dollars Queens and Essex counties top their respective states, New York and New Jersey, in
on-airport jobs. (See Fig. 4)
Direct Operating Impact by Airport The distribution of direct impact by airport depends on the volume of passengers and
cargo flowing through each airport. JFK airport handled the largest share of passengers as well as cargo (including revenue mail) with 40 percent and 63 percent, respectively. Newark airport followed, with 34 percent of the passengers and 36 percent of the cargo. LaGuardia airport handled the remaining 26 percent of passengers and slightly less than one percent of air cargo shipment.
FIG. 3: PASSENGER AND CARGO VOLUMES
LGA26%
EWR34%
JFK40%
DISTRIBUTION OF PASSENGERS
37.5 Mill
31.9 Mill
24.4 Mill
LGA1%
EWR36%
JFK63%
DISTRIBUTION OF CARGO (Short tons)
1.9 Mill1.1 Mill
(.029 Mill)

Monmouth
Mid
dles
ex
Hunterdon
Dutchess
Somerset
NY
Kings
HudsonQueens
Bronx
Richmond
Bergen
Essex
Nassau
Suffolk
Rockland
Westchester
Passaic
Warren
Mercer
Morris
Ocean
Sussex
Union
OrangePutnam
Employment RangesEmployment Ranges
8,000 to 17,0005,000 to 7,9992,000 to 3,9991,000 to 1,999
500 to 999200 to 49925 to 199
FIG. 4: MAP OF DIRECT ON-AIRPORT JOBS BY COUNTY
County distribution is based on a universe of 57,000 em ployees at EWR, JFK and LGA for whom zip code information was available. The 57,000 employees represent a subset of the 81,840 direct on-airport jobs reported in Table 1.
8
9
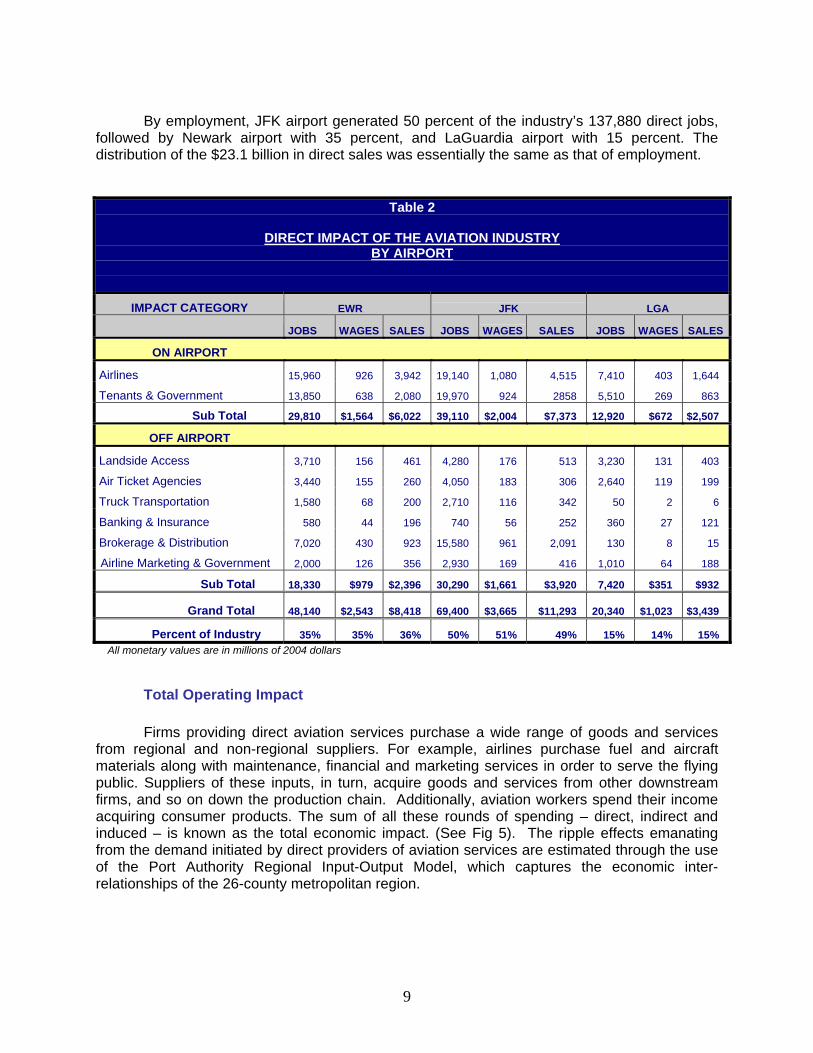
By employment, JFK airport generated 50 percent of the industry’s 137,880 direct jobs,
followed by Newark airport with 35 percent, and LaGuardia airport with 15 percent. The distribution of the $23.1 billion in direct sales was essentially the same as that of employment.
Table 2
DIRECT IMPACT OF THE AVIATION INDUSTRY BY AIRPORT
IMPACT CATEGORY EWR JFK LGA
JOBS WAGES SALES JOBS WAGES SALES JOBS WAGES SALES
ON AIRPORT
Airlines 15,960 926 3,942 19,140 1,080 4,515 7,410 403 1,644
Tenants & Government 13,850 638 2,080 19,970 924 2858 5,510 269 863
Sub Total 29,810 $1,564 $6,022 39,110 $2,004 $7,373 12,920 $672 $2,507
OFF AIRPORT
Landside Access 3,710 156 461 4,280 176 513 3,230 131 403
Air Ticket Agencies 3,440 155 260 4,050 183 306 2,640 119 199
Truck Transportation 1,580 68 200 2,710 116 342 50 2 6
Banking & Insurance 580 44 196 740 56 252 360 27 121
Brokerage & Distribution 7,020 430 923 15,580 961 2,091 130 8 15
Airline Marketing & Government 2,000 126 356 2,930 169 416 1,010 64 188
Sub Total 18,330 $979 $2,396 30,290 $1,661 $3,920 7,420 $351 $932
Grand Total
48,140 $2,543 $8,418
69,400 $3,665 $11,293
20,340 $1,023 $3,439
Percent of Industry 35% 35% 36% 50% 51% 49% 15% 14% 15% All monetary values are in millions of 2004 dollars
Total Operating Impact Firms providing direct aviation services purchase a wide range of goods and services
from regional and non-regional suppliers. For example, airlines purchase fuel and aircraft materials along with maintenance, financial and marketing services in order to serve the flying public. Suppliers of these inputs, in turn, acquire goods and services from other downstream firms, and so on down the production chain. Additionally, aviation workers spend their income acquiring consumer products. The sum of all these rounds of spending – direct, indirect and induced – is known as the total economic impact. (See Fig 5). The ripple effects emanating from the demand initiated by direct providers of aviation services are estimated through the use of the Port Authority Regional Input-Output Model, which captures the economic inter-relationships of the 26-county metropolitan region.

10
FIG. 5: DIRECT, INDIRECT AND INDUCED EFFECTS OF THE AVIATION INDUSTRY The economic activities of the aviation industry are related to other industries in the regional economy. Aviation activities that occur on-airport by airlines, tenants and government agencies, as well as off-airport activities undertaken by air ticket agencies, freight forwarders, insurance, and transportation
providers, generate indirect and induced economic effects in the regional economy. Ripple effects occur when companies engaged in aviation services purchase goods and services such as fuel, food, equipment and services from other regional firms. These purchases lead to further inter-industry activities, the impact of which is called the indirect impact. Additionally, induced impact occurs when workers employed in direct and indirect activities spend their wages on consumer goods produced in the region.
In 2004, the total economic contribution of the aviation industry amounted to 278,890
jobs, $13.1 billion in wages and $37.1 billion in sales. As in the case of the direct impact, air carriers, airport tenants, and brokerage and distribution were the major sectors, accounting for just over 75 percent of the total impact.
All monetary values are in millions of 2004 dollars
Table 3
TOTAL IMPACT OF THE AVIATION INDUSTRY
IMPACT CATEGORY JOBS WAGES SALES ON AIRPORT
Airlines 96,360 4,618 14,108 Tenants & Government 72,850 3,174 9,057
Sub Total 169,210 $7,792 $23,165 OFF AIRPORT
Landside Access 21,930 940 2,640 Air Ticket Agencies 18,280 821 1,721 Truck Transportation 8,860 392 1,114 Banking & Insurance 5,200 302 1,007 Brokerage & Distribution 42,330 2,196 5,661 Airline Marketing & Government 13,080 671 1,788
Sub Total 109,680 $5,322 $13,931 Grand Total 278,890 $13,114 $37,096
Spending byAviation workers and Suppliers
DIRECT
INDIRECT INDUCED
Effects of Aviation Spending on Suppliers
Direct Spending by the Aviation Industry

Air lines
Tenant s and
Gvovernment
Brokerage and
Dist r ibut ion
Landside
AccessAir Ticket
Agencies
Air line Market ing
and Government Agencies
Truck
Transport at ion Banking and
Insurance
05
10152025303540
PERCENT
FIG. 6: PERCENTAGE DISTRIBUTION OF TOTAL AVIATION EMPLOYMENT
Total Operating Impact by Airport In terms of employment, JFK airport generated 51 percent of the industry’s 278,890 total
jobs, followed by Newark airport with 33 percent and LaGuardia airport with 16 percent. The distribution of the $37.1 billion in total sales mirrored that of employment.
Table 4
TOTAL IMPACT OF THE AVIATION INDUSTRY BY AIRPORT
IMPACT CATEGORY EWR JFK LGA
JOBS WAGES SALES JOBS WAGES SALES JOBS WAGES SALES
ON AIRPORT
Airlines 32,190 1,580 4,777 45,250 2,158 6,758 18,920 880 2,573
Tenants & Government 25,710 1,100 3,188 36,660 1,610 4,545 10,480 464 1,324
Sub Total 57,900 $2,680 $7,965 81,910 $3,768 $11,303 29,400 $1,344 $3,897
OFF AIRPORT
Landside Access 7,190 311 871 8,270 354 984 6,470 275 785
Air Ticket Agencies 6,210 279 585 7,310 328 688 4,760 214 448
Truck Transportation 3,230 143 406 5,530 245 696 100 4 12
Banking & Insurance 1,790 104 347 2,300 134 446 1,110 64 214
Brokerage & Distribution 12,530 651 1,515 29,660 1,538 4,129 140 7 17
Airline Marketing & Government 4,660 242 664 6,000 303 773 2,420 126 351
Sub Total 35,610 $1,730 $4,388 59,070 $2,902 $7,716 15,000 $690 $1,827
Grand Total 93,510 $4,410 $12,353 140,980 $6,670 $19,019 44,400 $2,034 $5,724
Percent of Industry 33% 34% 33% 51% 51% 51% 16% 15% 16% All monetary values are in millions of 2004 dollars
11

Supporting Industries A vast set of industries supplied their goods and services to direct providers of aviation
services. Among the major supplying industries benefiting from aviation demand are: Business Services, Restaurants and Food Services, Retail Trade and Health Care Services.
FIG. 7: SUPPORTING INDUSTRIES
Business Services
Restaurants & Food Services
Retail Trade Health Care Services
Wholesale TradeManufacturingReal Estate
All Other
Supporting Industry Jobs Wages Supporting Industry Jobs Wages Business Services 47,280 $2,558 Wholesale Trade 6,900 $449Restaurants & Food Service 23,440 445 Manufacturing 6,340 319Retail Trade 22,650 693 Real Estate 5,930 287Health Care Services 14,790 679 All Other Industries 13,660 452
All monetary values are in millions of 2004 dollars.
Economic Impact of Air Cargo
Moving the cargo from the shipper to the consignee requires the services of airlines, warehousing firms, freight forwarders, Customhouse brokers, trucking companies, financial firms and public agencies. The rising demand for all types of cargo as the economy grows, the rapid growth in the small package expedited service and the Just-In-Time inventory practice together make air cargo an important part of the aviation impact.
In 2004, the region’s three major airports handled nearly three million (short) tons of air cargo, consisting of 2.8 million tons of freight and nearly 0.2 million tons of revenue mail. International cargo1 represented 56 percent of the volume, while domestic cargo accounted for the remaining 44 percent. JFK airport led the way with approximately 1.9 million tons, followed by Newark airport with nearly 1.1 million tons and LaGuardia airport with 29 thousand tons.
1 International air freight shipment through the New York Customs District totaled $140.5 billion in 2004.
12

22847
1,146
873
40
1,500
995
14
1,792
0
500
1000
1500
2000
2500
3000
1984 1994 2004
FIG. 8: AIR FREIGHT(In thousands of short tons)
EWR LGA JFK
81.8%
15.1%3.1%
62.2%
36.2%
1.7%
64%
35.5%
0.5%
Total1,510
Total2,413
Total2,802
Air cargo operations accounted for 40,280 direct jobs, or 29 percent of all direct jobs in the region’s aviation industry. Direct wage payments came to approximately $2.4 billion, or 33 percent of the regional industry’s direct wages. Direct sales were $6.6 billion, or 29 percent of the industry’s economic activity.
When indirect and induced effects are included, air cargo supported a total of 79,650
jobs, $4.1 billion in wages and $11.7 billion in sales. Brokerage and distribution, air carriers and tenants, and truck transportation services combined to account for more than 90 percent of the cargo impact.
Table 5
DIRECT AND TOTAL IMPACT OF AIR CARGO
DIRECT ECONOMIC IMPACT IMPACT CATEGORY JOBS WAGES SALES Airlines & Tenants 10,830 609 2,541 Brokerage & Distribution 22,710 1,399 3,029 Truck Transportation 4,330 186 548 Banking & Insurance 320 24 108 Airline Marketing & Government 2,090 136 381 Total 40,280 $2,354 $6,607
TOTAL ECONOMIC IMPACT JOBS WAGES SALES Airlines & Tenants 23,280 1,198 4,182 Brokerage & Distribution 42,330 2,196 5,661 Truck Transportation 8,860 393 1,115 Banking & Insurance 990 58 192 Airline Marketing & Government 4,190 221 576 Total 79,650 $4,066 $11,726
All monetary values are in millions of 2004 dollars
13

Air Cargo Impact by Airport By airport, JFK’s share of air cargo impact amounted to 63 percent of total sales.
Newark airport accounted for 36 percent of sales followed by LaGuardia airport with one percent.
Table 6
DIRECT AND TOTAL IMPACT OF AIR CARGO BY AIRPORT
CATEGORY EWR JFK LGA TOTAL
DIRECT
Jobs 15,030 24,720 530 40,280 Wages 867 1,451 36 $2,354 Sales 2,658 3,867 82 $6,607
TOTAL
Jobs 29,530 49,170 950 79,650 Wages 1,518 2,492 57 $4,067 Sales 4,195 7,404 127 $11,726
All monetary values are in millions of 2004 dollars Standardized Impact of Operations
Standardizing the economic impact provides an interesting alternative view of the
operating benefits of the industry to the regional economy. Every one million passengers using the airports supported 2,150 jobs and $260 million in sales. Every thousand short tons handled served to sustain 30 jobs and $4.2 million in sales.
All monetary figures are in 2004 dollars
BOX 4: STANDARDIZED IMPACT FOR
PASSENGER AND CARGO
Cargo: 30 jobs per 1,000 short tons $1.5 million in total wages per 1,000 short tons $4.2 million in total sales per 1,000 short tons
Passengers (connecting and non-connecting):
2,150 jobs per million passengers $85 million in total wages per million passengers $260 million in total sales per million passengers
14

15
SECTION 2: THE ECONOMIC IMPACT FROM INVESTMENT IN AIRPORT INFRASTRUCTURE
Investment in airport infrastructure, whether designed to maintain airport assets in a
state of good repair or to accommodate expected air passenger volume, has been a major source of economic benefit to the region. In order to provide customers with the very best air transportation service and face the capacity challenges arising from projected growth, the Port Authority along with its airport partners has undertaken a multi-year capital program at the airports.
Investment Background During the 2000-2004 period, the Port Authority and its aviation business partners
invested $7.4 billion, or an average of nearly $1.5 billion annually, on major redevelopment and other capital projects at the airports. Investment on facilities at JFK airport received 61.7 percent of all capital expenditures, Newark airport garnered 33.7 percent, and LaGuardia airport got 4.6 percent.
A partial list of major capital projects funded over the 2000-2004 period includes:
♦ AirTrain JFK ♦ The AirTrain Newark connection to the Northeast Corridor ♦ Enhanced roadway access to the airports ♦ Runway rehabilitation ♦ Structural parking ♦ Airside expansion ♦ Terminal improvements ♦ Security enhancements
Evidently, the major share of airport investment spending has gone to provide easier
landside access to the airports, improve passenger services and convenience, tighten security, and enhance capacity at the airports.
Table 7
INVESTMENT IN AIRPORT INFRASTRUCTURE: 2000 - 2004 (Annual Average in Millions of 2004 Dollar)
SOURCE EWR JFK LGA TOTAL
Port Authority 305 234 60 $599 Tenants 186 525 9 $720 PFC 8 155 0 $163
Total $499 $914 $69 $1,482

16
Direct and Total Impact from Investment Spending Filtering through the region’s construction industry, the $1.5 billion in annual capital
investment has contributed to regional economic growth. Airport investment generated 5,830 direct construction-related jobs and $335 million in direct wages annually.
Including feedback effects from suppliers to the construction industry and the spending
of workers, total construction-related employment amounted to 14,500 total jobs annually. Of the total jobs, 62 percent were associated with capital projects at JFK airport, 33 percent with investment at Newark airport and five percent with improvements at LaGuardia airport.
Table 8
DIRECT AND TOTAL REGIONAL ECONOMIC OF INVESTMENT IN AIRPORT INFRASTRUCTURE
DIRECT IMPACT
CATEGORY EWR JFK LGA TOTAL
Jobs 1,920 3,650 260 5,830
Wages 108 213 14 $335
Sales 499 914 69 $1,482
TOTAL IMPACT
CATEGORY EWR JFK LGA TOTAL
Jobs 4,850 8,970 680 14,500
Wages 240 451 33 $724
Sales 803 1,435 114 $2,352 All monetary values are in millions of 2004 dollars
Standardized Impact of Investment
When standardized, each $100 million in capital spending generated nearly 1,000 total construction-related jobs and $159 million in total sales.
BOX 5: STANDARIZED IMPACT FOR INVESTMENT
PER $100 MILLION IN CAPITAL SPENDING
980 Total Jobs $49 Million in Total Wages $159 Million in Total Sales
All monetary figures are in 2004 dollars

17
SECTION 3: THE ECONOMIC IMPACT OF AIR VISITORS TO THE REGION
The New York-New Jersey metropolitan region serves as a magnet for patrons of cultural activities and as a global center for parties wishing to conduct business. The region’s cultural assets of world-class theaters, museums, restaurants, and historical sites play a major role in attracting millions of domestic and overseas leisure visitors. As the financial capital of the world, the region’s strength in business services makes it a popular destination for visitors seeking to carry out far-reaching and complex business transactions.
Profile of Air Visitors In 2004, an estimated 16.9 million visitors came to the region by air, with domestic
visitors accounting for over 67 percent and international visitors for the remaining 33 percent. JFK airport served as the arrival gateway for 41 percent of the visitors, Newark airport for 30 percent and LaGuardia airport for 29 percent.
Air visitors to the region inject billions of dollars into the local economy on goods and
services purchased during their stay. Directly, visitors spend on shopping, lodging, meals, entertainment and local transportation. The level of direct spending depends not only on the origin and volume of visitors, but also on the average length of stay and the purpose for visiting the region. On the average, international visitors spent an estimated $823 per visit, or 11 percent higher than the $741 spent by domestic visitors. Business travelers, whether domestic or international, spent more per visit than leisure visitors, $921 versus $680.
Table 9
PROFILE OF AIR VISITORS TO THE REGION
CATEGORY VOLUME* SPENDING (In Millions) PER VISIT
Domestic Business 4.5 $829
Domestic Leisure 6.9 $684
International Business 1.6 $1,173 International Leisure 3.9 $674
Total Volume 16.9 --
Average Spending (per Visit) -- $767 All monetary values are in millions of 2004 dollars *Volumes are estimated. Domestic volumes are estimated from data provided by D.K. Shifflet & Associates, Ltd. Direct and Total Impact of Air Visitors In 2004, direct spending by air visitors amounted to $11.3 billion, supporting 134,380
direct jobs and providing $3.6 billion in wages. It is interesting to note that the above direct employment from air visitors rivals the estimated 137,880 operating jobs (see page 7).
Direct spending by air visitors sets in motion ripple effects throughout the regional
economy, producing a total contribution much greater than the initial injection. Total economic

18
activity spurred by air visitors to the region supported 192,280 total jobs, with total wages of $6.6 billion and total sales of $17.6 billion.
Table 10
DIRECT AND TOTAL ECONOMIC IMPACT OF AIR VISITORS TO THE NY-NJ REGION
DIRECT IMPACT
CATEGORY EWR JFK LGA TOTAL Jobs 41,220 55,220 37,940 134,380 Wages 1,122 1,494 1,029 $3,645 Sales 3,454 4,628 3,191 $11,273
TOTAL IMPACT CATEGORY EWR JFK LGA TOTAL Jobs 59,010 78,530 54,740 192,280 Wages 2,032 2,691 1,892 $6,615 Sales 5,391 7,157 5,019 $17,567
1. All monetary values are in millions of 2004 dollars 2. Economic impact values are adjusted for visitor spending on landside access to/from
the airports and on their purchases at the airports.
In terms of visitor origin, expenditures by domestic visitors went to maintain 127,400 jobs and $11.7 billion in sales, or 66 percent of the tourism impact. International visitors accounted for the remaining 34 percent –- 64,880 jobs and $5.9 billion in sales.
FIG. 9: IMPACT BY VISITOR ORIGIN
46,190 8,550
44,500 34,030
36,710 22,300
0 20,000 40,000 60,000 80,000
EWR
JFK
LGA
JOBS ( 192,280 )
$1,602 $290
$1,541 $1,150
$1,275 $757
0 1,000 2,000 3,000
EWR
JFK
LGA
WAGES ( $6,615 Million)
$4,240 $779
$4,070 $3,087
$3,364 $2,027
0 2,000 4,000 6,000 8,000
EWR
JFK
LGA
SALES ( $17,567 Million)
All monetary figures are in 2004 dollars
International Domestic
19
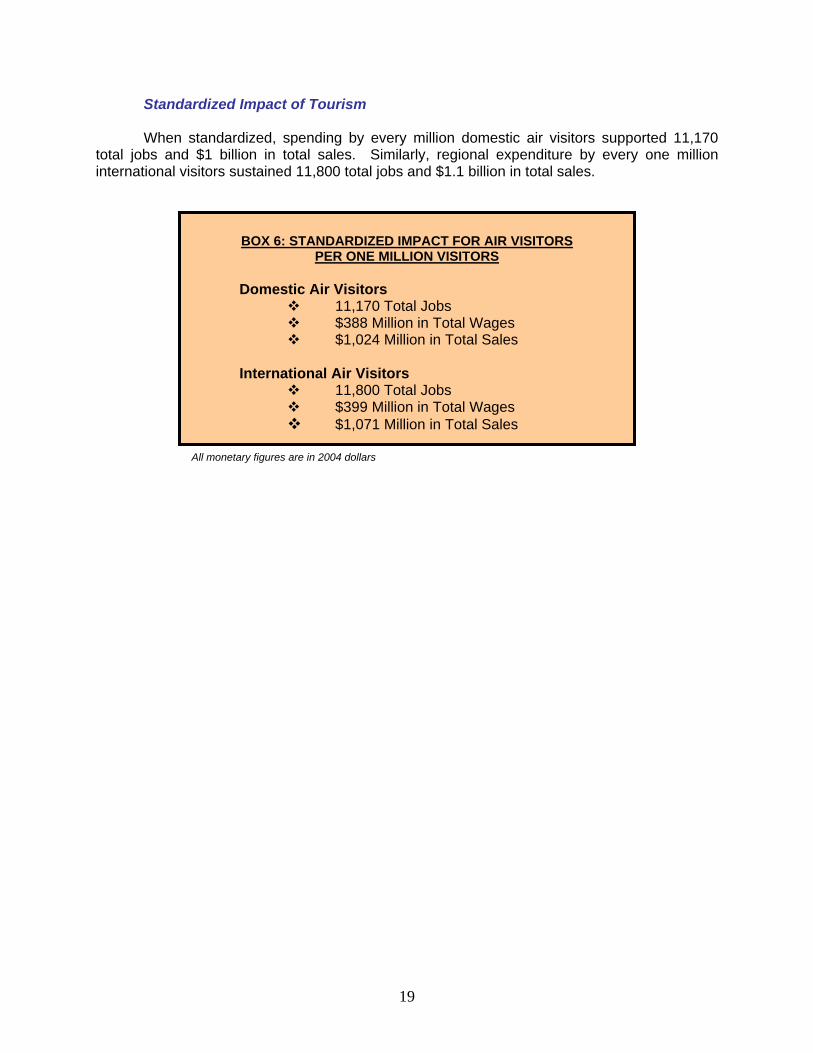
Standardized Impact of Tourism
When standardized, spending by every million domestic air visitors supported 11,170 total jobs and $1 billion in total sales. Similarly, regional expenditure by every one million international visitors sustained 11,800 total jobs and $1.1 billion in total sales.
BOX 6: STANDARDIZED IMPACT FOR AIR VISITORS
PER ONE MILLION VISITORS
Domestic Air Visitors 11,170 Total Jobs $388 Million in Total Wages $1,024 Million in Total Sales
International Air Visitors
11,800 Total Jobs $399 Million in Total Wages $1,071 Million in Total Sales
All monetary figures are in 2004 dollars

20
SECTION 4: QUALITATIVE BENEFITS AND TRENDS IN THE AVIATION INDUSTRY
The region gains from having a vibrant aviation industry in ways other than the
operating, investment and tourism impact quantified in this report. Current aviation activities help to further globalization and enhance regional communities while reducing the negative effects of noise pollution inherent in aircraft movement. The vitality of the industry in the near future depends on the degree to which the industry is able to adopt new technologies, streamline its operations and implement security measures at the same time that it is improving customer service through timeliness and competitive prices. Globalization. Being connected to the rest of the world has become increasingly important for business vitality, especially in an age in which global information quickly determines investment, production and consumption decisions. Regions, and consequently local businesses, that are readily accessible from anywhere on the globe stand to benefit from the international movement of resources. In this vein, the establishment of non-stop flights between Hong Kong and New York has, in essence, made the world a much smaller place, and as Asian economies expand, being the East Coast travel and business hub will continue to be an increasingly beneficial asset to the region. Community Benefits. The aviation industry is doing more to ensure that the benefits of the airports extend into all areas of the community. Currently, the Aviation High School at JFK allows students to graduate with two FAA licenses. The Air Services Development Office provides community businesses the opportunity to compete with major firms for contracts and has been a springboard for many area entrepreneurs. The Council for Airport Opportunity assists local individuals in obtaining more desirable jobs. These programs are in conjunction with annual benefits and charity events, which help to ensure that as many people as possible are benefiting from the airports. In the long term they help to promote more economically stable and prosperous communities. Environmental Benefits. The aviation industry has made leaps and bounds in its effort to reduce noise pollution, the major environmental drawback of air transportation. The number of people affected by noise pollution has been reduced substantially –- a 92 percent reduction during the 1992-2003 period. An Aircraft Noise Abatement Monitoring System (ANAMS) is being used to monitor aircraft and ensure that mandated noise restrictions are maintained. In addition, many new carriers such as JetBlue are using newer planes that improve on the noise levels of earlier models. With commencement of AirTrain service to JFK and Newark airports, the Port Authority is doing its share to decrease roadway congestion and harmful emissions. The agency also has supported carriers in switching from diesel to electric ground transportation vehicles.
Trends Affecting the Future Regional Impact of the Aviation Industry
The aviation industry is at a very critical juncture. Few industries have been as adversely affected by recent events, including the terrorist attacks of 9/11 and the spike in oil prices, as this industry. Adding to the mix is the intense competition between profitable, low cost carriers and financially challenged legacy carriers. Against this backdrop, the next few years will be critical in determining the long-term health of the industry. Technology and security concerns are among the important factors that will affect how the industry impacts the region.

21
Design and Technology. Until recently the hub-and-spoke model was the norm for most carriers, but the continued success of discount carriers has challenged this model. The decreased overhead and more efficient use of capital that comes from point-to-point service is proving to be difficult for many legacy carriers to compete with. This is coupled with the increased use of the Internet to book travel, by first allowing passengers to search for low fares and to easily choose direct flights over transfers. In addition, new technologies have had some impact on short haul trips. For example, for several companies, E-conferencing is the preferred alternative to traveling when the purpose is to see other employees in the company.
With cheaper prices resulting in lower yields, carriers will have to streamline their operations in order to maintain a competitive cost structure. Major restructuring, including code sharing and alliances, already is taking place in the industry. Also, the air traffic sector is likely to see some revamping, as it is currently one of the limiting factors in timeliness. New integrated systems will increase precision through new mapping software and trajectory-based flight plans. Overall, large information technology investments, consolidation and re-structuring are all major issues that must be addressed by carriers that want to stay afloat, as well as by airports that wish to remain competitive. Security. In the aftermath of the 9/11 terrorist attacks, security has become a major issue in the field of aviation. In response to terrorism, the Transportation Security Administration (TSA) is handling some of the responsibilities that were formerly under the FAA and the airlines; also, the newly formed Department of Homeland Security has jurisdiction over aviation protocol. In addition to making our airports more secure this new trend brings with it large IT expenditures and job creation. Equipment constantly must be updated and employees well-trained, leading to possibly major investment in the region. Of course, the provision of increased security imposes higher costs to consumers, airlines and airport operators. A central challenge facing the industry is the need to continue increasing security without adversely affecting the competitiveness of regional businesses, especially with regard to timeliness and price.

22
SUMMARY In enabling the movement of passengers and goods by air, the aviation industry bestows
significant economic benefits to the New York-New Jersey metropolitan region. Each year, millions of air passengers and shippers utilize the services provided by the region’s major commercial airport system: JFK, LaGuardia and Newark airports. Economic activities from day-to-day operation of the facilities, investment in airport infrastructure and tourism inject a major stream of direct spending into the area’s economy.
In 2004, aviation-related activities added nearly $36 billion directly into the bistate’s
economy through the purchases of goods and services from a multiplicity of local suppliers, including business services, restaurants, retail trade, hotels and manufacturers.
As this direct spending rippled throughout the regional economy, the overall impact
amounted to an impressive 485,670 total jobs, $20.5 billion in total wages, and $57 billion in total sales. Daily operations at the airports accounted for the major share of the overall performance of the industry, with 57 percent of the employment and 65 percent of sales. Spending by the 16.9 million domestic and international visitors who came to the region by air generated 40 percent of the jobs and 31 percent of sales. Though last in economic impact with three percent of the jobs and four percent of sales, the spending on maintenance and enhancements keeps the region’s vital airport infrastructure competitive and provides the capacity to meet the growing needs of regional and non-regional users.
In addition to operating, investment and tourism impact, the industry generates other
benefits not quantified in this report. For example, aviation services promote globalization by internationalizing investment, production and consumption. Also, the AirTrain rail systems have provided passengers and airport employees with a mass transit and environmentally friendly access mode to JFK and Newark airports.
The industry faces the twin pressures of complying with federal regulations to increase
security and keeping fares competitive as an increasing number of fliers use the Internet to purchase tickets. But as the world economy expands and globalization spreads, the industry should continue to be a pillar of regional economic growth as air travel moves along its long-run growth path.

23
Table 11
SUMMARY OF REGIONAL ECONOMIC IMPACT OF THE AVIATION INDUSTRY
DIRECT IMPACT CATEGORY EWR JFK LGA TOTAL
Jobs Operations 48,140 69,400 20,340 137,880 Investment 1,920 3,650 260 5,830 Tourism 41,220 55,220 37,940 134,380
Total 91,280 128,270 58,540 278,090
Wages Operations 2,543 3,665 1,023 $7,231 Investment 108 213 14 $335 Tourism 1,122 1,494 1,029 $3,645
Total 3,773 5,372 2,066 $11,211
Sales Operations 8,418 11,293 3,439 $23,150 Investment 499 914 69 $1,482 Tourism 3,454 4,628 3,191 $11,273
Total 12,371 16,835 6,699 $35,905 TOTAL IMPACT
CATEGORY EWR JFK LGA TOTAL
Jobs Operations 93,510 140,980 44,400 278,890 Investment 4,850 8,970 680 14,500 Tourism 59,010 78,530 54,740 192,280
Total 157,370 228,480 99,820 485,670
Wages Operations 4,410 6,670 2,034 $13,114 Investment 240 451 33 $724 Tourism 2,032 2,691 1,892 $6,615
Total 6,682 9,812 3,959 $20,453
Sales Operations 12,353 19,019 5,724 $37,096 Investment 803 1435 114 $2,352 Tourism 5,391 7,157 5,019 $17,567
Total 18,547 27,611 10,857 $57,015 All monetary values are in millions of 2004 dollars

24
APPENDIX A Countries of Destination served by direct flights from
EWR, JFK and LGA
Country Country Antigua and Barbuda Israel Argentina Italy Aruba Jamaica Austria Japan Bahamas Jordan Barbados Korea, Republic of Belgium Kuwait Belize Latvia Bermuda Mexico Brazil Morocco Canada Netherlands Cayman Islands Netherlands Antilles China Norway Colombia Panama Costa Rica Peru Czech Republic Poland Denmark Puerto Rico Dominican Republic Russian Federation Ecuador Saint Kitts and Nevis Egypt Saudi Arabia El Salvador Senegal Finland Serbia France Sierra Leone Germany Singapore Ghana South Africa Greece Spain Grenada Switzerland Guatemala Taiwan, Province of China Haiti Trinidad and Tobago Honduras Turkey Hong Kong Ukraine Hungary United Arab Emirates Iceland United Kingdom India United States Ireland Venezuela

25
APPENDIX B GLOSSSARY OF TERMS
Sales or Economic Activity – The value of output generated in the region economy. Employment – Employment refers to work-years of labor measured in terms of full-time equivalent jobs. Direct Impact – The impact generated on-airport at airport facilities and off-airport at various locations in the region. Indirect Impact – The impact resulting from increased activities of those industries that supply services, materials, and machinery needed to support direct aviation providers. Induced Impact – The impact resulting from increases in consumer spending by wage earners in the aviation and supporting industries. 2004 Dollars – All dollar figures used in this report are expressed in 2004 dollars unless otherwise indicated. Published price indices are used to adjust figures given for other base years. Supporting Industries – All industries that supply materials and services to the aviation industry. Wages – Payroll salaries and wages earned by employees in payment for their services. All benefits are excluded from this figure.

26
APPENDIX C THE PORT AUTHORITY INPUT- OUTPUT MODEL
Input-output models, in general, and the Port Authority’s Regional Model, in particular,
focus on the interrelationships or flows of products between industries. The Port Authority’s Regional Input-Output Model was first developed in 1978 and is continually updated to reflect changes in the regional economy as well as to integrate the results of regional studies, surveys and current regional data.
The mathematics of this technique is designed to capture the “ripple effects” of changes in an economy, in this case the economy of the 26-county New York-New Jersey region. These ripple effects can be illustrated as follows. If industry “A” increases its production by $100 million, it purchases additional quantities of good and services from other industries. To meet “A’s” needs, each of “A’s” supplying industries increases its production, which, in turn, requires additional quantities of their respective inputs. The producers of these inputs increase their output and so on, resulting in a domino effect throughout the economy.
The Port Authority’s Regional Input-Output Model calculates total regional sales, person
years of employment, and payroll wages resulting from the spending of industries or projects initiated in the region.
At the core of the Port Authority’s Regional Input-Output Model is a matrix of inter-
industry flows developed from the latest national input-output data assembled by the Bureau of Economic analysis of the United States Department of Commerce. This matrix represents the transactions of 490 industrial, governmental and consumer sectors of the national economy by capturing how each sector in the economy uses the output of other sectors in producing its own product and to what sectors its product is eventually sold.
In order to develop the national matrix of inter-industry flows into the Port Authority’s
Regional Input-Output Model, coefficients are developed which reflect the purchasing patterns of the 26-county regional economy by indicating what share of a product consumed in the region is actually produced in within the region. These Regional Purchase Coefficients, developed by the Port Authority, are based on data from the New York and New Jersey State Bureaus of Labor Statistics, Regional Commodity Flow Surveys, Commerce Department export statistics and other information.

27
Study Conducted for the Aviation Department by the Office of Policy and Planning
Board of Commissioners Anthony R. Coscia, Chairman Charles A. Gargano, Vice Chairman Bruce A. Blakeman Michael J. Chasanoff Christine A. Ferer Angelo J. Genova David S. Mack Raymond M. Pocino Anthony J. Sartor Henry R. Silverman Jack G. Sinagra David S. Steiner Kenneth J. Ringler Jr., Executive Director James P. Fox, Deputy Executive Director William R. DeCota, Director of Aviation JoJo Quayson, Manager, Industry Analysis and Forecasting, Aviation Department Scott Frisby, Senior Economic Analyst, Aviation Department Robert F. Lurie, Chief of Strategic Planning Cruz C. Russell, Deputy Chief of Strategic Planning Gene Spruck, Chief Economist, Office of Policy and Planning J. Anthony Morris, Project Manager, Office of Policy and Planning Graciela Ramirez, Management Intern, Office of Policy and Planning Hairu Zhang, Management Intern, Office of Policy and Planning