Embed Size (px)
Citation preview
The Economic Impact of Genetically Modified Organisms in Small Developing Countries
Guy G. Hareaua, Bradford F. Millsb, George W. Nortonc, Darrell Boschc
Paper prepared for presentation at the Annual Meeting of the American Agricultural Economics
Association
Long Beach, CA, July 28-31, 2002
Series: Selected Paper
Date: May 2002
208 Hutcheson Hall, Virginia Tech, Blacksburg, Virginia 24061
Phone (540) 231-6301, Fax (540) 231-7417
email: [email protected]
Copyright 2002 by Guy G. Hareau, Bradford F. Mills, George W. Norton and Darrell Bosch. All
rights reserved. Readers may make verbatim copies of this document for non-commercial
purposes by any means, provided that this copyright notice appears on all such copies.
a Researcher, Instituto Nacional de Investigación Agropecuaria (INIA, Uruguay) and Graduate Student, Department of Agricultural and Applied Economics, College of Agriculture and Life Sciences, Virginia Polytechnic Institute and State University. b Associate Professor at the Department of Agricultural and Applied Economics, College of Agriculture and Life Sciences, Virginia Polytechnic Institute and State University. c Professors at the Department of Agricultural and Applied Economics, College of Agriculture and Life Sciences, Virginia Polytechnic Institute and State University. The authors wish to acknowledge to Gonzalo Zorrilla, Head of the Rice Research Program at the National Agriculture Research Institute (INIA) of Uruguay, his collaboration in providing key expert opinion for this study.
ABSTRACT
The expected benefits from herbicide resistant transgenic rice in Uruguay are estimated
with stochastic simulation techniques. Economic surplus methods that account for private profits
are used to measure the magnitude and distribution of the benefits between producers and a
multinational firm. Further, the adoption rate of transgenic rice is endogenous in the model and
depends on the expected profitability of the technology. The results show that the potential
benefits from the technology are relatively small because of the small production base.
Multinational firms are, therefore, unlikely to develop locally adapted transgenic rice varieties
without strategic partnerships with local institutions.
Keywords: economic impact, economic surplus, genetically modified organisms, stochastic
simulation, developing countries
2

Introduction
The biotechnology science developed during the past decade has given rise to new
agricultural technologies based on the manipulation of individual genes. The new products are
usually known as Genetically Modified Organisms (GMOs) or transgenic organisms. High
invention costs and the need for a high degree of specialization have concentrated their
development within large multinational biotechnology companies, which are entitled to
intellectual property rights (IPR) over the innovation to recover the research investments. While
this conferred monopoly power acts as an incentive for the creation of the new technologies, it
also affects the distribution of the benefits derived from adoption of GMOs.
Weak enforcement of IPR has until now resulted in the concentration of the adoption of
GMOs in developed countries. Moreover, high fixed costs in developing biotechnology research
capacity make it economically difficult for agricultural research systems in small developing
countries, such as Uruguay, to develop locally adapted GMOs on their own. Relying on GMOs
developed by multinational corporations, on the other hand, raises concerns that multinational
monopolists may price GMOs to leave few benefits for country producers. In small developing
countries, appropriate national strategies are needed to maximize the domestic benefits of
GMOs, while leaving sufficient incentives for multinationals to partner in technology generation.
This paper presents an ex-ante evaluation of the size and distribution of the economic
benefits from introducing a herbicide resistant genetically modified rice variety in Uruguay.
Improved estimates of the potential benefits of GMOs will help inform agricultural research
organizations in small countries like Uruguay to develop feasible policies to retain a greater
share of the benefits from GMOs. A partial equilibrium framework is developed that accounts
for the market power in transgenic seed of a multinational GMO owner. Economic surplus
3
methods are used to measure the total benefits and their distribution between producers and the
multinational firm. The benefits from transgenic varieties are estimated with stochastic
simulation techniques that account for uncertainty in some key model parameters. Unlike most
previous studies of technology impact, the adoption levels of GMOs are also directly linked to
the per-unit cost reduction associated with the technology. The results indicate the total expected
benefits from the introduction of the new variety are 10.4 million dollars. Benefits to Uruguay
amount to 8.1 million dollars and the GMO owner receives 2.3 million dollars. By contrast, total
benefits produced when a perfectly competitive market for the transgenic seed is simulated
amount to 20.8 million dollars, all accruing to the country’s rice producers.
Three important implications are drawn from the simulations. First, the total benefits
generated by GMOs decrease with the seed markup charged by the monopolist. As the
monopolist increases the level of the seed premium, producer profits are reduced and adoption
rates decline. Producer benefits within the country are, therefore, reduced. Correspondingly, the
profit maximizing seed mark-up for the multinational firm results in a lower than optimal level
of technology adoption in the country. Second, a small market for varieties can significantly
restrict attempts by the country to use license fees to recover, and redistribute back to producers
and consumers, some of the profits captured by multinationals. Model estimates indicate that in a
small country like Uruguay, the profits available to the multinational gene owner are small,
leaving little room for redistribution of these profits before the multinational will choose not to
sell the gene in the country. Third, given the limits on potential tax and tariff policies imposed on
the country by small production base, agricultural research systems in small countries need to
examine alternative cost and benefit sharing arrangements with multinational gene owners.
Potential arrangements include shared licensing of genes introduced into locally adapted
4
germplasm and regional licenses that spread multinational’s fixed costs over a larger market
area.
The Economic Surplus Model with Market Imperfection
Procedures and methods for analyzing the economic impact of agricultural technologies
are well-established (see for example, Alston, Norton and Pardey, 1995). While different authors
have followed different approaches, the measurement of the change in economic surplus
generated after the adoption of the new technology is cited as one of the most accepted and often
used methods. The method, however, is dependent on some strong assumptions with respect to
the form of the supply functions and the nature of income effects and other parameters. On the
other hand, most of the data required is generally available or can be easily generated.
Moschini and Lapan (1997) argue that the presence of Intellectual Property Rights (IPR)
in agricultural innovations modifies the theoretical framework and assumptions of the
conventional economic surplus approach. The reasoning is based on the fact that IPR confer
limited monopoly power to firms producing the innovation. Since these innovations are in
general embedded in the inputs, the common assumption of perfect competition in seed input
market does not hold in this case. Rather, the firm producing the innovation sets its price to
maximize private profit based on monopoly power. This monopoly profit needs to be accounted
for when evaluating the welfare change after an agricultural innovation protected by IPR is
adopted.
Since the economic surplus approach is usually focused on the commodity market, while
the monopolist’s profit is generated in the input market, the adjusted model proposed by
Moschini and Lapan evaluates the total welfare change as the sum of the change in the
5
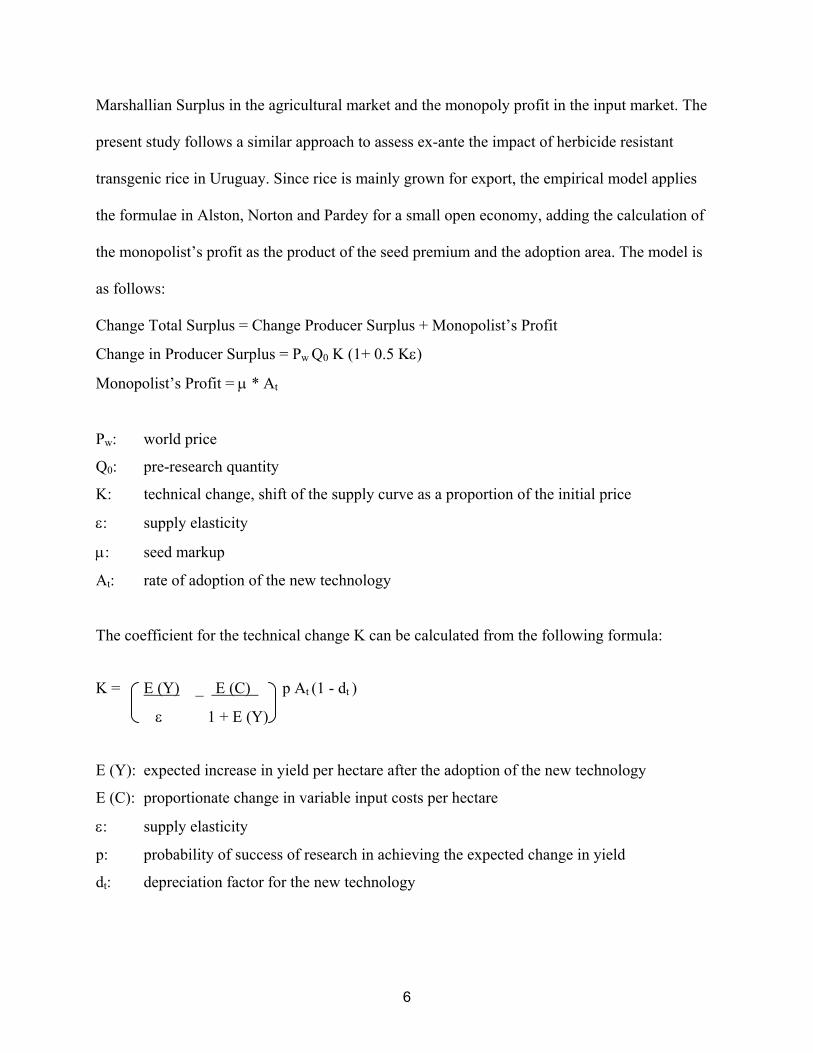
Marshallian Surplus in the agricultural market and the monopoly profit in the input market. The
present study follows a similar approach to assess ex-ante the impact of herbicide resistant
transgenic rice in Uruguay. Since rice is mainly grown for export, the empirical model applies
the formulae in Alston, Norton and Pardey for a small open economy, adding the calculation of
the monopolist’s profit as the product of the seed premium and the adoption area. The model is
as follows:
Change Total Surplus = Change Producer Surplus + Monopolist’s Profit
Change in Producer Surplus = Pw Q0 K (1+ 0.5 Kε)
Monopolist’s Profit = µ * At
Pw: world price
Q0: pre-research quantity
K: technical change, shift of the supply curve as a proportion of the initial price
ε: supply elasticity
µ: seed markup
At: rate of adoption of the new technology
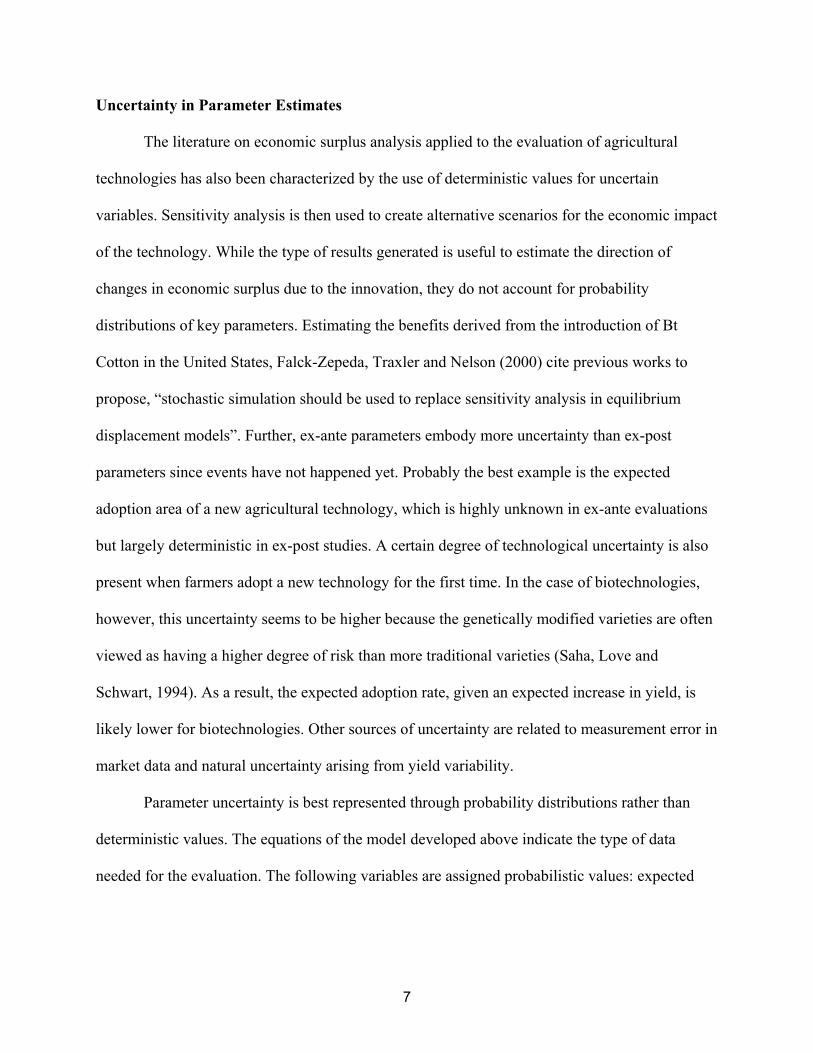
The coefficient for the technical change K can be calculated from the following formula:
K = E (Y) _ E (C) p At (1 - dt )
ε 1 + E (Y)
E (Y): expected increase in yield per hectare after the adoption of the new technology
E (C): proportionate change in variable input costs per hectare
ε: supply elasticity
p: probability of success of research in achieving the expected change in yield
dt: depreciation factor for the new technology
6
Uncertainty in Parameter Estimates
The literature on economic surplus analysis applied to the evaluation of agricultural
technologies has also been characterized by the use of deterministic values for uncertain
variables. Sensitivity analysis is then used to create alternative scenarios for the economic impact
of the technology. While the type of results generated is useful to estimate the direction of
changes in economic surplus due to the innovation, they do not account for probability
distributions of key parameters. Estimating the benefits derived from the introduction of Bt
Cotton in the United States, Falck-Zepeda, Traxler and Nelson (2000) cite previous works to
propose, “stochastic simulation should be used to replace sensitivity analysis in equilibrium
displacement models”. Further, ex-ante parameters embody more uncertainty than ex-post
parameters since events have not happened yet. Probably the best example is the expected
adoption area of a new agricultural technology, which is highly unknown in ex-ante evaluations
but largely deterministic in ex-post studies. A certain degree of technological uncertainty is also
present when farmers adopt a new technology for the first time. In the case of biotechnologies,
however, this uncertainty seems to be higher because the genetically modified varieties are often
viewed as having a higher degree of risk than more traditional varieties (Saha, Love and
Schwart, 1994). As a result, the expected adoption rate, given an expected increase in yield, is
likely lower for biotechnologies. Other sources of uncertainty are related to measurement error in
market data and natural uncertainty arising from yield variability.
Parameter uncertainty is best represented through probability distributions rather than
deterministic values. The equations of the model developed above indicate the type of data
needed for the evaluation. The following variables are assigned probabilistic values: expected
7

increase in yield per hectare, change in herbicide costs per hectare, level of seed premium, output
price, maximum adoption rate, and price elasticity of supply.
Another important issue is how to model the uncertainty over the 15-year period of the
analysis. Two variables are assumed to be random events every year: price and expected increase
in yield. Thus, they are modeled as having probabilistic distributions over the period and in each
year they can take different values. Other variables, however, are assumed fixed once the first
year event has occurred. It is rational to assume that per-unit cost reductions associated with the
technology are fixed on average and, thus, farmers would expect to achieve the same cost
reduction each year. The seed markup is also assumed fixed after the first contract has been
established1. The value for the long-run elasticity of supply is determined on the first year and
also remains constant over the rest of the period. The maximum expected adoption rate is
determined by the first year’s per-unit cost reduction value, and then calculated for the rest of the
period based on a fixed adoption pattern.
Data
This section details the data used for the simulation and the probability distributions assumed
for the specified random variables.
Expected Increase in Yield per Hectare
Crop yield is typically uncertain at the beginning of each cropping season. For new
varieties, information about field trials performance can be used as a proxy for expected farm
yields. However, there are no field trials of transgenic rice varieties in Uruguay. The
expectations about the potential benefits of herbicide resistant transgenic rice come from reduced
1 The seed markup only applies for the first ten years, the legal period for patent protection in Uruguay. After year 10, its value is zero.
8
herbicide costs rather than yield increases (Zorrilla, 2001). Nevertheless, Oard et al. (1996)
suggest that a better weed control can potentially increase yield, all else equal. Hence, the
expected increase in yield is assigned a triangular probability distribution with 0, 2.5 and 5 per
cent as minimum, most likely and maximum possible values respectively.
Change in herbicide costs per hectare
The study simulates a reduction in variable herbicide costs due to the substitution of a
GMO for the actual technology used to control the most relevant rice weed (Echinochloa sp.).
The new alternative transgenic variety is assumed to be effective with a single application of the
herbicide to which the variety is resistant, instead of the multiple applications needed in the
traditional technology. This approach is similar to the Round-up Ready technologies already on
the market. Budget figures for rice in Uruguay show that the total cost of herbicides is 90 dollars
per hectare, out of a total average cost for a five-year period of 1,100 dollars per hectare
(Lavecchia, 2000; Asociación de Cultivadores de Arroz, 2001). Using Round-up Ready
technologies as a benchmark suggests that herbicide costs under the new technology may be set
at 15 dollars per hectare, implying a net reduction of 75 dollars per hectare. The maximum
herbicide costs under the new technology can be arbitrarily set at 60 dollars per hectare,
assuming that higher values are beyond the threshold that would make farmers indifferent
between the new and old varieties. The change in herbicide costs per hectare is therefore
assigned a triangular distribution with 30, 75 and 90 dollars per hectare as minimum, most likely
and maximum possible values.
Seed premium
The seed premium and the change in herbicide costs per hectare jointly determine the
proportional change in variable input costs per hectare. The seed premium is the price that the
9

owner of the gene charges above the competitive price of the seed in order to recover its research
investments. The magnitude of the seed premium is associated with the degree of monopoly
power in the seed market. It must be specifically accounted, since it affects the per-unit cost
reduction that can ultimately be achieved with the new technology. Comparison with transgenic
technologies available in the U.S for cotton and soybeans suggests that the seed premium,
although extremely crop-specific, varies on average between 15 and 60 dollars per hectare
(Hubbell, Marra and Carlson, 2000; Carpenter and Gianessi, 1999; Couvillion, Kari, Hudson and
Allen, 2000). In a developing country, however, the monopolist may have lower profit margins
or more elastic input demand. Therefore, the seed premium is assigned a triangular distribution
with 10, 25 and 50 dollars per hectare as minimum, most likely and maximum possible values
respectively. Since the seed premium that the monopolist is able to extract depends on the size of
the expected reduction in herbicide costs per hectare, a positive correlation of 0.8 between both
variables is also included in the model.
Adoption rate
Adoption rates are highly uncertain in ex-ante analyses and have a large influence on the
magnitude of the change in total surplus. The difficulty in assigning an ex-ante value arises
because many factors affect both the path of adoption of a technology over time and the
maximum adoption rate achieved. Based on historic information for adoption of rice varieties in
Uruguay, the adoption path over the 15-year period of the analysis is calculated assuming a
logistic initial phase of increase, a constant maximum between years 5 and 10, and a linear
decline after year 10 with zero per cent adoption in year 16 (Zorrilla, 2001).
Unlike previous studies, the analysis assumes that the maximum adoption rate is
endogenous to the model and depends on the profitability of the technology, which is represented
10
by the estimated per-unit cost reduction. The latter is also a random variable depending, among
others, on the expected increase in yield per hectare, the elasticity of supply, the change in
herbicide costs per hectare and the seed markup.
The maximum adoption rate is assigned a triangular distribution whose values are
conditional on the per-unit cost reduction that the model previously calculates. Initial calibrations
with the available data show that the maximum per-unit cost reduction of the model is below 15
per cent2. The interval between 0 and 15 per cent was then arbitrarily divided into six equal
ranges of 2.5 points. Following the Stanford Research Institute Risk Assessment Protocol for
expert elicitation described in Morgan and Henrion (1990), the minimum, most likely and
maximum possible values for the maximum adoption rate under each range of per-unit cost
reduction was elicited from the head of the Rice Research Program of the National Agriculture
Research Institute (INIA) of Uruguay. The elicited values are shown in table 1. Then, applying
conditional functions embedded in the spreadsheet software used to run the model, the
simulation selects the corresponding distribution of maximum adoption rates according to the
per-unit cost reduction achieved, and this value is used to calculate the 15-year time path of
adoption.
2 The maximum per-unit cost reduction was initially calculated for calibration purposes applying the values of the variables that give the maximum expected per-unit cost reduction that can be achieved.
11

Table 1. Range of per-unit cost reductions and maximum expected adoption rates for
each range (Source: elicited from Zorrilla, 2001).
Expected Maximum Adoption Rate (% -Triangular Distribution Values) Range for Per-
Unit Cost Reduction (%) Lowest Most Likely Highest
0 – 2.5 0 2 5
2.5 - 5 0 3 5
5 – 7.5 3 7 20
7.5 - 10 5 15 30
10 – 12.5 20 40 60
12.5 - 15 30 60 70
Price
Based on time-series data for prices received by Uruguayan rice farmers during the
period 1981 – 1999, the price is assigned a normal distribution with mean 182.3 dollars per ton
and standard deviation of 35.1 dollars per ton (Asociación de Cultivadores de Arroz, 2001).
Price Elasticity of Supply
No estimates for Uruguay were found regarding the price elasticity of supply for rice, but
Moschini and Lapan show that the results are sensitive to the level of the price elasticity. Based
on literature review, it is assigned a triangular distribution with minimum possible value of 0.3,
most likely value of 1.0, and maximum possible value of 1.5.
Deterministic variables
All the other model parameters are assigned deterministic values. Total average rice
costs, as explained before, are 1,100 dollars per hectare. Since the technology is assumed
released, probability of success of the research is 100 per cent. The depreciation rate of the
technology is assumed to be 10 per cent per year beginning in year 10 and represents, for
12

instance, the increased resistance to herbicides that weeds acquire. Exogenous output growth is
assumed to be 1 per cent per year. Base quantities for year 1 are 889,200 tons, calculated using
average cropping area in Uruguay for the period 1991-2000 and average yield for the period
1995 – 1999, net of domestic consumption (Asociación de Cultivadores de Arroz, 2001). A
discount rate of 5 per cent is applied. The simulation was run using @Risk 3.5 for Excel, setting
the convergence criteria to 1 per cent and selecting Latin Hypercube sampling.
Results
The results for the change in producers’ surplus, monopolist’s profit and total surplus are
presented in table 2 for the mean, and 5 per cent and 95 per cent confidence intervals3.
Table 2. Simulation results: change in producers’ surplus, monopolist’s profit and total
surplus (in U.S. dollars).
Mean 5% 95%
Producers’ Surplus $ 8,118,819 $ 269,386 $ 20,315,440
Monopolist’s Profit $ 2,335,690 $ 117,534 $ 5,979,041
Total Surplus $ 10,454,510 $ 386,920 $ 26,294,481
Producers’ % 77.66 % 69.62 % 77.26 %
Monopolist’s % 22.34 % 30.38 % 22.74%
On average, the expected change in economic surplus for rice producers is 8.1 million
dollars for the entire period (15 years). Monopolist’s profit amounts to 2.3 million, and total
3The results refer to the Net Present Value (NPV) of benefits over a 15-year period.
13

surplus change to 10.4 million dollars. These figures represent a distribution of benefits between
producers and monopolist of 78 per cent and 22 per cent respectively. Since it is assumed that the
monopolist extracts the profit out of the country, from Uruguayan’s point of view 78 per cent of
the total surplus generated by the technology remains locally and 22 per cent is transferred out.
It is interesting to compare the total surplus generated under imperfect markets (the
monopolist’s power) with what would have happened had the input market for the seed variety
been perfectly competitive. Economic theory suggests that the presence of the monopolist,
represented in the model by the seed markup, decreases the total surplus generated. The model
was run setting the seed markup to zero to simulate a perfectly competitive market for the
transgenic seed, and results are shown in table 3.
Table 3. Simulation results under perfectly competitive market for the transgenic seed
change in producers’ surplus and total surplus (in U.S. dollars).
Mean 5% 95%
Producers’ Surplus $ 20,868,460 $ 4,158,791 $ 61,180,660
Total Surplus $ 20,868,460 $ 4,158,791 $ 61,180,660
Previous literature indicates that the change in the absolute size of the results comparing
perfect and imperfect markets is not as great as the change in distribution (Alston, Sexton and
Zhang, 1997). The present results, however, show that the absolute size may change
considerably. The difference arises from the use of an endogenous adoption rate. Assuming
14

perfectly competitive markets, the total surplus increases from 10.4 million to 20.8 million
dollars. Since the gene owner is not represented any more, the increase in producers’ surplus is
even greater, from 8.1 million to 20.8 million dollars
Next, the correlation coefficients are generated to identify the variables that most affect
the total surplus change (table 4). The variables with the highest correlation with the change in
total surplus are the expected increase in yield (0.47), the change in herbicide costs per hectare
(0.39), and the adoption rate (0.34). It is significant that the expected increase in yield has the
highest correlation, since it clearly makes it an important variable for the technology to be
successful. This fact has strong implications on the appropriate strategies that should be followed
to increase the expected benefits from a new transgenic variety. Particularly for small markets, it
seems that gene owners would do better by introducing the technology into locally adapted
varieties than by creating a new variety with lower yield.
Table 4. Correlation coefficients of uncertain parameters with total surplus and monopolist’s
profit.
Total Surplus Monopolist’s Profit
Expected yield increase 0.469 0.486
Change in herbicide costs 0.39 0.51
Adoption Rate 0.336 0.309
Seed Premium 0.174 0.384
Supply elasticity - 0.414 - 0.321
The positive correlations with the change in herbicide costs per hectare and with the
adoption rate are expected. The correlation with the supply elasticity is -0.41. This arises, in part,
15

because an increase in the supply elasticity directly reduces the per-unit cost reduction. Varying
the mean of the distribution for the supply elasticity has a large impact on the magnitude of the
results. For a mean of 0.5, the expected producer surplus is 12.4 million dollars, the expected
monopolist profit is 3.1 million dollars, and the expected total surplus is 15.5 million dollars.
When the mean of the supply elasticity is set at 1.3, the results are 7.2 million dollars for the
producer surplus, 2.1 million dollars for the monopolist’s profit and 9.3 million dollars for the
total surplus. Since the reason to treat the elasticity as stochastic was the lack of proper data, the
accuracy of future work and predictions can be improved with better estimates for this variable.
The positive sign of the correlation between the seed markup and the total surplus (0.17) is
explained by the assumed positive correlation with the reduction in herbicide costs per hectare.
The model allows for higher seed markup levels when reductions in herbicide costs per hectare
are larger. Larger cost reductions produce positive changes in total surplus, which in turn imply
that the markup can be set at a higher level.
The correlations between the different parameters and the monopolist’s profit are also
indicated on table 4. As expected, the correlation of monopolist’s profits with the seed markup is
positive and higher (0.38) than the correlation between total surplus and the seed markup. This is
due to the direct relationship between the profits and the level of seed premium charged. The
high correlation with the reduction in herbicide costs per hectare (0.51) is due, as before, to the
correlation assumed between change in herbicide costs and seed markup. The high correlation
with the expected yield increase (0.49) reconfirms the importance of the variable in determining
the magnitude of the benefits from GMOs. The positive impact on the expected profits comes
through the influence on the final adoption rate achieved, which for the monopolist’s has a
16
positive correlation of 0.31. As for the total surplus, the supply elasticity is negatively correlated
with profits (-0.32).
The sensitivity of the results to the level of the seed markup was examined by changing
the mean of the distribution for the latter. The sensitivity analysis show that when the mean of
the seed markup is changed to 35 dollars per hectare from the original level of 25, producers’
surplus is reduced 7.85 million dollars, monopolist’s profit remains constant at 2.32 million
dollars and total surplus is reduced to 10.17 million dollars. When the mean of the seed markup
is changed to 15 dollars per hectare, producers’ surplus increases to 9.94 million dollars,
monopolist’s profit is reduced to 2.17 million dollars and total surplus increases to 12.11 million
dollars4. Thus, as expected, the total surplus generated decreases with the markup, while between
$25 and $35 markups monopolists fail to increase their profits. It should be also noted that the
assumption about the functional form of the maximum adoption rate with respect to the per-unit
cost reduction of the new technology (see table 1) can be used to generate more drastic results.
For example, the seed markup can be increased to a level such that one of the thresholds of
adoption is reached, adoption rates decline sharply and total benefits are reduced more than
proportionally with a markup.
Conclusions
According to the simulation results, the expected total change in economic surplus
generated by the introduction of a transgenic rice variety in Uruguay is 10.4 million dollars. Out
of the total, 8.1 million dollars (78%) correspond to producers’ and national surplus and 2.3
million dollars (22%) are extracted out of the country as multinational firm profit. If the
4 The results refer to the mean of producers, monopolist and total surplus.
17
transgenic variety were released in a perfectly competitive seed market, the expected producers’
and total surplus is 20.8 million dollars, with no profits for the owner of the innovation.
The total benefits to society generated by GMOs decrease with the seed markup charged
by the monopolist. As the monopolist increases the level of the seed premium, producer profits
are reduced and adoption rates decline. Producer benefits within the country are reduced. Thus,
the profit maximizing seed mark-up for the multinational results in a lower than optimal level of
technology adoption in the country and lower levels of total benefits. Still, monopolist profits are
necessary to spur the large research investments needed to develop genetically modified
varieties. The results for both producers and the monopolist provide an indication of the total size
of returns to potential investments in a transgenic rice variety. The results suggest that, given the
size of the market, it seems unlikely that a private company would find it profitable to invest in
the creation of a specifically adapted transgenic variety for Uruguay. Moreover, the small market
size and the associated relatively small pool of total benefits significantly restrict the ability of
the country to use license fees to recover and redistribute back to producers and consumers some
of the profits captured by multinationals. Traxler (1999) shows, however, that when conditions
like proper law enforcement and availability of locally adapted varieties (among others) are met,
GMO companies are willing to enter small markets. Strategic alliances between multinational
companies and national institutions producing locally adapted varieties may increase the
attractiveness of investments. The conclusion is further supported by the high correlation found
between the surplus generated and the expected yield increase of the new variety, suggesting that
the yield gains associated with local adaptability play a major role in increasing the magnitude of
the expected benefits of a genetically modified variety.
18

Given the limits on potential tax and tariff policies imposed on the country by small
market size, agricultural research systems in small countries also need to examine alternative
cost and benefit sharing arrangements with multinational gene owners. Potential arrangements
include shared licensing of genes introduced into locally adapted germplasm, and regional
licenses and collaborative networks that spread national research systems and multinational’s
fixed costs over a larger market.
19

REFERENCES
Alston, J.M., G.W. Norton, and P.G. Pardey. Science under scarcity: Principles and
practice for Agricultural Research Evaluation and Priority Setting. Ithaca NY: Cornell
University Press, 1995.
Alston, J. M., R.J. Sexton and M. Zhang. “The effects of imperfect competition on the
size and distribution of research benefits” American Journal of Agricultural Economics.
79(November 1997):1252-1265.
Asociación de Cultivadores de Arroz (ACA). Evolución del Area Sembrada de Arroz.
Datos Estadísticos.<http://www.aca.com.uy/datos_estadisticos/tabla-
evolucion_area_sembrada.htm> Montevideo,Uruguay (Accessed March 30th 2001).
Carpenter, J.E., and L.P. Gianessi. “Herbicide Tolerant Soybeans: Why Growers Are
Adopting Roundup-ready Varieties”. AgBioforum Vol 2, 2(Spring 1999):65-72.
Couvillion, W.C., F. Kari, D. Hudson, and A. Allen. “A Preliminary Economic
Assessment of Roundup Ready Soybeans in Mississippi”. Department of Agricultural
Economics, Research Report 2000-005, Mississippi State University. May 2000.
Falck-Zeppeda, J.B., G. Traxler, and R.G. Nelson. “Surplus Distribution from the
Introduction of a Biotechnology Innovation”. Amer. J. Agr. Econ. 82(May 2000):360-369.
Hubbell B.J., M.C. Marra, and G.A. Carlson. “Estimating the Demand for a New
Technology: Bt Cotton and Insecticide Policies”. American Journal of Agricultural Economics
82(February 2000):118-132.
Lavecchia, A. “Estimación del Costo de Producción en el Cultivo de Arroz”.
Montevideo, Uruguay: Revista de la Asociación de Cultivadores de Arroz, Año VI Nº22, Julio
2000.
20

Morgan, M.Granger and M. Henrion (with a chapter by M. Small). Uncertainty: a Guide
to Dealing with Uncertainty in Quantitative Risk and Policy Analysis. New York: Cambridge
University Press, 1990 (reprinted 1998).
Moschini, G. and H. Lapan. “Intellectual Property Rights and the Welfare Effects on
Agricultural R&D.” Amer. J. Agr. Econ. 79(November 1997):131-142.
Oard, J.H., S.D. Linscombe, M.P. Braverman, F. Jodari, D.C. Blouin, M. Leech, A.
Kohle, and P. Vain. “Development, Field Evaluation and Agronomic Performance of Transgenic
Herbicide Resistant Rice”. Molecular breeding: new strategies in plant improvement. Dordrecht,
Boston: Kluwer Academic Publishers, c1995. 2:359-368, 1996.
Saha, A., H.A. Love and R. Schwart. “Adoption of Emerging Technologies Under Output
Uncertainty.” American Journal of Agricultural Economics. 76(November 1994): 836-846.
Traxler, G. “Assessing the Prospects for the Transfer of Genetically Modified Crop
Varieties to Developing Countries”. AgBioforum, Vol.2, Number 3 and 4 (1999): 198-202.
Zorrilla, G. Expected Adoption Rates for Transgenic Rice Varieties in Uruguay
(Elicitation form and personal communication). Unpublished, National Agricultural Research
Institute (INIA), Treinta y Tres, Uruguay, November 2001.
21