Embed Size (px)
Citation preview

The Economic Impact of AB 32 on California Small Businesses
December 2009
Jurgen Weiss, Ph.D, MBA Mark Sarro, Ph.D. 617.234.5739 617.234.5738 [email protected] [email protected]
Prepared for
Union of Concerned Scientists We acknowledge the valuable contributions of many individuals. Most importantly, we thank Steven Stoft for his participation and insight. We also thank the California Air Resources Board, the California Public Utilities Commission, and E3 for helpful data and methodological clarifications.

i www.brattle.com
TABLE OF CONTENTS
EXECUTIVE SUMMARY....................................................................................................................................... E-1 A. OVERALL FINDINGS ..................................................................................................................................... E-1 B. SPECIFIC FINDINGS ...................................................................................................................................... E-3 C. CONCLUSIONS.............................................................................................................................................. E-4
I. INTRODUCTION..................................................................................................................................................1
II. THE IMPACTS OF AB 32 ON ENERGY PRICES..............................................................................................2 A. ELECTRICITY PRICES .......................................................................................................................................3
1. Cap and Trade Impacts ............................................................................................................................3 a) Carbon Price Assumptions ...............................................................................................................3 b) Cap-and-Trade Revenue Recycling ..................................................................................................4 c) Impact on Electricity Prices .............................................................................................................6
2. RPS Impacts.............................................................................................................................................8 B. NATURAL GAS PRICES ...................................................................................................................................10 C. ENERGY EFFICIENCY .....................................................................................................................................11 D. TRANSPORTATION FUELS...............................................................................................................................12 E. SUMMARY OF AB 32 ENERGY PRICE IMPACTS ..............................................................................................15
III. CALIFORNIA SMALL BUSINESSES...............................................................................................................16 A. SMALL BUSINESS CHARACTERISTICS.............................................................................................................16 B. SMALL BUSINESS ENERGY COSTS..................................................................................................................20
IV. BORDER GRILL — A CASE STUDY...............................................................................................................22 A. SELECTING A TARGET SMALL BUSINESS .......................................................................................................22 B. THE BAU BASELINE......................................................................................................................................24 C. CONSERVATIVE CASE AB 32 IMPACTS ..........................................................................................................24 D. EXTREME CASE AB 32 IMPACTS....................................................................................................................25 E. CASE STUDY RESULTS...................................................................................................................................25
V. CONCLUSIONS..................................................................................................................................................27

E-1 www.brattle.com
EXECUTIVE SUMMARY
Assembly Bill 32 (AB 32), the Global Warming Solutions Act of 2006, established California’s 2020 greenhouse gas emissions reduction target, requiring the state’s emissions to return to 1990 levels by 2020, a reduction of approximately 12.5% from current levels and 40% from business-as-usual in 2020.* The economic impact of this requirement is of obvious policy and practical significance to all Californians. As a result, AB 32 has been the subject of a tremendous amount of ongoing analysis, controversy, and some confusion.
This report aims to provide objectivity and clarity to the policy debate regarding the likely economic impact of AB 32. Specifically, it examines AB 32’s potential impact on small businesses in California by developing two relatively simple scenarios: a Conservative Case and an Extreme Case. The Conservative Case reflects a realistic, but relatively pessimistic, set of outcomes. The Extreme Case sets an unrealistically high upper-bound on AB 32 cost increases through assumptions and policy design features that overstate the cost impacts of AB 32. By design, the Extreme Case makes simplifying assumptions known to over-estimate AB 32’s costs as a way to make our modeling process more transparent than previous modeling efforts, and to provide more assurance of capturing extreme potential outcomes.
In both cases, we mainly focus on the potential direct cost of implementing AB 32. We deliberately do not model all of the market and behavioral changes which will result from AB 32 and will offset its direct cost, such as any price-lowering effect of renewable energy on the prices of fossil fuels and thereby electricity, as well as the full economic potential of mitigation strategies, such as energy efficiency, which can yield significant savings for small business owners. As a result, both of our scenarios are likely to overstate, to differing degrees, the costs to small businesses of AB 32 policies.
Our analysis concludes that the incremental impact of AB 32 on the average small business in California will be relatively small and definitely manageable. In fact, the cost impact will be well within the range of historic cost variation most small businesses already face every day regardless of AB 32.
A. OVERALL FINDINGS
This conclusion is based on four fundamental observations:
First, most small businesses will not be directly regulated under AB 32. They will not be required to make emissions cuts or to buy allowances or pay fees to cover their emissions. AB 32 will affect small businesses only indirectly, through increases in energy costs. However, the vast majority of small businesses in California are not energy-intensive; that is, energy-related costs represent only a small fraction of total revenue.† In fact, the average small business in California spends less than 1.5% of revenues on energy-related costs. So, any increase in the price of energy (electricity, natural gas, and transportation fuels) will have only a modest financial impact.
* According to California’s Greenhouse Gas Inventory, statewide emissions were 426.6 million metric tons of CO2
equivalents (Mmt CO2e) in 1990, 479.8 Mmt CO2e in 2006 (the most current year reported), and are expected to reach 596.4 Mmt CO2e in 2020. See http://www.arb.ca.gov/cc/inventory/inventory.htm.
† Energy-related costs include the use of electricity, the use of fuels such as oil and gas for heating, and the use of transportation fuels.

E-2 www.brattle.com
Higher energy prices also may affect the intermediate products small businesses use, such as food, supplies, and services. However, increased small business costs due to the increased cost of intermediate products also will be modest. For example, an analysis done by the federal government on how climate legislation may affect the price of intermediate products in the US economy as a whole estimated increased energy costs will increase the consumer price index by just 0.005% per year over ten years.‡
Second, the increases we project in electricity, gas, and transportation fuel costs by 2020, even in the Extreme Case, are lower than recent increases in the same rates caused by factors wholly unrelated to environmental regulations. Small businesses routinely deal with price increases of similar, and larger, magnitudes.
Third, to be exceptionally cautious, the cost increases we estimate in this report do not take into account the reality that small businesses will have the ability to respond to AB 32 by changing their energy consumption, for example by taking advantage of incentives to increase their energy efficiency. Such responsive actions will at least partially offset higher energy costs, and some will be profitable in their own right. We have not included any assumed benefits from making mitigating efficiency investments in our general analysis of small businesses and have assumed only very modest benefits from energy efficiency investments for the case study we consider. Hence, both scenarios overstate the likely cost impacts.
Fourth, as is typically the case when all competitors experience the same increase in energy prices, as they will under AB 32, we expect the moderate cost increases to be passed through to consumers. Because of the products and services they sell, the vast majority of small businesses in California are subject to limited competition from businesses outside of California, who are beyond the reach of AB 32. For this reason, most small businesses will be able to pass through to their customers at least part of any cost increases due to AB 32 via slight price increases. While increasing price by one supplier, but not its competitors may result in a noticeable demand shift away from that supplier, when all suppliers raise prices by the same small amount (approximately 1%) there will be no demand shift among suppliers and the total reduction in demand likely will be imperceptible.
In competitive industries, increases in economy-wide production costs are always passed through to customers
at least to some extent. Since most small businesses will not be directly charged for AB 32, the very
assumption that small businesses will be affected by AB 32 assumes that costs incurred upstream, i.e., at the
level of electricity producers, electricity suppliers, natural gas suppliers, oil refineries, etc., will be passed on
100%. While certain of these costs are likely to be incurred by regulated entities with the right to pass on all
such costs, others are not. We therefore believe that an analysis that assumes that on the one hand all costs
related to AB 32 will be passed through to small businesses, but that small businesses in turn will be unable to
pass any of these costs on to their own consumers significantly overestimates the cost impact of AB 32 on
small businesses. We nevertheless make the same assumption here to develop an upper bound, and in our
Extreme Case an extreme upper bound, on the cost impacts associated with AB 32. We also illustrate in a
simple case study that a very small price adjustment would completely compensate for any cost increases
associated with AB 32.
The basic result of this report, that there will be little impact of AB 32 on small business, can be easily
understood without complex modeling. Energy expenditures account for 7% of total income for California
‡ An analysis by the Department of Energy of H.R. 5149, an early federal climate change bill, showed an incremental
impact on inflation (CPI-U) of approximately 0.6% over a ten year period, or .005% per year. http://www.eia.doe.gov/oiaf/servicerpt/economicimpacts/impacts.html

E-3 www.brattle.com
state-wide, and they account for less than 1.4% of total revenue for the average California small business.§ In
the Extreme Case, we estimate energy prices will rise by about 28% overall, and small businesses will do
nothing to conserve energy. This would result in just a 0.4% cost increase for the average small business.
Small businesses are likely to pass through virtually all of such a modest cost increase, so it cannot have a
significant financial impact.
We do not explicitly model the indirect impacts of AB 32 on small businesses or on the overall economy.
These indirect effects occur when energy cost increases filter through the economy and increase the prices of
many intermediate goods based on the energy used in their production and on the characteristics of supply and
demand in their markets. Predicting precisely the magnitudes of these indirect effects on input prices and on
the costs of any particular small business is beyond the scope of this study. However, we can put an upper
limit on the average indirect impact, and this proves to be quite revealing.
As estimated in this report, the impact of AB 32 on the average price level in the California economy—over a
ten-year period—will be, at most, 0.8% in the Conservative Case and 2% in the Extreme Case. Both estimates
assume businesses do not substitute away from energy inputs even as their prices increase. These projected
increases translate into an average annual increase in the price level of less than 0.001% and 0.2% respectively;
the larger impact is about ten times less than the normal year-to-year variability in inflation.
Price increases are a way that markets naturally adjust to cost increases caused by shocks to the economy
and/or structural changes over time. AB 32 will bring price changes that are very modest compared to the
normal fluctuations of prices experienced in the U.S. economy.** Small businesses can mitigate the impacts of
AB 32 on their profits by passing on the modest increases in their unit costs in the form of higher product
prices
Overall, our analysis indicates that the likely effects of AB 32 will be minor for small businesses and will be
easily absorbed into the existing range of cost variation that they already face.
B. SPECIFIC FINDINGS
The specific assumptions and results of our analysis are:
We assume 2020 carbon prices will be approximately $40 per ton in the Conservative Case and $60 per
ton in the Extreme Case. At those carbon prices, we project cap and trade under AB 32 will increase prices
in 2020 by:
< 0.7 cents per kWh (5%) and by 1.9 cents per kWh (12%) for electricity in the Conservative
Case and Extreme Case, respectively;
< 15 cents per therm (12%) and by 30 cents per therm (25%) for natural gas in the
Conservative and Extreme cases;
§ In 2007, California’s total energy expenditures were $121.9 billion, or 6.8% of the state’s $1.8 trillion gross domestic
product for the same year. (Source: EIA State Energy Data System and the Bureau of Economic Analysis GDP–by–State Statistics.) The small business statistics are discussed in Section III.
** For example, gasoline prices have fluctuated annually by over 10% just in the last 8 years and natural gas prices have similarly experience large annual changes over the last 15 years.

E-4 www.brattle.com
< 35 cents per gallon (8%) and by 53 cents per gallon (12%) for transportation fuel in the
Conservative and Extreme cases.
At the same carbon prices, we project:
< the Renewable Portfolio Standard (RPS) under AB 32 will increase electricity prices in 2020
by 1.1 cents per kWh (or 7%) in the Conservative Case and by 2.3 cents per kWh (or 15%) in
the Extreme Case;
< Energy efficiency measures under AB 32 will pay for themselves in the Conservative Case
and will increase electricity prices in 2020 by 0.4 cents per kWh (2%) in the Extreme Case;
< the Low-Carbon Fuel Standard (LCFS) under AB 32 will not increase the 2020 price of
transportation fuel in the Conservative Case and will increase it by 95 cents per gallon (21%)
in the Extreme Case.
C. CONCLUSIONS
For all of these reasons, and based on the underlying analysis summarized in this report, we conclude that the average impact of AB 32 on small businesses in California will be modest. We recognize that its impact will vary across small businesses. Some businesses and sectors will be more affected than others. However, new business opportunities also will emerge as a direct result of climate change regulations such as AB 32, and many of those opportunities will benefit small businesses.
Even if businesses do nothing to decrease their energy use through energy efficiency or other means over the next ten years, our results show California’s policies to reduce global warming pollution will have only a very small economic impact on small businesses. In exchange, such policies will help California to avoid the environmental, social, and economic impacts projected to result from unabated climate change and estimated at tens of billions of dollars annually.†† From an economic perspective, that tradeoff presents benefits to California’s small businesses and to the state as a whole in a future that is carbon-constrained.
†† California Climate Action Team Biennial Report, March 2009, http://www.energy.ca.gov/2009publications/CAT-
1000-2009-003/CAT-1000-2009-003-D.PDF.
1 www.brattle.com
I. INTRODUCTION
In September 2006, the California Legislature passed, and Governor Schwarzenegger signed into law, Assembly Bill 32 (AB 32), the Global Warming Solutions Act of 2006. AB 32 establishes a timetable and range of provisions for reducing greenhouse gas emissions in California between now and the year 2020. It covers the same six greenhouse gases (GHGs) covered by the Kyoto Protocol internationally1 and by legislation similar to AB 32 currently proposed at the U.S. federal level.2 Specifically, AB 32 requires California’s GHG emissions to return to 1990 levels (427 Mmt CO2e) by 2020, a reduction of approximately 12.5% from current levels (480 Mmt CO2e), and a 40% reduction from projected business-as-usual emissions in 2020 (596 Mmt CO2e) over the next ten years.3
AB 32’s passage was the culmination of 20 years of public policies and scientific research into the potential impacts of climate change on California.4 In 1988, AB 4420 required the California Energy Commission to create an inventory of all GHG emissions in the state. The result was a series of reports published in each of the subsequent three years on California’s GHG inventory, the potential effects of climate change, and potential strategies to reduce statewide GHG emissions.5 According to the most recent biennial report of California’s Climate Action Team (a multi-agency group which reports to the governor and legislature), business-as-usual climate change will cost California tens of billions of dollars annually.6 Other researchers report similarly prohibitive costs to California of climate change inaction.7 AB 32 is intended to significantly reduce California’s GHG emissions in order to avoid such environmental and social costs.
Some reports have predicted AB 32 will have dire consequences for California’s small businesses and for the state as a whole. For the most part, such reports fail to provide a solid analytical basis for their sensational conclusions. But there is an active, serious ongoing policy effort in California to model and understand the likely economic impacts of AB 32 so it can be implemented most intelligently. Assessing the economic impact of AB 32 on small businesses can be quite complex. Small businesses are a diverse mix of hundreds of thousands of companies, each of which will be affected by AB 32 to a different degree. Also, the full detail of how AB 32 will be implemented has yet to be finalized. The purpose of this report is not to add yet another complex analysis of AB 32’s potential impacts. Rather, we introduce a simple but robust approach to assess a conservative range of impacts AB 32 will have on small businesses in California.
1 The six Kyoto gases are carbon dioxide (CO2), methane (CH4), and nitrous oxide (N20), as well as three long-lived
industrial gases: hydrofluorocarbons (HFCs), perfluorocarbons (PFCs), and sulphur hexafluoride (SF6). 2 As of the time of writing of this paper, a federal climate change bill has been passed in the House of Representatives
(HR 2454, the American Clean Energy and Security Act of 2009) and a similar bill has been introduced in the Senate (S 1733, the Clean Energy Jobs and American Power Act).
3 California’s Greenhouse Gas Inventory, http://www.arb.ca.gov/cc/inventory/inventory.htm. 4 For a detailed history of California GHG policy, see Michael Hanemann, “California’s New Greenhouse Gas Laws,”
Review of Environmental Economics and Policy (2)1, Winter 2008, pp. 114–129, http://mek1966.googlepages.com/114.pdf.
5 See, e.g., The impacts of global warming in California (P500-89-004, 1989), 1988 inventory of California greenhouse gas emissions (1990), and Global climate change: Potential impacts and policy recommendations (P500-91-007, 1991).
6 California Climate Action Team Biennial Report, March 2009, http://www.energy.ca.gov/2009publications/CAT-1000-2009-003/CAT-1000-2009-003-D.PDF.
7 See, e.g., F. Kahrl, and D. Roland-Holst, California climate risk and response, University of California at Berkeley Research paper #08102801, 2008, http://www.next10.org/pdf/report_CCRR/California_Climate_Risk_and_Response.pdf.

2 www.brattle.com
The results of our analysis should therefore not be interpreted as precise predictors of AB 32’s cost impact, but rather as indicators of the potential range of impacts. Both our Conservative Case and Extreme Case purposely rely on conservative assumptions which tend to overstate the effects of AB 32. In addition, our analysis focuses on a subset of AB 32’s provisions, namely the cap and trade program, the Renewable Portfolio Standard (RPS), and the Low-Carbon Fuel Standard (LCFS). While these are the key provisions of AB 32, they are not the full package. AB 32 includes complementary measures to increase energy efficiency and decrease energy consumption. Such measures will at least partially offset the cost increases resulting from AB 32, but we do not model them explicitly.
In writing this report, we have carefully examined the existing modeling and analysis of AB 32. Rather than adopting any specific analysis, we have used the range of analyses to derive what we consider to be a Conservative Case and an Extreme Case of AB 32 impact on energy prices. We then used these two cases to calculate the economic impact of the corresponding energy price changes on the bottom-line of small businesses in California relative to a baseline business-as-usual (BAU) case. We did the latter by considering a statistical cross section of small businesses. We also develop a case study for the Border Grill, as an example of how AB 32 might affect an actual business in the sector with the most employment and highest energy intensity among the five largest small business categories.8
For both the statistical cross-section of all small businesses and the case study focusing on one particular business, we assume the primary impact of AB 32 on small businesses will be through energy costs. We acknowledge that higher energy costs also will affect intermediate inputs beyond energy, since those inputs might become more expensive as the energy used to produce them becomes more expensive. However, we have ignored such second-order impacts for two reasons. First, as we have said, energy-related costs are relatively small relative to total revenue, both at the small-business level (less than 1.4%) and statewide (less than 7%). Thus, any reasonable energy cost increase resulting from AB 32 will lead to only relatively small increases in the prices of intermediate products. Second, if suppliers can pass-through increased energy costs, so will the small businesses purchasing intermediary inputs. This point is one to which we return later in this report. It is an important point, but it is often neglected in analyzing the impact of input price increases on small businesses.
For both the statistical analysis and case study, we first assessed the impact of AB 32 on energy prices. The next section of the report describes our methodology for deriving estimates of those impacts. Since many of the rules for implementing AB 32 presently are not finalized, it is difficult to definitively derive a single set of AB 32 impacts on energy prices. Thus we developed a range of estimates using the Conservative Case and the Extreme Case.
The subsequent section of the report discusses the resulting AB 32 impacts on typical and small businesses across multiple lines of business. The final sections present the case study results and provide some concluding remarks.
II. THE IMPACTS OF AB 32 ON ENERGY PRICES
AB 32 will impact small businesses primarily through its direct effects on energy bills stemming from the consumption of three sources of energy: electricity, transportation fuels, and other carbon-based fossil fuels, mostly natural gas. The primary effect of AB 32’s carbon cap, RPS, and LCFS will be to potentially increase
8 As we report in Section IV, restaurants account for 10% of all small business employment in California, and the
average restaurant spends 2.8% of its revenue on energy-related costs.
3 www.brattle.com
the prices of all three energy sources. Complementary measures included in AB 32 may offset such price increases by helping to reduce energy consumption. However, because we do not model such complementary measures explicitly, the estimated impacts we report, even in our Conservative Case, are somewhat overstated.
In this section, we focus on the effect AB 32 might have on energy prices. We focus on the prices of three energy commodities in particular: electricity, natural gas for heating, and gasoline used as a transportation fuel. In reality, some amount of heating will come from sources other than natural gas. However, in California the only source of heating other than natural gas is electricity, not oil.9 Since we capture the direct effect of AB 32 on electricity prices, limiting the analysis on natural gas as a source of heating is reasonable. For simplicity, we limit our analysis of transportation fuels to gasoline, which represents the vast majority of transportation fuel consumption.
A. ELECTRICITY PRICES
AB 32 will impact electricity prices through two measures: the carbon limits implemented through a cap and trade program and a statewide RPS with a goal of generating 33% of electricity consumed from eligible renewable resources by 2020. Cap and trade and RPS jointly impact electricity prices and changes in the electric generation mix. As we explain in this section of the report, our analysis of the RPS impact on electricity prices explicitly netted out cap and trade impacts and our analysis of cap and trade prices takes into account the contribution from RPS compliance. Therefore, we were able to estimate the incremental price impact of each in isolation, and then add them to estimate the overall effect of AB 32 on electricity prices.
1. Cap and Trade Impacts
a) Carbon Price Assumptions
AB 32’s carbon cap and trade program will impact the price of electricity by reflecting the cost of carbon in fuels used to produce electricity. As of the writing of this report, the details of the cap and trade program under AB 32 are not yet known, nor is there a federal cap and trade program in place. We assumed a range of possible 2020 carbon prices from $40 per ton in our Conservative Case to $60 per ton in the Extreme Case.
We assumed a $40 per ton 2020 carbon price in the Conservative Case based on a report prepared by Synapse Energy.10 The Synapse report does not project carbon prices resulting from AB 32, but rather from future federal legislation. To our knowledge, as of the writing of this report, no credible forecast of CO2 allowance prices under AB 32’s contemplated cap and trade program exists. We relied on the Synapse projected 2020 price for internal consistency. The California Public Utilities Commission (CPUC) used that price in calculating the impact on electricity prices of meeting California’s 33% RPS target,11 and we, in turn, relied on the CPUC analysis to estimate the impact of the 33% RPS on electricity costs (discussed in the next sub-section).
We assumed a $60 per ton 2020 carbon price in the Extreme Case because it represents a full 50% increase over the 2020 carbon price in the Conservative Case and, at $60 per ton, certain technologies for reducing
9 See EIA, State Energy Profiles: California, http://tonto.eia.doe.gov/state/state_energy_profiles.cfm?sid=CA#Datum. 10 Synapse Energy Economics, Inc., “Synapse 2008 CO2 Price Forecasts” (July 2008), http://www.synapse-energy.com/
Downloads/SynapsePaper.2008-07.0.2008-Carbon-Paper.A0020.pdf. 11 33PercentRPScalculator.xls, http://www.cpuc.ca.gov/PUC/energy/Renewables/hot/33implementation.htm and “Inputs
and Assumptions to 33% Renewable Portfolio Standard Implementation Analysis,” June 2009, p. 13.
4 www.brattle.com
carbon emissions very significantly become economically viable.12 Most notably, carbon capture and storage for new coal-fired power plants and renewable energy sources both are likely economic at a $60 carbon price.
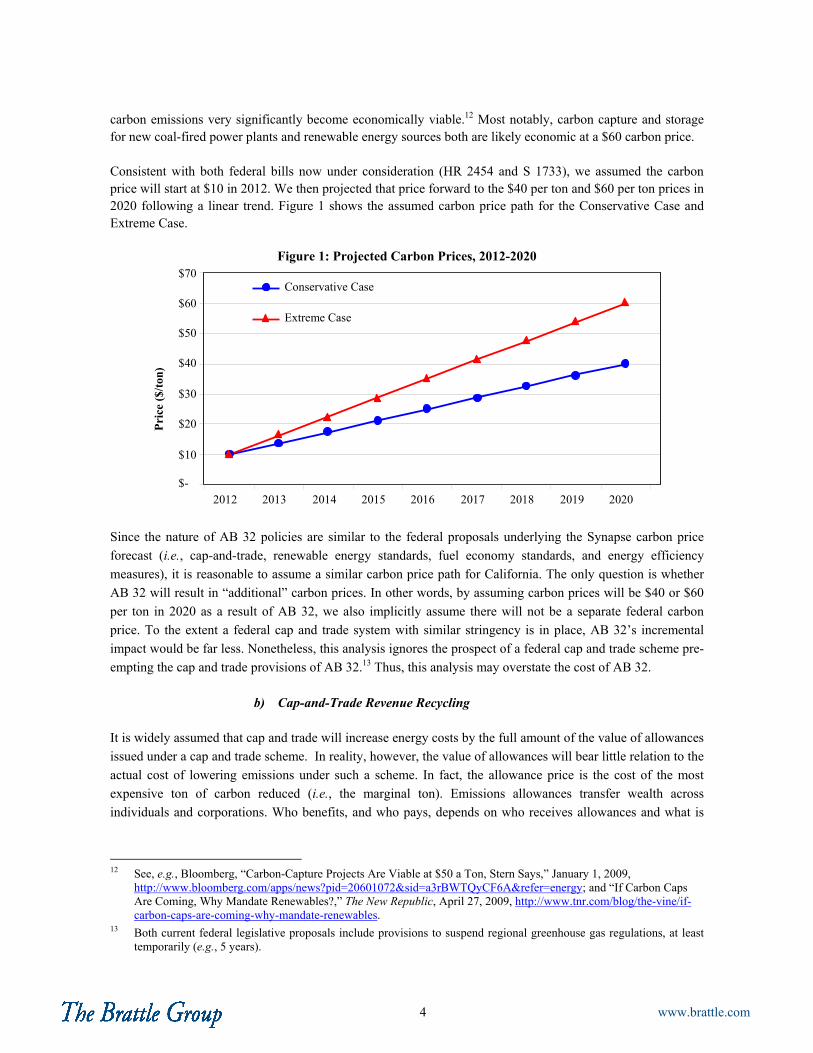
Consistent with both federal bills now under consideration (HR 2454 and S 1733), we assumed the carbon price will start at $10 in 2012. We then projected that price forward to the $40 per ton and $60 per ton prices in 2020 following a linear trend. Figure 1 shows the assumed carbon price path for the Conservative Case and Extreme Case.
Figure 1: Projected Carbon Prices, 2012-2020
$-
$10
$20
$30
$40
$50
$60
$70
2012 2013 2014 2015 2016 2017 2018 2019 2020
Pri
ce (
$/to
n)
Conservative Case
Extreme Case
Since the nature of AB 32 policies are similar to the federal proposals underlying the Synapse carbon price
forecast (i.e., cap-and-trade, renewable energy standards, fuel economy standards, and energy efficiency
measures), it is reasonable to assume a similar carbon price path for California. The only question is whether
AB 32 will result in “additional” carbon prices. In other words, by assuming carbon prices will be $40 or $60
per ton in 2020 as a result of AB 32, we also implicitly assume there will not be a separate federal carbon
price. To the extent a federal cap and trade system with similar stringency is in place, AB 32’s incremental
impact would be far less. Nonetheless, this analysis ignores the prospect of a federal cap and trade scheme pre-
empting the cap and trade provisions of AB 32.13 Thus, this analysis may overstate the cost of AB 32.
b) Cap-and-Trade Revenue Recycling
It is widely assumed that cap and trade will increase energy costs by the full amount of the value of allowances
issued under a cap and trade scheme. In reality, however, the value of allowances will bear little relation to the
actual cost of lowering emissions under such a scheme. In fact, the allowance price is the cost of the most
expensive ton of carbon reduced (i.e., the marginal ton). Emissions allowances transfer wealth across
individuals and corporations. Who benefits, and who pays, depends on who receives allowances and what is
12 See, e.g., Bloomberg, “Carbon-Capture Projects Are Viable at $50 a Ton, Stern Says,” January 1, 2009,
http://www.bloomberg.com/apps/news?pid=20601072&sid=a3rBWTQyCF6A&refer=energy; and “If Carbon Caps Are Coming, Why Mandate Renewables?,” The New Republic, April 27, 2009, http://www.tnr.com/blog/the-vine/if-carbon-caps-are-coming-why-mandate-renewables.
13 Both current federal legislative proposals include provisions to suspend regional greenhouse gas regulations, at least temporarily (e.g., 5 years).

5 www.brattle.com
done with the monetary value embedded in holding them. Irrespective of whether allowances are auctioned or
allocated, ultimately the value of allowances flows back to households.14
In the Extreme Case, we assumed all small businesses will face increased energy prices fully reflecting the cost of allowances. This is consistent with assuming regulated entities under a cap and trade scheme have to buy all allowances either through auctions or in secondary markets. The allowance value (i.e., the money spent buying allowances) would be recycled to final consumers either through direct refunds to taxpayers, through reduction of other income taxes, or through the use of those funds to finance other activities deemed to benefit taxpayers. Under this approach, consumer income is not reduced by the value of allowances, but rather by the net cost of lowering emissions, which will be significantly less. All else equal, this would lower consumer purchasing power somewhat, with resulting potential impacts on purchases of all other goods and services. We have not estimated this impact because, given the likely small magnitude of the overall economic cost of lowering emissions under AB 32 relative to state income, this effect will be de minimis.15 However, this type of revenue recycling is not likely to reduce the price impact of AB 32 on energy costs to small businesses.
In the Conservative Case, we assumed a substantial portion of allowances, whether auctioned or freely-allocated, are distributed to regulated entities with the explicit mandate to use the associated allowance value for the benefit of ratepayers. Both of the current federal cap and trade proposals (HR 2454, the American Clean Energy and Security Act of 2009 and S 1733, the Clean Energy Jobs and American Power Act) require regulated entities receiving free allowance allocations to use those allowances for ratepayer benefit. This type of revenue recycling tends to dampen the impact of allowance values on average energy prices. The magnitude and form of the reduced impact depends significantly on the number of allowances thus allocated and on the way the allowance value is used for ratepayer benefit.
For example, both federal proposals say allowance value should be refunded to ratepayers using the non-variable portion of utility bills, to the extent possible, so the refund does not vary with energy use. It is also possible for some money to be spent on initiatives to benefit ratepayers indirectly, for example by providing financing for investments in energy efficiency. Because both federal bills include provisions to recycle at least some allowance value through existing regulated entities (most notably electricity and natural gas local distribution companies) and because there is significant pressure on lawmakers to minimize the impact of climate legislation on ratepayers (rather than on consumers or taxpayers), we decided our Conservative Case should assume some of the allowance value will be used to provide average rate relief.
Under Waxman-Markey, at least 35% of all allowances issued each year through 2020 will be freely allocated
to electric distribution companies. Another 9% will be freely allocated to local gas distribution companies. We
used these federal allocation percentages as the basis for assessing the potential impact of rate relief through
allocations to electric and gas utilities. We further assumed 50% of the thus allocated allowances will be used
to provide rate relief (i.e., 50% revenue recycling of allowances through rates). To estimate the impact of free
allocation on retail rates, we estimated the percentage of emissions likely to be covered by the free allocations
to the electricity and gas sectors respectively.
14 Even if allowance allocation results in increased profits to shareholders, these profits ultimately flow back to
households, albeit with potentially important distributional differences. 15 The Environmental Protection Agency estimated the cost of proposed federal cap and trade legislation will be 22 to 30
cents per day ($80 to $111 per year) for the average household in 2020. The Congressional Budget Office projected a cost of 48 cents per day ($175 per year). Both estimates account for energy efficiency benefits, but neither accounts for the avoided cost of unabated climate change. See, e.g., http://energycommerce.house.gov/Press_111/20090623/hr2454_epasummary.pdf.
6 www.brattle.com
Assuming allowance revenues will be partially recycled through electricity and gas rate relief means final consumer direct income will be somewhat more affected than under direct revenue recycling, since part of the allowance value does not go back to consumers directly, but rather indirectly through lower average electricity and gas rates. To the extent consumers use electricity and gas, they will experience a similar income effect, but from two sources: whatever direct recycling is chosen and lower rate increases for electricity and gas. However, since companies (and small businesses) are also ratepayers, some of the allowance revenues will not go to consumers directly, but rather will lower the cost impact on businesses, which in turn means businesses will increase their prices less to pass-through the cost.
c) Impact on Electricity Prices
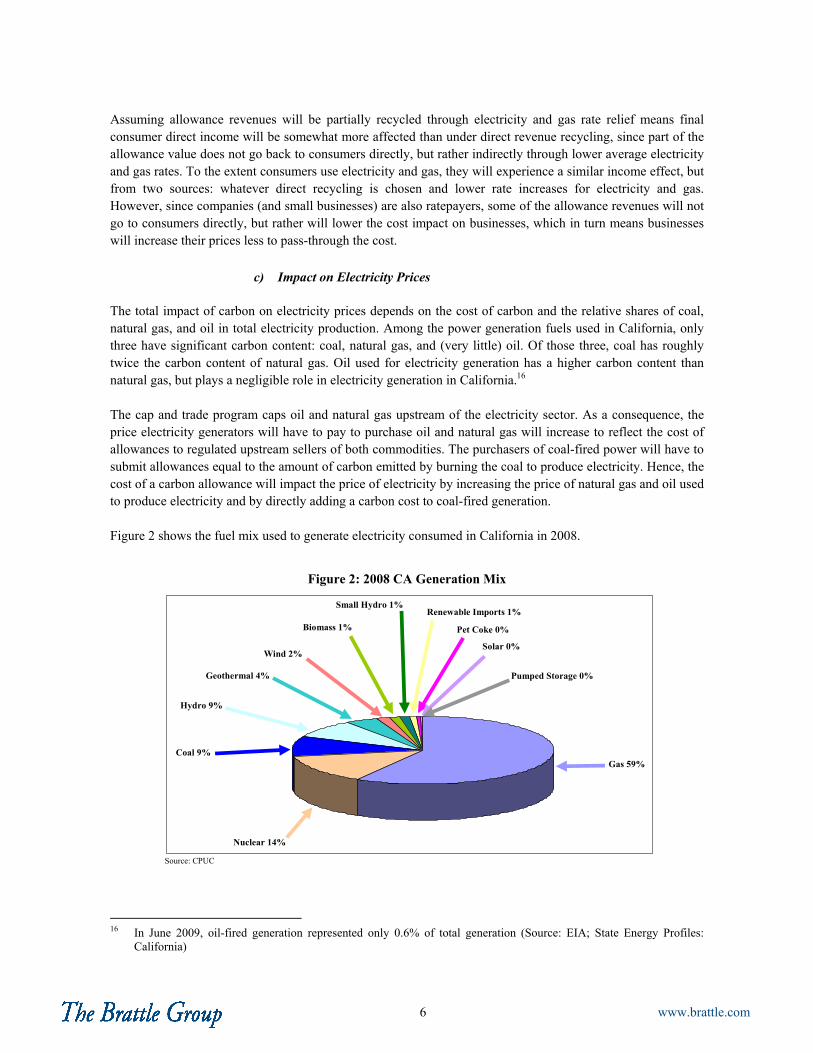
The total impact of carbon on electricity prices depends on the cost of carbon and the relative shares of coal, natural gas, and oil in total electricity production. Among the power generation fuels used in California, only three have significant carbon content: coal, natural gas, and (very little) oil. Of those three, coal has roughly twice the carbon content of natural gas. Oil used for electricity generation has a higher carbon content than natural gas, but plays a negligible role in electricity generation in California.16
The cap and trade program caps oil and natural gas upstream of the electricity sector. As a consequence, the price electricity generators will have to pay to purchase oil and natural gas will increase to reflect the cost of allowances to regulated upstream sellers of both commodities. The purchasers of coal-fired power will have to submit allowances equal to the amount of carbon emitted by burning the coal to produce electricity. Hence, the cost of a carbon allowance will impact the price of electricity by increasing the price of natural gas and oil used to produce electricity and by directly adding a carbon cost to coal-fired generation.
Figure 2 shows the fuel mix used to generate electricity consumed in California in 2008.
Figure 2: 2008 CA Generation Mix
Source: CPUC
Coal 9%
Hydro 9%
Pet Coke 0%
Renewable Imports 1%
Solar 0%
Small Hydro 1%
Pumped Storage 0%
Biomass 1%
Geothermal 4%
Wind 2%
Gas 59%
Nuclear 14%
16 In June 2009, oil-fired generation represented only 0.6% of total generation (Source: EIA; State Energy Profiles:
California)

7 www.brattle.com
We estimated the impact of carbon prices on electricity prices in four steps:
First, we projected California’s future generation mix. We relied on the generation mix projected by the CPUC in its 33% RPS calculations, starting with the 2008 mix shown in Figure 2 and ending in 2020. This mix reflects the CPUC’s projected impact of carbon prices on electricity generation. Figure 3 shows the resulting evolution of the mix of total power generation in California between 2008 and 2020.
Figure 3: Projected CA Electricity Generation Mix
The resulting mix assumes the renewable generation share increase from 15% to 33% between 2010 and 2020 (i.e., the state misses its RPS target of 20% for 2010 but meets its 33% target for 2020).
Second, we assumed an average heat rate for fossil-fueled generation (coal, natural gas, and pet coke) of 10,000 BTU/kWh.17 Actual heat rates for existing generation types vary. However, a constant heat rate across all future generation types is a reasonable forward-looking assumption, on average. We multiplied the constant heat rate by the actual carbon emissions factor for each fossil fuel type for coal (i.e., their carbon content) to calculate future CO2 emissions for the projected statewide generation mix.
Third, we multiplied the total emissions resulting from meeting demand with the projected generation mix by the assumed carbon prices and divided the total by the assumed total demand in each year to derive an increase in average electricity prices on a $/kWh basis for both a $40 per ton (Conservative Case) and a $60 per ton (Extreme Case) carbon price.
Last, we assessed the impact of free allowance allocation with partial revenue recycling through lower rates. Allocating 35% of allowances to the electric sector (again, based on the minimum allocation to the electric sector in HR 2454) will offset 72% to 89% of total electric sector emissions between 2012 and 2020. Assuming 50% revenue recycling of allowances through rates in the Conservative Case will lower the impact of cap and trade on electric rates by roughly half. In the Extreme Case, we assumed no revenue recycling so ratepayers bear the full electricity price impact of cap and trade.
17 This average heat rate is higher than heat rates we would expect to actually observe, so this assumption is conservative
and will overstate costs.
0%
20%
40%
60%
80%
100%
Pet Coke
Coal
Nuclear
Natural gas
Large Hydro
Renewables
2008 2012 2016 2020

8 www.brattle.com
The resulting rate increases for our assumed allowance prices of $40 per ton (Conservative Case) and $60 per ton (Extreme Case) depend on the assumption about revenue recycling. Without revenue recycling to lower average rates, cap and trade would increase electricity prices in 2020 by 1.3 cents per kWh in the Conservative Case and 1.9 cents per kWh in the Extreme Case. However, we assumed 50% freely-allocated allowances to the electricity sector ultimately will result in rate relief in the Conservative Case. Hence, our final impacts on 2020 electricity prices are 0.7 cents per kWh in the Conservative Case and 1.9 cents per kWh in the Extreme Case.
Figure 4 shows the resulting time path of electricity price increases due to cap and trade in the Conservative and Extreme cases.
Figure 4: Cap and Trade Electricity Price Impact
2012 2013 2014 2015 2016 2017 2018 2019 2020-
0.5
1.0
1.5
2.0
cen
ts/k
Wh
Conservative Case
Extreme Case
2. RPS Impacts
A second impact of AB 32 on electricity prices results from California’s RPS, which requires increasing amounts of electricity to be generated from renewable sources. In California, renewables are estimated to be more expensive than fossil-fuel alternatives, such as natural gas. Executive Order S-21-09 signed in September 2009 builds on AB 32’s RPS goal, requiring 33% of California’s electricity to be generated from renewable sources by 2020. The California Air Resources Board (ARB) also included a renewable energy target of 33% by 2020 in its AB 32 Scoping Plan.
In 2008, renewable sources supplied 27,063 GWh or 10.2% of the 265,185 GWh of retail electricity sales in California.18 Total retail electricity sales are expected to grow by an average of 1.26% per year to 308,220 GWh by 2020.19 So to comply with the 33% by 2020 renewable energy target in the Executive Order and ARB Scoping Plan, another 74,650 GWh of electricity will have to be generated from renewable sources.
We considered existing estimates for California’s 33% renewable energy target to derive a reasonable estimate of the likely incremental cost of moving the RPS target from current renewable levels to 33% by 2020. In June 2009, the CPUC released an interim report on its own assessment of the cost of complying with the 33% renewables target by 2020.20 The report concluded that meeting the 33% target will increase electricity
18 CEC, Form 1.1 - Statewide California Energy Demand 2010-2020 Staff Revised Forecast, Total Consumption. 19 Ibid. 20 “33% Renewables Portfolio Standard; Implementation Analysis Preliminary Results,” CPUC, June 2009
9 www.brattle.com
expenditures by 7.1% statewide. The CPUC examined a number of alternative procurement scenarios. Under the most costly procurement scenario, relying significantly on distributed generation from rooftop solar photovoltaic generation, the cost of the 33% renewables target is 14.6% higher than in the 20% renewables reference case.
The CPUC’s 20% renewables reference case results in average electricity prices of 15.8 cents/kWh (2008 dollars) by 2020. The 33% reference case results in electricity prices of 16.9 cents/kWh. The high distributed generation case results in electricity prices of 18.1 cents/kWh.21
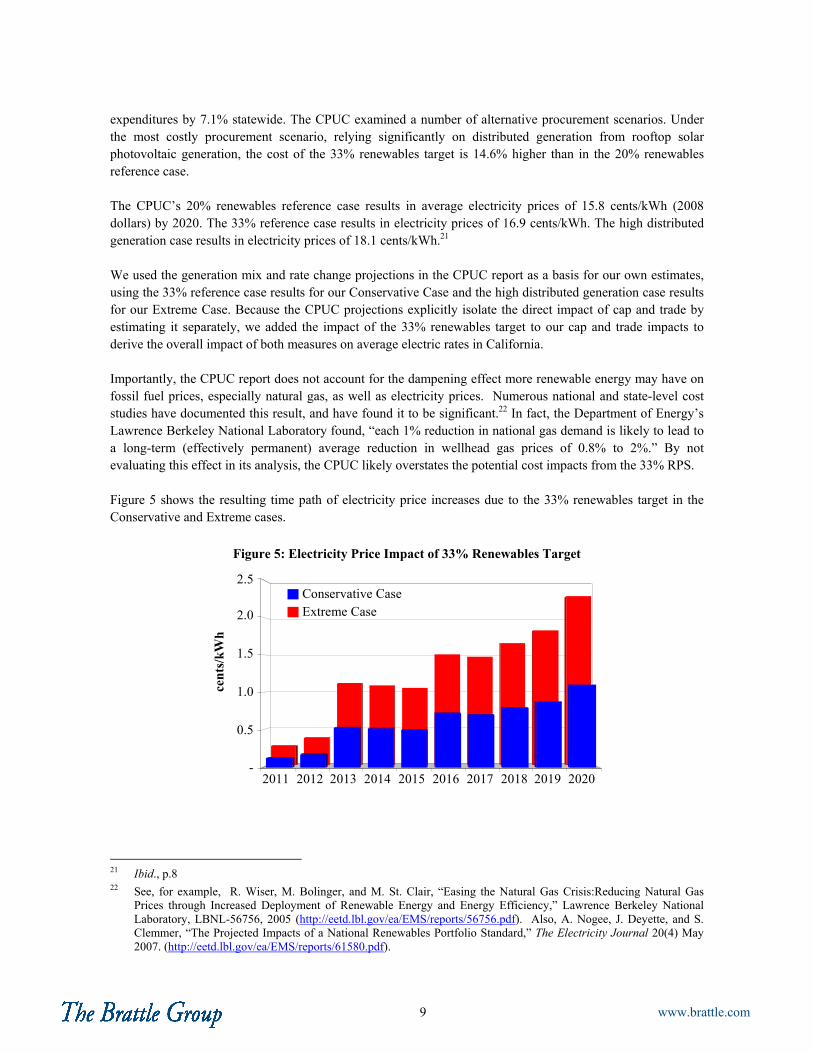
We used the generation mix and rate change projections in the CPUC report as a basis for our own estimates, using the 33% reference case results for our Conservative Case and the high distributed generation case results for our Extreme Case. Because the CPUC projections explicitly isolate the direct impact of cap and trade by estimating it separately, we added the impact of the 33% renewables target to our cap and trade impacts to derive the overall impact of both measures on average electric rates in California.
Importantly, the CPUC report does not account for the dampening effect more renewable energy may have on fossil fuel prices, especially natural gas, as well as electricity prices. Numerous national and state-level cost studies have documented this result, and have found it to be significant.22 In fact, the Department of Energy’s Lawrence Berkeley National Laboratory found, “each 1% reduction in national gas demand is likely to lead to a long-term (effectively permanent) average reduction in wellhead gas prices of 0.8% to 2%.” By not evaluating this effect in its analysis, the CPUC likely overstates the potential cost impacts from the 33% RPS.
Figure 5 shows the resulting time path of electricity price increases due to the 33% renewables target in the Conservative and Extreme cases.
Figure 5: Electricity Price Impact of 33% Renewables Target
21 Ibid., p.8 22 See, for example, R. Wiser, M. Bolinger, and M. St. Clair, “Easing the Natural Gas Crisis:Reducing Natural Gas
Prices through Increased Deployment of Renewable Energy and Energy Efficiency,” Lawrence Berkeley National Laboratory, LBNL-56756, 2005 (http://eetd.lbl.gov/ea/EMS/reports/56756.pdf). Also, A. Nogee, J. Deyette, and S. Clemmer, “The Projected Impacts of a National Renewables Portfolio Standard,” The Electricity Journal 20(4) May 2007. (http://eetd.lbl.gov/ea/EMS/reports/61580.pdf).
2011 2012 2013 2014 2015 2016 2017 2018 2019 2020-
0.5
1.0
1.5
2.0
2.5
cen
ts/k
Wh
Conservative CaseExtreme Case
10 www.brattle.com
B. NATURAL GAS PRICES
Small businesses also use natural gas directly, mostly for space heating. The impact of AB 32 on the space heating costs of small businesses depends on the impact of AB 32 on natural gas prices and on the ability of small businesses to mitigate the price increase by switching to lower cost heating fuels and/or to engage in energy efficiency measures. The impact of AB 32 on natural gas prices is straightforward: it will come through AB 32’s cap and trade program for carbon allowances. The price of carbon allowances will be directly reflected in the price of natural gas, which will be included in the cap and trade program as of 2015.
Each therm of natural gas consumed will release 0.005 metric tons of carbon dioxide into the atmosphere.23 The increase in natural gas rates due to AB 32’s inclusion of natural gas in a cap and trade program can therefore be calculated by multiplying the price of a carbon allowance by the number of allowances needed to cover the emissions from each therm of natural gas used, which in turn is equal to the fraction of a ton of CO2 emitted per therm.
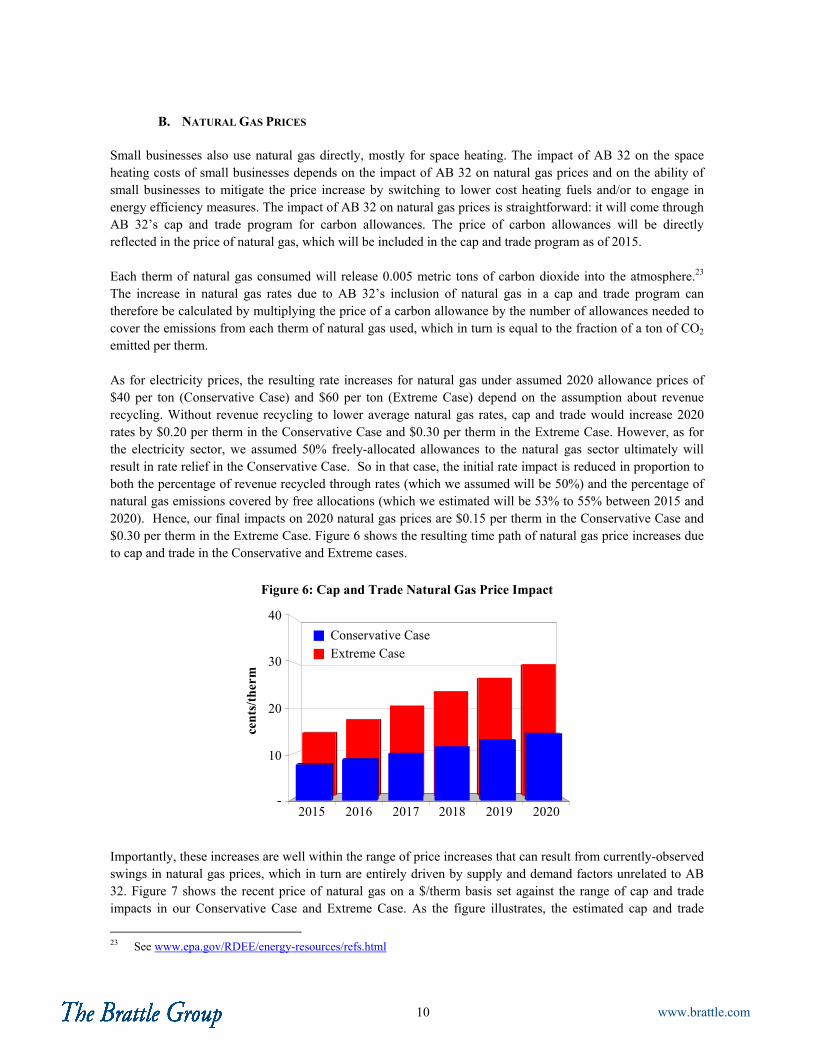
As for electricity prices, the resulting rate increases for natural gas under assumed 2020 allowance prices of $40 per ton (Conservative Case) and $60 per ton (Extreme Case) depend on the assumption about revenue recycling. Without revenue recycling to lower average natural gas rates, cap and trade would increase 2020 rates by $0.20 per therm in the Conservative Case and $0.30 per therm in the Extreme Case. However, as for the electricity sector, we assumed 50% freely-allocated allowances to the natural gas sector ultimately will result in rate relief in the Conservative Case. So in that case, the initial rate impact is reduced in proportion to both the percentage of revenue recycled through rates (which we assumed will be 50%) and the percentage of natural gas emissions covered by free allocations (which we estimated will be 53% to 55% between 2015 and 2020). Hence, our final impacts on 2020 natural gas prices are $0.15 per therm in the Conservative Case and $0.30 per therm in the Extreme Case. Figure 6 shows the resulting time path of natural gas price increases due to cap and trade in the Conservative and Extreme cases.
Figure 6: Cap and Trade Natural Gas Price Impact
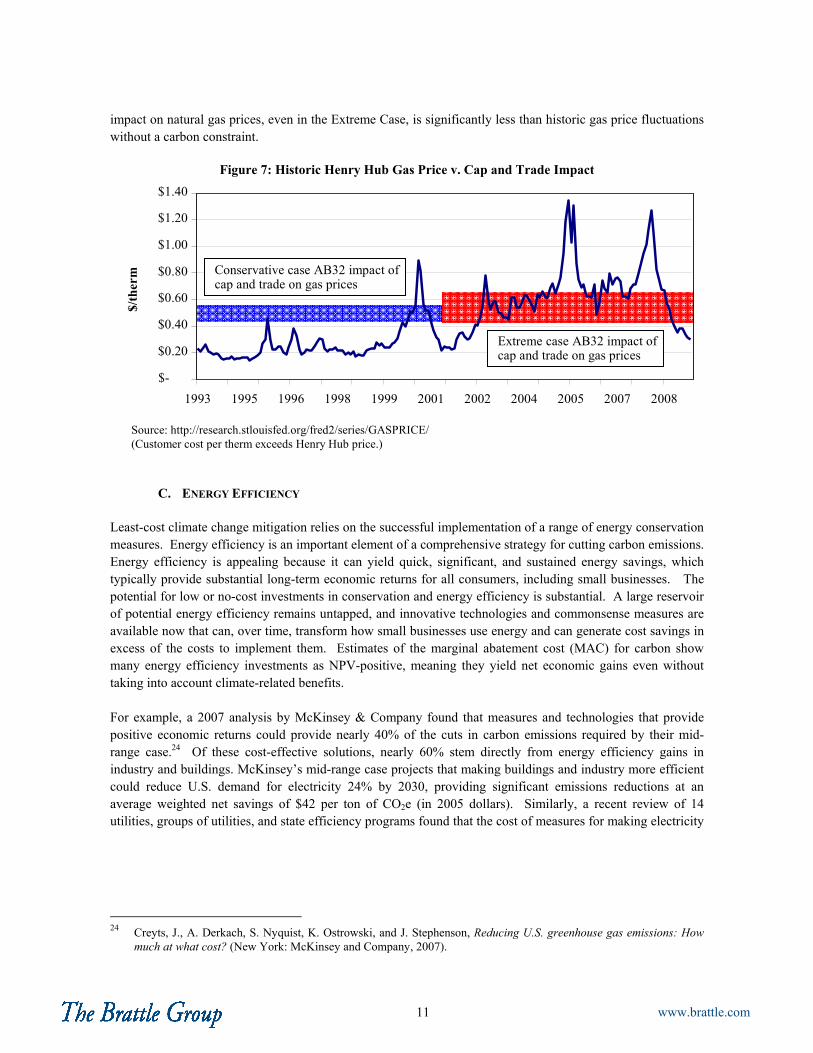
Importantly, these increases are well within the range of price increases that can result from currently-observed swings in natural gas prices, which in turn are entirely driven by supply and demand factors unrelated to AB 32. Figure 7 shows the recent price of natural gas on a $/therm basis set against the range of cap and trade impacts in our Conservative Case and Extreme Case. As the figure illustrates, the estimated cap and trade
23 See www.epa.gov/RDEE/energy-resources/refs.html
2015 2016 2017 2018 2019 2020-
10
20
30
40
cen
ts/t
her
m
Conservative CaseExtreme Case
11 www.brattle.com
impact on natural gas prices, even in the Extreme Case, is significantly less than historic gas price fluctuations without a carbon constraint.
Figure 7: Historic Henry Hub Gas Price v. Cap and Trade Impact
$-
$0.20
$0.40
$0.60
$0.80
$1.00
$1.20
$1.40
1993 1995 1996 1998 1999 2001 2002 2004 2005 2007 2008
$/th
erm
Extreme case AB32 impact ofcap and trade on gas prices
Source: http://research.stlouisfed.org/fred2/series/GASPRICE/ (Customer cost per therm exceeds Henry Hub price.)
Conservative case AB32 impact of cap and trade on gas prices
C. ENERGY EFFICIENCY
Least-cost climate change mitigation relies on the successful implementation of a range of energy conservation measures. Energy efficiency is an important element of a comprehensive strategy for cutting carbon emissions. Energy efficiency is appealing because it can yield quick, significant, and sustained energy savings, which typically provide substantial long-term economic returns for all consumers, including small businesses. The potential for low or no-cost investments in conservation and energy efficiency is substantial. A large reservoir of potential energy efficiency remains untapped, and innovative technologies and commonsense measures are available now that can, over time, transform how small businesses use energy and can generate cost savings in excess of the costs to implement them. Estimates of the marginal abatement cost (MAC) for carbon show many energy efficiency investments as NPV-positive, meaning they yield net economic gains even without taking into account climate-related benefits.
For example, a 2007 analysis by McKinsey & Company found that measures and technologies that provide positive economic returns could provide nearly 40% of the cuts in carbon emissions required by their mid-range case.24 Of these cost-effective solutions, nearly 60% stem directly from energy efficiency gains in industry and buildings. McKinsey’s mid-range case projects that making buildings and industry more efficient could reduce U.S. demand for electricity 24% by 2030, providing significant emissions reductions at an average weighted net savings of $42 per ton of CO2e (in 2005 dollars). Similarly, a recent review of 14 utilities, groups of utilities, and state efficiency programs found that the cost of measures for making electricity
24 Creyts, J., A. Derkach, S. Nyquist, K. Ostrowski, and J. Stephenson, Reducing U.S. greenhouse gas emissions: How
much at what cost? (New York: McKinsey and Company, 2007).
12 www.brattle.com
use more efficient ranged from about 1.5 cents to nearly 7 cents per kilowatt-hour saved, with a median of 3 cents per kilowatt-hour.25
However, what look like no-cost or low-cost energy efficiency options on the surface actually involve significant market, financial, and institutional barriers in practice. Many analyses of the least-cost path and price of emissions reductions ignore these barriers and thus overstate the net benefits from energy efficiency measures because there is little or no historical basis on which to forecast their future use or relative costs. Likewise, the likely future use and cost of abatement options depend on a range of mutual interactions with policy, technological, and market unknowns.
The June 2009 CPUC report we used to estimate AB 32’s impacts incorporates energy efficiency expectations. Therefore, our results reflect the same energy efficiency expectations embedded in the CPUC report. We did not separately model energy efficiency per se. Again, we used the CPUC’s 33% reference case results for our Conservative Case and its high distributed generation case results for our Extreme Case. Both cases include 16 TWh of embedded energy efficiency investments by 2020.26
In our Conservative Case, we assumed no additional energy efficiency costs or benefits in addition to those figures. Therefore, in our Conservative Case, energy efficiency has no incremental impact in addition to the cap and trade and RPS impacts we estimated, since those impacts already reflect embedded energy efficiency. In the Extreme Case, however, we make the extreme assumption that the additional $800.2 million the CPUC assumes in its aggressive policy case27 will be spent on energy efficiency but will have no additional impact on reducing electricity use (i.e., the additional efficiency investments will be entirely ineffective). Thus, our Extreme Case includes $800.2 million in incremental energy efficiency cost with no corresponding benefit. Even so, energy efficiency in the Extreme Case increases electricity prices by just 0.36 cents per kWh by 2020.28
D. TRANSPORTATION FUELS
As with electricity, the impact of AB 32 on transportation fuel prices will come from two primary sources: again, the cap and trade program for carbon allowances and the LCFS. The impact of the cap and trade program is analogous to the impact of AB 32 on natural gas prices. A $10 per ton carbon allowance price translates directly into a price increase of gasoline of approximately $0.09 per gallon.29 However, AB 32 also mandates a 10% reduction relative to a 2008 baseline in the average carbon content of California transportation fuel by 2020.
25 Hurley, D., K. Takahashi, B. Biewald, J. Kallay, and R. Maslowski, Costs and benefits of electric utility energy
efficiency in Massachusetts, prepared for the Northeast Energy Efficiency Council (Cambridge, MA: Synapse Energy Economics, 2008).
26 CPUC, “33% Renewable Portfolio Standard Implementation Analysis,” (June 2009), Table 7, p. 28. 27 33PercentRPScalculator.xls, http://www.cpuc.ca.gov/PUC/energy/Renewables/hot/33implementation.htm. 28 Form 1.1b of the California Energy Demand 2010-2020 Staff Revised Forecast projects total electricity sales of
301,385 GWh in 2020. $800.2 million / 301,385 GWh = 0.36 cents/kWh. 29 This assumes a carbon content of 0.00881 tCO2e/gallon, which in turn assumes that gasoline has no significant
renewable fuel component; a conservative assumption since current transportation fuel already includes a small amount of blended ethanol. Also, and more importantly, the LCFS will lower the carbon content of transportation fuel over time.

13 www.brattle.com
The impact of the LCFS is more difficult to estimate. We used the information in the latest ARB analysis as a
basis for developing an alternative estimate of the potential impact of the LCFS.30 The ARB collected cost
data for a range of lower-carbon substitutes to the current standard transportation fuel. These alternatives
included various types of ethanol (e.g., dry-milled, wet-milled, cellulosic, sugarcane), electricity, natural gas,
hydrogen, and more. Some such alternative fuels are available today. Some, such as cellulosic ethanol and
biofuels, are still under development.
According to the ARB analysis, low-carbon fuels will be no more expensive than traditional transportation fuels and will generate total savings of $11 billion by 2020.31 While significant technological advances in the fuels still under development may make this outcome possible between now and 2020, we took a more conservative approach and limited our analysis of California’s LCFS to currently-available alternative fuels since their costs are better understood. We excluded from our analysis potentially lower-cost alternative fuels still under development.
In addition, we assumed the prevailing price of alternative fuels used to meet the LCFS target will be determined by the most expensive alternative fuel available today. This assumption results in the highest possible cost of meeting the LCFS target. To determine the most expensive alternative fuel, we used the ARB’s estimates of total production costs for each currently-available fuel as well as its estimates of the carbon content of each fuel on the basis of a unit of energy.32 We used those estimates to calculate the implied cost of lowering carbon emissions by 1 gram of carbon for each of the eligible fuel types.
On the basis of a dollar per gram of carbon saved, Brazilian sugarcane ethanol is the most expensive option of those available with present technology.33 Therefore, we assumed the price of Brazilian sugarcane ethanol will set the price of alternative fuels used to meet the LCFS target in 2020.34 We used the relative energy content in the current California transportation fuel and in Brazilian sugarcane ethanol, the carbon content in both, and the time path for lowering the carbon content in California transportation fuels to calculate how many gallons of low-carbon fuel will be required in each year to displace gasoline to meet that year’s LCFS.
Approximately 1.48 gallons of sugarcane ethanol are needed to provide the same energy as one gallon of regular gasoline.35 Also, the carbon content of sugarcane ethanol is approximately 76% that of regular gasoline. So to achieve the LCFS goal of a 10% reduction in the average carbon content of gasoline by 2020, the blended fuel in that year will have to include 43% low-carbon fuel.
30 Proposed Regulation to Implement the Low-carbon fuel standard, Volume I, Staff Report: Initial Statement of
Reasons, California Air Resources Board, March 5, 2009. 31 Ibid., p. ES-26. 32 The ARB’s analysis compares carbon content on a grams-of-carbon/MJ basis. Since fuels have different energy
content per gallon, the comparison on a grams/MJ basis is equivalent to comparing different fuels on a gallons of gasoline equivalent (“gge”) basis rather than on a gallon to gallon basis.
33 We do not mean to imply that Brazilian sugarcane ethanol would actually be used to meet any, or all, of the LCFS requirement. Rather, we focus on the cost of Brazilian sugarcane ethanol as a focal point for deriving a most expensive option. In reality, there are many reasons why Brazilian sugarcane ethanol will not likely be a major fuel source to meet the LCFS, but that other more economical fuels will be used.
34 This is not to say California actually will use only Brazilian sugarcane ethanol to meet its 2020 target. It will not. But allowing the most expensive alternative fuel to set the price yields the most conservative possible estimate of the LCFS cost impact (i.e., it certainly overstates the cost).
35 According to ARB staff, the lower heating value (LHV) of CARBOB was assumed to be 113,300 BTU/gallon and the LHV of ethanol 76,330 BTU/gallon. In our calculations, we therefore used 76,330/113,300 = 1.48.

14 www.brattle.com
To assess the additional cost incurred by replacing roughly 43% of regular gasoline with low-carbon fuel requires an estimate of the future prices of the low-carbon fuel relative to the price path of regular gasoline. We estimated future gasoline prices in California based on two data sources: the oil price forecast included in the latest Annual Economic Outlook by the Energy Information Administration,36 and estimates of the relationship between crude oil prices and California average gasoline prices in the ARB’s preliminary analysis of the impact of the LCFS.37
The ARB analysis estimated the cost of Brazilian sugarcane ethanol, as well as the change in the cost of sugar cane ethanol as a function of the projected price of oil. While prices in competitive markets always reflect marginal production costs in theory, cost-based pricing is not the only possible outcome in practice. In fact, there is evidence that corn-based ethanol in the U.S. is priced at parity with the per-gallon price of regular gasoline, not based on production cost.38 This is so, even though ethanol has a lower energy content than regular gasoline. Assuming ethanol can be produced at costs lower than the price of regular gasoline on an energy equivalent basis (i.e., on a gge basis, not a per gallon basis), ethanol logically will be sold at a price equal to the price of gasoline per $/gge. However, historically this is not the case.
For this reason, to derive conservative estimates for the cost impact of the LCFS on California gasoline prices
in the Conservative Case and Extreme Case, we made two alternate assumptions about how the low-carbon
fuel will be priced. The Conservative Case assumes the low-carbon fuel will be priced at cost on a $/gge basis
as long as its cost exceeds the price of traditional gasoline. Alternatively, it will be priced at the price of
traditional gasoline on a $/gge basis if the price of traditional gasoline is higher. The Extreme Case assumes
the low-carbon fuel will be priced at cost on a $/gallon basis as long as that cost exceeds the price of traditional
gasoline. Alternatively, it will be priced at the price of regular gasoline on a $/gallon basis if the price of
traditional gasoline is higher.
Importantly, we consider this estimate to be very conservative, especially for the Extreme Case. This is so for at least two reasons. First, as we have said, we used the cost of the most expensive currently-available fuel option as the basis for calculating the cost of meeting California’s LCFS. Even today, lower-cost options are actually available and will be implemented, as will alternative technologies such as electric vehicles. Should technological progress proceed along the trajectories projected, even lower-cost alternatives will emerge in the next five to ten years. Second, our analysis assumes California’s LCFS exists in a vacuum, when in reality a federal standard requiring that traditional oil-based gasoline be increasingly blended with alternative fuels such as corn-based ethanol already exists. In the future, some of the same alternative fuels could meet part or all of the federal requirements, as well as California’s LCFS requirements. To that extent, any additional costs cannot be attributed to AB 32, but rather to federal regulation already in place.
As we observed with the cap and trade impacts, it also is important to note that the upper bounds for the potential impact of the LCFS on California gasoline prices would result in increases in the price of gasoline that are well within the price swings that small businesses (and everyone else) have experienced in the recent past, entirely unrelated to AB 32 and some of which may well lead to more severe increases in the future. In particular, the price of regular gasoline has been subject to substantial variation as the price of oil has
36 An Updated Annual Energy Outlook 2009 Reference Case Reflecting Provisions of the American Recovery and
Reinvestment Act and Recent Changes in the Economic Outlook, SR/OIAF/2009-03, Table 12, Energy Information Administration, April 2009,
37 Based on Proposed Regulation to Implement the Low-carbon fuel standard, Volume I, Staff Report: Initial Statement of Reasons, California Air Resources Board, March 5, 2009, Table VIII-9 and email conversation with the ARB.
38 See http://zfacts.com/p/817.html for a discussion of ethanol pricing in the United States

15 www.brattle.com
fluctuated. This report does not attempt to forecast oil prices. However, we note the oil price spike in the summer of 2008 may be a preview of future oil prices. The potential price increases due to the LCFS may well be cost-neutral in an environment in which oil prices reach or exceed 2008 peaks.
To illustrate this point, Figure 8 shows recent fluctuations in gasoline prices as well as the conservative range of price increases we project in our Conservative Case and Extreme Case.
Figure 8: Historic and Projected Gasoline Price Fluctuations
Source: EIA Annual Energy Outlook data and Brattle estimates
2000 2002 2004 2006 2008 2010 2012 2014 2016 2018 2020
-30%
-20%
-10%
0%
10%
20%
30%
% C
han
ge Y
ear
to Y
ear
BAU
Conservative Case
Extreme Case
Between 2002 and 2008 average gasoline prices increased by 128%, from $1.56/gallon to $3.56/gallon, an average price increase of 21% per year. Even without AB 32, gasoline prices are expected to grow by 117% between 2010 and 2020, or by 12% per year on average, primarily driven by the fact that oil prices are forecast to increase significantly from their current relatively low levels when compared to the high prices observed in 2008. The incremental contribution from AB 32 we estimate results in no additional price increases in our Conservative Case. In the Extreme Case, AB 32 results in a 45% increase, or 16% per year on average, still significantly lower than the annual increases observed between 2002 and 2008. This suggests that the gradual increase in gasoline prices that are expected to be observed with or without AB 32, even under extreme assumptions about AB 32’s impacts, are well within historic precedent.
E. SUMMARY OF AB 32 ENERGY PRICE IMPACTS
Based on the above analysis of the impact of AB 32 on electricity, natural gas, and gasoline, Figure 9 shows
the impacts of the prices of each of these commodities by 2020 under our Conservative Case and Extreme Case
scenarios. In the next two sections, we apply these impacts first to a cross section of small businesses on a
statistical basis, and then more specifically to the Border Grill, a small business restaurant located in Los
Angeles.

16 www.brattle.com
Figure 9: 2020 AB 32 Impacts Relative to BAU AB 32 Case Commodity Policy Conservative Extreme Electricity RPS $0.0110 $0.0230 Cap and Trade $0.0071 $0.0196 Energy Efficiency $0.0000 $0.0036 Total $0.0181 $0.0462
Gas Cap and Trade $0.1452 $0.3000
Transport Fuel Cap and Trade $0.3524 $0.5286 LCFS $0.0000 $0.9508 Total $0.3524 $1.4794
III. CALIFORNIA SMALL BUSINESSES
Figure 9 shows how AB 32 will affect the prices of electricity, natural gas, and transportation fuel under conservative and extreme case assumptions, both of which tend to overstate its effects. However, the extent to which AB 32 ultimately will affect small businesses in California depends on how these energy-related price changes will, in turn, change their revenues and costs. Likewise, the extent to which revenues and costs will be affected depends on the characteristics of California’s small businesses. Therefore, to translate the price changes in Figure 9 into small business impacts, we first considered the economic characteristics of California small businesses.
AB 32 has the potential to impact both the costs and revenues of small businesses. AB 32’s cost impacts will
mostly be determined by a combination of the absolute magnitude of the energy-related price changes, the
relative magnitude of energy-related costs, and the availability of cost-saving substitution and mitigation
strategies. The substitution possibilities depend on technology and cost characteristics of each small business,
such as its energy intensity (i.e., its energy costs as a percentage of its revenues) and its ability to save cost by
conserving energy through technology modifications. AB 32’s revenue impacts will be determined by the
ability of small businesses to pass-through the remaining energy cost increases. The ability for price increases
to cover cost increases will depend on the responsiveness of demand to price changes and on broader economic
factors, such as the level of market competition and the degree of competition with businesses outside of
California (and thus not affected by AB 32).
A. SMALL BUSINESS CHARACTERISTICS
To determine the relative importance of these potential cost and revenue impacts, we analyzed publicly-available data on California’s small business characteristics. We specifically relied on summary statistics compiled by the Small Business Administration (SBA) which categorize businesses by activity codes and report the following characteristics for each category: number of businesses, number of employees, and total payroll.39
39 See SBA, Data by State and Metropolitan Statistical Area (st03_06mi.txt), www.sba.gov/advo/research/data.html. In
addition, we requested and reviewed more-detailed data for California at the 3-digit North American Industry Classification System (NAICS) level.

17 www.brattle.com
The SBA defines small businesses as having fewer than 500 employees and sales of less than $7 million per year. According to the SBA data, there were 718,220 small businesses in California in 2006, employing a total of 7.2 million people. Figure 10 shows the breakdown of California small businesses by the number of businesses in each two-digit NAICS category. It includes a description for each of the nine categories which individually account for at least 5% of all California small businesses and which collectively account for nearly 82% of small businesses.
Figure 10: Number of California Small Businesses, 2006
Professional, Scientific, and Technical
14.4%Health Care and Social
Assistance11.2%
Construction10.6%
Retail Trade10.5%Other Services
8.8%
Accommodationand Food Services
7.7%
Wholesale Trade7.1%
Real Estate and Rental and Leasing
5.8%
Manufacturing5.6%
All Other18.4%
Source: SBA, st03_06mi.txt, http://www.sba.gov/advo/research/data.html
Figure 11 shows the breakdown of California small businesses by the number of employees at the 2-digit NAIC level. This figure includes a description of each of the nine categories which individually account for at least 5% of small business employment and which collectively account for nearly 84% of employment.
Figure 11: California Small Business Employment, 2006
Professional, Scientific, and Technical Services
9.5%
Health Care and Social Assistance
10.7%
Construction11.0%
Retail Trade9.6%
Accommodationand Food Services
11.2%
Wholesale Trade7.5%
Other Services (Except Public
Administration)6.5%
Manufacturing11.1%
All Other16.4%
Source: SBA, st03_06mi.txt, http://www.sba.gov/advo/research/data.html
Admin Support, Waste Management, and Remediation
6.4%
18 www.brattle.com
As Figures 10 and 11 show, no single small business category represents more than roughly 14% of all businesses or 11% of employment at the 2-digit NAICS level. Professional, Scientific, and Technical Services category has the largest number of small businesses, and the Accommodation and Food Services category employs the most people. The data at the 3-digit NAICS level in Figure 12 shows even more clearly how widely California’s small businesses vary in their activities.
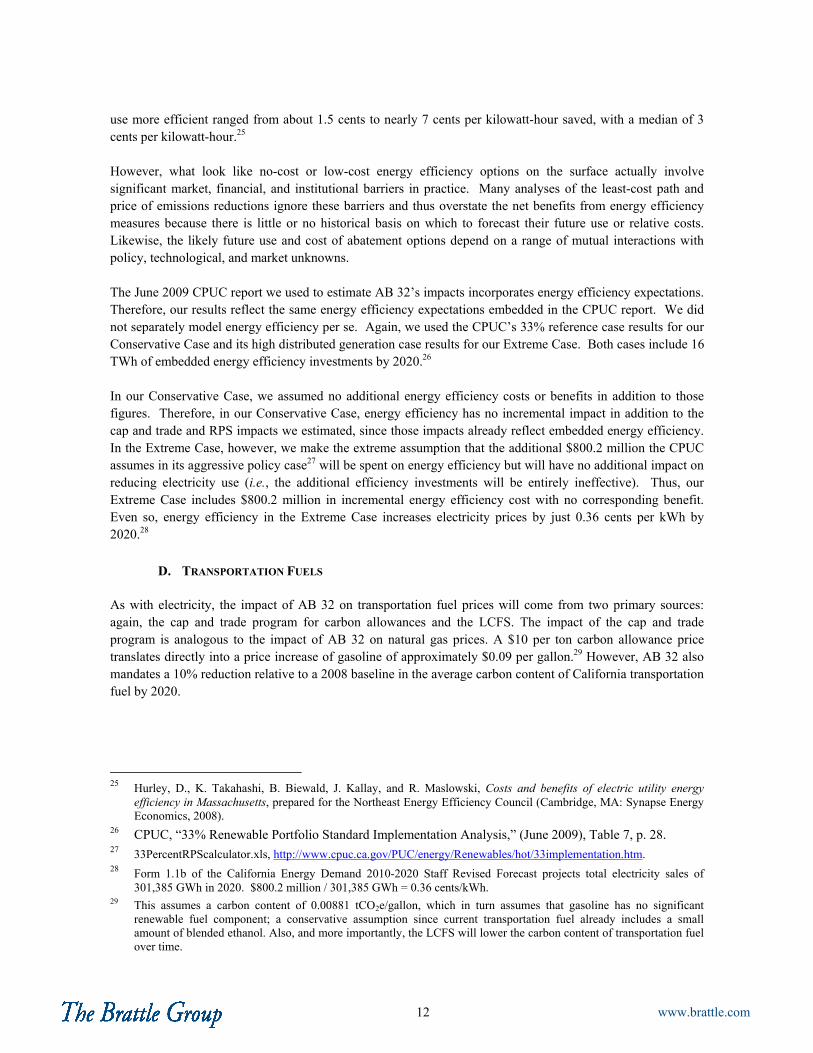
Figure 12: Employment by 3-digit NAICS Category
Category Employees % Total
Employment Food Services and Drinking Places 715,647 10.0% Professional, Scientific, Technological Svcs 683,010 9.5% Specialty Trade Contractors 539,252 7.5% Administrative and Support Services 439,472 6.1% Ambulatory Health Services 432,336 6.0%
As Figure 12 shows, only five small business categories at the 3-digit level accounted for more than 5% of the 7.2 million people employed in California in 2006. Each of the other business categories accounted for less than 5% of total employment.
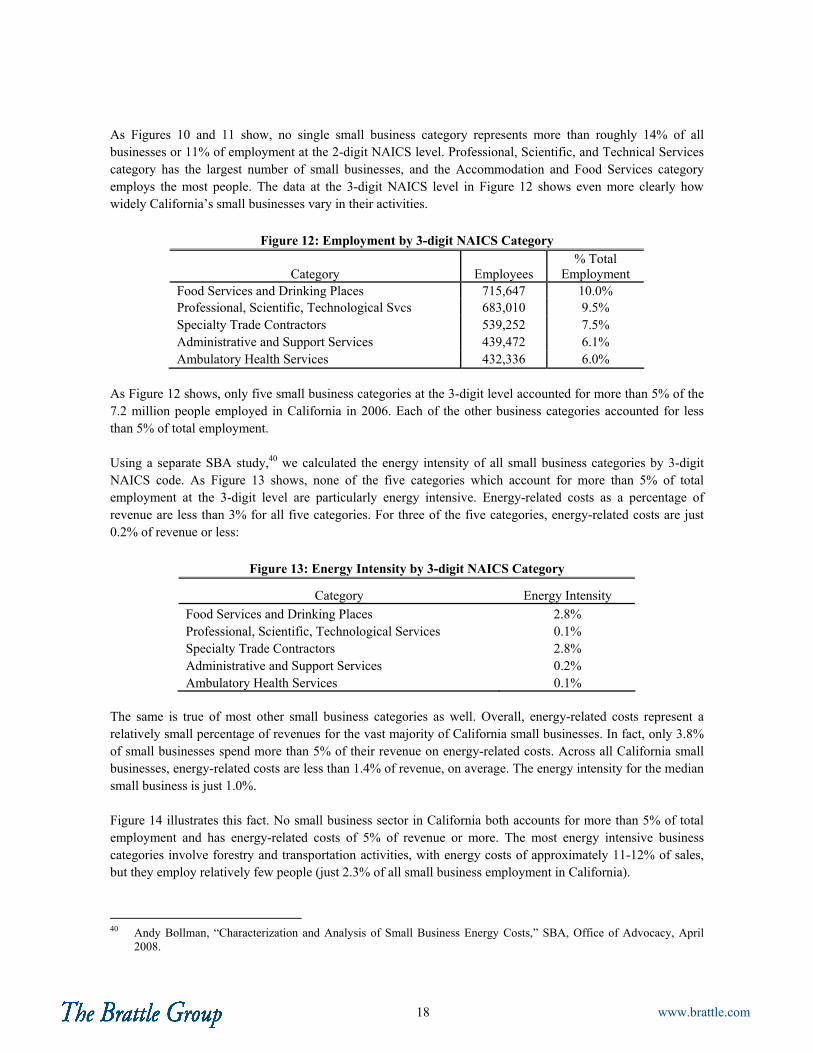
Using a separate SBA study,40 we calculated the energy intensity of all small business categories by 3-digit NAICS code. As Figure 13 shows, none of the five categories which account for more than 5% of total employment at the 3-digit level are particularly energy intensive. Energy-related costs as a percentage of revenue are less than 3% for all five categories. For three of the five categories, energy-related costs are just 0.2% of revenue or less:
Figure 13: Energy Intensity by 3-digit NAICS Category
Category Energy Intensity
Food Services and Drinking Places 2.8% Professional, Scientific, Technological Services 0.1% Specialty Trade Contractors 2.8% Administrative and Support Services 0.2% Ambulatory Health Services 0.1%
The same is true of most other small business categories as well. Overall, energy-related costs represent a relatively small percentage of revenues for the vast majority of California small businesses. In fact, only 3.8% of small businesses spend more than 5% of their revenue on energy-related costs. Across all California small businesses, energy-related costs are less than 1.4% of revenue, on average. The energy intensity for the median small business is just 1.0%.
Figure 14 illustrates this fact. No small business sector in California both accounts for more than 5% of total employment and has energy-related costs of 5% of revenue or more. The most energy intensive business categories involve forestry and transportation activities, with energy costs of approximately 11-12% of sales, but they employ relatively few people (just 2.3% of all small business employment in California).
40 Andy Bollman, “Characterization and Analysis of Small Business Energy Costs,” SBA, Office of Advocacy, April
2008.

19 www.brattle.com
Figure 14: Employment Share and Energy Intensity
Food Services
Forestry and Transportation
Industries
Professional Services
(None)
(1) HIGH Empl, LOW Intensity (2) HIGH Empl, HIGH Intensity
(4) LOW Empl, HIGH Intensity(3) LOW Empl, LOW Intensity
0.0%
2.0%
4.0%
6.0%
8.0%
10.0%
12.0%
0.0 1.0 2.0 3.0 4.0 5.0 6.0 7.0 8.0 9.0 10.0 11.0 12.0 13.0
Energy Intensity (%)
% E
mp
loym
ent
Specialty TradeContractors
However, few small businesses with energy intensities at or above 5% are exposed to a significant degree of potential competition from outside of California (i.e., not subject to AB 32). Figure 15 lists each of the low-employment, high-intensity small business categories located in the lower right-hand quadrant of Figure 14 (i.e., employment below 5% of total California small business employment and energy-related costs above 5% of revenue).
Figure 15: Low Employment, High Energy-Intensity Categories
Category Energy
Intensity (%) % Empl. Trade
Sensitive? Transport: Air 12.3 0.1% No
Transport: Water 12.3 0.0% No
Transport: Truck 12.3 1.0% Maybe
Transport: Passenger Ground Transit 12.3 0.2% No
Transport: Pipeline 12.3 0.0% No
Transport: Scenic/Sightseeing 12.3 0.0% No
Transport: Support Activities 12.3 0.6% No
Forestry and Logging 12.0 0.0% Maybe
Fishing, Hunting and Trapping 12.0 0.0% Maybe
Support Activities for Ag. and Forestry 12.0 0.1% Maybe
Couriers and Messengers 10.8 0.2% No
Utilities 7.8 0.1% No
Chemical Manufacturing 7.6 0.4% Yes
Accommodation 7.1 1.3% No
Mining (except Oil and Gas) 6.7 0.0% Yes
Paper Manufacturing 6.3 0.2% Yes
Plastics and Rubber Products Manuf. 6.3 0.6% Yes
Nonmetallic Mineral Products 5.2 0.3% Yes
Overall 9.1 5.2%

20 www.brattle.com
Collectively, these categories account for 5% of total small business employment in California, but most are not strongly trade-sensitive, so they should be able to pass-through some or all incremental energy-related costs resulting from AB 32.
B. SMALL BUSINESS ENERGY COSTS
Energy-related costs for small businesses are composed of several key components, including the use of electricity and the use of fuel for heating and transportation. Since AB 32 will affect each cost component differently, a precise analysis of the AB 32 impact on small business requires detailed information on the relative cost splits among these three energy components. Unfortunately, available information on the relative energy-related cost splits across both NAICS codes and business sizes is limited. However, some data are available on the percentage of total operating expenses spent on electricity, non-transportation fuel use, and all other utilities for most NAICS codes, and for transportation fuels for some business categories.41 We used those data to estimate electricity expenditures and non-motor fuel expenditures as a percentage of total energy expenditures for each of the 3-digit NAICS codes.
Specific information on motor fuels exists only for a small subset of NAICS codes, namely code 484 (Truck Transportation), 492 (Couriers and Messengers), and 493 (Warehousing and Storage). For all other sectors, motor fuels are not reported separately. We therefore assumed motor fuel use does not represent a significant percentage of total costs for other industry sectors.
Where no data were available for a particular category at the 3-digit NAICS level, we used the corresponding 2-digit NAICS code or the data for related industry codes to estimate the split of total energy use by category. The available data do not distinguish between small and large businesses. Therefore, our estimates implicitly assume the split between electricity, heating fuel, and transportation fuels is independent of size. We used the resulting energy-related cost splits to calculate the potential impact of AB 32 on total energy costs for each of the small business categories for which we had data.
Figure 16 shows the resulting energy price impacts in 2020 resulting from AB 32 in our Conservative Case and Extreme Case scenarios. The small business categories are listed from the most-affected sectors to the least-affected. The figure also shows the cumulative build-up of small business employment state-wide across the categories from left to right.
Under this approach, AB 32 will increase small business energy-related expenses relative to revenue by, at most, 1.3 percentage points in the Conservative Case and 3.9 points in the Extreme Case. The average estimated increases are even less: at just 0.3 percentage points in the Conservative Case and at 0.9 points in the Extreme Case. So, for example, AB 32 will increase the energy costs of small businesses in the Air Transportation sector (the most energy-intensive sector) by 1.0 percentage point, from 12.3% of revenue to 13.3%, in the Conservative Case. In the Extreme Case, energy-related costs in that sector will increase by 3.9 points (also from 12.3% of revenue) to 16.2%. However, that sector accounts for just 0.1% of small business employment in California. Also, it is not very trade-sensitive, so it should be able to pass-through cost increases.
41 Business Expenses: 2002; 2002 Economic Census, Industry Series; Us Census Bureau, BE02-001-1 (RV), issued
August 2006; see also Andy Bollman, “Characterization and Analysis of Small Business Energy Costs,” SBA, Office of Advocacy, April 2008, Table 15.

21 www.brattle.com
Figure 16: AB 32 Impacts on Energy-Related Costs as a % of Revenue
-
0.5
1.0
1.5
2.0
2.5
3.0
3.5
4.0
4.5
Air
Tra
nspo
rtT
ruck
Tra
nspo
rtPi
peli
ne T
rans
port
Tra
nspo
rt s
uppo
rtFi
shin
g/H
unti
ngC
ouri
ers/
Mes
seng
erC
hem
ical
Man
uf.
Min
ing
(exc
l.Pl
asti
cs/R
ubbe
rH
ospi
tals
Mer
chan
dise
Sto
res
Hea
vy/C
ivil
Eng
.Sp
ecia
lty T
rade
sFo
od S
ervi
ces
Oil
/Gas
Ext
ract
ion
Food
/Bev
erag
e St
ores
Food
Man
uf.
Bui
ldin
gC
loth
ing
Stor
esE
lect
rica
lC
ompu
ters
/Ele
ctro
nT
exti
le P
rodu
cts
Tra
nspo
rt E
quip
.B
uild
ing/
Gar
den
Furn
itur
eM
isc.
Furn
itur
e St
ores
Mis
c. R
etai
lA
mus
emen
tG
as S
tati
ons
Non
stor
eR
etai
lW
hole
sale
, Age
nts
Mot
orR
epai
r/M
aint
enan
ceA
mbu
lato
ry H
ealth
Cre
dit
Insu
ranc
eM
anag
emen
tR
enta
l/Lea
sing
Prof
/Sci
enti
fic/
Tec
h.Pu
blis
hing
Inte
rnet
Pub
lishi
ngIS
PsM
otio
n
Per
cen
tage
Poi
nt
Incr
ease
0%
20%
40%
60%
80%
100%
% E
mp
loym
ent
Conservative Case
Extreme Case
EmploymentCumulative Employment
As Figure 16 shows, AB 32’s estimated energy cost impact is smaller for all other sectors, and is much smaller for most sectors. For example, energy-related costs for the restaurant sector, which accounts for more of California’s small business employment than any other sector in California (10%, per Figure 12), will increase relative to revenue by just 0.3 percentage points, from 2.8% of revenue to 3.1%, in the Conservative Case. Even in the Extreme Case, its energy cost share will increase by just 0.8 points, from 2.8% of revenue to 3.6%. This sector is not trade-sensitive and should be able to pass-through this relatively modest cost increase.
Notably, all sectors for which we estimate AB 32 will increase energy-related costs relative to revenue by more than 1 percentage point, even in the Extreme Case, (i.e., all sectors to the left of the Specialty Trades sector in Figure 16) account for less than 7% of small business employment in California. And as we saw in Figure 15, most such sectors are not trade-sensitive and should be able to pass-through cost increases.
Even this relatively modest impact is probably significantly overstated, for at least two reasons:
First, our analysis assumes small businesses take absolutely no mitigating action to counter AB 32’s energy-related cost impact. In reality, whenever input prices increase, individuals and businesses have some degree of choice between simply paying higher prices and at least partially offsetting the price increase by switching to lower-cost substitutes. In the case of increased electricity, natural gas, and transportation fuel costs, possible mitigating steps include investing in more energy efficient equipment or optimizing the use of energy by changing use patterns. Some of this mitigation will take place completely without any new state or federal policies. In the case of AB 32, it is also reasonable to expect complementary policies to provide additional financial support for certain types of mitigation. The combined effect will be the ability of small businesses to at least partially offset higher energy costs resulting from AB 32. However, because we do not model such complementary measures explicitly, the estimated impacts we report, even in our Conservative Case, are overstated.
Second, the vast majority of energy-intensive small businesses in California are not particularly trade-sensitive;
they are not engaged in activities subject to competition from similar businesses outside of AB 32’s influence.
To illustrate this fact, assume California is a closed economy (i.e., no trade exists between California and any
entity outside of the state). In that hypothetical, AB 32 will increase energy prices to all businesses in the state.

22 www.brattle.com
When the costs to all businesses increase, at least some of the cost increase is passed-through to final
consumers through increases in the prices of various products and services. The extent to which price increases
can be passed-through depends on the price elasticity of demand (i.e., the degree with which quantities
demanded decrease as prices increase). But the relevant elasticity is not how many fewer pizzas, and more
hamburgers, will be sold as pizza prices increase and hamburger prices remain constant (this is the typical
elasticity economists think of), but rather how pizza and hamburger sales will both change as both prices
increase relative to foods with lower energy life-cycle content.
California small businesses exposed to relatively elastic demand may be able to pass-through only a small portion of a cost increase resulting from AB 32. However, in most cases, at least some portion of the additional costs will be passed-through with minimal or no impact on business performance. After all, passing-through costs only pays if revenue increases because the higher price on each sale more than compensates for lower sales at the higher price.
Overall, our analysis clearly estimates only very modest dollar and employment impacts of AB 32 on most California small businesses. Our estimates of AB 32’s overall impacts are likely very conservative (i.e., overstated) because we intentionally made conservative assumptions in our Conservative Case and Extreme Case scenarios, and we assumed no mitigating steps in response, such as retail price increases or energy use reductions. AB 32’s potential effects will be more pronounced for a few business categories, which represent only a small percentage (less than 7%) of California’s small business employment. Such impacts should not be trivialized, nor should they be sensationalized. The best policy approach to deal with such sectors is for California to target mitigation measures on the few small business sectors most affected by higher energy prices and/or least able to pass-through cost increases otherwise resulting from AB 32.
IV. BORDER GRILL — A CASE STUDY
As the sector-level analysis in the previous section shows statistically, AB 32 will have relatively modest
economic effects on all but a tiny fraction of small businesses in California. However, since the statistical
approach inherently reduces the question to AB 32’s estimated impacts on average, we also performed a more
detailed case study of precisely how, and to what extent, AB 32 will affect a typical small business.
In this section, we concretely illustrate, using a case study approach, how AB 32 might affect energy-related costs, energy use, and the resulting performance of an actual small business in California under the same Conservative Case and Extreme Case scenarios.
A. SELECTING A TARGET SMALL BUSINESS
For this case study, we deliberately selected a small business from a sector with a sizeable share of employment and above-average energy intensity. These selection criteria make the case study both conservative and relevant. The case study conservatively estimates AB 32’s cost impact on small business (i.e., it overstates the cost impact) because the target business, having above-average energy intensity, will be more affected by energy-related price increases than will the average California small business. The case study is relevant because we ultimately selected a target business from the restaurant sector, which employs more

23 www.brattle.com
people in California than any other small business category, accounting for 10% of small business employment statewide (per Figure 12).42
Figure 17 lists all of the small business categories in California with energy intensities of approximately 1.5% (just above the statewide average) to 3% (twice the average). The restaurant sector tops the list, with average energy-related costs at 2.8% of revenue. Since the restaurant sector also tops the list of small business employment in California, it was an obvious candidate for this case study.
Figure 17: Above-Average Energy Intensities
Category Energy Intensity
Food Services and Drinking Places 2.8% Specialty Trade Contractors 2.8% Support Activities for Mining 2.7% Wood Product Manufacturing 2.4% Petroleum/Coal Products Manuf. 2.4% Oil and Gas Extraction 2.4% Food and Beverage Stores 2.1% Fabricated Metal Product Manuf. 1.9% Food Manufacturing 1.9% Beverage/Tobacco Product Manuf. 1.9% Construction of Buildings 1.6%
Within the restaurant sector, we identified and selected an upscale, Mexican restaurant located in Los Angeles
named the Border Grill. The restaurant is well-established, having been in operation for nearly 20 years. It is a
limited liability partnership that meets the SBA definition of a small business on both the size and sales
dimensions: it employs 79 people and its annual revenues are well under $7 million. The Border Grill
provided us with extensive and detailed information on its physical premises, equipment and lighting, energy
use and cost, and financial performance. While we had full access to detailed information for purposes of
conducting this case study, we are sensitive to its proprietary nature, and we therefore do not disclose any such
information in this report.43
To estimate the impact of AB 32 on the Border Grill under our Conservative Case and Extreme Case
scenarios, we first develop a simple cash flow model to project its revenues and expenses from now through
the year 2020 under BAU conditions. Specifically, we project the restaurant’s expected future cash flows,
which we calculated for each year as total revenue less operating expenses and taxes, and adjusted for
depreciation and capital expenditures (capex).
42 The case study profiles the Border Grill in Los Angeles. For more information on the Border Grill, see
http://www.bordergrill.com/bg_sm/bg_smsus.htm. We have no prior or ongoing knowledge of, or relationship with, the Border Grill beyond the preparation of this case study. We appreciate its willingness to participate.
43 At the Border Grill’s very reasonable request, we present the case study results on a “percentage of revenue” basis to protect the restaurant’s proprietary information.

24 www.brattle.com
B. THE BAU BASELINE
We base the BAU scenario mostly on historical financials for some or all of the years between 1997 through 2008. For instance, we project revenue and wages to grow at their historic average rates. We project the cost of sales, depreciation, and non-energy capex to grow in proportion to revenue to maintain historic average ratios. And we project overhead costs to grow at inflation (assumed to be 2.5%) plus 1% per year, also based on its historic average.
We separately project the restaurant’s energy-related costs, which include electricity, natural gas for heating, and capex on, and cost savings from, energy efficiency upgrades. (The restaurant does not purchase transportation fuel.) In the BAU baseline, we conservatively assume no energy efficiency measures. We project electricity and natural gas costs grow based on changing both usage and rates derived from past utility bills. We assume electricity use will increase at 1.5% per year going forward based on the actual increase in use from 2008 to 2009, and electricity rates will increase at the annual growth rates used in the base case of the CPUC RPS model, ranging from 0% to 3% per year and averaging 1.5%. We assume natural gas use will remain constant despite a slight downward trend in past usage, while gas prices increase with Henry Hub forward prices (for procurement) and inflation (for transmission).
C. CONSERVATIVE CASE AB 32 IMPACTS
With the BAU baseline in place, we developed alternative cash flow projections for the Conservative Case and Extreme Case AB 32 impacts using the estimated electricity and natural gas rate increases previously described in detail for California as a result of the cap and trade scheme and RPS.
We expect the Border Grill to take some steps to mitigate energy cost increases resulting from AB 32.
Therefore, in the Conservative Case, we assume the Border Grill will invest in certain energy efficiency
measures. We analyze the existing energy use equipment and calculated the net cost (i.e., replacement cost net
of energy cost savings) of replacing existing equipment with more energy efficient versions. Most of the
restaurant’s energy-intensive equipment is less than five years old, including the HVAC, oven, range, fryer,
broiler, freezer, holding cabinet, ice machine, and so on. Replacing relatively new equipment with more energy
efficient models will result in significant additional costs and pay-back periods of ten years or more in the
absence of additional incentives. So we assume no replacement of such equipment.
However, the Border Grill’s nine refrigerators are over 10 years old, thus nearing the end of their expected
lives. In addition, replacing some of the incandescent lighting with energy efficient bulbs will result in
relatively immediate pay-back. So in the Conservative Case, we assume the restaurant will replace half of its
lighting with compact fluorescent lighting in 2009 and the other half in 2010. We also assume it will replace its
refrigerators with more energy-efficient models in 2012, financed over a five-year period at no interest cost. In
each instance, the Conservative Case deviated from the BAU baseline by the amounts of the corresponding
capex as well as the reduced electricity usage and corresponding cost savings.
Next, we apply the AB 32 price impacts to the BAU energy prices. By our estimates, AB 32 will increase electricity rates in the Conservative Case over the BAU rates by an estimated 0.1 cent per kWh (less than 1%) in 2011 (the first year of the RPS) and by 1.8 cents per kWh (12%) by 2020 due to both the RPS and cap and trade. Gas rates in the Conservative Case will increase by 15 cents per therm (12%) by 2020.
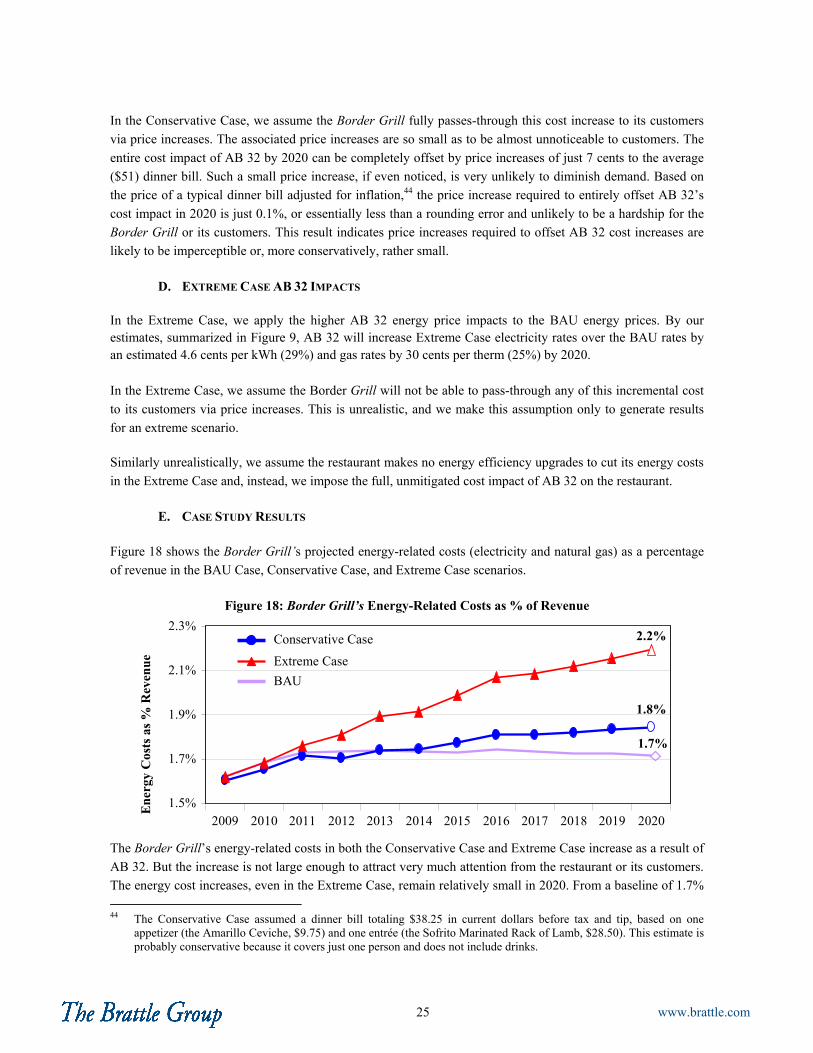
25 www.brattle.com
In the Conservative Case, we assume the Border Grill fully passes-through this cost increase to its customers
via price increases. The associated price increases are so small as to be almost unnoticeable to customers. The
entire cost impact of AB 32 by 2020 can be completely offset by price increases of just 7 cents to the average
($51) dinner bill. Such a small price increase, if even noticed, is very unlikely to diminish demand. Based on
the price of a typical dinner bill adjusted for inflation,44 the price increase required to entirely offset AB 32’s
cost impact in 2020 is just 0.1%, or essentially less than a rounding error and unlikely to be a hardship for the
Border Grill or its customers. This result indicates price increases required to offset AB 32 cost increases are
likely to be imperceptible or, more conservatively, rather small.
D. EXTREME CASE AB 32 IMPACTS
In the Extreme Case, we apply the higher AB 32 energy price impacts to the BAU energy prices. By our estimates, summarized in Figure 9, AB 32 will increase Extreme Case electricity rates over the BAU rates by an estimated 4.6 cents per kWh (29%) and gas rates by 30 cents per therm (25%) by 2020.
In the Extreme Case, we assume the Border Grill will not be able to pass-through any of this incremental cost
to its customers via price increases. This is unrealistic, and we make this assumption only to generate results
for an extreme scenario.
Similarly unrealistically, we assume the restaurant makes no energy efficiency upgrades to cut its energy costs
in the Extreme Case and, instead, we impose the full, unmitigated cost impact of AB 32 on the restaurant.
E. CASE STUDY RESULTS
Figure 18 shows the Border Grill’s projected energy-related costs (electricity and natural gas) as a percentage
of revenue in the BAU Case, Conservative Case, and Extreme Case scenarios.
Figure 18: Border Grill’s Energy-Related Costs as % of Revenue
En
ergy
Cos
ts a
s %
Rev
enu
e
BAU
Conservative Case
Extreme Case
1.7%
1.8%
2.2%
1.5%
1.7%
1.9%
2.1%
2.3%
2009 2010 2011 2012 2013 2014 2015 2016 2017 2018 2019 2020
The Border Grill’s energy-related costs in both the Conservative Case and Extreme Case increase as a result of
AB 32. But the increase is not large enough to attract very much attention from the restaurant or its customers.
The energy cost increases, even in the Extreme Case, remain relatively small in 2020. From a baseline of 1.7%
44 The Conservative Case assumed a dinner bill totaling $38.25 in current dollars before tax and tip, based on one
appetizer (the Amarillo Ceviche, $9.75) and one entrée (the Sofrito Marinated Rack of Lamb, $28.50). This estimate is probably conservative because it covers just one person and does not include drinks.

26 www.brattle.com
of revenue, energy-related costs increase to 1.8% in the Conservative Case and 2.2% in the Extreme Case. As
we also observed in the statistical analysis, even extreme estimates of energy costs under AB 32 remain very
small in relation to revenue. So we suspect the Border Grill, and most California small businesses, actually
will be able to pass-through most or all of its increased energy costs with little or no difficulty.
Similarly notable is the fact that the potential cost impact of AB 32, even in the Extreme Case, is well within
the range of year-to-year variation in the Border Grill’s historic energy costs. Figure 19 shows historic and
projected changes in the restaurant’s energy costs year-by-year to 2020. It shows, the Border Grill has
experienced year-to-year swings in energy costs of similar or greater magnitude than the estimated AB 32 cost
increases relative to the BAU projection.
For example, the Border Grill’s monthly bills show a 51% decrease between 2008 and year-to-date 2009 in the
average rate the restaurant pays for natural gas. That accounts for the noticeable drop in energy costs in 2009
on Figure 19. To imagine the estimated cost impact of AB 32 would have a material detrimental effect on the
Border Grill’s business assumes the restaurant will be unable to meet future cost changes of far less magnitude
than the changes it already internalizes. Even making the drastic assumption that the Border Grill will be
unable to pass-through any AB 32 cost increases (again, a harsh assumption which we make in the Extreme
Case), the restaurant will continue to generate a sustainable level of profit and free cash over the entire forecast
period.
Figure 19: Historic and Projected Border Grill Energy Costs
2002
2003
2004
2005
2006
2007
2008
2009
2010
2011
2012
2013
2014
2015
2016
2017
2018
2019
2020
-15%
-10%
-5%
0%
5%
10%
15%
% C
han
ge in
Cos
t
BAU
Conservative CaseExtreme Case

27 www.brattle.com
V. CONCLUSIONS
In this paper, we have developed a pragmatic, simple, yet powerful approach to estimate the potential impact of AB 32 on small businesses in California. The precise impacts are difficult to estimate, both because detailed implementation of AB 32 is still under development and because estimating future impacts involves inherent uncertainties. Our approach yields a reliable first-order approximation of the impacts of AB 32 both in terms of magnitude and direction.
Our basic conclusion is that the incremental impact of AB 32 on the average small business in California is likely to be relatively small. The main reasons for this conclusion are:
Total energy-related costs represent only a small fraction of total costs (less than 2%) for the
majority (74%) of small businesses in California and will remain small even if our Extreme Case
predictions about energy price increases attributable to AB 32 are realized.
The projected increases in electricity, gas, and transportation fuel costs by 2020, even in the
Extreme Case, are significantly lower than increases in the same rates which have occurred in
recent history and which were entirely unrelated to climate change regulation. Small businesses
routinely deal with price increases of similar and larger magnitudes. Moreover, some of the costs
of reducing greenhouse gas emissions may serve as a hedge against future increases in the
underlying commodity prices.
Small businesses in California will not have to absorb the full effect of potential energy price
increases resulting from AB 32.
< At least some part of the revenue from emissions allowances created under AB 32’s cap and
trade program likely will be recycled through regulated entities, passing on the associated
benefits through some form or rate relief to utility customers, including commercial
ratepayers.
< In addition, small businesses will have the ability to at least partially offset energy cost
increases by investing in energy efficiency measures that become economic under AB 32.
Small businesses will have access to additional subsidies to lower the cost of implementing
such efficiency measures.
< Finally, most small businesses in California are operating in sectors which do not face
significant competition from businesses outside of AB 32’s reach. As a result, they will be
able to pass-through to consumers in the form of higher prices at least some of any increased
cost. The degree to which cost increases will be passed-through depends on the price
responsiveness of demand. For most of California’s small businesses, providing relatively
local services, this ability will exist by the very nature of their markets.
AB 32 does not operate in isolation. There are now significant efforts underway at the federal
level to impose greenhouse gas reductions and related emissions targets very similar to those
under AB 32. To the extent federal regulations are already implemented, or are likely to be
implemented, by the time AB 32 takes full effect, its impact will be reduced to price increases
above and beyond those attributable to evolving federal rules absent AB 32. Also, federal
legislation similar to AB 32 will further reduce the threat of competition from entities not outside
of its scope.

28 www.brattle.com
For all of these reasons, and based on the underlying analysis summarized in this report, we therefore conclude that the average incremental impact of AB 32 on small businesses in California will be modest. Its impact will vary, of course. Some specific small businesses and sectors will be affected, more directly and/or more significantly, than the average. However, new business opportunities are also at least as likely to emerge as a direct result of climate change regulations such as AB 32, and many of those opportunities will benefit small businesses. Such spillover effects on the economy and on local employment are not included in our rather conservative analysis.
Even if small businesses do nothing to decrease their energy use through energy efficiency or other means over the next ten years, our results show California’s policies to reduce global warming pollution will have only a very small economic impact on small businesses.