Embed Size (px)
Citation preview
The Economic Benefits and Fiscal Impact of Parks and Open Space in Nassau and Suffolk Counties, New York
A Report by The Trust for Public Landfor the Long Island Community Foundation and the Rauch Foundation
Conservation FinanCe Programthe trust For PubliC land
33 union street, FiFth Floorboston, ma 02108
617.367.6200
national oFFiCe the trust For PubliC land
101 montgomery street, suite 900san FranCisCo, Ca 94104
415.495.4014
tpl.org

Cover Photos: Left: Jerry Monkman; Right: Alan Chin

The Economic Benefits and Fiscal Impact of Parks and Open Space in Nassau and Suffolk
Counties, New York
A Report by The Trust for Public Landfor the Long Island Community Foundation
and the Rauch Foundation
© 2010 The Trust for Public Land

2 The Economic Benefits and Fiscal Impact of Parks and Open Space in Nassau and Suffolk Counties, New York
To the Residents of Long Island,
Long Island’s parks and open space are a regional treasure. Its 1,180 miles of shoreline and 60,000 acres of trails, gardens, farmlands, woodlands, waterways, day camps, ball fields, and playgrounds provide us with recreation, relaxation, beauty, peace, and wonder.
Long Islanders have always valued these resources but usually as intangible assets. Their material, economic benefits have gone unexamined and largely overlooked. We typically—but uncritically—think of open space as a sort of luxury, for which we have agreed to pay a rather handsome price.
The study now before you contradicts that perception, revealing Long Island’s parkland and open space not as an economic drain but as a significant driver.
The study, commissioned by the Long Island Community Foundation and the Rauch Foundation, and prepared by The Trust for Public Land, quantifies for the first time the fiscal impacts of parks and open space over a wide range of activity. It identifies direct economic benefits to the region amounting to $2.74 billion per year, in areas ranging from boosting tourism and reducing government costs to improving air quality and public health.
As Long Island confronts the imminent build-out of its last remaining unprotected open space, fateful decisions must soon be made. These decisions must be based on fact, not myth. Decision makers and the public must be fully aware of the true economic picture revealed in these findings.
And more. The current research does not assess the effect of future changes. Additional study is needed to determine how development of currently unpreserved land on the East End would impact our tourism, farming, and second-home industries.
Only upon a foundation of broad understanding based on solid information can we succeed in building a better future for our region.
Sincerely,
Nancy R. Douzinas David M. Okorn President Executive DirectorRauch Foundation Long Island Community Foundation
3The Economic Benefits and Fiscal Impact of Parks and Open Space in Nassau and Suffolk Counties, New York
Introduction 4
Executive Summary 7
Reduced Cost of Government Services 13
Fiscal Impact Analysis 13
Enhanced Property Value 18
Recreation and Tourism 21
Park Tourism 21
Direct Use Value 23
Helping to Promote Human Health 25
Agriculture 27
Government Cost Savings 29
Protection of Drinking Water 29
Reducing the Cost of Managing Stormwater in Urban Areas 32
Air Pollution Removal by Vegetation 35
Additional Benefits 38
Boosting Local Economies by Attracting Businesses and Residents 38
Supporting Commercial Fishing and Shellfishing 38
Sequestering Carbon 38
Mitigating Hazards 38
Stimulating Community Cohesion 38
Saving Energy 39
Conclusion 40
Resources Related to the Economic Value of Parks and Open Space 41
Appendix 44
Table of Contents

4 The Economic Benefits and Fiscal Impact of Parks and Open Space in Nassau and Suffolk Counties, New York
The future of land conservation on Long Island is uncertain. This comes despite voters’ long understanding of the importance of parks and open space and their approval of nearly every land acquisition measure put before them. According to the Long Island Index, if the rate of land acquisition does not pick up, the region will fall short of its goal to protect an additional 35,000 acres of environmentally significant open space and working farmland. Exacerbating the potential shortfall are the calls to divert existing voter-directed funds.
Land conservation is an integral element of the Long Island economy—mirrored in voter sup-port—but a reliable assessment of the true costs and benefits of land conservation is needed. Currently, there is some debate on the local economic impact of land acquisition on Long Island. In 2008, the Long Island Economic and Social Policy Institute at Dowling College conducted a study of the costs of land acquisition by local municipal governments in Suffolk County, New York. However, this study neglected to consider the costs of alternative land uses or the economic benefits generated by conserved lands. A complete analysis of the net costs of alternative land uses and the economic benefits provided by parks and open space is needed to fully understand the impact of land acquisition on the Long Island economy. To address this need, the Long Island Community Foundation and the Rauch Foundation asked The Trust for Public Land (TPL) to conduct a thorough and transparent analysis of the economic benefits and fiscal impact of parks and open space in Nassau and Suffolk Counties on Long Island. This report definitively estimates the total economic benefits and fiscal impacts of parks and protected open space in the communi-ties of these two counties. It does so by calculating the following:
• Reduced cost of government services. This report evaluates both property tax revenues and expenditures for government services associated with residential, agricultural, commercial, industrial, and vacant properties and parks and open space to determine the real fiscal impacts.
• Recreation and tourism. Parks and open space are a key component of Long Island’s recreation and tourism industry. This report determines visitor spending and sales tax generated in the local economy because of parks, as well as the direct use value and the health benefits gained by residents recreating in parks.
• Agriculture industry. Farmland preservation helps sustain the agriculture industry on Long Island. This report considers the market value of Long Island’s agriculture industry and the spending of agritourism visitors.
• Government cost savings. Parks and open space provide services for free that would otherwise have to be provided by local governments. This report estimates cost savings from clean drinking water, stormwater management, and air pollution removal.
• Additional benefits. Parks and open space provide a number of other important economic benefits that cannot be quantified at this time; they are discussed qualitatively.
Introduction

5The Economic Benefits and Fiscal Impact of Parks and Open Space in Nassau and Suffolk Counties, New York
TPL is extremely well positioned and qualified to conduct a complete analysis of the economic benefits and fiscal impacts of Long Island’s parks and open space. TPL conserves land for people to enjoy as parks, gardens, and other natural places, ensuring livable communities for generations to come. TPL has a long history of estimating the economic benefits of parks, trails, greenways, open space, and farmland preservation in reports such as the following:
• The Economic Benefits of Parks and Open Space, 1999
• Community Choices: Thinking Through Land Conservation, Development, and Property Taxes in Massachusetts, 1999
• The Benefits of Parks, 2005
• The Economic Benefits of Land Conservation, 2007
• Quantifying the Greenhouse Gas Benefits of Urban Parks, 2008
• Conservation: An Investment That Pays, 2009
• Measuring the Economic Value of a City Park System, 2009
• A Return on Investment: The Economic Value of Colorado’s Conservation Easements, 2010
TPL has also published extensively on the economic benefits of urban parks across the county. TPL contracted with six economist teams to construct methodologies for how green space makes for successful communities and is putting these methodologies to work in cities. Research has been conducted in Philadelphia, Pennsylvania; Boston, Massachusetts; Sacramento and San Diego, California; Washington D.C.; Wilmington, Delaware; Denver, Colorado; Charlotte, North Carolina; and Seattle, Washington.
What Is the Difference between Parks, Open Space, and Protected Open Space?
For the sake of clarity, in this report we make distinctions between parks, open space, and protected open space. These definitions may be slightly different from those used in past open space publications (e.g., in this report open space includes unprotected farmland); however, they are necessary for the economic and fiscal analysis of parks and open space on Long Island.
Parks are defined as all publicly accessible recreation areas (not including schools). Publicly owned and managed lands are included as parks. National wildlife refuges, public golf courses, state-owned and state-managed tidal wetlands, and rare cases of privately held parks that are publicly accessible are also included.
Open space is defined as undeveloped publicly owned land that is not publicly accessible (e.g., utility corridors) and privately owned natural lands and farmland.
Protected open space is defined as conservation, agricultural, and historic preservation easements held by any government entity or land trust.

6 The Economic Benefits and Fiscal Impact of Parks and Open Space in Nassau and Suffolk Counties, New York
§̈ ¦91
§̈ ¦95
§̈ ¦84
[\̂ 495
£ ¤7
£ ¤1
£ ¤1
UV101ST11
2
ST135
UV27
ST454
UV25
UV27
UV25
ST347
UV24ST11
0
UV27[\̂ 49
5
UV97
[\̂ 684
[\̂ 287
ST102
ST25A
ST27A
[\̂ 395
Suff
olk
C
ount
y
Nas
sau
C
ount
y
Con
nect
icut
New
Yor
k
Long
Isl
and
Soun
d
Atla
ntic
Oce
an
Blo
ck I
slan
d So
und
Gre
at P
econ
icB
ay
Gre
at S
outh
Bay
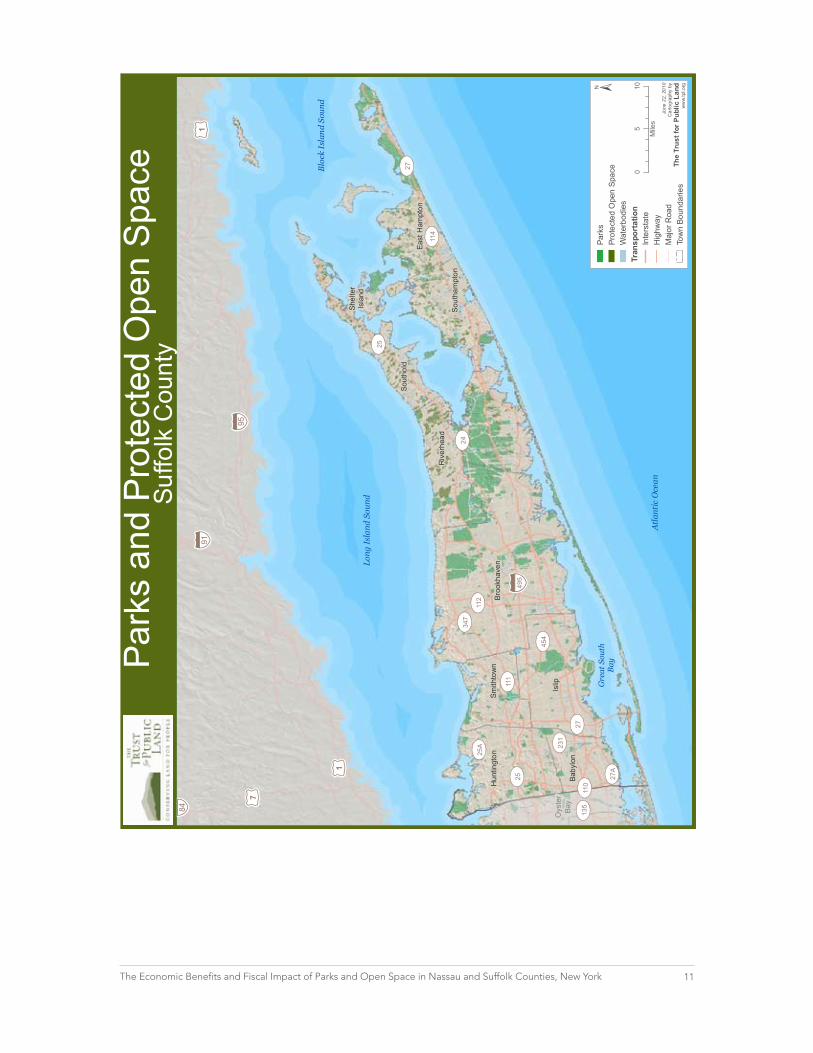
Park
s an
d Pr
otec
ted
Ope
n Sp
ace
Long
Isla
nd, N
ew Y
ork
±
June
22,
201
0C
arto
grap
hy b
yTh
e Tr
ust f
or P
ublic
Lan
dw
ww.
tpl.o
rg
Park
sPr
otec
ted
Ope
n Sp
ace
Wat
erbo
dies
Tran
spor
tatio
nIn
ters
tate
Hig
hway
Cou
nty
Line
05
10
Mile
s

7The Economic Benefits and Fiscal Impact of Parks and Open Space in Nassau and Suffolk Counties, New York
Long Island’s parks and open space provide enjoyment, recreation, cost savings, and local revenues, supplying quantifiable economic benefits worth over $2.74 billion a year. These benefits include cost savings provided by functioning natural systems, such as clean drinking water, and direct revenue generation from Long Island’s tourism and farming industries.
Parks and open space reduce the cost of government services, such as schools, police, roads, and other public services associated with residential development. When both property tax revenues and expenditures for services are taken into account, it becomes clear that residential development is more costly to local governments than are parks and open space.
Parks and open space also contribute to other important economic benefits that elude quantification at this time. Long Island’s fishing and shellfishing industry, ability to attract businesses, and quality of life are dependent on its parks and open spaces.
While this report is a good first step in understanding the economic benefits of currently protected parks and open space, additional research is needed to determine the economic losses that would be incurred from the development of currently unprotected open space.
Summary of Economic Benefits
Decision makers must consider not just the costs of protecting parks, open space, and farmland but also the real economic and fiscal benefits provided by these lands.
Reduced Cost of Government Services
• TodeterminethefiscalimpactoflanduseonLongIsland,decisionmakersmustconsiderbothproperty tax revenues and expenditures for necessary government services (e.g., schools, police, roads, etc.). They will discover that parks and open space actually save local governments money by reducing the demand for expensive public services.
• Residentialdevelopment(exceptinsecond-homecommunities)requiresmoreingovernmentservices than it brings in property taxes—on average, $33,000 per acre per year. Agricultural land costs on average $2,960 per acre (in Suffolk County), while parks and open space cost on average just $3,750 per acre.1
• Parksandprotectedopenspaceincreasethevalueofnearbyresidentialpropertiesbecausepeople like living close to parks and protected open spaces and are willing to pay for the privilege. Parks and protected open space raise the value of nearby residential properties by $5.18 billion (2009) and increase property tax revenues by $58.2 million a year (see Table 1).
Executive Summary
1 All figures are rounded to three significant digits unless otherwise noted.

8 The Economic Benefits and Fiscal Impact of Parks and Open Space in Nassau and Suffolk Counties, New York
Recreation and Tourism
• TourismisoneofLongIsland’slargestindustries,producingrevenuesof$4.7billionayear. Parks and open space contribute to this industry.
• Approximately28percentofvisitors(i.e.,nonresidents)toLongIsland—5.1millionperyear—come for the purpose of visiting parks, such as beaches, heritage sites, and so on. These visitors spend $615 million annually in the local economy and generate $27.3 million in sales tax.
• ResidentsalsoenjoyLongIsland’sparksandprotectedopenspace.Residentsarewillingtopay$1.48 billion per year for the recreational activities they engage in on park facilities.
• Independentresearchshowsthatparkusetranslatesintoincreasedphysicalactivity,resultinginmedical costs savings. Approximately 611,000 Long Islanders engage in physical activity at a level sufficient to generate measurable health benefits, yielding annual savings in medical costs of $164 million.
Agriculture
• AgricultureisanimportantindustryonLongIsland.Infact,SuffolkCountyranksnumberonein market value for the entire State of New York. In 2007, Suffolk County had direct agricultural sales of $288 million.
• LongIslandwineriesattract1.2millionvisitorsperyearwhospend$90millionduringtheirvisits, $33.3 million of it at the wineries themselves.
• Additionalrevenuesaregeneratedbyvisitorswhocometopickstrawberriesinspring,gatherpumpkins and apples in fall, and buy Christmas trees in winter.
Government Cost Savings
• Landconservationhelpsprotectcleandrinkingwatersupplies.Thecostofwaterpumped from the pine barrens, where the source water is protected, is up to ten times lower than in unprotected areas.
• Parksandprotectedopenspacereducestormwatermanagementcostsbycapturing precipitation and/or slowing its runoff. These areas lower stormwater management costs $23.9 million annually.
• Treesandshrubsinparksandprotectedopenspaceremoveairpollutantsthatendangerhumanhealth and damage structures. Such spaces reduce Long Island’s pollution control costs by $18.9 million per year.
Additional Benefits
• Parksandprotectedopenspaceprovideanumberofotherimportanteconomicbenefitsthatcannot be quantified at this time. These include boosting local economies by attracting businesses and residents, supporting Long Island’s fishing and shellfishing industries, sequestering carbon and reducing global warming, and providing a buffer from disturbance events (e.g., hurricanes).
• Thesebenefitscreatesubstantialandsustainedeconomicvalue,whichunfortunatelyis extremely difficult to quantify.
9The Economic Benefits and Fiscal Impact of Parks and Open Space in Nassau and Suffolk Counties, New York
Conclusions
• LongIsland’sparksandprotectedopenspaceareakeyeconomicdriverthatcontributesatleast$2.74 billion annually in economic benefits.
• LongIsland’sparksandprotectedopenspacesavelocalgovernmentsmoneywhencomparedtoresidential development (except in second-home communities). When both property tax revenues and expenditures for services are taken into account, it becomes clear that residential development is more costly to local governments than are parks and protected open space.
• WhendifficultpublicpolicydebatesthatwillaffectthefutureofLongIslandareoccurring,decision makers must make informed choices by considering not just the costs of preservation but also the real economic and fiscal benefits provided by these lands.
• Thisreportdocumentstheextensivenaturalbenefitsthatcomefromprotectedparksandopenspace. It demonstrates the considerable benefits to business and residents where water quality, farmland, parks, and open space buffers around our lakes, harbors, bays, and ponds are preserved. However, we still do not know what happens to the natural value of Long Island as private open space and farmland are developed. Further research is needed on the cost to the public and the economy if the remaining natural areas and farmland are lost. Clearly, for each acre of mature forest, productive farmland, or undisturbed wetland lost, there is a measurable economic consequence.

10 The Economic Benefits and Fiscal Impact of Parks and Open Space in Nassau and Suffolk Counties, New York
Atl
anti
c O
cean
Long
Isl
and
Soun
d
Gre
at S
outh
Bay
UV107
UV27
UV24
UV25UV231
UV106
UV110UV135
UV25B
UV25A
UV27A
UV347UV101
UV22
UV111
UV878
UV102
UV454
£ ¤1
§̈ ¦695
§̈ ¦87
§̈ ¦295
§̈ ¦278
§̈ ¦495
§̈ ¦95 §̈ ¦678
Hem
pste
ad
Long
Bea
chGle
n C
ove
Oys
ter B
ay
Nor
th H
emps
tead
Hun
tingt
on
Islip
Baby
lon
Smith
tow
n
Park
s an
d Pr
otec
ted
Ope
n Sp
ace
±
June
22,
201
0C
arto
grap
hy b
yTh
e Tr
ust f
or P
ublic
Lan
dw
ww.
tpl.o
rg
Nas
sau
Cou
nty
Park
sPr
otec
ted
Ope
n Sp
ace
Wat
erbo
dies
Tran
spor
tatio
nIn
ters
tate
Hig
hway
Maj
or R
oad
Tow
n Bo
unda
ries
02
4
Mile
s
11The Economic Benefits and Fiscal Impact of Parks and Open Space in Nassau and Suffolk Counties, New York
§̈ ¦91
§̈ ¦95
§̈ ¦84 £ ¤7
£ ¤1
£ ¤1
[\̂ 395
Long
Isla
nd S
ound
Atl
anti
c O
cean
Blo
ck I
slan
d So
und
Gre
at S
outh
Bay
UV27
UV111
UV27
UV24
UV27A
UV25A
UV114
UV112
UV135
UV454
UV25
UV25
UV231
UV347
UV110
§̈ ¦495
Oys
ter
Bay
Riv
erhe
ad
Sout
hold
Shel
ter
Isla
nd
Islip
Smith
tow
n
Sout
ham
pton
Broo
khav
en
Baby
lon
Hun
tingt
on
East
Ham
pton
Park
s an
d Pr
otec
ted
Ope
n Sp
ace
±
June
22,
201
0C
arto
grap
hy b
yTh
e Tr
ust f
or P
ublic
Lan
dw
ww.
tpl.o
rg
Suffo
lk C
ount
y
Park
sPr
otec
ted
Ope
n Sp
ace
Wat
erbo
dies
Tran
spor
tatio
nIn
ters
tate
Hig
hway
Maj
or R
oad
Tow
n Bo
unda
ries
05
10
Mile
s

12 The Economic Benefits and Fiscal Impact of Parks and Open Space in Nassau and Suffolk Counties, New York
Benefit Category
Benefit Subcategory
Land Use Category
Nassau County
Suffolk County Total
Reduced Cost of Government Services
Enhanced property value
Additional property value*
Parks $1,070,000,000 $1,770,000,000 $2,840,000,000
Protected open space
$71,100,000 $2,270,000,000 $2,340,000,000
Additional property tax
Parks $16,200,000 $25,900,000 $42,100,000
Protected open space
$1,030,000 $15,100,000 $16,100,000
Recreation and Tourism
Park tourism value
Tourist spending
Parks Combined $615,000,000
Sales tax on tourist spending*
ParksCombined
$27,300,000
Direct use value Parks $691,000,000 $790,000,000 $1,480,000,000
Human health value Parks $73,300,000 $90,200,000 $164,000,000
Agriculture Industry
Agricultural value
Sales of agricultural products
Agricultural lands
Not available $288,000,000 $288,000,000
Wineries tourist spending
Agricultural lands
Not available $90,000,000 $90,000,000
Government Cost Savings
Drinking water protection Parks and open space
Water treatment costs for protected drinking water supplies can be ten times less than unprotected supplies
Stormwater retention valueParks $1,880,000 $16,500,000 $18,400,000
Protected open space
$171,000 $5,330,000 $5,500,000
Air pollution removal valueParks $1,380,000 $14,800,000 $16,200,000
Protected open space
$175,000 $2,500,000 $2,670,000
Summary
Total annual value
Parks $783,000,000 $938,000,000 $2,340,000,000
Protected open space
$1,380,000 $22,900,000 $24,300,000
Agricultural lands
Not available $378,000,000 $378,000,000
All $785,000,000 $1,340,000,000 $2,740,000,000
* Additional property value cannot be included in the total annual value because it is a one-time boost to the properties’ value and does not accrue each year. Also, to avoid double counting, sales tax on tourist spending is not included in the total (it is a subset of tourist spending).
Table 1. Summary of Estimated Annual Benefits of Parks and Protected Open Space on Long Island

13The Economic Benefits and Fiscal Impact of Parks and Open Space in Nassau and Suffolk Counties, New York
Parks and protected open space can reduce government expenditures on costly public services and increase property tax revenues. This section determines the real fiscal impacts of residential, agricultural, commercial, industrial, vacant properties and parks and open space. It also determines the enhanced property value and additional property tax revenues associated with parks and protected open space.
• Protecting parks and open space reduces the demand for costly public services. Parks and open space cost local governments far less than residential development and vacant lands.
• Parks and protected open space add $5.18 billion in market value to nearby homes, resulting in additional property taxes revenues of $58.2 million a year.
Fiscal Impact Analysis
The impact of parks and open space on public services is often of interest to local government officials and residents. Protecting parks and open space can reduce the demand for costly public services, such as schools and police. This report investigates the budget implications of parks, protected open space, and development on Long Island communities.
The government structure on Long Island is highly complex. In Nassau and Suffolk Counties there are two cities, 13 towns, 96 villages, 125 school districts, and 132 fire districts. Therefore, the method used in this analysis is the average cost approach at the county, city, and town levels. This simple procedure estimates the costs of government services (e.g., transportation, education, and public safety) based on the existing average cost of providing services per acre. That is, the costs of government services are distributed evenly over the total acreage of the appropriate land use within each municipality.
To accurately compare costs and revenues, we first needed to narrow the field of potential development types to those that are active uses (i.e., require government expenditures or contribute revenues) and that represent a significant portion of a municipality’s land mass (i.e., at least 10 percent). They are residential, agricultural, commercial, industrial, and vacant properties and parks and protected open space. Table 2 shows the number of acres in each of these land uses by local governments. Residential development is the largest category of land use in both counties, followed by parks and protected open space.
Reduced Cost of Government Services

14 The Economic Benefits and Fiscal Impact of Parks and Open Space in Nassau and Suffolk Counties, New York
Municipality Residential Agriculture Commercial Industrial Vacant Parks and Open Space
Nassau County 73,700 215 10,300 1,380 4,260 15,300
Glen Cove 2,040 0 232 61 396 400
Hempstead 32,400 6 4,770 289 1,520 6,110
Long Beach 667 0 60 7 20 110
North Hempstead 5,170 22 2,300 228 700 1,980
Oyster Bay 33,400 188 2,910 795 1,630 6,720
Suffolk County 272,000 79,100 21,300 9,150 42,000 120,000
Babylon 9,800 3 1,260 1,980 883 3,500
Brookhaven 82,400 5,530 5,880 1,280 17,900 29,500
East Hampton 26,400 6,840 809 484 3,700 16,500
Huntington 33,800 495 2,440 553 476 6,100
Islip 31,300 17 3,980 2,120 1,930 9,680
Riverhead 8,300 14,800 2,030 2,110 3,030 12,400
Shelter Island 3,720 10,100 76 11 430 2,770
Smithtown 19,100 96 2,350 99 669 4,110
Southampton 41,400 24,500 1,720 505 12,100 28,400
Southold 15,300 16,700 720 16 867 7,020
Sources: Parcel data provided by Nassau and Suffolk Counties.
Next we determined the categories of government services likely to be associated with these land use types. The New York State Office of the State Comptroller collects financial data for local governments, including spending data in fiscal year 2007 on the following:
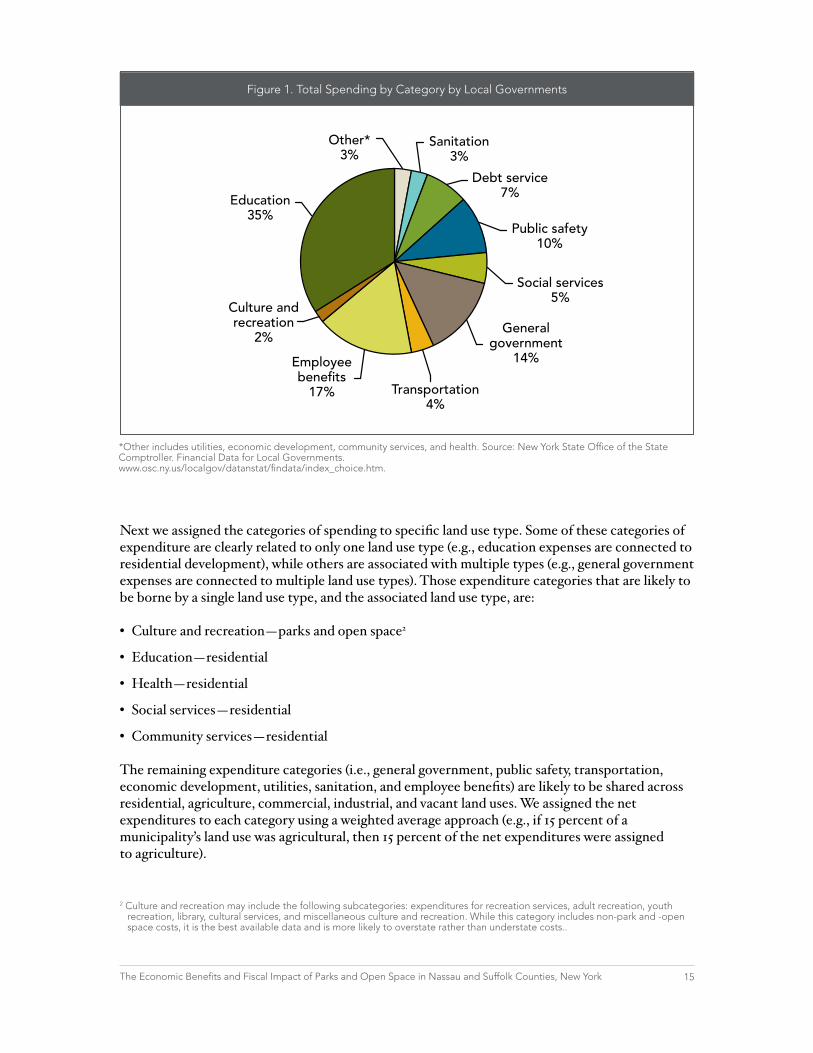
Total spending by local governments on each category of service is only part of the picture; local governments also charge fees for some of these services. For example, local governments collect museum admissions, library charges, recreational concession charges, and private contributions for culture and recreation. The State Comptroller also collects data on revenues derived from charges for services by category. We subtracted all fees collected from expenditures to obtain net government costs. Figure 1 shows net spending by category by local governments. Education is the largest category of cost at 34 percent. Culture and recreation makes up 2 percent of net spending.
General government Education
Public safety Health
Transportation Social services
Economic development Culture and recreation
Community services Utilities
Sanitation Employee benefits
Debt service
Table 2. Acres of Select Land Uses by Local Governments
15The Economic Benefits and Fiscal Impact of Parks and Open Space in Nassau and Suffolk Counties, New York
Other*3%
Sanitation3%
Debt service7%
Public safety10%
Social services5%
Generalgovernment
14%
Transportation4%
Employeebenefits
17%
Culture andrecreation
2%
Education35%
Figure 1. Total Spending by Category by Local Governments
*Other includes utilities, economic development, community services, and health. Source: New York State Office of the State Comptroller. Financial Data for Local Governments. www.osc.ny.us/localgov/datanstat/findata/index_choice.htm.
Next we assigned the categories of spending to specific land use type. Some of these categories of expenditure are clearly related to only one land use type (e.g., education expenses are connected to residential development), while others are associated with multiple types (e.g., general government expenses are connected to multiple land use types). Those expenditure categories that are likely to be borne by a single land use type, and the associated land use type, are:
• Cultureandrecreation—parksandopenspace2
• Education—residential
• Health—residential
• Socialservices—residential
• Communityservices—residential
The remaining expenditure categories (i.e., general government, public safety, transportation, economic development, utilities, sanitation, and employee benefits) are likely to be shared across residential, agriculture, commercial, industrial, and vacant land uses. We assigned the net expenditures to each category using a weighted average approach (e.g., if 15 percent of a municipality’s land use was agricultural, then 15 percent of the net expenditures were assigned to agriculture).
2 Culture and recreation may include the following subcategories: expenditures for recreation services, adult recreation, youth recreation, library, cultural services, and miscellaneous culture and recreation. While this category includes non-park and -open space costs, it is the best available data and is more likely to overstate rather than understate costs..

16 The Economic Benefits and Fiscal Impact of Parks and Open Space in Nassau and Suffolk Counties, New York
After we assigned all net expenditures to a land use category, we determined the local governments’ spending per acre by land use type by dividing the net expenditures by the total number of acres in that land use category (see Appendix). While spending per acre varies across land use categories and local governments, it is highest for residential development.
We can now turn our attention to the property tax revenues generated for local governments. To estimate property tax revenues per acre by land use type, we multiplied the assessed value and the appropriate tax rate for each local government. We determined the assessed value per acre by dividing the assessed value of every parcel by its size in acres.3 We then averaged the assessed value per acre across each land use type by municipality based on county, city, town, village, and school district tax rates we obtained from the New York Office of Real Property Services.4 The Appendix lists the average property tax revenues per acre generated for local governments. Similar to expenditures, the revenues generated vary across the local governments and the land use types. Generally, commercial development contributes the greatest amount of property tax revenues per acre (on average, $44,000 per acre per year).
Finally, we compared the government expenditures and revenues associated with development and parks and protected open space. The Appendix shows the difference between the average revenues generated and expenditures on local government services by land use type.5 Key findings include the following:
• Thedisparitybetweenpropertytaxrevenuesandlocalgovernmentexpendituresrequiredislargest for residential development. That is, residential development tends not to pay for itself. There are five communities in which the residential property taxes exceed government expenditures (on services such as education, health, and social and community services): East Hampton, Shelter Island, Smithtown, Southampton, and Southold. A possible explanation for why residential development pays for itself in some of these communities is that they tend to have a large stock of second homes and, therefore, would not provide year-round services for many landowners. Excluding these five towns, residential development on average costs $30,200 a year more per acre than it supplies in property tax revenues.
• Thedifferenceingovernmentservicesdemandedandpropertytaxrevenuesgeneratedforvacant lands is second only to residential development. On average, vacant lands require $14,800 more in government services than property tax revenues generated per acre.
• Wecalculatethatlocalgovernmentsspend$3,750peracreonparksandprotectedopenspaceeach year (on average) and assume that zero property tax revenues are realized. However, it is important to note that this is an upper-bound estimate of this difference. The best available data on local government expenditures on parks and protected open space are overly inclusive (i.e., they may also include expenditures for library, cultural services, and miscellaneous culture). In addition, parks and protected open space do contribute some property tax revenues. Select types of parks and protected open space do generate property tax revenues (e.g., conservation easements). As discussed in the next section, proximity to parks and protected open space generates $58.2 million annually in additional residential property tax revenues. Also, as investigated later in this report, parks and open space are a key component of Long Island’s recreation and tourism industry. Out-of-town visitors to Long Island parks spend $615 million in the local economy each year.
3 In Nassau County the assessed value of all condominium units was distributed over the total complex size.4 New York Office of Real Property Services. Municipal Profiles, Tax Rate and Levy Data Fiscal Year Ending 2008. http://www.orps.
state.ny.us/cfapps/MuniPro/osc/oscOptionSelect.cfm5 Property tax revenues generated by land use types rely on actual assessed values and property tax rates for all parcels in each
municipality and, therefore, are unlikely to be sensitive to assumptions. The calculation of government expenditures by land use type is sensitive to the assumptions made in this report. For example, assuming some expenditures (e.g., general government) are likely to be shared across land uses, we used a weighted-average-by-acre approach. To the extent that a category of expenditure is not dependent upon land use acreage, the average expenditures per acre may be over- or understated.
17The Economic Benefits and Fiscal Impact of Parks and Open Space in Nassau and Suffolk Counties, New York
• Overall,agriculturedoesnotpayforitself.Onaverage,agricultureintownswithover500acresof agricultural land requires $2,960 more in government services than property tax revenues generated per acre. However, the agriculture industry is important to the Long Island economy. As discussed in more detail later in this report, the agriculture industry generates $288 million in direct annual sales and an additional $90 million in visitor spending.
• Ingeneral,commercialandindustrialdevelopmentstendtopayforthemselves,onaverage,$44,000 and $7,110 per acre, respectively.
This fiscal impact analysis provides a general overview of how parks and protected open space affect local government finances. However, additional detailed research is necessary to pinpoint the effect of more specific types of preservation and development (e.g., conservation easements or high-density single-family residential development) at the local level.
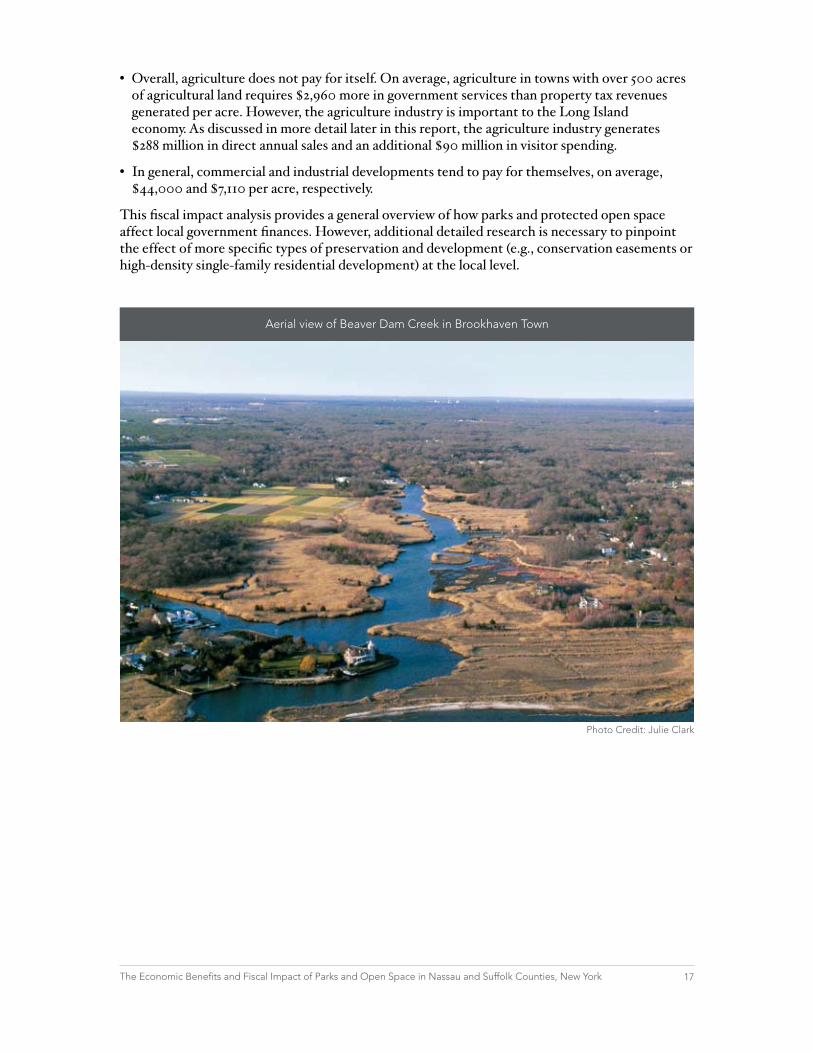
Aerial view of Beaver Dam Creek in Brookhaven Town
Photo Credit: Julie Clark
18 The Economic Benefits and Fiscal Impact of Parks and Open Space in Nassau and Suffolk Counties, New York
Enhanced Property Value
Study after study has shown that parks and open space have a positive impact on nearby residential property values. All things being equal, most people are willing to pay more for a home close to a nice park or protected open space. The property value added by a park or protected open space, incidentally, is separate from the direct use value gained; property value goes up even if the resident never visits the park or protected open space.
Property value is affected primarily by two factors: the distance from and the quality of the park or protected open space. While proximate value (“nearby-ness”) can be measured up to 2,000 feet from a large park or protected open space, most of the value—whether such spaces are large or small—is within the first 500 feet. Therefore, we have limited our analysis of enhanced property value to 500 feet. Moreover, people’s desire to live near a park or protected open space also depends on the quality of the park or protected open space. Beautiful natural resource areas with great trees, trails, meadows, and gardens are markedly valuable. Those with excellent recreational facilities are also desirable (although sometimes a property has the greatest value if it is located a block or two away from the park rather than directly adjoining it, because of noise, lights, and parking). However, less attractive or poorly maintained parks or protected open spaces can be only marginally valuable, and those with dangerous or frightening aspects can actually reduce nearby property values.
Determining an accurate view of every property next to every park or protected open space is technically possible but prohibitively time-consuming and costly. Therefore, we formulated an extrapolative methodology to arrive at a reasonable estimate. We identified all residential properties within 500 feet of every significant public park and recreation area in Nassau and Suffolk Counties. This was separately done for all other protected open spaces, such as those with conservation easements. We defined “significant” as a space of one acre or more; “park” included every park in the two counties, even if owned by a county, state, federal, or other agency; and “other protected lands” included those non publicly owned but legally protected and designated conservation lands.
As there are many public entities on Long Island, from villages to national parks‚ it was a major undertaking to identify nearly every public park in the area.6 A residential property consists of a structure that is owned and taxed; thus, a single-family house is one property, a 100-unit apartment building is one property, and a 100-unit condominium building is 100 properties. Generally‚ the tax assessments on Long Island do not represent the market value of properties; therefore, we normalized the values according to local equalization rates. For instance, market value of a residential property is 400 times the tax-assessed value in Nassau County. The residential units next to parks and protected lands on Long Island had a total market value of $103 billion in 2009.
Typically‚ we determine the amount conservation lands add to the value of a residential property based on the quality of the park or protected open space. That is, high-quality lands add significant value, average-quality lands add slight value, and low-quality lands reduce value to surrounding residences. Despite interviews with park professionals, park users, real estate agents, assessors, and others, we were not able to assess the quality of these spaces. Instead, we chose to assign the conservative value of 5 percent as the amount that these conserved lands add to the market value of all dwellings within 500 feet of them. This number is an average of the high, medium and low values of 15 percent, 5 percent, and negative 5 percent that would be used if specific park quality could be established. The estimate for 2009 is that $5.18 billion in residential real estate value exists because of proximity to parks and protected lands (see Table 3).
6 We created a comprehensive database of parks using data from the Early Years Institute, North Shore Land Alliance, New York State Office of Parks, Recreation and Historic Preservation, New York State Department of Environmental Conservation, The Nature Conservancy, New York State Office of Cyber Security and Critical Infrastructure, Nassau County, and Suffolk County.

19The Economic Benefits and Fiscal Impact of Parks and Open Space in Nassau and Suffolk Counties, New York
County Total Market Value Additional Market Value
Additional Property Tax Revenue
Nassau County
Parks $21,400,000,000 $1,070,000,000 $16,200,000
Protected open space $1,420,000,000 $71,100,000 $1,030,000
Suffolk County
Parks $35,300,000,000 $1,770,000,000 $25,900,000
Protected open space $45,300,000,000 $2,270,000,000 $15,100,000
Total $103,000,000,000 $5,180,000,000 $58,200,000
Table 3. Enhanced Residential Property Value from Proximity to Parks and Protected Open Space
We then used the residential property tax rate to determine how much additional tax revenue was raised by local units of government (i.e., villages, school districts, and the two counties). While property tax rates differed by jurisdiction, we found that the total value captured in property tax revenue derived from parks and protected lands within Nassau and Suffolk Counties is $58.2 million.
The robustness of this estimate is grounded in the following. First, it does not include the effects of any spaces under an acre, although it is known that even minor green spaces can have a property value effect. Second, the estimate leaves out all the value of dwellings located between 500 feet and 2,000 feet from a park or protected open space, even though evidence exists for marginal property value at such distances. Third, as mentioned, it only measures a 5 percent marginal value, though studies have shown up to a 20 percent premium and marginal values up to distances of 2,000 feet. In fact, Johnston et al. (2001) found that a parcel of land adjacent to open space in the Peconic Estuary System of Suffolk County has, on average, a 12.8 percent higher per acre value than a similar parcel located elsewhere. Last, the estimate does not include the potentially very significant property value for commercial offices located near these parks and protected areas.

20 The Economic Benefits and Fiscal Impact of Parks and Open Space in Nassau and Suffolk Counties, New York
Identification of residential properties within 500 feet of parks
LEGEND
ParkResidential Property

21The Economic Benefits and Fiscal Impact of Parks and Open Space in Nassau and Suffolk Counties, New York
Parks and open space are a key component of Long Island’s recreation and tourism industry. This section estimates visitor spending and sales tax generated in the local economy because of parks, as well as the direct use value and the health benefits gained by residents recreating in parks.
• Out-of-town visitors to Long Island parks spend $615 million in the local economy, generating $27.3 million in sales tax revenues each year.
• Residents of Long Island visit parks a total of 464 million times each year, resulting in $1.48 billion in use value.
• Parks yield $164 million in medical savings costs each year by providing residents access to engage in physical activity.
Park Tourism
The features that encourage out-of-towners (tourists) to visit a region include beaches, cultural facilities, heritage places, and parks as well as special events that take place there, such as festivals and sports tournaments.7 On Long Island, many tourists participate in local festivals and attend events, such as the U.S. Open at the public Bethpage State Park golf course (in 2002 and again in 2009). And of course, the beaches and coast, such as the Hamptons, Fire Island National Seashore, and Jones Beach State Park, are major tourist attractions. Though not always recognized, parks play a very large role in the tourism economy of both Nassau and Suffolk Counties. To determine the contribution of parks to the tourism economy requires knowledge of tourists’ activities, the number of visits, and their spending habits. In Nassau and Suffolk Counties, there are many park entities ranging from town and village park divisions to state parks, federal wildlife refuges, and national parks. Although some of these agencies track park usership, many do not, making it difficult to estimate the economic impact of tourists for Long Island based on each separate agency.
Some of the local park entities at the town, village, city, and county levels have information on tourist activity and spending. The National Park Service, which operates Sagamore Hill National Historic Site Fire Island National Seashore, and the New York State Office of Parks, Recreation and Historic Preservation monitor visitation rates. In addition, some municipalities have statistics on beach visitation. However, it is not possible to extrapolate from those numbers to the rest of the parks in the two counties.
We thus obtained visitation numbers and expenditures from another source—the Long Island Convention and Visitors Bureau (LICVB), which has hired consultants to track how many people are visiting Long Island, how much they spend while there, and the primary reason for their visit. Based on the categories listed for the visit—outdoor recreation, attending a festival, rest and relaxation, and heritage or cultural experience—we estimated that 28 percent of visitors to Nassau and Suffolk Counties came because of the parks, whether a week at Fire Island National Seashore, an overnight visit to bird watch and hike at a wildlife refuge, a stay in the Hamptons, or a day trip to Sagamore Hill. That is, approximately 4.1 million overnighters and 1.01 million day visitors came to Nassau and Suffolk Counties because of parks.
Recreation and Tourism
7 By definition, local users are not tourists—any spending they do at or near the park is money not spent locally somewhere else, such as in their immediate neighborhood.
22 The Economic Benefits and Fiscal Impact of Parks and Open Space in Nassau and Suffolk Counties, New York
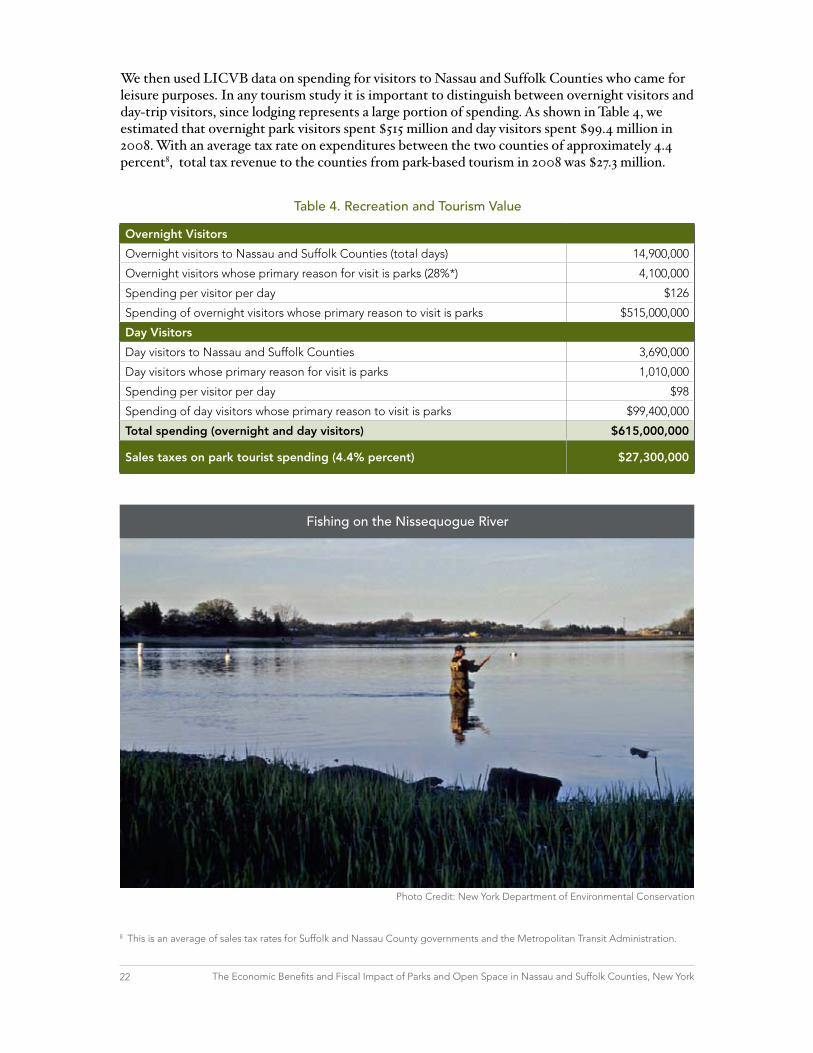
We then used LICVB data on spending for visitors to Nassau and Suffolk Counties who came for leisure purposes. In any tourism study it is important to distinguish between overnight visitors and day-trip visitors, since lodging represents a large portion of spending. As shown in Table 4, we estimated that overnight park visitors spent $515 million and day visitors spent $99.4 million in 2008. With an average tax rate on expenditures between the two counties of approximately 4.4 percent8, total tax revenue to the counties from park-based tourism in 2008 was $27.3 million.
Table 4. Recreation and Tourism Value
Overnight Visitors
Overnight visitors to Nassau and Suffolk Counties (total days) 14,900,000
Overnight visitors whose primary reason for visit is parks (28%*) 4,100,000
Spending per visitor per day $126
Spending of overnight visitors whose primary reason to visit is parks $515,000,000
Day Visitors
Day visitors to Nassau and Suffolk Counties 3,690,000
Day visitors whose primary reason for visit is parks 1,010,000
Spending per visitor per day $98
Spending of day visitors whose primary reason to visit is parks $99,400,000
Total spending (overnight and day visitors) $615,000,000
Sales taxes on park tourist spending (4.4% percent) $27,300,000
Photo Credit: New York Department of Environmental Conservation
8 This is an average of sales tax rates for Suffolk and Nassau County governments and the Metropolitan Transit Administration.
Fishing on the Nissequogue River

23The Economic Benefits and Fiscal Impact of Parks and Open Space in Nassau and Suffolk Counties, New York
Direct Use Value
While Long Island’s parks provide much indirect value, they also provide direct recreational value to residents through such activities as team sports, bicycling, skateboarding, walking, picnicking, bench sitting, and visiting a flower garden.
Most direct uses in public parks are free of charge, but economists can still calculate value by determining the consumer’s “willingness to pay” for the recreation experience in the private marketplace. In other words, if parks were not available on Long Island, how much would the resident (or “consumer”) pay for similar experiences in commercial facilities or venues? Rather than income, the direct use value represents the amount of money residents save by not having to pay market rates to indulge in the many park activities they enjoy.
The model for quantifying the benefits received by direct users is based on the “Unit Day Value” method as documented in Water Resources Council recreation valuation procedures by the U.S. Army Corps of Engineers. The Unit Day Value model counts park visits by specific activity, assigning each activity a dollar value. For example, playing in a playground is worth $3.50. Running or walking on a park trail is worth $4, as is playing a game of tennis on a public court. For activities for which a fee is charged, such as golf or visiting a garden, only the “extra value” is assigned (e.g., if a round of golf costs $20 on a public course and $80 on a private course, the direct use value would be $60). In addition, we applied the law of diminishing returns to park use (i.e., each additional repetition of a park use in a given period is slightly less valuable than the first use). For example, playground value diminishes from $3.50 for the first time to $2.25 for the sixth time in a week. We also estimated an average “season” for different park uses to take into account reduced participation rates in the off-season. Although some people are active in parks 365 days a year, we eliminated seasons when participation rates drop to low levels. Finally, for the few activities that charge a fee, such as golf, ice skating, and the use of fields for team sports, we subtracted the per-person fee from the imputed value, based on fees for such services in Nassau and Suffolk Counties.
A professionally conducted telephone survey of 301 residents in Nassau County and 300 residents in Suffolk County determined the number of park visits and the activities engaged in. This ran-dom-digit-dialed survey had an accuracy level of plus or minus 6 percent. Residents were asked to answer for themselves; a representative proportion of adults with children under the age of 18 were also asked to respond for one of their children. The calculation only includes residents of Nassau and Suffolk Counties; the value to the two counties from nonresident uses of parks is measured by the income to local businesses from what these visitors spend on their trips. This is covered under income from out-of-town visitor spending (see above). The result of the Direct Use Calculator combined for Nassau and Suffolk Counties is $1.48 billion for 2009 (see Table 5).
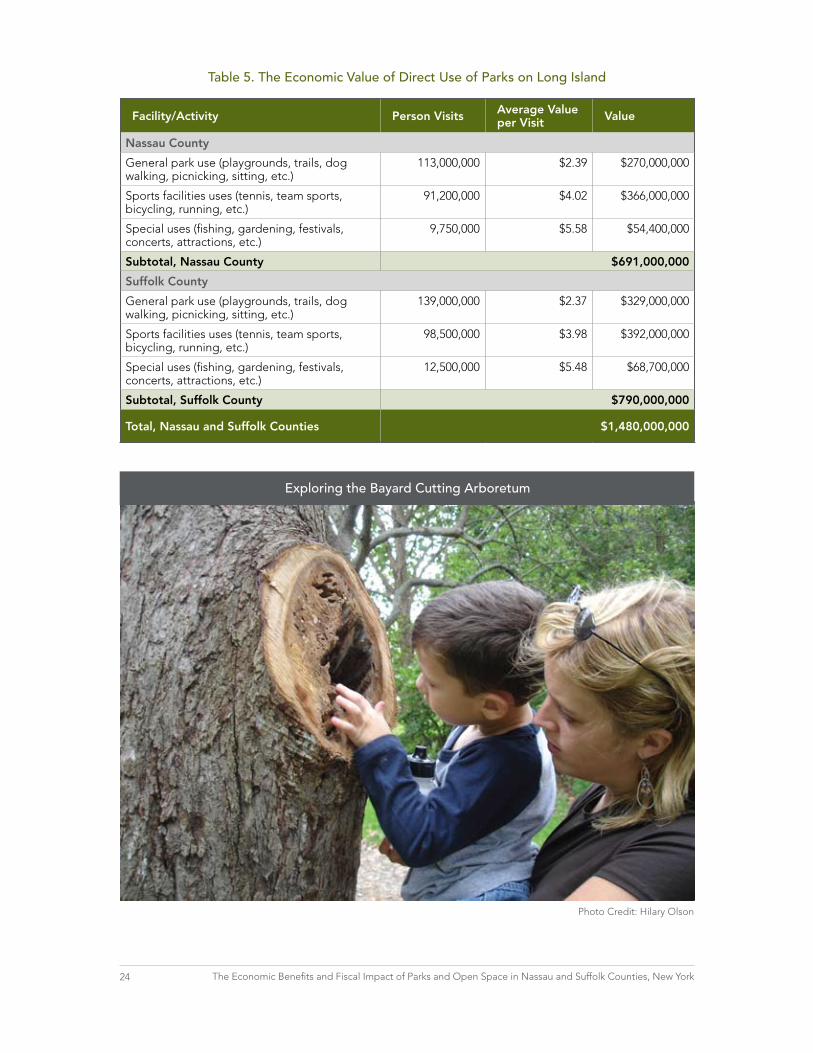
24 The Economic Benefits and Fiscal Impact of Parks and Open Space in Nassau and Suffolk Counties, New York
Facility/Activity Person Visits Average Value per Visit Value
Nassau County
General park use (playgrounds, trails, dog walking, picnicking, sitting, etc.)
113,000,000 $2.39 $270,000,000
Sports facilities uses (tennis, team sports, bicycling, running, etc.)
91,200,000 $4.02 $366,000,000
Special uses (fishing, gardening, festivals, concerts, attractions, etc.)
9,750,000 $5.58 $54,400,000
Subtotal, Nassau County $691,000,000
Suffolk County
General park use (playgrounds, trails, dog walking, picnicking, sitting, etc.)
139,000,000 $2.37 $329,000,000
Sports facilities uses (tennis, team sports, bicycling, running, etc.)
98,500,000 $3.98 $392,000,000
Special uses (fishing, gardening, festivals, concerts, attractions, etc.)
12,500,000 $5.48 $68,700,000
Subtotal, Suffolk County $790,000,000
Total, Nassau and Suffolk Counties $1,480,000,000
Table 5. The Economic Value of Direct Use of Parks on Long Island
Photo Credit: Hilary Olson
Exploring the Bayard Cutting Arboretum

25The Economic Benefits and Fiscal Impact of Parks and Open Space in Nassau and Suffolk Counties, New York
Helping to Promote Human Health
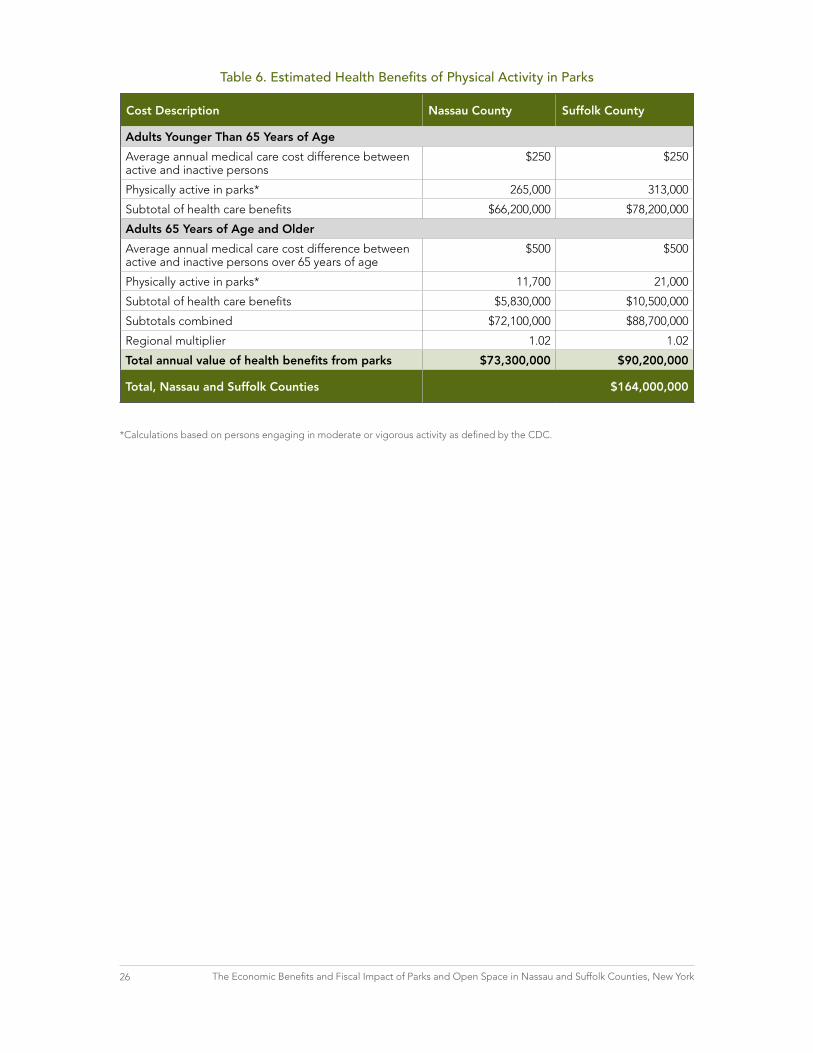
Several studies have documented the large economic burden related to physical inactivity. One report released in August 2009 by the U.S. Centers for Disease Control and Prevention (CDC) estimates that obesity costs the U.S. economy $147 billion in 2008 alone. Lack of exercise is shown to contribute to obesity and its many effects, and for this reason experts call for a more active lifestyle. Recent research suggests that access to parks can help people increase their level of physical activity. The Parks Health Benefits Calculator measures the collective economic savings realized by residents of Long Island who use their parks for exercise.
We created the calculator by identifying the common types of medical problems that are inversely related to physical activity, such as heart disease and diabetes. Based on studies that have been carried out in seven states, we assigned a value of $250 as the annual medical cost difference between those who exercise regularly and those who do not. For persons over the age of 65, that value has been doubled to $500 because seniors typically incur two or more times the medical care costs of younger adults.
The key data input for determining medical cost savings is the number of park users who are engaging in a sufficient amount of physical activity. The CDC defines this as at least 150 minutes of moderate activity per week or at least 75 minutes of vigorous activity per week. To determine this, the same telephone survey that carried out the direct use valuation also determined residents’ activities and their frequency, grouped by age. In accordance with CDC guidelines, we eliminated low-heart rate activities (e.g., picnicking, sitting, strolling, and bird watching). Next, we removed respondents who engaged in strenuous activities fewer than three times per week because they were not being active enough to gain a health benefit. Likewise, we removed respondents who engaged in activities fewer than four times per week that were less strenuous but still healthful. The remaining users engaged in enough physical activity to warrant health care cost savings. We found that about 277,000 residents in Nassau County and 334,000 residents in Suffolk County improve their health in parks. In 2009 the combined health savings from park use for the residents of both counties was $164 million (see Table 6).
Photo Credit: Tim Holmstrom
Kayaking the Wartheim National Wildlife Refuge
26 The Economic Benefits and Fiscal Impact of Parks and Open Space in Nassau and Suffolk Counties, New York
Cost Description Nassau County Suffolk County
Adults Younger Than 65 Years of Age
Average annual medical care cost difference between active and inactive persons
$250 $250
Physically active in parks* 265,000 313,000
Subtotal of health care benefits $66,200,000 $78,200,000
Adults 65 Years of Age and Older
Average annual medical care cost difference between active and inactive persons over 65 years of age
$500 $500
Physically active in parks* 11,700 21,000
Subtotal of health care benefits $5,830,000 $10,500,000
Subtotals combined $72,100,000 $88,700,000
Regional multiplier 1.02 1.02
Total annual value of health benefits from parks $73,300,000 $90,200,000
Total, Nassau and Suffolk Counties $164,000,000
Table 6. Estimated Health Benefits of Physical Activity in Parks
*Calculations based on persons engaging in moderate or vigorous activity as defined by the CDC.

27The Economic Benefits and Fiscal Impact of Parks and Open Space in Nassau and Suffolk Counties, New York
AgricultureFarmland preservation helps sustain the agriculture industry on Long Island. This section considers the market value of Long Island’s agriculture industry and the spending of agritourism visitors.
• Farming is an important industry on Long Island, generating $288 million in annual sales and directly employing 2,240 people.
• It is also a vibrant part of the tourism economy as 1.2 million winery tourists visit every year and spend $90 million in the local economy.
The role of local farmland preservation programs in protecting Long Island’s thriving agricultural industry is significant. Since 1977 roughly 13,000 acres of farmland have been protected in Nassau and Suffolk Counties by various government entities. Approximately 37.8 percent of farmland in Nassau and Suffolk Counties is protected.
Agriculture is an important industry on Long Island. In fact, Suffolk County ranks number one in market value for the whole State of New York. In 2007, Suffolk County had direct agricultural sales of $288 million (see Table 7). Long Island’s 656 farms, which cultivate 34,500 acres and an additional 1,800 acres of aquaculture production, accomplished this remarkable feat. Long Island farmers are able to generate such impressive sales on modest acreage by producing a large variety of crops (over 100) such as vegetables, fruits, wine, poultry, livestock, and oysters.
Agriculture also contributes to the local economy by providing jobs. Farming directly employs 2,240 people on Long Island and indirectly employs many more in industries that provide goods and services to farmers. The Long Island Farm Bureau estimates that “Agri-businesses employ well over 10,000 people in the region, with a multiplier effect that generates jobs for tens of thousands more.”
Long Island agriculture is also a vibrant part of Long Island’s tourism economy. With most of the over 50 wine producers on Long Island offering tours and tastings, the Long Island Wine Council estimates that 1.2 million tourists visit Long Island vineyards each year. These wine tasters are in addition to the millions of tourists who come to Long Island to visit parks discussed earlier. Consumer spending in tasting rooms at wineries on Long Island is $27.80 per customer on average, or $33.3 million in aggregate annually. Visitors to Long Island wineries also patronize restaurants, resorts, and spas. In total, these vineyard visitors spend an estimated $90 million in the local economy each year. Additional revenues are generated by visitors to Long Island’s roughly 20 farmers markets and 60-plus farm stands. Tourists enjoy visiting these iconic farms to pick strawberries in summer, gather pumpkins and apples in fall, and buy Christmas trees in winter.

28 The Economic Benefits and Fiscal Impact of Parks and Open Space in Nassau and Suffolk Counties, New York
Agricultural Products
Direct sales $288,000,000
Agricultural Tourism
Consumer spending at tasting rooms $33,300,000
Other wineries tourist spending $56,700,000
Wineries tourist spending $90,000,000
Total $378,000,000
Table 7. Agricultural Value
Photo Credit: Archie Rinaldini
Cycling along Banfi Fields, one of Long Island’s many vineyards

29The Economic Benefits and Fiscal Impact of Parks and Open Space in Nassau and Suffolk Counties, New York
Government Cost SavingsParks and protected open space provide services for free that would otherwise have to be provided by local governments. This section estimates the costs savings from clean drinking water, stormwater management, and air pollution removal.
• Drinking water can cost ten times more in Nassau and Suffolk Counties where sources are not protected.
• Parks and protected open space reduce stormwater management costs by $23.9 million each year.
• Vegetation in parks and protected open space provides $18.9 million in air pollution removal services each year
Protection of Drinking Water
Land conservation within source water areas is an effective tool for protecting clean drinking water supplies. By preserving existing natural areas that drain into the water source, new sources of contaminants are likely to be prevented from entering into the drinking water supplies in the first place. By protecting the source water area, a community avoids many of the costs associated with water treatment (e.g., filtration and disinfection). Long Island is one such example of a community choosing source water protection over intensive treatment and filtration as the preferred economic alternative.
The source of drinking water in Nassau and Suffolk Counties is groundwater. The groundwater system is classified as a sole-source aquifer.9 According to the New York State Department of Health, there are over 60 public water systems in Nassau and Suffolk Counties, and these systems rely on more than 1,000 different groundwater source wells.
To determine just how much money is saved by land conservation in source water areas for the benefit of Long Island residents, we must determine the cost of obtaining and treating drinking water from wells where open space is protected and compare it to the costs of obtaining and treating drinking water from wells where open space is not protected.
Minimal drinking water treatment costs are incurred where the source water area is parks and protected open space. They include the cost to pump the water to the surface and the cost to disinfect and buffer the water. As shown in Table 8, the average total cost to pump, disinfect, and buffer 1,000 gallons of water is $0.16.
Additional drinking water treatment costs accrue where open space in the source water area has been developed for various purposes. In unprotected areas the water sources may contain the following:
• Volatileorganiccompounds(VOCs)frombusiness,farming,andindustry.Thewatertreatmentfor VOC removal is granular activated carbon (GAC), which adds $0.24 in treatment cost per 1,000 gallons.
• Nitratesfromcesspools,animalwaste,andlawnandfarmfertilizers.Thewatertreatmentfornitrate removal is ion exchange resin, adding $0.95 in treatment cost per 1,000 gallons.
9 The U.S. Environmental Protection Agency defines a sole-source aquifer as one that supplies at least 50 percent of the drinking water consumed in the area overlying the aquifer. These areas do not have alternative drinking water sources that could physically, legally, or economically supply all those who depend upon the aquifer for drinking water.
30 The Economic Benefits and Fiscal Impact of Parks and Open Space in Nassau and Suffolk Counties, New York
• Perchloratefromroadflares,fireworks,andorganicfertilizer.Thewatertreatmentforperchlorateremoval is resin filtration, adding $0.26 in cost per 1,000 gallons.
• Naturallyoccurringironcancontaminatewellswhentheyaredrilleddeepertoavoidsurfacepollutants. An iron removal system (i.e., greensand) adds $0.09 in treatment costs per 1,000 gallons.
Land conservation is also important to protect the quality of future water supplies. Water utilities now have the three-dimensional technology to place wells where they will be able to take advantage of preserved open space to keep the filtration costs low into the future, so continued open space also protects the quality of future wells.
Drinking Water Costs More Where Sources Are Not Protected—Ten Times More
When we compare the costs of drinking water pumped from the pine barrens, where the source water area is protected, with an unprotected well, we find that unprotected drinking water is ten times more costly. This is because the drinking water from unprotected wells needs more expensive water treatments. For example: A typical pump station produces an average of 1 million gallons per day (gpd). Assuming all water is used for domestics use only, not irrigation, 1 million gpd serves 3,000 homes (i.e., 300 gpd per home). The total annual cost to pump to the surface and disinfect and buffer 1 million gallons per day is: $0.16/1,000 gpd x 1,000,000 gpd x 365 days/year = $58,400/year, or $19 per household/year
The additional cost to treat contaminated drinking water with GAC, ion exchange resin, resin filtration, and greensand is: $1.54/1,000 gpd x 1,000,000 gpd x 365 days/year = $562,100, or $188 per household/year
Thus, drinking water can cost ten times more where source water areas are not protected. Note: These figures should not be interpreted as the cost of water as all customers have a uniform rate block. Also, these figures do not include overhead and debt service items. The significant finding is the order of magnitude difference between the two examples.

31The Economic Benefits and Fiscal Impact of Parks and Open Space in Nassau and Suffolk Counties, New York
Category Cost/1,000 Gallons Assumptions
Cost to pump to surface $0.13 Based on a typical 100 hp pump to 85 psi
Cost to disinfect and buffer $0.03 Total annual sodium hypochlorite and lime costs divided by annual pumpage
Added cost for granular activated carbon (GAC)
$0.24 Cost to treat 200 mg through 40k lbs of GAC
Added cost for ion exchange $0.95 Total O&M costs for the South Spur ISEP Nitrate Removal Treatment System
Added cost for perchlorate removal $0.26 Cost per current contract, resin only
Added cost for greensand/IMR $0.09 Harvest Lane Iron Removal System with sewer connection
Table 8. Estimated Costs to Treat a 1,000 Gallon per Minute Drinking Water Well
Sources: Scott Meyerdierks, senior sanitary engineer, Suffolk County Water Authority, written communication, April 3, 2009; and Stephen Jones, chief executive officer, Suffolk County Water Authority, written communication, April 23, 2009. Note: Suffolk County Water Authority estimates are reflective of the incremental treatment costs in both Nassau and Suffolk Counties since all drinking water in the two counties comes from pumping groundwater; the power costs to pump the groundwater are similar; and the costs of treatment and filtration are similar.
Photo Credit: Archie Rinaldini
Upper Francis Pond, Village of Mill Neck, protected by Nassau County as open space in 2009

32 The Economic Benefits and Fiscal Impact of Parks and Open Space in Nassau and Suffolk Counties, New York
Reducing the Cost of Managing Stormwater in Urban Areas
Stormwater runoff is a significant problem in urban areas. When rainwater flows off roads, side-walks, and other impervious surfaces, it carries pollutants with it. Unfiltered rainwater can flow directly into waterways, causing significant and costly ecological problems such as algal blooms.
Parks and protected open space reduce stormwater management costs by capturing precipitation and/or slowing its runoff. Large pervious (absorbent) surface areas allow precipitation to infiltrate and recharge the groundwater. Also, vegetation provides considerable surface area that intercepts and stores rainwater, allowing some to evaporate before it ever reaches the ground. In effect, urban green spaces function like ministorage reservoirs and are the original form of green infrastructure.
The Western Research Station of the U.S. Forest Service in Davis, California, has developed a model to estimate the value of stormwater retained by parks and protected open space. Inputs to the model consist of geographic location, climate region, surface permeability index, park and protected open space size, land cover percentages, and types of vegetation. This model provides a preliminary estimate of the value of stormwater retention for protected lands on Long Island.
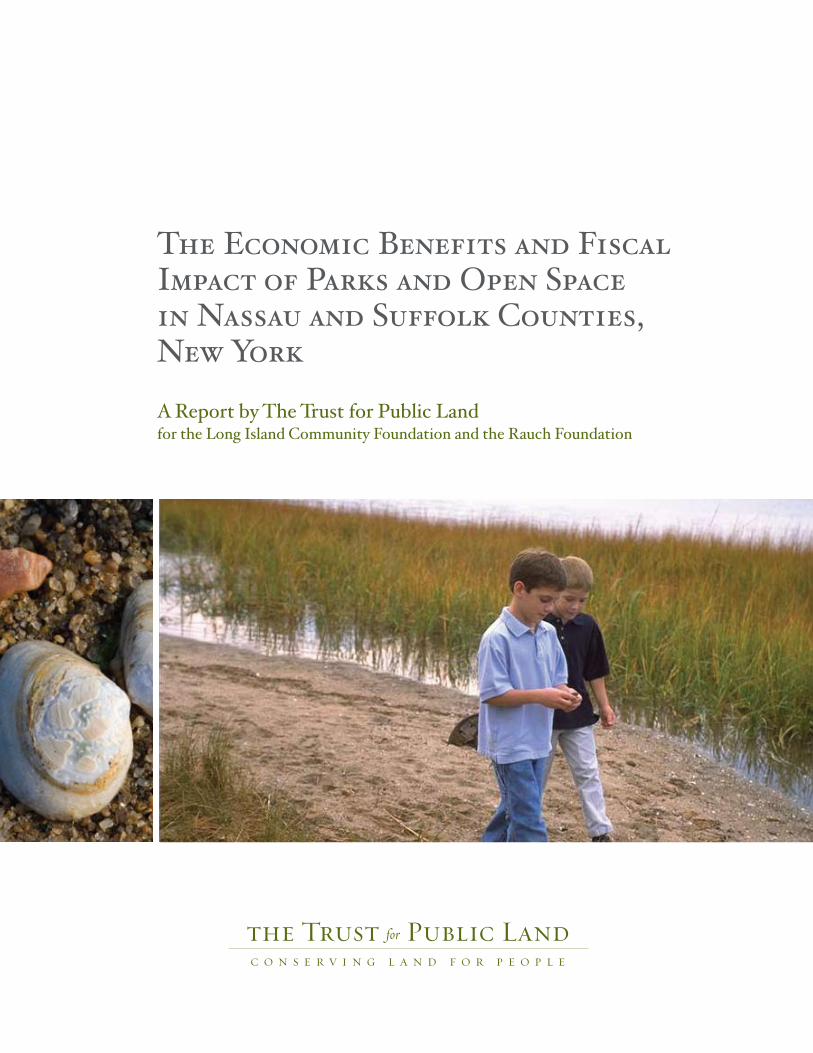
First, we determined the perviousness of parks and protected open space on Long Island, using the National Land Cover Database of land use and land cover created by the U.S. Geological Survey. This analysis reveals the perviousness of those areas within Nassau and Suffolk Counties (see Table 9). The rest consists of impervious roadways, trails, parking areas, buildings, hard courts, and also water surface.
Second, we estimated the amount of perviousness of the rest of Nassau and Suffolk Counties (i.e., the two counties without their parkland and protected areas), using the same data (see Table 9). The pervious land consists largely of residential front and backyards, private natural areas such as cemeteries, public institution grounds, and office campuses.
Third, we calculated the amount and characteristics of rainfall from U.S. weather data. On average, Nassau and Suffolk Counties receive 50.7 inches of rain per year with the characteristic mid-Atlan-tic mix of drizzles, showers, and downpours. The model, which combines aspects of two other models developed by researchers with the U.S. Forest Service, uses hourly annual precipitation data for Nassau and Suffolk Counties to estimate annual runoff. We then calculated the reduction in runoff attributable to parks and protected open space by comparing the modeled runoff with the runoff that would leave a hypothetical site of the same size but with land cover that is typical of surrounding urban development (i.e., with streets, rooftops, parking lots, etc.). In other words, it is not the entire amount of water being retained by parks and protected open space; rather, it is the marginal amount of water held back above what would normally be held back if the area were developed similar to the rest of the county.
33The Economic Benefits and Fiscal Impact of Parks and Open Space in Nassau and Suffolk Counties, New York
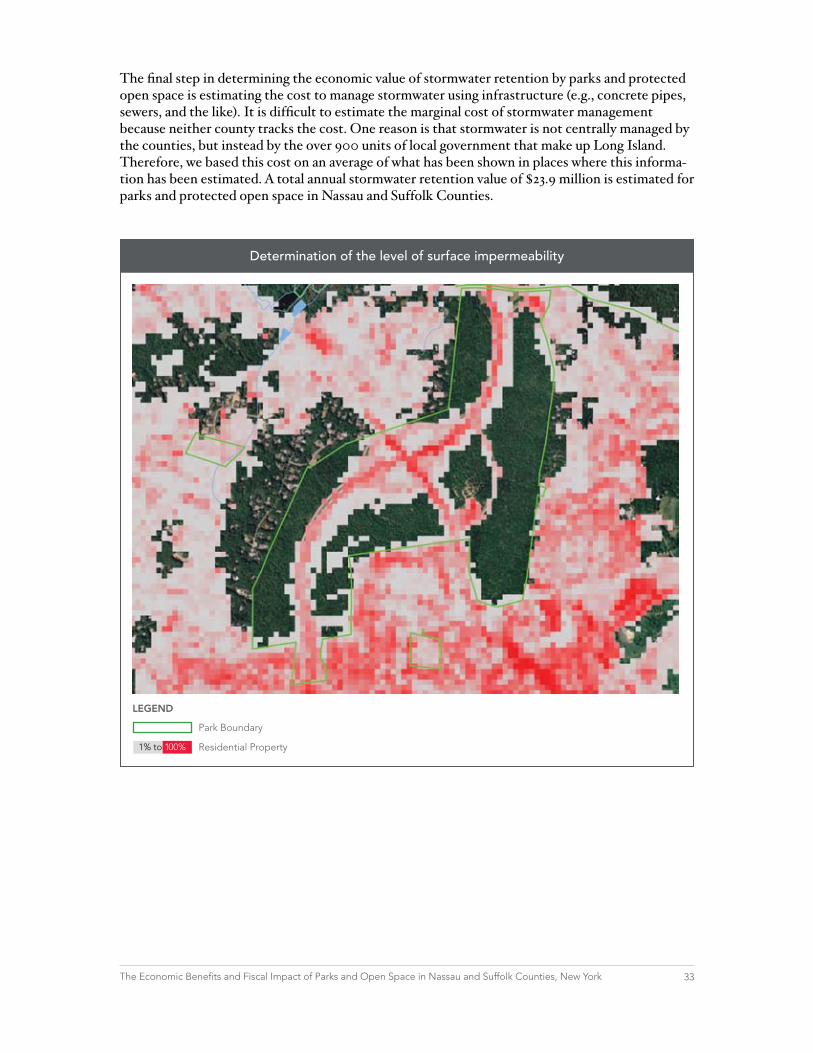
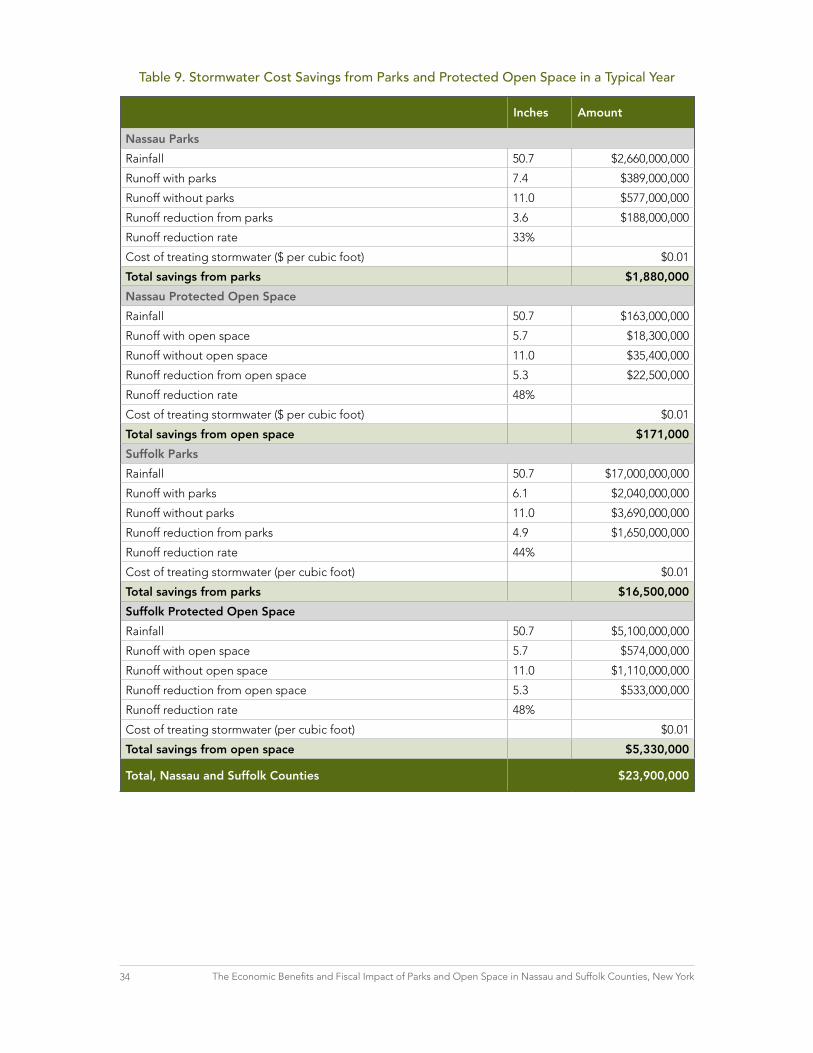
The final step in determining the economic value of stormwater retention by parks and protected open space is estimating the cost to manage stormwater using infrastructure (e.g., concrete pipes, sewers, and the like). It is difficult to estimate the marginal cost of stormwater management because neither county tracks the cost. One reason is that stormwater is not centrally managed by the counties, but instead by the over 900 units of local government that make up Long Island. Therefore, we based this cost on an average of what has been shown in places where this informa-tion has been estimated. A total annual stormwater retention value of $23.9 million is estimated for parks and protected open space in Nassau and Suffolk Counties.
Determination of the level of surface impermeability
LEGEND
Park Boundary
1% to 100% Residential Property
34 The Economic Benefits and Fiscal Impact of Parks and Open Space in Nassau and Suffolk Counties, New York
Inches Amount
Nassau Parks
Rainfall 50.7 $2,660,000,000
Runoff with parks 7.4 $389,000,000
Runoff without parks 11.0 $577,000,000
Runoff reduction from parks 3.6 $188,000,000
Runoff reduction rate 33%
Cost of treating stormwater ($ per cubic foot) $0.01
Total savings from parks $1,880,000
Nassau Protected Open Space
Rainfall 50.7 $163,000,000
Runoff with open space 5.7 $18,300,000
Runoff without open space 11.0 $35,400,000
Runoff reduction from open space 5.3 $22,500,000
Runoff reduction rate 48%
Cost of treating stormwater ($ per cubic foot) $0.01
Total savings from open space $171,000
Suffolk Parks
Rainfall 50.7 $17,000,000,000
Runoff with parks 6.1 $2,040,000,000
Runoff without parks 11.0 $3,690,000,000
Runoff reduction from parks 4.9 $1,650,000,000
Runoff reduction rate 44%
Cost of treating stormwater (per cubic foot) $0.01
Total savings from parks $16,500,000
Suffolk Protected Open Space
Rainfall 50.7 $5,100,000,000
Runoff with open space 5.7 $574,000,000
Runoff without open space 11.0 $1,110,000,000
Runoff reduction from open space 5.3 $533,000,000
Runoff reduction rate 48%
Cost of treating stormwater (per cubic foot) $0.01
Total savings from open space $5,330,000
Total, Nassau and Suffolk Counties $23,900,000
Table 9. Stormwater Cost Savings from Parks and Protected Open Space in a Typical Year

35The Economic Benefits and Fiscal Impact of Parks and Open Space in Nassau and Suffolk Counties, New York
Air Pollution Removal by VegetationAir pollution is a significant and expensive problem associated with metropolitan growth that injures human health and damages structures. The human cardiovascular and respiratory systems are affected, with broad consequences for health care costs and productivity. In addition, acid deposition, smog, and ozone increase the need to clean and repair buildings and other costly infrastructure.
Trees and shrubs have the ability to remove air pollutants such as nitrogen dioxide, sulfur dioxide, carbon monoxide, ozone, and some particulate matter. Leaves absorb gases, and particulates adhere to plant surfaces, at least temporarily. The vegetation in parks and other protected open space plays a role in improving air quality, helping these areas avoid the costs associated with pollution.
We estimated the value of air pollution removed by urban trees using a model designed at the Northeast Research Station of the U.S. Forest Service in Syracuse, New York. This approach, which is based on the U.S. Forest Service’s Urban Forest Effects (UFORE) model, is location-specific, taking into account the air pollution characteristics of a given region. This is important because even if two parts of the country have similar forest characteristics, the parks and protected open space could nevertheless generate different results based on differences in ambient air quality. First, we determined the amount of tree canopy cover of the parks and protected open space on Long Island using the National Land Cover Database of 2001 (see Table 10). While Long Island has street trees and numerous other trees on private property, this study measures only the economic value of trees on protected land. We conducted a separate analysis for public parkland and protected open space (e.g., conservation easements).
Then we calculated the pollutant flow through the area within a given time period (known as “pollutant flux”), taking into account the concentration of pollutants and the velocity of pollutant deposition. We then considered the resistance of the tree canopy to the air, the different behavior of different types of trees and other vegetation, and seasonal leaf variation.
The calculator uses hourly pollution concentration data from cities that we obtained from the U.S. Environmental Protection Agency. We multiplied the total pollutant flux by tree canopy coverage to estimate total pollutant removal by trees. We then estimated the monetary value of pollution removal by trees, using the median cost to prevent a unit of that pollutant from entering the atmosphere. For instance, the cost of preventing the emission of a short ton of carbon monoxide is $870; the cost of preventing that same amount of sulfur dioxide is $1,500.
When all of these factors are accounted for, public parkland and protected open space provide an estimated $18.9 million in air pollution removal each year (see Table 11).
Table 10. Protected Land and Tree Canopy, Long Island
Park System (acres)*
Parkland Tree Canopy
Protected Open Space (acres)
Open Space Tree Canopy
Nassau County 14,400 34% 886 70%
Suffolk County 92,200 57% 27,700 32%
*Includes all public parkland from town and village parks to national parks.

36 The Economic Benefits and Fiscal Impact of Parks and Open Space in Nassau and Suffolk Counties, New York
Table 11. Parks and Protected Lands Cutting Air Pollution Costs in Long Island
Tons Removed Dollars Saved per Ton Removed
Pollutant Removal Value
Nassau County, Parkland
Carbon dioxide 16.0 $870 $13,900
Nitrogen dioxide 78.8 $6,130 $483,000
Ozone 81.0 $6,130 $496,000
Particular matter 81.3 $4,090 $333,000
Sulfur dioxide 38.3 $1,500 $57,400
Subtotal $1,380,000
Nassau County, Protected Open Space
Carbon dioxide 2.0 $870 $1,760
Nitrogen dioxide 10.0 $6,130 $61,000
Ozone 10.2 $6,130 $62,700
Particular matter 10.3 $4,090 $42,000
Sulfur dioxide 4.8 $1,500 $7,250
Subtotal $175,000
Suffolk County, Parkland
Carbon dioxide 171.3 $870 $149,000
Nitrogen dioxide 843.7 $6,130 $5,170,000
Ozone 867.7 $6,130 $5,320,000
Particular matter 871.2 $4,090 $3,560,000
Sulfur dioxide 409.9 $1,500 $615,000
Subtotal $14,800,000
Suffolk County, Protected Open Space
Carbon dioxide 28.9 $870 $25,100
Nitrogen dioxide 142.1 $6,130 $871,000
Ozone 146.2 $6,130 $896,000
Particular matter 146.8 $4,090 $600,000
Sulfur dioxide 69.1 $1,500 $104,000
Subtotal $2,500,000
Total $18,900,000

37The Economic Benefits and Fiscal Impact of Parks and Open Space in Nassau and Suffolk Counties, New York
Percent tree cover canopy
LEGEND
Park Boundary
1% to 100% Tree Canopy

38 The Economic Benefits and Fiscal Impact of Parks and Open Space in Nassau and Suffolk Counties, New York
Additional BenefitsParks and open space provide many other benefits for which it is very difficult and cost prohibitive to estimate dollar values. This section addresses some of those benefits qualitatively.
• Parksandprotectedopenspaceprovideavarietyofotherbenefitssuchasboostinglocaleconomiesby attracting businesses and residents, supporting commercial fishing and shellfishing, sequestering carbon, mitigating hazards, stimulating community cohesion, and saving energy.
Boosting Local Economies by Attracting Businesses and Residents
Today the U.S. economy is dominated by high technology and service businesses selling knowledge and intellectual expertise. Unlike the manufacturing businesses that drove the economy in decades past, enterprises in the emerging knowledge economy are not tied to specific business locations by the need for certain kinds of transportation facilities or raw materials. With more freedom to choose a site, businesses often select one with a high quality of life—including parks, open space, and easy access to the outdoors—in order to compete for the highly trained, in-demand workers of the knowledge economy.
Supporting Commercial Fishing and Shellfishing
Watershed protection is crucial to fish production, providing food, protection, and spawning areas for a number of species. Long Island once supported robust commercial fishing and shellfishing industries. However, development and population growth within Long Island’s bay watersheds have compromised the health of coastal resources, reducing commercial fish catch and shellfish harvest. While much reduced, a commercial fishing and shellfishing industry remains on Long Island. The National Oceanic and Atmospheric Administration Fisheries, Office of Science and Technology, estimates that in 2007, the port of Montauk ranked 45th in dollar value of commercial fisheries landings in the United States with 12 million pounds valued at $15.7 million.
Sequestering Carbon
Parks and open space, by growing plants, in particular trees, sequester carbon and reduce global warming. Atmospheric carbon, in the form of carbon dioxide, is one of the key greenhouse gasses associated with global warming. Trees and other plants absorb carbon dioxide as they grow, sequestering carbon in their cellular structure. Conservation of natural lands helps store carbon in growing plants, removing it from the atmosphere.
Mitigating Hazards
Intact landscapes can provide a buffer from disturbance events. For example, coastal vegetation can reduce the damage of wave action and storm surges. Protected barrier islands and coastal wetlands can provide a buffer from hurricanes and other storm events. According to a 2008 study by Costanza et al., coastal wetlands in New York provide $271 million in storm protection services to coastal communities each year.
Stimulating Community Cohesion
Numerous studies have shown that the more webs of human relationships a neighborhood has, the stronger, safer, and more successful it is. Any institution that promotes relationship building —whether a religious institution, a club, a political campaign, a co-op, or a school—adds value to a neighborhood and, by extension, to the whole city.

39The Economic Benefits and Fiscal Impact of Parks and Open Space in Nassau and Suffolk Counties, New York
This human web, for which Jane Jacobs coined the term “social capital,” is strengthened in some communities by parks. From playgrounds to sports fields to park benches to chessboards to swimming pools to ice skating rinks to flower gardens, parks offer opportunities for people of all ages to communicate, compete, interact, learn, and grow. Perhaps more significant, the acts of improving, renewing, or even saving a park can build extraordinary levels of social capital in a neighborhood that may well be suffering from fear and alienation partially owing to the lack of safe public spaces.
Saving Energy
Natural areas with trees can cool the air, reducing the need for expensive mechanical air conditioning. Nationwide, air conditioning for residential buildings alone costs billions of dollars. Trees reduce energy use in buildings by shading them during summer, thus lowering their indoor temperatures and reducing the need for air conditioning. During winter, trees block wind and reduce heat loss. This strategy works best if trees are planted on the west and northwest sides; trees planted on the east provide the next greatest benefit. Only deciduous trees should be planted on the south side of buildings so when they lose their leaves in fall, they will allow in the warming sun in winter. Evergreen trees should be planted as windbreaks.
The Importance of Potentially Redevelopable Lands
Much of the land conservation focus on Long Island has been on the remaining acres of land that are not committed to preservation or development (i.e., open space and farmland). Left out of this discussion are those large tracts of lands (e.g., large estates and golf courses) that are potentially redevelopable. These lands will become increasingly important for land conservation on Long Island as the last remaining undeveloped open spaces are converted (i.e., developed or protected).
We identified parcels within Nassau and Suffolk Counties as potentially redevelopable if they were vacant (i.e., a lot without a building) or had significant acreage (i.e., over 20 acres in size) where, if subdivided, some of the new parcels would be vacant. We estimate that there are approximately 259,000 acres that are potentially redevelopable.
Note: This estimate represents the magnitude of the opportunity for additional conservation on lands that traditionally may not have been considered “open space.” This estimate is not exact as some landowners may not be interested in conserving, developing, or subdividing their property.
Potentially Redevelopable Acres on Long Island
Acre
Ownership Nassau County Suffolk County Total
Public owned 9,480 100,000 110,000
Private owned 52,100 96,800 149,000
Total 61,600 197,000 259,000

40 The Economic Benefits and Fiscal Impact of Parks and Open Space in Nassau and Suffolk Counties, New York
ConclusionLong Islanders have long valued their parks and open space, but many have wondered just how much they are worth. This study shows that Long Island’s parks and protected open space are major economic drivers that contribute at least $2.74 billion annually in economic benefits. In addition, Long Island’s parks and protected open space save local governments money when compared to residential development. When both property tax revenues and expenditures for services are taken into account, it becomes clear that residential development is more costly to local governments than are parks and protected open space (except in second-home communities). For the first time, parks and open space can be assigned the kind of numerical underpinning long associated with transportation, trade, housing, and other sectors.
Never has this information been more necessary than in these current economically challenging times. Difficult public policy debates that will affect the future of Long Island are occurring, and decision makers must make informed choices by considering not just the costs of preservation but also the real economic and fiscal benefits provided by these lands. This report demonstrates that preservation of parks and open space is not a luxury to put on hold, but rather a key economic driver vital to the economy of the Long Island region.
Further research is necessary. This report documents the extensive natural benefits from protected parks and open space. This analysis demonstrates the considerable benefits to business and residents of protecting water quality, farmland, parks, open space buffers around our lakes, har-bors, bays, ponds, and much more. However, we still do not know what happens to the natural value of Long Island as private open space and farmland are developed. Further research is needed on the cost to the public and the economy if the remaining natural areas and farmland are lost. Clearly, for each acre of mature forest, productive farmland, or undisturbed wetland lost, there is a measurable economic consequence.
Photo Credit: The Nature Conservancy
Summer canoe ride on a Long Island river

41The Economic Benefits and Fiscal Impact of Parks and Open Space in Nassau and Suffolk Counties, New York
Resources Related to the Economic Value of Parks and Open SpaceBedimo-Rung, A. L., Mowen, A. J., and D. Cohen. 2005. The significance of parks to physical activity and public health: A conceptual model. American Journal of Preventive Medicine 28 (2S2): 159–168.
Center for Urban Forest Research. Collection of “Benefits and Cost” Research. U.S. Forest Service. Davis, CA. http://www.fs.fed.us/psw/programs/cufr/research/studies.php?TopicID=2.
Correll, M., J. Lillydahl, H. Jane, and L. D. Singell. 1978. The effect of green belts on residential property values: Some findings on the political economy of open space. Land Economics 54 (2): 07–217.
Costanza, R., O. Pérez-Maqueo, M. Luisa Martinez, P. Sutton, S. J. Anderson, and K. Mulder. 2008. The value of coastal wetlands for hurricane protection. Ambio 37 (4): 241–248.
Crompton, J. L. 2004. The Proximate Principle: The Impact of Parks, Open Space and Water Features on Residential Property Values and the Property Tax Base. Ashburn, VA: National Recreation and Park Association.
Edwards, M. Community Guide to Development Impact Analysis: Fiscal Impact Analysis. http://www.lic.wisc.edu/shapingdane/facilitation/all_resources/impacts/analysis_fiscal.htm.
Ernst and Young. 2003. Analysis of Secondary Economic Impacts of New York City Parks. New York: New Yorkers for Parks.
Gies, E. 2006. The Health Benefits of Parks: How Parks Keep Americans and Their Communities Fit and Healthy. San Francisco: The Trust for Public Land.
Johnston, R., J. Opaluch, T. Grigalunas, and M. Mazzotta. 2001. Estimating amenity benefits of coastal farmland. Growth and Change 32: 305–325.
Long Island Pine Barrens Society. April 2007. On Course for Failure: A Call to Action on Open Space Preservation. Riverhead, NY: Long Island Pine Barrens Society.
———. June 2008. Still On Course for Failure: A Renewed Call to Action on Open Space Preservation. Riverhead, NY: Long Island Pine Barrens Society.Long Island Wine Council. Long Island Wine Region Fact Sheet. http://liwines.com (accessed on June 9, 2009).
Lutzenhiser, M., and N. Noelwahr. 2001. The effect of open spaces on a home’s sale price. Contemporary Economic Policy 19 (3): 291–298.
McPherson, E. G. 1998. Structure and sustainability of Sacramento’s urban forest. Journalof Arboriculture 24 (4): 174–190.
Miller, A. R. 2001. Valuing Open Space: Land Economics and Neighborhood Parks. Cambridge: Massachusetts Institute of Technology Center for Real Estate.

42 The Economic Benefits and Fiscal Impact of Parks and Open Space in Nassau and Suffolk Counties, New York
MKF Research LLC. 2005. Economic Impact of New York Grapes, Grape Juice and Wine 2005. (prepared for the New York Wine & Grape Foundation) St. Helena, CA: MKF Research LLC.
National Oceanic and Atmospheric Administration Fisheries, Office of Science and Technology. 2007. Total Commercial Fishery Landings at Major U. S. Ports Summarized by Year and Ranked by Dollar Value. Silver Spring, MD: National Oceanic and Atmospheric Administration Fisheries.
New York State Department of Health. Information Sheet for Consumers Served by Long Island Public Water Systems. http://www.health.state.ny.us/environmental/water/drinking/li.htm (accessed on May 7, 2009).
New York State Office of the State Comptroller. Financial Data for Local Governments. htt://www.osc.state.ny.us/localgov/datanstat/findata/index_choice.htm.
Nicholls, S. and J. L. Crompton. 2005. The impact of greenways on property values:Evidence from Austin, Texas. Journal of Leisure Research 37 (3): 321–341.
———. 2005. Why do people choose to live in golf course communities? Journal of Park and Recreation Administration 23 (1): 37–52.
Nowak, D. J., D. E. Crane, and J. C. Stevens. 2006. Air pollution removal by urban treesand shrubs in the United States. Urban Forestry and Urban Greening 4: 115–123.
Nowak, D. J., D. E. Crane, J. C. Stevens, and M. Ibarra. 2002. Brooklyn’s Urban Forest. USDA Forest Service General Technical Report. NE-290. Newtown Square, PA: U.S. Department of Agriculture.
Nowak, D. J., R. E. Hoehn, D. E. Crane, J. C. Stevens, and J. T. Walton. 2006. Assessing Urban Forest Effects and Values: Washington, D.C.’s Urban Forest. USDA Forest Service Resource Bulletin. NRS-1. Newtown Square, PA: U.S. Department of Agriculture.
Nowak, D. J., R. E. Hoehn, D. E. Crane, J. C. Stevens, J. T. Walton, J. Bond, and G. Ina. 2006. Assessing Urban Forest Effects and Values: Minneapolis’ Urban Forest. USDA Forest Service Resource Bulletin. NE-166. Newtown Square, PA: U.S. Department of Agriculture.
Nowak, D. J., P. J. McHale, M. Ibarra, D. Crane, J. Stevens, and C. Luley. 1998. Modelingthe effects of urban vegetation on air pollution. In Air Pollution Modeling and Its Application XII, ed. S. Gryning and N. Chaumerliac. New York: Plenum Press, 399–407.
Peconic Baykeeper. Baywatch 2008-09: Long Island Bay Health Report. Quogue, NY: Peconic Baykeeper.
Pennsylvania State University. 2000. Costs and Revenues of Residential Development: A Workbook for Local Officials and Citizens. http://cax.aers.psu.edu/residentialimpact/.
Stynes, D. J. 1997. Economic Impacts of Tourism: A Handbook for Tourism Professionals. Urbana: University of Illinois, Tourism Research Laboratory. http://web4.canr.msu.edu/mgm2/econ.
Stynes, D. J., D. B. Propst, W. H. Chang, and Y. Sun. 2000. Estimating Regional Economic Impacts of Park Visitor Spending: Money Generation Model Version 2 (MGM2). East Lansing: Department of Park, Recreation and Tourism Resources, Michigan State University.U.S. Bureau of Economic Analysis. 2007. Regional Economic Accounts. Washington, DC: U.S. Department of Commerce.

43The Economic Benefits and Fiscal Impact of Parks and Open Space in Nassau and Suffolk Counties, New York
U.S. Department of Agriculture, National Agricultural Statistical Service, New York Office. Cash Receipts from Farm Marketings, by County, New York, 2006–2007. Washington, DC: U.S. Department of Agriculture.
Wachter, S. M., and G. Wong. July 2006. What Is a Tree Worth? Green-City Strategies and Housing Prices. http://ssrn.com/abstract=931736.
Walker, C. 2004. The Public Value of Urban Parks. Washington, DC: Urban Institute. http://www.wallacefoundation.org/NR/rdonlyres/5EB4590E-5E12-4E72-B00D-613A42E292E9/0/ThePublicValueofUrbanParks.pdf.
Written communication from:
Long Island Wine Council, June 17, 2009Suffolk County Water Authority, April 3 and 23, 2009 Frank M. Flowers and Sons, Inc., November, 5, 2009Geographic Information System (GIS) data sources: Early Years InstituteNassau County The Nature ConservancyNew York State Department of Environmental ConservationNew York State Office of Cyber Security and Critical InfrastructureNew York State Office of Parks, Recreation and Historic PreservationNorth Shore Land AllianceSuffolk CountySuffolk County Water Authority
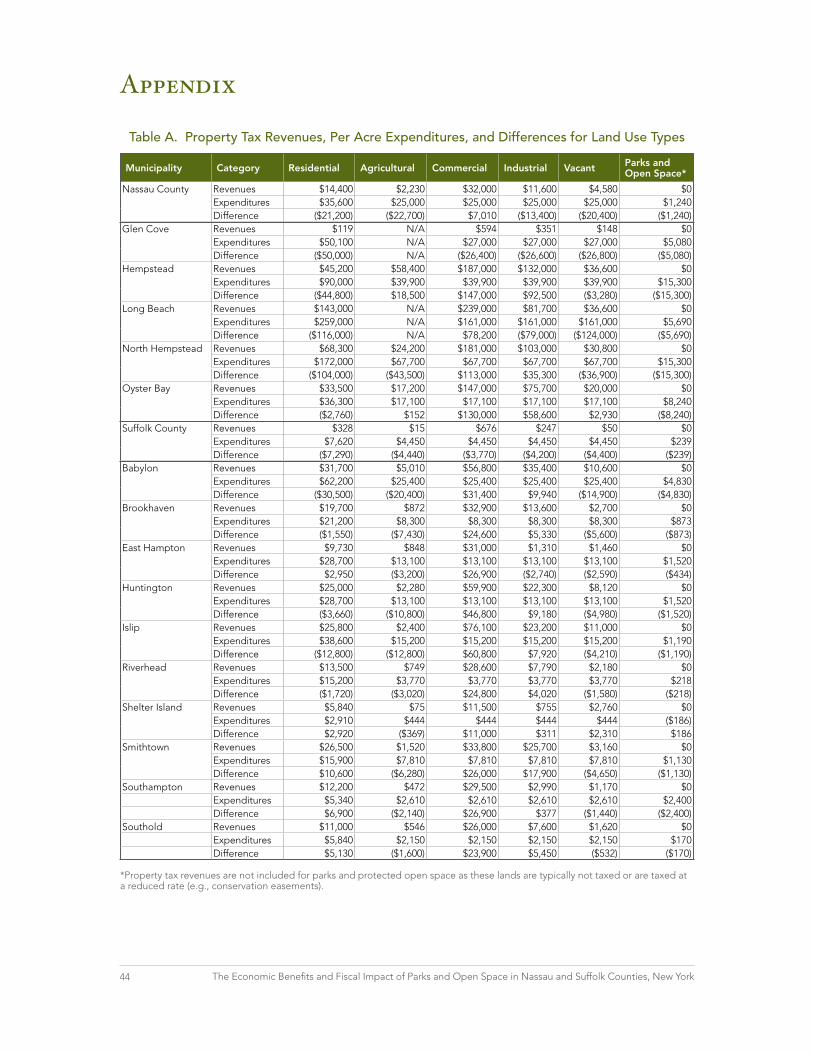
44 The Economic Benefits and Fiscal Impact of Parks and Open Space in Nassau and Suffolk Counties, New York
Municipality Category Residential Agricultural Commercial Industrial Vacant Parks and Open Space*
Nassau County Revenues $14,400 $2,230 $32,000 $11,600 $4,580 $0 Expenditures $35,600 $25,000 $25,000 $25,000 $25,000 $1,240 Difference ($21,200) ($22,700) $7,010 ($13,400) ($20,400) ($1,240)
Glen Cove Revenues $119 N/A $594 $351 $148 $0 Expenditures $50,100 N/A $27,000 $27,000 $27,000 $5,080 Difference ($50,000) N/A ($26,400) ($26,600) ($26,800) ($5,080)
Hempstead Revenues $45,200 $58,400 $187,000 $132,000 $36,600 $0 Expenditures $90,000 $39,900 $39,900 $39,900 $39,900 $15,300 Difference ($44,800) $18,500 $147,000 $92,500 ($3,280) ($15,300)
Long Beach Revenues $143,000 N/A $239,000 $81,700 $36,600 $0 Expenditures $259,000 N/A $161,000 $161,000 $161,000 $5,690 Difference ($116,000) N/A $78,200 ($79,000) ($124,000) ($5,690)
North Hempstead Revenues $68,300 $24,200 $181,000 $103,000 $30,800 $0 Expenditures $172,000 $67,700 $67,700 $67,700 $67,700 $15,300 Difference ($104,000) ($43,500) $113,000 $35,300 ($36,900) ($15,300)
Oyster Bay Revenues $33,500 $17,200 $147,000 $75,700 $20,000 $0 Expenditures $36,300 $17,100 $17,100 $17,100 $17,100 $8,240 Difference ($2,760) $152 $130,000 $58,600 $2,930 ($8,240)
Suffolk County Revenues $328 $15 $676 $247 $50 $0 Expenditures $7,620 $4,450 $4,450 $4,450 $4,450 $239 Difference ($7,290) ($4,440) ($3,770) ($4,200) ($4,400) ($239)
Babylon Revenues $31,700 $5,010 $56,800 $35,400 $10,600 $0 Expenditures $62,200 $25,400 $25,400 $25,400 $25,400 $4,830 Difference ($30,500) ($20,400) $31,400 $9,940 ($14,900) ($4,830)
Brookhaven Revenues $19,700 $872 $32,900 $13,600 $2,700 $0 Expenditures $21,200 $8,300 $8,300 $8,300 $8,300 $873 Difference ($1,550) ($7,430) $24,600 $5,330 ($5,600) ($873)
East Hampton Revenues $9,730 $848 $31,000 $1,310 $1,460 $0 Expenditures $28,700 $13,100 $13,100 $13,100 $13,100 $1,520 Difference $2,950 ($3,200) $26,900 ($2,740) ($2,590) ($434)
Huntington Revenues $25,000 $2,280 $59,900 $22,300 $8,120 $0 Expenditures $28,700 $13,100 $13,100 $13,100 $13,100 $1,520 Difference ($3,660) ($10,800) $46,800 $9,180 ($4,980) ($1,520)
Islip Revenues $25,800 $2,400 $76,100 $23,200 $11,000 $0 Expenditures $38,600 $15,200 $15,200 $15,200 $15,200 $1,190 Difference ($12,800) ($12,800) $60,800 $7,920 ($4,210) ($1,190)
Riverhead Revenues $13,500 $749 $28,600 $7,790 $2,180 $0 Expenditures $15,200 $3,770 $3,770 $3,770 $3,770 $218 Difference ($1,720) ($3,020) $24,800 $4,020 ($1,580) ($218)
Shelter Island Revenues $5,840 $75 $11,500 $755 $2,760 $0 Expenditures $2,910 $444 $444 $444 $444 ($186)Difference $2,920 ($369) $11,000 $311 $2,310 $186
Smithtown Revenues $26,500 $1,520 $33,800 $25,700 $3,160 $0 Expenditures $15,900 $7,810 $7,810 $7,810 $7,810 $1,130 Difference $10,600 ($6,280) $26,000 $17,900 ($4,650) ($1,130)
Southampton Revenues $12,200 $472 $29,500 $2,990 $1,170 $0 Expenditures $5,340 $2,610 $2,610 $2,610 $2,610 $2,400 Difference $6,900 ($2,140) $26,900 $377 ($1,440) ($2,400)
Southold Revenues $11,000 $546 $26,000 $7,600 $1,620 $0 Expenditures $5,840 $2,150 $2,150 $2,150 $2,150 $170 Difference $5,130 ($1,600) $23,900 $5,450 ($532) ($170)
Table A. Property Tax Revenues, Per Acre Expenditures, and Differences for Land Use Types
Appendix
*Property tax revenues are not included for parks and protected open space as these lands are typically not taxed or are taxed at a reduced rate (e.g., conservation easements).

Cover Photos: Left: Jerry Monkman; Right: Alan Chin

The Economic Benefits and Fiscal Impact of Parks and Open Space in Nassau and Suffolk Counties, New York
A Report by The Trust for Public Landfor the Long Island Community Foundation and the Rauch Foundation
Conservation FinanCe Programthe trust For PubliC land
33 union street, FiFth Floorboston, ma 02108
617.367.6200
national oFFiCe the trust For PubliC land
101 montgomery street, suite 900san FranCisCo, Ca 94104
415.495.4014
tpl.org