Embed Size (px)
Citation preview
The Ecological Footprint of Oil Production and Sustainability
Chris W Baynard, PhDUniversity of North Florida
ESRI Petroleum User Group ConferenceHouston, TexasFeb 23, 2009

Measuring Environmental Performance: some examples
• Internal CSR Reports– Environmental Performance section
• International Organization for Standardization–ISO 14031
• Global Reporting Initiative (GRI)• International Petroleum Industry Environmental Conservation Association (IPIECA)
• American Petroleum Institute (API)• Environmental Sustainability Index (ESI)• Ecological Footprint (EF) index

Ecological Footprint
• Simple measure of demand for natural resources.• Quantifies amount of productive land required to support human consumption patterns, as well as the wastes generated.
• Considers “how much of the regenerative biological capacity of the planet is demanded by a given human activity.”
• Unit of analysis: land area– in hectares per capita.(Ewers and Smith 2007; ESI 2005; Kitzes et al. 2009, 813, Siche et al. 2008).

Limits to ecological footprint
• Spatial scale is too large (global hectares).
• Does not account for habitat fragmentation and loss of biodiversity resulting from specific extractive operations.
• Difficult to measure company performance on a concession basis.
• Excludes the use of GIS and remote sensing in its methodology.

Research Question?
• How can we use geospatial technologies to quantify and rank the ecological footprint created by E&P activities at the landscape level?
• E.g. Sara Tyler‐ Shell WindEnergy: site screening methodology 2009 PUG Plenary Session. But in this case instead of site selection, use GIS and RS to measure existing alterations.

Alternative?Landscape‐level Ecological Footprint
(LEF)• Based on landscape ecology metrics.
• Uses GIS and satellite imagery.
• Quantitative, objective, replicable.
• New index for companies and 3rd parties to monitor ecological footprint remotely.

Case Study: Venezuela’s Heavy Oil Belt (HOB)
SincorPetrozuataAmerivenCerro Negro

SINCORPDVSA 38%Total (France) 47%
Statoil (Norway) 15%
PETROZUATAPDVSA 49.9%
ConocoPhillips 50.1%
AMERIVENPDVSA 30%Chevron 30%
ConocoPhillips 40%
CERRO NEGROPDVSA 41.67% ExxonMobil 41.67% BP (United Kingdom) 16.66%
Heavy Oil Belt as of 2005

HOB FiguresSincor Petrozuata Ameriven Cerro Negro
Syncrude Production and Upgraded Quality
180,000 b/d 104,000 b/d 190,000 b/d 105,000 b/d
From 8.5º to 32ºAPI
From 9º to 19-25º API
From 7-10º to 26º API
From 6º-10ºto 16º API
Congressional Authorization 1993 1993 1997 1997
Early Production 2001 1999 2002 1999Full Production (Upgrader Start-up)
Mar-02 Jan-01 Oct-04 Aug-01
Sources: Petroguía., 2006-2007; Talwani, M., 2002; Mommer, B., 2004; Gipson et al., 2002; Chevron, 2008.

Methods (LEF)1. Change Detection: NDVI Image Differencing (ERDAS Imagine
9.2)
A. Red=negative vegetation change—loss
B. Green= positive change– gain
C. Black= small/no difference
2. Infrastructure Density: (ESRI ArcInfo 9.2)
A. Petroscape
B. Nonpetroscape
3. Edge‐Effect Zone
4. Core Areas
5. Number of Rivers Crossed
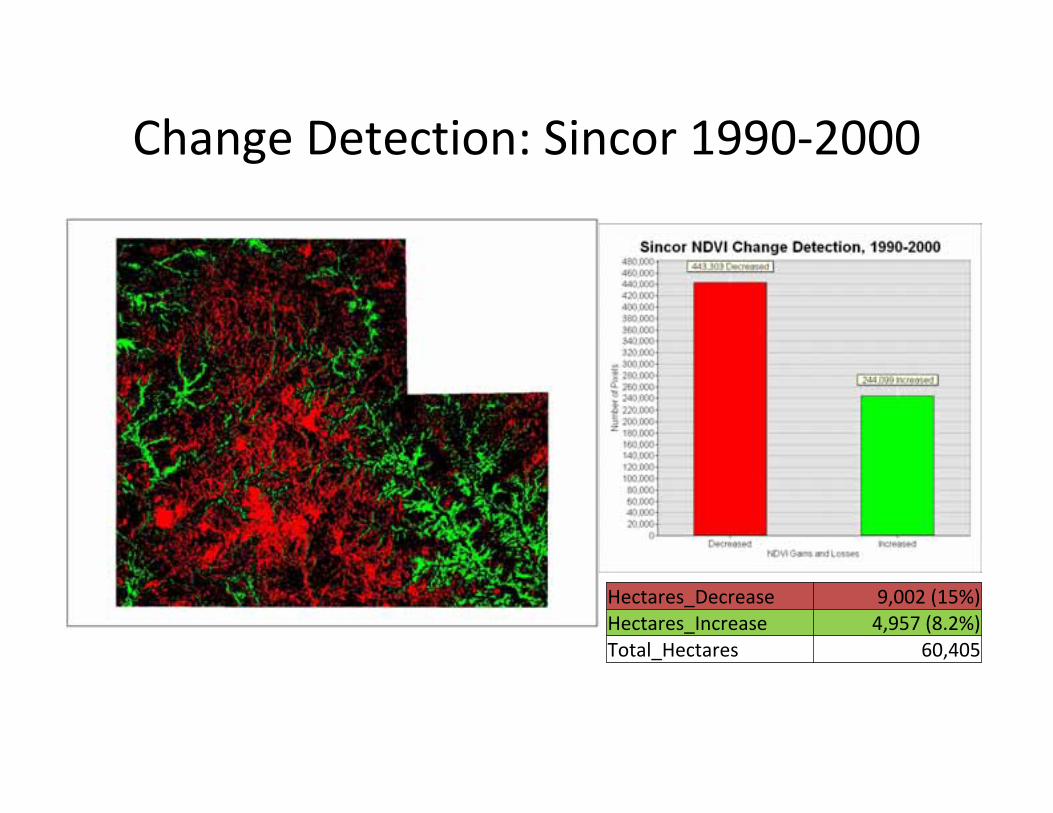
Change Detection: Sincor 1990‐2000
Hectares_Decrease 9,002 (15%)Hectares_Increase 4,957 (8.2%)Total_Hectares 60,405

Change Detection: Petrozuata 1990‐2000
Hectares_Decrease 7,108 (13%)Hectares_Increase 3,802 (7%)Total_Hectares 54,714

Change Detection: Ameriven 1990‐2000
Hectares_Decrease 32,385 (47%)Hectares_Increase 232 (.33%)Total_Hectares 69,536

Petroscape Density Sincor: 1990, 2000, 2005
.19 km .47 km
.58 km

Petroscape Density Petrozuata: 1990, 2000, 2005
.17 km
1.13 km
.95 km
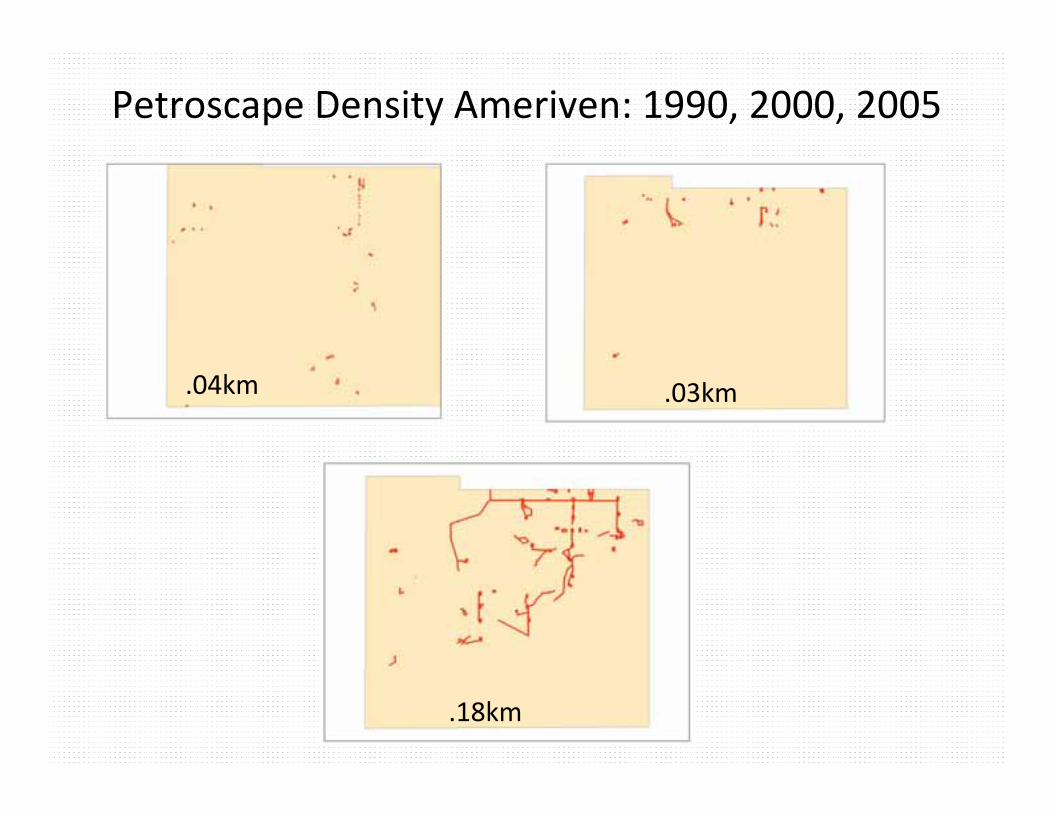
Petroscape Density Ameriven: 1990, 2000, 2005
.04km
.18km
.03km

Petroscape Density Cerro Negro: 1990, 2000, 2005
.01 km
.39 km
.31 km
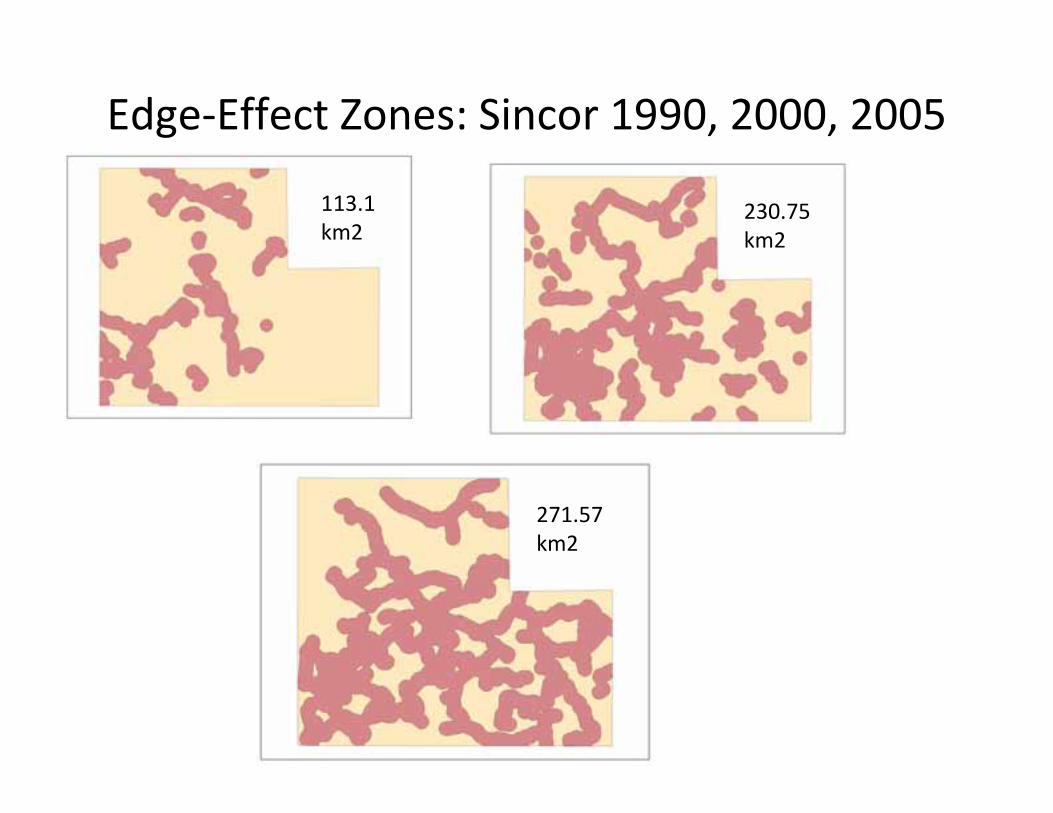
Edge‐Effect Zones: Sincor 1990, 2000, 2005
113.1 km2
271.57km2
230.75 km2

Edge‐Effect Zones: Petrozuata 1990, 2000, 2005
59.45 km2
222.49 km2
194.79 km2

Edge‐Effect Zones: Ameriven 1990, 2000, 2005
38.43 km2
30.16 km2
117.07 km2

Edge‐Effect Zones: Cerro Negro 1990, 2000, 2005
36.83 km2
101.63 km2
115.85 km2

Core‐Areas Sincor 1990, 2000, 2005
404.28 km2
286.63 km2
245.8 km2

Core‐Areas Petrozuata 1990, 2000, 2005
241.32 km2 105.98
km2
78.29 km2

Core‐Areas Ameriven 1990, 2000, 2005
627 km2 635.27 km2
548.37 km2

Core‐Areas Cerro Negro 1990, 2000, 2005
266.32 km2 187.30 km2
201.52 km2

Rivers Crossed Sincor: 1990, 2000, 2005
515
53

Rivers Crossed Petrozuata: 1990, 2000, 2005
0 18
26

Rivers Crossed Ameriven: 1990, 2000, 2005
0 0
1

Rivers Crossed Cerro Negro: 1990, 2000, 2005
00
0
0
0

Results: Full Production 2005lower # = better score; *= inverted score
SINCOR PETROZUATA AMERIVEN CERRO NEGRO RANK
NEG VEG CHANGE % 2000
15% 13% 47% n/a Petrozuata 1Sincor 2Ameriven 3
POS VEGCHANGE % 2000*
5.2% 7% .33% n/a Petrozuata 1Sincor 2Ameriven 3
PETROSCAPE DENSITY
.58 km2 1.13 km2 .18 km2 .39 km2 Ameriven 1Cerro Negro 2Sincor 3Petrozuata 4
EDGE‐EFFECT 271.57 km2 222.49 km 2 117.07 km2 101.63 km2 Cerro Negro 1Ameriven 2Petrozuata 3Sincor 4
CORE‐AREAS* 245.8 km2 78.29 km2 548.37 km2 201.52 km2 Ameriven 1Sincor 2Cerro Negro 3Petrozuata 4
# RIVERS CROSSED
53 26 1 0 Cerro Negro 1Ameriven 2Petrozuata 3Sincor 4

Final Rank 2005
SINCOR PETROZUATA AMERIVEN CERRO NEGRO
Total 13 14 6 7
Rank 1‐4 3 4 1 2
Company Participation
NOC 38%Total 47%Statoil 15%
NOC 49.9%ConocoPhillips 50.1%
NOC 30%Chevron 30%ConocoPhillips 40%
NOC 41.67% ExxonMobil 41.67% BP 16.66%

What is the business case?
• Saves money, lowers reclamation costs, reduce infrastructure building expenses, limit illegal settlements.
• Avoids negative publicity, fines, litigation
• Attracts green investors/customers, employees.
• Competitive advantage (compare env best practices; include in sustainability reporting).
Sources: Morhardt 2002; Morhardt et al. 2002; Diamond 2005; Lawrence 2007; Anderson 1994; Orlitzky et al. 2003; Kakadabase 2007; Dashwood 2007; Reinhardt 2000; Shapiro 2000)

Challenges with LEF
• Requires skilled personnel
• Requires satellite data
• Distinguishing petro from nonpetroscape (and other economic activities)
• Lacks field visit data (ground truthing, training samples)

Advantages of LEF
• Systematic
• In house/third party (eventually web‐based services)
• Replicable
• Provides an index to measure performance yearly (room for improvement)
• Site specific, but can be averaged
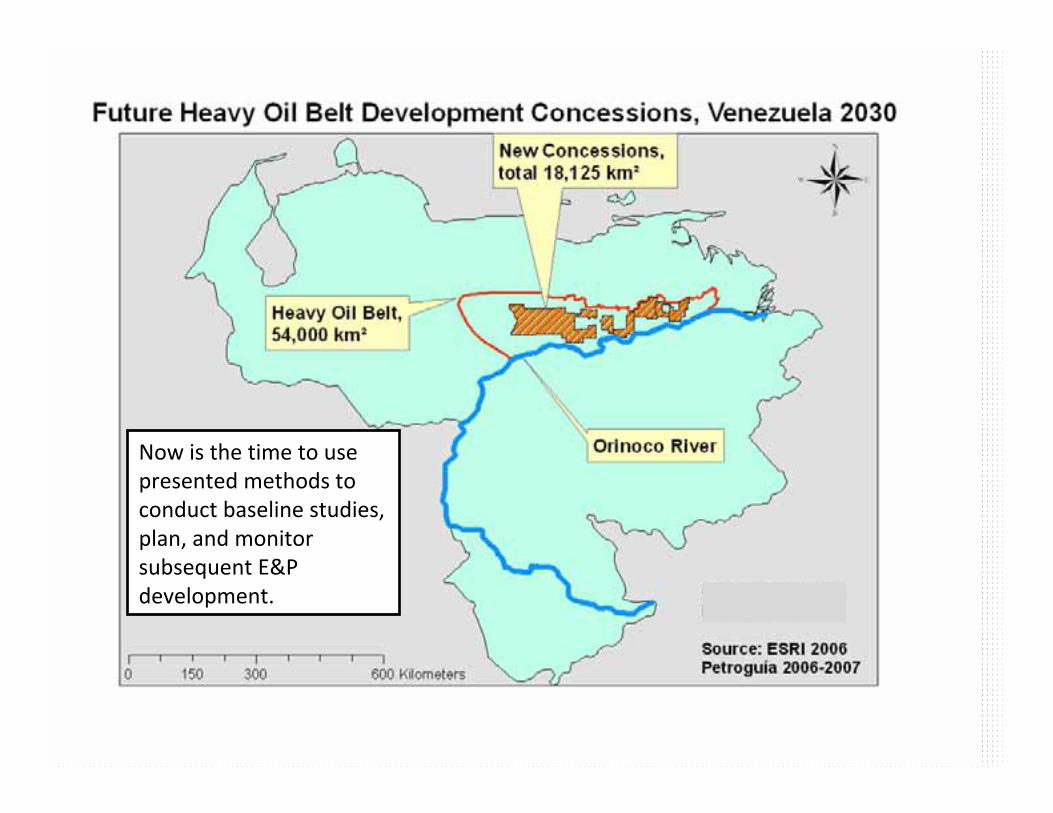
Now is the time to use presented methods to conduct baseline studies, plan, and monitor subsequent E&P development.

Implications/Future Research
• Create geoprocessing model/ArcGIS Explorer (suggested by Peter Becker: ESRI)
• Weight/refine variables• Model different density scenarios• Cross‐country comparison• Quantify and rank other extractive industries• Investigate business culture/management decision‐making to help explain observed variations

References
• Anderson, L. E. 1994. The Political Ecology of the Modern Peasant: Calculation and Community. Johns Hopkins University Press, Baltimore.
• Chevron, 2008. Venezuela Fact Sheet. http://www.chevron.com/documents/pdf/venezuelafactsheet.pdf
• Dashwood, H. S., 2007. Canadian mining companies and corporate social responsibility: weighing the impact of global norms. Canadian Journal of Political Science 40 (1), 129‐156.
• Diamond, J., 2005. Collapse: How Societies Choose to Fail or Succeed. Viking, New York.
• ESI. 2005. 2005 environmental sustainability index: benchmarking national environmental stewardship. Appendix F comparing the ESI with other sustainability indicators. CIESIN and YCELP. http://sedac.ciesin.columbia.edu/es/esi/f_comparing.pdf

References cont.
• Ewers, R. M., Smith, R. J. 2007. Choice of index determines relationship between corruption and environmental sustainability. Ecology and Society 12(1):r2. http://www.ecologyandsociety.org/vol12/iss1/resp2
• Gipson, L. J., Owen, R., Robertson, C. R., 2002. Hamaca heavy oil project: lessons learned and an evolving development strategy. Society ofPetroleum Engineers 78990, 1‐9.
• Kakabadse, A. P., 2007. Being responsible: boards are reexamining the bottom line. Leadership in Action 27 (1), 2‐6.
• Kitzes, J., Wackernagel, M. 2009. Answers to common questions inecological footprint accounting. Ecological Indicators. 9 (4). 812‐817.
• Lawrence, R., 2007. Corporate social responsibility, supply‐chains and Saami claims: tracing the political in the Finnish forestry industry. Geographical Research 45 (2), 167‐176.

References cont.
• Mommer, B., 2004. The value of extra‐heavy crude oil from the Orinoco belt. Venezuelan Ministry of Energy and Mines. http://www.soberania.org/Archivos/doktor_mommer_orimulsion.pdf .
• Morhardt, J. E., 2002. Clean, Green, and Read All Over: Ten Rules for Effective Corporate Environmental and Sustainability Reporting. ASQ Quality Press, Milwaukee, WI.
• Morhardt, J. E., Baird, S., Freeman, K., 2002. Scoring corporateenvironmental and sustainability reports using GRI 2000, ISO 14031, and other criteria. Corporate Social Responsibility and Environmental Management 9, 215‐233.
• Orlitzky, M., Schmidt, F. L., Rynes, S. L., 2003. Corporate social and financial performance: a meta‐analysis. Organization Studies 24 (3), 403‐441.

References cont.• Petroguía., 2006‐2007. Energy map of Venezuela. Editorial Los Barrosos,
Caracas, Venezuela.• Reinhardt, F. L., 2000. Bringing the environment down to earth. In: Harvard
Business Review: on Business and the Environment. Harvard Business School Press, Boston.
• Siche, J. R., Agostinho, F., Ortega, E., Romeiro, A. 2008. Sustainability of nations by indices: comparative study between environmental sustainability index, ecological footprint and the emergy performance indices. Ecological economics 66. 628‐637.
• Shapiro, R. B. 2000. Cited in: Magretta, J. Growth through global sustainability: an interview with Monsanto’s CEO, Robert B. Shapiro. In: Harvard Business Review: on Business and the Environment. Harvard Business School Press, Boston.
• Talwani, M., 2002. The Orinoco heavy oil belt in Venezuela: Or heavy oil to the rescue? Rice University Department of Earth Science, Houston, TX. http://cohesion.rice.edu/naturalsciences/earthscience/research.cfm?doc_id=2819

Questions?
Chris W. Baynard, PhD
Dept of Economics & Geography
Coggin College of Business
University of North Florida