Embed Size (px)
Citation preview

117

117

118
The EC-FAO Partnership Programme on Information and Analysis for Sustainable ForestManagement: Linking National and International Efforts in South Asia and Southeast Asia isdesigned to enhance country capacities to collect and analyze relevant data, and to disseminate andup-to-date information on forestry, and to make this information more readily available for strategicdecision making. Thirteen countries in South and Southeast Asia (Bangladesh, Bhutan, Cambodia,India, Indonesia, Laos, Malaysia, Nepal, Pakistan, Philippines, Sri Lanka, Thailand and Viet Nam)participate in the Programme. Operating under the guidance of the Asia-Pacific ForestryCommission (APFC) Working Group on Statistics and Information, the initiative is implemented bythe Food and Agriculture Organization of the United Nations in close partnership with experts fromparticipating countries. It draws on experience gained from similar EC-FAO efforts in Africa, andthe Caribbean and Latin America and is funded by the European Commission.
Cover Design:Thomas Enters
Cover Photo:Masakazu Kashio
For copies write to:Patrick B. DurstSenior Forestry OfficerFAO Regional Office for Asia and the Pacific39 Phra Atit RoadBangkok 10200Thailand
Printed and published in Bangkok, Thailand
© FAO 2002ISBN 974-79-46-31-9
The designations employed and the presentation of the material in this publication do notimply the expression of any opinion whatsoever on the part of the Food and AgricultureOrganization of the United Nations concerning the legal status of any country, territory, cityor area or of its authorities, or concerning the delimitation of its frontiers or boundaries. Theword “countries” appearing in the text refers to countries, territories and areas withoutdistinction. The designations “developed” and “developing” countries are intended forstatistical convenience and do not necessarily express a judgement about the stage reached bya particular country or area in the development process. The opinions expressed in thearticles by contributing authors are not necessarily those of FAO.

119
EUROPEAN COMMISSIONDIRECTORATE-GENERALDEVELOPMENT
Information and Analysis for Sustainable Forest Management:Linking National and International Efforts in
South and Southeast Asia
EC-FAO PARTNERSHIP PROGRAMME (2000-2002)Tropical Forestry Budget Line B7-6201/1B/98/0531
PROJECT GCP/RAS/173/ECin collaboration with
Forestry Department Headquarters, Rome
An overview of forest products statistics in South andSoutheast Asia
edited byQiang Ma and Jeremy S. Broadhead

120
FOREWORD
Making appropriate and timely decisions is important in managing forest resources and inachieving sustainable management of forests and tree resources, a declared goal ofvirtually all national forest policies in the Asia-Pacific region. The growing demand for arange of goods and services by different stakeholders has increased the complexity ofsustainable forest management and the volume, value and direction of trade of forestproducts are undergoing significant shifts. Resolving conflicts between different demandsnow and in the future requires substantial improvement in the present systems forcollecting and analyzing data and disseminating information.
Forestry statistics in Asia are inadequate. As a result, many decisions are based oninaccurate, incomplete or outdated information. Although many efforts have been made,and continue to be made, at national and international levels to improve this situation,capacities for providing relevant and up-to-date information remain weak in mostcountries. Strengthening statistics on forest products is crucial for improving forest policyformulation and planning at the national and sub-national levels.This report reviews the current status of data collection, data processing and dissemination ofinformation in the context of implementing sustainable forest management in the Asia-Pacificregion. It provides insights into forest products statistics in 12 countries of Tropical Asia. Thedocument consists of two main parts: (1) a regional synthesis on forest products statistics; and (2)country profiles that describe the current situation at national levels.
The country profiles review the existing data related to forest products and trade(roundwood, wood charcoal, wood chips, particles and residues, sawnwood, wood-basedpanels, pulp and recovered paper, paper and paperboard); identify main weaknesses andconstraints in current statistical systems; and propose practical measures for improving datacollection, data processing and regular dissemination of information on forest products.This report includes contributions provided by: D.B. Dhital (Bhutan); Det Seila (Cambodia);Pratap Singh (India); Magdalena Gultom, Ahmad Pribadi, Nurcahyo Adi and Rubiandono(Indonesia); Somchay Sanonty (Lao PDR); Dan Yit May (Malaysia); Swoyambhu Man Amatya(Nepal); Tarik Nazir Chaudhry (Pakistan); Dolores R. Catindig (the Philippines); A.N.S.Baminiwatta (Sri Lanka); Suchart Thaipetch (Thailand); and Phan Trung Dien (Viet Nam). Theinputs of the authors and their unnamed assistants are acknowledged.
Various colleagues at FAO headquarters in Rome and at the FAO Regional Office inBangkok have been involved in the preparation of the country profiles and the regionaloverview. C.T.S. Nair, F. Padovani and T. Enters provided overall guidance andcoordination for the study, and contributed to the collection, analysis and finalization ofthe information presented in this volume. Their assistance is appreciated. Furthermore, wewould like to thank the European Commission for the financial support given for thiswork through the Tropical Forestry Budget Line B7-6201/97.It is hoped that readers will find this publication useful and that it will contribute not only toimproving forest products statistics in Asia but even more so to better decision-making.

121
ABBREVIATIONS AND ACRONYMS
AAC Annual Allowable CutADB Asian Development BankAJK State of Azad Jammu and KashmirAPHI Asosiasi Pengusaha Hutan Indonesia (Indonesian Association for Forest
Concession Holders)APKINDO Asosiasi Panel Kayu Indonesia (Indonesian Wood Panel Association)ARM Assistant Regional Manager of the STCARMM Autonomous Region for Muslim MindanaoAWP Annual Working PlanBAPLAN Badan Planology/Forestry Planning agencyBEHPHH Balai Eksploitasi Hutan and Pengujian Hasil Hutan (Forest Exploitation
Agency)BOE Bill of EntryBPS Biro Pusat Statistik (Central Board of Statistics)C & I Criteria & IndicatorsCAR Cordillera Administrative RegionCBFM Community-based Forest ManagementCBS Central Bureau of StatisticsCCF Chief Conservator of ForestsCDR Central Development RegionCENRO Community Environment and Natural Resources OfficeCES Compendium on Environment StatisticsCF Conservator of ForestsCft. Cubic feetCham BeamCHK Custom House, KarachiCIF Cost Insurance FreightCSO Central Statistical OrganisationDangchung Slim poles holding roof shingles, laid top to bottom.DAO Department Administrative OrderDCF (FI & M) Deputy Conservator of Forests (Forest Inventory & Management)DCF (R) Deputy Conservator of Forests (attached to a specified region)DENR Department of Environment and Natural ResourcesDFO Divisional Forest OfficerDFPSC District Forest Products Supply CommitteeDG Directorate GeneralDGFPD Directorate General of Forest Product DevelopmentDishut Kabupaten Dinas Kehutanan Kabupaten (District Forestry Office, under
Bupati/Mayor)Dishut Propinsi Dinas Kehutanan Propinsi (Provincial Forestry Office, under governor)DM Divisional Manager (under FDCL)DOE Department of EnergyDoF Department of ForestsDoFS Department of Forestry ServicesDPC Data Processing CentreDR Reforestation feeDR&C Department of Revenue & CustomsDrashing Trees used for sawlogsDWF Department of Forestry and WildlifeDWLC Department of Wildlife Conservation

122
DzFO Dzongkhag Forest OfficerDzong FortressDzongkhag DistrictEA1P Environment Action 1 ProjectEDR Eastern Development RegionENR Environment and Natural ResourcesESIA Environmental and Social Impact AssessmentFAO Food and Agriculture OrganizationFBS Federal Bureau of StatisticsFD HQ Head Office of the Forest DepartmentFD Forest DepartmentFDCL Forestry Development Corporation LimitedFDPM Forestry Department of Peninsular MalaysiaFED Forest Extension DivisionFMB Forest Management BureauFMO Forest Management OfficeFMU Forest Management UnitFNCCI Federation of Nepal Chambers of Commerce and IndustriesFOB Free-on-BoardFPDB Forest Products Development BoardFPUD Forest Protection and Utilisation DivisionFRDD Forest Resources Development DivisionFRI Forest Research InstituteFRIM Forest Research Institute, MalaysiaFRMP Forest Resources Management ProjectFSIS Forest Statistics Information SystemFSMP Forestry Sector Master PlanFSMS Forest Stocks Monitoring SystemFWDR Far Western Development RegionGDP Gross Domestic ProductGeog BlockGIS Geographic Information SystemGO Governmental OrganisationGOI The Government of IndonesiaGOSL Government of Sri LankaGVA Gross Value AddedHECS Household Energy Consumption SurveyHESS Household Energy Strategy StudyHPH Hak Pengusahaan Hutan (Forest Concession Right)HQ HeadquartersHS Harmonised SystemHSP Harmonized System of the PhilippinesHTI Hutan Tanaman Industri (Industrial Tree Plantation)IFMA Industrial Forest Management AgreementIHH/PSDH Iuran Hasil Hutan /Provisi Sumber Daya Hutan (Forest Product Royalty)IHPH Forest Concession Licence FeeILO International Labour OrganisationIMOS Integrated MTIB Operations SystemIMS Information Management SystemITTO International Tropical Timber OrganisationJEDB Janatha Estates Development BoardJFSQ Joint Forestry Sector QuestionnaireJICA Japan International Cooperation AgencyJQ Joint QuestionnaireKAMFOREXIM Kampuchea Forest exports and Imports

123
Kanwil Kehutanan Regional Forestry Office under MOFKLUI Klasifikasi Lapangan Usaha Indonesia. This is a modification of the
International Standard Industrial Classification of all EconomicActivities (ISIC) revision 3. KLUI is an industrial classification adoptedin the manufacturing industry survey, while HS and SITS are thecommodities that are produced by such industrial classification.
LAN Local Area NetworkLGU Local Government UnitMATRADE Malaysia External Trade Development CorporationMENR Ministry of Environment and Natural ResourcesMFSC Ministry of Forests and Soil ConservationMIS Management Information SystemMIT Ministry of Industry and TradeMITI Ministry of International Trade and Industry, MalaysiaMoA Ministry of AgricultureMOA Ministry of AgricultureMoF Ministry of FinanceMOF/MOFEC Ministry of Forestry / Ministry of Forestry and Estate CropMPFD Master Plan for Forestry DevelopmentMPI Ministry of Primary Industries, MalaysiaMRC Mekong River CommissionMTIB Malaysian Timber Industry BoardMWDR Mid-Western Development RegionN. As Northern AreasNCD Nature Conservation DivisionNCR National Capital RegionNEC National Environment CommissionNFP National Forestation ProgramNGO Non-Governmental OrganisationNSCB National Statistical Coordination BoardNSO National Statistics OfficeNu. Ngultrum, Bhutanese currency. (US$1 = 48.68 Ngultrum)NWFP (Pakistan) North West Frontier ProvinceNWFP Non Wood Forest ProductsPENRO Provincial Environment and Natural Resources OfficePFDA Private Forest Development AgreementPFS Philippine Forestry Statistics<PLOT> Statistical software for analysing inventory dataPMMD Plantation Management Monitoring DivisionPPB Land Improvement TaxPPMS Physical Performance Monitoring SystemPSCC Philippine Standard Commodity ClassificationRENRO Regional Environment and Natural Resources OfficeRFO Range Forest OfficerRFPO Regional Forestry Planning OfficeRGC Royal Government of CambodiaRGOB Royal Government of BhutanRM Regional Manager of the STCRNR-RC Renewable Natural Resources – Research CentresRP Republic of the PhilippinesRPC Regional Plantation CompanyRPMS Revised Price Monitoring SystemRRA Rapid Rural AppraisalRS Remote SensingS2S Sawntimber with two smooth surfaces

124
S4S Sawntimber with four smooth surfacesSB Shipping BillShinglep Shingles (Usually fir trees are used for making shingles)SIFMA Socialized Industrial Forest Management SystemSITC Standard International Trade ClassificationSLR Sri Lanka RupeesSLSPC Sri Lanka State Plantation CorporationSRO Statutory regulatory orderSRS Statistical Reporting SystemSTC HQ Head Office of the State Timber CorporationSTC State Timber CorporationSTIDC Sarawak Timber Industry Development CorporationSWOT Strengths, Weaknesses, Opportunities and Threats (Analysis method)TCN Timber Corporation of NepalThram Land record documentTPTI Indonesian Selective Cutting System/ Indonesian Selective Cutting and
Planting Silvicultural SystemTSI Timber Stand ImprovementTsim Slim poles that are laid horizontally on the roof to hold shinglesUNDP United Nations Development ProgrammeUNECE United Nations Economic Commission for EuropeUSAID United States Agency for International DevelopmentWB World BankWCO World Customs OrganisationWDR Western Development Region

125
INTRODUCTIONAchieving sustainable management of forests and tree resources and enhancing the supply ofgoods and services that forests provide are the goals of most national forest policies in the Asia-Pacific region. The growing demand for a range of goods and services by different stakeholdershas increased the complexity of sustainable forest management, especially if varying demands areconflicting. With many economies liberalising, the volume, value and direction of trade, includingthat in forest products, are undergoing significant changes. Resolving conflicts between thedifferent demands now and in the future requires substantial improvement in the systems forcollecting and analysing data and sharing information. Yet capacities for providing relevant andup-to-date information remain weak in most countries. This study discusses some of the issuesrelating to the current status of data collection, processing and dissemination of information in thecontext of implementing sustainable forest management in the Asia-Pacific region.
IMPACTS OF KEY CHANGES IN FORESTS AND FORESTRY IN THE REGION1
The Asia Pacific Forestry Sector Outlook Study (APFSOS) completed in 1998 revealed a numberof interesting trends in the development of forestry. With some of the fastest growing economiesin the world, fundamental shifts in the economic, social and institutional environments in theregion have had striking impacts on forests and forestry. Some important changes with a bearingon forestry statistics are indicated below.
Institutional changes
An important institutional change in most countries is the diminishing role of the public sector inforest resource management and a corresponding increase in private sector efforts, especially asregards production of wood and non-wood forest products. This has important implications for theproduction of forestry statistics. Since government revenues and budget allocations for forestrydepartments were largely dependent on the quantity of wood produced, forestry departmentscollected and analysed production-related data. This also ensured that removals remained withinthe stipulated annual allowable cut. As wood production, processing and trade shift to the privatesector – including farmers, community groups and industries – governmental systems of datacollection and reporting are becoming less effective.As a result of decentralisation, sub-national entities, such as provincial and district governments,are increasingly assuming responsibility for forest management in several countries. Thesedecentralised agencies are expected to manage forest resources with full recognition of localneeds and priorities. While the approach has a number of advantages, especially throughincreasing management responsiveness to local aims and needs and enhancing communityinvolvement, there are a number of transitional problems. Often there is little capacity toefficiently manage forests and, more importantly, monitoring of forest management sustainabilityis often largely prevented by the absence of effective information systems. Information flow fromsub-national units to national organisations is therefore weakened along with the ability tomonitor change.
“Break down” of information flows caused by decentralization in Indonesia
Before the decentralisation policies were implemented, institutions involved in forestry,such as logging companies, wood industries and local forestry offices, would sendactivity reports to Jakarta. Since decentralisation, however, the flow of the data has beenhindered, as new technical guidelines on forest products information systems have not
1 For more information, see FAO Forestry Department, 2002. Developing information for sustainable forestmanagement in Asia and the Pacific. Nineteenth session of Asia-Pacific Commission on agricultural statistics.

126
been issued. This has led to a paucity of data and information at the national level.Source: Indonesia country report
Another important development in the region is the growing role of civil society in themanagement of forest resources. As activities become fragmented and the role of the public sectordiminishes, it is important that civil society organisations steer the forestry sector in the rightdirection. In the Asia-Pacific region, there are several instances where civil society has played alead role both as a corrective force and as a leader of change. The effectiveness of suchinvolvement largely depends on access to relevant, accurate and up-to-date information. In thecontext of increasing privatisation of data and information, it becomes all the more important thatcapacity is built to enhance access to information, especially for civil society.
Shifts in priorities and objectives
Historically forest management has concentrated on forest harvesting and wood production andwith low demand these activities do not conflict with provision of other goods and services.However, provision of environmental services has gained importance whilst wood production hasincreased substantially. The Asia Pacific Forestry Sector Outlook Study indicated some criticalforest services in the region. These include conservation of biological diversity, watershedprotection and ecotourism. The role of forests in carbon sequestration and combating climatechange are other environmental services receiving increased attention. The multi-functionality offorests has necessitated closer scrutiny of conventional, often destructive and exploitative,management practices. The ongoing efforts to apply sustainable forest management throughdefining criteria and indicators (C&I) has enhanced the need for better information on technical,economic, socio-cultural and environmental aspects.
Shifts in sources of wood supply
Only a fraction of the natural forests and woodlands are subject to active annual management.Increasingly wood production is shifting to plantations and trees outside forests. Imports of woodand other forest products are also rising. The shifts have been driven by several factors, includingmoves to set aside natural forests for provision of environmental services and the realisation thatgrowing demands for wood and wood products cannot be met by natural forests. Many countrieshave imposed timber-harvesting restrictions or logging bans, although this has frequently shiftedthe problem from one geographical area to another.
2
An important shift evident as regards wood supply is the growing role of forest plantations inmeeting industrial wood demand. In 2000, the Asia-Pacific region had about 119 million ha offorest plantation, accounting for some 64 percent of the total global area. As these plantationsmature, they will form an important source of wood and some are even foretelling a wood supply“big bang”, altering the contours of forests and forest industry regionally as well as globally.
While plantation wood supply is likely to increase over the next decade and beyond, theinformation base for drawing more meaningful conclusions remains disturbingly weak. Majorgaps include (a) area under plantations; (b) annual planting and harvesting rates; (c) age classdistribution; (d) species composition; and (e) the variation in productivity. With the increasinginvolvement of the private sector in establishing and managing plantations, traditional datacollection systems (which largely focused on government-managed plantations) have not beenable to keep track of developments. Furthermore, current systems of collection of woodproduction data do not distinguish between wood supply sources such as natural forests,
2 Durst, P., T.R. Waggener, T. Enters and L.C. Tan (eds.), 2001. Forest out of bounds: impacts andeffectiveness of logging bans in natural forests in Asia-Pacific. RAP Publication: 2001/08. Food andAgriculture Organization of the United Nations, Bangkok.

127
plantations and trees outside forests, making long-term assessment of supply shifts difficult.
The increasing role of trees outside forests in augmenting supplies of wood and non-wood forestproducts is another important aspect of forestry in the region. For example, in Bangladesh and SriLanka a substantial proportion of woodfuel and other roundwood are obtained from homegardens. In Malaysia, Thailand and Indonesia, rubberwood is an important raw material for woodindustries (e.g. furniture and medium-density fibreboards). Coconut wood is an importantconstruction material in several Pacific Island countries and other coconut-growing countries.Tree plantings on private land supplying wood to the pulp and paper industry (e.g. India,Indonesia, and Thailand) have also substantially expanded. While the importance of such effortshas been recognised, information on the contribution from such sources is at best patchy. What isknown is far from adequate to draw meaningful conclusions and to formulate supportive policies.In particular wood supply from home gardens is highly variable and is subject to land-use changesin response to a variety of factors, particularly prices of alternative agricultural crops.
Processing and trade of forest products
An important aspect of forestry in the region is the rapid growth of trade in forest products. Bothimports and exports have increased dramatically in volume and value. Between 1980 and 2000imports of forest products to the Asia-Pacific region increased from US$17.3 billion to US$45.2billion, increasing the region’s share of world forest products imports from 27.3 percent to 29.5percent. Most notable is the increase in developing country imports, which grew at an averageannual rate of about 7.6 percent, largely as a consequence of increased imports from China andIndia3. Some countries such as the Philippines and Thailand who were major timber exportersbecame net log importers during the 1970s and 1980s. Exports are also increasing and the regionis emerging as an important producer and exporter of secondary products, especially furniture.
National policy on log import in PhilippinesFrom being a net log and lumber exporter prior to the 1980’s, the Philippines underwent acomplete turn-around and became a net importer in the 1990’s. The reversal was theresult of government policy aimed at sustaining the country’s forest resource base. Thepolicies included not only banning log exports but also liberalising the log import marketto satisfy demand. At the same time, however, the secondary and tertiary woodprocessing industries experienced an upswing in exports due to government policyencouraging export of value added products.
Source: Philippines country report
GENERAL ASSESSMENT OF CURRENT FOREST PRODUCTS STATISTICS
Broad differences among national information systems
Based on the country reports (see this volume), there is considerable variation in the developmentof forestry information systems. In this regard the following three broad groups can be identified:
I. Several countries in Asia – mostly comprising the middle-income countries, have reasonablywell-developed information systems, including skilled human resources. Most forestryactivities take place in the formal sector (public and private), making it easy to keep track ofthe different activities, irrespective of the actors involved. There is also better coordinationbetween the different agencies and organizations involved in the collection and analysis ofdata and dissemination of information. This enables the effective capture of relevant data and
3 Most significant is the growth of China’s imports, which grew from US$647 million in 1980 to US$9.5billion in 2000. India’s imports have also grown from US$205 million to over US$1.0 billion during thesame period (see FAOSTAT, 2002)

128
makes information easily accessible. More detailed features of this group are as follows:� Forestry information systems are comprehensive and serve several objectives and
stakeholders.� Standard definitions and methodologies are used.� Entire data sets are validated and information is disseminated regularly.� The systems are usually computerised and some information is accessible on the Internet.� Mechanisms are in place to ensure the flow of data from lower to higher administrative
levels and vice versa.� Data produced are generally up-to-date, reliable and satisfactory to policy makers and
other users, although this does not necessarily guarantee that they are always used fordecision-making purposes.
II. Numerous countries have fragmented information systems with several agencies collectingdata (at times duplicating efforts), but with inadequate efforts to share, validate and analysethem. Much of the problem stems from the lack of information sharing resulting from poorcommunication and coordination and frequent inter-agency rivalries and conflicts. Moredetailed features of this group are as follows:� Different organisations or agencies have their own forestry information systems.� The information flow among organization or agencies is ineffective or does not exist at all.� National-level information is usually not available due to the poor data flow among
different hierarchical levels.� Definition, measurement units and methodologies used differ frequently among
organisations or agencies.III. The third group comprises countries with poorly developed information systems or no system
at all. This is particularly the case where forestry is dominated by informal activities. The factthat most activities (e.g. collection and trade of woodfuel including charcoal and sawmilling)are informal generally indicates a poorly developed formal economy. Obviously, keygovernment agencies lack the human, material and financial resources to collect dataefficiently and to develop and manage a reliable information system. Another factor thatdistorts national statistics on wood production and trade is a preponderance of illegal loggingin a number of countries in the region.
Illegal logging in Indonesia
Since the Asian economic crisis, illegal logging has increased dramatically and may haveresulted in underestimation of roundwood production as suggested by the fact thatrecorded roundwood production is lower than demand. According to MOF (2002) annualroundwood demand is around 63.48 million m3, whilst production is only23.98 million m3. It is assumed that illegal logging plays a significant role in filling the39.50 million m3 gap. In addition, illegally harvested roundwood also finds it way toneighbouring countries such Malaysia and China.Source: Indonesia country report
More detailed features of this group are as follows:� Very limited data on timber production are collected, analysed and stored in the systems.� Data collected by different agencies and sometimes within the same agency are not shared.
Virtually no data flow exists and information is only available upon request.� In some cases, there is no unit within an agency clearly mandated and facilitated to collect,
compile and analyse forestry data, let alone disseminate information.� Information is usually not available to decision-makers and civil society.
129
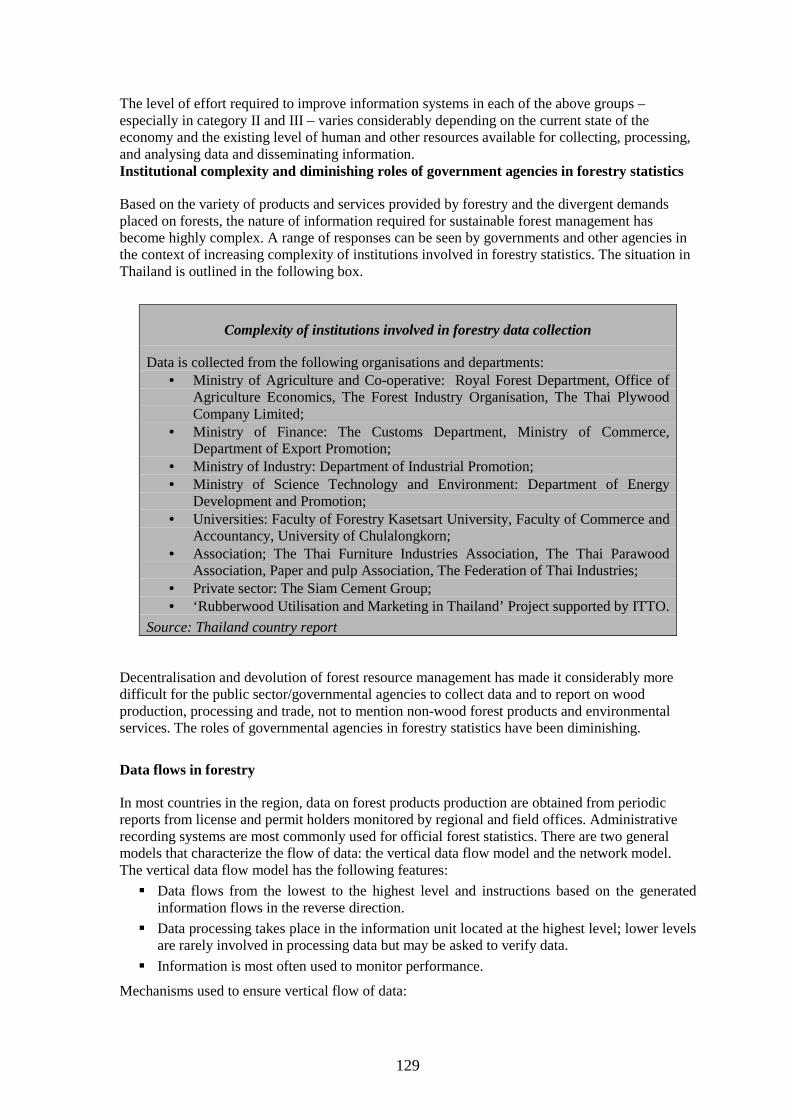
The level of effort required to improve information systems in each of the above groups –especially in category II and III – varies considerably depending on the current state of theeconomy and the existing level of human and other resources available for collecting, processing,and analysing data and disseminating information.Institutional complexity and diminishing roles of government agencies in forestry statistics
Based on the variety of products and services provided by forestry and the divergent demandsplaced on forests, the nature of information required for sustainable forest management hasbecome highly complex. A range of responses can be seen by governments and other agencies inthe context of increasing complexity of institutions involved in forestry statistics. The situation inThailand is outlined in the following box.
Complexity of institutions involved in forestry data collection
Data is collected from the following organisations and departments:• Ministry of Agriculture and Co-operative: Royal Forest Department, Office of
Agriculture Economics, The Forest Industry Organisation, The Thai PlywoodCompany Limited;
• Ministry of Finance: The Customs Department, Ministry of Commerce,Department of Export Promotion;
• Ministry of Industry: Department of Industrial Promotion;• Ministry of Science Technology and Environment: Department of Energy
Development and Promotion;• Universities: Faculty of Forestry Kasetsart University, Faculty of Commerce and
Accountancy, University of Chulalongkorn;• Association; The Thai Furniture Industries Association, The Thai Parawood
Association, Paper and pulp Association, The Federation of Thai Industries;• Private sector: The Siam Cement Group;• ‘Rubberwood Utilisation and Marketing in Thailand’ Project supported by ITTO.
Source: Thailand country report
Decentralisation and devolution of forest resource management has made it considerably moredifficult for the public sector/governmental agencies to collect data and to report on woodproduction, processing and trade, not to mention non-wood forest products and environmentalservices. The roles of governmental agencies in forestry statistics have been diminishing.
Data flows in forestry
In most countries in the region, data on forest products production are obtained from periodicreports from license and permit holders monitored by regional and field offices. Administrativerecording systems are most commonly used for official forest statistics. There are two generalmodels that characterize the flow of data: the vertical data flow model and the network model.The vertical data flow model has the following features:
� Data flows from the lowest to the highest level and instructions based on the generatedinformation flows in the reverse direction.
� Data processing takes place in the information unit located at the highest level; lower levelsare rarely involved in processing data but may be asked to verify data.
� Information is most often used to monitor performance.
Mechanisms used to ensure vertical flow of data:

130
� The highest level is the authority responsible for licensing and regulating forest-basedactivities or industries at the lower levels.
� The lower levels record or collect data, which serve as sources of all kinds of information.
The flow of forest industry information in MalaysiaStatistics on wood-based industries such as sawmills, plywood/veneer mills, andmoulding mills are collected on a monthly basis by the District Forest Offices. Thesemills are required, by condition of their licences, to keep records of the number ofremoval passes, the date of timber entry into the mill, the number and species of logs, thevolume input into mills and processing machinery, the output of converted timber andsales of timber to domestic markets. This information is completed by the mills andsubmitted to respective District Forest Offices. The District Offices then check, verifyand endorse the returns before they are despatched to the Federal Forest Department inshuttle returns.
Source: Malaysia country report
The network model is used in comprehensive information systems that are comparatively higher-level than the simple administrative recording systems. These models have the following features:
� All components of the system participate in the collection and analysis of data.� Data collection and analysis is an integral part of day-to-day activities.� Wider sharing of data, information and knowledge is common and encouraged.� A central database/information unit facilitates sharing and dissemination of information.
Substantial investment in information networking and increased willingness to share informationare crucial to ensure effective vertical and horizontal flow of data. Under these circumstancesnetwork system may be developed as currently seen in countries with more advanced andcomprehensive information systems.
Decreasing availability of public information
In addressing the availability of public information there are three main issues to be considered.Firstly, as resource management moves increasingly towards the private sector and localcommunities, collection of data by the public sector and the transfer of information to the publicdomain have become increasingly difficult. Secondly, existing information systems are unable todeal with the changing situation, which involves a large number of actors who, although theygenerate and use information, largely tend to keep it within the private domain. Thirdly, a numberof constraints limit the capacity of existing organizations to access information and make itavailable in the public domain. For example, of total timber extraction and production of wood-based products, only 10 percent are included in national timber production statistics in Sri Lanka.The detailed situation is given in the following box.
The limitations of public sector information collection in Sri LankaStatistics on total production of timber, firewood and wood-based items by all producingsectors are not currently available. Official statistics on timber production and marketingrefer mainly to removals and sales by the State Timber Corporation (STC), agovernmental statutory body that holds a timber production monopoly. Recent studieshave revealed that the STC’s share in annual timber harvests amounts to only 10 percentwith the balance coming from non-forest sources such as home gardens (68 percent),rubber (11 percent) and coconut plantations (9 percent), and other perennial croplands(2 percent). Timber extraction from tea, coconut and rubber estates leased by thegovernment to private companies are only partially recorded in annual timber production

131
statistics due to inadequate monitoring.
Source: Sri Lanka country report
Secondly, in many countries decentralisation of forest management to provincial, and districtlevels has often resulted in the breakdown of linkages between central units and lower-leveloffices. This has undermined the traditional reporting system. In countries such as Indonesia andIndia, there is no effective mechanism to ensure efficient data flow from the local to the nationallevel. In fact, in some cases staff at headquarters do not even know whether data are stillcollected. In consequence, the information available at the national level is incomplete andunreliable.
Thirdly, the informal sector plays a significant role in producing and processing of wood andother forest products in many countries. This is particularly the case with woodfuel collection andtrade. No country is able to provide a realistic estimate of the quantity of woodfuel removed fromforests, especially since a significant proportion is “illegally” collected. Woodfuel extracted fromcommunity forests and private holdings are not recorded at all. Hence what is reported accountsfor only a fraction of what is actually removed and used. The situation has led to incompletestatistical coverage fuelwood and most other “minor” forest products.
MAIN CONSTRAINTS AND KEY CHALLENGES
Increasing demand vs. limited national capacity
Traditionally, the main objective of forest management was timber production. Forestry policiesand forest management objectives have however diversified and expanded over the past decades.This has been especially so since UNCED in 1992 when the multi-dimensional aspects of forestrybecame a central global theme. In common with the traditional aims of forest management, themain focus of forestry statistics has been on timber, timber products, the wood-processingindustries and forest resource assessments. Following the structural and institutional changes inthe national forestry sectors over recent years there is now increased concern and need forcollection of information on forest condition, the extent of private plantations, growing stock andyields of non-wood forest products, trees outside forests, fuelwood use, biodiversity loss andclimate change. The demand for information from different users and interest groups is growingrapidly. For countries committed to the implementation of the international conventions, reportingrequirements have increased enormously.
Increasing reporting requirements in MalaysiaThe rapid expansion and development of Malaysia’s forestry sector over the last fewdecades have led to a rapid increase in forestry activities and tremendous growth in datacollection. For instance, in addition to existing statutory and routine requirements, forestmanagement practices now have to be evaluated against prescribed sustainable forestmanagement criteria. Manpower allocated to data collection is therefore increasinglyoverstrained in keeping up with the volume of work and this has affected the timeliness,accuracy and quality of statistics.Source: Malaysia country report
In most countries the capacity for collecting relevant data and providing accurate informationremains very limited. In fact, the capacity of many countries has been overstretched as revealed inthe country reports:
� Lack of funding is a perennial constraint in data collection, especially in the field officeswhere, in most countries, funds are insufficient for regular monitoring of production and

132
trade in forest products. Data gathering and monitoring are therefore usually derivative ofother activities and thus have low priority.
� There is no specific office or unit under the forestry agency that is clearly mandated andfacilitated to collect, compile and analyse data in most group III countries. In mostcountries, there are no permanent staff or only temporary positions assigned to statisticalwork in field offices.
� Staff have inadequate data collection and analysis skills especially at the field level.Training in statistics and use of computers is not regularly provided and personnel oftenmove from their assigned posts after receiving training.
� Although data processing and analysis are generally facilitated by the use of computers,most field offices in many of the countries in the region still have not acquired computersand other relevant equipment.
� Data storage systems are very limited in some countries and data, especially raw data, arediscontinuously kept and sometimes lost. Furthermore, the inadequacy of data systemsoften slows the flow of information from the local to the national level and therefore causesdelays in disseminating information to users.
� Inconsistent definitions and methodologies are used in different systems in some countries.This constraints data flow and comparability, and causes data and information conflicts atthe national level.
Fragmentation and duplication of efforts
There is an immense amount of duplication and fragmentation in data and information collectionnot only within forest department headquarters and provincial forest offices but also among otheragencies.
Relevant information is often scattered in different units, departments and ministries. Forexample, information on forest cover and tree growth is with forest department, while informationon wildlife is with wildlife departments. Forestry departments may be responsible for roundwoodproduction from natural forests while information on wood processing can only be obtained fromindustry departments, and export and import figures from customs department. There is nomechanism to share information and departments often do not consider information as a publicgood. Furthermore, the same types of data may be generated by different systems and may be inconflict and difficult to reconcile.4
In several cases, forestry departments are not aware of the routine surveys undertaken by otherdepartments and no efforts are made to take advantage of nation-wide surveys such as populationcensuses, agricultural surveys or household income and expenditure surveys to obtain informationrelevant to forestry.
Further, information needs at different levels have frequently been addressed in a fragmentedway. As new demands arise they are added to a system not designed for the purpose. A plethoraof efforts, often based on short-term (and consequently unsustainable) donor support, havecomplicated matters. With the multitude of rapid changes, it is important that piece-mealapproaches are replaced by more comprehensive efforts. Priorities need to be defined at differentlevels based on what can be realistically accomplished. There is a clear need to target limitedresources for priority issues.
Irrelevant and unutilised information5
Frequently, information is not available to decision-makers while many of the data collected are
4 For example, two independent sets of forest cover information for Lao P.D.R. are available.
more information see Durst P.B. and Enters, T. 2002. Ten reasons why we know less about forestry in Asia than we should. In:Forest Policies and Forest Policy Reviews, eds. Enters, T. and Leslie, R.N. Information and analysis forsustainable forest management: linking national and international efforts in South and Southeast Asia.Workshop Proceedings No. 2. Food and Agriculture Organization of the United Nations, Bangkok. pp. 19-25.

133
irrelevant or remain unutilised. Appropriate and timely information is particularly importantbecause of the increasing complexity in forestry and the demands for policy changes by numerousstakeholders.
Data are often collected for the sake of data collection or because of historical precedent. Littletime is spent on selecting the appropriate level of precision, the data-collection method or theupdating interval. Survey forms are often poorly designed and even when survey forms arereturned data may not be coded for further processing, let alone subjected to secondary analysis.Efforts are generally focussed on particular sectors of forestry (usually wood production) to thedetriment of others.
Furthermore, the types of statistics produced by government departments are mainly descriptive,in tabular form, graphics or pictures. Essentially, data remain data and are not translated intoinformation. There is a substantial disregard for the needs of decision-makers, planners and thegeneral public, and as long as the translation of data into more useful information is neglected,decisions will remain poor and people will continue to be misinformed.
CONCLUSIONS AND RECOMMENDATIONS
Decentralisation and privatisation in forest management in the region have important implicationsfor the production of forestry statistics. The role of the government agencies in data collection andreporting has been diminishing while their information systems are becoming less effective andthe data they contain less accurate and more outdated. Forestry information is moving from“public domain” to the “private domain”. Existing information systems are unable to deal with thechanging situation. Furthermore, a number of constraints are limiting the capacity of existingsystems especially at the local level. The complexity of agencies involved in collecting andanalysing data causes difficulties in producing information necessary to achieve sustainable forestmanagement while some information lacks relevance and other information remains under-utilized. Finally there is the difficulty of “documenting the undocumented” such as activities inthe informal sector and illegal logging and illegal timber trade.6
On the other hand, information needs will increase as stakeholders involved in forestry andobjectives of forest management diversify. Globalisation places demands on policy makers andplanners at all levels to assess and understand developments beyond their own narrow fields.Furthermore, sustainable forest management that emphasises the social and environmentaldimensions of forestry requires generation of information often beyond the capacity of countriesand actors concerned. Past efforts have either addressed issues in isolation or provided atechnological fix, which frequently did not bring about improvements in information systems anddid not lead to necessary institutional changes.
Collecting useful information
Traditionally, forestry statistics covered a limited area of what is today considered sustainableforest management. The aim of information generation was, and in many countries still is, toprovide public sector decision-makers with insight mainly into production related issues.However, forestry stakeholders have diversified and new stakeholders with very differentinformation needs have appeared. That the nature of information requirements has changed hasgone largely unnoticed to forestry statistics.
In developing comprehensive information, the most critical questions are:� What information is required for decisions by different stakeholders and at various levels?� What is the precision of information required to support decision making?� How can access to information be ensured to a wide range of potential users?
6 See also Johnson, S. 2002. Documenting the undocumented. Tropical Forest Update 12(1): 6-9.

134
As a result of budgetary constraints there is frequently less rather than more informationproduced. In addition, there is a tendency to focus on data that can be easily collected and issuesfor which there are tangible short-term benefits. In giving priority to such “useful” information,less “useful” aspects are neglected. However, it is impossible to collect all the data thatstakeholder’s request and therefore forestry statistics should be guided by decision-makingrequirements for sustainable forest management.
Increasing co-ordination and collaboration
Co-ordination and collaboration in the public and private sectors are essential for streamlininginformation systems and for providing comprehensive information at the local and national levels.
To increase and enhance co-ordination and collaboration to ensure provision of comprehensivepublic goods information, it is recommended to:
� build partnership among all the forestry stakeholders to exchange information and to shareresponsibilities;
� increased co-operation to avoid duplication, which is essential where there is a shortage offunds;
� develop efficient information networks to facilitate effective vertical and horizontal flow ofinformation.
Building capacity in statistics
In most countries the capacity for collecting relevant data and providing accurate informationremains very limited, especially in field offices. In the absence of local-level information, it isalmost impossible to provide national assessments, let alone to make informed decisions. It iscrucial to enhance capacity7 to collect, compile and analyse data at the local level. The followingaspects should be addressed:
� Establishment of permanent positions in field offices and a unit/office in forestrydepartments clearly mandated and facilitated to collect, compile and analyse data.
� Provision of regular training to statistical personnel and upgrading skills, especially in fieldoffices.
� Allocation of sufficient funds for statistical activities and equipment8;
� Development of standard and cost-effective guidelines and methodologies for datacollection, processing and dissemination.
Perhaps the first step in the right direction would be to accept that many of today’s decisionmakers require more than annual reports filled with descriptive statistics that many stakeholdersdo not trust or rely on. While it is recognized that improvements have been made in severalcountries, the suspicion remains that far more could have been achieved, if the underlying causesfor poor information on Asian forestry and forests had been more thoroughly examined. Too oftenpolicy makers, planners and donors assume that the lack of funds, infrastructure and skills are themain barriers to improving forestry information. While a scarcity of funds and weak capacities areobstacles, other important barriers to improving forestry statistics exist. They include vestedinterest in obscuring the true, sometimes embarrassing situation, resistance to change andinappropriate performance rating and reward systems. Without tackling the underlying causeslittle will be achieved and forestry statistics will at best remain muddled and at worst will becomeredundant. 7 Many countries, such as the Philippines, Sri Lanka, Bhutan recommend in their country reports (i) theestablishment of a unit within the forestry agency to collect, process, store and disseminate data provided bypublic and private sector institutions; (ii) training for personnel involved in data collection, processing andanalysis and computer use and (iii) allocation of adequate funds and logistics, including computers, for datahandling and information dissemination.8 Investments in infrastructure should be minimized where data quality is a problem.

135
National forest products statistics, Bhutan
Introduction
Forests
Of the total country area (40 075 km2), 2.9 million ha has forest cover. Of the total forest areaabout 1.9 million ha are not used for timber production due to its classification as either: (i) forestwithin Protected Areas, National Parks or Wildlife Sanctuaries, (ii) steep land or buffer zones, or(iii) scrub forest not ready for timber production. Details are shown in Table 1.
Table 1. Forest area restricted for timber productionForest category Forest areas (ha) % of total forest areaProtected Area System 846 054 28.9> 4 000 meters above sea level 218 738 7.5Steep areas 819 055 28.0Road buffers 18 482 0.6River buffers 8 013 0.3Scrub forest 36 381 1.2Total 1 946 723 66.5
Source: FRDD, 2002
Total production forest area is approximately 982 362 ha and at present about 169 991 ha havebeen brought under approved FMU management plans (5.8 percent of the total forest area).However, timber production is technically and economically feasible, under the FMUs system, inabout 409 564 ha. The balance of 572 798 ha could only be brought under the FMU system withhigh investment or inputs. The forests concerned either have low production potential, are smallareas, or areas that require large investment in access roads. The potential cost of timber fromsuch areas would therefore be higher than from existing FMUs.
The estimated Annual Allowable Cut for Bhutan is about 35 million cft (1 million m3). From the5.8 percent of the production forest area under the FMU system, about 5.8 million cft, standingvolume, is prescribed for harvesting per annum. However, due to harvesting losses and extractionconstraints, average production in 1999 and 2000 were 2.4 million and 2.3 million cft respectively.
The total area of plantation to date as given by the Social Forestry and Afforestation Division(Table 2). Forestry plantation information is periodically evaluated at the Dzongkhag and Nationallevel to provide planning guidance and to assess the effectiveness of the plantation program.
Table 2. Plantation area by typeCategory Area (acres)Normal plantations 40 209Plantation created by FDCL 1 818Industrial plantations 3 810Community plantations 428Total 46 267
Wood-based industries

136
In Bhutan, wood-based industries are still at an early stage of development (Anon, 2001). Theyare mainly small-scale industries, comprising ~56 sawmills, 60 furniture-workshops, one largeveneer/particle board firm. Products include broom handles, fruit boxes, veneer, plywood andblock board and wooden handicrafts. Owing to limitations in the transport infrastructure, cost oftimber transportation between Dzongkhags is high and therefore timber is mostly processed in itsarea of origin, i.e. hardwood in hardwood areas, softwood in softwood areas.
The ninth five-year Development Plan emphasises sustainable forest management for the dualpurposes of conserving environmental resources and supplying wood to the domestic market. TheTimber Marketing and Pricing Policy (RGOB, 2002) also emphasises that (i) urban, commercialand industrial sectors can access timber through open auctions; (ii) prices are determined bymarket forces and (iii) the export of logs, sawnwood and fuelwood is banned unless lots remainunsold after three consecutive auctions, in which case FDCL may auction timber internationally.
Organisation of the Department of Forestry Services
The Department of Forestry Services is headed by a director who is assisted in technical mattersby four functional divisions at headquarters, these are: (i) Forest Resources Development Division(ii) Nature Conservation Division (iii) Forest Protection and Utilisation Division, and (iv) SocialForestry Division.
Territorial Divisional Forest Officers, (DFOs) are responsible for carrying out forestry sub-sectordevelopment at the district level. They are also responsible for overseeing and supervising work inthe Forest Management Units (FMUs) and are directly responsible to the Head of DoFS in alladministrative matters. Dzongkhag (district) forestry offices are responsible for promoting andimplementing the social, community and private forestry program. These offices also carry outextension work in the Dzongkhags for the DoFS.
Forest Development Corporation, Limited (FDCL), an autonomous corporation, deals with alltimber production and marketing activities. Production of timber is guided by forest managementplans prepared by the Forest Resources Development Division of the Department of ForestryServices. FDLC is directly responsible to its Management Board, which includes as one of itsmembers, the directors of the DoFS. The present set up of the DoFS is given in Figure 1.
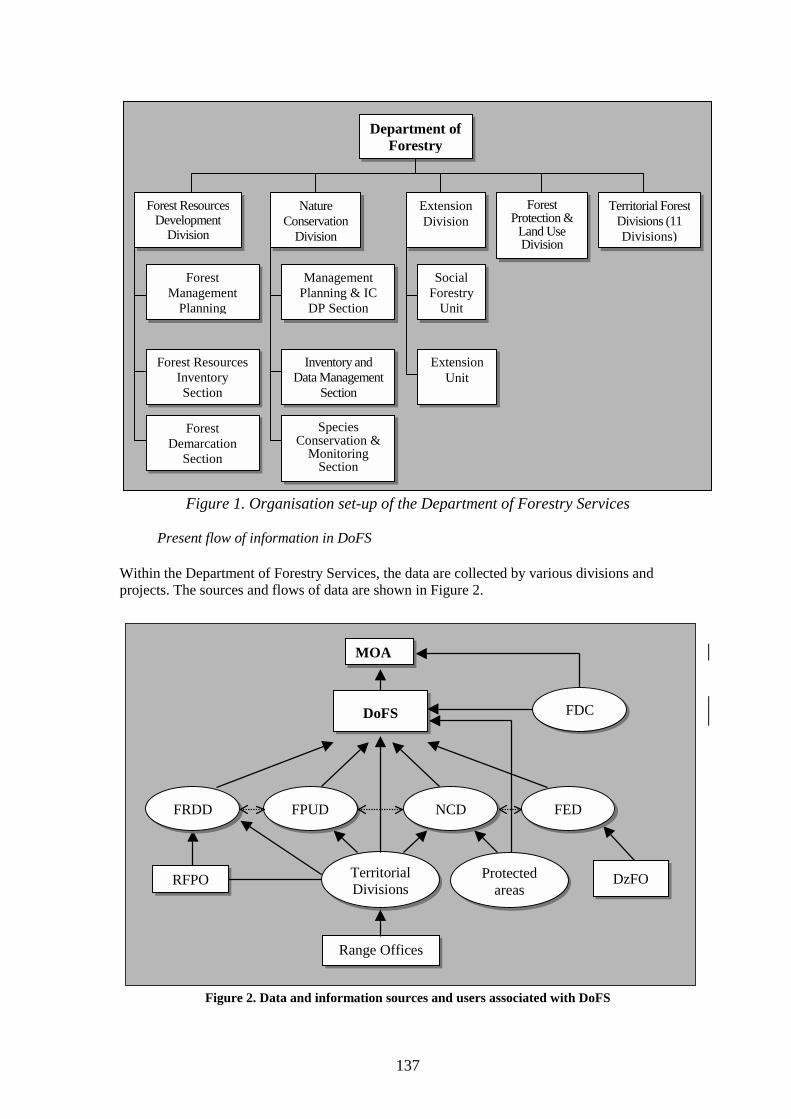
137
Figure 1. Organisation set-up of the Department of Forestry Services
Present flow of information in DoFS
Within the Department of Forestry Services, the data are collected by various divisions andprojects. The sources and flows of data are shown in Figure 2.
Figure 2. Data and information sources and users associated with DoFS
DoFS
TerritorialDivisions
DzFO
Range Offices
RFPO
MOA
FDC
FRDD FPUD NCD FED
Protectedareas
Department ofForestry
Forest ResourcesDevelopment
Division
NatureConservation
Division
ExtensionDivision
ForestProtection &
Land UseDivision
Territorial ForestDivisions (11Divisions)
ForestManagement
Planning
Forest ResourcesInventorySection
ForestDemarcation
Section
ManagementPlanning & IC
DP Section
Inventory andData Management
Section
SpeciesConservation &
MonitoringSection
SocialForestry
Unit
ExtensionUnit

138
The field offices of DoFS collect information from (i) FMUs (ii) forest areas presently outside theFMUs (iii) National Parks and Wildlife Sanctuaries and (iv) people involved in community andsocial forestry programs. Data comprising timber production from FMUs and timber sales are alsoreceived from FDLC. From DoFS, the information is passed to the Ministry of Agriculture andother interested organisations. The flows of information are shown in Figure3.
Past data collection efforts
Data concerning forests and forest products are generally collected by the Department of ForestryServices (DoFS) in the form of quarterly progress reports. As a result of delays in data collectionat the field offices, final compilation of data may be well behind schedule and difficulties are alsoencountered with data entry at DoFS and mistakes are often made.
In forestry, database management is crucial to ensuring the conservation and sustainable use offorest resources. The type of data gathered differs amongst the functional and territorial divisionsof the Department of Forestry Services depending on their functions and responsibilities.
The current users of wood production and trade information include:• Ministry of Agriculture• Ministry of Trade and Industry• Department of Forestry Services and its divisions.• Forestry Development Corporation Limited and its divisions.• Dzongkhag Administrations• Department of Revenue and Customs• Association of Wood-based Industries

139
Figure 3. Present flows of forestry information
Potential users of information include the following institutions:• Department of Education• Department of Health Services• Consulting Firms• Concerned Donor Agencies• NGOs
Existing forest and forest products data
The following four sub-sections detail the different types of data available in the Department ofForest Services.
Rural timber supply
Data concerning rural timber supplies comprise the following:• Total number of standing trees supplied for rural use9
• Total quantity of firewood supplied to rural household• Total quantity of sawn timber supplied for rural use• Total quantity of saw logs supplied for rural construction
These data are collected by the territorial Divisional Forest Officers on the basis of the permits 9 Round timber for rural uses includes sawlogs (in tree form), trees for shingle manufacture,poles, posts, and flagpoles, etc.
ResearchCentres
UsersSource of data Agenciesresponsible for datacollection & analysis
DoFS
FDCL
Forest1
Environment
People
MOA
NEC
DoFS
FDCL
CSO
PlanningCommission
PrivateCompanies
InternationalAgencies
Others
1. Forest includes: FMUs, areas outside FMUs and National Parks

140
and quantities they supply and are submitted to the DoFS head office in Thimphu on a quarterlybasis. The quarterly reports sent by the various divisions are entered into computer files andcompiled for the whole department at the end of each year. The volume of timber supplied forrural use is calculated from the number of trees using a conversion factor. This creates somecompilation difficulties and also does not allow exact assessment of the annual quantity of timbersupplied.
Timber production and sale
The following data are collected on timber production and sale:• Total timber produced from the forests (FMUs).• Total quantity of timber sold at public auction within the country.
Data on commercial timber production and sale are collected by FDCL, through its fielddivisions. FDCL head office then undertakes compilation and analysis of the data.
Roundwood production
Although policy allowing timber production from community and private forests has been issued,as detailed below, all present supply is from Government Forests Reserves (i.e. forest areas withinand presently outside the FMU system). Commercial roundwood (sawlogs) is supplied from FMUareas exclusively by the FDCL10, whereas other, non-commercial, roundwood is supplied undersupervision of the Territorial Divisions of the DoFS from areas currently outside the FMU system(Figure 4).
Figure 4. Production and supply of roundwoodTimber produced by FDCL is sold at open auction to wood-based industries, urban Governmentconstruction utilities and other consumers. Small quantity of timber produced by FDCL’s is also
10 In accordance with the Timber Marketing and Pricing Policy of January, 1999.
ANNUAL ALLOWABLE CUT(for entire production forest)
TOTAL ROUNDWOOD
ROUNDWOOD EXCLUDINGSAWLOGS (through DoFS)
SAWLOGS(through FDCL)
Rural construction(at subsidized &commercial rate)
Urban & industrial uses(auction sale)
Fuelwood(urban & rural)

141
supplied at a subsidised rate for rural construction with FDCL providing the subsidy themselves.
Non-commercial roundwood is approved by Dzongkhag administrations, in close collaborationwith the Territorial Divisions, and fulfils the Government’s obligation to supply rural people withsubsidised timber for house construction (Forest and Nature Conservation Rules, 2000). Suppliesare either in the form of standing trees, logs from FDCL’s depots or sawnwood, if available.Fuelwood is also produced through the territorial divisions for both rural and urban supply.Construction timber for Government or donor-funded projects in remote areas is supplied in theform of standing trees and processing is carried out by the agency concerned11. Royalties at thecommercial rate are collected by the DoFS Territorial Divisions.
Total roundwood production increased by 12 percent between 1999 and 2000 as a result ofincreased woodfuel production (Table 3). Excluding sawlogs, another 5.81 million cft ofroundwood, including 3.34 million cft of woodfuel, was harvested from forest presently outsidethe FMUs.
Table 3. Total national roundwood productionProduction (cft)Product aggregate
1999 2000Sawlogs 2 372 707 2 269 507Industrial roundwood excluding sawlogs 2 545 786 2 467 565Industrial roundwood 4 918 493 4 737 072Woodfuel 2 267 300 3 340 712Total roundwood 7 185 793 8 077 784
Source: DoFS, 1999 and 2000 & FDCL, 1999 and 2000.
Production from Community/Private Forestry
Policy allowing community and private forestry has been in existence since 2000 and governmentsupports application from interested parties. To date, more than 800 ha of forest with approvedmanagement plans have been handed over to communities. As these programmes have onlyrecently begun there is as yet no production of timber/wood from community or private forestry.
Market Price, Commercial Royalty and Rural RoyaltyAs outlined above timber is supplied in three main ways: (i) rural supply, (ii) remote locationsupply and (iii) through open auction. For rural supply, timber is subsidised for rural houseconstruction and the rural royalty rate applies, whereas for remote location supply, where standingtrees are used for Government or project construction, the commercial royalty rate applies.
The market price of round timber is equal to auction price having been fixed by FDCL on thebasis of:
• Production costs (including costs associated with marking, felling and crosscutting, debarking, extraction and transportation.)
• Indirect costs/overheads, etc.• Royalty (as per schedule)• Profit (about 5 percent)
The ‘commercial royalty’ is the only royalty component and varies according to tree girth andwhether timber is in log form or standing. With sawn timber for urban or industrial use, thesawmills determine selling price on the basis of market forces and, as no royalty is paid, FDCL do
11 Section 49 (2) of Forest and Nature Conservation rules, 2000 states that timber forcommercial/project construction in remote locations shall be supplied on a standing trees basis,at the commercial royalty rate. Remote locations are defined as being further than one day’s walkwith a back load from the nearest motorable road.

142
not intervene. If, however, sawmills supply rural people a subsidised royalty applies as per theschedule shown in Table 4.
The rural, or subsidised royalty rate varies according to tree size and whether hard or softwood12.It is applied for a given number of trees/volume of timber as detailed in Forest and NatureConservation Rules, 2000. Above this entitlement, the commercial royalty rate must be paid forstanding timber and sawnwood must be obtained in the open market. Details are given in Table 4.
Table 4. Subsidised royalty rate for rural constructionTimber supply form Unit Girth Quantity Rate (Ngultrum13)Sawnwood Sawnwood volume (cft) 2000 cft Nu. 1.00 per cft
Drashing trees 4' 1" & above 4 trees Nu. 40/treeTree for shingles 6 trees Nu. 40/treeCham-sized tree 2' to 4' 80 trees Nu. 30/treeTsim-sized tree 1' 2' 80 trees Nu. 12/tree
Softwood species(standing)
Dangchung/poles Below 1' 100 trees Nu. 4/treeDrashing tree 4' 1" & above 4 trees Nu. 120/tree
Tree for shingles 6 trees Nu. 120/treeCham -sized tree 2' to 4' 60 trees Nu. 40/treeTsim sized tree 1' to 2' 60 trees Nu. 12/tree
Hardwood species(standing)
Dangchung/poles Below 1' 80 trees Nu. 4/tree
Source: DoFS
Trade of forest products
As FDCL information is limited to statistics on internal sales of round logs and data collected forthe occasional exports conducted by FDLC themselves, a complete picture of import and exportof wood and wood products, is not possible. However, the Department of Revenue and Customs(DR&C) does maintain full information on import and export of wood and wood products. Entryand exit check points maintain data in a register, based on challans, permits and invoices. Thesedata are entered into computer files and send to the DR&C Head office where the information iscompiled and analysed. At present, DoFS receives the data from DR&C in a compiled bookletand there is no exchange of electronic data between the two departments. It would be preferable,in future, if these data were received in computer files.
Import of wood and wood products
Various types of forest products were imported during 1999 and 2000 ranging from charcoal,sawlogs (softwood), sawn timber, veneer sheets, fibreboard, wooden household utensils andfurniture, etc. to paper, cartons, journals and periodicals. The total value of imports in 1999 was242 million Ngultrum; about 91percent of which was from India (Table 5). The data shows thatalthough imports increased in 2000 business was confined to India and there were no transactionswith other countries (DR&C, 2002).
12 The rate is higher for hardwood species as regeneration and management is more difficult.13 US$1 = 48.68 Ngultrum

143
Table 5. Wood and wood product import value (Ngultrum) for 1999 and 20001999 2000
Country Value % by value Value % by valueIndia 221 578 878 91.4 388 723 258 100Bangladesh 38 100 0.02 0 0Japan 468 437 0.2 0 0Singapore 11 163 775 4.6 0 0Thailand 7 747 911 3.2 0 0Others1 1 351 835 0.6 0 0Total 242 348 936 100.0 388 723 258 100
1 Others include Belgium, Denmark, Nepal, Netherlands, Switzerland, Taiwan, United Kingdomand USA. Source: DR&C, 2002.
Export of wood and wood products
Wood and wood products exported in 1999 and 2000 included woodfuel, sawlogs, tea-chestbattens, furniture, handicraft items, sawn timber, beadings and packing cases (DR&C, 1999 and2000). Between 1999 and 2000, exports of forest products declined significantly with a fall of 20percent (Table 6) (DR&C, 1999 and 2000).
Table 6. Export of wood and wood products in Ngultrum, 1999 & 20001999 2000
Country Value % by value Value % by valueIndia 363 478 207 98 295 318 581 100.0Others 7 033 251 2 0 0Total 370 513 457 100 295 318 581 100.0
Source: DR&C, 2002.The 1999 Timber Pricing and Marketing Policy included export bans on round timber, sawntimber and firewood and encouraged wood-based industries to upgrade technology and increasedownstream processing to add value to wood products (RGOB, 1998). Although activity isexpected to pick up in the near future, the changes led to reduced production of value added woodproducts and a decline in overall quantities of wood products exported.
With respect to the future, the 9th five-year plan of the forest sub-sector supports development ofwood-based industries in terms of upgrading skills, training workers and assessing manpowerrequirements. To facilitate this development and to enable investment and planning in the sector,sustained increases in the availability of timber will be required.
Data collected and methodologies used
Various divisions and projects, under the Department of Forestry Services (DoFS), collect dataaccording to their functions. In addition the following organisations are involved in collection offorest and forest products related data:
• Forestry Development Corporation Limited• Department of Revenue and Customs (timber and forest products trade related
data).• Dzongkhag Administration• Association of Wood Based Industries (private sector organisation)
The formats used also suit each institutions particular requirement. The type of informationpresently collected by the various agencies, under the DoFS are detailed in the following sections.

144
Forest Resources Development Division
Responsibilities of Forest Resources Development Division include:• To carry out forest resources inventory within and outside forest management
units, excluding protected areas;• To develop management plans for forest management units;• To identify potential forest management units and assess the sustainability of
forest management units and systems;• To develop technical guidelines and manuals directed at monitoring and
evaluating the implementation of forest management plans;• To provide technical backstopping to the territorial Divisional Forest Officers
(DFOs) and Forestry Development Corporation Limited (FDCL) in the properimplementation of management plans;
• To conduct socio-economic surveys in forest management units and maintaindatabases in collaboration with Information Management Section (IMS);
• To carry out forest demarcation in collaboration with relevant agencies.•
Data collection
Data concerning the following are collected in the forest management units (FMUs).• Timber resources;• Non wood forest products;• Pests and diseases;• Socio-economic conditions.
The Forest Resources Development Division also collects data for forest areas outside FMUs14 inorder to monitor forest resources allotted and utilised. The information is used for preparing forestmanagement plans and monitoring and evaluating the implementation of the plans.
Methodology used for data collection and analysis
Data is collected through management inventories, using systematic sampling. The data are usedto estimate stand density, volume/hectare, number of trees/hectare, site condition, etc. Theinformation is used to assist in developing future management of forest stands (Laumans, 1994).
Data are compiled using a tailor-made computer program called ‘PLOT’ which runs in FoxProand allows automatic checking of common errors during data entry. Following field datacollection, tally sheets records are entered using the input option in PLOT. The data from the tallysheets are saved in database files (PLOT.dbf, SITE.dbf, TREES.dbf, REGENER.dbf andWILDLIFE.dbf) under separate sub-directories for each inventory. Upon completion of data entryhard copies are printed for error checking and errors are corrected manually. Further errorchecking is carried out by PLOT in a data validation process.
Other information collected through aerial photo interpretation is entered into a GIS with detailedinformation being transferred to a 1:50 000 scale base map. Stand files containing areainformation and forest type are then prepared and stratification is carried out on the basis of these 14 These are areas not covered by Forest Management Plans, in which small timber and firewoodharvesting for rural villagers’ bona fide use is allowed but commercial harvesting is prohibited.Management plans will be implemented in these areas as soon as planning capacity becomesavailable in DoFS.

145
two sources of information. Calculation of results using PLOT is the final task (Laumans, 1994).
In the future, the inventory database will be linked to the GIS and ultimately to a NationalDatabase System, to provide a comprehensive Management Information System for all FMUs inBhutan. This will act as an on-line FMU register of resources and logging and will enableinformation retrieval for specified geographical areas (Laumans, 1994).
In addition to the above-mentioned information, socio-economic data are also collected from theFMUs through Rapid Rural Appraisal (RRA). This includes the use of structured and unstructuredquestionnaires and group discussion.
Forest Protection and Utilisation Division
Responsibilities of Forest Protection and Utilisation Division include:• To take responsibility for forest land allotment/swapping, leasing, clearance and
encroachment in collaboration with relevant agencies;• To co-ordinate and assess allotment of stone, sand and other materials related to
quarrying;• To provide arbitration services;• To monitor and assess the impacts of poaching/hunting and other illegal activities;• To monitor timber transactions.
Nature Conservation Division
Responsibilities of Nature Conservation Division• To manage wild biodiversity in the Protected Areas of Bhutan;• To implement the provisions of The Forest and Nature Conservation Act, 1995 in
the Protected Areas;• To develop and implement conservation management plans for protected areas;• To conduct biological and socio-economic surveys in protected areas and to
maintain databases in collaboration with Information Management Section (IMS).•
Data collected
This division collects data on (i) the socio-economics conditions of people living within theProtected Areas and (ii) bio-diversity in Protected Areas. Information on the abundance of faunaand flora is also collected in a much more detailed manner. The information is used for preparingconservation management plans for the National Parks and Wildlife Sanctuaries.Methodology used for data collection and analysis
Data are collected by survey and recorded in pre-designed formats. These surveys have now beencompleted for most of the National Parks and Wildlife Sanctuaries in Bhutan.
All data collected are stored in a FoxPro database although there are plans to upgrade to either MSExcel or Access. At present, statistical analysis is carried out using packages such as MINITAB.This Division also has a well-defined GIS, which will eventually be linked to the NationalDatabase System.
Territorial divisions
As field offices of the DoFS the territorial divisions are responsible for the implementation of allmanagement plans in the FMUs. They also regulate allocation of forest produce to ruralconsumers within and outside FMUs.

146
Data collected by the Territorial Divisions predominantly concerns (i) supply of forest products15
and (ii) forest offences. There are also well-developed forest fire databases and information onmining and quarrying in government reserve forests is also kept.
The DFOs maintain forest depot registers in which numbers of trees and volumes of timbersupplied to rural and urban consumers are recorded, along with information on revenues andsubsidies. This information is collected and compiled on the basis of permits supplied by theDFOs office. A similar set of information on non-wood forest products is also kept as isinformation and forest products supplied to, on royalties collected from, the Armed Forces andurban Dzong/monasteries. Data are not analysed in divisional offices but are transmitted in theform of quarterly progress reports to the DoFS head office for further compilation and analysis.
Information on forest offences, collated from offence report registers maintained by the DFOs isalso sent to DoFS head quarters on a quarterly basis. The format includes the followinginformation:
• number of cases registered or compounded;• compensation/penalties realised;• rewards paid to the informants leading to detection of the offence16.
Presently most of the divisional databases are maintained in the form of registers although someterritorial divisions are making efforts to create an MS Excel based system (geog-wise) containingdata on the rural supply of forest products. It is envisaged that this could act as a model systemwhich the remaining divisions could modify and adapt to suit their own needs.
Social Forestry and Afforestation Division
The Social Forestry and Afforestation Division collects and maintains record on afforestation andreforestation program carried out across the country. The database includes the following details:
• the area planted;• the species planted;• percentage seedlings survival;• number of community and private forests and related data such as total area,
growing stock and location.Information of the area planted is obtained from the territorial DFOs, Dzongkhags or from otheragencies responsible for planting. Data on the survival of the seedlings planted are collectedusing systematic sampling methods. As statistical software has not yet been developed data areanalysed manually. It is planned, in the near future, to link data from community forestry, privateforestry and plantations raised by industrial firms to the National Database System.
During afforestation/reforestation activities the following information is considered:• choice of species;• maintenance work like, thinning, weeding, climber cutting, fencing repair;• casualty replacement;• survival survey;• girth and height of older plantations;• biotic interference;• growth information and condition of species planted.
15 Territorial Divisional Forest Officers supply forest products to rural users including villagers,Dzong and, monasteries located in rural areas.16 As per Section 91 of Forest and Nature Conservation rules, 2000, the informant(s) are paid areward.

147
Forestry Development Corporation Limited
Data collected
The Forestry Development Corporation Limited collects the following data:• Quantity of timber produced from Forest Management Units;• Quantity of timber sold in at in-country public auctions.
Data on the quantity of timber produced is collected and compiled by FMUs and submitted atmonthly intervals to the Divisional Manager’s office. The Divisional Manager's office alsoreceives information from the sale depots. The two sets of information are then compiled and sentto the FDCL head office for further compilation and analysis (Figure 5). No specific statisticalsoftware has been developed for data analysis although there is a proposal to link the FDCLdatabase to the National Database at the Ministry of Agriculture in the near future.
Figure 5. Flow of information in FDCLTimber production
As prescribed by the Forest and Nature Conservation Rules, 2000, commercial timber productionshall only be from approved FMUs and as such ad-hoc production of timber, for commercialpurposes, is strictly prohibited. The Timber Pricing and Marketing Policy of 1999 recognises theForestry Development Corporation as the sole agency in the country producing timber from theFMUs. FDCL has six production divisions under responsible for harvesting, extracting, anddisposing of the timber within the country. The field offices maintain records of production andprogress reports are sent to FDCL head office for compilation.
Timber sale
According to the Timber Marketing and Pricing Policy of 1999, timber is sold by the timberproducing agencies through open auction only with only Bhutanese nationals being allowed toparticipate. Furthermore, it is directed that timber be auctioned in volumes as small as practicallypossible to enable the participation of small buyers (MOA, 2002). The auctioning authorities sendinformation on quantities of timber sold to the FDCL head office for compilation and perusal. TheFDCL head office, in turn, compiles the timber auction information and sends it to the Ministry ofAgriculture and the DoFS head office for further action.
Dzongkhag administrations
Registers are maintained on the quantity of rural timber sanctioned at the District ForestExtension Office, which is under the Dzongkhag administration. A relatively underdevelopeddatabase also exists for land exchange cases, detailing the thram number and name of the personapplying for land exchange.
FMUs
Movement of timberFlow of information
Saledepot
Roadhead
FDCLDivisionalManager’s
Office
FDCLHeadOffice

148
Dzongkhags are required to maintain information on the quantity of firewood supplied to the ruralpeople for their bona fide uses. As the afforestation program has been decentralised Dzongkhagswill be expected to maintain data on afforestation activities in the future.
Weakness and constraints in the current statistical system
The main constraints in the current system of data collection result from the limited budgetavailable and a lack of human resources. An increased budget is required for setting up andmaintaining a data collection infrastructure and personnel able to set-up computer networkingfacilities and databases are required. The personnel constraint applies in particular to theDivisional Forest Offices where there is also a lack of computer hardware.
Table 7 details strengths, weaknesses, opportunities and threats relating to the existingInformation Collection System. The analysis shows that there are many weaknesses in the presentsystem. The opportunities are that the methods used could be improved with minimal input andthat a system of data analysis could be put in place.
Table 7. Analysis on the past/existing information collection systemStrengths WeaknessProcedure simple and easily followed.Reporting was regular
Lack of data analysisLack of physical verificationNo feedback on lessons learnedNo feedback from information usersFormats not designed for computer data entry.
Opportunities ThreatsTo modify the format and use of the system. As collected data are not analysed, data collection does yield
benefits
Recommendations
In Bhutan there are many structured and unstructured databases concerning forests and forestproducts spread across several divisions of DoFS. To ensure better flow and utilisation of data andto assist in implementation of sustainable forest management, the databases need to be linked.Therefore, each Department under the Ministry of Agriculture should have a division responsiblefor Information Management Systems. Figure 7 shows the planned set-up of an InformationManagement System within the Ministry of Agriculture.
The Ministry of Agriculture has established a Local Area Network (LAN) in Thimphu connectingvarious departments and their divisions. A Network Administration Section, responsible formanaging the network-related websites and databases, has also been set up. As the DivisionalForest Officers in the Dzongkhags are not connected, efforts should be made to establishconnections between the territorial divisions, Parks and Dzongkhags forestry offices and the DoFSand MOA. Connections between FDCL and DoFS should also eventually be established. Theabove-mentioned recommendations are in line with the proposal prepared by the Task Force ofthe Ministry of Agriculture (MOA, 2002).
In order to improve the workability and effectiveness of the Information Management System,some structural adjustments need to be made within the DoFS. The proposed structure of theDoFS, as suggested by the Task Force, is given in Figure 6. The Information Management Sectionwill be responsible for organising the National Database and data analysis and in particular will:
• Act as a GIS focus and as a store of sub-sector information and data to facilitateplanning, programming, monitoring and evaluation;
• Maintain databases for technologies, problem areas, and relevant solutions and actas a knowledge base for the sub-sector;

149
• Maintain market information and statistics on timber production, trade, prices andthe market situation;
• Standardise and co-ordinate information generation;• Backstop functional divisions and field units in terms of information technology
management (GIS, databases management and data analysis).The territorial DFOs will report to the Head of DoFS through the Forest Protection and UtilisationDivision (FPUD) and through this division the information will be transmitted to InformationManagement Section. Collection of data, at the field level, will be done by the DFOs, Projects andDzongkhag Administrations as was previously the case.
Figure 6. Proposed structure of DoFSFunction of research in forest products statistics
National Forest Policy of 1974 recognises the need for research to assist sustainable forestmanagement. It states that utilisation programs should keep abreast technological developmentsand establishment of research centres is also emphasised. Forestry research, in Bhutan, is stilldeveloping and efforts should therefore be concentrated on applied research until adequate humanresources are available (RGOB, 1991).
Research on forest product statistics has not yet been initiated by the Research Centres. Forestryresearch detailed in the 9th five-year plan is split into nine sub-programs as follows:
1. Strengthen forestry research organisation and management2. Broadleaf forest management3. Conifer forest management4. Reforestation and industrial plantation5. Social forestry6. Non-wood forest Products7. Wood Products8. Nature Conservation9. Forest protection
Department ofForestry
NatureConservationDivision
InformationManagementSection
ForestProtection &UtilisationDivision
Regional ForestryPlanning Offices
SocialForestryDivision
Forest ResourcesDevelopmentDivision
NationalParks Territorial Forest
Divisions (11Divisions)

150
Figure 7. Proposed network set-up for DoFS and also partly MOA (adapted from draftMOA Monitoring & Evaluation Framework)
RNR-RC
Serve
DOFSIMS
DFOs
Parks
DzFOs
Project
Web Server Database Server E-mail/ProxyS
RNR SECTOR(Dzongkhag)
RNR Offices(Geog Based Offices)
Database ManagerMOAUsersat HQ
Access tosub sector
IMSManager
Other usersExternal to RNR
FeedbacDRUKNET
DRUKNET
RegionalResearchCentres
Access toRNR
NationalDatabase
(LAN)
MINISTRY OF AGRICULTURE

151
Information retrieval and management
All forest information should be stored in a forestry database within the main Ministry ofAgriculture database. The data management team should have direct and full access to thedepartment’s database server although only the DoFS representative should be authorised to enteror make amendments to forestry data.
The Ministry of Agriculture’s proposed Monitoring and Evaluation system will be heavilydependent on the information system that will enable data flow, data storage and data processing.The Information Management System Plan (IMSP) provides direction on how the informationtechnology will be utilised within the Ministry. The system architecture, shown in Figuredescribes (i) organisations responsible for data collection (ii) flow of data (iii) organisationsresponsible for data processing (iv) how data can be accessed by users.
The data collected by the geog-based offices of the Ministry will be entered and stored in theDzongkhag RNR sector database. Data access and analysis will also be done at this level. Thedata will then be electronically transferred to the National Database, either by e-mail, diskette orcompact disc. The data may, if required, also be transferred to Regional Research Centres forstorage and access. The National database will be accessible through web-based interfaces.
In the Department of Forestry Services, various data collection formats are presently in use. Tostreamline and improve cost-effectiveness of data collection, standard formats are recommended.These formats will focus on a minimum set of data so as not to overburden resources withseldom-used data.
Requirements
For the network system to work effectively the following basic requirement would be necessary(MOA, 2002).
Hardware:• Database servers at National and Regional level• Pentium based PCs
Software:• Appropriate statistical software
Human resources:• Database Administrators at the national and regional levels• Database manager to enter data and administer the database

152
References
Anon, 2001. BHUTAN-Private Sector Survey, Report prepared jointly by RGOB and UNDP.DoFS, 1999. Records of Forest Plantation of Bhutan, Department of Forestry Services.DoFS, 2002. Quarterly Progress Reports of Department of Forestry Services.FDCL, 2002. Progress Reports of Forestry Development Corporation Limited and the formats.FRDD, 1994 Guidelines for Forest Management Inventory Fieldwork, Department of Forestry
Services.MOA, 2002a. Report on Export of Semi Finished Timber Products, Ministry of Agriculture.MOA, 2002b. The RNR Sector Monitoring and Evaluation System: A proposal (Draft document),
Ministry of Agriculture.RGOB, 1991. National Forest Policy of Bhutan, 1991, Ministry of Agriculture, Royal
Government of Bhutan.RGOB, 1998. Timber Marketing and Pricing Policy-1999, Ministry of Agriculture, Royal
Government of Bhutan.RGOB, 2000. Forest and Nature Conservation Rules, 2000, Department of Forestry Services,
Ministry of Agriculture.RGOB, 2002. Forestry Sub-Sector Plan, Ninth Five-Year Plan Document, 2002-2007, Ministry of
Agriculture.

153
National forest products statistics, Cambodia
INTRODUCTION
Cambodia lies between 10°-15° North and 102°-108° East and shares borders with Thailand, LaoPDR, and Viet Nam. The country has a total area of 181 248 km2 and is divided into 21 provinces.There are 3 major towns, Keb and Sihanoukville and the capital city, Phnom Penh.
In 1998, Cambodia’s population was estimated at 11.5 million with an annual growth rate ofabout 2.8 percent. The population is concentrated in the central plain (318 persons/ km2) withlower densities in the coastal (60 persons/ km2) and upland regions (as low as 1 person/km2).Eighty-five percent of the Cambodian people depend on agriculture and wood and non-woodforest products for their subsistence.
The climate of Cambodia is classified as humid tropical with alternating, distinct wet and dryseasons, which are most pronounced in the central plains. The southwest rainy season lasts fromMay to October and is followed by a dry period from November to April. Average annual rainfallranges between 1000 and 2500 mm and average annual temperature from 25°C in late Decemberto 29°C in early May. Humidity increases from 65-70 percent in early part of the year to 85-90percent in August and September.
ForestsForests are a natural source of wealth and, managed wisely, can continue to provide for the nextand future generations of Cambodians, both at the local level and in terms of Governmentrevenues for rehabilitation and development.
In the 1960s, Cambodia's forest cover was approximately 13.2 million ha, or 73 percent of totalland area. Forests form a major part of the natural resource base and the importance of sustainableforest management has been the subject of much recent discussion given that many countries inthe region have lost a large proportions of their productive forests in recent decades.
Until 1970, the forests of Cambodia were managed in a way that caused little impact to the overallforest ecosystem. The country was divided into a system of forest reserves with managementdesigned to be conservatively sustainable. There was a fledgling timber industry and stronginstitutional controls by way of a District Forester and District System.
The outbreak of fighting in 1970 curtailed forest industry development, forced closure of localindustry and prevented access to forests. Over the following twenty years, forests were only usedfor provision of fuelwood and building timber for local communities. Shifting cultivation in thenortheast of the country had some impact on the forests but these were minimal. However, as thecountry emerged from the unstable political conditions of the 1970s and 1980s, increased timberdemand led to a proliferation of timber extraction that rapidly reached unsustainable levels. Theincreases in timber production have also exceeded the forest management capacity, both physicaland institutional, to regulate production and maintain sustainability of forest resource use. Theseriousness of the problems has motivated the government to work with internationaldevelopment institutions (FAO, IMF, UNDP, WB) to develop solutions.
THE CURRENT FOREST RESOURCE BASE
The forest cover of Cambodia includes evergreen, semi-evergreen, deciduous, swamp, mangroveand bamboo forest in various conditions from closed to disturbed and mosaic formations. Thereare also regrowth and plantation forests as well as open forest types including evergreen shrubland and dry deciduous shrub land (Table 1).
Table 1. Forest cover by forest type, 1997Forest type Area (ha) % of total land area

154
Evergreen closed 634 869 3.5Evergreen disturbed 3 323 527 18.3Evergreen mosaic 135 632 0.8Semi-evergreen closed 111 842 0.6Semi-evergreen disturbed 1 184 689 6.5Semi-evergreen mosaic 97 905 0.5Deciduous 3 777 678 20.8Deciduous mosaic 274 552 1.5Regrowth 544 777 3.0Swamp regrowth 23 590 0.1Swamp 222 149 1.2Mangrove 77 259 0.4Bamboo 21 822 0.1Swamp mosaic 105 464 0.6Other 0 0TOTAL 10 535 763 58.1Source: GIS & RS Unit, DFW
Based on the pre-1970 inventory data of IREF/USAID, forest cover was estimated at 13 227 100ha, or 73 percent of the total land area. In more recent years, estimates of remaining forest areafrom various organisations have varied greatly. However, a trend of rapid forest resourcedepletion is clear, with forest cover estimated from satellite imagery to be as low as 10 535 763 haor 58 percent of total land area (GIS Unit, DFW, 1996-97).An FAO forest inventory, currently underway, will provide data on wood volumes within theaforementioned forest types. Estimates indicate that commercial management is only feasiblewithin less than 4 million ha of the total forest area of which about 33 percent (3.3 million ha) hasbeen ‘set-aside’ in protected areas.Although there is no precise data on the area of forest remaining at present, between 1970 and1997, approximately 2 million ha of forest cover were removed. Analysis of land use data from1970, 1992/93 and 1996/97 shows that the annual rate of change in forest cover moderated after1993 as shown in Table 2.
Table 2. Forest cover and annual change, 1970-1997Area (ha) Annual change (%)
Forest Type 1970 1992/93 1996/97 1970-1993 1993-1997Dry Land 12 449 900 10 464 774 10 263 797 -0.8 -0.48Edaphic 1 777 200 427 145 408 142 -2.6 -1.13Total 13 227 100 10 891 919 10 671 939 -0.8 -0.51Forest cover 73% 60% 58%1 Forest growing in costal or flooded area (e.g. mangroves). Source: GIS & RS Unit, DFW

155
The forests of Cambodia have been and are being transformed to other land uses, and much of theremaining forest has been disturbed. The causes of forest degradation include effects resultingfrom the combination of poverty, population pressure, forestry policy failure and weaknesses inrural development; they include agricultural expansion, shifting cultivation and increaseddemands for fuelwood and construction wood. However, the main factors constrainingmanagement and implementation in the forestry sector are associated with uncertainty overforestland management and utilisation. These factors include forest clearing for land ownership,illegal occupation of forestlands and ‘land grabbing’ for commercial purposes. Organisedcollusion in illegal logging is also an impediment, especially with respect to removal of timber inexcess of sustainable cut.
Although forest resource information required for operational planning purposes is limited, mapsand databases are sufficiently well developed for strategic planning purposes. Forest inventoriesnecessary for commercial management have only been produced for a few areas and little isknown about the condition or current level of utilisation of remnant and degraded deciduousforest. However, there have been various estimates of medium term levels of sustainableproduction from the Cambodian forest estate.
Over the past five years, the Government has made numerous attempts to stop illegal logging andlog export, but none have been successfully implemented. Recent efforts involving theinternational community have made some progress towards improving the situation and recentreports by the Royal Government of Cambodia (RGC) claim significant progress in reducing therate of illegal logging. Logging controls implemented by the RGC include a requirement forconcessionaires to carry out inventories and determine the sustainable annual allowable cut(AAC). However, due to the questionable reliability of initial inventories and the lack ofmonitoring of illegal logging AACs may often be incorrectly set. The actual inventory figures areprobably significantly lower than the estimates used, and calculated AACs are therefore almostcertainly above sustainable levels.
Forest concessionsTo the extent that timber harvesting took place in a legal and controlled manner before the early1990s, it did so under a system of collection permits and log quotas that originated in Frenchcolonial times. Since then The Royal Government of Cambodia has promoted foreign investmentin the forestry sector and has introduced private industrial forest concessions as the maininstrument of commercial forest management. Investors were required to enter into Investmentand Timber License agreements with the RGC, which warranted capital investment in sawmillsand veneer and furniture manufacturing plants. They also required agreed numbers of employeesand the transfer of technology and knowledge. In return investors gained exclusive rights tologging concessions at agreed royalty and tax rates. However, instead of creating a clear legalcontext for the concession system, the government simply superimposed it on the existing permitsystem.
The first concession was granted in 1994, and over the following three years, 33 concessions wereestablished totalling almost seven million hectares. Based on 1997 DFW data, forest concessionscovered 41 percent of total land area, with protected areas at 31 percent and unallocated forestland28 percent. Concessions range in size from 55 000 to 1 400 000 ha and together cover 6 581 641ha or 62.3 percent of 1993 forest cover. The entire process of delineation of concessions andnegotiation of their terms was done without any reliable resource assessment. In the absence ofthis information, many concessionaires invested heavily in veneer plants. As a substantialproportion of the forests contain large quantities of dipterocarps, usually unsuitable for veneerproduction, most concessionaires do not consider these forest types operable and do not invest intheir protection and development. These forests do, however, remain attractive to illegal loggers.
DFW stipulated that, as of 1 January 2002 cutting permits would not be issued until completion of100 percent inventories in the next annual coupe and 1-5 percent intensity inventories for the five

156
subsequent annual coupes. Each concession company was also required to complete and submit aNew Master Plan and an environmental and social impact assessment to the DFW, to ensure thesustainability of forest management planning. In 2001, following the cancellation of theconcessions of 11 companies (16 concession areas) with 2 437 970 ha, concessions were held byonly 17 companies (24 concession areas) with a combined forest area of 4 362 729 ha.
WEAKNESSES AND CONSTRAINTS IN THE FOREST PRODUCTS STATISTICAL
SYSTEM
The main weakness and constraints in Cambodia’s forestry statistical system include: (i) poorinstitutional linkages, which impede data sharing, (ii) a lack of information technology with whichto manage data, (iii) a lack of institutional capacity, (iv) difficulties with law enforcement, (v) aninappropriate forestry administrative structure, (vi) low effectiveness, (vii) a lack of transparencyand (viii) the predominance of short-term planning.
COMMERCIAL TIMBER AND WOOD CONSUMPTION
Timber is now considered to be the most valuable forest product, especially in terms of provisionof foreign currency to the government. Within the country, large quantities of timber are used forconstruction of wooden houses and also for manufacture of furniture, bridges, wagons, andsleepers and in the construction of concrete building. National log production increaseddramatically following government elections in 1993 and by the end of 1996, log export bans andlinkages between log production and processing has been installed by the government to helpregulate forest sector development.
Since 1997, Cambodia ceased to export round logs and crudely sawn timber, however, the exportof processed forest products and some non-wood forest products, such as rattan, charcoal andbamboo, has remained.
Currently, most governmental and international agency representatives agree that the sustainabletimber utilisation is of great important to the economic development of Cambodia. Reductions inlog production are also important for bio-diversity conservation and wildlife protection.Cambodia’s support of this policy is shown by the falling log production between 1996-2001(Table 3).
Table 3. Production of forest products, 1996-2001Production (m3)
Product 1996 1997 1998 1999 2000 2001Industrial roundwood:
From forestconcessions
Purchase & bidding 1
136 026381 388
242 463283 472
233 34896 126
290 8763 930
179 3309 309
121 497794
Total industrial roundwood 517 414 525 935 329 474 294 806 188 639 122 291Sawnwood & otherprocessed wood 79 690 71 535 74 555 25 852 20 407 4 729Veneer 29 002 92 387 147 455 44 436 26 214 23 231Plywood 0 1 103 6 702 14 308 17 980 13 612Total sawnwood & wood-based panels 108 692 165 025 228 712 84 596 64 601 41 572
1- either (i) illegal logs intercepted by DFW or (ii) old logs collected under quota issued by Office of theCouncil of Ministers (quotas were suspended in 1998). Source: FMO, DFW, 2001.
Table 4. Wood processing installations, 2001Installation type Number of
installationsSawmills (State) 2Sawmills (Private) 611
Veneer/ plywood mills 122
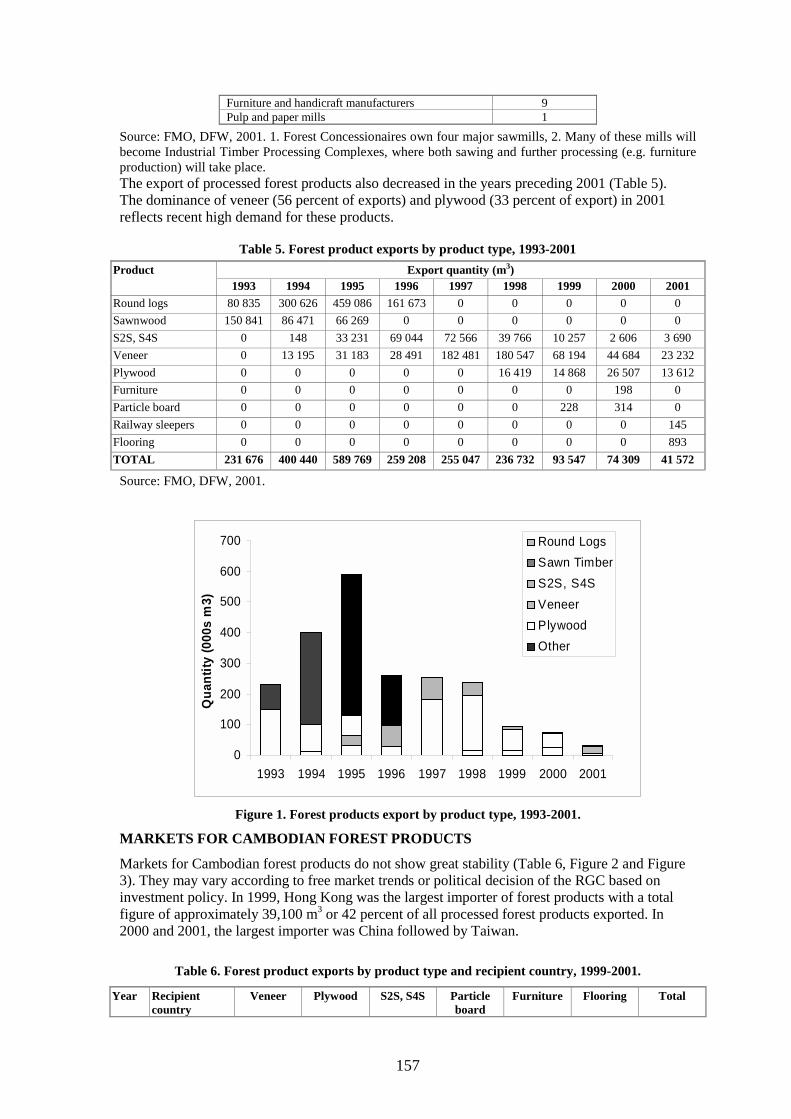
157
Furniture and handicraft manufacturers 9Pulp and paper mills 1
Source: FMO, DFW, 2001. 1. Forest Concessionaires own four major sawmills, 2. Many of these mills willbecome Industrial Timber Processing Complexes, where both sawing and further processing (e.g. furnitureproduction) will take place.The export of processed forest products also decreased in the years preceding 2001 (Table 5).The dominance of veneer (56 percent of exports) and plywood (33 percent of export) in 2001reflects recent high demand for these products.
Table 5. Forest product exports by product type, 1993-2001Export quantity (m3)Product
1993 1994 1995 1996 1997 1998 1999 2000 2001Round logs 80 835 300 626 459 086 161 673 0 0 0 0 0Sawnwood 150 841 86 471 66 269 0 0 0 0 0 0S2S, S4S 0 148 33 231 69 044 72 566 39 766 10 257 2 606 3 690Veneer 0 13 195 31 183 28 491 182 481 180 547 68 194 44 684 23 232Plywood 0 0 0 0 0 16 419 14 868 26 507 13 612Furniture 0 0 0 0 0 0 0 198 0Particle board 0 0 0 0 0 0 228 314 0Railway sleepers 0 0 0 0 0 0 0 0 145Flooring 0 0 0 0 0 0 0 0 893TOTAL 231 676 400 440 589 769 259 208 255 047 236 732 93 547 74 309 41 572
Source: FMO, DFW, 2001.
Figure 1. Forest products export by product type, 1993-2001.
MARKETS FOR CAMBODIAN FOREST PRODUCTS
Markets for Cambodian forest products do not show great stability (Table 6, Figure 2 and Figure3). They may vary according to free market trends or political decision of the RGC based oninvestment policy. In 1999, Hong Kong was the largest importer of forest products with a totalfigure of approximately 39,100 m3 or 42 percent of all processed forest products exported. In2000 and 2001, the largest importer was China followed by Taiwan.
Table 6. Forest product exports by product type and recipient country, 1999-2001.
Year Recipientcountry
Veneer Plywood S2S, S4S Particleboard
Furniture Flooring Total
0
100
200
300
400
500
600
700
1993 1994 1995 1996 1997 1998 1999 2000 2001
Qua
ntity
(000
s m
3)
Round LogsSawn TimberS2S, S4SVeneerPlywoodOther

158
Taiwan 15 121 313 391 228 0 0 16 063China 18 683 3 092 0 0 0 0 21 775Japan 0 0 5 390 0 0 0 5 390Singapore 700 5 842 0 0 0 0 6 542Viet Nam 0 0 962 0 0 0 962Thailand 0 0 3 514 0 0 0 3 514Hong Kong 33 478 5 622 0 0 0 0 39 100USA 211 0 0 0 0 0 211
1999
TOTAL 68 193 14 869 10 257 228 0 0 93 547Taiwan 15 912 0 0 314 160 0 16 386China 28 121 23 478 0 0 0 0 51 599Japan 0 0 1 307 0 211 0 1 518Singapore 0 3 030 44 0 0 0 3 074Viet Nam 0 0 1 080 0 0 0 1 080Philippines 653 0 0 0 0 0 653
2000
TOTAL 44 686 26 507 2 431 314 371 0 74 309Taiwan 3 660 1 722 735 0 0 695 6 812China 19 571 11 890 639 0 0 0 32 100Japan 0 0 1 017 0 0 0 1 017Viet Nam 0 0 1 300 0 0 0 1 300Thailand 0 0 145 0 0 198 343
2001
TOTAL 23 231 13 612 3 836 0 0 893 41 572
Source: KAMFOREXIM, DFW 2001

159
Figure 2. Forest product exports by recipient country, 1999-2001
Figure 3. Export quantities of forest products 1999-2001.
CONCLUSIONS
The collection of quantitative information on the production and trade of forest products inCambodia has been limited over the last decade. However, the situation is expected to improveannually through the Government’s forest reform policy and various forest management andconservation studies.
0
10
20
30
40
50
60
China
Taiwan
Hong Kong
Singap
oreJa
pan
Thaila
nd
Vietnam
Philipp
ines
USA
Expo
rt qu
antit
y (0
00s
m3)
199920002001
0
10
20
30
40
50
60
70
80
Veneer Plywood S2S, S4S Flooring ParticleBoard
Furniture
Expo
rt qu
antit
y (0
00s
m3)
199920002001

160
REFERENCES
Department of Forestry and Wildlife (1999, 2000, and 2000) Annual report fromKAMFOREXIM.
Forest Management Office Annual Report (2000-2001).National Institute of Statistics (1999) Report on the Cambodian Socio-Economic Survey. National
Institute of Statistics, Ministry of Planning, Phnom Penh.Papers of Forest Management Office, Department of Forestry and Wildlife. 2000-2001.Department of Forestry and Wildlife (2001) Biodiversity conservation guideline for forest
concessions.Sustainable Forest Management Project (2000) (TA-3152-CAM).

161
National forest products statistics, India
INTRODUCTION
The importance of Forestry Statistics in India was realised in a meeting of The Board of Forestryat Dehradun in 1925 where it was decided that all provinces would conduct an economic surveyof Forest Resources. Formats for collection of information were designed and circulated and theresulting information was sent to the Forest Research Institute (FRI) in Dehradun for compilationof an ‘all India’ view. Until 1946/47, The British India Government collected only limitedforestry information, however, after independence coverage was gradually extended to includeforests located in the former princely states.
In 1958/59, the Directorate of Economics and Statistics (DES) in the Ministry of Agriculture andIrrigation standardised state forestry statistics collection formats and began compiling nationallevel data. However, the accuracy of data and the timeliness of its collection and compilation werelimited by inadequate mechanisms and checking and analysis was minimal. To overcome thesedifficulties it was felt necessary to form a central body to collect and compile forestryinformation.
In 1965, a Central Forestry Commission (CFC) was set up in the Ministry of Agriculture with theobjective of collecting, compiling and publishing standardised forestry statistics. In 1967 the CFCrevised the standard DES formats and, following comments from the states and other experts inthe field, began collecting standardised statistics. There was, however, still insufficientorganisation for prompt collection, compilation and analysis.
Following creation of the Ministry of Environment and Forests (MOEF), the CFC wasreconstituted into separate Statistics and Utilisation Divisions. During this period the FRIcollected basic timber price information through its Forest Utilisation wing, and also compiledlimited forestry statistics, published through the MOEF as ‘India’s Forests’. These activities werediscontinued, however, after the post of Forest Utilisation Officer in FRI was abolished.
Previously, data on different aspects of forestry were collected and stored by different agencies inIndia but were not held in any single place which created difficulties in projecting a completepicture of forestry and ecosystem management in India. To centralise information, the IndianCouncil of Forestry Research and Education (ICFRE) organised a directorate of statistics inJanuary 1995, under the Forestry Research, Extension and Education Project (FREEP). The roleof this directorate, now called the Division of Statistics, is to collect, collate, process, publish andcirculate covering all aspects of forestry at the national level.
THE CURRENT FOREST PRODUCTS STATISTICAL SYSTEM
The Division of Statistics gathers data on production and trade of forest products from StateForest Departments, IAPMA, FIPPI and the Ministry of Commerce (Figure 1). In addition toproduction and trade data information is also received from the Planning Commission and MOEF,the Forest Survey of India and the Central Statistical Organisation. At present data is receivedeither in hard copy or electronically via e-mail.
Data collected through State Forest Departments

162
Forest products information is collated by the State Forest Departments using standard formatsreviewed at the FORSTAT–96 national workshop17 organised by the Directorate of Statistics inFebruary 1996 at ICFRE, Dehradun. Data from forest ranges, the lowest data collection unit, aredetermined through a chain of custody system (Box 1). Information from different field offices iscompiled at division level and transmitted annually to the State Forest Department Head Quarters,where statewide statistics are collated and consolidated. The State Forest Departments send datain standard format to ICFRE where, after analysis and discussion with State Forest Departments,it is compiled using Microsoft Excel by the Division of Statistics. The validity of data is checkedat state level with the help of ICFRE institutions.
Figure 1. Inflow of information and data for production and trade of forest products
Box 1. System for Determination of Timber Production.Production figures from State Forests Departments are collected through the followingsystem: (i) timber removals are based on marking book records which incorporate speciesname and girth over bark at breast height; (ii) all removals are recorded in a felling registerwhich bears the total volume and number of pieces from each stump; (iii) transport ofremovals is recorded in a transit pass register and in triplicate on transit passes; (iv)removals are taken to Govt. depots/go downs where a copy of the transit pass is depositedand receipt indicated on a duplicate copy; (v) in Govt. depot/go downs all incomingmaterial is measured piecewise and recorded in a depot/go down register; (iv) annualarrivals at, and disposals from, depot/go downs is reported to Division/state level authoritiesannually by the end of June.
17 Participants included delegates from 14 State Forest Departments, The Ministry of Environment andForests, The Forest Survey of India, The Wildlife Institute of India, The Indira Gandhi National ForestAcademy, The State Forest Service College, The Indian Institute of Remote Sensing, Kerala ForestResearch Institute and The Directorate of Forest Education.
FIPPI IAPMAMinistry of Commerce
TradeProduction
State Forest Departments
FORESTPRODUCTS
DATA

163
Information on different aspects of national forestry18 is summarised and published in ‘ForestryStatistics India’ in the form of tables. To date, editions have covered 1988-94, 1995, 1996 and2000. Forest products information covered in Chapter 11 includes paper production (MT),plywood production by state (m2), annual sawnwood production by state and saw mill (m3), aswell as a survey of wood product manufacturing units and information on paper industries andtheir raw material sources. Chapter 12 covers state wise annual production of timber (m3), poles,pulp and matchwood (m3), fuelwood (MT), sal seeds (MT), tendu leaves (standard bags/MT),gums and resins (MT), cane and rattan (MT), bamboo (no.), grass and fodder, drugs, spices,tannins and other NTFPs (MT).
In most states channels of information flow are not well organised and hence information flow istoo slow. As Government Forests are controlled at the state level, national agencies can onlycollect data with the cooperation of State Forest Departments. Efforts are currently being made toimprove the efficiency of forestry data flow between the state and national levels. To outline theflow of information on production and trade of forest products in India, the structure and situationin Madhya Pradesh State is used as an example.
Forestry administrative structure and information flow in Madhya PradeshThe flow of forest products data flow in Madhya Pradesh State is shown in Figure 2. Descriptionsof the units involved and their tasks are as follows.
Coupes are the lowest unit of government forestdue for logging in a particular year and aregenerally looked after by forest guards educated tohigh school level. In charge of coupe records treefellings in a felling register, and stacking of logsand woodfuel in a stacking register, which refers tothe felling register. Products from felling are thensent with transit passes to the Government Depotswith details being recorded in a transit register. Thefelling register, transit register and transit passes allcontain piece-wise log measurement and volumeinformation.
A beat is the lowest forest managementadministrative unit and is looked after by a forestguard. Illegal felling and tree uprooting is recordedand recovered logs are sent to the GovernmentDepot with transit passes, which include records ofeach log. A copy of the transit pass is also sent tothe Range Officers.
A depot is a forest products dump and sales pointand is overseen by a depot officer who maintains records of forest products received from eachcoupe and their value after re-measurement. Products are auctioned in graded stacks and recordsare made of quantities sold and the value fetched by each stack. Depot officers send monthly andannual receipt and disposal data to the Sub-Divisional Offices who send it on to Divisional ForestOffices after scrutiny and validation.
A Range Office is the administrative office of a group of beats and is headed by a Forest RangeOfficer who maintains records in standard formats as prescribed by the Divisional Forest Office.Each month, forest products data is sent from the range offices to the Sub-Divisional Office and 18 Topics include: demographic data, forest area, diversion of forest area, forest management, land-use, soilconservation, afforestation, wildlife, livestock and fodder, forest offences, plan-wise progress, wood-basedindustries, forest product and energy consumption, revenue and expenditure, education and training, importand export of forest products, economic indicators and world forestry statistics.
Figure 2. Forest products data flow
Stat
Circl
Division
Sub-
Depot
Coupe/Bea
Range

164
copied to the Divisional Forest Office.
There are between two and four Sub-Divisional Forest Offices in each Division. The Sub-Divisional Officers validate data from the Range and Depot Officers both by physically verifyingstock and checking entries in the various registers. They also verify coupe records, depot receiptsand disposal records at the end of each forestry year. The data is then sent to Divisional ForestOfficers for validation and scrutiny, after which necessary actions are taken.
The Divisional Forest Offices are the highest administrative body of forest resource managementin a district. The Divisional Forest Officers maintains records of all activities within theirjurisdiction including forest products production and trade data. Records are communicated to theCircle and State level authorities at monthly and annual intervals. All sawmills are registered inthe Divisional Forest Offices under the Kastha Chiran Adhiniyam Act, 1984. All sawmills submitstandard format accounts of receipts and disposals to the Divisional Forest Officers at quarterlyand annual intervals. This information is not, however, communicated to Circle and State HeadQuarters.
The Circle Office is a supervising office of a group of Divisional Forest Offices and is overseenby a Conservator of Forest. The Conservator sends all information and data received fromDivisional Forest Offices to State Head Quarter together with comments and validation ifrequired.
Data collected by States and Union TerritoriesStates and Union Territories (UTs) also independently generate some forestry information, whichis published in Annual Reports (see Appendix 1). Most states and UTs still collect data on auctionor sales values and compile annual case returns covering topics such as illicit felling, road repairs,budgets, regeneration and forest and nursery operations. A number of states also collect, compileand publish statistical information on subjects including climate and rainfall, forest area, growingstock and annual yield, plantation and development activities, production and export of forestproducts, market prices, fuelwood consumption, forest administration, forest revenue andexpenditure, forest protection, social forestry programmes, wildlife and forestry research. Thequality of the resulting statistical publications is enhanced in the certain cases where computersand suitable software applications are used.
Paper and newsprint dataPaper and newsprint data are received from IAPMA or IPMA in standard format. They collectthree quarters of the data on paper and newsprint through sampling of manufacturing units withthe rest being assessed on the basis of annual commercial tax and sales tax records. Data is sent inhard copy.
Wood-based panel dataThe Federation of Indian Plywood and Panel Industries (FIPPI) collect data on decorativeveneers, particle board, hardboard and medium density fibreboard from individual manufacturingunits. The data is validated on the basis of commercial tax, sales tax and other governmentrecords. Information is sent to ICFRE in hard copy and by e-mail.
Trade dataForest products import and export data is published in ‘Monthly Statistics of Foreign Trade’ byThe Directorate of Commercial Intelligence and Statistics, Ministry of Commerce. Thenomenclature used follows that of the World Customs Organisation harmonised system. Data issent in hard copy as well electronically on floppy discs.
The Department of Custom and Central Excise collate data on import and export of ForestProducts from its daily trade reports and custom clearance records. These data are reported to theDirectorate of Commercial Intelligence and Statistics, Calcutta, for dissemination. The data isbased on authentic Govt. records and are therefore reliable.
Revenue data from domestic trade of forest products is assembled by State Forest Departmentsfrom audited records and submitted to the Division of Statistics.

165
Data disseminationThe statistical information collected and compiled by the Division of Statistics is stored in adatabase with a report being published biannually in hard copy and on the Internet(http://www.icfre.org). The report is sent to all the State Forest Departments, State ForestCorporations, concerned Govt. of India Ministries and other miscellaneous users who requestsuch information from ICFRE.
At the national level, well-organised data is also generated by other agencies such as The ForestSurvey of India, the Ministry of Environment and Forests, the Central Statistical Organisation, theIndian Council of Forestry Research and Education (ICFRE), the Directorate of Foreign Tradeand the Federation of Indian Plywood and Panel Industry.
Potential data usersPotential data users include:
� State Forest Departments� MOEF� Planning Commission� State Forest Development Corporation� Forest Research Institute� NGOs� Universities� Traders
REVIEW OF TRADE DATA
Comparisons were made between 1990-2000 FAOSTAT forest products import and export dataand figures in the Monthly Statistics of Foreign Trade publication produced by the Directorate ofCommercial Intelligence and Statistics, Ministry of Commerce (MoC).Import data
� Industrial roundwood. Differences were found between FAOSTAT and MoC figuresalthough there was no clear trend. MoC figures are lower for 1990, 1991, 1992 and 2000and higher for1993 and 1999.
� Fuelwood. Figures are not available in FAOSTAT for 1992 and 1998. For the years inwhich comparisons could be made, MoC fuelwood import figures are lower thanFAOSTAT figures.
� Wood charcoal. Figures are available in FAOSTAT for 1992 and 2000 whereas MoCfigures are available for 1993 and 2000. For 2000 the MoC figure is lower.
� Sawlogs and veneer logs (C and NC). Figures are not available in FAOSTAT and MoCfigures are only available for 1993.
� Plywood. MoC figures not available.� Veneer sheets. FAOSTAT contains no data for 1990, 1991 and MoC figures are not
available for 1994 to 1998. For 1993 and 1999 MoC figures are higher than those inFAOSTAT.
� Hardboard. MoC figures not available� Fibre board and particle board. MoC figures are generally lower than those in
FAOSTAT.Export data
� Forest products. Figures are available in the FAOSTAT database for 1990-2000. Countryfigures are disaggregated amongst different Forest Products groups, which are underdifferent sections of the World Customs Organisation’s harmonised system ofnomenclature. Therefore comparison was not possible.
� Industrial roundwood. FAOSTAT figures are only available for 1991, 1992, 1999 and2000 in which years MoC figures are generally higher.

166
� Wood fuel. FAO figures are available for 1992, 1995 and 1996 whereas MoC figures areavailable for 1991 and 1992 only. For 1992, the MoC figure is lower.
� Wood charcoal. For the nine years where data was available for comparison, figures fromFAOSTAT are higher in all except for 1993.
� Sawlogs and veneer logs (C and NC). Comparisons could not be made, as figures are notavailable in FAOSTAT.
� Plywood. FAO figures are higher than the MoC figures prior to 1993 and lower thereafter.� Veneer sheets. FAO figures are higher than MoC figures throughout the comparison
period.� Fibre board. FAO export figures are rather low in comparison with the MoC figures.� Particle board. FAO figures are higher for 1990, 1991 and 1992 but considerably lower in
the latter part of the decade.WEAKNESSES AND CONSTRAINS IN THE FOREST PRODUCTS STATISTICAL
SYSTEM
Reliability of production and trade dataThere are several difficulties with ensuring the reliability of data from different sources collatesby the Division of Statistics. These are related not only to the direct providers of information, butalso to the chain of information providers from which they themselves receive data.
With respect to information collected by State Forest Departments from forest ranges and sent tothe Division of Statistics, the mechanisms involved are, at present, inadequate to ensure dataaccuracy and timely submission. This is partly because of the lack of statistical units in some StateForest Departments and the fact that the involved staff, being already burdened with other work,may be inclined to treat collation of information from user agencies as a secondary task. TheDivision of Statistics also faces difficulties in collating information from state and centralagencies as a result of differences between the data collection formats used by the agencies andthose sent by The Division of Statistics. Gaps in information are therefore inevitable and onoccasion there is considerable hesitancy in sharing data for one reason or another.
Once information is received by the ICFRE Division of Statistics for national publication, it isconsidered correct and as such no checking, even by sampling, is carried out. All precautions aretaken, however, during data compilation. Safeguards include scrutiny of data, in consultation withexperienced forest officers at Dehradun and double-checking of information with original formsonce data are entered in Microsoft Excel spreadsheets. In general, there are no great problems inanalysing and disseminating statistical information at the national level and The Division ofStatistics at Dehradun discharges this duty very efficiently.
State/UT Forest Departments do not have staff trained in collection and compilation of statisticalinformation and, due to a scarcity of funds, are unable to acquire the latest data processingequipment. They also lack the funding to appoint experienced database and Internetadministrators to efficiently manage and maintain statistical systems and, in fact, very fewState/UT Forest Departments are able to access internet facilities. Without making such facilitiesavailable to the State/UT Forest Departments it is unlikely that it will be possible to obtainaccurate and timely forestry information. The main constraints and weaknesses in forest productsstatistics collection are summarised in Table 1.
Table 1. Matrix of weaknesses and constraints in the current statistical systemActivity Weaknesses Constraints

167
Data collection Information may be inaccurate and unreliableInformation is reported irregularly or not at all.Data formats used at the state and national levelsare not uniform.There is often indifference to sharinginformation.
General lack of staff and also a lack of stafftrained in relevant fields.Lack of funds.Responsibility for state level reporting is notentrusted to the Directorate of Statistics.No single agency is responsible for providingstate level information.
Datacompilation andanalysis
Data may go unchecked or unanalysed Insufficient staff and electronic equipmentLack of a database and of database administratorsLack of staff trained in the use of relevantsoftware.Lack of trained and experienced staff at bothstate and national level.
Dissemination No priority is given to timely collection andsupply of information by the states.Difficulties are found in publishing final reportson time.
Lack of funds.Lack of an internet administrator.States HQs have no internet facilitiesLack of a database at the central and state levels.
1 erstwhile Directorate of Statistics; the unit of statistics under the Directorate ofEducation in ICFRE.
Adherence of customs statistics to the WCO Harmonised SystemFor the assessments in this report, forest products trade statistics were taken from the March 2000issue of Monthly Statistics of Foreign Trade, published by the Directorate of CommercialIntelligence and Statistics, Department of Commerce. The information contained thereinconforms exactly to the World Customs Organisation harmonised system. This is in accordancewith the explanatory notes issued by the Directorate of Publication, Custom and Central Excise,New Delhi, which includes the Harmonised Commodity Description and Coding System. Thenomenclature and codes followed for export and import of forest products is covered in chapters6, 12, 14 and 44 to 49. In this respect, there are no problems with trade statistics.RECOMMENDATIONS TO IMPROVE THE FOREST PRODUCTS STATISTICAL
SYSTEM
To improve the national forest products statistics systems state and national level data collectionformats should be harmonised to facilitate accurate and timely data reporting and compilation.
At the national level, the Division of Statistics maintains a forestry database and equivalentdatabases should be set-up in all State Forest Departments. Those that do not have a statistical unitat head quarters should create such a unit. To ensure that the unit is properly staffed, the staffshould comprise one Senior Statistical Officer, two Statistical Officers and four ResearchInvestigators. The Division of Statistics should post a Junior Research Fellow (JRF) to eachState/UT Forest Department to assist with compiling and sending information to the NationalForest Department HQ on time19. The JRFs could also help with installing information-processingsystems.
All State/UT Forest Department Head Quarters should equip their statistical units with Internetfacilities and modern data processing equipment. With such facilities available to all State/UTForest Departments, information flow will be much more rapid and State/UT level informationcould also be made available on the Internet. A programme to improve facilities in this way wouldbe facilitated by researchers and funding agencies working together with the Forest Departments.
Other proposed suggestions include:� Statistical correspondents at each State Forest Department Head Quarters should be
nominated.� Links should be formed through NIC with districts/divisions.
19 To provide one JRF to each of the 35 States/UTs in India at a cost of Rs. 5000/- per month, the Divisionof Statistics would have to bear an expenditure of Rs. 12.0 lakh per annum.

168
� Districts should send information in standard format directly to ICFRE, either directly by e-mail or through NIC.
� Data from national level agencies should be requested in electronic form.
INFORMATION SOURCESIndian Agro Paper Mill Associations, 1006 Pragati Town, 26 Rajendra Place, New Delhi- 110008.Federation of Indian Plywood and Panel Industry, 709 Pragati Town, 26 Rajendra Place, New
Delhi-110 008.State Forest Department of India.Monthly Statistics of Foreign Trade, March 2000 Directorate of Commercial Intelligence and
Statistics, Ministry of Commerce, Govt. of India.Customs and Central Excise, Ministry of Finance, Govt. of India.Central Statistical Organisation, Govt. of India, New Delhi.Directorate of Publications Customs and Central Excise, New Delhi.

169
Appendix 1Forest Products Data, 1995-2000
Table 1. Production of industrial roundwood, poles, fuelwood, sawnwood and pulp and matchwoodProduction (‘000 m3)
Product 1995/96 1996/97 1997/98 1998/99 1999/00Industrial roundwood 2 793.540 1 415.748 2 168.031 1 692.883 1 574.587Poles 108.641 30.049 24.910 40.510 14.195Fuelwood 2 937.678 1 936.615 1 710.057 2 898.81 2 933.628Sawnwood 10 624 18 520 16 293 NA NAPulp and matchwood 698.115 471.339 450.168 817.321 397.422
Source: State Forest Departments
Table 2. Production and trade of paper and newsprint
Source: Indian Agro Paper Mills Association
Table 3. Plywood capacity and productionProduction (million m2–4 mm)
StateAnnualcapacity
No.Units 2000 1999 1998 1997 1996 1995
Andaman & NicobarIslands
10.057 3 1.491 5.889 8.462 8.397 7.712 8.294
Arunachal Pradesh 30.674 9 - - - 0.051 18.465 17.601Assam 44.512 22 1.019 - 0.783 3.214 39.084 42.956Karnataka 9.749 8 2.286 2.397 1.465 0.867 1.031 0.820Kerala 8.790 8 0.513 0.639 0.689 0.915 0.734 0.764Maharashtra 1.437 2 1.440 1.077 1.260 1.596 1.465 1.810West Bengal 2.716 2 2.124 1.220 0.121 0.263 0.856 0.905Nagaland 4.200 2 2.605 - - - - -Meghalaya 2.600 1 - - - - - -Andhra Pradesh 1.500 1 - - - - - -Uttar Pradesh 0.558 1 2.035 2.487 - - - -Rajasthan 1.500 1 - - - - - -Madhya Pradesh 5.750 2 - - - - - -Chennai - - 1.177 - - - - -
Source: Federation of Indian Plywood and Panel Industry
Table 4. Production of decorative veneers, particle board, hardboard and medium density fibreboardProduction
Product 1997/98 1998/99 1999/00Decorative veneers (m2) - 2 092 021 23 356 997Particle board (tonnes) 34 634 63 683 92 728Hardboard (tonnes) 45 126 81 290 78 414Medium density fibreboard (tonnes) 30 632 39 085 43 567
Source: Federation of Indian Plywood and Panel Industry
Quantity (‘000 tonnes)Product Element 1996-97 1997-98 1998-99 1999-2000 2000-2001Paper Production 4 050 4 150 4 275 4 567 4 786
Import 110 300 271 277 297Export 100 60 70 100 150
Newsprint Production 302 410 500 400 700Import 547 500 498 350 487Export 0 0 0 0 0

170
Table 5. Value of wood-based industry product exportsValue (millions rupees)
Product 1995/96 1996/97 1997/98 1998/99 1999/00 2000/01Plywood and plywood products 579.5 631.8 413.9 172.4 282.0 303.0Hardboard of wood fibre 145.0 175.8 142.2 172.1 208.0 239.0Veneers 211.1 237.2 221.0 109.9 184.0 161.0Teachest plywood 38.9 45.2 53.7 26.9 15.0 18.0Wooden furniture 115.2 166.1 219.3 364.4 619.0 1165.0
Source: Federation of Indian Plywood and Panel Industry
Table 6. Import values of plywood and plywood productsValue (millions rupees)
Product 1995/96 1996/97 1997/98 1998/99 1999/00Veneer sheet and sheet for plywood 208.9 229.1 382.5 522.7 170.9Particle board and similar board ofwood other ligneous material
133.0 128.0 153.4 162.8 285.9
Fibre board of wood or other ligneousmaterial
8.5 24.1 298.4 353.2 366.1
Plywood, veneered panels and similarlaminated products
233.6 148.0 265.3 374.4 242.3
Total 584.0 529.2 1099.6 1413.1 1075.2Source: Federation of Indian Plywood and Panel Industry

171
National forest products statistics, Indonesia
INTRODUCTION
Over the last four years, Indonesia has suffered a multidimensional crisis affecting all aspects ofgovernment management. The crisis has been followed by many policy reforms including recentchanges in decentralisation and autonomy laws. These changes have implications for the use andmanagement of forestry sector information systems and have also presented new problems in thefield. As a result of lack of concern and limited government funds and resources, serious effortshave not yet been made by MOF but related institutions to overcome these problems.
This paper details national statistics on forest products in Indonesia and was conducted byconsultants in cooperation with the Ministry of Forestry of Indonesia and the Food andAgriculture Organisation of the UN. The report evaluates existing national statistics on forestproducts and presents comparisons of current national forest products data sets with those ofFAO. The work included library based research on forest products monitoring and informationsystems, interviews with relevant people in the Ministry of Forestry, the Central Board ofStatistics and other involved institutions.
Forest areaIndonesia is located on the equator between 110° North and 140° East. It consists of 17,508islands with total area of approximately 1.9 million km2 (190 million ha). Based on harmonisationof the consensus forest use plan and regional level spatial planning in 1999, the total registeredforest area is 120.35 million ha (MOF 2000). Indonesian forest areas comprise 112.27 million haof permanent forest and 8.08 million ha of forest area designated for conversion to other landuses. Permanent forest is that which has been designated by Government as ‘forest’ whether treesare present or not and thus includes areas destined for planting or natural regeneration as well asexisting forest. Permanent forest includes the following sub-categories:
� Protection forest, comprising 33.52 million ha, is forest in areas with specific physicalcharacteristics that warrant protection to sustain particular functions, especially with respectto hydrology and soil conservation.
� Conservation/fully protected forest and recreation forests cover 20.50 million ha. Theyserve not only to protect and preserve genetic resources and life supporting systems but alsoto provide materials for the development of science and education.
� Production forest covers 58.25 million ha and is designated for exploitation of timber,rattan, sap and other forest products. Production forest may be classified into limited(23.06 million ha) and permanent production forest (35.20 million ha). Limited productionforest is designated for prevention of soil erosion as well as timber production. Under theforestry rule, trees with diameter at breast height of >60 cm may be felled whereas inpermanent production forests the cutting limit is 50 cm.The importance of timber in Indonesia
Indonesia’s forest resources have been the principle engine of national economic developmentover the last three decades and forest resources have contributed significantly to foreign exchangerevenues, employment, regional development and economic growth. The roles of forestry instimulating the economic development have increased rapidly since the concession system wasintroduced in 1970. Based on investment and forestry laws20, private concessionaires, bothdomestic and foreign, were permitted to invest in the forestry sector. The laws stated that forestutilisation rights may be granted to state, provincial, or private companies and cover activitiessuch as harvesting, reforestation, and processing and marketing of forest products. Concessions 20 Act No.1 of 1967 regarding Foreign Investment, Act No.6 of 1968 regarding Domestic Investment, BasicForestry Law and Forestry Laws nos. 5/1967 and 41/1999.

172
are granted for a limited period, normally of 20 years.
Forest products commodities were ranked second after oil and gas with respect to foreignexchange earnings in 1990 (FAO and MOF 1990). The ‘Monthly Statistical Bulletin 1998’reported that, as a percentage of total export revenue, that from wood products (includingsawnwood, plywood, and paper) came second (18 percent) to textiles (19 percent) with ‘others’,including processed food, chemicals and cattle fodder, contributing 47 percent of export revenue(Figure 1). According to MOFEC (1999) export revenues from wood products at US$6 millionper year are second in magnitude to textiles outside the oil and gas sector.
In addition to export earnings, forestry revenues are also obtained from (i) forest concessionlicence fees (IHPH); (ii) land and improvement tax (PBB); (iii) forest products royalty(IHH/PSDH); (iv) reforestation fee (DR); (v) scaling and grading fee and (vi) sawn timber exporttax and minimum export price.
Figure 1. Proportion of Indonesia’s total export revenues for industrial products in 1997
Recent changes in forest managementThe importance of forest resources to the economic growth of Indonesia and the increasing publicawareness and international attention towards Indonesia’s forests require that the existing forestresources be managed sustainably. At present Indonesia still has large areas of tropical forest,however, the area is decreasing rapidly and recent estimates show that the rate of deforestation isbetween 600 000 and 1.8 million ha per year. The major causes of deforestation are forestharvesting and legal and illegal land clearance for plantation establishment. As a result of thesefactors the area of Indonesia’s natural forests has diminished much more rapidly than expected ashas the quality of resources in large areas of remaining forest. These effects are having majoreconomic, social and environmental effects.
It may be argued that between 1970 and 2000, Indonesia’s forests were centrally managed by thegovernment in Jakarta. As befitted the political and power systems of the time, management wascarried out in an exclusive way. Major influences included policy and regulatory frameworks thathindered forest control and law enforcement. Furthermore, the capacity of Government and theMinistry of Forestry to control concessions was constrained by a lack of qualified personnel andsupporting facilities and poor staff motivation.
Since the district autonomy measures implemented early in 2001, forest management has beenchanging. Today, it is not only Central Government or ‘people in Jakarta’ who have significantroles in forest decision making, but many other stakeholders including concession holders, localpopulations, urban people, environmentalists, eco-tourists and scientists. Thus, Government’s rolein forest management is now more collaborative and the process is, in general, more decentralisedand participatory in nature.
Wood products18%
Textile19%
Rubber and palm oil10%
Others47%
Basic metal2% Electrical apparatus
4%

173
Although, in theory, a new forest management system, taking stakeholder’s demands intoaccount, would by now have been developed, unstable conditions have led to rapid andfundamental changes in the systems involved. The conditions have also affected the informationsystems needed to support the decision making process. For example, several local authoritieshave ceased to report forest activities and illegal logging has exploded since the 1997/98economic crisis. The latter was assisted by the general turmoil and a vacuum in the forest sector,and still persists through fear of imprisonment of those acting against it (SCKPFP, 2002). Thesecircumstances have caused difficulties in predicting production and distribution of forest products.Changes in production forest policy in Indonesia are detailed in Table 1.
In summary, although more time is needed for the measures to be smoothly implemented, forestmanagement in Indonesia is now, as the new regulations make clear, more transparent,participatory and fair. It is perhaps necessary to add that it is not only the regulations themselvesthat induce change but the motivation they give to individual forest stakeholder to change theirapproach to include the demands of all stakeholders. Indeed, it is obvious that there arepreconditions necessary to support the implementation of the new forest management practices,one of these being to formulate a well functioning information system.
Table 1. Indonesia’s recent production forest management related policiesPolicy explanation Law/Regulation/Decree
Basic regulations on the auctioning of new or expiredconcessions (HPHs).
Ministerial Decree No. 731/1998 and No. 732/1998
Guidance on sustainable forest management in Indonesia Forestry Acts No.41/1999Decentralisation to increase the role of district/provincialauthorities in natural resource management.
Law No.22/1999
Limits the size of any new or extended timber concession(HPH) to 50 000 ha and the overall concession holding ofany timber group to 100 000 ha within a province or 400000 ha nationally.
Government Regulation No.6/1999
Export taxes on logs reduced gradually from 30% in April1998 to 10% by the end of 2001
Ministerial Decree
Log export ban since 8th October 2001 Collective decree by the Ministry of Forestry and theMinistry of Industry and Trade, Nos. 1132/KPTS-II/2001 and 292/MPP/Kep/10/ 2001
Source: Pribadi (2002)

174
Forest products statistical systems in Indonesia
The forest products statistical system between 1997 and 2001
Early in 2001, GOI began moves towards decentralisation21 by giving Local Government greateropportunity to manage their region and natural resources. At present, The Ministry of Forestrycontinues to manage forests in line with Forestry Act No. 41/1999, in which provision is made for(i) carrying out forest inventories and developing forest management plans, (ii) utilisation offorest land (iii) forest rehabilitation (iv) forest protection and nature conservation. Plans have beenmade to revise the Forestry Acts in order to harmonise them with the Local Autonomy Act andthereby support further implementation of sustainable forest management.
Before the decentralisation policies were implemented, institutions involved in forestry, such aslogging companies, wood industries and local forestry offices, would send activity reports toJakarta. Since decentralisation, however, the flow of the data has been hindered, as new technicalguidelines on forest products information systems have not been issued. This has led to a paucityof data and information at the national level.
In summary, forest products data for the last five years has been very limited and incomplete dueto the unstable political, social and economic situation as well as the moves towards localautonomy.
Developing a national forestry information system in the Ministry of ForestryAwareness of the need for accurate, accessible and complete information for forest managementmotivated the Ministry of Forestry (1990) to formulate a forestry information systemsdevelopment plan. The ‘Info Plan’ has three phases: (i) Preparation (1990-1994), which focuseson solving internal problems, (ii) Transition (1994-1999), in which activities will centre onimproving the flow of required data from outside the Ministry of Forestry, and (iii) Independence(1999-2019).
Each phase includes three major aspects: organisation, information systems, and resources asdescribed:
� Organisation consists of: (i) developing a data processing unit and a data and statisticsdivision (preparation phase), (ii) establishing a centre for information technology(PUSTIK) run by professional staff, (iii) strengthening the centre of information technology(independency phase) and developing information exchange with ITTO, The World Bank,international conservation groups and other countries.
� Information systems. Setting up an information system that fulfils the requirements ofMOF is the main concern of the preparation phase. Following development during thetransition phase, the information system will be connected with other databases during theindependence phase to facilitate cooperation with other national or international institutionsand organisations.
� Resources. Resources, in terms of staff, hardware and software, will mostly be requiredfor setting up the centre for information technology (PUSTIK) during the preparationphase. During the transition phase, the efficiency of use of resources will be improved sothat data requirements may be completed during the independence phase.
The implementation process faces several hurdles related to the current national financial turmoiland the urgent calls from provinces and district for greater autonomy. For this reason,management of forestry information should be in collaboration with local authorities althoughsome Local Governments are not yet ready to participate.
Since the issue of the autonomy regulation there have been no clear laws or rules regulatingexchange of information between central, provincial and local Government offices. At present,Ministerial Decree No. 577/KptsI/1993, regarding the guidance of report management in theMinistry of Forestry, is used. However, the decree has not yet been brought into line with the
21 The implementation of decentralisation is covered by Acts No. 22/1999 and 25/1999.
175
decentralisation process. Furthermore, lower ranking regulations, such as technical guidelines, arealso required to support the Ministerial Decree.
Until now there has been no specific institution charged with collecting internationallystandardised forest products data, even though timber contributes significantly to national income.It is therefore necessary to evaluate the forest products data system in Indonesia and to improvethe reliability and accuracy of data.
FOREST PRODUCTS DATA COLLECTED AND METHODOLOGIES USED
The Ministry of Forestry collects statistics in order to support policy and planning activities.Statistics are mainly used descriptively, although in certain cases inferential statistics are used toassist policy formulation.
Prior to implementation of the decentralisation process in January 2001, the types of data andinformation collected were as detailed below. Since implementation, technical guidelinessupporting and explaining the new forest management systems (including information flow) havenot been available and, as a result, the flow of data has suffered. Some district and ProvincialForestry Offices under local authority have voluntarily continued to submit data whilst othershave stopped.
There are three main government institution, which, together with their local offices, are involvedin collecting data and information in Indonesia: (i) the Ministry of Forestry (MOF, and its localoffices BEHPHH), (ii) the Central Board of Statistics (BPS) and (iii) the Ministry of Industry andTrade (MIT). NGOs such as the Indonesian Association for Concession Holders (APHI) and theIndonesia Wood Panel Association (APKINDO) also collect data and information from theirmembers although it is not an obligatory task.
Local levelData is collected at the local level by forest concessions, wood industries, local forestry officesand local statistics offices.Forest concessionsForest concessions include (i) private concession, (ii) state owned concessions (Inhutani andPerhutani), (iii) capital sharing concession (private/state), and (iv) plantations. Every year, forestconcession companies are obliged to submit annual workplans (AWP) to the local and centralforestry offices for Government legal clearance and approval. The plans detail proposals for allactivities related to forest management within the concession areas. Based on the approved AWP,companies implement activities in a sustainable manner following the Indonesian SelectiveCutting System (TPTI).
To further assist regulation of company activities, concessions must also send monthly reports toregional or provincial forestry office (Figure 2). The reports based on primary field data, detailtotal roundwood removals and the quantities of roundwood sold to other parties or used by thecompany itself. Before 2001, proposals were submitted to the Regional Forestry Offices (Kanwil)under The Ministry of Forestry, however, since 2001, the Provincial Forestry Offices (DinasKehutanan Propinsi) under the Provincial Governors have dealt with the reports.
Wood industriesPrivate concessions commonly run their own wood industries. Their reports include data onprocessed wood production, distribution of roundwood among provinces and quantities of forestproducts imported and exported22. The wood industries also provide information on theiractivities to the Ministry of Trade and Industry and the Central Board of Statistics (BPS). In thepast, forest concessions and wood industries sent their reports to the local forestry offices thatpassed them to the Ministry of Forestry. Forest Concessions sometimes sent reports directly to centralforestry office.
22 Information collected by wood industries includes production, import and export of plywood, sawnwood,mouldings, block board, particle board, veneer, wood chips and pulp.

176
Forestry service officesForestry Service Offices include (i) District Forestry Service Offices (Dishut Kabupaten, underhead of district), (ii) Provincial Forestry Service Offices (under province governor), and (iii) theForest Exploitation Agency (BEHPHH under MOF). The offices collect data from forestconcessions and wood industries in the form of monthly and annual reports (Figure 2). Dataincludes production, import and export of roundwood, plywood, sawnwood, mouldings, blockboard, particle board, veneer, wood chips and pulp. Records are also collected from cuttingpermits, transport licenses, sample surveys and volumes or values estimated at checkpoints.
Following data compilation, local forestry offices send their reports to the Directorate General ofForest Products Development (DGFPD) in Jakarta (Figure 2). Reports are also sent to the ForestryPlanning Agency (BAPLAN) in MOF, which also has a responsibility to collect data andinformation on all forestry activities in Indonesia. At present, the data format used by localforestry offices to report to central office has not been aligned with the Harmonised System (HS)of the World Customs Organisation.
Information is disseminated in a number of ways, which include: (i) publication of monthly,annual and semester reports (ii) production of accountability reports, and (iii) replying to dataenquiries from newspapers, radio, TV, libraries and NGOs.
Local statistics offices (district/provincial BPS offices)Local Statistics Offices (BPS) collect forest products data through complete enumeration surveysof all forest concessions (HPH) and industrial tree plantations (HTI) including those owned by thestate (Perhutani). The data, collected includes roundwood and industrial roundwood production atdistrict and province level. The surveys are carried out annually between April and August byDistrict Officers from the Central Board of Statistics and are supervised by the Head ofProduction Statistics in the District Statistics Office. BPS also works with customs staff to collectimport and export data for which the Harmonised System (HS) of the World Customs Organisationis used.
Wood products data and information required from branch offices/base camps includes:� Roundwood volume production for the current year and previous year.� Data on allocation of roundwood (e.g. for sawnwood or plywood).
Data required from central offices includes:� Forest products prices per unit volume.� Company income and expenditure.
Data required from plantation companies includes:� Roundwood volume production.� Data on allocation of roundwood (e.g. for sawnwood or plywood).
National levelThere are three main institutions collecting data and information on wood products at the nationallevel: (i) The Ministry of Forestry (MOF) (ii) The Central Board of Statistics (BPS) and (iii) TheMinistry of Trade and Industry and some NGOs (Figure 2). These institutions collect secondarydata from forest concession and/or wood industries, who themselves collect the primary field dataduring felling operations or processing of forest products.
Ministry of ForestryThe Directorate General of Forest Products Development (DGFPD) in the Ministry of Forestry isthe institution responsible for collecting wood products data and information at the national level.Data are gathered from local forestry offices in the provinces and districts as well as from forestconcessions.
The categories of data collected by DGFPD amongst others, include (MOF 2000):� Roundwood production by province.

177
� Industrial roundwood production by province (including plywood, sawnwood, mouldings,blockboard, particle board, veneer, wood chips and pulp).
� Export of roundwood and industrial roundwood by province.
DGFPD disseminates forest products data along with information on other forest activities, suchas logging and NTFP production through monthly and annual reports validated by the DirectorGeneral of Forest Products Development. Summaries are presented by province, source, year andmonth but are not classified botanically (coniferous/non-coniferous) as in the WCO HarmonisedSystem or ITTO data. Moreover, measurements are often in kilograms and further study is neededto develop factors to convert to other units such as cubic metres. The reports are sent to all echelon Isections in the Ministry of Forestry, the Central Board of Statistics (BPS) and the ForestryLibrary. MOF also disseminates information through response to data enquiries from the media.
The Forestry Planning Agency (BAPLAN) in MOF also collects secondary data from DGFPD,the Central Board of Statistics and the Ministry of Industry and Trade (Figure 2). BAPLANdisseminates information by the following means:
� Publication of an annual statistics book� Presentation of data and information, in cooperation with DGFPD, on the MOF web site
(http://www.dephut.go.id).� Response to enquiries from governmental and non-governmental organisation.� Response to e-mail enquiries.
The annual forestry statistics book, validated by the Secretary General of MOF, presents data onthe following:
� Log, sawn timber and plywood production during last ten years� Log production by provinces during last five years� Sawn timber production by province during five years� Plywood production by provinces during last five years� Non wood forest products during last five years� Processed wood exports by product during last five years� Sawn timber exports by destination country� Plywood exports by destination countries� Non-wood forest products exports during last five years.
Central Board of StatisticsBased on Government Regulation No. 51 concerning management of statistics, the Central Boardof Statistics (BPS) collects data and information by census, survey and other methodologies thathave arisen with the development of information technology. Information concerned with forestryindustries has been collected annually since the agriculture census in 1993, whereas householdforestry statistics are only collected every ten years during the agriculture census. Data collectedby the Central Board of Statistics via local BPS offices comprises roundwood and industrialroundwood production from plantations and natural forests at district and province level.
BPS also consign staff to work with customs in collecting data and information on export andimport of forest products and BPS data are botanically classified in accordance with the WCOHarmonised System (HS) and ITTO data, although further work is needed to develop conversionfactors where kilograms are not appropriate.

178
Figure 2. Data and information flows related to forest products before implementation of districtautonomy system
Through these efforts BPS is able to assist MOF in completing data and information required forthe annual statistics report (Sutarno, 2000) and, likewise, BPS compiles data and informationfrom the annual forestry statistics books issued by The Ministry of Forestry. All data collected byBPS are presented in a forestry company statistics book issued annually at the national level.
The existing data collection system in BPS has several weaknesses. Currently, BPS lacksqualified staff and has limited funds to improve forestry statistical systems. There is also somelack of concern amongst respondents and as a result the response rate is low and submissions areoften late. These difficulties account for the common late publication of the statistics books.Ministry of Industries and TradeThe Ministry of Industries and Trade (MTI) collect data related to processed wood through itslocal offices and directly from wood industries (Figure 2). In common with MOF, MTI issuesmonthly, semester, and annually reports and responds to data enquiries from the media nationaland international NGOs and private companies.
The information collected by MTI includes:� Roundwood production.
District ForestryService Office(DishutKabupaten)
ProvincialForestry ServiceOffice (DishutPropinsi)
DGFPD, MoF.(deadline 15th ofevery month)
ForestryPlanningAgency,MoF
CentralBoard ofStatistics(BPS)
Roundwoodproduction
Industrialroundwoodproduction
Roundwoodproduction fromnatural forests andplantations
Forestproducts
distribution
BEHPHH
Customs
Export/import
Cut by forest concessionsProcessed by wood
i d t i
Ministryof TradeandIndustry
Local StatisticsOffice
Local MTIffi

179
� Processed wood (industrial roundwood).� Distribution of roundwood and industrial roundwood amongst provinces.� Export and import quantities of wood and non-wood forest products.
Non-Government OrganisationNGOs such as APHI, and APKINDO collect forest products related information from theirmembers. Neither has special relationships concerning wood products data collection with anyGovernment organisation.
POTENTIAL USERS OF FOREST PRODUCTS STATISTICS
Ministry of ForestryThe main potential user of data and information on forest products in Indonesia is the Ministry ofForestry whose responsibilities include the following:
� Formulation of national forestry policy.� Management of national level action plans.� Management of a central monitoring program.� Formulation of criteria and indicators for SFM.� Research and development.
The information flow hierarchy is detailed in Figure 3. The potential users of data and informationon forest products include echelon I, II, III, IV management levels in local and central Ministry ofForestry offices. Data processing is required for each management level. For example, descriptivestatistics are commonly used to guide operational of transactional activities, whereas inferentialstatistics are more important for decision-making processes at the management and strategiclevels.
Figure 3. Hierarchy of information system in Ministry of Forestry, IndonesiaOthers
Other potential users of forest products statistics in Indonesia include:� Secretariat of the Vice President� Other ministries such as the Ministry of Industry and Trade.� Universities.
DATA
PROCESS 3Strategic
Operational/Transactional
Management INFORMATION
INFORMATION
PROCESS 2
PROCESS 1INFORMATION
180
� Forest concessions, wood industries and organisations dealing with forest products.� Local, national and international non-governmental organisations such as APHI, ITTO
and FAO.� Local and international companies involved in forest product distribution and trade.
NATIONAL FOREST PRODUCTS STATISTICS AND FAO
Difficulties encountered in responding to FAO statistical enquiriesTo unearth difficulties in responding to FAO statistical enquiries, interviews were held with thecurrent and previous JQ focal points as listed in Appendix 1. The following points were made:
� Since the issue of Acts No. 22/2000 and 25/2000 relating to provincial and districtautonomy, regulations governing data and information flow have been unclear. Some forestconcessions that previously reported to central and local forestry offices (Kanwil) ceasedreporting when responsibilities for data collection shifted to the local forestry service officeunder the Provincial Governor. In general, decentralisation has aggravated information flowas a result of the concept of autonomy being incorrectly assessed. This is especially the casein rich provinces and districts where the authorities assume that they are independent andnot therefore obliged to report to central government on forest activities. The situation hasled to incomplete data at the national level.
� Lack of coordination amongst government offices has led to differences in the figurespublished by different institutions e.g. BPS and MOF.
� There appears to be some lack of confidence in responding to statistical enquiries frominternational agencies, e.g. FAO and ITTO as a result of unreliable, incomplete data and theuse of different units.
� MOF as the contact institution for forest products data enquiries has not used internationalstandard systems (e.g. HS or SITC) for collecting, analysing and processing data. To putsuch systems into effect would still take some time and effort.
� Time and money are consumed in coordinating with other government agencies whereMOF lacks the necessary data. For instance participation of the Central Board of Statisticsand the Ministry of Industries and Trade is required to complete information on productionand distribution of roundwood and forest products trade.
� As a result of the present political situation, decision makers and staff working in MOFare frequently changed with the result that information development policy is alsofrequently changed. Furthermore, as there are no strict rules governing forest productsstatistics in place at present, the system is highly dependent on individuals directlyinvolved. The quality of the data in Ministry of Forestry can therefore be poor and coverageincomplete.Comparison of FAO and national forest products data sets
To assess the degree of concurrence between FAO and national data sets, records from the 1999Indonesia Statistics Book were compared with FAO data for 1999. The following points warrantconsideration:
� As with FAO and ITTO, the most MOF data is in units of cubic meters whereas datacollected by BPS is in kilograms.
� As MOF does not classify forest products as coniferous or non-coniferous as required byFAO and other international agencies the MOF data cannot be used for the joint forestsector questionnaire.
� Where measurement units are directly comparable, serious differences between nationaland FAO data sets are evident. The underestimates in MOF data can be explained by thefact that many local forestry offices no longer submit reports to the central forestry office.BPS data, although more complete as a result of the annual census is often not comparabledue to different measurement units.
� Instead of SITC or the WCO Harmonised System, BPS adopted the KLUI system (KlasifikasiLapangan Usaha Indonesia), which was replaced in 2000 by KLBI (Klasifikasi Baku Lapangan

181
Usaha Indonesia). KLUI is an industrial classification based on revision 3 of the InternationalStandard Industrial Classification of all Economic Activities (ISIC) and modified according tolocal conditions. As an example of differences in the systems, KLUI 33111 covers three HSsub-groups, HS 44.07.10, HS 44.07.20 and HS 44.07.90. The 1999 publication includes 351manufacturing subgroups numbered from 15111 to 37200 (BPS, 1999).
� Under present conditions in Indonesia it is difficult to determine the reliability of forestproducts data and therefore completing the JQ and revising data from recent years isproblematical.
� Production data, unlike trade data, are not yet harmonised at the international level. Thisresults from the greater importance of harmonisation in bilateral or multilateral trading ascompared to domestic decision-making and policy formulation.
Weaknesses and constraints in the forest products statistical systemAt present, the standard of forest products data and information in Indonesia is relatively poor andthe situation is worsening as a result of changes in forest management and misunderstandings ofdecentralisation. The main problems are detailed in the following sections.
Regulation� The autonomy regulations have changed not only the allocation of forest management
roles but also the responsibility for reporting forest products statistics. The greaterindependence of districts has also led some to believe that they no longer have theobligation to report on forest management or forest products.
� There is no common vision or understanding of information systems management acrossall parties involved in collection, validation, analysis and dissemination of forest productsdata.Data and information systems capacity
� Forestry offices lack sufficient computer equipment to process data. In general, centralgovernment offices are better equipped than local offices and almost all divisions in theMinistry of Forestry have computers although some do not work optimally. However, inlocal offices few staff members are sufficiently trained to operate the computer systems.Problems are also encountered with inefficient maintenance, the lack of a uniformoperating system and inappropriate software and/or hardware.
� Data flow between institutions is slow as a result of the use of conventional rather thancomputerised systems of exchange.
� Currently, radio and Internet communication links are available and could be used for dataexchange with the provinces. However, the number of radios is inadequate and theoperating procedures are time consuming and inefficient.
� At present Customs and the Central Board of Statistics use the WCO Harmonised Systemwhereas the Ministry of Forestry have not yet begun to. Thus, information gaps commonlyappear since trade data are from Customs and BPS, whilst timber production figures aremainly from the Ministry of Forestry. Furthermore, MOF does not use any botanicalclassification (coniferous and non-coniferous) as used by FAO and ITTO.Human resources
� Officers concerned with collection and compilation of data and information are lessdisciplined in the task than could be the case.
� Due to the lack of reward, people are not motivated to improve their skills. This isparticularly the case for staff in the provincial offices.
� There is a general lack of expertise in information technology and an imbalance in itsdistribution.
� Top managers (decision makers) lack of awareness of the importance of accurate andreliable information and decisions may be based solely on the political agenda. Decisionmakers should improve their appreciation of the necessity of wood products information.

182
� Technical officers lack awareness of the importance of wood products data andinformation, are poorly motivated and lack discipline in data processing and also lack skilland knowledge in data collection and management.
� Late submissions from remote or poorly motivated respondents cause delays in theproduction of statistical reports.Law enforcement
Only 40-60 percent of companies required to return the national forestry statistics form actuallydo so (Sutarno, 2000). This might be caused by:
� Respondents not completing the form through doubt that they will benefit from the surveyresults.
� Difficulty in finding or adapting data to fulfil the specific requirement laid down by theform.
� The absence of sanctions imposed on companies that do not submit data.� Since the Asian economic crisis, illegal logging has increased dramatically and this may
have resulted in underestimation of roundwood production. This is suggested by the factthat recorded roundwood production is lower than demand. According to MOF (2002)annual roundwood demand is around 63.48 million m3, whilst production is only 23.98million m3. It is assumed that illegal logging plays a significant role in filling the 39.50million m3 gap. In addition, illegally harvested roundwood also finds it way toneighbouring countries such Malaysia and China.
� As a result of non-payment of royalties, reforestation fees and export tax illegal loggingresults in annual losses equivalent to US$3.5 billion (EIA, 2001; World Bank, 2001 inFreezailah et al. 2001). Estimates of timber volumes removed through illegal logging areshown in Table 2.
Table 2. Estimates of timber harvested illegally in Indonesia per yearSource Volume (millions m3)Speech of The Minister of Forestry and Estate Crops in The Workshop onIllegal Logging (Jakarta, August 2000)
17-30
Purnama and Basuki (2000) 25Indonesia-UK Tropical Forest Management in Ruwindriyarto (2000) 32Manurung (2000) 30
RECOMMENDATIONS TO IMPROVE THE FOREST PRODUCTS STATISTICAL
SYSTEM
With the recent political and structural changes in Indonesia, the roles of government offices andthe flow of forest products information have changed significantly. However, there are nowefforts to develop a new information system in line with the changes in national, provincial anddistrict government. Several recommendations have been formulated as detailed in the followingsections.
Regulation and technical guidance� Government policy should support data sharing and information coordination amongst
forestry companies, local and central government and other forest products relatedinstitutions. For instance, if MOF could access BPS forestry census data, repetition wouldbe avoided. This could be achieved through either a ministerial decree, a decree at the levelof Director General or Governor, or through a collective decree issued by involvedinstitution.
� To enable response to enquiries at both the local and national levels, the central forestryoffice should develop an integrated, standardised data system for the local offices to use. Acentral database manager should assist nationwide system integration from the beginning ofdevelopment.

183
� Technical guidelines detailing a data coordination system should be developed toharmonise data collection methodologies across government agencies. To improve dataflow a computer application linked to the Internet would be indispensable.Human resources
� Short and long-term training should be carried-out in all institutions involved in forestproducts data collection, if possible, to improve expertise in the area.
� Incentive scheme should be set-up for staff dealing with data collection and processing, asthe work is unattractive and boring for most employees.
� Short-term training for middle and top managers should be initiated to demonstrate thenecessity of forest products statistics and to help motivate managers to make maximum useof data.
� Staff of the Forestry Planning Agency (BAPLAN) who submit data and information toFAO and other international agencies (e.g. analyst/programmer, database administrator andtelecommunications staff) need regular training to improve their knowledge of newerinformation technology.
The proposed actions to reduce problems related to forest products information in Indonesia aredescribed in Table 3.
Table 3 Proposals for improving data on national forest products in IndonesiaTimeframe
Programmes/activities General objectives Comments
Long term Establishing a new national forestproducts information system withadequate technical and humanresources.
To establish intensive andextensive informationcoordination and to provideefficient response to datainquiries under the newdecentralised system.
The new information systemwill be implemented when anappropriate institution isfound.
Mediumterm
Continue working on ‘infoplan’with involved institution (localgovernment offices, MTI andBPS).
To build an information systemin MOF in coordination withother institutions.
The concept should be revisedto bring it in line with currentnational conditions.
Establishing a workinginstitutional system throughgovernment regulation.
To build coordination amongstinvolved institutions and localand central authorities.
Acts, government regulationsand decrees not in line withdecentralisation should berevised.
Improving staffing capacity andlevels of expertise.
To achieve staffing andtraining levels adequate tosupport the informationsystem.
Capacity building is expensiveand should therefore be wellplanned and organised.
Short term -Revising regulations in allinvolved institutions.-Revising ‘infoplan’ in MOF-Organising workshops andtraining in information systems.-Developing a capacity buildingplan (in line with ‘infoplan’ in theMOF).-Improving coordination amongstinvolved agencies.
To build a new managementsystem in line withdecentralisation and tointroduce the system toinvolved parties.
Order and control mechanismsare no longer appropriate andtherefore new approaches areneeded to accommodate theneeds of each institution.
Establishing a new national forest products information systemTo establish a new national forest products information system through institutional adjustmentsis urgent, especially under present conditions. Three phases should be considered:
1. Definition phase/Feasibility analysis:� What must the system do?� What output must it produce?� What inputs must it accept?� How will the input data be obtained?

184
� What major databases would be required?� How quickly must output be available?
2. Construction phase:� System design� System building� System testing
3. Implementation phase:� Installation� Operation and maintenance
The problem is that the reformation and decentralisation occurred are still in process. The fastchanges of policy occur very often. Therefore, several of the government institutions (such as theMinistry of Forestry) could only wait until the situation is more stable.
REFERENCES
Central Board of Statistics, 1998. Economics indicators. Monthly statisticalbulletin. Jakarta, Indonesia: BPS.Central Board of Statistics, 1999. Large and Medium Manufacturing Statistics. Volume 3. Jakarta.
Indonesia: BPS.Central Board of Statistics, 2000. Indonesian Foreign Trade Statistics. Export. 1999. Volumes 1
and 2. Jakarta, Indonesia: BPS.Central Board of Statistics, 2000. Indonesian Foreign Trade Statistics. Import. 1999. Volumes 1
and 2. Jakarta, Indonesia: BPS.Central Board of Statistics, 2001. Indonesian Foreign Trade Statistics. Export. 2000. Volumes 1
and 2. Jakarta, Indonesia: BPS.Central Board of Statistics, 2001. Indonesian Foreign Trade Statistics. Import. 2000. Volumes 1
and 2. Jakarta, Indonesia: BPS.Central Board of Statistics, 2001. Foreign Trade Statistics Bulletin. Export until July 2001.
Jakarta, Indonesia: BPS.Central Board of Statistics, 2001. Foreign Trade Statistics Bulletin. Import until July 2001.
Jakarta, Indonesia: BPS.Frezailah, B., Che Yeom, and Cherukat Chandrasekharan, 2001. Achieving Sustainable Forest
Management in Indonesia. ITTO News Letter http//www.itto.or.jp/newsletter/v12nl/3.html.(4 April 2002).
Kvanli, A.H., 1988. Statistics. A Computer Integrated Approach. St. Paul, USA: West PublishingCompany.
Magdalena, 1999. A review of the Indonesian Selective Cutting and planting (TPTI) SilviculturalSystem, and Assessment of Its Cost and Benefits. Unpublished MSc Dissertation. Universityof Edinburgh.
Manurung, E.G. Toga, 2000. Mengenai Pencurian Kayu di Indonesia Fakta Praktek KKN danKetiadaan Penegakan Supremasi Hukum, in The Proceeding of Workshop on Illegal Logging,Jakarta 30-31 August 2000. MOFEC, World Bank, and WWF.
MOF, 1990. Infoplan (Rencana Pengembangan Sistem Informasi dan Pemanfaatan TeknologiInformasi) Departemen Kehutanan.
MOF, 2000. Forestry Statistics of Production Forest Management.MOF, 2001. Eksekutif. Data dan Informasi Kehutanan dan Perkebunan.MOF, 2001. Export and Import. Forest Commodity 1999-2000.MOF, 2001. Forestry Statistics of Indonesia 2000.MOF, 2002. Materi RDP Dirjen BPK dengan Komisi III DPR RI tanggal 8 maret 2002.
Unpublished Meeting Material, Presented in Parliament Hearing in 8 March 2002.MOFEC, 1999. Hutan untuk kesejahteraan rakyat.
http://www.mofrinet.cbn.ne.id/inform...formasi/konsep/htm_sejahtera. html (31 May 1999).

185
MOFEC, 2002. Sambutan Menteri Muda Kehutanan Pada lokakarya Penebangan Kayu Liar(Illegal logging) in Proceedings of Workshop on Illegal Logging, Jakarta 30-31 August 2000.MOFEC, World Bank, and WWF.
MOF and FAO. 1990. Situation and outlook of forestry sector in Indonesia. Forest Resource BaseVol 2. Jakarta, Indonesia: MOF and FAO.
Purnama B and Basuki H, 2000. Masalah Penebangan kayu Liar dari Perspektif Pemerintah inThe Proceeding of Workshop on Illegal Logging, Jakarta 30-31 August 2000. MOFEC, WorldBank, and WWF.
Ruwindrijanto, 2000. Masalah Penebangan Kayu (Pencurian Kayu) dari Perspekkstif LSM inProceeding of Workshop on Illegal Logging, Jakarta 30-31 August 2000. MOFEC, WorldBank, and WWF.
Sutarno, 2000. Statistik Kehutanan (Permasalahan dan Alternatif Pemecahannya). Unpublishedpaper presented in Information Development Meeting, November 2001, Jakarta, Indonesia.
Pribadi, A., 2000. The Present Condition of Forest Information System in Indonesia. Unpublishedpaper presented at FAO workshop in Bangkok, Thailand.
Pribadi A, 2002.Indonesia’s Forest Policy and Its Review. Unpublished paper presented in FAOWorkshop 2002. Kuala Lumpur, Malaysia.
SCKPFP, 2002. After Three Years of Introducing Sustainable Forest Management In Indonesia.Bulletin SCKPFP 1, December 2002. Banjarbaru, Indonesia: EC-IFP.
APPENDIX 1. CONTACT PERSONS
Name Current PositionUsman Yusuf and staff: Director of Centre for Data Information and Forest Inventory, Forestry Planning
Agency (BAPLAN), MOFDedi Supriadi Head of Division, Forestry Planning Agency (BAPLAN), MOFAgus Widiarto Section Head, Forestry Planning Agency (BAPLAN), MOFDani Staff of Forestry Planning Agency (BAPLAN), MOF
Rubiandono Staff of evaluation and reporting, DGFPDMagdalena Staff of evaluation and reporting, DGFPDNurcahyo Adi Forestry Planning Agency (BAPLAN), MOFSupardi Staff of Central Board of Statistics (BPS)

186
National forest products statistics, Lao PDR
INTRODUCTION
The Lao People’s Democratic Republic (Lao PDR) is located in central Indochina between13º 50’-22º 30’ North and 100º 10’-107º 40’ East. The total land area is 236 800 km2 and bordersare shared with China, Myanmar, Thailand, Cambodia and Viet Nam and. Elevation ranges from 80m above sea level in the extreme south, where the Mekong River leaves the country, to 2 820 m atPhoubia Mountain in Xiangkhuang Province; 79 percent of the country is regarded asmountainous. The Mekong River enters Lao PDR from China in the northwest where the borderswith Myanmar and Thailand meet and then flows east to Luangpabang and south to the regionbordering Thailand, Viet Nam and Cambodia. The population in 1998 was estimated at 5.2million with an annual increase of 2.7 percent and a population density of 22 people per km2.
The climate is dominated by the monsoon and, as such, has pronounced wet and dry seasons. Therainy season lasts from May to September when the prevailing wind is from the southwest.Average annual rainfall varies between 1 000 mm in the north to 3 000 mm in the South. The dryseason which runs between October and April is characterised by winds from the northeast. Dailymean temperatures range from 10º C in January to 38º C in July with the north of the countrygenerally cooler than the south. Lowland areas are classified as tropical, whilst the higherelevations and mountainous areas in the north are considered sub-tropical.
Lao PDR is highly dependent on forest products due to its low population density and high forestcover (Foppes and Ketphanh, 2000). Forest products serve a wide range of subsistence needs andprovide opportunities for income generation. More than 500 plants and animal products arereported to be used. Forestry is also the second largest economic sector, after agriculture, and acrucial source of export income. Several provinces are highly dependent on forestry revenues andmore than 10 percent of the population are employed in the forestry sector, there being few othersources of industrial development. There are good development opportunities in forestry as Laotimber species are well known, and in high demand. The investment climate is also favourableowing to low wages and the existence of many valuable non-timber forest products attractive toexport markets.
Laos is aware that its natural resources have been in decline over the years as a result ofincreasing populations, the expansion of settlements, subsistence agriculture in natural forestareas, forest fire and unsound logging practices. Owing to extensive upland agriculture (slash andburn), substantial land areas have been degraded in Lao PDR and with population growth moreland has been required for food production, which has meant conversion of forestlands foragriculture. National development efforts also require resources such as timber and in additiontree clearance has been necessary for hydropower plant construction.
Forest resourcesWith respect to natural forests, Lao PDR was considered one of the best endowed of the SouthEast Asia countries. The forests are of great importance due to their contribution to socio-economic development, and therefore require proper management. The Lao government is nowstaging efforts to protect the remaining forests in order to maintain an ecological balance in thenation’s natural resources. Forest law provides a clear definition of forest which stipulates that theLao Government may designate forestlands as either (i) Protection forest, (ii) Conservation forest,(iii) Production forest, (iv) Regeneration forest or (v) Degraded forest.
Forest cover has recently been estimated at 47 percent, with an area of about 11.1 million ha. Ofthe total forest cover 35 percent is mixed deciduous forest, 5 percent dipterocarp forest and

187
5 percent dry evergreen forest; the remaining area is coniferous and mixed coniferous forest(Table 1). The low and medium altitude forests (100-500 m above sea level) contain hardwoodtree species of commercial value in the Dipterocarpaceae and Leguminoseae families includingDipterocarpus spp., Pterocarpus spp. and Lagerstromia spp.. At higher levels broad-leavedspecies and tropical pines, such as Araucaria cunningamia, occur. There are also a wide range ofnon-timber forest products including bamboos, rattans, cardamoms, benzoin, latex, bark resin andgum and the forests provide a home to a variety of birds, reptiles, amphibians and other fauna.
Table 1. Forest types in Lao PDRForest type Area (ha)Evergreen forest 3 400 000Mixed deciduous forest 5 680 000Deciduous forest 1 600 000Other 480 000Total 11 160 000
The challenge to the forestry sectorThe potential impacts of economic and social changes in Lao PDR and neighbouring countriesand the effects of regional integration on Lao forests and forestry are difficult to predict owing tothe number of unknown factors involved. In general it is likely that more forestlands will beconverted to other land use types, especially agriculture and rice paddy, required for subsistenceof the increasing population. Furthermore, roads and reservoirs will be constructed in forest areasas part of the country’s development programme. The magnitude of forest loss is difficult topredict, however, it is likely that conversion to agriculture land will be commensurate withpopulation increase.
Policy and strategy developmentThe Lao government has laid down forest policy and guidelines that include the followingprovisions:
� Biological resources of the present forest must be protected, through participatoryapproaches.
� Afforestation, production, and forest management must be linked to food production andprovision of alternative to shifting cultivation.
� Forest cover should be expanded to 70 percent of the total land area with priority given toannual tree plantations.
To fulfil the strategy to 2000, Lao PDR developed a Tropical Forest Actions Plan (TFAP) in1990, which was endorsed by the Lao government in 1991.
Forestry-related lawsThe Lao government has issued many decrees in relation to natural resource utilisation, whichwere enacted in 1996 as forest law. Many copies of the forest law have published and distributed.Various regulations and technical guideline were drafted by the Department of Forestry includingthe following:
� Sustainable plantation development regulation� Conservation and wildlife management regulation� Village forest regulation� Management on wood processing industry regulation� Management of logging regulation� Criteria and indicators for sustainable forest management� National code of harvesting
Forest land-use planning and land allocationUnder land use planning practice, land for different uses is allocated to villagers, households orcommunities. Allocation is a participatory process in which villagers make the decisions on howland should be used. Following indication of the boundaries of allocated lands, land tenure

188
certificates, prepared by the land allocation committee, are issued to applicants.
Shifting cultivation stabilisationThe Lao government places high priority on reducing/stabilising shifting cultivation to protectforest resources and the natural environment. One of the 8 priority programmes of the governmentis to protect natural resources whilst increasing living standard of rural people. Bilateral donorshave supported many experiments concerning shifting cultivation stabilisation, which haveutilised many different methods. Moves are currently being made to limit agricultural productionto flat areas.
WOOD PRODUCTS SUPPLY
Timber harvesting in Lao PDR uses a quota system based on Provincial Forest Management Plansand Infrastructure Development Programmes. The Ministry of Agriculture and Forestry and theDepartment of Forestry are responsible for summarising the logging plans of all provinces in thecountry. A nationwide Annual Logging Plan is formulated from the individual provincial plansand submitted to The Prime Minister’s Office for consideration and approval. Quotas are then sentto the provinces prior to the beginning of the harvesting season.
Logging takes place in the dry season, which normally runs between November and late May. Theprovincial government allocates the quota received from central government to the woodprocessing enterprises in each province and shares are also allocated to one of the three nationalstate owned enterprises. During the 1997/98 logging season, harvest quotas were mainly fromdam construction areas, (e.g. Nam Theun Dam, Nam Ngum Dam, Nam Leuk Dam Xe Nam NoiDam and Xepian Dam) although harvesting also took place in other project areas and productionforests. Wood products have also recently been supplied from plantation grown trees such as Teakand Eucalyptus. The major companies engaged in logging are the state forest enterprises andforeign companies involved in joint ventures with the Lao government.
The demand for wood products within and outside Lao PDR is currently increasing rapidly. Woodproducts provided by the forestry sector include lumber, furniture, doors, parquet flooring andpoles. Most houses in urban areas are now built with bricks although wooden houses stilldominate in rural areas and a large proportion of production serves to meet increasing demandsassociated with construction. The increase is resulting in heightened demand for doors, flooring,furniture and other household items.
In 2000, the forestry sector contributed 5 percent to GDP. However, this figure does not includethe contribution of the wood-processing industry, which is accounted for under the industrysector, or values associated with subsistence use of logs for house construction or other purposes.The growth of the forestry sector’s share, from 3.4 percent in 1990, reflects the increase in logsproduction from 300 000 m3 in 1990 to 734 000 m3 in 1999. The share is expected to reduce insize in the future due to planned harvesting reductions.
THE WOOD INDUSTRY
Forest related industry constitutes a significant part of the Lao economy and within the timberindustry saw milling is the largest sub-sector. Furniture factories in Lao PDR mostly servedomestic markets and mainly produce household furniture using species such as May Dou, MayTekha, Rosewood and Teak. According to the Order of The Prime’s Minister Office No. 10/PMof 4 October 2000, concerning forest management and wood industries, there were 1 164 woodprocessing factories in the country (Table 2). Due to overcapacity some revision is needed in thesector to adjust the number of industries to match raw material supply. Two factories, located inXaisomboun special region, were established in 1995-96 with government permission. There aretwo plywood mills in the country, the Bolisad Phathana Ket Phoudoi plywood mill inKhammouane Province and Huang Fat Hong Lao plywood mill, which although situated inVientiane Province acquires timber from Bolikhamxay Province.
Table 2. Forest products processing factories in Lao PDR

189
Type of installation NumberSawmill 161Factory producing finished wood products 11Bamboo factory 2Furniture factory 954Factory producing finished rattan products 4Agar wood factory 10Plywood factory 2
Source: Donor meeting 1998, Savannakhet ProvinceFOREST PRODUCTS DATA COLLECTION
Collection of information on production and export of forest products is a duty of the Departmentof Forestry. DOF embraces concerns such as sustainable management of forests and ecosystemsand sustainable use of forest products. Collection of forest products statistics not only assists theDepartment of Forestry in management planning and providing other organisations withinformation for forest related development but also contributes to Lao PDR’s over-archingconcern with poverty alleviation as detailed in the current five year programme.
As yet, there is no forest sector information system in Lao PDR. Consequently, the quality ofexisting data on forest resources and production and consumption of wood products, includingindustrial products is not highly reliable. Time series data is only available for select variablessuch as import and export of products from wood-based industries.
This study included desk-based research, interviews and workshops and was carried out by theDivision of Planning in the Department of Forestry. To gather information, the team organisedworkshops within each Provincial Forestry Office and each international border checkpoint.Workshops were also conducted centrally with the Customs Department and other organisationconcerned with timber trade and small meetings were held with a wide range of institutions,including:
� Provincial Agriculture and Forestry Offices� Forestry Section and international border checkpoints in Savannakhet Province� Lao-Thai International border checkpoint� Lao-Nakhonphanom Thai International border checkpoint� Lao-Vietnam International border checkpoint� Forestry Section and international border checkpoints in Khammouane Province� Forestry Section and international border checkpoints in Bolikhamxay Province� Forestry Section and international border checkpoints in Xayabouly Province
The FAO questionnaires were used to gather data, but in many cases there were no records at allor records were damaged through the passage of time or as a result of termite attack. It was alsofound that forest products data collecting agencies frequently refer to Department of Forestrydata. It was therefore difficult for the team to consolidate data for review. Comparison of datawith those produced by FAO was done using information from the Planning and CooperationDivision within the Department of Forestry. Other older information is available in theDepartment of Forestry library but it was not easy for the team to access accurate information.
Agencies involved in wood products data collectionAgencies involved in wood products data collection include the following:
� Ministry of Agriculture and Forestry� Department of Forestry� Provincial of Agriculture and Forestry Offices� Science Technology and Environment Agency� Ministry of Commerce and Tourism� Department of Customs

190
Current users of wood products informationCurrent users of wood products information include the following:
� Ministry of Agriculture and Forestry� Department of Forestry� Provincial of Agriculture and Forestry Offices� Science Technology and Environment Agency� Ministry of Commerce and Tourism� Department of Customs� Electrical enterprise
AVAILABLE FOREST PRODUCTS DATA
This section details available forest products production and export data. Although manyattempts have been made to collect a more complete set of national forest products data theobjective has not yet been fully achieved. Therefore some data have been estimated, particularlyfor the period between 1990 and 2000.
Fuelwood consumptionData on fuelwood consumption in Lao PDR is not complete or accurate, figures for 1990-1994 areshown in Table 3. Utilisation of wood for energy causes forest degradation both directly andindirectly. However, fuelwood is an important income-generating commodity for slash and burnfarmers. Fuelwood and charcoal may be used for both household consumption and for incomegeneration through collection and sale. There are no records of export of fuelwood or charcoal.
Table 3. Woodfuel consumption 1990-1994 (including wood for charcoal)Year Consumption (tonnes)1990 917.291991 980.751992 924.431993 979.601994 1,070.40Total 3 872.47
Source: Department of Forestry 1997Production data
Log production volumes increased from 331 220 m3 in 1990 to 594 930 m3 in 1994 and thenremained steady at 560 000 m3 between 1996 and 1998 (Table 4). Volumes have since beendecreasing as a result of the 1998 Asian economic crisis. The main sources of logs areinfrastructure development sites such as dam construction areas and tracts of land cleared forhydropower transmission lines or roads. The main wood products consumed domestically arecharcoal, poles and firewood. There are no pulp and paper factories in Lao PDR.
Table 4. Industrial roundwood productionYear Volume (m3)1990 331 2201991 408 2901992 210 8901993 516 0001994 594 9301995 543 2461996 583 8141997 495 3321998 465 4001999 523 3002000 434 838Total 5 109 260

191
Source: Annual Forestry Department ReportExport data
Although log export is banned, some companies operate to supply various processing factories asauthorised by government quotas. Over the last four years 16 percent of government tax revenueshave been from log royalties and log sales are an important source of revenue for many provinces.Wood products account for approximately 40 percent of total exports by value. With respect totrade in timber, the most important export products were logs, sawnwood, stumps, parquetflooring, plywood and a ranch of semi-finished products and finished products. Due to the Asianeconomic crisis log exports have been well below planned levels and domestic wood consumptionhas also dropped due to price increases resulting from devaluation of the Kip.
The total revenue from wood products in Lao PDR between 1990 and 2000 is estimated atUS$279 million (Table 5). The main exports were logs followed by sawnwood, finished productssuch furniture, flooring and photo frames and stumps. Plywood has also contributed significantlyto export earnings. Between 1990 and 2000 the export value of sawnwood and processed woodproducts amounted to US$9.5 million and log export value totalled US$37.2 million. The majorexport markets were Thailand, China, Taiwan, Japan and France. Each year, revenue from exportof wood products totals approximately 30 percent of national foreign currency earnings andvarious non-wood forest products are also exported. The country is in desperate need of theseexport revenues for both import purchase and domestic investment.
Table 5. Estimated total wood-products income, 1990-2000Income source Income (US$)Lowland log sales 232 679 280Log export 37 200 000Processed wood export 9 500 000Total 279 579 280
Source: Forestry Sector Strategy for 1993-2000.
The following tables detail wood products export for Lao PDR between 1990 and 2000. The teamtried to collate these data and compare them with the other sources collected but found that somedata were not available, especially value figures between 1996 and 2000. Value data, where notavailable, were therefore estimated on the basis of export volume and average unit prices for theproducts concerned.

192
Table 6. Quantity and value of log exports, 1990-2000Year Volume (m3) Value (US$) Data source1990 39 200 3 456 000 Donor meeting 19981991 23 200 3 003 000 Donor meeting 19981992 34 200 9 500 000 Donor meeting 19981993 32 100 7 500 000 Donor meeting 19981994 53 200 11 800 000 Donor meeting 19981995 130 500 30 700 000 Donor meeting 19981996 313 000 - Department of Custom and Electrical Enterprise of Lao1997 68 000 - Department of Custom and Electrical Enterprise of Lao1998 77 000 - Department of Custom and Electrical Enterprise of Lao1999 17 000 - Department of Custom and Electrical Enterprise of Lao2000 156 783 13 033 572 Department of Custom and Electrical Enterprise of Lao
Table 7. Quantity and value of non-coniferous sawnwood exports, 1990-1999Year Volume (m3) Value (US$) Data source1990 100 000 17 028 000 Donor meeting 19981991 286 000 32 796 000 Donor meeting 19981992 121 000 81 300 Donor meeting 19981993 128 000 31 100 000 Donor meeting 19981994 159 000 30 000 000 Donor meeting 19981995 166 000 31 200 000 Donor meeting 19981996 102 000 - Basic statistics of the Lao PDR1997 173 000 - Basic statistics of the Lao PDR1998 69 000 - Basic statistics of the Lao PDR1999 1 346 000 - Basic statistics of the Lao PDR
Table 8. Quantity and value of plywood exports (non-coniferous and coniferous), 1990-2000Year Quantity
(millions sheets)Value
(millions US$)Data source
1990 1 004 247 Donor meeting 19981991 553 175 Donor meeting 19981992 198 81.3 Donor meeting 19981993 185 92.8 Donor meeting 19981994 5 104 1 483 Donor meeting 19981995 1 434 - Department of Custom and Electrical Enterprise of Lao1996 1 461 3 344 Department of Custom and Electrical Enterprise of Lao1997 1 125 - Department of Custom and Electrical Enterprise of Lao1998 39 - Department of Custom and Electrical Enterprise of Lao1999 341 - Department of Custom and Electrical Enterprise of Lao2000 729 1 933 Department of Forestry (6/7/2000)
Table 9. Quantity of parquet flooring (non-coniferous) exports, 1990-2001Year Quantity (m2) Data source1990 417 000 Department of Custom and Electrical Enterprise of Lao1991 -1992 -1993 -1994 -1995 220 000 Department of Custom and Electrical Enterprise of Lao1996 -1997 -1998 3 816 650 Department of Custom and Electrical Enterprise of Lao1999 283 155 Department of Custom and Electrical Enterprise of Lao2000 167 254 Department of Custom and Electrical Enterprise of Lao2001 196 278 Department of Custom and Electrical Enterprise of Lao

193
The Chai Seng Wood Products Company in Vientiane Province exports many finished woodproducts, items include photo and picture frames, tea light holders, stands, trays, vases, boxes,mouldings and shelves. The company began producing photo frames for export in 1995.Quantities of timber consumed by the company and the export value of finished products andphoto frames from the company are summarised in Table 10.
Table 10. Timber consumption and exports value, 1995-2001Year Consumption (m3) Value (US$)1995 251 113 2801996 524 202 9471997 440 181 7931998 693 253 8661999 883 386 7522000 987 380 2352001 803 350 620Total 4 591 1 769 494
Source: Chai Sang Wood Products Company Vientiane MunicipalityWEAKNESSES AND CONSTRAINTS IN CURRENT STATISTICAL SYSTEM
The current statistical system suffers due to delays in submission of statistical reports by theProvinces to the Department of Forestry. The Department of Forestry is approached by differentorganisations requesting data for particular purposes, however, there is often insufficientinformation to provide for their needs.
Dissemination of information to related agencies is time consuming due to the need forpreparation of reports from the information sent by each province, which may take two weeks.
RECOMMENDATIONS TO IMPROVE THE FOREST PRODUCTS STATISTICAL
SYSTEM
Forest products statistics collected under the present organisational structure in the Department ofForestry are much appreciated. The working methods have promoted responsibility, transparencyand sustainability. With respect to the future, the development of statistical systems and datacollection methods for forest products in Laos is of key importance. To improve the nationalforest products statistical system the following changes are recommended:
� An information system should be established.� The forest products statistical system should be harmonised across all provinces with
collected data forwarded to the Department of Forestry Planning Division for summary.� Staff working in the Department of Forestry or involved in the forestry sector should be
trained to strengthen skills and knowledge necessary for implementing an efficientstatistical system.
� The provincial offices should have standardised record keeping methods.� The central staff involved in statistical work should be appropriately equipped (e.g.
computers and software) to facilitate summary of forest products data from the provinces.� A forest industries council should be established for data collection from private sector
enterprises.� Support in the form of a technical assistance programme should be given to forest
products industries.� National wood consumption data should be made widely available.

194
REFERENCES
Annual Reports of the Department of ForestryBasic statistics of the Lao PDR, 1995-2000.Lao-Thai border checkpoint official communication, 16 December 2001.Lao-Thai border checkpoint official communication, 12 February 2001.Lao-Vietnam border checkpoint official communication, 17 December 2001.Official communication with head of provincial forestry office, Savannakhet, 15 December 2001.Official communication with head of provincial forestry office, Champasack, 11 February 2001.Official communication with head of provincial forestry office, Sayabuly, 16 February 2002.Kenthao border checkpoint official communication, 18 February 2002.Report on 4th Donor meeting, 1998, Lao PDR.World Bank (1998) Technical note IDA Supervision Mission.

195
National forest products statistics, Malaysia
INTRODUCTION
Malaysia is located in South East Asia and comprises Sabah, and Sarawak, on the island ofKalimantan (Borneo), and Peninsular Malaysia. Malaysia has a total land area of 330 242 km2
(33 million ha), and is one of the few remaining heavily forested tropical countries with20.06 million ha of natural forest (61 percent of total land area). Dipterocarp forest constitutes thebulk of Malaysia’s forest areas (89 percent), followed by peat swamp forest (7 percent), mangroveforest (3 percent), and planted forest (1 percent). Of the total forest area 5.97 million ha are inPeninsular Malaysia, 4.25 million in Sabah, and 9.84 million in Sarawak (Table 1).
Table 1. Malaysian forest cover by region (2001)Area (millions ha)
Region Land area Naturalforest
Plantationforest
Total forestarea
Forest area as %of land area
Peninsular Malaysia 13.16 5.90 0.07 5.97 45.4Sabah 7.40 4.10 0.15 4.25 57.4Sarawak 12.44 9.81 0.03 9.84 79.1Malaysia 33.00 19.81 0.25 20.06 60.8
In addition to natural and plantation forest, Malaysia has another 5.27 million ha of agriculturaltree crops, mainly rubber, oil palm, and cocoa. These tree crops, particularly rubber trees, are ofincreasing importance as alternative sources of raw material and vegetation cover. If these areasare taken into account, forest cover in Malaysia is 25.33 million ha or 77 percent of total land area.
Timber is the primary forest product in Malaysia although NTFPs such as rattan, bamboo,firewood, charcoal, damar, palm, wood-oil, gums/resins and medicinal plants are also harvested.Secondary products from the forest industries include sawn timber, plywood, veneer,particleboard, blockboard, fibreboard and medium density fibreboard, mouldings and furniture.
Between 1996 and 2000, Malaysia’s annual sawlog production averaged around 26 million m3, adecline of 32 percent from the 1991-1995 figure of around 38 million m3. This decrease wasconsistent with the Government’s conservation policy and commitment to the ITTO Year 2000objective of sustainable forest management. In 2000, of the country’s total sawlog production of23 million m3, Peninsular Malaysia contributed 22 percent, Sabah 16 percent, and Sarawak 62percent. Sawlog production figures for 1996-2000 are shown in Table 2.
Table 2. Annual production of sawlogs (1996-2000)Production (‘000 m3)
Region 1996 1997 1998 1999 2000Peninsular Malaysia 8 418 7 379 5 100 5 356 5 072Sabah 5 638 6 959 5 265 3 436 3 728Sarawak 15 904 16 599 11 119 12 895 14 030Malaysia 29 961 30 938 21 484 21 687 22 830
Source: Forestry Departments of Peninsular Malaysia, Sabah and Sarawak.
Malaysia is the world’s largest exporter of tropical hardwood logs and sawn timber and is also amajor exporter of tropical plywood, veneer and mouldings. Malaysia’s export of timber andtimber products has been increasing steadily over the last decade, from US$3.57 billion in 1990 toUS$4.65 billion in 2000. In terms of export volume and product range, there has been a shift fromthe traditional dominance of logs, sawn timber and plywood to a more varied mix includingmouldings, furniture and wood-based panels. In 1990, logs contributed about 46 percent of totaltimber sector export earnings; by 2000 the figure had reduced to 14 percent. Table 3 showsMalaysia’s export of timber and timber products from 1996-2000.

196
Table 3. Export value of timber and timber products (1996-2000)Value (US$ millions)
Products 1996 1997 1998 1999 2000Logs 597 620 495 706 663Sawn timber 802 722 673 742 807Plywood 1 158 1 139 934 1 066 1 011Veneer 166 191 159 236 212Mouldings 177 206 196 217 236Dressed Timber 34 45 47 51 58Woodchips 2 3 3 7 6Chipboard/particleboard 13 16 31 44 42Fibreboard 72 111 156 195 217Wooden frames n.a n.a n.a n.a 24Builders carpentry & joinery 106 132 174 188 202Wooden furniture 550 666 854 1 026 1 162Rattan furniture 21 22 23 16 18Total 3 699 3 874 3 745 4 494 4 658
Source: Malaysian Timber Industry Board, Department of Statistics, Sarawak, and Statistics DepartmentMalaysiaORGANISATION OF FORESTRY SECTOR STATISTICS
In Malaysia, forestry statistics are collected, analysed and disseminated by the ForestryDepartments of Peninsular Malaysia, Sabah and Sarawak, the Malaysian Timber Industry Board(MTIB), the Sarawak Timber Industry Board (STIDC), the Department of Statistics Malaysia andthe Ministry of Primary Industries Malaysia. Unlike the Statistics Department Malaysia, whichoperates under the provisions of the Statistics Act 1965 (Revised-1989), the forestry departmentsdo not have powers or Acts of Parliament to compel submission of statistics from relevantestablishments.
Forestry statistics are monitored indirectly through licensing procedures, revenue records andconditions that oblige licensees of logging areas and mills to keep records and submit reports tothe Forestry Department on a monthly or yearly basis. In practice, this procedure is verycumbersome, wastes time and requires some form of coercion to obtain results.
The collection, processing, storage and reporting of forestry statistics constitutes an important partof the administrative functions of Malaysia’s Forestry Departments. In the Federal ForestryDepartment Peninsular Malaysia, for instance, the Forest Economics Unit is responsible for thecompilation and publication of statistics from the various states. However, as information andreporting requirements of individual departments of the Forest Service to the various levels ofpolicy and decision makers are substantial, other sections in the Federal Forestry Department arealso involved in data collection23 based on their respective specialised needs.
Data and information flows from the field (Districts and States) to Forestry Department Head-quarters is based on the ‘Shuttle Returns’ system, which had been established for many years. The‘Shuttle Returns’ system is well developed and formalised. It is periodically reviewed to improvetimeliness, accuracy of reporting and scope of coverage. Statistics, which cannot be monitoredthrough shuttle returns, are collected by special surveys, either by mail or direct interviews. Incertain cases, telephone interviews are used and more recently e-mail has been utilised.
For the following reasons the State Forestry Departments and the District Forest Offices are vitallinks in the statistics collection chain:
� the State Forest Departments license and regulate forest-based activities and industries inthe states;
23 Departments include the Forest Management Unit, the Silviculture Unit, the Forest Plantation Unit, thePlanning Unit, the Forest Engineering Unit, and the Industrial Development and Utilisation Unit

197
� the State and District offices keep files and records of all kinds of information and areoften sufficient to satisfy the users’ needs;
� the State and District offices have the manpower and facilities to carry out surveys.DATA TYPES, SOURCES AND METHODS
ForestlandsForestland in Malaysia is owned by the individual states and can be divided into threeadministrative groups: (i) Forest Reserves, (ii) State land Forests, (iii) National Parks and WildlifeReserves. Rubber plantations may be considered as a fourth group, although generally they arerecorded under agricultural land.Forest ReservesForest Reserves are administered and controlled by the State Forest Departments. Each state’sRuler in Council has the power, by notification in the Gazette, to constitute any land a reservedforest or to decide that any reserved forest, or any portion thereof, shall cease to be reserved.Forest reserve area changes are recorded in the registers of reserves at the District Forest Offices,which are generally kept up-to-date. Each reserve register contains information on gazettenumber, date of gazetting, a photocopy of the page in the Gazette declaring the constitution orexcision, the location and a map or area estimates from the State Survey Department.State Land ForestsState land forests are administered and controlled by the State Land Departments althoughlogging is controlled by the State Forestry Departments and areas are measured by the StateSurvey Departments. Each State Administrative District keeps a register of state land forest areas,on both an alienated and non-alienated basis24. However, the alienation of state forestland isexecuted by specific government agencies involved in land development.National Parks and Wildlife ReservesNational parks and wildlife reserves are administered and controlled by the Federal GameDepartment. Information on these reserves and their areas are compiled by each State ForestDepartment and published in the Annual Report.
Rubber plantations are almost totally under private ownership although the State SurveyDepartments have surveyed the areas. Replacement of rubber by other crops such as oil palm arefollowed by the Department of Statistics, Malaysia.
Included in forest land data collection efforts are the various forest types and land use categories,the latter being derived from a combination of forest and land characteristics, resource capabilitiesand developmental needs. The classification of land for forestry in respect of Permanent ReservedForest, as required under the 1984 National Forestry Act, is based on functional uses of forestland as follows:
� Timber production forest under sustained yield;� Soil protection forest;� Soil reclamation forest;� Flood control forest;� Water catchment forest;� Forest sanctuary for wildlife;� Virgin jungle reserved forest;� Amenity forest;� Education forest;� Research forest; and� Forest for federal purposes.
24
Alienated land refers to Malay Reserve land and/or aboriginal land. Non-alienated land can be land heldunder temporary occupation license or mining land etc.
198
Forest resources Forest resource information is derived from data collected during the various forest inventories,such as the National Forest Inventory, Pre-Felling Inventories and Continuous Forest Inventories,carried out by the Forest Department. Information on species composition, log production, growthand mortality rate is derived from data obtained from growth and yield studies, permanent sampleplots and cutting and harvesting regime studies. Observations are based on maps, aerial photos andsample plot measurements.
Silviculture Various types and sequences of silvicultural treatments are applied to harvested or disturbed foreststands both to assist natural regeneration and to improve yields. These prescriptions are based onpost-felling diagnostic sampling results or on the management history and records of the foreststand, supported by field checking.
Annual treatment operations are planned by each State Forest Department and submitted to theSilviculture Unit in the Federal Forestry Department, which monitors and coordinates thereforestation programme and activities. Progress summaries for each silvicultural activity arerecorded on special forms, which document progress and achievements including the type, extentand location of treatment operations, manpower requirements and costs. These forms are collectedfrom the districts, compiled by the State Forest Departments and sent to the Federal ForestryDepartment where they are published in monthly and quarterly progress reports. At the districtand state level, activities are entered in the Annual Felling and Treatment Plans and also therecords for the compartment and reserve concerned.
Forest plantations Forest plantation records are maintained by the District and State Forest Departments involved inplantation establishment. Information on nurseries, date and area planted and costs are collected.In Peninsular Malaysia, the information is compiled and submitted to the Forest Plantation Unit ofthe Federal Forestry Department, which coordinates forest plantation establishment.
Forest allocation and harvesting activity Removal of forest produce is regulated by licences issued by the State Forest Departments.Information recorded in the licence form includes serial number, name and address of holder, dateof issue and expiry, map and boundary description, logging prescriptions, name and location ofchecking station where the produce is to be measured, payment conditions and road standards.
Each District Forest Office enters records of licences issued and cancelled into shuttle returnforms, which are sent at quarterly intervals to the Federal Forestry Department and are compiledand published in the Department’s various publications. Each District Forest Officer also keeps aregister of forest offences and license breaches, detailing the offence and the manner in which itwas dealt with. Monthly returns on forest offences are forwarded from the State ForestryDepartments to Headquarters. As licensees are obliged to obtain a sub-licence for each workerbefore they enter the forest, these records also form the basic source of employment statistics inthe logging sector.
Records of completed logging activities and other related information such as out-turn per acre andspecies removed are entered into Reserve Records and the Annual Felling and Treatment Plans.
Forest products and their units of measurementLogs are measured in metric units under bark at the small end. Volume deductions, for logs withhollow heart or centre rot, are only allowed when the diameter of the defect is 15 cm or more atthe measured end. Log volumes are derived from log measurements using volume tables preparedby the Forest Department. In general, logs of 24-40 cm and above are accepted for sawmilling/veneering; the preferred length is 1.5 m and above.
All production is licensed and logs entering sawmills and plywood/veneer mills are hammermarked and given a serial number to indicate that they have been scaled and checked at achecking station.
Production of non-timber products such as rattan, bamboo, fuelwood, charcoal and other minorforest produce are reported only in terms of royalties collected.

199
For industrial products such as sawnwood, plywood/veneer and wood mouldings, output isreported in cubic metres. The sawmill, plywood/veneer mills and wood moulding mills arerequired by licence conditions to record log input and production. The Federal ForestryDepartment monitors development of the mills through a monthly shuttle return and periodic spot-checks.
No formal system has yet been devised for collection of data from downstream industries such aschip/fibreboard industries, furniture mills, wood-wool cement panel manufacturers. However,developments of these industries are monitored through periodical surveys, using questionnairesor direct interviews or through trade dialogue between government and the private sector.
Log production As the sources of log production data, District Forest Offices make records of all issued forestproducts harvesting licences in a register of licences. In addition, individual licence files containdata on production, forest charges, renewals and termination of licences amongst other things. Aremoval pass, which carries a record of the type and volume of produce and the royalties andforest development cess/fund payable, is issued for each consignment (truck-load) of forestproducts. One copy of the removal pass is forwarded to the Collector of Forest Revenue in theState Forest Office who oversees revenue collection and compilation of revenues and volumes byspecies, licence, forest district and destination. At monthly intervals each State Forest Officetransmits these statistics to the Federal Forest Department as shuttle returns. The shuttle returnscomprise the following:
� Form 1-Monthly production of logs, poles and minor forest products, and revenuecollected;
� Form 2-Monthly log production by producer (by racial entrepreneur groups);� Form 3-Monthly silviculture cess collection and expenditure; and� Form 6-Monthly log movement and transport of logs to other states.
Non-timber forest productsIn Malaysia, harvested non-timber forest products include rattan, bamboo, firewood,charcoal, damar, palm, wood-oil, gums/resins and medicinal plants. Due to variation inmeasurement units, the small quantities harvested and the low transaction rates, NTFPproduction volumes are not available. Production can only be estimated by examiningroyalties collected by the states.
Table 4. Royalties collected from NTFPs in Peninsular Malaysia (1996-2000)Year Value (‘000s US$)1996 3 6431997 2 6161998 2 3681999 2 5112000 3 082
Forest industry

200
Statistics on wood-based industries such as sawmills, plywood/veneer mills, and moulding millsare collected on a monthly basis by the District Forest Offices. These mills are required, bycondition of their licences, to keep records of the number of removal passes, date of entry into themill, log number, species, volume input into the mills and processing machinery, output ofconverted timber and sales of timber to domestic markets. This information is completed by themills themselves for the monthly shuttle returns and submitted to the respective District ForestOffices. The District Offices then check, verify and endorse the returns before they are despatchedto the Federal Forest Department in shuttle returns as detailed in Table 5. The flow of forestindustry information is shown in Figure 1.
* Moulding mills, Furniture, Wood working & joinery factories, Blockboard mills, Chipboard mills,Moulded particle board mills, Medium density fibreboard mills.
Figure 1. Current flow of forest industry statistics
The Forest Economics Unit in the Forestry Department of Peninsular Malaysia (FDPM) withassistance from the Forest Research Institute Malaysia (FRIM) has developed 3 informationsystems (Table 5) for the collection of forest industry data. The systems are run in MicrosoftAccess on personal computers.
Table 5. Information Systems in the Forest Economics Unit of the FDPMTypes of Information Systems Shuttle No. Year of
ImplementationSawmills Information System (SIS) 4 1998Plywood/Veneer Mills Information System (PLYSIS) 5 1999
PRIMARY WOOD-BASED MILLS
ForestryDepartmentHeadquarters
Departmentof Statistics
LabourDepartment
BranchLabourOffices (29)
State ForestryDepartment (13)
Forest Districts(35)
Forest RangeOffice (120)
Sawmills(667)
Other Mills*(2 989)
Plywood/Veneermills (50)
TimberAssociations
BranchStatistics FieldOffices (13)
TimberInspection AreaOffices (7)
CheckingStationsFD (256)MTIB (97)
M.T.I.B

201
Moulding Mills Information System 8 2000
The three information systems each contain 4 modules as follows:� Report – presents processed information in various prescribed formats� Input and output – data validated during input� Information update – allows users to update information� Data validation – ensures that data are clean and error free
These systems ensure timely reports and efficient use of manpower. As a result, more time can bespent analysing data and further reports can be produced for management purposes.Industry data not covered by the shuttle returns, such as the wood-wool cement plants, timberpreservation plants, pencil factories, wood-chips manufacturers, match factories are monitoredthrough periodic surveys, using questionnaires or direct interviews.
Timber trade data
Statistics related to the timber trade are collected, analysed and disseminated by the Departmentof Statistics Malaysia, the Malaysian Timber Industry Board (MTIB), the Forestry Departmentsof Peninsular Malaysia, Sabah and Sarawak, the Ministry of Primary Industries Malaysia, and theMinistry of International Trade and Industry, Malaysia.
The Department of Statistics Malaysia compiles general external trade statistics of Malaysia basedon import and export declarations (hard/soft copy) given on customs forms provided by the RoyalCustoms and Excise Department and Free Zone Authorities. These are published monthly andannually directly from computer printouts.
In ‘Monthly External Trade Statistics, Malaysia’25, exports of selected forest products such assawlogs, sawn timber, dressed timber, wooden mouldings, veneer sheets, and plain plywood arerecorded by cubic metre, Malaysian Ringgit, average unit value and percentage contribution tototal export/import value. Included in this publication, there is also a table of imports and exportsby commodity group. The table provides figures for fuelwood, wood charcoal, wood chips orparticles, wood waste, wood in the rough or roughly squared, simply worked wood, railwaysleepers, pulp and waste paper, veneer, plywood, particle board, other worked wood notelsewhere specified, paper and paperboard, paper and paperboard cut to size or shape andparticles of paper and paperboard.
Revisions, made from time to time as a result of continuous quality checks, are incorporated incumulative totals in subsequent issues. The WTO Agreement on Valuation is used as the basis ofvaluation for all goods transactions. Commodities in the trade statistics publication are classifiedaccording to the Standard International Trade Classification, Revision 3 (S.I.T.C Rev. 3) of theUnited Nations. Trade data statistics are compiled under the provisions of the Statistics Act, 1965(Revised-1989) that stipulates that the contents of individual returns are confidential. Therefore,only aggregated figures are published.
The Malaysian Timber Industry Board (MTIB) also collects, analyses and disseminates statisticsrelated to timber trade through use of the Computerised Information System (CIS). The CIS holdsall relevant timber industry data and information on legislative processes affecting forest productsexports. The information is used to assist planning, management, administration and revenuecollection activities associated with timber export. The CIS comprised two major sub-systems:
� Integrated MTIB Operations System (IMOS); and� Administration and Finance System
IMOS capture and maintain data relating to registration of companies as exporters, sliers, timberprocessors, jetty operators and grader applicants. The data are entered and maintained by the
25
‘External Trade Statistics, Tables & Summaries, Sabah’, and ‘External Trade Statistics, Tables &Summaries, Sarawak’ are released each year, independently for Sabah, and Sarawak.

202
Registration Unit. IMOS consists of four major modules, while the operations module itselfcomprises three sub-modules (Table 6).
Table 6. Integrated MTIB Operations SystemModule Procedure
(i) Registration Entry, validation and maintenance of data on receipt of applications, approvalsand renewals of registered companies and graders.
(ii) Contract Entry, validation and maintenance of data on receipt of contract from buyerand seller.
Operations
(iii) Licensing &Cess
Entry, validation and maintenance of data on receipt of customs declarationsfrom exporters and exporter’s deposits. Printing of export licences.
Technical Entry and maintenance of technical codes and classifications, and the status ofgraders.
Planning and Development(PND)
Entry and maintenance of data on receipt of custom declarations from TheCustoms Department.
Marketing Entry and maintenance of data on receipt of domestic market prices.
Besides the above, MTIB also gathers information from the FAO Forest Products Yearbook,journals, reports from trade commissions and embassies. From time to time MTIB also, conductssurveys and market research on subjects such as raw rattan pricing, transportation and currencytabulation.
MTIB produces the following timber trade related publications/reports:� MASKAYU is a monthly timber bulletin produced by MTIB. The bulletin gives an update
on the average domestic prices of logs, sawn timber and plywood in Peninsular Malaysia.� Total and cumulative export from Malaysia to all destinations (monthly).� Export summary for graded sawn timber by destinations and species (monthly/yearly).� Exporter and supplier performance (based on volume) by destinations and species (ad-
hoc/yearly).� Volume, value and unit value for timber and timber product export from Peninsular Malaysia
(yearly).� Monthly export performance for all timber products by destination.� Monthly consignee performance report by destination and import value.� Monthly average FOB prices for veneer, plywood and mouldings.� Export of sawn timber summary by species, grade, size and destination.� Trade related statistics e.g. prices, economic data and factors affecting timber trade
(housing and construction development, wood-based industrial development, exchangerates, tariffs, policies and regulations on trade and tariff and non-tariff barriers).

203
Timber export statistics are also collected and compiled by the Forestry Departments ofPeninsular Malaysia, Sabah and Sarawak for internal use to follow business cycles and trends.Annual timber export statistics are analysed and published in the Annual Report and ForestStatistics Time Series Book of Forestry Department Peninsular Malaysia.
Organisation and administrationForest administration and staffing
Data on forest district administration, staff deployment and manpower requirements are compiledand recorded at district, state and federal level. The number and category of staff are currentlyreported in the Forestry Department Annual Report.
Finance and expenditureUnder each five year Malaysia Plan, the Federal Forestry Department through the Forest PlanningUnit collects and compiles information on the progress of implementation of programmes,projects and activities in each state. Included are physical and financial achievements for variousprojects and activities ranging from infrastructural development, forest management anddevelopment activities to community forestry projects and manpower training.USERS OF FOREST PRODUCTS STATISTICS
Forest products statistics are dissemination through statistical bulletins and reports, responses totelephone and mail enquiries and via working paper presentations. In recent years, production andtrade statistics for the Forestry Departments of Peninsular Malaysia, Sabah and Sarawak have alsobeen available on the Internet.
The most regular users of forestry statistics include:� The Economic Planning Unit in the Prime Minister’s Department,� The Central Bank,� The Ministry of Finance,� The Labour Department,� The State Governments,� The Federal Land Development Agency,
and other land development agencies and statutory bodies such as:� The Malaysian Timber Industries Board (MTIB),� The Forest Research Institute Malaysia (FRIM), and� The Malaysian Industries Development Authority.
Commercial banks, various timber related industries, the construction industry, plantation relatedsectors, machinery suppliers, local and foreign investors and many others are also keen users offorestry data and information.
The ministries closely related to the forestry sector, such as the Ministry of Lands and Mines, theMinistry of Primary Industries, Malaysia, and the National Land Council are adequately providedwith statistics for policy formulation and macro level planning through the current system.Outside the forestry sector, the Department of Statistics, Malaysia is one of the major users offorestry statistics and requires statistics mainly to fulfil national accounting needs.
DISSEMINATION OF FORESTRY STATISTICS
The Forest Economics Unit of the Forestry Department Peninsular Malaysia disseminates forestrystatistics through the following publications:
� Forestry Statistics Peninsular Malaysia provides statistics on recent developments inforestry and forest industries. The book is mainly based on statistics gathered by theForestry Department Peninsular Malaysia and covers forest resources, forest licensing andharvesting, forest industries, forest revenues, production, consumption and prices of forestproducts and information on forest charges, employment and trade. Most of the informationis presented in historical series, normally for five years periods and there are a total of

204
83 tables and 5 appendixes. There are also some secondary data and information providedby outside organisations. The publication was originally issued at three yearly intervals, buthas now become an annual publication due to increased demand and popularity.
� Forestry Department Annual Reports, published separately for Peninsular Malaysia,Sabah and Sarawak, contain details of the activities and achievements of the departmentsduring the preceding year including statistical information on forest resources, production,consumption and trade. For Peninsular Malaysia, the report is published annually, in themiddle or towards the end of the following year.
� The Forestry Sector Review Peninsular Malaysia gives a six-monthly and annualreview of the forestry sector performance. Topics covered by the Forestry Sector Revieware the forest economy, forest resources, wood-based industries, exports, imports,employment, and prices.
The Forestry Department Peninsular Malaysia disseminates more widely data by the followingmeans:
� Research reports and working papers presented at meeting and seminars and articlespublished in trade and professional journals also help to disseminate forestry statistics.
� ‘The Malaysian Forester’ a professional journal published by The Forestry Departmentprovides some current statistics.
� Official correspondence and questionnaire responses account for a large volume andwide range of statistical information disseminated through the Forestry Department.Although the service is extended to industry and trade sectors, the main recipients aregovernment agencies, academic and research institutions and international organisationssuch as FAO, ITTO, JICA, ILO, World Bank and various foreign embassies.
� The Forestry Department also contributes data on production, industries and forpublication in the Asia Pacific Forest Industries Directory and Year Book.
Besides the Forestry Department Peninsular Malaysia other sources of forestry statistics include:� The Economy, Industry and Statistics Division of The Sabah Forestry Department
annually publish Production and Export Statistics of Forest Products. Two hundred andeighteen tables provide monthly statistics on mills, employment, equity, wood-basedindustry investment structure as well as production and export of major forest products androyalty rates.
� The Ministry of Primary Industries Malaysia, with the cooperation of the FederalForestry Department and the Forestry Departments of Sabah and Sarawak, publishesstatistical information on forestry in its annual Statistics on Commodities. Once every twoto three years, the Ministry also publishes a Profile on Malaysia’s Primary Commodities,which includes a chapter on forestry.
� The Department of Statistics Malaysia publish forestry macro-economic data such asthose pertaining to production, consumption, employment and trade appear in the followingpublications and bulletins: (i) Monthly Statistical Bulletins for Malaysia, Sabah andSarawak, (ii) Monthly External Trade Statistics Malaysia, (iii) Monthly ManufacturingStatistics Malaysia, (iv) Index of Industrial Production Malaysia, (v) Annual NationalProduct and Expenditure Accounts 1987-2000, and (vi) a chapter on Malaysian forestry inthe Compendium on Environment Statistics (CES) compiled by the Department ofStatistics, Malaysia.
� The Department of Statistics, Malaysia, the Central Bank of Malaysia, the Ministry ofFinance, Malaysia, and the Ministry of Primary Industries, Malaysia also include up-to-datedata and information on the forestry sector in their respective annual economic andcommodity reports.
In general, forestry statistics already reported in official publications cover most requests made tothe forestry department and hence, the overall relevance and quality of statistics is high. Datasources are well defined and records kept at the sources are well maintained, especially with

205
regard to routine data. Problems that arise are related to staff competence and the priority given tothe work, which affects interpretation of questions and data and the eventual timeliness andaccuracy of reporting.
WEAKNESSES AND CONSTRAINTS IN THE FOREST PRODUCTS STATISTICAL
SYSTEM
TimelinessOne of the major problems in the present forest statistical system is timeliness. The problemaffects most forestry sector statistics including log production, intake and output of logs frommills, areas of planned and executed land clearance in state land forests, licences and others. Theslow flow of statistics from districts and states has caused delays in disseminating forest statisticsand has also delayed publication of the Department’s Annual Report and Forest Statistics Report.
DuplicationA second problem is the extent of duplication in forest statistics collection within ForestDepartment Headquarters, State Forest Offices and various other government departments andagencies. For example, the Department of Statistics Malaysia and the MTIB sometimes collect thesame information as Forestry Department Headquarters. Furthermore, different sections inForestry Department Headquarters may request the same information by different means and atdifferent times.
Duplication is also a problem in compilation of trade statistics. The Department of StatisticsMalaysia compiles and processes all raw data on external trade from customs declaration forms.Through formal arrangement, the raw data is supplied to five governmentministries/departments26 on magnetic tape or CD-ROM. Ideally, the Forestry Department and theMalaysian Timber Industry Board would obtain timber trade data direct from The Department ofStatistics Malaysia or even the Ministry of Primary Industries Malaysia. However, considerationsof timeliness, cost, and practicality compel the Forestry Department to obtain timber trade dataelsewhere. Export data is thus acquired from the Malaysian Timber Industry Board and importdata from the Malaysia External Trade Development Corporation (MATRADE), the externaltrade promotion arm of MITI (see Figure 2).
In the case of Sabah and Sarawak, import and export data are prepared by Sabah ForestDepartment, Sarawak Forest Department Headquarters and the Sarawak Timber Association.Thus, data input and other efforts are duplicated and large volumes of paperwork are created withconsiderable margins of error. This also inevitably raises the cost of collecting and processingforest statistics.
CapacityIn principle, the purpose of collecting data is to perform analysis and to thus elucidate thesituation. However, little interrogation and analysis of data seems to be performed, other than forannual statistical bulletins and reports, and a large amount of data seem to be filtered out and leftunutilised. Data storage capacity is also inadequate and low priority is therefore given tosafekeeping of raw data once summary figures have been produced.
26
The Prime Minister’s Department, The Ministry of International Trade and Industry, The Ministry ofPrimary Industries Malaysia, The Ministry of Agriculture and The Central Bank of Malaysia.

206
Figure 2. Flow of timber export statistics
The rapid expansion and development of Malaysia’s forestry sector over the last few decades hasled to a rapid increase in forestry activities and tremendous growth in data collection. Forinstance, in addition to existing statutory and routine requirements, forest management practicesnow have to be evaluated against prescribed sustainable forest management criteria27. Manpowerallocated to data collection is therefore increasingly overstrained in keeping up with the volume ofwork and this has affected the timeliness, accuracy and quality of statistics.
Computer use in information management, geographical information systems and remote sensingapplications in Malaysia has developed rapidly since the 1970s. In the case of PeninsularMalaysia, efforts prior to 1996 to computerise data processing met with limited success. Therewas no single integrated system, but a number of systems and applications operating in isolation.Their use was complex and their relationships poorly structured or non-existent. Different systemsfrequently required identical information and the same data were often entered several times,resulting in inconsistencies and inefficient use of scarce staff time. Consequently, in 1996, theForestry Department Peninsular Malaysia embarked on an ambitious programme entitled ‘TheMapping and GIS Project’ with financial and technical assistance from the EuropeanCommission. The primary objective was to develop and operationalise on-line forestry
27 Such criteria include the Forestry Department’s Malaysian Criteria and Indicators, ITTO’s Criteria andIndicators for Sustainable Forest Management of natural tropical forests and market-driven certificationcriteria.
TimberExporter
RegionalCustomsOffices
Royal Customsand ExciseDepartment(Headquarters)
MalaysianTimber IndustriesBoard (MTIB)
Department ofStatistics
MalaysiaExternal TradeDevelopmentCorporation(MATRADE)
The Central Bank
Ministry of TradeIndustry
Ministry ofAgriculture
Ministry ofPrimary
Prime Minister’sDepartment
ForestryDepartmentPeninsularMalaysia(HQ)

207
applications within each of Peninsular Malaysia’s State Forestry Department. The projectencompassed three systems, a Management Information System (MIS), a Geographic InformationSystem (GIS) and a remote sensing system. The integrated systems would have linked the variousState Forestry Departments and the Forestry Department Headquarters. However, in 1999 The EUterminated the Project and the integrated GIS and MIS Systems remained uncompleted anduninstalled. The Forestry Department is now continuing the project using internal sources offunding and local expertise.
Completing the Joint Forestry Sector QuestionnaireA number of difficulties are encountered in collating data required for the Joint Forestry SectorQuestionnaire. In particular, these relate to obtaining data from the three regions of Malaysia andalso from the various government agencies.
Annually, ITTO sends the questionnaire to Ministry of Primary Industries Malaysia (MPI), themain agency responsible for collecting, coordinating and disseminating forest and forest productsdata in Malaysia. To complete the questionnaire, MPI enlists assistance from departments andagencies under the Ministry of Forestry28. For instance, removal and production data can only beobtained from the Forestry Departments, while trade statistics are from the respective ForestryDepartments, the Department of Statistics and the Malaysian Timber Industry Board, which itselfobtains data from area offices and MATRADE. In addition, miscellaneous text questions mayhave to be referred to forest industries, timber associations or other agencies not in the stipulatedmailing list of MPI.
Even though exact definitions for all terms and classifications are given, problems still arise ininterpretation of items and fields in the questionnaire. For instance, removals and production areoften interpreted as the same thing as are roundwood, sawlogs and veneer logs. It is thereforenecessary to simplify definitions and reduce ambiguity in the terminology used.RECOMMENDATIONS TO IMPROVE THE FOREST PRODUCTS STATISTICAL
SYSTEM
The economic importance of obtaining forest statistics in time should be formally and clearlypresented to the State Land Departments, the State and District Administrative Offices and otherdevelopment agencies. This will facilitate improvement in their statistics and planning processesto meet Forestry Department deadlines.
For the overall development of forestry sector statistics, the Forestry Department Planning Unitshould be established as a centre to co-ordinate the efforts of the Forestry Department Divisionsand other forestry organisations. For this purpose, a forestry sector statistics standing committeeshould be established to assist the Planning Unit in its development. The committee shouldcontain representatives from the Forestry Department, The Statistics Department, The MalaysianTimber Industry Board, land agencies and the private sector.
In each State Forestry Department the responsibility of the continuous development andproduction of statistics should be vested with a particular senior Forest Officer.
In view of the extent and volume of forestry data being collected at all levels in the ForestryDepartment, the use of computers has become necessary. Computerisation offers an efficient andcost effective means of acquiring, storing, updating and retrieving forest statistics in a timely andaccurate manner. Operation of computerised systems requires planning and implementation ofstaff training and routine upgrading of computer peripherals in line with technologicaldevelopments.
Motivation and training of staff at all levels is an absolute necessity. Brief courses on forestrysector statistics should be arranged, with the assistance of The Department of Statistics and theForestry Faculty at the Agricultural University. Courses could be arranged separately for (i)
28 The Forestry Departments of Peninsular Malaysia, Sabah and Sarawak, The Malaysian Timber IndustryBoard, The Forest Research Institute Malaysia, The Malaysian Timber Council, Sarawak TimberAssociation and the Malaysian Timber Certification Council.

208
directors of the Federal and State Forestry Departments, (ii) other academically trained forestofficers, (iii) forest officers at the diploma level, (iv) uniformed staff, and (v) statistical clerks. Acourse in forestry sector statistics should also be included in the curricula of the Forestry Facultyat the Agricultural University, the Forestry College and the Forestry School.CONCLUSIONS
Future forestry statistics requirements will continue to arise from the planning andimplementation levels in the forestry sector. However, at present the state of forestry statistics inMalaysia is, in general, satisfactory. Data sources are well identified and records kept at thesources are well maintained, especially with regard to routine data. Problems, which arise, arerelated to staff competence and the priority given to the work, which affects interpretation ofquestions and data and the eventual timeliness and accuracy of reporting.
In terms of data collection, procedures are adequate and seem to fulfil Forest Service datarequirements. The most encouraging aspects in the present and future development of thestatistical systems in Malaysia’s forestry sector are:
� Malaysia has a well established forest administration (the Forestry Department PeninsularMalaysia celebrated its 100th anniversary in 2001);
� There are very few forest owners (the 13 individual states); and� The forest administration has good control of the wood-based industries and exporters.
The State Forestry Departments licenses and regulates forest-based industries and theMalaysian Timber Industry Board administers, regulates and oversees business conduct inthe timber trade.
The development of forestry sector statistical systems must be a continuous process moving withthe anticipated rapid pace of change in the sector. The traditional system of sustained yield timberproduction in Malaysia has now been replaced by the new paradigm of sustainable multi-resourceforest management. Under such management, the emphasis reflects wider forestry issues, such asthe needs to sustain production of NTFPs, enhance the protective functions of forests andconserve biological diversity. With these broadening approaches to management, datarequirements will similarly expand beyond the present statutory and routine needs. However, theadditional information will enable forest management practices to be more effectively evaluatedagainst sustainable forest management criteria.

209
ReferencesDepartment of Statistics, Malaysia. 1996. Department of Statistics Malaysia in Brief.Department of Statistics, Malaysia. 2001. Monthly External Trade Statistics, December 2001.Department of Statistics, Malaysia. 2001. Monthly Manufacturing Statistics, December 2001.Department of Statistics, Malaysia. 2001. Index of Industrial Production, Malaysia, December
2001.Department of Statistics, Malaysia. 2001. Compendium of Environment Statistics.Forestry Department Peninsular Malaysia. 2000. Annual Report.Forestry Department Peninsular Malaysia. 2000. Forestry Statistics Peninsular Malaysia.Forestry Department Sarawak. 1999. Annual Report.Forestry Department Sabah. 1997. Annual Report.Sabah Forestry Department. 2000. Production and Export Statistics of Forest Products.Dan, Y.M. 1993. Forestry Statistics, Data Sources and Methods of Data Collection and
Verification in Malaysia. Paper presented at the ITTO Workshop on Tropical Forestry andTimber Trade Statistics 1993, Kuala Lumpur, Malaysia.
Dan, Y.M. 1993. Users of Forestry Statistics, Reporting and Dissemination. Paper presented at theITTO Workshop on Tropical Forestry and Timber Trade Statistics 1993, Kuala Lumpur,Malaysia.
Tong, K.H. Timber Trade Statistics, Data Sources and Methods of Data Collection andVerification. Paper presented at the ITTO Workshop on Tropical Forestry and Timber TradeStatistics 1993, Kuala Lumpur, Malaysia.
Yeah, K.L. & Chan, K.K. 1982. Proposal for a Computer System for the Forestry Department ofPeninsular Malaysia. Unpublished.
Razani Ujang, Mohd Hizamri Yasin, Austin, D. & Rashid, A.S. 1994. Computer InformationTechnology, Geographic Information System and Remote Sensing Activities in Malaysia.Paper presented at the Meeting of the Computer Applications of Geographic InformationSystem and Remote Sensing Technical Working Group, ASEAN Institute of ForestManagement, Kuala Lumpur, Malaysia.
Shaharuddin, M.A. 1986. Status of the Information Collection Activities in the ForestryDepartment Peninsular Malaysia. Paper presented at the Workshop on MicrocomputerApplication in Managing Forestry Information, Kuala Lumpur, Malaysia.
Ministry of Primary Industries, Malaysia. 1998. Profile: Malaysia’s Primary Commodities.

210
Appendix 1. AGENCIES INVOLVED IN WOOD-PRODUCTS RELATED DATA
Policy-level government agenciesMinistry of Primary Industries MalaysiaMinistry of Land and Co-operative DevelopmentThe National Forestry Council
Other government departments/statutory bodiesDepartment of Statistics MalaysiaPrime Minister’s DepartmentRoyal Customs and Excise DepartmentLabour Department Peninsular MalaysiaSurvey and Mapping DepartmentMeteorological Services DepartmentFire and Rescue DepartmentAborigines Affairs DepartmentMinistry of Finance MalaysiaMinistry of International Trade and IndustryMinistry of Human ResourcesMinistry Of AgricultureMinistry of EducationMinistry of Science, Technology and EnvironmentMinistry of Culture, Arts and TourismMinistry of WorksCentral Bank of MalaysiaMalaysian Timber Industries BoardForest Research Institute MalaysiaThe various State GovernmentsLand Development AgenciesMalaysian Tourism Promotion BoardMalaysian Industrial Development AuthorityNational Library of MalaysiaParliamentNational Archives of MalaysiaNational Institute of Public Administration
International AgenciesFood and Agriculture Organization of the United Nations (FAO)International Tropical Timber Organisation (ITTO)Japan International Cooperation Agency (JICA)The World BankAsian Development Bank (ADB)Foreign EmbassiesOrganisation of Economic Cooperation and Development (OECD)Deutsche Gesellschaft für Technische Zusammenarbeit (GTZ)
Other agenciesMalaysia Timber CouncilMalaysian Timber Certification CouncilMalaysian Panel-products Manufacturers’ AssociationTimber Trade Federation of Malaysia (Sawmillers)Timber Exporters’ Association of MalaysiaMalaysian Wood Moulding and Joinery CouncilMalaysian Furniture Industry CouncilRubberwood Industry Association of MalaysiaMalaysia Pulp and Paper Manufacturers’ AssociationPersatuan Pengusaha-Pengusaha Kayu-Kayan dan Perabot Bumiputera MalaysiaPersatuan Pembalak Bumi Sabah

211
Sarawak Timber AssociationThe Timber Association of SabahInstitute of Strategic and International StudiesMachineries SuppliersMalaysian Nature SocietyUniversitiesWorld Wide Fund for Nature MalaysiaSchoolsLocal and foreign investors and banksThe PressGeneral Public

212
National forest products statistics, Nepal
INTRODUCTION
Nepal is a relatively small country with an area of 14.72 million hectares, situated between Indiaand China. Administratively, the country is divided into five Development Regions and 75districts. The five Development Regions of the country are Eastern, Central, Western, Mid-Western and Far Western.
Forest and shrub land cover about 39 percent (5.83 million hectares) of the total land area (DFRS,1999). National forests are divided into five categories according to management and ownershipas follows: (i) Government managed forests, (ii) Community forests, (iii) Religious forests, (iv)Leasehold forests and (v) Private forests. Of the 75 districts in total, 24 fall into the lowland Teraiarea of the country where forests are categorised for production. At present, Government’s policyis to increase the forest area under community management whereby user groups are givenresponsibility for managing forest as underlined in the community forestry Operation Plans.
In Nepal, sawnwood is the main product from hardwood species, of which the most important isSal (Shorea robusta). Because of over exploitation of several species, in the past, harvesting oflive trees has been prohibited since 1994/95. The sale of products derived from these species istherefore currently restricted, although the ban has been lifted in the past. Currently, there is atotal ban on log export, especially with respect to Shorea robusta, Michelia and Acacia catechu.
Of the various forest product categories29, existing documents suggest that data for only four areavailable, i.e. roundwood, fuelwood, sawnwood and wooden poles. Information on these productsis collected on a regular basis by the institutions detailed below. Fuelwood is measured by stackvolume or chatta30 whereas roundwood and sawnwood are measured in cubic feet. Data on woodchips, wood residues and other minor items are difficult to obtain as these items are consideredsawmill waste.
INSTITUTIONS INVOLVED IN COLLECTION, ANALYSIS AND DISSEMINATION OF
FOREST PRODUCTS DATA
Currently, there are three institutions involved in producing forest products. The same threeinstitutions are also largely responsible for collecting forest products data, they are:
• The Department of Forests (DoF), which has the main responsibility for meetingnational demand for forest products such as roundwood, fuelwood, householdconstruction timber and small timber for agriculture implements.
• The Timber Corporation of Nepal (TCN), which acquires roundwood from theDepartment of Forests and produces sawn timber.
• The Forest Products Development Board (FPDB), which sells roundwood,fuelwood and poles harvested from its own plantations.
In addition to these, Community Forest User Groups and private tree growers also produce forestproducts such as roundwood, fuelwood and small timber for household use. However, DoF hasonly recently begun compiling forest products production figures for community forests and doesnot collect data directly from private forests.
29 Such as roundwood, fuelwood, wood charcoal, wooden poles, sawnwood, wood-based panels, plywood,fibre board, wood chips, particles and residues, pulp and recovered paper, paper and paperboard.30 A chatta is the equivalent of a stacked wood of dimensions 5 ft x, 5 ft x 20 ft; the metric volume is14.16 m3 inclusive of voids.

213
The information provided by the implementing institutions is thought to be reliable given thatfixed royalties have to be paid to the national treasury before forest products are sold and theconcerned revenue department monitors annual audits of production and sale. Thus figures aredouble-checked and are hence reliable.
Owing to the nature of the institutions involved, variability exists in the way data are presented.Therefore, the review of existing forest products statistics in the following sections treats eachinstitution separately. Although, it may appear that three sets of data are collected for each forestproduct category, data collected by DoF and TCN are equivalent as TCN receives all forestproducts from the DFOs. However, forest products obtained by FPDB are separate.
All institutions involved in collection, analysis and dissemination of wood products related dataare listed in Table 1. Most do not themselves collect forest product data from the field but gatherit from published reports, journals and other sources.
Table 1. Institutions involved in collection, analysis and dissemination of wood products-related dataInstitution Type of OrganisationMinistry of Forests and Soil Conservation GovernmentMinistry of Finance GovernmentMinistry of Local Development GovernmentNational Planning Commission GovernmentDepartment of Forests GovernmentDepartment of Forest Research and Survey GovernmentCentral Bureau of Statistics GovernmentForest Products Development Board Semi-autonomousDistrict Forest Products Supply Committee GovernmentDistrict Development Committee GovernmentFederation of Nepal Chamber of Commerce and Industries NGOTimber Corporation of Nepal Semi-autonomousForest Products Business Bureau CompanyFederation of Community Forests in Nepal NGOCommunity Forest Users Committee NGONepal Foresters Association NGOTrade Promotion Centre Semi-autonomous
Details of the activities of the three main institutions involved collection of forest products dataare given in the following sections.
Department of ForestsThe Department of Forests is responsible for the protection, sustainable development andpromotion of all national forests. It has District Forest Offices (DFO) in all national districtsexcept Mustang in the Himalayas. One of the principal objectives of the department is to fulfilnational wood and fuelwood demands through its district offices. As felling of green trees isprohibited, the department currently obtains logs from dead, fallen or uprooted trees. In addition,District Forest Offices harvest forest products when trees are removed during development work.
As forest products supply is mainly directed towards fulfilling national demands for roundwood,sawnwood and fuelwood. District Forest Offices follow a standard method of distribution. Thisinvolves allocating forest products to the district level Forest Products Supply Committee to firstsatisfy district demands. Of the remaining stock, each District Forest Office sells 50 percent andprovides the remaining 50 percent to the Timber Corporation of Nepal for sale in the open market(Figure 1).

214
Figure 1. Forest products distribution scheme
Data collectedInformation on roundwood and fuelwood production, collected by the Department of Forests, isavailable annually. With respect to other forest products, data are limited for a number of reasons:
• The production of charcoal is prohibited by law in Nepal and there is, therefore nofigure for this item.
• Forest products have not, to date, been utilised as industrial raw materials andtherefore there are no figures for wood pulp, other pulp, paper or paperboard.
• A small number of industries produce wood chips, wood residues, sawnwood,wood-based panels, plywood and fibreboard but volumes are small (<1000 m3)and published data are not available.
• Trade data is only available from the Department of Customs, Ministry of Financeat present31.
In the following tables, national and regional figures for roundwood and fuelwood production andstock are presented. Data inconsistencies are probably due to the present system of book keeping.For example, differences in roundwood production and stock figures for 1999/2000 (32 176 m3
and 88 913 m3, respectively) may result from accumulation of stock over the previous years. Thesame situation applies for fuelwood.Roundwood production, sales and stockRegional and National roundwood production, sales and stock are shown Tables 2 to 4.
31 Product codes are based on the Harmonised System of the World Customs Organisation.
Total forest productsharvested by District
Forest Office
District ForestProducts Supply
Committee
Left-over forest products
TCN for openmarket sales
District forestoffice sales
50% 50%

215
Table 2. Regional and national roundwood production, 1994-2000Roundwood production (m3)
Year EDR CDR WDR MWDR FWDR National total1994/95 1 202.18 1 686.77 3 562.92 1 078.30 10 370.80 17 900.971995/96 18 87.72 1 427.47 660.52 1 666.75 3 504.18 9 146.641996/97 8 372.38 3 767.31 508.10 2 930.26 1 335.57 16 913.621997/98 6 325.61 6 149.20 810.84 621.95 1 975.28 15 882.881998/99 5 299.09 11 960.66 4 932.14 1 037.78 6 616.77 29 846.441999/00 10 309.83 11 055.00 4 456.81 1 759.05 4 595.75 32 176.442000/01 17 686.45 32 178.76 4 487.46 4 156.24 8 104.94 66 613.85
Table 3. Regional and national roundwood sales, 2000/2001Roundwood sales (m3)
Year EDR CDR WDR MWDR FWDR National total2000/01 21 324.94 35 548.82 4 807.15 3 607.34 8 809.89 74 098.14
Table 4. Regional and national roundwood stock, 1996-2000Roundwood stock (m3)
Year EDR CDR WDR MWDR FWDR National total1996/97 16 603.57 6 668.09 751.72 1 481.59 2 167.32 27 672.291997/98 12 717.90 7 539.76 973.22 1 443.90 18 773.85 41 448.631998/99 11 387.51 8 942.23 1 606.29 1 352.73 179 667.94 202 956.701999/00 17 108.61 4 825.27 49 275.40 1 170.57 2 231.95 74 611.802000/01 20 795.29 18 041.57 4 254.07 7 847.91 30 914.14 81 852.98
1-This figure was revised to 5 0064.68 upon second assessment, 24553.12 m3 having been lost to decay.Fuelwood production, sales and stockFuelwood has traditionally been the main source of energy for domestic and industrialapplications in Nepal. Currently, annual fuelwood consumption is over 13 million tons (WECS,1998). It was estimated that total energy consumption in 1995/96 was 292 million GJ of whichwood fuel contributed over 80 percent. In Nepal, head loads of fuelwood from Governmentforests are free and fuelwood is also extracted for community forests as per the operation plans;no records are kept for either. Additionally, many private tree growers sell fuelwood to smallindustries and the public. Therefore, recorded fuelwood collection is very small compared tofigures that have been reported in other publications.
According to actual production and sale figures from depots located mainly in accessible parts ofthe Terai districts, the highest levels of fuelwood consumption during 1995/96 were in the CentralDevelopment Region (36 percent of national total), followed by the Western Development Region(20 percent), the Mid Western and Eastern Development Regions (16 percent each) and the Far-Western Development region (12 percent). The fuelwood production and stock figures providedby the Department of Forests do not tally with these percentages and as such DoF figures appearto be nominal.
Table 5. Regional and national fuelwood production, 1994-2000Fuelwood production (m3)
Year EDR CDR WDR MWDR FWDR National total1994/95 343.38 3 220.69 10 297.86 531.28 1 226.26 15 619.471995/96 444.34 2 756.95 2 109.84 1 083.24 6 052.69 12 447.061996/97 1 712.23 4 761.30 106.77 1 731.06 1 132.80 9 444.151997/98 2 194.80 5 168.40 562.86 77.88 233.64 8 237.581998/99 346.92 8 357.94 7 133.10 1 157.58 2 626.68 19 622.221999/00 11 359.86 6 998.58 3 663.33 1 281.48 1 558.31 24 861.562000/01 6 191.46 51 390.18 5 642.76 6 086.39 10 871.76 80 182.56

216
Table 6. Regional and national fuelwood sales, 1994-2000Fuelwood Sales (m3)
Year EDR CDR WDR MWDR FWDR National Total2000/01 3 590.27 45 160.10 4 400.22 3 132.62 6 989.80 63 929.00
As a result of the more recent instigation of regional level data collection, regional fuelwood stockfigures have only been available since the 1996/97 fiscal year whereas national figures from theDistrict Forest Office, have been available since the 1995/96 fiscal year as shown in Table 7.
Table 7. Regional and national fuelwood stock, 1995-2000Fuelwood stock (m3)
Year EDR CDR WDR MWDR FWDR National Total1995/96 - - - - - 5 292.591996/97 2 172.71 3 461.55 261.39 1 497.42 84.96 7 478.041997/98 1 189.44 5 061.21 113.28 41 858.23 142.17 48 364.331998/99 8 134.92 2 411.31 1 295.64 598.26 2 731.32 15 171.451999/00 2 562.96 2 528.13 1 257.97 792.96 - 7 142.021999/00 2 892.89 8 525.74 2 856.78 3 206.96 4 201.98 21 684.342000/01 5 494.04 14 099.89 4 099.32 6 160.73 8 083.66 37 937.61
Source: Annual Reports, Department of Forests, 1996, 1997, 1998Data collected by District Forest Products Supply Committee and Timber Corporation of NepalTable 8 and Table 9 show production and stock of roundwood and fuelwood from the DistrictForest Products Supply Committee (DFPSC) and Timber Corporation of Nepal (TCN); regionaldata are not available from these institutions. As stated above, District Forest Offices providetimber to the TCN and therefore TCN roundwood figures should match District Forest Officefigures. However, as a result of log decay in TCN log yards, this is not always the case.
In some cases, stock figures may be higher than production figures for the two agencies. This isbecause of accumulation of stock from the previous year/s. Moreover, production and sale ofthese products are irregular and fluctuate with availability.
Table 8. DFPSC and TCN Roundwood production and stock figuresDistrict Forest Products Supply Committee Timber Corporation NepalYearProduction (m3) Stock (m3) Production (m3) Stock (m3)
1994/95 6477.88 - 24202.81 -1995/96 8176.30 7111.18 36948.45 45772.451996/97 7820.09 4419.46 24985.19 46179.471997/98 2466.48 12817.03 21037.47 61779.701998/99 - 11431.08 2082.72 -1999/00 - 11100.06 4151.63 27417.142000/01 5726.03 - 16345.58 20467.03
Table 9. DFPSC and TCN Fuelwood production and stock figuresDistrict Forest Products Supply Committee Timber Corporation Nepal
Year Production (m3) Stock (m3) Production (m3) Stock (m3)1994/95 20121.36 17301.54 -1995/96 31389.18 2730.19 50541.29 51605.411996/97 26740.45 9093.55 14537.22 -1997/98 26493.36 2310.77 6073.22 35244.241998/99 - - - -1999/00 - 21684.06 - 6552.262000/01 - 2106.02 - 8580.68
Source: Bi-Annual Report, Department of Forests, 1996. Annual Reports, Department ofForests, 1996, 1997, 1998; The Timber Corporation of Nepal, 2001.Data collection methodologiesRoundwood and fuelwood productions figures are collected through direct field measurements. Amanual recently published by the Ministry of Forests and Soil Conservation (MFSC, 2000)contains methodologies for collection, harvesting, measurement, sale and distribution of forest

217
products. The key features of the harvest methodologies are as follows.
Harvest area assessment. Initially, the District Forest Officer (DFO) marks plots from whichtrees are to be removed. During plot marking consideration is paid to soil and water conservationand bio-diversity. DFO and the harvesting representative check the area for skid trails, landingand log yard locations. The information is marked on a map that is jointly submitted to theDistrict Forest Office.
Marking procedure. All trees to be removed are marked and placed into one of three classesaccording to the roundwood and fuelwood volume, which are evaluated using local volume tables.This procedure has to be done by a Range Officer with the concerned officer verifying figures.Each tree is marked with a hammer at 15 cm and 1.35 m above ground, and numbered with paint.The marks should be 15 cm x 15 cm in size and in opposite directions. All trees marked should berecorded in a prescribed tabular format. DFO should examine at least 10 percent and the RegionalDirector at least 5 percent of the marked trees.
Sectioning procedure. A standing rule in the MFSC manual states that trees should be sectionedfor logs as appropriately as possible. However, market demand and tree form also play a crucialrole in log sectioning. There are also standing rules for defining roundwood and fuelwood. Logshaving less than the size prescribed for roundwood (45.6 cm girth and 61 cm length) arecategorised as fuelwood. Large logs not fit for sawing due to defects are categorised as fuelwoodas are lops and tops and other tree sections not normally used for lumber. The manual directs thatpoles and logs suitable for roundwood should not be converted into fuelwood.
Volume computation. Log volumes are computed on the basis of the quarter girth formula withdeductions made for voids and decayed wood. A sawlog register book is maintained, whichrecords information such as marking number, log number, species, and length of log, grossvolume, cull volume and net volume. The volume of logs and fuelwood should also be recordedin a standard format provided by the MFSC (2000).
Data compilation, validation and dissemination methodologiesTraditionally, the District Forest Offices compile all district level production and sale dataaccording to a series of formats. In the case of harvested trees and logs brought to the dumpingyard, formats should be completed at fifteen-day intervals. As there are regular checks on thenumber and volume of logs arriving at the dumping yard and figures are regularly updated, thereis no confusion over data validation.
The data compiled for Districts and Development Regions on production, sale, stock and revenuecollected, etc are disseminated annually by the Department of Forests in Annual Reports. As yetthere is no system for regular dissemination of information to the public and press, although somedata are released at press conferences. Individuals and press members interested in forestryinformation therefore acquire data either from the annual report or through official contact. TheDepartment of Forests also provides data to the Nepali Central Bureau of Statistics and toInternational Agencies such as FAO.
The Timber Corporation of NepalThe Timber Corporation of Nepal (TCN) is a semi-autonomous body under the Ministry ofForests and Soil Conservation. It was established during 1960s with the objective of collectingand selling forest products in the 33 Terai Districts of the country and has branches in most ofthese districts. The institution has a government mandate to meet the forest products demands ofthe urban population and sells sawnwood and fuelwood as appropriate. TCN receives roundwoodfrom the respective District Forest Offices and sells it as either roundwood or sawnwood, whichTCN produces itself. TCN is currently suffering from internal problems and is not receiving asmuch roundwood from districts forest offices as before. The volumes produced and sold by TCNare therefore lower than in previous years.
Data collectedInformation on production of roundwood, sawnwood and fuelwood are only available from TCNat the national level. Information provided on the production and sale of roundwood, sawnwood

218
and fuelwood over the past six years are presented in Table 10.
Table 10. Production and sale of roundwood, sawnwood and fuelwoodRoundwood Sawnwood Fuelwood
Year Production Sale Production Sale Production Sale1995/96 30 841.57 34 561.26 879.24 1 274.68 35 109.72 27 527.041996/97 21 985.44 24 985.19 2 823.82 3 214.19 25 449.06 26 740.451997/98 33 438.66 16 739.73 3 101.27 2 688.36 33 368.04 25 716.261998/99 2 082.72 21 006.03 1 697.00 1 969.39 309.82 22 267.451999/00 4 151.63 13 218.35 570.72 841.77 948.72 1 360.922000/01 8 509.23 15 586.94 239.54 585.05 3 554.16 1 150.64
Source: The Timber Corporation of Nepal Ltd. Head Office, Kathmandu, November 2001.In most cases, roundwood, sawnwood and fuelwood sale figures are below those for production.This results from the roundwood and sawnwood productions volumes being accumulated fromprevious years. The figures provided by DoF and TCN headquarters do not match.
Data collection methodologiesThe District Forest Offices supply roundwood to TCN on the basis of field measurements. TCNfollows a standard data collection procedure identical to that of the DoF. All logs are measuredunder bark and volumes are calculated following local volume tables. Because of the pricedifferences between species, logs are graded, as far as is practical, according to species andmerchantable size. Of the construction timbers Sal (Shorea robusta) fetches the highest pricesfollowed by Terminalia, Adina cordifolia and other species. The Range Officer responsiblecounter signs the log production sheet, hands the logs over to the TCN representative and sends acopy of the log production sheet to the District Forest Officer.
Methods of data compilation, validation and disseminationForest products data are compiled both at district and national level for a given fiscal year. If needbe these data are inspected by the supervisors and validated where necessary. Although data arecollected and compiled species wise, they are grouped for presentation purposes as in Table 10.On a national level, it is difficult to analyse the share of major and minor timber species. Districtlevel data are, however, normally available on request from the respective districts but are notdisseminated either in the form of leaflets or annual reports.
Forest products development boardThe Forest Products Development Board (FPDB) is a semi-autonomous body established in the1975. FPDB has established plantations by clearing degraded Sal (Shorea robusta) forest andother forest types and replacing them with fast growing species such as Eucalyptus, Tectonagrandis and Dalbergia sissoo. Forest products include roundwood, fuelwood, poles fortransmission lines, wood residue (locally known as koro) and raw materials for the particle boardindustry. Production and sale of forest products by FPDB for the last four year are shown in Table 11.
Table 11. FPDB production of roundwood, fuelwood, poles and wood residuesProduction (m3)Year
Roundwood Fuelwood Poles Wood residues1997-98 42.48 19 370.88 3 520.67 31.351998-99 8.61 20 532.00 1 695.27 143.561999-00 33.70 24 879.12 2 056.84 295.642000-01 175.90 43 202.16 3 403.29 319.00
Source: Forest Product Development Board Head Office, Kathmandu, November 2001Data collection methodologiesProduction data is collected through direct field measurements. Prior to felling, trees are markedand their volumes are estimated using local volume tables. For roundwood and poles, log volumeis calculated by the quarter girth formula. The local officer is responsible for keeping andupdating production and sale records. Since FPDB does not fall under the jurisdiction of the

219
Department of Forests, the data produced by FPDB are not available from District Forest Offices.
Methods of data compilation, validation and disseminationInitially, production and sale data are collected for a given site and compiled later on for thewhole project area. As almost all FPDB forest products are from Eucalyptus plantations, it isnormally assumed that all FPDB products are Eucalyptus. All harvest, production and sales dataare immediately compiled and documented in the project office and are inspected by supervisorsand validated where necessary. Progress reports are sent to Central Office at monthly, quarterlyand yearly intervals and compiled data are reported in standard format to the Ministry of Forestsand Soil Conservation. All these data are available to the concerned institutions upon request,however they are not otherwise disseminated.
CURRENT AND POTENTIAL USERS OF FOREST PRODUCTS STATISTICS
Currently, export of roundwood, sawnwood, fuelwood and poles is prohibited. Therefore, currentusers of information are limited to the Ministry of Forests, the Ministry of Finance, the NationalPlanning Commission, the Central Bureau of Statistics and local traders. Potential users of forestproducts information are unlimited provided that information serves requirements. For example,potential users of fuelwood information include brick kiln proprietors, and furnituremanufacturers and other forest products using industries are potential users of roundwoodinformation. The following current and potential users have been identified (Tables 12 and 13).
Table 12. Current users of wood products informationCurrent user of information Type of organisationMinistry of Forests and Soil Conservation GovernmentMinistry of Finance GovernmentMinistry of Local Development GovernmentNational Planning Commission GovernmentDepartment of Forests GovernmentDepartment of Forest Research and Survey GovernmentCentral Bureau of Statistics GovernmentForest Products Development Board Semi-autonomousTimber Corporation of Nepal Semi-autonomous

220
Table 13. Potential users of wood products informationPotential future users of information Type of agenciesDepartment of Cottage Industries GovernmentForest Products Business Bureau CompanyCommunity Forest Users Committee NGONepal Foresters Association NGOTrade Promotion Centre Semi-autonomousFurniture factories PrivateBrick kiln proprietors PrivateWood based industries PrivateParticle board factories PrivatePlywood factories PrivatePiling factories PrivatePackaging factories Private
WEAKNESSES AND CONSTRAINTS IN THE CURRENT STATISTICAL SYSTEM
At present statistics are collected by various institutions according to their individual needs. Thereare many data gaps and disparities. This is not only the case in the forestry sector but also in mostother sectors. The Central Bureau of Statistics (CBS) is responsible for collection anddissemination of various types of data in Nepal but has not so far not been able to collect anddisseminate appropriate data covering all sectors.
There are a number of constraints in the existing system of national data collection. Among themsome important ones are as follows:
• Fifty-three of the seventy-five National District Forest Offices are located in thehills and the Range Offices are located in still more remote areas. There is apossibility that these areas lack adequate supervision, which may result inincorrect information.
• Due to poor communication systems, data may not be received in time forcompilation, which may result in late publication of annual and bi-annual reportsor complete failure to publish.
• Most Field Rangers and even District Forest Officers do not understand theimportance of statistical data and record keeping.
• Most Field Rangers and even District Forest Offices lack modern technologies toanalyse data.
Table 14. Matrix of weaknesses and constraints in the current statistical systemIssue Weakness ConstraintsForest products datacollection.
-Range office/DFOs are not used to collecting data.-There is little understanding of the importance ofinformation for policy formulation and programmeimplementation.-Local forestry personnel mean only to collectproduction and consumption figures for major forestproducts, as they do no perceive the importance of othertypes of information.
-Lack of standard data collection formats.-There no record keeping system andrecords are not monitored regularly.-Lack of modern equipment.-Most District Forest Offices and RangeOffices are located in remote places.-Data collection is time consuming andexpensive.
Collection ofproduction data forfinished goods, suchas plywood veneer.
-Enterprises/industries do not like to provide productionfigures to concerned authorities until they are requested.
-There is no regular system of collection ofthese types of data.
Dissemination ofinformation
-Information is not published regularly. -Lack of communication facilities in most ofthe DFO and Range Offices.-Lake of modern technology for datacompilation.-Lack of a separate national unit for datacompilation and dissemination.
SUGGESTIONS FOR IMPROVEMENT TO THE CURRENT STATISTICAL SYSTEM
Presently national forestry statistics are collected by conventional methods that need to beimproved. Improvements should start by equipping Field Offices with modern instruments toincrease the efficiency of information generation and update and Forest Rangers should be given

221
short refresher courses on information collection and analysis. The development and linking ofappropriate record keeping system at District, Regional and Central level is a further priority. Atthe national level a National Statistical Plan should be formulated. The plan should review theprevailing system of data collection and dissemination and reform it in accordance with nationaland international requirements. Until such a plan is instigated, it is highly desirable that datarecording should be continued following the diagram in Figure 2.
With respect to tree classification, it should be noted that roundwood data are compiled from all74 districts in Nepal, some of which produce roundwood from conifers. In the current annualreport softwood and hardwood quantities are not individually specified although it is possible thatthis could be achieved given that differentiation is made in district level data between softwoodand hardwood figures through the royalty system. In this connection work has already beeninitiated through development of a database in the Department of Forests, which includes figuresfor old stock, present production, sale and remaining stock for a given fiscal year. The forms fordata collection have been developed with the concept that forest product data collection shouldbegin from the range post and district. Softwood/hardwood classification would be recorded at thecollection point. Figure 2 shows the proposed system for information collection.
Figure 2. Proposed data collection system
CONCLUSIONS
Other than the Forest Products Development Board, which produces forest products from its ownresource base, the DoF (District Forest Offices), DFPSC and TCN are totally dependent ongovernment forests. The district forest offices sell a proportion of forest products from their owndepots and provide forest products to the District Forest Products Supply Committee and theTimber Corporation of Nepal. The forest products data generated by these agencies sometimesdiffer despite the source of materials being the same (e.g. district forest offices). This results fromthe differing systems of functioning of the involved institutes.
District ForestProductsSupply
DistrictForestOffice
RegionalForestOffice
MFSCCentral data
bank
Ilaka Forestdata
Range Officedata
ForestDepartment
(Central
CentralBureau ofStatistics
ConcernedMinistries and
other lineagenciesCommunity
Forest UserGroups

222
REFERENCES
Department of Forests, 1996. Bi-Annual Reports, for the Fiscal Years 1994/95 and 1995/96.Department of Forests, Ministry of Forests and Soil Conservation, Babar Mahal, Kathmandu,Nepal.
Department of Forests, 1997. Annual Reports, for the Fiscal Year 1996/97. Department ofForests, Ministry of Forests and Soil Conservation, Babar Mahal, Kathmandu, Nepal.
Department of Forests, 1998. Annual Reports for Fiscal Years 1997-1999. Department of Forests,Ministry of Forests and Soil Conservation, Babar Mahal, Kathmandu, Nepal.
DFRS, 1999. Forest Resources of Nepal, 1987-1998. Department of Forest Research and Survey.Forest Resource Information System Project. Babar Mahal, Kathmandu Nepal.
Ministry of Forests and Soil Conservation, 2000. Forest Products, timber/fuelwood Collection andSale Directives- 2000. Ministry of Forests and Soil Conservation, Singha Durbar, Kathmandu,Nepal.
Nepal Rastra Bank, 2001. Export and Import Bulletin. Research Department, Nepal Rastra Bank,Baluwatar, Kathmandu, Nepal.
Pandit, S.K., 2001. National Statistical Plan and its Necessity. The Gorakhapatra Daily.November 26, 2001. Kathmandu.
Sixth Annual Report, 1997/98. Sri Bhrikuti Pulp and Paper Nepal Limited, Nawalp Parasi, Nepal.WESC, 1998. Country document on present status of wood energy in Nepal. WESC report,
Kathmandu, Nepal.
Appendix 1. Exchange rates of Nepalese rupee to us dollarsYear Nepalese Rupees per
US Dollar1995 50.631996 56.301997 57.301998 68.801999 68.802000 70.402001 73.68Dec 2001 76.10

223
National forest products statistics, Pakistan
INTRODUCTION
Pakistan has 4.2 million ha of forest and planted trees, which equates to 4.8 percent of the totalland area. Forty percent of the forest area comprises coniferous and scrub forest in the northernhills and mountains. The balance includes irrigated plantations, riverine forests along major riversof the Indus plains, mangrove forests of the Indus delta and trees planted on farmlands.
With only 0.05 ha of forest per capita against a world average of 1.0 ha, Pakistan is comparativelyforest-poor. The high population growth rate (2.61 percent) is pushing the figure further downand, at present, it is not possible to expand public forest area at a high enough rate to keep up withdemand for forest products. However, farmers are encouraged to establish plantations onfarmlands and wastelands to help ameliorate the situation.
Benefits from forestry in Pakistan include the following:� Five hundred thousand workers are employed in forestry and related industries such as
logging, village carpentry and manufacture of timber components for the constructionindustry. However, the forestry sector contributes only 0.3 percent to GNP.
� Between 1996 and 2000, on average, 31.66 million m3 of roundwood and 2.35 million m3
of industrial roundwood were produced annually from state forests and farmlands. Afurther 532 000 m3 of industrial roundwood was imported annually to meet nationaldemand.
� Forests supply 32 percent of Pakistan’s total energy needs in the form of fuelwood.Ninety percent of rural, and sixty percent of urban households use fuelwood, together withother forms of biomass as their primary energy source.
� Forests provide forage for one third of Pakistan’s 86 million head of livestock. Leather,wood and other livestock products contribute US$400 million or 9 percent of total exportearnings. Trampling and browsing by increasing numbers of livestock are causing forestdestruction and uncontrolled grazing is a major obstacle to sustainable forest management.
� Forests are vital in protecting the catchment areas of reservoirs32 used for powergeneration and irrigation. Agriculture, which contributes 26 percent to GDP, is highlydependent on irrigation in Pakistan and annual losses due to flooding, soil erosion in uplandwatersheds and siltation in reservoirs and irrigation works is estimated at Rs.2.3 billion.Forest ownership
In Pakistan forests are classified on the basis of legal status, function, vegetation composition andownership. Types of state and privately owned forests are detailed in the following sections. Table 1gives details of the areas of State and Private forest sub-categories in Pakistan’s provinces.
State-owned forests
State owned forests comprise 85 percent percent of Pakistan’s total forest area of 87.98 millionha. They are further divided into four classes on the basis of the legal designation and protection:
� Reserved Forests33. Forests under Forest Department control and declared ‘ReservedForests’ under the 1927 Forest Act. Local people generally do not have rights andprivileges unless specifically permitted by Government notification.
32 e.g. Tarbela, Mangla and proposed Kalabagh reservoirs for power generation and the massive irrigationschemes on the Indus plains.33 In Balochistan the legal term for Reserved Forests is State Forests. Cantonment and Municipal Forestsare also State owned and as they occupy small areas, are grouped with Reserved Forests.

224
� Protected Forests. Forests, declared as ‘Protected Forests’ under provision of the 1927Forest Act. Local people have some rights and concessions for grazing, grass cutting,collection of dry wood, etc.
� Un-classed Forests. Public forestlands under the control of the Forest Department, whichare neither Reserved Forests nor Protected Forests.
� Resumed Lands. Lands surrendered by larger owners following the fixing of a ceiling onthe extent of land ownership under the Land Reforms Act of 1959. Concerned landownersretained cultivated lands but surrendered wooded lands in excess of the ceiling. Theseresumed lands are managed by the Forest Department.
Table 1. Forest area by legal classification and province (‘000 ha)Category AJK Balochistan N.As NWFP Punjab Sindh TotalState forestReserved forests 567 707 - 98 337 292 2 001Protected forests - 378 67 629 2 747 726 4 547Un-classed forests - - - 7 115 25 147Resumed Lands - - - 33 9 5 47Private forestGuzara forests - - - 550 - - 550Communal forests - - 2 982 - - - 2 982Section 38 areas - 1 - 26 9 - 36Chos Act areas - - - - 1 - 1Private plantations - - - 159 - - 159Miscellaneous - - 53 42 - 95Total 567 1 086 3 049 1 555 3 260 1 048 10 5651
1- 6 287 000 ha of rangelands are included in table figures.Privately owned forestsPrivately owned forest is a broad classification encompassing all forests held in privateownership. There are five categories, as follows:
� Guzara (subsistence) Forests. Sizeable patches of wooded land close to habitation,which were set aside to meet the bona fide domestic needs of local communities. They weredesignated when government forests were reserved at the first land ownership settlement inHazara, NWFP, 1872. Ownership is vested in local people either individually, orcommunally as ‘village shamilat’.
� Communal Forests. Communal forests are a sub-category of Guzara Forests. However,communal forest is essentially owned by the entire village. Communal Forests are mostlyfound in the Rawalpindi Civil Division of Punjab Province.
� Chos Act Areas. Privately owned lands subject to erosion hazard endangering vitalpublic installations or structures and taken over by the Government under the Chos Act,1900. These areas may be returned to their original owners after stabilisation.
� Section 38 Areas. Areas offered by Private owners to the Forest Departments forafforestation and management for an agreed period ranging from 10 to 20 years underSection 38 of the Pakistan Forest Act, 1927. Section 38 states that: “The owner of any landor, if there be more than one owner thereof, the owners of shares therein amounting in theaggregate to at least two-thirds thereof may, with a view to the formation or conservation offorests thereon, represent in writing to the Collector their desire that: such land be managedon their behalf by the Forest Officer as a Reserved or a Protected Forests on such terms asmay be mutually agreed upon; or all or any of the provisions of this Act be applied to suchland. In either case, the Provincial Government may, by notification in the official Gazette,apply to such land such provisions of this Act as it thinks suitable to the circumstancesthereof and as may be desired by the applicants”.
� Farm Forest Areas. Farm Forests are linear or compact plantings of trees on privatefarmlands owned individually or by a family. Farm forest areas are found throughout thebarani (arid areas) and irrigated farming areas of Pakistan.

225
Forest areaThe Forest Department maintains records of the forest area over which it has jurisdiction. Forestcover information is derived from Forest Department surveys and working plan inventories.Although Forest Reserves are accurately surveyed, area estimates for Protected Forests and othercategories of Government forest are less reliable and no records concerning private or communalforests are kept. Areas typically cited as ‘Forest Areas’, referring to lands under ForestDepartment control, are summarised in Table 2.
Table 2. Forestland under government jurisdiction by province (‘000 ha)Forest type AJK Balochistan N.As NWFP Punjab Sindh TotalConiferous forests 360 131 285 1105 72 1 1 953Irrigated plantations 142 2 82 3 224Riverine forests4 5 51 4 226 5 282Scrub forests 1 163 658 115 340 10 1 287Mangrove forests6 605 605Mazri (dwarf palm) 24 24Linear plantations 2 21 23Private plantations 120 7 120Total 361 299 943 1 366 626 923 4 518
1. 29 000 ha Forest Department, 43 000 ha Murree-Kahuta Development Authority; 2. 63 000 ha unstocked;3. 53 000 ha unstocked; 4. 24 000 ha unstocked; 5. 114 000 ha unstocked. 6. Sindh Forest Department (281000 ha), Qasim Port Authority (64 000 ha) and the Central Board of Revenue (240 000 ha); 7. NWFP ForestDepartment estimate for planting under watershed management projects.Sources: Pakistan Forest Institute (Amjad and Khan, 1990); Provincial Forest Departments.
Under the Forestry Sector Master Plan (FSMP) national forest cover was independently estimatedthrough interpretation of 1:250 000 scale satellite images. Results are shown in Table 3.
Table 3. FSMP Estimates of Forest Area (‘000 ha)Forest type AJK Balochistan N.As NWFP Punjab Sindh TotalConiferous forest:1
Dense 17 46 75 138Sparse 224 42 614 865 30 1 775Sub-total 241 42 660 940 30 1 913
Scrub forest 16 504 539 132 1 191Riverine forest:
Dense 1 2 27 85 115Sparse 20 11 27 58Sub-total 1 20 13 27 112 173
Mangrove forest:Medium 2 85 87Sparse 120 120Sub-total 2 205 207
Irrigated plantations:Dense 48 7 55Sparse 1 31 16 48Sub-total 1 79 23 103
Farmland trees 7 23 6 70 306 54 466Linear planting 2 14 16Miscellaneousplanting
10 120 20 5 155
Total 275 592 666 1 684 608 399 4 224Geographic Area 1 330 34 719 7 040 10 174 20 626 14 091 87 980% Tree Cover 20.7 1.7 9.5 16.6 2.9 2.8 4.8
1-For Northern Areas, this category includes scrub. Source: FSMP database.National growing stock and biomass
Between 1990 and 1992, the Household Energy Strategy Study (HESS) conducted an analysis ofnationwide tree biomass and productivity. Total standing volume was estimated at 240 million m3,

226
the number of standing trees at 1 435 million, total air-dry wood weight at 203 million tons andthe average stocking density at 2.38 tons per hectare. Total wood yield was estimated at 22.2million tons per annum or 10.9 percent of the standing stock. Definitions used for woodfuel andtimber are given in Box 1 and estimates of total standing wood volume from the HESS BiomassSurvey are given in Table 4.
Box 1. Definitions of Timber and FuelwoodRoundwood with mid diameter greater than or equal to 20 cm is called timber and is mostlyused as industrial wood. Roundwood with mid-diameter of less than 20 cm is called woodfueland is commonly used for burning or charcoal making. Woodfuel billets of 76-152 cm areseparated by the timber martinets and categorised for different purposes according to middiameter:
• Select: Mid diameter 15-19.9 cm, used by the match and sports goodsindustries, for manufacture of industry crates, as poles and for cheap furniture.
• Thick: Mid diameter 9.5-14.9 cm, used for cheap furniture and chipboardmanufacture.
• Medium: Mid diameter 5.5-9.5 cm used for chipboard manufacture.• Thin: Mid diameter less than 5.5 cm, used as fuelwood.
The Forestry Sector Master Plan34 (FSMP) calculated a total growing stock of 185 million m3.The 1992 FSMP farm tree survey estimated a standing stock of trees on farms of 70.3 million m3
with an annual growth rate of 7.7 million m3. By combining data from Forest Department workingplans, the farmland tree survey and HESS, FSMP estimated a total national standing volume of368 million m3.
Table 4. Estimates of standing wood volume (‘000 m3) by agroecological zone
Zone Area(‘000 ha) Woodfuel Timber Total wood
volumeDesert 25 234 1 857 286 2 143Semi-Arid 25 383 7 857 6 000 13 857Natural Forest 12 997 61 143 43 143 104 286Barani 2 788 4 429 429 4 858Irrigated Lowlands (Sindh/Balochistan) 4 461 4 429 3 286 7 715Irrigated Lowlands (Punjab/NWFP) 3 186 14 286 14 286 28 572Irrigated Highlands (Sindh/Balochistan) 1 987 4 714 4 143 8 857Irrigated Highlands (Punjab/NWFP) 9 185 36 857 32 857 69 714Total 85 221 135 572 104 430 240 002
Source: HESS Biomass SurveyAccording to the HESS demand survey, conducted in four provinces, 125.1 million trees wereplanted on farmlands in 1990-91 and 10.8 million were felled; of those planted, 13.2 million(11 percent) were fruit trees. Tree planting and felling rates in different provinces calculated byHESS are given in Table 5.
34 FSMP was compiled using 29 working plans from NWFP, 3 from Punjab, 4 from AJK and 3 fromNorthern Areas.

227
Table 5. Tree planting and felling rates in four provincesPunjab Sindh NWFP Balochistan Total
Trees planted (millions)% of plantings
60.9049.7
6.515.2
44.1635.3
13.5410.8
125.11100
Fruit (millions)Non-fruit (millions)
% non-fruit trees
5.6955.2190.6
2.613.9059.9
3.7140.4591.6
1.2512.2990.8
13.25111.86
89.4Trees planted/ha 7.5 2.5 54.9 24.5 10.9Total farmers (000s)
% of farmers planting3 39642.9
1 11726.6
80048.4
24551.8
5 55840.8
Trees felled (millions) 5.42 2.04 1.63 1.75 10.83Planting/felling ratio 11.2 3.2 27.1 7.7 11.6
Source: HESS Demand SurveyREVIEW OF WOOD CONSUMPTION BY SUB-SECTOR
In Pakistan, almost all softwood comes from state forests in NWFP, Northern Areas and AJK,whereas most hardwood is from the plains area of Punjab and Sindh. Ninety percent of hardwoodcomes from farmlands and the remaining 10 percent from irrigated plantations.
The solid wood industry in Pakistan is artisanal and small scale. Wood is considered a valuableresource and any solid ‘waste’ is carefully re-sawn for manufacture of smaller products withleftovers finally sold as fuelwood. Users and uses of wood are outlined in the following sections.
ConstructionThe construction industry is the largest single user of roundwood in Pakistan, consuming about30 percent of the total. Builders purchase logs or scant (squared timber) and convert themaccording to their needs.
Manufacture of wooden crates and boxesPakistan has more than 8 000 sawmills, employing an average of four or five people andprocessing 2-5 m3 per day. There are also twelve large sawmills, which operate at well below theiraverage production capacity of 50 m3 per day. On the whole, sawmills produce low qualityoutturn as a result of the preferred species not always being available and a lack of productstandardisation, grading and quality control.
The most common sawmills products are fruit boxes and crates, which are manufactured by unitsattached to the mills. The entire conversion from roundwood to finished product is thus handledby a single small enterprise. Crates for transporting fruit and vegetables are assembled in the fruitproducing areas, whilst boxes are made near industrial centres. The industry uses a variety ofspecies, the main ones being shisham (Dalbergia sissoo, 70 percent), deodar (Cedrus deodara,12 percent), Sufeda (Eucalyptus camaldulensis, 7 percent), fir (Abies pindrow, 5 percent), poplar(Populus deltoids, 3 percent) and babul (Acacia nilotica, 3 percent).
Furniture manufactureFurniture is made by hundreds of small-scale enterprises in Pakistan. Traditionally, furnituremanufacture was considered under the village carpentry sub-sector. Now, however, new modernfurniture factories have been established by the private sector in Gujarat, Jhang and Peshawar.
Nearly all wood used for furniture making is shisham (Dalbergia sissoo, 82 percent), with smallquantities of deodar (Cedrus deodara), poplar (Populus deltoids), mulberry (Morus alba) andother species. The furniture makers themselves saw most wood. An FSMP survey estimated urbanconsumption of wood for furniture at 5.9 m3 per 1000 population.
Village carpentryVillage carpenters produce a wide variety of products including furniture, agriculturalimplements, doors and windows. Carpenters generally do all the conversion from roundwood tofinished product themselves and sometimes also fell client’s trees. The most commonly usedspecies are babul (38 percent), shisham (16 percent), Zizyphus jujuba (15 percent) and deodar(8 percent). In 1992, FSMP estimated rural wood consumption for village carpentry at 3.7 m3 per1 000 capita.

228
Match productionThere are twelve match factories in Pakistan, four in NWFP, four in Sindh, three in Punjab andone in AJK. All match splints are made from poplar, of which 90 percent is from private growers.Each cubic meter of roundwood yields 13 200 boxes of matches, however, conversion efficiencyis only 20-30 percent because of the small logs used. Between 1977 and 1988 the industry grewat an annual rate of 6.7 percent with 2.491 billion boxes produced in 1988. If production continuesto increase at the same rate, production will exceed 14 billion boxes per year by 2018. Projectedwood requirement for 2018 is thus 996 000 m3 assuming current levels of production efficiency.
Mining applicationsPakistan extracts many minerals, but only the coal industry uses large amounts of timber. In thepits, babul poles are used for structural timbers and babul planks are for facing timbers.Approximately 56 m3 of mining timber are used per 1000 tonnes of coal extracted.
Particle board and fibreboard manufactureParticle board (also called chipboard) is made by mixing wood chips with glue and pressing themixture into a panel, whereas fibreboard is manufactured by reducing wood chips to fibres andpressing them into panels without glue. Both are high value-added products and make efficientuse of any kind of wood residue, including plantation thinnings, branches and tops. The onlycompeting use for this kind of wood is for fuel. A viable market for these boards benefits privatetree growers, who harvest trees when they are still small.
The annual raw material requirement for particle board and fibreboard was estimated by theFSMP at a constant 22 000 m3 per year.
Particle boardThere are sixteen particle board plants in the country using wood or bagasse. Of the eleven plantsusing wood, six are in Sindh, four in Punjab and one in NWFP. The preferred species for particleboard are mango (60 percent) and poplar (30 percent) and although plants are not limited by woodsupply, mango wood availability is seasonal and spasmodic.
Although the construction industry has begun to use particle board, the bulk is used by largefurniture makers. It has yet to catch on with smaller manufacturers and thus, the potential forreplacing solid wood in the furniture industry has yet to be fully realised. Due to limited currentdemand and manufacturers apprehensions about future demand, plants currently operate at anaverage of only 48 percent capacity although most have sufficient wood supply.
FibreboardThere are five fibreboard plants in Pakistan, four using wood and one bagasse. Babul (97 percent)and eucalyptus (3 percent) are the preferred species. Fibreboard may be used as a substitute forplywood, which costs four times more than fibreboard. Fibreboard plants, nevertheless, onlyoperate at 23 percent of installed capacity and the fibreboard industry is stagnant.
Plywood manufactureThere are 17 plywood plants in Pakistan; ten of them are in the Punjab, six in Sindh and one inNWFP. The installed capacity of the mills is 1.6 million m3 per shift (eight working hours). Onemill operates on three shifts, whereas others operate at less than 50 percent capacity. If they couldobtain sufficient supplies of high quality wood, most mills would operate three shifts. Indeed,some plants, to supplement supplies, go through the lengthy and costly process of importing smallamounts of teak, keruing and other woods from Southeast Asia. Production of plywood increasedfrom 30 000 m3 in 1996 to 47,000 m3 in 2000.
Construction of trains, trucks, buses, and boatsAnnually, Pakistan Railways use an average of 1 350 m3 of roundwood for new construction and5 050 m3 for maintenance; 60 percent of wood used is deodar and 40 percent shisham. In general,wood is gradually being replaced by metallic and non-metallic fibrous materials in the railwayindustry and it is therefore expected that wood consumption will remain constant or decrease.
For new truck and bus bodies, some 30 000 m3 of roundwood was used in 1990. The main specieswere shisham (60 percent), fir (25 percent) and chir pine (10 percent) with small quantities of

229
babul, deodar, and chilghoza. The volumes used are likely to increase even though bus and truckbodies are increasingly being constructed with greater amounts of plastic and metal.
Shipbuilding uses 13 640 m3 of wood annually, comprising 10 040 m3 for ocean-going fishingboats, 3 200 m3 for freshwater fishing vessels and 400 m3 for other boats. The main species usedfor boat building are deodar (38 percent), shisham (32 percent), teak (24 percent) and kikar (6percent).
Railway sleeper manufactureIn the past, Pakistan Railways has used high value species such as deodar (90 percent) andshisham (10 percent) for sleepers, however, these could be replaced with less valuable speciessuch eucalyptus in the future. Furthermore, demand for wooden sleepers is declining due to agradual shift toward road transport and the closure of unprofitable rail routes by PakistanRailways in recent years. Pakistan Railways has also begun a program to replace wooden, ironand steel sleepers with pre-stressed concrete ones.
Production of sports goodsPakistan produces and exports a variety of wooden sports goods, including hockey sticks (about60 percent of the world supply), cricket bats and tennis, squash and badminton rackets. Between1985 and 1990 the amount of roundwood used by the sports goods industry fell by 20 percentfrom 50 220 m3 to 41 000 m3. FSMP assumed an annual growth rate of 8 percent for the entiresports goods industry. Hockey sticks are made from mulberry, with small amounts of ash andcane for the handle. Cricket bats, on the other hand were made of willow around 1980, now,however, poplar is now used for 80 percent of them.
Brick manufactureTotal production from brick kilns in 1990 comprised 11 118 million bricks and 1 227 million tiles.On average, 4.3 m3 of fuelwood and 271 tonnes of coal are used to cure one million bricks.Fuelwood consumption for brick and tile production in 1990 was estimated by FSMP at 83 370 m3.
Tobacco curingIn 1987, fuelwood consumption per tonne of green tobacco averaged 1.26 m3. Between 1978 and1984, Pakistan’s annual tobacco production ranged between 64 700 and 89 200 tonnes. Totalfuelwood consumption in 1984 would therefore have equalled 112 400 m3.
REVIEW OF EXISTING FOREST PRODUCTS RELATED DATA
Institutions involved in data collection, analysis and disseminationThe following ministries/departments are engaged in collection, analysis and dissemination offorest products data:
� The Office of the Inspector General of Forests, Ministry of Environment, LocalGovernment and Rural Development.
� Ministry of Industries and Production.� Ministry of Commerce.� Federal Bureau of Statistics.� Pakistan Custom Department.� Central Board of Revenue.� State Bank of Pakistan.� Provincial Forest Departments.� Pakistan Forest Institute
Current users of forest products production and trade dataCurrent users of FBS forest products production and trade data include:
� The Ministry of Commerce and Industries, Planning & Development Division, (forapproval of development projects),
� Export Promotion Bureau� Provincial Forest Departments (to validate revenue receipts)� Provincial Planning and Development Boards (to guide recommendations for funding
development work),

230
� The Ministry of Finance,� Provincial Finance Departments� The State Bank of Pakistan,� The Central Board of Revenue.� Chamber of commerce and trade� Exporters & importers� Universities and Educational institutions� Donor agencies
Use of CHK data is confined to the Central Board of Revenue and the Ministry of Finance.Forest-related information currently collected
Information presently collected at the local and national level includes the following:� Forest area under compact plantation� Forest Area under linear plantation (roadside/rail side canal plantation)� Area afforested/reforested under different schemes� Forest Departments Nurseries� Planting stock available or distributed during tree planting campaigns� Revenue generated from grazing and grass cutting� Work done for rangelands improvement� Work done to develop sericulture (rearing of silkworms)� Work done for watershed management� Area subject to felling and thinning� Out-turn of timber from state forests� Yield of fuelwood from state forests� Forest crop damage through natural causes (flood, fire and others)� Import/export of forest products� Surveys for removal and production of processed wood
Production and trade dataAnnual production of wood and quantities imported between 1996-2000 are shown in Table 6 alongwith the percentage of consumption (imports+consumption) imported.
Statistics from the publication of the Federal Bureau of Statistics, Statistics Division, Governmentof Pakistan for 1996 to 2000 show that for the 1995-96 financial year the value of the importedproducts listed in Table 6 amounted to Rs.8 032.874 million. For the four following years theamounts were Rs.6 713.419 million, Rs.7 458.516 million and Rs.10 634.853 million andRs.6 525.584 million.
Between 1996 and 2000, wood products exports from Pakistan were confined to woodenfurniture, small amounts of stationery (registers, diaries, letters, etc.) and some shisham(Dalbergia sissoo) table and kitchen wear. Export earnings during 1995-96 and the four followingyears were Rs.80.795 million, Rs.148.338 million, Rs.285.244 million, Rs.263.183 million andRs.417.635 million respectively. Export and import values are plotted in Figure 1.
Table 6. Average Annual Wood Production and Quantity Imported for 1996-2000Product Units Production Import % ImportedRoundwood 000s m3 31 660 533 2Woodfuel including wood for charcoal 000s m3 29 315 0.023 0Industrial roundwood 000s m3 2 345 532 18Wood residues 000s m3 598 0.171 0Sawnwood 000s m3 1 103 37 3Wood-based panels 000s m3 110 49 31Plywood 000s m3 31.2 0.521 2Particle board 000s m3 55 0.677 1Fibreboard 000s m3 24 46 66Hardboard 000s m3 10.2 8.354 45Mdf 000s m3 13.6 35.639 72Insulating board 000s m3 0 1.995 100Wood pulp 000s mt 0 57.072 100

231
Other pulp 000s mt 176 0.215 0Recovered paper 000s mt 81.4 25 23Paper & paper board 000s mt 500 199 28
Figure 1. Value of wood products import and export 1996-2000
0
2000
4000
6000
8000
10000
12000
1996 1997 1998 1999 2000
Year
Val
ue (R
s. m
illio
ns)
ImportsExports

232
The major suppliers of wood products imports between 1996 and 2000 were as follows:� Roundwood: Afghanistan, Myanmar, Malaysia and Singapore. Softwood was imported
from Afghanistan and teak and other non-coniferous wood from Myanmar, Malaysia andAfrican countries.
� Veneer and Plywood: Indonesia, China, Malaysia, Singapore and USA.� Sawnwood: UK, USA, Romania, Myanmar, Malaysia and Singapore.� Wood Pulp: Sweden, Switzerland, USA and South Korea. Pakistan imported a huge
quantity of paper and paperboard i.e. graphic paper, newspaper print.� Paper and paperboard: France, Russian Federation, Sweden, Japan, Italy, Finland and
South Korea.� Packaging material: Brazil, China, Italy, Poland, Spain, Romania and USA.� Other paper and paperboard not elsewhere specified: France, Japan, Netherlands,
South Africa, Norway, Spain, UK and USA.� Special coated paper: Asian countries, Bulgaria, Finland, Germany, Italy, Norway,
Poland, South Korea, UK and USA.� Copying paper: China, Japan and UK.� Household sanitary papers: China, Dubai, Norway, South Korea, Thailand, UK and
USA.� Packaging cartons and boxes: Austria, Australia, Dubai, Switzerland and USA.
METHODOLOGIES FOR DATA COLLECTION, COMPILATION, VALIDATION AND
DISSEMINATION
Production from public forestsPublic forests (i.e. coniferous, riverine, scrub and mangrove forest and irrigated and linearplantations) supply most of the national industrial wood requirement and some of its fuelwood.Within public forest areas, Divisional Forest Officers (DFO) record production data on the basisof actual fellings. Enumeration of trees to be felled is carried out and diameter of the respectivetrees is recorded at breast height. Log volumes are computed on the basis of the quarter girthformula, with allowances made for bark. Fuelwood is laid in stacks of 40 feet in length, 5 feet inwidth and 5 feet in height, giving a total volume of 1000 cft. including void space. Measurementsof woody produce (log and fuelwood) are recorded in respective forms at compartment and forestlevel.
Production is reported at monthly intervals through the forest operation report by the DFO to theConservator of Forests. The Conservator of Forests (CF) compiles the annual production reportfor his circle and submits it to the Chief Conservator of Forests (CCF) using the control form oftimber and fuelwood production. The revenue generated through harvesting is also reported onmonthly basis and is validated through inspection by the CF and CCF. The Revenue Wing of theForest Department also audits revenues collected.
In contrast to State forest production data, which is based on field measurements, farmlandproduction is estimated through surveys and studies conducted by the forest departments, NGOsand the Pakistan Forest Institute. Final production figures are arrived at through estimation andprojection of survey/study results.
International trade statisticsInternational trade statistics are collected by the Federal Bureau of Statistics (FBS) and the DataProcessing Centre (DPC), Custom House, Karachi (CHK). The FBS obtains international tradestatistics through collection of Bills of Entry (BOE) and Shipping Bills (SB) from 44 customspoints. It has attained 100 percent coverage and retrieval of international trade data. The CHK isconfined to Karachi only and has yet to expand to cover the whole country. The FBS and CHKdata are verified with data from revenue receipts from the Central Board of Revenue and withexport/import remittance data from the State Bank of Pakistan. As a result of cross checking atfour levels the data is considered reliable.

233
The information collected by FBS includes country of origin and quantity and value of importsand exports. Data collected and published includes35:
� Monthly and cumulative values and quantities of imports and exports with details ofimportant items. Issued in ‘Advance release of Foreign Trade Statistics’ in the monthfollowing data collection.
� Monthly and cumulative imports and exports by commodity, and short shipment exports.� Data for the last quarter and whole financial year on (i) import and export value of
commodities by section and group, and (ii) import and export value and quantity bycommodity and country. The information is published annually in ‘Foreign Trade Statisticsof Pakistan’.
The DPC and CHK collect information on the value of imports and total import duty, splitaccording to duty free and dutiable imports. Information collected and published includes1:
� Item-wise details of commodities imported for home-consumption and their value.� Heading and sub-heading wise details of commodities imported and their value.� Import rate-wise value of imports and actual import duty.� A comparative statement of imports by economic category.� A comparative statement of selected items giving total import value of dutiable and duty
free imports, and collection of customs duty.� Information on exemptions by SROs giving assessed value, import duty, cost of Iqra
(educational) surcharge and sales tax.The FBS use the Standard International Trade Classification, Revision-3 (SITC, Rev.3) in theform of a conversion made in July 1989 called the Pakistan Standard Trade Classification.Although, a full description of the coding system has not been published the revised classificationuses seven digit codes for each commodity. For example 6 343 100 is allotted to plywood sheetsouter-ply, 6 343 900 to other plywood sheets, 6 344 101 to laminated sheets, 634 909 to otherplywood (i.e. veneered panel). Since the system has been in place there has been some confusionencountered in using the commodity codes and descriptions.
Quarterly information published by the Federal Bureau of Statistics is occasionally incompleteand does not include full information on imports by commodity and country. However, thebiannual forest trade statistics published by the FBS does provide complete information and thisdata is compared and revalidated with that of the Pakistan Customs.
Adherence to the WCO Harmonised SystemThe WCO Harmonised System (HS) has been adopted by the Pakistan Customs Department.Eight columns are used to categorise each commodity as detailed in the Imports and ExportsTrade Guide, Central Excise and Sales Tax Tariffs produced by the Central Board of Revenue.The system is as follows:
� Column 1: Heading number based on the headings of Harmonised System of Coding andCommodity Description.
� Column 2: Sub-heading number based on the Harmonised System or created to suitnational requirements.
� Column 3: Description of items.� Column 4: Rate of duty applicable.� Column 5: Rate of sales tax.� Column 6: Conditions of Import of goods (in accordance with the Import Policy).� Column 7: Unit of quantity in which goods are to be invoiced.� Column 8: Standard International Trade Classification, Revision 3 developed by the
International Bureau of Statistics.Processed wood products data
Production data for processed forest products (i.e. wood charcoal, wood chips and particles, woodresidues, sawnwood, veneer sheets, plywood, particle board, pulp and paper) is collected through 35 Values quoted in reports produced by the Federal Bureau of Statistics and the Custom Department are inPakistan rupees only.

234
surveys and studies carried out under development projects. The data is normally collected byway of questionnaires or visits to concerned industries.
WEAKNESS AND CONSTRAINTS IN CURRENT STATISTICAL SYSTEM
General weaknesses and constraints in the existing national system of forest products datacollection, analysis and dissemination include the following:
� In Pakistan, planning, execution and implementation of forestry and range managementprogrammes is the responsibility of the Provincial Forest Departments. Policy, however, isa federal responsibility and this has led to a fragmented forestry sector lacking consistencyand unity.
� The present skeleton staff lack computer facilities and the necessary support to develop acentral forestry database for analysis of information, policy formulation and strategicplanning.
� Production data for farmlands and forest industries is based on surveys and studies carriedout by the Provincial Forest Departments and the Pakistan Forest Institute. A substantialamount of money is required to carry out such studies at regular intervals.
� Forest trade industries are reluctant to provide accurate data, as they do not fullyunderstand the purposes for which the information is used.
SUGGESTIONS
Studies should be updated at five yearly intervals to allow a clear understanding of forest productsproduction and consumption patterns and of natural resource use. Studies of the followingsubjects are required:
� Fuelwood consumption in Pakistan.� Annual wood use in construction and building.� Species-wise consumption of wood for furniture.� Industrial wood use.� Consumption of fuelwood by the tobacco and brick industries.� Chipboard units and their wood consumption.� Wood consumption by chipboard, hardboard, veneer and plywood units in Pakistan.� Wood consumption by the pulp and paper mills in Pakistan.� Wood consumption by the match industry.� Wood consumed in village carpentry.
Other suggestions and requirements for improvement of the statistical system in Pakistan are asfollows:
� Capacity building is required in the areas of data collection, data entry, error checking anddata analysis.
� Statistical models are required for survey analysis and appraisal.� Systems are required for storage and rapid retrieval of data.� There is a need for a regional data collection and networking system.� Capacity building is required at the national regional and provincial levels to improve
understanding of the Harmonised System (HS) and the Standard International Trade Code(SITC) classification.

235
References
Anon, 1998. Foreign Trade Statistics of Pakistan, 1995-96 & 1996-97. Federal Bureau ofStatistics, Government of Pakistan.
Anon, 1998. Pakistan Customs Tariff, Imports & Exports Trade Guide, Pakistan CustomsDepartment, Central Board Revenue, Government of Pakistan.
Anon, 1999. Foreign Trade Statistics of Pakistan, 1996-97 & 1997-98. Federal Bureau ofStatistics, Government of Pakistan.
Anon, 1999. CBR Year Book 1997-98.Stastic Wing, Central board Revenue, Government ofPakistan.
Anon, 2000. Foreign Trade Statistics of Pakistan, 1999-2000. Federal Bureau of Statistics,Government of Pakistan.
Archer, G. 1993. Pakistan Household Energy Strategy Study (HESS) Planning and DevelopmentDivision, Government of Pakistan.
Bukhari A.S. 1990. Wood Consumption Survey of the Railway Industry in Pakistan –Consultancy Report. Envoforestry (Pvt) Ltd.
MSJ Research Institute 1991. A Survey of the Sawmilling/Crate/Box Making Industry in Pakistan– Consultancy Report, MSJ Research Institute Karachi.
NMC, 1990. Consumption of Wood in the Chipboard/Particle Board and Hardboard Industries ofPakistan – Consultancy Report, NMC (Pvt) Ltd.
MSJ Research Institute, 1991. A Survey of the Truck & Bus Body, Tractor Trolley and BoatBuilding Industry in Pakistan – Consultancy Report.
MSJ Research Institute, 1991. A Survey of the Furniture Industry in Pakistan – ConsultancyReport.
Punjab Forest Department, 1999. Statistical Handbook of Forestry, Wildlife and FisheriesDepartment.
Reid, C. and Associates, 1992. Forestry Sector Master Plan (FSMP) Reid, Collins Associate,Canada, Silviconsult Ltd, Sweden.
Siddiqui K.M. & Khan Saliheen, 1995. Wood Use in Match Industry of Pakistan. Pakistan ForestInstitute, Peshawar.

236
National forest products statistics, Philippines
INTRODUCTION
Forest is regarded as an important resource for development in the Philippines. Its vast expanseprovides a vital economic base for a large portion of the population. It is also home to a widerange of flora and fauna, provides raw material for forest-based industries and furnishes thepeople and the economy of the Philippines with recreation areas, eco-tourism sites and a host ofother benefits. As a result of the government’s conservation policy, the Philippines is now a netimporter of wood products, having previously had an export-oriented forestry sector for manyyears.
Forest resourcesAs of 2000, forestlands in the Philippines comprised 15.8 million ha or 53 percent of the total areaof the country. Alienable and disposable lands36 make up the remaining 14.2 million ha or47 percent of the land area. The latest statistics estimate the country’s forest area at 5.4 million haor roughly 18 percent of the total land area. Table 1 shows the break down of the national forestarea by forest type.
Table 1. Forest area in the Philippines by forest typeForest type Area (millions ha)Dipterocarp forest 3.54Old growth 0.80Secondary 2.74Pine forest 0.23Mangrove forest 0.11Mossy forest 1.04Sub marginal forest 0.47
Forest-based industriesLoggingAs of 2000, 20 timber licenses existed, covering a total forest area of 910 000 ha. Between 1990and 2000 there was a significant decrease of 79 percent in the number of active timber licensesmainly as a result of the government’s strict forest conservation policy. To boost the timbersupply, the private sector has been encouraged to venture into large-scale industrial forestplantation development, and by 2000, there were 172 Industrial Forest Plantations in existence. Inthe same year, approximately 53 percent of the total log production was attributed to TimberLicense Agreement holders and Industrial Forest Plantations.
Wood processingIn 2000, there were 86 sawmills in the Philippines with a total daily capacity of 3 747 m3.However, only 45 of these operated during the year due to local wood shortages, and as a result,only 151 000 m3 of sawnwood were produced.
In addition, there were 27 plywood plants and 19 veneer plants with daily rated capacities of1.8 and 0.56 million m3, respectively. Actual production of plywood and veneer during the yearregistered at 286 000 and 178 000 m3, respectively.
Forest development strategiesThe Philippine Strategy for Sustainable Development is the overarching framework within whichthe forest development strategies outlined in the following sections operate.
36 Lands which, under the present classification system, have been declared not required for forestrypurposes.

237
Master Plan for Forestry Development (MPFD)The Master Plan for Forestry Development is a 25-year (1991-2015) nationwide blueprint forforestry sector development. The general goal of the plan is to transform the forestry sector into acondition whereby all forest resources will be under efficient and effective management. It isenvisioned that the MPFD will steer the forestry sector and draw the support for development.
Specific objectives of the Master Plan are to:• conserve and protect the forest ecosystem and its resources;• meet demands for forest products by placing all of the country’s production forest
under sustainable management;• generate employment and contribute to the country’s economic development; and• promote equitable access to forest resources.
The Community-Based Forest Management StrategyThe Government has adopted the Community-Based Forest Management strategy (CBFM) as thenational strategy to ensure sustainable development of the country’s forest resources pursuant tothe provisions of Executive Order No. 263 of 19 July 1995. The CBFM provides mechanisms forthe effective management of forestlands and coastal areas through responsible development,protection, conservation and utilization of forest resources by organized and empowered localcommunities. As of 2000, there were 4 885 CBFM projects within the country covering a totalarea of 5.4 million ha and benefiting 477 984 families.
Forest ManagementThe National Forestation Program (NFP) works in parallel with the conservation and developmentmeasures adopted by the government, and plans to establishment around 3 million ha of plantationforest by 2015 to ensure sufficient wood supply. The NFP counts on both the government andprivate sector to meet the reforestation goal outlined in the MPFD. Major activities included in theNFP are watershed rehabilitation and management and establishment of industrial forestplantations in forestlands and privately owned areas.
In addition the Department of Environment and Natural Resources (DENR) has launched a multi-faceted forest protection program that aims to protect the 15.8 million ha of forestlands in thecountry. Approaches include, the deployment of forest rangers in critical areas, aerial surveillanceand pest and forest fire control.
Several forestry development projects are also being implemented with funding assistance fromforeign donors. These include the RP-German Community Forestry Project (in Nagtipunan,Quirino Province), the Water Resources Development Project, the Natural ResourcesManagement Program and the Forestry Sector Project.
THE CURRENT FORESTRY STATISTICAL SYSTEM
The Forest Management Bureau of the DENR is responsible for collection, compilation,processing and dissemination of forestry statistics. Within the Bureau, the Forestry StatisticsSection maintains and regularly updates the forestry data bank, which consists of severaldatabases. Information collected by the FMB is detailed in Table 2.
The primary mode of dissemination of forestry statistics is through the Philippine ForestryStatistics Yearbook (PFS). The PFS is a compendium of basic information on forest resources,forestry operations, forest utilisation, forest products trade and prices, forest revenues and otherforestry-related information such as employment, gross value added, etc. The information isderived from both primary and secondary sources. The primary sources of data are the regionaloffices, which submit regular reports as by-products of their administrative and regulatoryfunctions. In some instances, data are also obtained from one off studies and surveys. Secondarydata such as trade and gross value added in forestry are sourced from other government agencies.Figure 1 details the flows of information within the Forestry Statistical System.
Table 2. National and local information collected by the FMB

238
Type CoverageProduction volume (m3) Fuelwood, Log, Lumber, Plywood, Veneer, Non-timber forest products,
Blockboard.Forest charges (PhP) Logs, Non-timber forest products.Prices (PhP) Log (m3), Lumber (board feet), Plywood, Lawanit, Fuelwood, Rattan.Forest Products import (volume andvalue)
Wood chips, Wood waste, Wood charcoal, Log, Lumber, Plywood,Veneer, Fibreboard, Particleboard, Non-timber forest products,manufactured wood products, Furniture, Paper and Paperboard, Pulp andWastepaper.
Forest products export (volume andvalue)
Wood chips, Wood waste, Log, Lumber, Plywood, Veneer, Fibreboard,Particleboard, Non-timber, Manufactured wood products, Furniture,Paper and Paperboard, Pulp and Wastepaper.
Licenses issued Timber Licenses, Other LicensesNon-timber licenses issued RattanNumber of wood processing plants Sawmills (Active with & w/out Timber Concession), Sawmills (Existing
with & w/out Timber Concession), Veneer mills, Plywood mills,Blockboard manufacturing plants, Particle board manu-facturing plants.
Economic indicators in forestry GNP & GVA in Forestry, GVA growth rate ofIndicators of forestry education Number of Schools, Course enrolment, graduates in ForestryWatershed management information Watershed forest reservesReforestation information Reforested areaCommunity-based forest managementinformation
Community-base forest management projects
Industrial Forest Managementinformation
Industrial forest management agreements
Grazing management Forestland grazing leases & agreementsLand area by status (ha) Land Classification by type

239
Figure 1. Forestry statistical system flowchart
Flow of reportsThe current statistical system within the DENR is structured into four organisational layers asshown in Figure 2. The first layer comprises the Community Environment and Natural ResourcesOffice (CENRO). CENRO acts as the frontline implementer of projects and activities in the field,where the majority of data originate. CENRO collects required data and submits it in prescribedformats on designated dates to the second layer of the statistical system, the ProvincialEnvironment and Natural Resources Office (PENRO). The PENROs summarise reports from thedifferent CENROs in their jurisdiction and submit reports to the Regional Environment andNatural Resources Offices (RENRO). The RENRO likewise summarise the PENRO reportswithin each region and submit reports to the upper layer, the Central Office. The Central Officeconsists of the DENR proper and the different Bureaus and attached agencies.
Dissemination
Databases
Data sources
FMB Divisions
LicenseesReports/Regional
StatisticalReports
TradePublications
GovernmentAgencies,
PrivateOrganizations
Regional PriceSurvey Reports
ForestryProduction,
IndustryProfile,
Revenues
PricesTrade (Import& Export of
Forest Products)
Other ForestryRelated
Information
Email/Fax DiskettesPeriodicUpdates
PhilippineForestryStatistics
Yearbook (PFS)
Forest ResourcesAccomplishment
s/Status offorestry
activities
Forestry Statistics SectionForest Management Bureau
(compiling, processing, analysis,dissemination)

240
Figure 2. DENR revised statistical reporting flow
Primary sources of forestry information (within DENR)Forestry data that emanate from the field offices are reported using standard formats. Thesereports are submitted regularly to the Central Office who, in turn, processes the data into moreusable information. Several information systems have been developed and are currentlyimplemented within the FMB. These systems generate information that is mostly disseminatedthrough the Philippine Forestry Statistics Yearbook.
Statistical Reporting System (SRS)
The SRS is a data generating mechanism implemented within the DENR by virtue of DepartmentAdministrative Order (DAO) 89-133 amended by DAO 94-10 and DAO 99-09. The objectives ofthe system are to generate timely and reliable statistics and to establish and maintain unified,integrated and organised databases of environment and natural resources (ENR) statistics. TheSRS covers all ENR sectors, i.e. forestry, environmental management, ecosystem research anddevelopment, land management, mines and geo-sciences, protected areas and wildlife.
Under the system, the forestry sector uses 10 prescribed formats, 8 of which deal with productionof forest products. The products covered include sawlog/veneer log, pulpwood, poles and piles,fuelwood and charcoal, lumber, veneer, plywood, blockboard, other wood-based panels and non-timber forest products. The remaining two formats focus on forestry licenses and permits, andemployment, which was included in the year 2000. The SRS follow the standard flow of reportingfrom the CENRO to the Central Office. Reports are submitted quarterly to the FMB.
Revised Price Monitoring System (RPMS), DAO 2000-55The RPMS generates data on prices of all forest products. The field offices submit reports atmonthly intervals. Data collection is done by the price monitoring units at the CENRO level andfollows the general flow of reports. Price data on log and selected non-timber forest products areused as the basis for determining charge rates for these products as provided for by Republic Act7161, otherwise known as the Forest Charges Law of 1991. Reports are submitted to the FMB.
CENRO. Prepares reports each month, quarter andsemester and submits them to PENRO on the fifteenthof each month.
PENRO. Reviews and consolidates CENRO reportsand submits them to the concerned Regional SectoralOffice on the twentieth of each month.
REGIONAL OFFICE. Reviews and consolidatesPENRO reports for submission to the concernedbureaus at the end of each month.
Secretary
Other Clients
PMD
Planningand Policy
BUREAUS and ATTACHED AGENCIES.Consolidate Regional reports and submit to the Planningand Policy Office every semester and fifteen days afterthe deadline of the Regional Offices.
Copyfurnished

241
Physical Performance Monitoring System (DAO 92-33)The Physical Performance Monitoring System (PPMS) is a monthly reporting mechanismperformance with respect to budgeted activities. The system generates data on reforestation,watershed management, CBFM, TSI, forest protection and other regular activities within thesector. The PPMS is implemented by the Central Planning Office, which prepares and publishesthe Annual Report of the DENR.
Forest Stocks Monitoring System (FSMS)The FSMS is a computer-based database and monitoring system that has been piloted in oneregion in Mindanao and will be implemented nationwide within the year. It is designed to:
• track timber harvesting operations in real-time;• facilitate monitoring of movements of timber from stump to mill;• facilitate cross-checking of timber shipments across provinces and regions; and• maintain a permanent record of the growing stock within a forest management
unit.The FSMS will provide data supporting sustainable forest management in terms of monitoringenvironmental quality, development of criteria and indicators and monitoring forest cover change.FSMS data will also provide vital inputs to DENR decision support systems such as land usemodelling and allocation, environmental impact assessments, silvicultural management systemsand operational planning and budgeting for local DENR offices. Training of staff to be involvedin system implementation from field operations to computer applications has been completed.
Secondary sources of forestry information (outside DENR)National Statistics Office (NSO)The NSO is the official source of statistics on forest products trade. The FMB collects monthlytrade data from NSO publication and carries out re-processing so that data presentation isconsistent with commodity groupings and units of measurement used in other FMB generatedstatistics. The NSO produces monthly statistical releases with a lag time of two to three monthsand usually publishes the trade statistics yearbook in the year following the reference year. Apartfrom trade statistics, the NSO collects other forestry-related data from their regular surveys andcensuses. The Annual Survey of Establishments generates data on the number of forest-basedestablishments according to size (small/medium/large), average employment by type of workerfor logging and related activities, revenues and sales, etc. The Census of Population, carried at tenyearly intervals, generates data on the number of households consuming fuelwood, and thenumber of people engaged in informal activities in forestry (e.g. hunting, fuelwood gathering,charcoal making).
National Statistical Coordination Board (NSCB)The NSCB publishes statistical yearbooks and coordinates closely with FMB to estimate GrossValue Added (GVA) in forestry and to determine the contribution of the sector to Gross DomesticProduct (GDP). Both the FMB and NSCB act as simultaneous providers and users of each other’sdata.
Department of EducationThe Department of Education keeps a record of all schools offering forestry and allied coursesand also of the number of forestry graduates.
FOREST PRODUCTS DATA COLLECTION, VALIDATION AND DISSEMINATION
Data collectionData on forestland use/forest cover are projections based on the results of the RP-German ForestResources Inventory Project of the DENR conducted between 1983 and 1988. Models weredeveloped by the project to update estimates each year. However, projections have beendiscontinued and the model is considered outdated and unrealistic; the latest available data is from1997. Currently, an assessment of the forest situation, based on a more recent study, is beingundertaken to update land-use information.

242
Information on the status of forestry projects including details of area reforested, CBFM progress,forest disturbance, forest protection, etc. are brought together from the accomplishment reportssubmitted by regional offices.
Data on production and utilisation of forest resources and the wood processing industry isobtained from periodic reports from license and permit holders monitored by the regional andfield offices. Harvesting of timber and non-timber items by communities and the private sector ismanaged by the DENR through licenses and appropriate tenurial instruments. The licensees asprovided in the terms and conditions of the license are mandated to submit monthly productionreports. Wood processing plants are also monitored by the DENR and are also mandated tosubmit monthly production reports. Standard formats are prescribed to achieve uniformity andfacilitate compilation and processing. Information extracted from these reports includes area,allowable cut and actual production of timber, production from wood processing mills and non-timber forest products production. Basic information on logging companies and processing plantsis also available from operation plans, annual concession reports, sawmill reports, etc.
Trade data, received from the National Statistics Office, are based on recorded trade transactionsfor given periods. To avoid discrepancies and inconsistencies, these data are not generated withinthe DENR. The FMB re-processes raw data so that units are consistent with those used forproduction, and commodity groupings are in accord with the desired table format. Trade dataincludes import and export of logs and processed wood products, such as sawnwood, veneer,plywood, other wood-based panels and non-timber forest products. NSO also generate otherforestry-related data through surveys and censuses.
Data on prices of forest products are based on monthly surveys of selected establishments,conducted by regional price monitoring units, usually by interviews. Included in the survey arethe prices of log, sawnwood and plywood by species, grade and size, and NTFPs such as rattan,bamboo and others.
Data on revenues, from forest charges, etc. are obtained from reports based on actual receipts ofpayment by permit/license holders, received from the regional offices.
Data validationAll data, except trade data and information coming from outside offices, are assessed forcompleteness and reliability and validated at least twice annually. Comparing the licensees’reported figure with the DENR scalers’ report allows validation of log production. The AnnualConcession Report, which contains the timber licensee’s report on past operations, is also used tocross check production data. Whenever discrepancies occur, adjustments are made to reflectofficial figures. With regard to the FSMS, inventory records of timber to be cut may serve to helpdetect irregularities in actual cutting operations.
The SRS (Forestry Sector) has a range of validation mechanisms. The use of similar formats forplanning and implementing operations allows some degree of cross checking. For example, tree-cutting permits, which indicate, among other things, volumes to be cut are checked against reportsof actual cut. If the two do not match, enquiries are made to the concerned regional office.Assessment of the timeliness and completeness of reports is regularly undertaken and serves as abasis for rating the compliance of the regional offices. Performance of regional offices, in termsof budget targets achieved, is validated annually through field visits by monitoring teams.
In the case of logs, price data are validated by comparing regional reports with sales invoices.This method is, however, ineffective since most companies do not want to disclose informationregarding business transactions. A more effective method is for validating teams to conductrandom, on the spot forest products price enquiries although telephone enquiries are sometimesresorted to when there is an immediate need for price information.
Data processing and analysisThe advent of computers has made data management considerably easier. In the Central Officeand most field offices, computers are widely used for storing, processing and analysing data. Tofacilitate management of data, tailored computer programs have been developed and are currently

243
in use in FMB. Software packages such as Excel and Access are also widely used and statisticalpackages such as MICROSTAT and SPSS are used in data analysis.
Dissemination of dataThere are several media for disseminating forestry statistics. Among these, the Philippine ForestryStatistics Yearbook has a wide distribution and is considered the official publication on forestrymatters. Data are also disseminated through fax, e-mail, and diskette upon request. Recently,forestry data has also been available through the Internet on the FMB and DENR web sites, andplans are underway to disseminate data in compact discs.
USES AND USERS OF FORESTRY STATISTICS
Several uses are made of forestry statistics, highlighting its importance in both government andprivate endeavours. Forestry data serve as vital inputs to the following:
• Planning, policy formulation and decision-making by government agenciesparticularly the forestry sector.
• Market research and analysis, preparation of feasibility studies for investments inforestry
• Research conducted by government and non-government institutions in the field offorestry.
• Estimation of the contribution of forestry to Gross Domestic Product• Public information• Business decisions in forestry companies• Other corporations, e.g. banks, in evaluating applications for forestry investments
Users of forestry statistics include the following:• Government Agencies• Department of Environment and Natural Resources (DENR)• National Economic and Development Authority (NEDA• National Statistical Coordination Board (NSCB)• Local Government• Non-government Organisations• Private companies engaged in forestry• Research institutions and Academe• Media• Other corporations (e.g. banks)
Methods of data dissemination include the yearbook, e-mail, fax and the Internet.
PRODUCTION AND TRADE OF FOREST PRODUCTS, 1996-2000
ProductionProduction of logs and wood-based products was affected by the 1991 logging ban even though itonly covers old growth and not secondary forest. The ban resulted in a reduction in the number oftimber concessions and non-renewal of expiring licenses. Concession holders with expiringlicenses are encouraged to convert their areas to comply with the Industrial Forest ManagementAgreement (IFMA), which is geared towards large-scale forest plantation development. Small-scale forest plantation development programs involving communities are likewise given prioritythrough the Socialised Industrial Forest Management Agreement (SIFMA), the Private ForestDevelopment Agreement (PFDA), and the CBFM.
As a result of the ban a greater proportion of log production is now from plantations, however,

244
production shrinkage following the ban resulted in insufficient supply of raw materials to theprocessed wood product industry. The government therefore liberalised import of wood productsto augment supplies.
The following is an analysis of the performance of the Philippine forest industry between 1996and 2000. The tables in each section show production of forest products by region from 1996 to2000.
WoodfuelNationally, woodfuel was the most widely used traditional fuel because of its low price,accessibility, convenience and the safeness of its use. The actual volume of woodfuel productionis not known since little data is reported within the existing statistical system. A Department ofEnergy study conducted in 1995 and entitled ‘1995 Household Energy Consumption Survey’revealed that only the 9.6 percent of households gathered woodfuel from government lands orforests. Data for the remaining 90.3 percent of households collecting woodfuel from their ownland or private land went unreported. The study estimated annual per capita consumption ofwoodfuel at 0.44 m3. However, since the study covered only the households, the significantproportion of woodfuel used by industries was not included. Recently, FAO estimated annual totalwoodfuel consumption per capita at 0.54 m3. Based on this figure, average annual woodfuelproduction for 1996-2000 was 39.1 million m3. Table 3 shows estimated woodfuel productionbetween 1996 and 2000.
Table 3. Woodfuel production, 1996-2000 (000s m3)Year 1996 1997 1998 1999 2000 AverageVolume 37 445 38 301 39 156 40 011 40 950 39 173
Industrial roundwoodFrom 1996 to 2000, the country produced a total of 3.5 million m3 of industrial roundwood, or anaverage of 698 000 m3 per year (Table 4). There were no significant changes in yearly productionduring the period and production rose only 4 percent. Sawlogs and veneer logs (Table 5) fromnatural forest comprised 61 percent of the total 1996-2000 production and pulpwood (Table 6),which was mostly from planted trees on private lands and tree plantations, comprised 38 percent.Other industrial roundwood (Table 7 and Table 8) constituted only 1 percent of the total industrialroundwood figure, with production averaging 7 000 m3 per year.
With respect to regional production, the Mindanao regions (Regions 11-13) and the AutonomousRegion in Muslim Mindanao (ARMM) were the leading producers of industrial roundwood. From1996 to 2000, Region 13, created in 1996 and composed of four timber-rich provinces, was themain source of industrial roundwood, producing an annual average of 519 000 m3. Its highestrecorded production, in 2000 registered 622 000 m3 and accounted for 78 percent of totalproduction for the year. From 1996 to 2000, there was a rise in the region’s production from588 000 to 621 000 m3, equivalent to 6 percent. The region was the major producer ofsawlogs/veneer logs (Table 9), which is unsurprising given that most existing timber concessionswere in this area. The second most productive region, Region 11, only produced and annualaverage of 56 000 m3 during the period, 1996 was the year of highest production with 81 900 m3.A 30 percent increase was recorded in 2000 with a volume of 64 600 m3 produced.
Regions 9, 10, 12 and ARMM were also significant contributors to industrial roundwoodproduction. Region 9 had an average annual production of 12 400 m3 from 1996 to 2000. Region10 produced a record of 63 000 m3 or 11.3 percent of the total national production in 1997.Between 1997 and 2000, however, the region experienced a decline of 79 percent, which wasmainly caused by the transfer of jurisdiction of three timber-rich provinces to the CARAGARegion or Region 13. Region 12, in contrast, increased production between 1996 and 2000 by 304percent. The ARMM recorded an impressive production performance between 1996 and 1998,with an average 47 200 m3 per year, only to fall by 14 percent in 2000. Region 2, a former leadingproducer, and Region 4, both located in the island of Luzon produced a combined average of33 000 m3 or 4.7 percent of the national total. The remaining 7.3 percent were credited to theCordillera Administrative Region (CAR) and Regions 1, 3, 5, 6, 7 and 8. Industrial roundwood

245
produced in these regions were mostly from plantation species such as Gmelina arborea andParaserianthes falcataria.
Data on ‘other industrial roundwood and specifically poles and piles, as discussed above, werebased on actual reports. However, figures are deemed underestimates considering that asignificant proportion of other industrial roundwood production is not captured, e.g. for electricitypoles. Poles are also used in rural housing, for supporting banana plants and in construction. TheMaster Plan for Forestry Development estimates that consumption of poles and local constructiontimber is 0.03 m3 per person per year. Based on this estimate, a total of almost 11 million m3 ofother industrial roundwood was produced in 1996-2000, amounting to a yearly average of2.2 million m3.
Table 4. Industrial roundwood production by region 1996-2000Production (m3)
Region 1996 1997 1998 1999 2000 Total Average
CAR 379 104 - - 648 1 131 3771 89 - 41 2 757 2 732 5 619 2 8092 8 602 10 903 11 545 16 189 17 472 64 711 13 4023 - - - 312 420 732 3674 22 855 21 454 30 997 7 207 19 569 102 082 21 8045 173 433 1 004 2 770 359 4 739 1 0116 - - - - 15 928 15 928 15 9287 - - 1 505 1 773 2 395 5 672 1 8918 1 117 - - 374 753 2 244 1 6819 1 231 18 941 5 938 18 574 17 210 61 894 13 67710 - 63 042 9 806 20 740 13 123 106 712 32 80911 81 944 43 224 38 978 49 649 64 617 278 412 63 26112 3 497 - 5 953 9 174 14 112 32 736 10 91213 588 042 339 675 464 450 583 109 621 691 2 596 966 519 393ARMM 63 393 58 141 63 580 17 542 9 058 211 713 42 343Total 771 322 555 917 633 797 730 171 800 087 3 491 294 698 259
Table 5. Sawlog/veneer log production by region 1996-2000
Production (m3)Region 1996 1997 1998 1999 2000 Total Average
CAR 379 104 648 1 131 3771 2 757 2 732 5 489 2 7442 8 602 10 903 11 545 16 189 16 897 64 136 12 8273 311 420 731 3664 18 619 21 064 30 997 7 207 19 569 97 456 19 4915 94 433 1 004 2 770 359 4 660 9326 7 453 7 453 7 4537 1 195 455 593 2 243 7488 374 753 1 127 5649 29 18 941 2 812 18 574 17 210 57 566 11 51310 2 767 30 17 222 13 123 33 142 8 28611 16 454 9 211 2 723 49 649 56 126 134 163 26 83312 3 497 8 845 11 188 23 531 7 84413 289 222 119 436 431 370 426 298 227 821 1 494 147 298 829ARMM 63 393 58 141 63 580 17 542 9 058 211 713 42 343Total 400 289 241 000 545 256 568 194 383 951 2 138 690 427 738
Table 6. Pulpwood production by region 1996-2000

246
Production (m3)Region 1996 1997 1998 1999 2000 Total Average2 575 575 5754 4 236 390 4 626 2 3135 43 43 439 1 202 3 126 4 328 2 16410 60 275 9 776 3 518 73 569 24 52311 63 096 33 826 36 255 6 677 139 854 34 96413 296 415 216 837 33 059 156 103 392 734 1 095 148 219 030Total 364 992 311 328 82 216 159 621 399 987 1 318 144 263 629
Table 7. Other industrial roundwood production by region 1996-2000
Production (m3)Region 1996 1997 1998 1999 2000 Total Average1 89 41 130 653 1 1 15 36 36 366 8 475 8 475 8 4757 310 1 318 1 802 3 429 1 1438 1 117 1 117 1 11711 2 394 187 1 814 4 395 1 46512 5 953 329 2 924 9 206 3 06913 2 405 3 402 21 708 1 135 7 671 1 534Total 6 041 3 589 6 325 2 356 16 150 34 460 6 892
Table 8. Other industrial roundwood production 1996-2000 (‘000 m3)1996 1997 1998 1999 2000 Average
Production 1 2 098 2 146 2 194 2 242 2 290 2 194Figures based on Master Plan estimates1-Regional breakdown not availableWood charcoalFAO estimated a total of 150 000 MT for the five-year period, 1996 to 2000, giving an average of30 000 MT per year. Wood charcoal ranked second only to fuelwood amongst traditional fuels inthe Philippines and is widely used for cooking and ironing, especially in rural areas.
SawnwoodThe wood-processing industry was the industry most affected by the shifts in the logging policy inthe 1990s and sawnwood produced between 1996 and 2000 used both local and imported logs.Sawnwood production declined over the period with an annual average of 265 000 m3 (Table 9).Production peaked in 1997 at 351 000 m3 and was at its lowest level in 2000 with 151 000 m3.The NCR was the top sawnwood producer with an average annual production of 72 500 m3. Dueto inadequate local wood supplies and heavy demand in the area, the NCR has been a majorimporter of industrial roundwood for sawnwood production. Region 13 occupied the secondposition among sawnwood producers with an average annual production of 71 000 m3. In 1996,Region 13 was the leading sawnwood producer with a recorded volume of 125 500 m3 or40 percent of total production for the year. However, the region’s production between 1996 and1999 fell by 73 percent, only recovering in 2000 with a volume of 62 300 m3.Region 3 is timber-deficient and highly dependent on imported logs for saw milling. However, theregion traditionally produces high volumes of sawnwood and turned out 100 000 and 80 000 m3 in1997 and 1999, respectively. Average annual production between 1996 and 2000 was 42 100 m3.Region 11 also contributed significantly to the total sawnwood production with an averageproduction of 37 400 m3 per year. The decline over most of the period was brought about by thetransfer of one timber-rich province (Surigao del Sur) from its coverage to Region 11 to13.

247
Other regions which showed declining production trends included Regions 9, 10 and 12. Region9’s 1996 production high of 11 700 m3 fell by 91 percent to 1 000 m3 in 2000. Region 10 posted a49 percent average decline in production between 1997 and 2000 and Region 12’s production slidby 84 percent from 1996 to 2000. In contrast ARMM recorded an increase of 156 percent from1 700 m3 in 1997 to 4 300 m3 in 2000. Region 4 had an average production of 13 200 m3, postinga decline of 74 percent between 1996 and 2000. Its total five-year production amounted to 65 800m3, equal to 5 percent of the national total for the period.Regions CAR, 1, 2, 5, 6 recorded a combined production of 51 300 m3 or 4 percent of the totallumber tally for the five-year period.
Table 9. Sawnwood production by region, 1996-2000Production (m3)
Region 1996 1997 1998 1999 2000 Total AverageNCR 62 849 80 830 76 195 93 823 48 984 362 681 72 536CAR 335 6 485 - - 334 7 154 2 3851 - 2 100 2 548 3 890 2 848 11 386 2 8472 2 072 8 950 3 374 1 051 1 447 16 894 3 3793 11 070 99 963 15 292 79 842 4 437 210 604 42 1214 23 186 13 357 11 867 11 241 6 116 65 767 13 1535 - - - 14 747 50 14 797 7 3996 - - - - 1 110 1 110 1 1107 - 2 126 1 112 7 532 2 289 13 059 3 2659 11 693 8 504 3 048 - 1 065 24 310 6 07810 7 800 13 386 7 458 5 468 1 274 35 386 7 07711 67 014 34 890 40 493 30 964 13 884 187 245 37 44912 1 167 - 5 077 558 183 6 985 1 74613 125 466 78 353 55 524 33 676 62 298 355 317 71 063ARMM - 1 690 - 5 525 4 332 11 547 3 849Philippines 312 652 350 634 221 988 288 317 150 651 1 324 242 264 848
Veneer sheetsProduction of veneer sheets increased during the period and peaked in 2000 with a volume of178 000 m3, almost double the 1999 figure (Table 10). The growth was mostly attributable toRegion 13, which produced 133 000 m3 or 75 percent of the total production for 2000. Onaverage, about 89 percent of veneer production between 1996 and 2000 were credited to theMindanao regions (Regions 9-13) where most of the country’s veneer plants are located. Region 9recorded a yearly decline from 11 000 m3 in 1996 to 500 m3 in 1999, followed by a remarkablerecovery to 8 800 m3 in 2000. Region 10, on the other hand, registered a significant increase froma figure of 5 896 m3 in 1996 to 17 300 in 2000. Only 11 percent of the total veneer sheetproduction for the five-year period was attributed to Regions 2, 3, 4, 7 and 12.
Table 10. Veneer sheets production by region 1996 – 2000
Production (m3)Region 1996 1997 1998 1999 2000 Total Average2 2 666 - 88 - - 2 754 1 3773 - - - 3 160 1 845 5 005 2 5034 811 - - - - 811 8117 5 528 4 027 3 310 21 245 5 212 39 322 7 8649 11 130 6 293 2 640 508 8 782 29 353 5 87110 5 869 4 678 5 876 9 690 17 292 43 405 8 68111 32 598 15 311 1 553 5 482 11 659 66 603 13 32112 1 542 - - - - 1 542 1 54213 22 045 31 307 45 413 49 148 133 292 281 205 56 241Philippines 82 189 61 616 58 880 89 233 178 082 470 000 94 000

248
PlywoodBetween 1996 and 2000 plywood production declined by 44 percent from a volume of 508 000m3 to 286 000. The operating plywood plants in the country recorded an average production of354 000 m3. Region 13 showed the highest production contributing an average of 131 000 m3 peryear. Its peak production was in 1996 with 194 300 m3 or 38 percent of the total annualproduction. ARMM shared a significant proportion of total production of plywood with a meanvolume of 120 000 m3 for 1996 and 1997, the only years in which production was recorded.Region 11 also contributed significantly to production with an average of 85 000 m3. The year2000 saw the Region’s highest production with 104 500 m3, an increment of 32.4 percent over theprevious year. Region 10 produced 47 900 m3 on average while a slump was experienced in 1998.However, production rose by 65 percent in 1999 and by a further 28 percent in 2000. Region 9had an average annual production of 23 200 m3, exhibiting a decline from 1996 to 1999 and aslight recovery in 2000.
Plywood plants in Luzon had a combined annual average production of 24 000 m3 over the five-year period with NCR only recording production during 1996 and 1997. Noticeable in Region 3’sperformance is the abrupt decline in production in 2000 with only 290 m3 produced, a 96 percentfall from the previous year. Reasons cited by plywood plant operators included a lack of woodsupply and the tight economic situation in the country. Region 4’s production rose by 86 percentin 1997 only to slide back by 1999.

249
Table 11. Plywood production by region, 1996-2000
Production (m3)Region 1996 1997 1998 1999 2000 Total AverageNCR 5 448 2 914 - - - 8 362 4 1812 4 949 7 425 3 198 - - 15 572 5 1913 3 859 9 739 8 975 7 576 290 30 439 6 0884 5 512 10 284 8 167 7 797 3 884 35 644 7 1299 27 564 32 714 27 146 13 452 15 283 116 159 23 23210 58 811 54 208 26 558 43 817 56 023 239 417 47 88311 93 958 87 097 61 953 79 105 104 755 426 868 85 37412 976 - - - - 976 97613 194 305 151 972 110 025 91 817 106 078 654 197 130 839ARMM 112 263 128 102 - - - 240 365 120 183Philippines 507 645 484 455 246 022 243 564 286 313 1 767 999 353 600
TradeFrom being a net log and lumber exporter prior to the 1980’s, the Philippines underwent acomplete turn-around and became a net importer in the 1990’s. The reversal was the result ofgovernment policy aimed at sustaining the country’s forest resource base. The policies includednot only banning log exports but also liberalising the log import market to satisfy demand. At thesame time, however, the secondary and tertiary wood processing industries experienced anupswing in exports due to government policy encouraging export of value added products.
The Philippines adopts the ‘General’ trade system for recording foreign trade statistics with thecustoms frontier also constituting the statistical frontier. All commodities are classified inaccordance with the 1993 Revised Philippine Standard Commodity Classification (PSCC). Theclassification is aligned with the United Nations Standard International Trade Classification(SITC) and the Harmonised Commodity Description and Coding System of the Philippines,otherwise known as the Harmonised System of the Philippines (HSP). Tables 12 and 13 show thevolumes and values of national exports and imports respectively. The regional breakdown is notpresented here but is available from FAO. National-level data are published in the Foreign TradeStatistics of the NSO while regional data normally only available upon request.

250
Table 12. Summary of import of forest products (1996-2000)1996 1997 1998 1999 2000 Total Average
Commodity Units Volume Value1 Volume Value Volume Value Volume Value Volume Value Volume Value Volume Value
Roundwood 1000 m3 878 127 413 768 117 821 435 54 875 584 69 450 585 54 341 3 250 423 900 650 84 780
Woodfuel inc. wood for charcoal 1000 m3 0 0 0 0 0 0 0 0 0 0 0 0 0 0
Industrial Roundwood 1000 m3 878 127 413 768 117 821 435 54 875 584 69 450 585 54 341 3 250 423 900 650 84 780
Coniferous 1000 m3 102 13 880 103 16 354 11 2 114 26 7 327 41 3 844 283 43 520 57 8 704
Non-coniferous 1000 m3 776 113 533 665 101 467 424 52 761 558 62 123 543 50 497 2 966 380 381 593 76 076Wood charcoal 1000 mt <1000 9 <1000 16 <1000 12 <1000 36 <1000 59 <1000 132 <1000 26Wood Chips and particles 1000 gk 1 5 <1000 1 2 827 167 3 371 1 365 15 467 2 023 21 666 3 561 4 333 712Wood Residues 1000 nk 486 110 644 158 316 92 444 130 339 102 2 229 592 446 118
Sawnwood 1000 m3 567 161 691 411 112 492 296 71 188 381 116 239 359 79 800 2 014 541 409 403 108 282
Coniferous 1000 m3 78 43 751 60 19 321 28 15 449 46 15 904 46 16 548 258 110 973 52 22 195
Non-coniferous 1000 m3 489 117 940 351 93 171 268 55 738 335 100 335 313 63 252 2 245 430 436 449 86 087
Wood-based panels 1000 m3 273 71 272 259 70 510 179 43 002 305 72 572 264 59 298 1 280 316 653 256 63 331
Veneer Sheets 1000 m3 104 32 154 100 33 348 69 19 487 146 43 761 122 33 827 541 162 576 108 32 515
Coniferous 1000 m3 26 10 930 21 8 981 6 2 460 8 3 373 15 4 523 75 30 267 15 6 053
Non-coniferous 1000 m3 78 21 224 79 24 367 63 17 027 139 40 388 108 29 304 466 132 309 93 26 462
Plywood 1000 m3 11 6 907 12 8 535 5 4 283 5 3 371 5 3 728 38 26 824 8 5 365
Coniferous 1000 m3 10 6 122 12 8 280 5 4 234 5 3 275 4 3 540 36 25 451 7 5 090
Non-coniferous 1000 m3 <1000 785 1 255 <1000 48 <1000 96 <1000 188 1 1 372 <1000 274
Particleboard 1000 m3 36 7 735 41 8 716 22 4 597 29 5 408 29 5 523 157 31 979 31 6 396
Fibreboard 1000 m3 122 24 476 106 19 911 83 14 635 125 20 032 108 16 220 544 95 274 109 19 055
Hardboard 1000 m3 29 6 422 23 5 260 12 3 218 12 2 188 5 1 048 81 18 136 16 3 627
MDF 1000 m3 49 13 901 68 11 822 67 10 512 108 17 191 94 14 241 386 67 667 77 13 533
Insulating Board 1000 m3 44 4 153 15 2 829 4 905 5 653 9 931 77 9 471 15 1 894Wood Pulp 1000 mt 106 57 222 104 55 407 88 42 528 79 42 164 65 42 370 442 239 691 88 47 938Mechanical 1000 mt 4 2 079 3 3 788 1 464 6 2 259 5 2 863 20 11 453 4 2 291Semi-chemical 1000 mt 14 5 016 3 1 028 3 976 1 248 1 666 22 7 934 4 1 587Chemical 1000 mt 88 50 118 98 50 578 84 41 088 72 39 657 58 38 657 400 220 098 80 44 020Sulphate unbleached 1000 mt 4 2 472 6 2 459 3 1 154 10 4 127 10 4 984 33 15 196 7 3 039
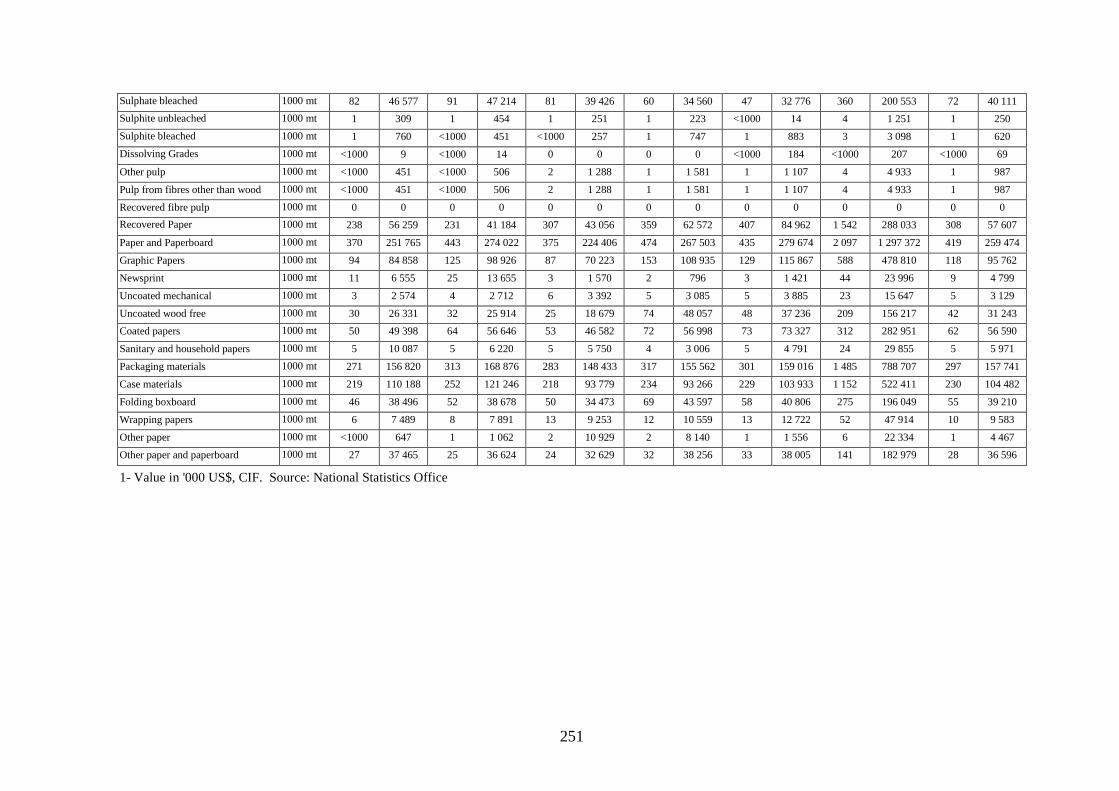
251
Sulphate bleached 1000 mt 82 46 577 91 47 214 81 39 426 60 34 560 47 32 776 360 200 553 72 40 111Sulphite unbleached 1000 mt 1 309 1 454 1 251 1 223 <1000 14 4 1 251 1 250Sulphite bleached 1000 mt 1 760 <1000 451 <1000 257 1 747 1 883 3 3 098 1 620Dissolving Grades 1000 mt <1000 9 <1000 14 0 0 0 0 <1000 184 <1000 207 <1000 69
Other pulp 1000 mt <1000 451 <1000 506 2 1 288 1 1 581 1 1 107 4 4 933 1 987
Pulp from fibres other than wood 1000 mt <1000 451 <1000 506 2 1 288 1 1 581 1 1 107 4 4 933 1 987
Recovered fibre pulp 1000 mt 0 0 0 0 0 0 0 0 0 0 0 0 0 0Recovered Paper 1000 mt 238 56 259 231 41 184 307 43 056 359 62 572 407 84 962 1 542 288 033 308 57 607
Paper and Paperboard 1000 mt 370 251 765 443 274 022 375 224 406 474 267 503 435 279 674 2 097 1 297 372 419 259 474
Graphic Papers 1000 mt 94 84 858 125 98 926 87 70 223 153 108 935 129 115 867 588 478 810 118 95 762
Newsprint 1000 mt 11 6 555 25 13 655 3 1 570 2 796 3 1 421 44 23 996 9 4 799
Uncoated mechanical 1000 mt 3 2 574 4 2 712 6 3 392 5 3 085 5 3 885 23 15 647 5 3 129
Uncoated wood free 1000 mt 30 26 331 32 25 914 25 18 679 74 48 057 48 37 236 209 156 217 42 31 243Coated papers 1000 mt 50 49 398 64 56 646 53 46 582 72 56 998 73 73 327 312 282 951 62 56 590
Sanitary and household papers 1000 mt 5 10 087 5 6 220 5 5 750 4 3 006 5 4 791 24 29 855 5 5 971
Packaging materials 1000 mt 271 156 820 313 168 876 283 148 433 317 155 562 301 159 016 1 485 788 707 297 157 741
Case materials 1000 mt 219 110 188 252 121 246 218 93 779 234 93 266 229 103 933 1 152 522 411 230 104 482
Folding boxboard 1000 mt 46 38 496 52 38 678 50 34 473 69 43 597 58 40 806 275 196 049 55 39 210
Wrapping papers 1000 mt 6 7 489 8 7 891 13 9 253 12 10 559 13 12 722 52 47 914 10 9 583
Other paper 1000 mt <1000 647 1 1 062 2 10 929 2 8 140 1 1 556 6 22 334 1 4 467Other paper and paperboard 1000 mt 27 37 465 25 36 624 24 32 629 32 38 256 33 38 005 141 182 979 28 36 596
1- Value in '000 US$, CIF. Source: National Statistics Office

252
Table13. Summary of export of forest products (1996-2000)1996 1997 1998 1999 2000 Total Average
Commodity Units Volume Value1 Volume Value Volume Value Volume Value Volume Value Volume Value Volume Value
Roundwood 1000 m3 0 0 4 266 0 0 <1000 4 <1000 16 4 286 1 95
Woodfuel inc. wood for charcoal 1000 m3 0 0 0 0 0 0 0 0 0 0 0 0 0 0
Industrial Roundwood 1000 m3 0 0 4 266 0 0 <1000 4 <1000 16 4 286 1 95
Coniferous 1000 m3 0 0 4 266 0 0 0 0 <1000 16 4 282 2 141
Non-coniferous 1000 m3 0 0 0 0 0 0 <1000 4 0 0 <1000 4 <1000 4
Wood charcoal 1000 mt 43 10 700 44 12 529 41 10 105 31 7 484 30 7 471 189 48 289 38 9 658
Wood chips and Particles 1000 gk 0 0 0 0 0 0 0 0 0 0 0 0 0 0
Wood Residues 1000 nk 739 518 782 503 702 449 753 469 1 213 517 4 189 2 456 838 491
Sawnwood 1000 m3 145 23 196 142 21 852 41 5 543 69 8 739 120 20 457 517 79 787 103 15 957
Coniferous 1000 m3 56 9 195 38 4 877 2 879 <1000 55 0 0 96 15 006 24 3 752
Non-coniferous 1000 m3 89 14 001 104 16 975 39 4 664 69 8 684 120 20 457 510 78 781 102 15 756
Wood-based panels 1000 m3 41 18 420 49 21 185 40 14 095 18 7 031 16 7 067 164 67 798 33 13 560
Veneer Sheets 1000 m3 26 12 856 31 14 396 33 11 857 5 3 055 5 3 131 100 45 295 20 9 059
Coniferous 1000 m3 <1000 26 <1000 350 <1000 187 1 310 <1000 86 <1000 959 <1000 192
Non-coniferous 1000 m3 26 12 830 31 14 046 32 11 670 4 2 746 5 3 045 98 44 337 20 8 867
Plywood 1000 m3 12 4 507 14 5 164 7 1 987 12 3 756 11 3 859 56 19 273 11 3 855
Coniferous 1000 m3 <1000 29 <1000 152 <1000 78 1 578 3 2 593 4 3 430 1 686
Non-coniferous 1000 m3 12 4 478 14 5 012 6 1 909 11 3 178 8 1 266 64 20 230 13 4 064
Particleboard 1000 m3 2 1 057 4 1 617 <1000 251 1 220 <1000 77 7 3 222 1 644
Fibreboard 1000 m3 0 0 <1000 8 0 0 0 0 0 0 <1000 8 <1000 8
Hardboard 1000 m3 0 0 0 0 0 0 0 0 0 0 0 0 0 0
MDF 1000 m3 0 0 0 0 0 0 0 0 0 0 0 0 0 0
Insulating Board 1000 m3 0 0 <1000 8 0 0 0 0 0 0 <1000 8 <1000 8
Wood Pulp 1000 mt <1000 51 <1000 160 <1000 194 <1000 49 <1000 138 <1000 592 <1000 118
Mechanical 1000 mt 0 0 0 0 0 0 0 0 0 0 0 0 0 0
Semi-chemical 1000 mt 0 0 0 0 0 0 0 0 <1000 6 <1000 6 <1000 6
Chemical 1000 mt <1000 51 <1000 160 <1000 194 <1000 49 <1000 132 <1000 586 <1000 117
Sulphate unbleached 1000 mt 0 0 0 0 0 0 0 0 0 0 0 0 0 0
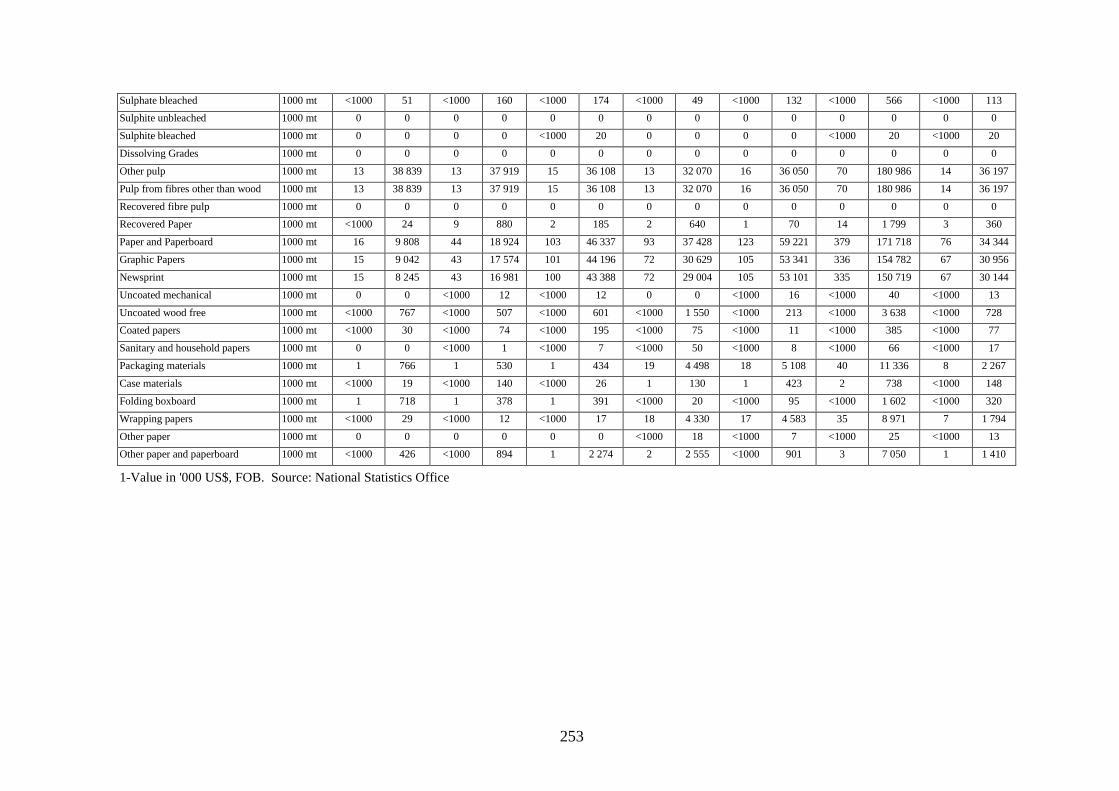
253
Sulphate bleached 1000 mt <1000 51 <1000 160 <1000 174 <1000 49 <1000 132 <1000 566 <1000 113Sulphite unbleached 1000 mt 0 0 0 0 0 0 0 0 0 0 0 0 0 0
Sulphite bleached 1000 mt 0 0 0 0 <1000 20 0 0 0 0 <1000 20 <1000 20
Dissolving Grades 1000 mt 0 0 0 0 0 0 0 0 0 0 0 0 0 0
Other pulp 1000 mt 13 38 839 13 37 919 15 36 108 13 32 070 16 36 050 70 180 986 14 36 197
Pulp from fibres other than wood 1000 mt 13 38 839 13 37 919 15 36 108 13 32 070 16 36 050 70 180 986 14 36 197
Recovered fibre pulp 1000 mt 0 0 0 0 0 0 0 0 0 0 0 0 0 0Recovered Paper 1000 mt <1000 24 9 880 2 185 2 640 1 70 14 1 799 3 360
Paper and Paperboard 1000 mt 16 9 808 44 18 924 103 46 337 93 37 428 123 59 221 379 171 718 76 34 344
Graphic Papers 1000 mt 15 9 042 43 17 574 101 44 196 72 30 629 105 53 341 336 154 782 67 30 956
Newsprint 1000 mt 15 8 245 43 16 981 100 43 388 72 29 004 105 53 101 335 150 719 67 30 144
Uncoated mechanical 1000 mt 0 0 <1000 12 <1000 12 0 0 <1000 16 <1000 40 <1000 13
Uncoated wood free 1000 mt <1000 767 <1000 507 <1000 601 <1000 1 550 <1000 213 <1000 3 638 <1000 728Coated papers 1000 mt <1000 30 <1000 74 <1000 195 <1000 75 <1000 11 <1000 385 <1000 77
Sanitary and household papers 1000 mt 0 0 <1000 1 <1000 7 <1000 50 <1000 8 <1000 66 <1000 17
Packaging materials 1000 mt 1 766 1 530 1 434 19 4 498 18 5 108 40 11 336 8 2 267
Case materials 1000 mt <1000 19 <1000 140 <1000 26 1 130 1 423 2 738 <1000 148
Folding boxboard 1000 mt 1 718 1 378 1 391 <1000 20 <1000 95 <1000 1 602 <1000 320
Wrapping papers 1000 mt <1000 29 <1000 12 <1000 17 18 4 330 17 4 583 35 8 971 7 1 794
Other paper 1000 mt 0 0 0 0 0 0 <1000 18 <1000 7 <1000 25 <1000 13Other paper and paperboard 1000 mt <1000 426 <1000 894 1 2 274 2 2 555 <1000 901 3 7 050 1 1 410
1-Value in '000 US$, FOB. Source: National Statistics Office

Industrial roundwoodExports
The 1986 log export ban prevented export of industrial roundwood from natural forest butallowed export of plantation grown wood. During the 1996-2000 period, a total of 4 000 m3 ofindustrial roundwood from plantations were exported, valued at US$286 000. The bulk of thiswas exported to Taiwan from Region 13 while the rest was from Regions 10 and the NCR. Japanalso received a small quantity of exports.
Imports
The logging ban in old growth forest created a stir in the wood processing industry as local supplycould not meet demand; as a result, wood importation was liberalised. Industrial roundwoodimports, particularly sawlogs and veneer logs, continued to form a large part of total nationalimports in the 1990s. From 1996 to 2000, a total of 3.2 million m3, valued at US$424 million,were imported, giving an average annual figure of 650 000 m3. Imports reached their peak in 1996at 878 000 m3 and their lowest level in 1998 with 435 000 m3. Import volumes for 1999 and 2000were the same at 585 000 m3 although the value for 2000 was lower by 22 percent. About 91percent of imported industrial roundwood was non-coniferous. The main supplying countrieswere Indonesia, Malaysia, Papua New Guinea, New Zealand and Brazil. The NCR, wherenumerous wood processing plants were located, was the leading importer with an annual averagevolume of 243 000 m3, which equated to almost 37 percent of the national average over the five-years. Following NCR, Regions 13 and 11 each received 22 percent of the total imports.
Wood charcoalExports
Wood charcoal exports declined between 1996 and 2000 with a peak in 1997 of 44 000 m3 MTdeclining to 30 000 MT in 2000. Region 11 was the major exporter of wood charcoal, with30 percent of the total, followed by Regions 10 and NCR with 29 and 26 percent, respectively.
Imports
Between 1996 and 2000 the country imported less than 1000 MT of wood charcoal worthUS$132 000. An average of US$26 000 were spent on wood charcoal imports.
Wood chips and particlesImports
Wood chips and particles imports increased in volume between 1998 and 2000, from 2.8 million kgin 1998 to 15.5 million in 2000. The NCR and Region 13 were the leading importers of the product.
Wood residuesExports
Wood residues were a consistent dollar earner with an average export volume of 838 000 kgamounting to US$491 000. Highest recorded export of the product was in 2000 at 1.2 millionkilograms. Export volumes were steady from 1996 to 1999, and then rose from 753 000 to1.2 million in 2000. The increase in value, however, was not so significant, from US$469 000 toUS$517 000, due to the depressed price of wood residues in 2000. Region 7 was the leadingexporter of wood residues with an average volume of 627 000 kg and value of US$376 000. TheNCR was second with an average export volume of 139 000 kg and value of US$104 000.Regions 10 and 11 had a combined average export volume of 161 00 kg worth US$53 000.
Imports
A total of 2.2 million kg of wood residues were imported between 1996 and 2000 amounting to446 000 kg or US$118 000 per year. From 486 000 kg in 1996, wood residue imports fell to339 000 kg in 2000, a decline of 40 percent. The NCR was the largest importer of the productaccounting for 93 percent of the total; imports for Regions 3 and 4 were minimal.

144
SawnwoodExports
Between the 1960s and 1980s, sawnwood, together with industrial roundwood, were the topexports. The 1990s saw a sudden drop in the export of sawnwood due to the 1989 lumber exportban. Only sawnwood from plantation species and imported logs were subsequently allowed forexport. From 1996 to 2000, a total volume of 516 000 m3, or an annual average of 103 000 m3,were exported. Total value realised was US$80 million or an annual average revenue ofUS$16 million. In 1998, exports slid by 71 percent from the 1997 level. Recovering from theslump, annual growth increments of 68 and 74 percent were achieved in 1999 and 2000,respectively. Taiwan has been the major market for Philippine sawnwood for the past years.Approximately 81 percent of the total sawnwood exports for the five-year period were non-coniferous.
From 1996 to 2000, the NCR was the top exporter of sawnwood with a total export volume of393 000 m3, valued at US$61 million. Both the volume and the value constituted 76 percent ofthe national total. Region 10 was second largest exporter with 80 000 m3, valued at US$12 million.Regions 4, 7, 11, 12 and 13 also exported small amounts of sawnwood.
Imports
Sawnwood imports have contributed greatly to meeting demand, especially in the metropoliswhere demand is especially high. A total of 2 million m3 of sawnwood, worth US$541 million,were imported between 1996 and 2000 with imports peaking in 1996 at 567 000 m3. In 1997,import fell by 28 percent to 412 000 m3, a level more or less maintained up to 2000. About87 percent of the lumber imported was non-coniferous, coming mostly from Malaysia and Brazil.The USA and New Zealand were the main suppliers of coniferous sawnwood. As expected, theNCR imported the largest volume taking 77 percent of the total for the period. Region 7 imported9 percent followed by Regions 4 and 10 with a combined share of 10 percent.
Veneer SheetsExports
Export of veneer sheets totalled 100 000 m3 over the five years, amounting to US$45 million,with 1997 and 1998 the peak years with an average volumes of 32 000 m3. Between 1998 and1999 an 85 percent downswing in volume was recorded but there was no further change in 2000.Non-coniferous veneers accounted for almost all national exports. Region 12 was the top exporterwith a total volume of 56 000 m3 or 56 percent of the national total. 1998 saw the region’s peakexport year with 28 000 m3 or 48 percent of the national total for the year, however, the region didnot export in the following year. The second largest exporter was ARMM with 22 000 m3
amounting to US$11 million or 22 percent of total veneer sheet exports between 1996 and 2000.Other regions exporting small amounts of veneer were the NCR and Regions 7,10, 11 and 13.Australia and China were the main importers of Philippine veneer sheets.

145
Imports
Over the five years, a total volume of 541 000 m3 of veneer with a value of US$162 million wereimported. A drop of 34 percent in 1998 was followed by a recovery of 112 percent in 1999 andthen a slide of 16 percent in 2000. Non-coniferous veneer sheet constituted 86 percent of importsfor the period. The NCR imported the largest volume with 54 percent of the total followed byRegion 10 with 23 percent. Regions 3, 4, 7, 9, 11, 12 and 13 imported smaller volumes. Malaysiawas the primary supplier of veneer sheets to the Philippines.
PlywoodExports
Between 1996 and 2000, plywood was not a significant export for the Philippines. The totalvolume for the period was only 56 000 m3, valued at US$19 million (annual average of 11 000 m3/US$4 million). Almost 93 percent of plywood exports were non-coniferous. Region 13 was thetop exporter with 21 000 m3 for the period, valued at US$8 million. Next was Region 10, whichexported 20 000 m3 over the five years, worth US$5 million. The other regions such as the NCR,and Regions 2, 7 and 11 shared a small proportion of plywood exports. Taiwan and Japan werethe major markets for plywood from the Philippines.
Imports
Traditionally, the Philippines has been relatively self sufficient in meeting local plywood demand,and during the five-year period imported only 38 000 m3 worth US$27 million. 95 percent of thatimported was coniferous. The NCR and Region 4 where the most urbanised cities are locatedwere the leading importers of plywood. The country bought plywood mainly from Malaysia.
Particle boardExports
The country exported a total of 7 000 m3 of particle board between 1996 and 2000, amounting toUS$3 million. Region 10 exported the largest volume averaging 1 000 m3 per year, worthUS$381 000. Region 10’s highest export volume, which equalled almost 52 percent of thenational total for the year, was in 1997 (3 000 m3, US$850 000). Region 13 exported about 1 000 m3
or 20 percent of the national total the five year period. The NCR and Region 7 exported in smallamounts worth US$31 000. Taiwan and Japan were the leading markets for particleboard.
Imports
Imports of particleboard were consistently maintained during the period with a total volume of157 000 m3 valued at US$32 000. Region 1 was the leading importer of particleboard with48 percent followed by Region 4 with 43 percent.
FibreboardExports
The Philippines exported fibreboard only in 1997. The volume was less than 100 m3 and the valueUS$8 000, the importer was Taiwan.
Imports
A total volume of 544 000 m3 of fibreboard worth US$95.3 million was imported between 1996and 2000. Medium density fibreboard (MDF) was the most sought after among all fibreboardswith imports totalling of 435 000 m3 worth US$67.7 million, (71 percent of the total fibreboardimports). Hardboard imports totalled 81 000 m3 (15 percent), while insulating board accounted for14 percent of imports. The NCR was the major importer of the three types of fibreboard

146
(73 percent of the total) followed by Region 7 (22 percent). Taiwan, Macau, Malaysia andIndonesia were the major suppliers of fibreboard to the country.
Wood pulpExports
Wood pulp exports totalled less than one thousand MT over the five year period and were worthUS$592 000. The NCR was the leading exporter of these products taking almost 87 percent of thetotal volume exported. Thailand and Singapore were the major markets for wood pulp andrecovered paper from the Philippines.
Imports
Among the wood pulps imported during the period under review, chemical sulphate bleached pulpwas the biggest in terms of volume and value. A total volume of 360 000 MT worth US$201million was. Over the five years imports declined at an annual average of 26 percent. The NCRtook the bulk of imports with 96 percent; Regions 3, 4, 11 and 13 shared the remainder. Thechemical sulphate unbleached pulp imported by the NCR came a far second with a total volumeof 38 000 MT, valued at US$17.6 million. Chemical sulphite bleached and unbleached pulps hada combined five-year import total of 8 000 MT or US$4.3 million.
Other pulpExports
About 99 percent of pulp exported by the Philippines was non-wood pulp from bagasse, ricestraw, etc. Total other pulp exported was 70 000 MT, worth US$181 million or an average of14 000 MT per year with a value of US$36 million. The NCR exported about 89 percent of thetotal the rest, in minimal amounts, came from Regions 3, 4, 5, 7, 10 and 11.
Imports
The country, mostly the NCR and Region 13, also imported other pulp, with a combined record of4 000 MT worth US$4.6 million. Import of other pulp exhibited a significant upswing of538 percent in 1998 but slowed in 2000 by 56 percent.
Recovered paperExports
Recovered paper was exported with a five-year total of 14 000 MT valued at US$1.8 million. TheNCR was the major exporter to the tune of 14 000 MT or 95 percent of the total, amounting toUS$1.7 million. The highest recorded recovered paper exportation was in 1997 with a weight of9 000 MT, giving total foreign exchange earnings of US$880 000.
Imports
A total of 1.5 million MT of recovered paper, valued at US$288 million, were imported, mostlyby the NCR. The imports were mostly from Indonesia, New Zealand, USA, Canada and SouthAfrica.

147
Paper and paperboardExports
Among paper products, newsprint was the leading export. A total of 335 000 MT of newsprintwere exported, earning a total revenue of US$151 million or an average of 67 000 MT per annum.The NCR, where most of the paper mills were located exported 99 percent of the five-year totalwith 333 000 MT. Regions 3, 4, 11 and 12 shared the other 1 percent. Neighbouring Asiancountries, such as China, Thailand, Singapore, Hong Kong, etc. were the major destinations fornewsprint. The uncoated wood free paper was also a consistent export with a total volume of lessthan 1 000 MT worth US$3.6 million, mostly dominated by the NCR. The uncoated mechanicaland the coated papers, again from the NCR, gained total export earnings of US$425 000. Sanitaryand household paper exports were minimal with an average value of US$17 000 for the five-yearperiod.
Among the packaging materials, wrapping papers registered the greatest export quantity at 35 000 MT,amounting to US$9 million. Exports were again dominated by the NCR. The five-year period sawsignificant growth in export of this product group from less than 100 MT to 17 000 MT in 2000.The other paper and paperboard, not elsewhere specified, was also exported at an average ofaround 1 000 MT per year; the NCR dominated export of these products.
Imports
Paper and paperboard products occupied the top slot among national forest-based imports duringthe five-year period and had the largest requirement in terms of financial outlay. From 1996 to2000, a total volume of 2.1 million MT of paper and paperboard products, worth US$1.3 billion,were imported, giving annual averages of 419 000 MT and US$259 million. Packaging materials,of which case materials constituted the bulk, had the highest import total with 1.5 million MT,amounting to US$789 million. The NCR shared 40 percent and Region 11, 27 percent of totalcase materials imports. 588 000 MT of graphic papers were imported over the five year period,with a total value of US$479 million. Coated papers constituted the greatest proportion with312 000 MT followed by uncoated wood free paper with 209 000 MT. Other paper andpaperboard had a total volume of 141 000 MT worth US$183 million. The NCR recorded thehighest import for all paper and paperboard products. Thailand, Japan, Taiwan, USA, Korea,Netherlands and New Zealand were the major suppliers of these products to the Philippines.
THE RELIABILITY OF FOREST PRODUCTS DATA
Production data are based on administrative reports produced by the DENR Regional Offices’ aspart of their monitoring and regulatory functions. These data are reported in accordance with theDENR Statistical Reporting System (SRS) and are compiled from reports of licensees and permitholders from the community and the private sector. To generate reliable data, existingmethodologies under the system are regularly reviewed and updated to reflect changes in theforestry sector. The system prescribes standard formats to facilitate data compilation and analysis.There are eight prescribed formats to collect information on monthly production of forest productsnamely: log, lumber, veneer, plywood, particleboard, fibreboard, blockboard and the non-timberforest products. These forms are regularly reviewed and revised to take note of policy changesaffecting production of forest products and user’s feedback, etc. The present forms are adequatefor stakeholder’s information needs, such as production volume, species and type of forest andtype of license, in the case of logs. The data are validated once a year prior to analysis anddissemination.
Regarding other sources of production data, the Forest Stocks Monitoring System (FSMS) canfunction complementarily with the SRS. To facilitate compilation of reports, user-friendlycomputer programs have been developed to minimise errors in data processing.
Furthermore, submission of reports has improved considerably with the adoption of a ratingsystem that gives incentives to the best performing regions. Annual assessment of the timelinessand completeness of reports is undertaken through dialogue with the field personnel. Thus, thesystem is well rated in terms of coverage.

148
Although there are still one or two regions that are remiss in submission of reports, the overalldegree of compliance to the system is highly satisfactory. Overall, production data for most forestproducts have the same high level of reliability. The only exceptions are woodfuel, otherindustrial roundwood and wood charcoal, where data capture is incomplete. It is a known factthat the greater part of woodfuel production is unreported as it is collected by households forhome use from private lands. Wood charcoal and other industrial roundwood are also mostlysourced from private lands and unreported.
The FMB has no control over the generation of trade data since the NSO is the sole agencymandated to compile foreign trade statistics. Trade data are based on import and exportdocuments submitted to the Bureau of Customs, as required by law. There are several copies ofthese documents one of which goes to the NSO for compilation. Data processing is done usingcomputers and comprises several stages: coding, code verification, computation and computationverification. Quality control of coding and computations is through sample verification. Toimprove the quality of their work, processors are given continuous training on systems operation.From the basis of the methodologies used for compilation, trade data are assessed as beingreliable. However, the presence of illegal trade cannot be discounted, and hence, in someinstances, there may be discrepancies when comparing data between countries.
WEAKNESSES AND CONSTRAINTS IN THE FOREST PRODUCTS STATISTICAL
SYSTEM
Notwithstanding the capability of the present statistical systems to produce information, there isconsiderable room to improve the efficiency and cost-effectiveness of the system. Constraints onthe statistical system are outlined in the following sections.
Fragmented Information SystemsA glaring weakness in the current forest statistics set-up is that there is no single informationsystem covering all DENR data. The system is characterised by small, activity-focusedapplications and data compilation is slowed by the need to go from one concerned office toanother. Furthermore data generated by the different applications are often conflicting anddifficult to reconcile.
GIS systems developed and maintained in the Central Office are also fragmented and non-complimentary. Different offices/units within the DENR generate their own digitised data, whichoften results in overlapping and conflicting statistics.
FundingFunding is a perennial constraint in data collection, especially in the field offices where funds areinsufficient to allow regular monitoring. Data gathering and monitoring are therefore usuallyderivative of other activities and thus have low priority. Lack of funds also curtails monitoring inremote areas and thus affects timely submission of reports. Additionally, some data, such as thosecollected through forest inventory, are rather costly to generate (Durst and Enters, 2001). This hasresulted in there having been only two nation-wide forest inventories in the Philippines since1965, the latest having been conducted with German Government assistance in 1988.
Though data processing and analysis are generally facilitated by the use of computers in CentralOffice, some field offices still have not acquired computers and GIS equipment due to fundingconstraints. Others have computers but in insufficient numbers to service all computing needs.
Skills and trainingInadequate skill in data collection and analysis greatly affect the generation of reliable statistics,especially in field offices. Training in the use of computer applications is not regularly extendedto statistical personnel and, in some instances when training is conducted, personnel attending arenot necessarily from the statistical units.
In the Central Office, the Forest Economics Division of the FMB is the central repository offorestry statistics and provides IT assistance to the Director. There is, however, inadequatesupport for systems development in terms of training and skills enhancement for such activities.

149
Personnel turnoverIn the field offices, statistical systems are beset by problems related to the rapid turnover ofstatistical staff due to the absence of permanent positions. There are not permanent statistical unitsin the lower organisational levels and the ad hoc units created in 1989 are mostly ineffective dueto high staff turnover. Personnel assigned to statistical work are often hired temporarily or holdpermanent positions but have multiple assignments. Furthermore, when personnel move from apost, replacements are usually not trained in statistical work and thus continuity is affected.
Low regard for statisticsThere is a general perception that statistical work is of less important than other activities. Thismay result from a lack of understanding of the reasons for data collection and how data can beused to assist in fulfilling various mandated activities. At present, statistics are collected for thesake of compliance with orders and little regard is paid to the quality of data being generated.
RECOMMENDATIONS
The current forestry statistical system has improved greatly over recent years with the advent andspread of information technology. However, there are still problems that continue to adverselyaffect generation of reliable and timely forestry statistics. These problems may be addressed bythe following:
• Adoption of a single comprehensive information system that captures allinformation requirements for the forestry sector and development of systematicdata collection, processing and analysis procedures. A proposal entitled ‘ForestryStatistical Information System’ (FSIS) addressing this concern was prepared bythe Forest Economics Division of the Forest Management Bureau. The FSIS hasbeen approved by the International Timber Trade Organisation (ITTO) forimplementation this year.
• Provision of additional computers to field offices, especially the CENROs, shouldbe given priority since they are the main data collecting units in DENR. Thiswould support Central Office efforts to automate data management.
• Adequate funds and logistics should be allocated to statistical activities to achievetimely delivery of reliable statistics.
• Creation of permanent statistical positions in the field offices, specifically in theCENROs, and integrating legitimate statistical unit into the organisationalstructure.
• Training of statistical personnel in data collection, processing and analysis andcomputer use. Orientation of statistical personnel to raise levels of awareness ofthe uses and applications of statistics.

150
REFERENCES
Durst, P. & Enters, T., 2001. Ten Reasons Why We Know Less about Forestry in Asia Than WeShould. In Forest Policies and Forest Policy Reviews, Enters T. and Leslie R.N. (eds.)Workshop Proceedings No. 2, EC-FAO Partnership Programme. Food and AgricultureOrganization of the United Nations, Bangkok. pp. 19-25.
Department of Energy. 1995. 1995 Household Energy Consumption Survey, Metro Manila.Forest Management Bureau. 1990. The Master Plan for Forestry Development, Main Report,
Quezon City, Philippines, 1990.Forest Management Bureau. 2000. The Philippine Forestry Statistics, 2000, Quezon City.Forest Management Bureau. 2001. Thrusts and Policy Directions, The Philippine Forestry Sector,
2001-2008 and Beyond 2008, Quezon City.National Statistics Office. Unpublished Trade Statistics, 1991-2000. Manila.National Statistical Coordination Board. 1999. Philippine Statistical Yearbook, City of Makati.

151
National forest products statistics, Sri Lanka
IntroductionThe island state of Sri Lanka, which lies between 5°55’-9°50’ North and 79°42’-81°55’ East,covers an area of 65 525 km2 (including inland water bodies) and is characterised byheterogeneous vegetation types reflecting topographic variability and other environmental factors.Sri Lanka is a densely populated country with a population in 2001 of 19.3 million, giving anaverage population density of 294 persons/km2. Sri Lanka’s geography comprises a highlandmassif in the south centre of the island surrounded by an intermediate zone of upper ridges andlow valleys and an outer region of lowlands extending to coastal areas. Precipitation variesaccording to locality with the central highlands and the south-western lowlands receiving up to5 000 mm per year and the eastern and northern parts up to 3 500 mm. Certain pockets in thenorthwest and southeast receive well below 1 500 mm.
The contribution of the forestry sector to the national economy in 2000 was estimated at1.6 percent of Gross National Product and the total manpower employed in the forestry and woodindustry amounted to about 170 000. In 1992 annual timber demand of the country was estimatedat 1 million m3, with an annual growth of 4 percent.
Natural forestsNatural forest cover has been assessed over the last five decades by aerial surveys and morerecently by satellite remote sensing. As in most developing countries, a reduction in cover hasbeen observed. Assessments in 1951 and 1994 indicated dense natural forest cover at 44 percentand 24 percent37 respectively. Forest cover details are shown in Table 1.
Table 1. Extent of natural forests in Sri Lanka by forest type in 1994Forest category Precipitation (mm) Elevation (m) Area (ha) percent of land
areaMontane forests >1800 >1500 3 108 0.05Sub-montane forests >1800 >1000 68 838 1.04Lowland rain forests >2500 <1000 14 549 2.14Moist monsoon forests 1800-2500 <1000 243 877 3.68Dry monsoon forests <1800 <1000 1 094 287 16.54Riverine forests - - 22 411 0.34Mangrove forests - Sea level 8 687 0.13Sparse forests - - 463 842 7.01Total 1 919 599 30.93
Source: The Administration Report of the Conservator of Forests-2000The GOSL imposed a suspension of tree harvesting from natural forests in 1989. Tree extractionfrom natural forests is therefore limited to occasional clearing of areas for development work.
Forest plantationsData on the extent of planted forests shows considerable variation according to source. Officialstatistics of the FD (Administration Report of the Conservator of Forests, 1999) indicate a total of135 623 ha, whereas, the forest inventory database (FORDATA), maintained by the ForestInventory & Management Division in the Forest Department, show 76 469 ha. The majority of theforest plantations, except for those in the northern and eastern provinces have been mapped andinventoried (see Appendix 1).
Forestland ownershipThe total area for timber production in Sri Lanka falls into different ownership categories 3730.9 percent including sparse forests.

152
described in this section and detailed in Appendix 2. The total extent of timber producing forestlands amounts to 109 170 ha and the extent of timber producing non-forestlands has beenestimated at 1.4 million ha. Forest lands in the country fall into different ownership ormanagement categories as described in the following sections.
Forestlands administered by the Forest Department and the Department of WildlifeConservation
Extents of forestlands administered by the FD and DWLC are shown in Table 2.
Table 2. Forestlands administered by the FD and DWLCExtent (ha)Agency Designation No.
Declared 1994 figure1994 as percent of total
land areaForest Reserve 177 518 199 466 335 7.1Proposed Forest Reserve 217 621 147 589 388 8.9National Heritage andWilderness Area
1 11 187 11 187 0.2
FD
Total 395 1 150 533 1 066 910 16.1Jungle Corridor 1 10 360 10 360 0.2National Park 12 462 448 462 448 7.0Nature Reserve 3 33 372 33 372 0.5Sanctuary 52 284 117 284 117 4.3Strict Natural Reserve 3 31 574 31 574 0.5
DWLC
Total 71 821 871 821 871 12.4Source: Sri Lanka Forestry Sector Master Plan, 1995.
Forest plantationsForest department plantationsThe total extent of forest plantations currently inventoried, mapped and managed by the FDamounts to 76 500 ha. The major species comprise teak (Tectona grandis), eucalypts (Eucalyptusgrandis, E. robusta, E. microcorys and others), mahogany (Swietenia macrophylla) and tropicalpines (mainly Pinus caribaea). See Appendix 1 for details.
Community forestsThe Participatory Forestry Project, implemented by the FD between 1993 and 2000with theassistance of the Asian Development Bank, has established farmer’s woodlots in difference partsof the country totalling 9 771 ha. The majority of trees planted were teak with an area of 3 398 habeing planted in total. These woodlots remain a valuable timber resource for future harvesting.
Forest plantations in DWLC areasThe extent of forest plantations in the wildlife conservation areas has been estimated as 2 352 ha.Although the FD established the plantations, they ended up within wildlife reserves as a result ofboundary realignment or declaration of new wildlife conservation areas. Consideringenvironmental and wildlife management criteria, the plantations, most of which are teak, are notbeing harvested at present.
Forest plantations in the plantation crop sectorSri Lanka has a well-developed export oriented plantation industry, comprising crops such as tea,rubber and coconut. Trees are grown in association with these crops, especially on tea estates inthe central highlands and the south-west of the country. The stock on tea lands consists mainly ofeucalypts species (Eucalyptus grandis, E. robusta, E. microcorys) although Grevillea robusta andAlbizia spp. are also planted. Tea planters started planting eucalyptus as ‘fuel coups’ in the 19th
century and the estates use the timber as fuel for processing tealeaves and for domesticconstruction work. Timber is also sold to third parties through special arrangements with thegovernment. On rubber and coconut plantations in lowland areas, valuable timber species such asteak and mahogany are commonly planted for commercial purposes.
Forest plantations in the plantation crop sector are either managed by one of two state ownedorganisations, the Janatha Estates Development Board (JEDB) and the Sri Lanka State PlantationCorporation (SLSPC), or are leased by theses organisations to regional companies. The JEDB andthe SLSPC manage tea plantations amounting to 10 703 ha and 13 345 ha respectively. The JEDB

153
manages 17 estates with 755.6 ha of planted forests and the SLSPC have a total of 1 039 ha offorest plantation. Both enterprises are currently engaged in commercial forestry activities, whichmainly comprise harvesting and selling mature tree (mainly eucalypts). Most timber extraction iscontracted to privately owned enterprises rather than the State Timber Corporation (STC).
During the recent restructuring of estates owned by the two aforementioned organisations, nearly400 tea, rubber and coconut estates were leased to 23 privately owned regional plantationcompanies. The total extent of leased plantation cropland amounts to 340 000 ha. Although anestimate of the extent of forest plantations on these lands has been made (12 784 ha) the exactfigure is not known, as there are no maps.
Private forestsSri Lanka does not have a large areas of private forest, however, at present, several privateenterprises are involved in commercial tree plantations, in which young trees are sold toindividual buyers as investments. The extent of such establishments is small and trees will not beharvested for many years.
NON-FOREST TIMBER RESOURCES
Estimates of the Forestry Sector Master Plan (1995) indicate that 90 percent of the total timberproduced in the country comes from non-forest timber resources, including home gardens (68percent), rubber (12 percent) and coconut (8 percent) plantations and other perennial croplands(2 percent).
Home GardensThe average size and species composition of home gardens varies according to factors such asagro-ecological region and population density. Trees planted on home gardens provide eithertimber or food and in certain instances, both.
The total extent of home gardens in the country has been estimated as 858 490 ha (FSMP, 1995).Within several sampled districts across agro-ecological regions the average stocking of timberproviding trees varies between 53.9 and 419.2 trees per hectare (EA1P, 1998). Home gardens inthe Kalutara (wet zone) and Kurunegala (intermediate zone) districts have higher stockingdensities, averaging 508 and 284 trees per hectare respectively. The high densities are due to thepresence of rubber and coconut trees cultivated in these districts. Home gardens in districtswithout plantation crops have lower stocking densities, but with valuable species such as teak,mahogany and jak. The proportion of mature trees (i.e. >15 years old) in the non-plantation cropareas is 5 percent, whereas in plantation crop areas (Kurunegala, Kalutara and Ratnapura districts)the figure can reach 80 percent on average.
In the past five years, an annual average of two mature trees have been felled in the surveyedhome gardens. The species felled in all three agro-ecological zones, in descending order, are asfollows (EA1P, 1998).
10. Jak (Artocarpus heterophyllus Lam.)11. Teak (Tectona grandis Linn.)12. Havari Nuga (Alstonia macrophylla Wall.)13. Mahogany (Swietenia macrophylla King.)14. Lunumidella (Melia dubia Gaertn.)15. Rubber (Hevea brasiliensis (Kunth.) Muell.Arg.)16. Coconut (Cocos nucifera L.)17. Kohomba (Azadirachta indica A. Juss)18. Weera (Drypetes sepiaria (Wight & Arn.) Pax & Hoff.)19. Albizzia spp.
Several studies have identified home gardens as an important source of timber and fuelwood inthe country (FSMP, 1995 and EA1P, 1998) and in 1995 home gardens produced 551 000 m3 ofsaw logs nationally. This is considerably higher than the total quantity of sawlogs produced by the

154
STC in 2001 (109 032 m3) and in upcountry areas, medium size saw mills are heavily reliant ontimber from home gardens. In recent years, there has been an increasing trend of timber treeplanting in home gardens (Weeramunda & Baminiwatte, 2000) and it has been estimated thatduring the next 15 years, the total annual production of timber from home gardens will be1.2 million m3 (EA1P, 1998).
Administrative procedures for removal of timber produced in private landsRemoval of timber from private lands, including home gardens, is governed by restricted fellingregulations and transport permits, as follows.
Restricted felling: Due to their nutritional or economic significance, the government restrictsfelling of jak (Artocarpus heterophyllus Lam), wal del (Artocarpus nobilis Thw.) and femalepalmyra (Borassus flabellife L.). These trees may be felled only under special circumstances onspecial approval granted by Divisional Secretaries.
Transport permits: Timber transport permits have been made obligatory for many importanttimber species. Authority is required from the Conservator General of Forests1 for removal of thefollowing eight tree species from private or government leased lands: Kaluwara (Diospyrosebenum Koenig), Kalumediriya (Diospyros quesita Thw.), Burutha (Chloroxylon swetenia DC.),Hulanhik (Chukrasia tabularis A. Juss.), Gammalu (Pterocarpus marsupium Roxb.), Milla (Vitexaltissima L.), Welang (Pterospermum canescens Roxb.), Panakka (Pleurostylia oppositsa (Wall.)Alston).
The Divisional Forest Officers may grant permission for removal of the following species fromprivate or government-leased lands38: Palu (Manilkara hexandra Roxb.), Suriyamara (Albizzialebbeck (L.) Benth.), Halmilla (Berya cordifolia (Willd.) Burret), Kumbuk (Terminalia arjuna(Roxb.) Wight & Arn.), Kohomba (Azadirachta indica A. Juss), Mee (Madhuca longifoliaL.J.F.Macbr.)
All species mentioned above are classified as class I, special class or luxury timber by the STC.For other tree species not mentioned above or not needing a transport permit, according to GazetteExtraordinary No.1129/13 of 28/04/2000 or subsequent regulations, approval for removal fromprivate or government-leased lands may be granted by the Divisional Secretaries.
Major commercial species raised in plantations or on private lands, such as teak, eucalypts, pine,mahogany etc. and most natural forests species, still require transport permits1 and deregulation isunlikely.
Collection of statisticsStatistics on timber production from home gardens and private lands are not collected. As asignificant quantity of timber is removed from these lands, recording annual production is apriority. Form ‘F’, commonly used by Range Forest Officers and the Divisional Secretaries toapprove timber removal from private or government-leased lands has sufficient space forcollection of data such as log volume and volume of roundwood, sawnwood and fuelwood.During the survey, however, it was found that this information is not recorded and thereforetimber felled illegally and transported undetected, and species not requiring transport permits arenot recorded.
Plantation cropsRubberwoodRubber is capable of producing 65 m3 of sawlogs per hectare at the end of its 25-year economiclife span and is used for many purposes, including furniture, plywood, shuttering in buildingconstruction and fuelwood on tea estates. The annual contribution of rubber wood to total nationaltimber production in 1995 was estimated at 13 percent by the Forestry Sector Master Plan. In thesame year, rubber plantations produced 256 000 m3 of sawlogs on a total of 193 000 ha. In spiteof a reduction in new planting areas, the FSMP (1995) predicts an increase of saw logs fromrubber plantations over the next 20 years. From 2000 to 2005 the predicted increase is from 38 Permits are issued by Range Forest Officers

155
256 000 to 269 000 m3.
No regular statistics are collected on rubber wood extraction from estates or smallholdings.Therefore, a major component of timber production in the country is not included in nationalstatistics.
Coconut and palmyraIn recent years, coconut timber has gained much importance in the housing industry, especially asrafters for roof construction. At the end of its economic life span of 50 years, a well-stockedcoconut plantation may produce 49.4 m3 of sawlogs per hectare. The extent of Coconutplantations in the country was estimated as 300 700 ha in 1995. The FSMP (1995) predicted thatthe area of coconut plantation would remain stable for a long period and that along with Palmyra,total production of saw logs would increase from 202 400 to 220 000 m3 between 2000 and 2005.As with rubber wood, no regular statistics are collected on removal of coconut timber from largeestates or smallholdings.
Other timber sourcesTimber is also extracted from other sources such as perennial croplands other than tea, rubber andcoconut. These include lands planted with coffee, cinnamon and cocoa. Total area of thesecroplands has been estimated as 45,300 ha with a production potential of 0.69 m3 of sawlogs and0.48 m3 poles per hectare per year (FSMP, 1995).
Tree planting by main roads is a common sight in Sri Lanka and the current Forestry Master Planhas quantified 2.5 trees per kilometre of road. The total length of highways planted with trees isabout 17 000 km (FSMP, 1995). In addition, the Participatory Forestry Project (1993-2000)assisted in establishing 1 288 km of roadside tree plantings, the survival of which variedaccording to agro-ecological zones (Weeramunda & Baminiwatte, 2000). Trees are occasionallyfelled at maturity, for safety reasons or for development work; the STC is normally responsiblefor felling and timber extraction.
AGENCIES DEALING WITH TIMBER PRODUCTION, HARVESTING AND
PROCESSING
The following governmental and private institutions are involved in timber production, harvestingand processing in Sri Lanka:
� Forest Department� State Timber Corporation� Regional Plantation Companies� Manufacturing industry (paper and paper based products, plywood etc.)
The capacity, organisation and responsibilities of these agencies at national and provincial levelare described below.
Forest DepartmentThe FD, currently under the Ministry of Environment and Natural Resources, as one of the oldeststate institutions in the country, is responsible for the management and safe guard of nationalforest resources for production and the environment. The Conservator General of Forests headsthe FD with an office at the Colombo Head Quarters. The FD maintains 18 territorial units knownas Forestry Divisions, which follow the Administrative Districts of the country; each is headed bya Divisional Forest Officer.
Forestry DivisionsThe Forestry Divisions are the territorial arm of the FD for administration and implementation offorestry policy decisions. Currently timber harvesting is confined to these territorial units and FDitself does not do any timber harvesting.
Before the beginning of each year, the Divisional Forest Officers identify timber-harvesting areasand inform the Deputy Conservator of Forests (Forest Inventory and Management Division) at the

156
FD HQ in Colombo. The annual timber-harvesting program is prepared and the STC areinformed. Upon clearance from Head Office, the Divisional Forest Officers issue Coup EntryCertificates to the Regional Managers of the STC to commence harvesting. The DFO and hissupport staff closely monitor harvesting operations and the STC has to return the area within agiven time frame, as logged areas are replanted in the ensuing season.
After successful completion of work by the STC, the DFO issues a Coup Clearance Certificate. Ifthe work has not been correctly completed or has caused damage to the remaining stand or theenvironment, the STC are penalised.
Forest managementThe Forest Inventory and Management Division (FI & M) of the FD is responsible formanagement of all natural and plantation forests in the country. Most forest plantations aremanaged according to working plans and the FD annually releases selected plantation sub-blocksto the STC for felling or thinning operations. Since commissioning of the STC in 1969, the FDhas not undertaken any timber harvesting in its own forests.
Forest management in transitionIt is anticipated that in the near future most functions of the FD will undergo considerable changesdue to the current restructuring program. Any proposed mechanism for improved data collectionhas also to consider these anticipated changes. The possible changes would be as follows:
� Formation of four new forestry regions, each headed by a regional Deputy Conservator ofForests. Each region would include 3 to 4 forestry divisions.
� Decentralisation of FD activities. Logistics for the decentralised administration, especiallyin relation to forest management and harvesting, have not yet been identified.
� Annual release of a minimum of 600 ha of forest plantation for harvesting. Private timberconcessions and the STC are invited to submit their bids. In addition, it is envisaged tolease 1 200 ha of plantation per year to the private sector for management over a five-yearperiod.State Timber Corporation
The STC currently functions as the sole authority in harvesting trees from state lands. Thisgovernment entity, which was established in1968, has an infrastructure developed for timberharvesting. The STC has its head quarters in Colombo and works in close collaboration with theForest Department. It is divided into 13 territorial regions, each covering more than one forestrydivision/administrative district. The STC is well equipped with harvesting machinery, worth about483 million SLR.
Sources of timberSTC extracts timber from following sources:
� Forest plantations annually released by the FD (may be ~1 000-1 200 ha.)� Forest plantations released by Regional Plantation Companies.� Timber from land clearance for development projects.� Private gardens� Illicit timber confiscated by the judiciary
Under normal circumstances, the felling area will be divided into coups by the STC andharvesting will be entrusted to registered contractors. On rare instances, however, the STC alsoharvests timber. The contractors are paid according to the quantity of timber supplied to the STCtimber depots, located in different parts of the country.
The work in each coup is closely supervised by an STC Coup Officer who keeps a record ofconverted material from each felled tree.
Payment of stumpageThe STC annually pays government stumpage for timber removed from forests, however, themethod of calculating fees has been controversial. Before introduction of stumpage appraisal, the

157
STC paid a royalty of 12 percent to the consolidated fund of the government based on total annualturnover. Since introduction of appraisal, however, calculations have been made on the basis ofthe quantity of converted material removed39. Stumpage varies according to species and thedimensions of the logs harvested. The current ADB funded Forest Resources Management Projecthas undertaken to review the existing procedures.
Record keeping by STC is relatively well developed. It is understood that FD obtains data ontimber harvests from STC for special requirements, such compilation of statistics on timberproduction and stumpage calculation.
Future perspectivesThe recent restructuring activities of the forestry sector in Sri Lanka have paid special attention tothe future role of the STC and a phased introduction of the private sector into timber harvestinghas been proposed. According to the report of the current Forest Resources Management Project(ADB Loan No. 1744-Sri (SF)), the STC will be guaranteed harvesting rights over 1200 ha ofstate forest plantations in 2000 provided the allocated area in 2001 equals or exceeds 1200 ha. IfSTC is unable to meet the 2001 harvesting target, the annual allocation for 2002 and 2003 will belimited to the area harvested in 2001. Based on the performance of STC in 2001-2003, anindependent body will decide on the subsequent STC quota. It is inevitable that in the near futurethe STC will compete with private entrepreneurs for timber harvesting contracts.
Regional plantation companiesTree harvesting by Regional Plantation Companies may be for one of two purposes: (i) for ownconsumption, i.e. as fuelwood for tea processing and for construction of workers quarters and, (ii)for sale to third parties, i.e. industrial timber. There are several regulations governing activity ofthe RPCs:
� In 1999, an Inter-Ministerial Committee on Tree Harvesting40, appointed by the President,recommended several measures to regulate tree felling by the newly formed RegionalPlantation Companies. The RPCs were requested to prepare 5-year forestry managementplans and to seek approval of the Forest Department. The were also requested to submitharvesting applications, in accordance with the approved forestry management plans, andwith endorsement by, and recommendations from, respective District Secretaries. TheInter-Ministerial committee closely monitored tree harvesting. The role of the Inter-Ministerial Committee ceased early 2002 and now a special unit established in the Ministryof Plantation Industries, the Plantation Management Monitoring Division (PMMD),monitors tree harvesting.
� During early 2001, The Ministry of Plantation Industries requested all Regional PlantationCompanies to maintain Coup Registers containing records of all timber removals. Recordswere to be submitted to the Divisional Forest Officers to obtain transport permits forremoval of felled material.
� At the early stages of the arrangement, mentioned in the previous section, the RegionalPlantation Companies were requested to supply all timber to the State Timber Corporation.A cabinet decision, in early 2001, however, allowed the RPCs to sell 50 percent ofharvested timber to private sector buyers through competitive bidding. The requirement hasnow been eased and most supply timber to private sector buyers at higher prices than paidby the STC. The PMMD receives no feedback from the RPCs on their annual timberharvests or on value added production.
Manufacturing industriesPlywood millsOnly one major plywood mill operates in the country at present. The mill was previously ownedby the Government, having been established with Romanian assistance. It is now under private 39 Logs, round poles and fence posts, transmission poles, roundwood and fire wood40 The Committee comprised representatives of the Ministry of Plantation Industries, the ForestDepartment and the Central Environmental Authority

158
management and has been re-equipped with new technology. The plywood and plywood productsproduced are for domestic consumption and raw material requirements amount to 970 m3 ofpeeler logs per month. Most logs are from private gardens and Regional Plantation Companiesand the predominant species include rubber, Albizzia spp. and mango. Due to scarcity of rawmaterial the mill is running below capacity, however, production figures are not included in anynational database.
Pulp and paper productsAt present, two medium size paper mills operate in Sri Lanka. The mill at Valachchanai mainly usesrecycled paper as raw material whereas the mill at Embilipitiya uses about 30 percent recycled paperand 70 percent imported pulp and locally collected pulpwood. Albizzia and eucalypts, purchasedmainly tea estates and other private lands, are the main species used. Tropical pines, which areabundant in the country, are not used due to high cost of chemical processing.
THE CURRENT FOREST PRODUCTS STATISTICAL SYSTEM
Statistical systems of agencies producing, processing and marketing timberThe State Timber CorporationThe STC, being the largest timber harvesting enterprise, maintains a well-developed statisticalsystem on the production and trade of various wood products. Statistical records are kept for allstages from trees felling to conversion and marketing. The procedures are as follows:
Preparation of enumeration lists
After selection of a forest plantation sub-block for harvesting, the FD demarcates the boundaries,prepares an enumeration list and issues a coup entry certificate to the STC to commence fellingoperations. The enumeration list carries details of each tree selected for felling. This includes dataon the species, merchantable height (bole height to the first significant branch) and the girth at thebreast height of the tree. Each tree selected for felling is serially numbered.
Coup demarcation
The STC divides the felling area into coups. A coup has an average size of 5.0 ha and is given to aregistered contractor for logging. A Coup Officer is assigned to supervise all activities within thecoup, including record keeping.
Maintenance of coup registers
Coup officers are responsible for maintaining coup registers, which contain information onmaterials converted from felled trees. Items recorded vary according to tree species; the followingare some examples:
� Teak: logs, fence posts, fuelwood.� Mahogany: logs, fuelwood.� Eucalyptus: logs, railway sleepers, transmission poles, outside slabs and firewood.
Number of logs obtained from each tree and their dimensions are recorded (mid-girth under bark(cm) and the length (m)) and each log is numbered according to the tree from which it was taken.The volume of each log is calculated in cubic decimetres using tables, and recorded.
Items such as fuelwood, outside slabs and fence posts are recorded for the total coup area and noton the basis of the individual tree. In the case of railway sleepers, which are converted in-situfrom felled Eucalyptus microcorys and E. grandis trees, records are made for each tree.
Filling of the advice of dispatch
The coup officer prepares a monthly return to his superior on wood products released from thecoup and transported to the relevant STC depot. In the case of logs this includes the species, lognumber, class, length, mid-girth, volume and serial number given by the receiving depot.

159
The stock book of the depot
At each depot, material supplied from the coups is entered in the stock book. In the case ofroundwood, a separate serial number is given to each piece. The stock book includes threevaluable items of information: (i) the amount sold during a specified period, (ii) the quantitytransferred for sawing and (iii) the quantity transferred to other depots or sales outlets. Forfirewood, fence posts and railway sleepers, two separate stock books are maintained at the depots.
Monthly reporting by ARM to RM
The Assistant Regional Managers in charge of the sub-regions of the STC send monthly returns totheir Regional Managers which include values and amounts received, produced, sold, transferredand in stock for logs, sawn timber and other wood products.Monthly reporting by Regional Manager to STC HQ
Regional Managers of the STC send monthly returns to the planning division of the STC HQ onproduction and sale of forest products in their respective regions. This feedback forms the annualSTC statistics on timber production. Three forms are used, one each for logs, sawn timber andother wood products. Each contains information on the utility class, production, receipt, issues(sales and transfers) and sales values for the current month.
Additionally, a separate document is sent to the head quarters by the Regional Managers, whichspecifically contains production information. Production figures are given separately for (i) Logs(in standard utility classes), (ii) Sawn timber (in standard utility classes) and (iii) Other woodproducts.
The origin of the timber is classified into the following categories: (i) timber extracted from statelands, (ii) timber extracted from private lands, (iii) timber received as confiscated material fromforest offences, and (iv) timber from other sources (e.g. development areas)
Compilation of statistical highlights by the State Timber Corporation
Based on the statistical returns sent by the Regional Managers, the planning division of the StateTimber Corporation prepares monthly reports on the production and sale of logs, sawn timber andother wood products. The structure of the current Statistical Highlights published monthly by theSTC is as shown in Table 3.
Table 3. Structure of the Monthly Statistical Highlights compiled by the STCInformation Area covered DetailsSales figures Regions and
nationwideLogs and sawn wood, in utility classes and other wood products.Quantity and value.
Stock summary Regions Volumes of the existing stock and their values.Targets vs.achievement
Regions andnationwide
Monthly targets for production and sale of logs, sawn timber and otherwood products and their achievement
Stock summary Depots Volumes and value of existing stock. This is the input to the regionalstock summaries.
Stock summary forcoconut timber
Few depots Volumes and value of existing stock.
The Forest DepartmentThe FD does not maintain its own records on yields from timber harvest, but relies heavily onstatistical data provided by the State Timber Corporation. The FD collects statistical data for twomain purposes:
� Stumpage calculation. The FD collects data on timber removals from plantationsharvested by STC. The Divisional Forest Officers collect these data from RegionalManagers and a joint report is submitted to FD head office for stumpage calculation.Currently stumpage is calculated on the basis of volume of extracted logs of differentspecies in respective girth classes. Calculations for fuelwood are also on the basis of

160
volume. For other products such as fence posts, poles and transmission poles calculation ison the basis of the number of units in different dimension or quality classes.
� The Administration Report. The annual administrative report of the ConservatorGeneral of Forests incorporates data on the removal of timber and other wood productsfrom the state forests. Data are mainly collected from the Regional STC Offices by theDivisional Forest Officers, using a specified format. Data are then reported back to thePlanning and Monitoring Division at the FD head office. Data in the following categoriesare collected: (i) Yields from forest plantations thinnings, (iii) Yields from clear felledareas, (iv) Volumes of confiscated timber.
The regional plantation companiesAs already mentioned, there are 23 private regional plantation companies in Sri Lanka managingleased tea, rubber and coconut plantations by the government. Many of these companies are nowengaged in commercial forestry through harvesting timber and establishing new industrial woodand fuelwood plantations. As forestry is a new discipline for most of these companies, theMinistry of Plantation Industries provides them with guidance on keeping harvest records.
During early 2001 the Ministry of Plantation Industries requested the regional plantationcompanies to maintain coup registers in a similar format to those maintained by the State TimberCorporation. Extracts of the information are presented to Divisional Forest Officers to obtaintransport permits for removed material.
The author visited an RPC to collect information on statistical procedures and is of the opinionthat many companies are not keeping up-to-date records and may need assistance. Observationsare presented in Appendix 4.
The Customs DepartmentThe Sri Lanka Customs maintain statistics on import and export of wood and wood basedproducts based on declarations made by importers and exporters. Wood and wood based productsare classified according to the Harmonised System (HS 96) using standard codes. The yearlypublication, ‘External Trade Statistics’, published by Sri Lanka Customs, includes annuallyquantities of products imported and exported.
Forest products statistical publicationsSeveral state agencies in Sri Lanka produce statistical documents, which also include data onforests products and their trade. Some of the recently available publications are listed below.
� ‘Statistical Abstracts’ is annually prepared by the Department of Census and Statistics ofthe Ministry of Finance and Planning with forest products data supplied by the STC. Theedition for 2000 is now available. Production figures for the preceding ten year are includedfor: (i) Soft timber, (ii) Ebony logs, (iii) other logs, (iv) sawn timber, (v) railway sleepers,(vi) electricity transmission poles, (vii) posts, (viii) firewood and pulpwood. Thepublication does not include forest products sale values.
� ‘Statistical Compendium for Natural Resource Management’ was published by thePlanning Division of the Ministry of Forestry and Environment in 2000, but is not a regularpublication. It includes statistical data on the removal of round timber and saw logs bythinning, regeneration cuttings and other felling operations during the same year. Timber isclassified into the utility classes used by the STC. The classification used has severaldifferences with the classification used in Statistical Abstracts.
� ‘Annual Report of the Central Bank’ (Year 2000). This report has a vague descriptionof the forestry sector in the country and concentrates more on forest cover data. Statisticaldata on timber production is insufficient.
� ‘Annual Administration Report of the Conservator General of Forests’ is producedby the Sri Lanka Forest Department and includes all timber removals from state forests andtheir sale values during the year under review. The timber utility classes used are similar tothose used by the STC.

161
� ‘Statistical Highlights of the State Timber Corporation’ is a monthly documentprepared by the STC and is perhaps the only comprehensive statistical document availableon trade and production of wood products in Sri Lanka.
� ‘External Trade Statistics of Sri Lanka Customs’ is published annually by the CustomsDepartment and includes the quantities and values of all imports and exports of timber andwood products.
WEAKNESSES AND CONSTRAINTS IN THE FOREST PRODUCTS STATISTICAL
SYSTEM
Different forest harvesting practices, complex institutional and regulatory arrangements andvarying land ownership have led to incomplete collection of forestry statistics and compilation ofstatistics on production of timber forest products.
Incomplete coverage of statistical dataOf total timber extraction, and production of wood-based products, only part is included innational timber production statistics because data collectors relying exclusively on the STC, asdata from other institutions are not currently available. Statistical data compiled by the STC relateonly to timber removed by STC itself from the following sources: (i) forest plantations releasedannually by the FD, (ii) estates leased to regional plantation companies (partly), (iii) confiscatedmaterial from illegal felling and other forest offences, and (iv) land clearing for developmentprojects. The STC is involved in only 10 percent of national timber extraction.
Compilation of statistics by the STC is quite satisfactory and other agencies such as the ForestDepartment rely heavily on these data.
Unutilised dataData on non-STC timber removals are recorded in official documents or as production figures ofprivate organisations, and remain unutilised. These are as follows.
� Timber extracted from home gardens or other private lands. Studies show thequantity of timber extracted from home gardens amounts to 68 percent of the total annualtimber production. Amounts extracted are recorded on transport permits issued by theRange Forest Officers or by the Divisional Secretaries. Although not all timber extractedfrom home gardens or private lands are recorded on the permits, it is estimated that nearly35 percent of annual timber production could be assessed. The data includes information onvaluable timber species such as jak, teak, mahogany and margosa.
� Timber extracted by organisations other than the STC (from lands leased to RegionalPlantation Companies or belonging to the JEDB and the SLSPC41). If sold to a privatebuyer, the quantity of timber is recorded on the transport permits issued by the RFO or inthe books of the companies. By requesting the Regional Plantation Companies to reportannual timber extraction by private enterprises to the PMMD of the Ministry of PlantationIndustries, nearly 4-5 percent of the national timber production would be included in annualstatistics.
� Plantation companies and other private estate owners produce fuelwood for theirfactories. The estate normally records amounts extracted.
� Certain regional plantation companies have started processing timber growing on theirestates to produce doors, tea chests and furniture. The production and sale of these items isnot included in any database.
� Regional plantation companies and small holders uproot mature rubber or coconuttrees, either to establish new trees or to change land use. The wood is used for fuel, in thefurniture industry or as peeler logs. Some growers keep records on timber extractions.
� Production of pulp, recovered paper, paper and paper products, veneer sheets andplywood are not included in national statistics.
41 If timber extraction was done by the STC, the production figures will be recorded and entered inmonthly or annual statistics.
162
Unrecorded timber extractions� Many timber species (80 at present) do not require transport permits. Most other
deregulated timber species, except few, fall into class III or below. The proportion of thesespecies is estimated as 33 percent of the national annual timber production.
� Coconut and rubber timber removed, especially from smallholder plots, have a higherlikelihood of not being recorded. This omission is estimated at 20 percent of the nationalannual timber production.
� Illicitly felled timber on public or private lands is not recorded, unless detected.Limited dissemination of statistical data
The only detailed statistical document on timber production, the monthly ‘Statistical Highlights’of the STC, has a limited circulation and is used mainly by the FD. Other documents such as the‘Administration Report of the Conservator General of Forests’ or the ‘Report of the Central Bank’have a limited pool of users, including researchers and students. Details of the informationcollected and disseminated by relevant agencies are given in Appendix 3.
Institutional arrangementsThere is neither coordination between relevant agencies nor a central establishment in the countrythat collects data on forest products and marketing. The Department of Census and Statistics,which has responsibility for collection of national statistics in many fields, restricts itself to dataon removal of public timber. The FD, the major establishment responsible for forestmanagement, has no statistical unit and relies heavily on data collected by the STC.
Constraints in completing information requested by FAOProblems encountered in completing information requested by FAO for 2000 included:
� The timber production estimated for 2000 includes only that extracted from governmentor government leased forestlands, as other data are not available.
� Total volumes of certain industrial roundwood products had to be ‘guesstimated’ as otherinformation was not available. This applies mainly to electricity transmission poles, fenceposts and round poles, where production is expressed by number of units. The averagevolume of an electricity transmission pole used was to 0.107 m3 (Baminiwatte, 1985). Theaverage volumes for a fence post and a round pole were estimated as 0.01 m3 and 0.001 m3
respectively.� Wood residues are normally recorded as side slabs (off cuts) and expressed as number of
units in official STC statistics. In 2000, the number of off cuts from sawing of logs amountsto 213 802. As the side slabs vary considerably in size, estimation of a mean volume perside slab is not feasible. Therefore, volume figures for wood residues are not included insubmissions.
RECOMMENDATIONS
Sri Lanka is attempting to intensify forestry sector production by redefining its productionforestry estate, introducing genetically improved seeds, improving silvicultural and nurserypractices, revising inventory techniques and improving forest plantation valuation. The increasingparticipation of private enterprises in forest plantation management and harvesting is inevitable.Under these circumstances, centralised recording of data related to timber removals andperformance of wood based industries is of high significance.
Data collection should be done at many levels with the involvement of several multi-disciplinaryagencies. The institutions involved and the methodologies proposed are outlined in the followingsections.
Institutional involvementCollection of statistical data could be undertaken within the existing institutional frameworkwithout much additional investment. All relevant public and private sector institutions that arelisted below shall participate in the data collection process.
Public sector� Forest Department

163
� State Timber Corporation� Ministry of Plantation Industries� District Secretariats� Divisional Secretariats� Rubber Development Department� Coconut Cultivation Board� Customs Department
Private cector� Regional plantation companies� Wood-based industries (paper, plywood)� Forest concessionaires (in future)
Institutional developmentTo centralise data processing and dissemination, it is recommended that a unit be established tocollect, process, store and disseminate data provided by the aforementioned agencies. The unit couldbe located at the Forestry Division of the present Ministry of Environment and Natural Resources.At present, this unit is employing a statistician, but existing facilities and manpower needs to beupgraded. Is it proposed the unit be called the ‘Central Forestry Statistics Unit’ of the MENR.
The MENR shall play the lead role in the data collection process. Appointment of a monitoringcommittee with representatives of all concerned parties would be advantageous. It is proposedthat the committee include representatives of:
� Ministry of Environment and Natural Resources (Convener)� Ministry of Plantation Industries� Ministry of Public Administration (representing Divisional Secretaries)� Forest Department� Customs Department� State Timber Corporation� Planters Association (representing RPCs).
To upgrade monitoring of activities by the Ministry of Plantation Industries, the capacity of thePMMD should be expanded by establishing a system to monitor timber-harvesting activities byRPCs. The RPCs should be requested to report on quantities of timber removed and on otheractivities such as the establishment of new plantations, etc. The PMMD would send data to theCentral Forestry Statistics Unit in the MENR.
To increase Forest Department data collection capability, it is important that FD possess its owndatabase on timber removals from forests under its administration. The current upgrading of theFORDATA database by the FRMP is a move in this direction and stand parameters for forestplantation sub-blocks can be retrieved from FORDATA for use in managerial decisions. It isanticipated that extra modules will be added to record the felling history of each sub-block, whichwould include information on timber removals.
It is necessary that all concerned parties recognise the importance of forest products statistics.The skills of primary level data collectors should be improved through additional schoolingsessions and the few senior staff involved in statistical analysis should be provided additionaltraining on database management.
Data to be collectedTypes of data to be collected are as follows:
� Records on timber removals from public and private lands measured directly in the field,as done by STC.
� Estimation of timber removals from private lands based on scrutiny of documents,including transport permits issued by Divisional Secretaries and Range Forest Officers.
� Estimation of timber removals and species composition, particularly for commerciallyimportant species and those not requiring transport permits to be done by periodical surveysof saw mills, timber depots and similar establishments in forest ranges. This would includeremovals of rubber and coconut timber from smallholdings.

164
� Reporting on timber removals by concessionaires. Private timber concessions selected bytender procedure will commence harvesting of forest plantations from 2003 onwards.Submission of harvest data in a prescribed format should be included in the contract withthe successful bidders.
� It is recommended that the STC and other timber producing agencies improve their timbermeasurement practices. All timber residues should be quantified according to their weight.For pole size timber (electricity transmission poles, fence posts and round poles), theappropriate unit would be stacked cubic meters. In both of these cases, conversion factorsshould be used to obtain solid cubic contents.Information flow
Information flow during data collection depends on the hierarchical order of the concernedagencies (Table 4).
Table 4. Hierarchical order of territorial units of relevant agenciesInstitution Hierarchical
positionTerritorial organisation
Forest Department 1 Region → Division → Range →BeatState Timber Corporation 2 Regions → Sub-regionsMinistry of Plantation Industries 3District Secretariats 4 Divisional Secretariats → Grama Niladhari DivisionsRubber Development Department 5 Regions (Districts)Coconut Cultivation Board 6 RegionsRegional plantation companies 7 Clusters → Estates → Divisions → Fields
The impact of the decentralisation of forest department activitiesAt the time of preparing this report, the FD had formed four forestry regions in the country,(southern, western, central and north-western) each headed by a DCF(R). Each region has two ormore forestry divisions. Currently the forests are managed centrally by the FDHQ anddecentralisation arrangements are not yet known.
The author is of the opinion statistical data could be more efficiently collected under the newadministration. This applies especially to data on timber extraction from home gardens and otherprivate lands and survey of private saw mills. In addition, the regional administrations shouldmonitor timber extraction by logging concessions. Effective coordination could also beestablished with rubber and coconut authorities at the regional level. Collection of statistical datafrom Regional Plantation Companies should be entrusted to the Ministry of Plantation Industries.
The entrusted responsibilities and tasks for each stakeholder organisation at the regional ordivisional level are given in Table 5. The proposed flow of information among relevantstakeholders is presented in Figure 1.

165
Table 5. Collection of statistical data at district level and responsible institutionsType of information Responsible
institutionArea covered Data collector Data source Procedure Report to
STC Coups CO RMRPCs Fields CO/Estate staff PMMD
Quantities of logs, sawnwood and otherconverted materialremoved from publiclands.
Timberconcessions
Concession Concessionaire
Coup registers Quantities oftimberremovedrecorded foreach fellingarea or coup
DFO
FD RFOQuantities of logs, sawnwood and otherconverted materialremoved from privatelands on transportpermits
DivisionalSecretariats
Homegardens/Otherprivate lands
Divisionalsecretary
Copies oftransportpermits issuedto the public.
Preparation ofmonthlyreturns onquantity of logsand sawnwoodremoved
DFO
Quantities of logs, sawnwood and otherconverted material, otherthan rubber or coconut,removed from privatelands. (Transport permitsnot needed).
FD Homegardens/Otherprivate lands
RFO Records ofprivate sawmills in ranges
Quarterlysurveys of logpurchases byprivate sawmills
DFO
Rubber wood from smallholdings
RubberDevelopmentDepartment
Regions RubberDevelopmentOfficers
Throughmonitoring oflarge scaleclearings
Estimation ofthe quantityand value offelled material
MPI
Coconut timber fromsmall holdings
CoconutDevelopmentAuthority
CoconutDevelopmentOfficers
Throughmonitoring oflarge scaleclearings
Estimation ofthe quantityand value offelled material
MPI
Plywood, veneer, MDF,paper and pulpproduction
ForestryStatistical unitof the MENR
National ForestryStatistical unitof the MENR
Return of annualquestionnaires
Data recordedon productionand turnover.
MENR
External trade of woodand wood basedmaterial.
CustomsDepartment
National Statistical unitof the CustomsDepartment
Customsstatistics
Records madeof quantity andvalue ofexported andimported woodand wood-based products
MENR

166
Figure 1. Proposed forest products information flow
ST LoggingConcessions
Individuals
Coupofficers
Data Collection bydirect measurements
Data Collectionby estimation
Data Collection bydirect measurements
ARDFO Regional Managers
RM DCF(R) DCF (R)
STC HQrecords FD HQ FD HQ PMMD/ MPI PMMD/ MPI
on
Central Forestry Statistics Unit d based industries
Range ForestOfficers/Divisional
secretaries Rubber/CoconutDevelopment
Estatestaff
Custom
Home gardensPrivate lands
Rubber/Coconutsmallholdings
Regional PlantationCompanies
Potential
Data Collection bydirect measurements
Concessionaires
DFO
Individuals/Small-scale
entrepreneurs
Data Collection byindirect measurements

167
ReferencesAnnual Administration Report of the Conservator General of Forests, 1999 & 2000. Forest
Department, Colombo, Sri LankaAnnual Report of the Central Bank, 2000. Publication of the Central Bank, Colombo, Sri LankaBaminiwatte, A.N.S., 1985. Plantation forests as a source for wooden transmission poles.
Proceedings of the annual sessions of the Institute of Engineers Sri Lanka on wood poles-production and usage in the supply industry, Colombo, Sri Lanka.
Environment Action 1 Project (EA1P), 1998. The effect of the wood products industry on naturalforests, Final report, Ministry of Forestry and Environment, Colombo, Sri Lanka.
External Trade Statistics of Sri Lanka Customs, 2000. Report published by Sri Lanka Customs,Colombo, Sri Lanka.
Project document of the Forest Resources Management Project, Sri Lanka, ADB Loan No. 1744-SRI (SF).
Sri Lanka Forestry Sector Master Plan, 1995. Publication of the Ministry of Agriculture, Landsand Forestry, Colombo, Sri Lanka.
Statistical Abstracts, 2000. Publication of the Department of Census and Statistics, Colombo, SriLanka.
Statistical Compendium for Natural Resource Management, 2000. Publication of the Ministry ofForestry and Environment, Colombo, Sri Lanka.
Statistical Highlights of the State Timber Corporation, January- December 2000. Internaldocument of the State Timber Corporation, Colombo, Sri Lanka.
Weeramunde, J & Baminiwatte, A.N.S., 2000. Socio-economic and Environmental ImpactAssessment of the Participatory Forestry Project, Final Report, TEAMS Limited, Colombo, SriLanka.

168
Appendix 1. Inventoried forest plantations, 1999 (ha)District Teak Margosa Eucalypts Acacias Pines Mahogany Others Total
Ampara 5 753.8 157.2 48.3 5 959.3
Anuradhapura 3 226.5 158.1 764.5 268.0 872.9 5 290.0
Badulla 23.6 6 109.3 190.6 2 947.1 176.1 9 446.7
Galle/Matara 138.6 20.3 2 616.2 237.5 3 012.6
Gampaha 191.6 10.5 83.8 100.0 487.0 47.0 919.9
Hambantota 1 080.7 71.5 2 528.7 108.1 277.0 20.4 67.5 4 153.9
Kalutara 1.0 318.7 1 070.5 2.3 110.1 1 502.6
Kandy 51.2 257.1 319.4 3 071.8 52.5 3 752.0
Kegalle 188.5 92.6 879.1 27.0 1 187.2
Kurunegala 3 895.4 114.8 1 451.8 87.1 3 476.6 140.4 9 166.1
Matale 1 572.6 810.3 520.6 1 242.5 2.8 4 148.8
Moneragala 3 634.8 312.4 846.6 85.5 2.4 42.0 90.5 5 014.2
Nuwara Eliya 3.0 4 742.6 93.0 2 405.8 0.5 90.7 7 335.6
Polonnaruwa 928.6 12.0 2 124.6 52.0 0.0 3 117.2
Puttalam 4 101.8 14.5 3 647.3 163.0 155.5 60.3 8 142.4
Ratnapura 420.7 166.2 543.3 2 580.3 101.7 508.4 4 320.6
Total 24 884.3 683.3 23 756.3 3 041.9 16 406.2 5 165.1 2 532.0 76 469.1
Source: FORDATA database of the Forest Department
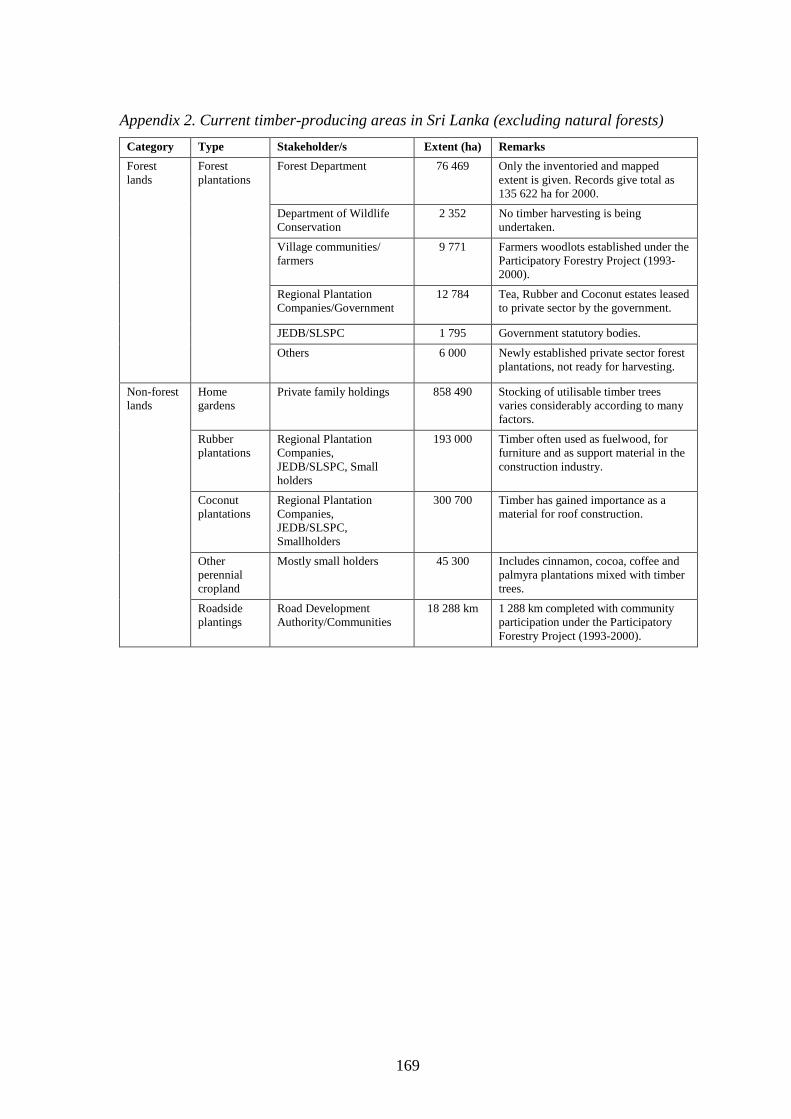
169
Appendix 2. Current timber-producing areas in Sri Lanka (excluding natural forests)Category Type Stakeholder/s Extent (ha) Remarks
Forest Department 76 469 Only the inventoried and mappedextent is given. Records give total as135 622 ha for 2000.
Department of WildlifeConservation
2 352 No timber harvesting is beingundertaken.
Village communities/farmers
9 771 Farmers woodlots established under theParticipatory Forestry Project (1993-2000).
Regional PlantationCompanies/Government
12 784 Tea, Rubber and Coconut estates leasedto private sector by the government.
JEDB/SLSPC 1 795 Government statutory bodies.
Forestlands
Forestplantations
Others 6 000 Newly established private sector forestplantations, not ready for harvesting.
Homegardens
Private family holdings 858 490 Stocking of utilisable timber treesvaries considerably according to manyfactors.
Rubberplantations
Regional PlantationCompanies,JEDB/SLSPC, Smallholders
193 000 Timber often used as fuelwood, forfurniture and as support material in theconstruction industry.
Coconutplantations
Regional PlantationCompanies,JEDB/SLSPC,Smallholders
300 700 Timber has gained importance as amaterial for roof construction.
Otherperennialcropland
Mostly small holders 45 300 Includes cinnamon, cocoa, coffee andpalmyra plantations mixed with timbertrees.
Non-forestlands
Roadsideplantings
Road DevelopmentAuthority/Communities
18 288 km 1 288 km completed with communityparticipation under the ParticipatoryForestry Project (1993-2000).

170
Appendix 3. Information dissemination by timber harvesting and processing stakeholdersStakeholder Types of information
heldMain informationrecipient/s
Purpose Other datausers
State TimberCorporation
Timber removals fromstate and privateforests
Forest DepartmentDepartment of Censusand StatisticsCentral Bank
Stumpage calculationPublication in reportsPlanning purposes
No wide range ofusers. Limited tostudents andresearches.
ForestDepartment(Range ForestOfficers)
Timber transportpermits. No statisticscompiled on quantityof timber permitted forremoval
None Not applicable Not applicable
DivisionalSecretaries
Timber transportpermits. No statisticscompiled on quantityof timber permitted forremoval
None Not applicable Not applicable
RegionalPlantationCompanies:JEDB/SLSPC
Timber removed fromtea, rubber andcoconut estates
Range Forest Officers(Only for trees thatrequire permits forremoval)
To obtain transportpermits. No furthertransmission of data forstatistical purposes
Not applicable
Private treegrowers, homegardens, tea,rubber andcoconutsmallholdings.Other perennialcroplands
Quantity of timberremoved from theirholdings
Range Forest Officers(Only for trees thatrequire permits forremoval)
To obtain transportpermits. No furthertransmission of data forstatistical purposes
Not applicable
Wood basedindustries(Plywood, Pulpand paper)
ProductionValue of turn-over
None Not applicable Not applicable

171
Appendix 4. Case study: Hapugastenna Plantations Ltd.
Recording of timber harvest by a regional plantation company – Hapugastenna Plantations Ltd.
The author visited Hapugastenna Plantations Limited at Ratnapura on 23rd May 2002 to collectinformation on timber harvesting record keeping procedures. This RPC has 22 estates, mainly inthe Sri Lankan uplands, with an area of 1 496 ha. The main stock comprises of stands of matureeucalypts thriving in the hilly steep terrain. Two cable crane units have been commissioned fortimber harvesting and hauling. The company maintains good records of timber harvest foraccounting and audit purposes. Data recording includes the following stages:
1. Tree Count on Fields Selected for Felling During the Year
Each tree is serially numbered, species identified, GBH and merchantable height measured andvolume estimated using tables. Normally the tree cover on fields consists of Grevillea robusta,planted for shade, or eucalypt block plantations.
2. Preparation of Tree Harvesting EstimatesThe superintendent of each estate prepares a timber-harvesting estimate for the next felling seasonusing a standard format. Data collected by tree counting is used to prepare the estimate. Thetimber-harvesting estimate includes the number of trees falling within three girth classes (>5’, 3’-5’ and <3’)
Operation costs for felling, included in the annual budget of the relevant estate, are calculatedusing these lists.
3. Recording Daily Timber ProductionTimber harvesting is done by company cable-logging units and by private timber buyers. In bothcases daily turnout from each felling area is recorded.
4. Recording Monthly And Total Timber ProductionBy summarising daily timber production, the company prepares monthly production figures foreach field in which timber harvesting has taken place.
The company does not provide data on annual timber production (including rubber) to any statedata-collecting agency as no requests have been made; the data is used, rather, for companyaccounting purposes. The Plantation Management Monitoring Division (PMMD) of the Ministryof Plantation Industries, which overseas activities on leased estates, so far has not developed amechanism to collect data on timber production by private and government owned plantationcompanies.
Appendix 5. List of persons interviewedMr. Abey Dias, Director, Plantation Management and Monitoring Division, Ministry of PlantationIndustries.Mr. Atapattu, Mill Manager, Ruhunu Plywood Company Ltd., Gintota.Mr. K.R.D.S Perera, Statistician, Forestry Unit, Ministry of Environment and Natural Resources.Mr. Lesly Gunaratne, Deputy General manager, State Timber Corporation.Mr. Mahinda Seneviratne, Divisional Forest officer, Ratnapura.Mr. Priya Gunewardene, Forestry Coordinator, Hapugastenna and Udapussellawa Plantations Ltd.Mr. Wickremasinghe, Statistician, State Timber Corporation.Mr. H.N. Siriwardena, Deputy Director (Statistics), Customs Department.Mr. Abeysinghe, Project Engineer, National Paper Company, Colombo.

172
National forest products statistics, Thailand
INTRODUCTION
Forest Products trade and production statistics were previously kept separately by individualorganisations depending on their specific needs. Data analysed for specific purpose were notreadily applicable for others, not only because of differences in data, but also as a result of thelack of continuity of efforts following data collection campaigns for specific purposes.
The Royal Forest Department of Thailand (RFD) has now set up a Data Centre in the InformationOffice. It is responsible for collecting, compiling and disseminating information on forestry.Forestry statistical reports are published annually and are available from the RFD’s web site(http://www.forest.go.th). The Data Centre also provides forestry data to national and foreignorganisations, institutes and researchers. There is also some specific forest information collectedby certain units, which are not included in the annual report (e.g. forest inventory information).The majority of data in the forestry statistical reports are from various, specially designed formsthat are submitted at monthly intervals to forestry branch offices throughout the country. Somedata are also extracted from reports of other offices such as the Department of Customs and theDepartment of Internal Trade. Forest products data is disseminate to related agencies, the publicand press, etc. through the Internet and by way of the Forest Product and Trade Annual YearReport.
FOREST RESOURCES
Data on forest resources comprise forest area and forest inventory results collected and compiledby the Forest Resources Assessment Division, Forest Research Office. Forest area is assessedthrough interpretation of LANDSAT satellite images every two or three years and the informationis included in the annual forestry statistical report. For forest inventory, the RFD uses the UnitSystem Forest Inventory Method. Data are entered into a forest resources database, whichcontains information for each forest on number of trees and, species, regeneration, growth andyield and composition of forest. The information is disseminated, in certain provinces, in reportsclassified by forest name.
Forest plantationsPast forest plantation data are only available for plantations operated under Government budgetby the Reforestation Office. Other plantation data are available from the Forest IndustriesOrganisation (FIO) and the Thai Plywood Company Limited, both of which are Governmentalorganisations with involvement in reforestation.
Following the 1989 logging ban, there has been greater planting activity in private plantations forwhich the Office of Private Reforestation and Extension (OPRE), established in 1986, isresponsible. To endorse and strengthen national forest policy and to reflect Government’sacknowledgment of the role the private sector plays in reforestation, land policy changes havebeen considered. The Government is presently considering adoption of a progressing land taxpolicy to encourage conversion of uncultivated land to productive land. Some indication of thelevel of involvement of the private sector can be obtained through assessment of the area of landrented for forestation in National Reserve Forest under the National Reserve Forest Act 1964(Article 20). Private sector involvement in forest plantations comprises 170 farms, with themajority less than 320 ha in size and averaging between 80-160 ha (Table 1).

173
Table 1. 1994 Plantation area on land rented under the National Reserve Forest Act 1964 (ha)Private
individualsCompanies State enterprises Government
departmentsTotal
Number 86 47 37 10 180Area 5 310 18 506 11 867 829 36 512
Source: Private Reforestation Division, RFD 1995
Plantation developmentFollowing the logging ban in 1989, attention focused on how Thailand would acquire adequatewood for domestic consumption. The concern was reflected in a flurry of legislation, policy andcabinet resolutions made in the years following the ban. Perhaps foremost among the legislativedocuments is the Re-Afforestation Act 1992. The main purpose of the Act is to support plantingof restricted tree species by the private sector on their own land. The Act describes the types ofland on which forest plantations may be registered and established. Of particular note are Sections10-13, which cover harvesting and passage of timber through checkpoints, and Section 14, whichindicates that all royalties shall be waived.
Further to this keystone legislation, a number of resolutions have been passed by the Council ofMinisters concerning economic reforestation. Notable resolutions include:
• Classification of the National Reserve Forest Area. The Council of Ministersagreed to conduct land-use zoning of the National Reserve Forest area. Based onzoning, about 14.12 million ha (25 percent) of the country have been approved bythe cabinet for conservation forest, 8.30 million ha (16 percent) for economicforestland, and 1.15 million ha (2 percent) for land reformation.
• Renting of degraded forestlands by the private sector (not exceeding 8ha/holder). The Council of Ministers agreed that the Minister of Agriculture andCo-operatives should be permitted to authorise the rent of degraded forest land,within the National Forest Reserve, to private individuals for the purpose ofplantation establishment.
• Reorganisation of the State Enterprise, Forest Industries Organisation (FIO).The Council of Ministers agreed that the Forest Industries Organisation shouldplay a role in encouraging the private sector to invest in plantation development.
Regardless of these changes, the remaining forests would neither be protected nor new forestsestablished, without solving the problem of occupation of forest reserves by 12 million people.To solve the problem, the RFD issued a four phase policy in 1998, which included (i) zoning toseparate conservation and economic forest; (ii) demarcation of forest boundaries on the ground;(iii) land reform, to reverse degradation of areas by local people, re-establish agricultural land andlegitimise occupation of state land designated for agricultural processes; and (iv) protection andmanagement to prevent further encroachment on forest lands and to promote forest plantations,agroforestry and other sustainable land use practices.
An overview of forest plantation ownership as stipulated under the Reforestation Act 1992 isgiven in Table 2. There are a number of reasons for the low figures for registered plantations: (i)the Re-Afforestation Act does not stipulate registration of forest plantation for tree species otherthan teak (Tectona grandis) and Dipterocarpus alatus; (ii) farmers and other plantation ownersare unfamiliar with this new piece of legislation; (iii) Government officials offer poor service tothe general public; several thousand registration forms have to be processed; (iv) it is notnecessary to register until it is needed to fell the trees.

174
Table 1. Forest plantations registered with the RFD, 2000Plantation owner Number registered Area (ha) Number of treesFarmers 6 760 14 307 20 416 078Companies 912 3 853 4 895 316Government agencies 4 18.56 15 772State enterprise (FIO) 189 53 906.4 30 365 503Total 7 865 72 084.96 55 692 669
Source: Private Reforestation Division, RFD, 2001Under the Ninth National Economic and Social development plan (2002–2006), one of the mainstatements was aimed at conserving and improving natural resources, and also improvingutilisation. The Agricultural Development plan proposed conservation and rehabilitation ofprotected forest equalling not less than 30percent of the national land area and promotedestablishment of forest plantation in 2.56 million ha each of state and private land.SOURCES OF FOREST PRODUCTS DATA
The forestry information Data Centre was set up after establishment of the Forest InformationOffice in 1992. Information is collected both internally and from external organisations. Reportsare usually sent to the centre at quarterly, half-yearly or yearly intervals depending on the needs ofthe RFD.
Data is collected from the following organisations and departments:• Ministry of Agriculture and Co-operative
RFDOffice of Agriculture EconomicsThe Forest Industry OrganisationThe Thai Plywood Company Limited
• Ministry of FinanceThe Customs Department
• Ministry of CommerceDepartment of Export Promotion
• Ministry of IndustryDepartment of Industrial Promotion
• Ministry of Science Technology and EnvironmentDepartment of Energy Development and Promotion
• UniversitiesFaculty of Forestry Kasetsart UniversityFaculty of Commerce and AccountancyUniversity of Chulalongkorn
• AssociationThe Thai Furniture Industries AssociationThe Thai Parawood AssociationPaper and pulp AssociationThe Federation of Thai Industries
• Private sectorThe Siam Cement Group
• ‘Rubber wood Utilisation and Marketing in Thailand’ Project supported by ITTOOtherwise, data on merchantable rubber wood is collected through field sampling and informationon teak and other timber is collected from records of confiscated logs.PRODUCTION AND TRADE OF FOREST PRODUCTS
In 1989 concessions were banned in order to save the nation’s forests. Since then, Thailand hasdepended on imported wood, particularly from neighbouring countries. Wood production figures,including both permitted and confiscated logs, are reported at monthly intervals by ProvincialForest Offices to the Data Centre that undertake analysis. Trade data are collected from themonthly report of Department of Customs, Ministry of Finance. With respect to domestic wood
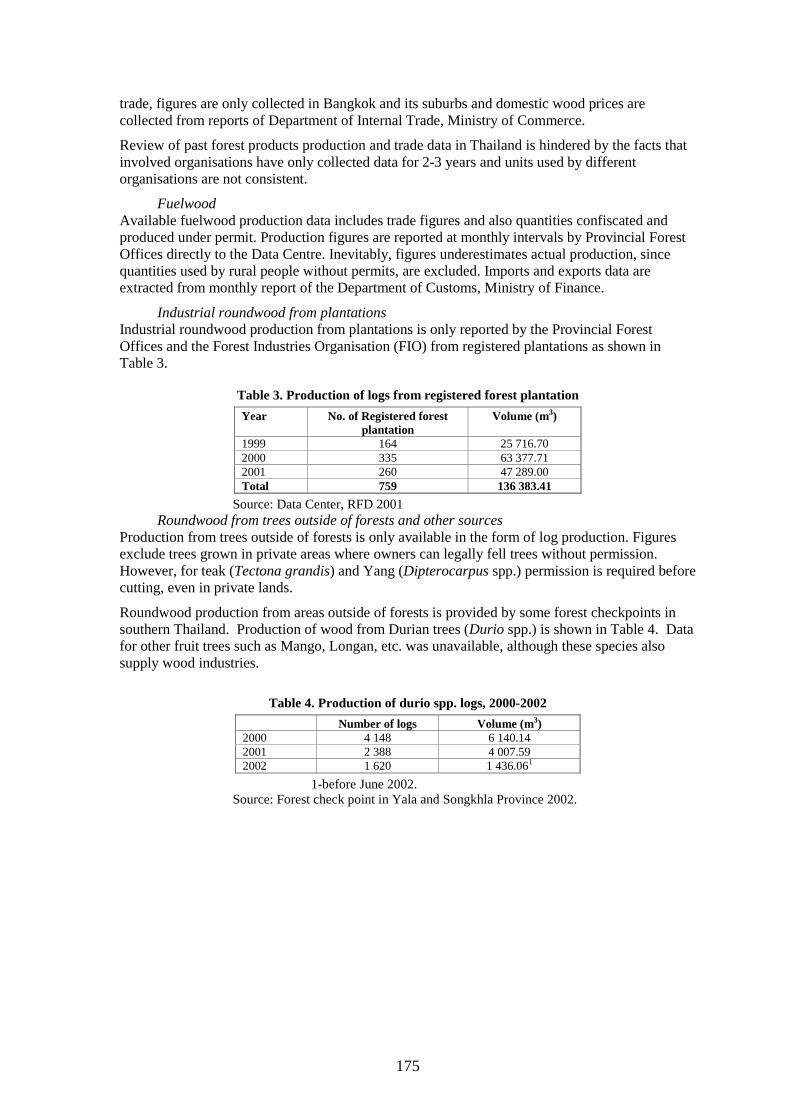
175
trade, figures are only collected in Bangkok and its suburbs and domestic wood prices arecollected from reports of Department of Internal Trade, Ministry of Commerce.
Review of past forest products production and trade data in Thailand is hindered by the facts thatinvolved organisations have only collected data for 2-3 years and units used by differentorganisations are not consistent.
FuelwoodAvailable fuelwood production data includes trade figures and also quantities confiscated andproduced under permit. Production figures are reported at monthly intervals by Provincial ForestOffices directly to the Data Centre. Inevitably, figures underestimates actual production, sincequantities used by rural people without permits, are excluded. Imports and exports data areextracted from monthly report of the Department of Customs, Ministry of Finance.
Industrial roundwood from plantationsIndustrial roundwood production from plantations is only reported by the Provincial ForestOffices and the Forest Industries Organisation (FIO) from registered plantations as shown inTable 3.
Table 3. Production of logs from registered forest plantationYear No. of Registered forest
plantationVolume (m3)
1999 164 25 716.702000 335 63 377.712001 260 47 289.00Total 759 136 383.41
Source: Data Center, RFD 2001Roundwood from trees outside of forests and other sources
Production from trees outside of forests is only available in the form of log production. Figuresexclude trees grown in private areas where owners can legally fell trees without permission.However, for teak (Tectona grandis) and Yang (Dipterocarpus spp.) permission is required beforecutting, even in private lands.
Roundwood production from areas outside of forests is provided by some forest checkpoints insouthern Thailand. Production of wood from Durian trees (Durio spp.) is shown in Table 4. Datafor other fruit trees such as Mango, Longan, etc. was unavailable, although these species alsosupply wood industries.
Table 4. Production of durio spp. logs, 2000-2002Number of logs Volume (m3)
2000 4 148 6 140.142001 2 388 4 007.592002 1 620 1 436.061
1-before June 2002.Source: Forest check point in Yala and Songkhla Province 2002.

176
Roundwood production from trees outside of forests should be available directly from plantations;there are no specific reports, as harvesting is carried out by the plantation owner themselves.
PlywoodIn Thailand, the Thaiplywood Co. Ltd., established by the Forest Industries Organisation, initiatedplywood manufacturing in 1957 and the Thaichipboard Co. Ltd. instigated export of veneer in1971. Today, there are 14 veneer factories and 21 plywood factories, although the majority ofplywood factories also produce veneer. Only one company (Thaiplywood Co., Ltd.) attained theplywood standard from the Industry Standard Office of Thailand.
Veneer and plywood manufacturers in Thailand have faced raw materials scarcity and high pricesthat have resulted in reductions in output. This has been partly due to the fact that many log-exporting countries, such as Indonesia and Malaysia, have policies to export sawnwood instead ofroundwood in order to add value within the country of origin. The shortage of large logs hasforced some factories to re-equip with peeling machines of 4ft rather than 8ft length and withslicing machines cutting the thinnest veneer at 0.1 mm. Some factories, however, import logs forveneer production and then re-export. Thailand also imports finished plywood and overlay tosupply local markets and many plywood industries use overlay on particle board or MDF tocompensate for the lack of plywood. Unfortunately, plywood production records are not availablebecause of the shortage of raw materials.
Pulp and paperThe situation of the Pulp and Paper Industry in Thailand improved significantly in 2000 as a resultof economic growth and rapid global price increases. Pulp and paper consumption was expectedto grow at 5 percent to 2.8 million tonnes, close to the pre-crisis level, while capacity wasexpected to increase by approximately 6percent from 4.4 million tonnes to 4.6 million tonnes.
Paper production capacity rose by 7 percent between 1999 and 2000 to 3.7 million tonnes andtotal short fibre pulp production capacity increased slightly to 956 000 tonnes. The overallutilisation rate for the industry was 67 percent, although some producers with export capabilityran at much higher rates.
The existing five pulp mills in Thailand are as follows:• Advance Agro Public Company Limited• Panjapol Pulp Industry Public Company Limited• Phoenix Pulp and Paper Public Company Limited• Siam Cellulose Co., Limited• The Siam Pulp and Paper Public Company Limited
Growth rates in different other sectors of the Thai economy are shown in Table 5.
Table 5. Growth rate in different sectors of the Thai economy (percent)Growth RateAverage growth
rate 1987-1991 1992 1993 1994 1995 1996 1997 1998 1999 20001 20011
GDP2 11.0 8.1 8.4 9.0 8.9 5.9 -1.4 -10.8 4.2 4.4 n.aAgriculture 4.5 4.8 -1.3 4.7 3.5 3.8 -0.7 -3.1 2.6 2.7 n.aNon-agriculture 12.2 8.6 9.8 9.4 9.5 6.1 -1.5 -11.7 4.4 4.6 n.aExport (US$) 26.6 13.8 13.7 22.1 24.6 -1.8 3.7 -6.8 7.4 19.6 -2.7Pulp & paperindustry
15.5 12.0 17.0 15.0 6.0 4.0 3.0 -16.0 12.0 5.0 5.0
1-Preliminary figures last updated September 28, 20012-GDP at constant 1988 priceSource: Bank of Thailand, The Thai Pulp and Paper Industries Association.

177
Pulp and wastepaperIn 2000, fibre consumption in Thailand was 2.7 million tonnes, an increase of 1 percent from1999 levels. Consumption comprised 655 000 tonnes of short fibre, 213 000 tonnes of long fibreand 1.9 million tonnes of wastepaper (Table 6). Consumption of pulp is expected to increase from868 000 tonnes in 2000 to 1.2 million tonnes in 2004. This figure takes into account plannedadditional capacity of Phoenix Pulp and Paper Public Company Ltd. in 2003, with a capacity of250 000 tonnes.
Demand for short fibre pulp decreased by 4 percent, between 1999 and 2000. As supply exceededdemand, major pulp producers exported a surplus of 254 000 tonnes, an 11 percent increase from1999. The producers benefited from improved pulp prices and the weakening of the baht in thesecond half of 2000. Importers included China, Australia, Singapore, Japan and South Korea.Consumption of long fibre pulp, all of which was imported, increased by 2 percent from 1999.Supplying countries included Canada, USA, Chile, Sweden, Germany and New Zealand.
In 2000, 952 000 tonnes of wastepaper were imported, mainly from USA, Japan, Germany,Singapore and Netherlands. Old corrugated containers accounted for 72 percent of the imports.
Table 6. Pulp and wastepaper consumption and trade, 1990 and 2000 (’000 tonnes)
Consumption Import Export1999 2000 1999 2000 1999 2000
Short fibre pulp 682 655 29 31 230 254Long fibre pulp 209 213 336 328 - -Total pulp 891 868 365 359 230 254Wastepaper 1 802 1 861 935 952 - -
Source: The Thai Pulp and Paper Industries Association 2001World pulp prices increased continuously from mid 1999 to the third quarter of 2000 fromUS$540 per ton to US$710 per ton, but slowed at the end of 2000 due to the weak demand inthe region.
PaperTotal paper consumption in Thailand was about 2 million tonnes in 2000, up 9 percent from 1999(Table 7). The rise was mostly due to increases in demand for kraft paper and printing and writingpaper, driven by exports and a boom in publishing and advertising. By 2004, paper consumptionis expected to reach 2.4 million tonnes with an annual growth rate of 6 percent from 2000.
Paper capacity in 2000 comprised: (i) kraft paper, 2.2 million tonnes, (ii) printing and writingpaper, 983 070 tonnes, (iii) paperboard, 254 100 tonnes, (iv) household and sanitary paper, 80 340tonnes and (v) newsprint, 122 000 tonnes. Due to over-supply, has been no new paper productioncapacity has been installed in the last few years, although minor capacity increases were madethrough modifications or programs to reduce bottlenecks. This situation is likely to continue in thecoming years.
In 2000, paper imports increased by 22 percent from 1999 to 420 179 tonnes. The increase wasmainly attributed to a shortfall in domestic supply of newsprint and high quality printing andwriting paper, especially carbon and self-copy paper. The major exporters to Thailand wereIndonesia, Japan, USA, Sweden, Taiwan, Finland, Korea, Russia, New Zealand and Singapore.
Between 1999 and 2000 exports decreased by 20 percent due to the recovery in domestic demandfor kraft paper and printing and writing paper. The main export markets were China, Hong Kong,Malaysia, Singapore, USA, Philippines, Taiwan and Australia.
Over-supply is expected to continue to 2004 especially with respect to kraft paper and printingand writing paper. However, newsprint capacity is below demand but no plans for increasing newcapacity have been put forward.
Table 7. Paper consumption and trade, 1990 and 2000 (‘000 tonnes)Consumption Import Export
1999 2000 1999 2000 1999 2000

178
Kraft paper 1 018 1 018 33 48 501 379Printing & writing paper 320 363 85 106 377 291Paperboard 192 188 55 42 6 220Newsprint paper 220 270 113 149 13 320Household & sanitary paper 53 270 8 10 28 320Other papers - 57 52 65 34 320Total 1 803 1 959 346 420 959 772Source: The Thai Pulp and Paper Industries Association 2001.
Forest products customs dataThe Customs Department under the Ministry of Finance is responsible for forest products tradestatistics. The classifications used are the World Custom Organisation HS and HS 2002 systems.The Department has a specific category for forest products trade and data are collected eachmonth and reviewed twice annually. The reports are published on the Internet and distributeinternally to other departments according to individual requirements. The RFD have requestedforest products trade statistics be supplied every six months.
Weakness and constraints in the forest products statistical system
In the past, forest products production and trade statistics were collected through interview orwere estimated by persons working in related fields. In many cases, these methods resulted ininaccuracies in the data. Weaknesses and constraints in the existing system of national datacollection, analysis and dissemination are as follows:
• Companies and producers are located over a wide area and have a wide range ofspheres of activity. This increases difficulties encountered in data collection.
• The organisations involved in collection, analysis and dissemination of woodproducts data are constrained by a lack of knowledge, funds and experience tomanage the necessary systems.
• Many organisations involved in forest products data collection, analysis anddissemination lack human resource with experience of data system management.
• Wood industries in the public and private sectors collect data individually with noconsistency in the formats used.
• Many forest products related organisation do not and have not kept regular recordsbut, rather, have collected data only when necessary.
• Persons working on data collection lack incentives from their organisation tostimulate functioning of efficient statistical systems.
The Data Centre has good human resource and equipment developing data systems and networkson forest product and trade. If there good procedures are maintained work will continue well intothe future.

179
Table 8. Matrix of constraints and weaknesses in the current statistical systemsElement Constraint Weakness SuggestionsProduction Data is collected using a
variety of systems, whichhinders monitoring andcentralised collation.Statistics are collected withdifferent objectives so arenot compatible at thenational level.
Organisations do not collectdata regularly and may notkeep records after data hasbeen used.Specific data are oftencollected for definedpurposes that are notapplicable for otherpurposes.
All organisations involved with forestproducts statistics should co-operateto find a common method for datacollection that fits in with theinternational systems and in whichrepetition of efforts is avoided.
Trade The Customs Departmentonly collect data for taxationpurposes.
Trade data is not availablefrom organisationsincluding the CustomsDepartment, for all tradedproducts.
Organisations should collaborate indata collection and organisationsrequiring specific data should inform TheCustoms Department of their needs.
RECOMMENDATIONS
Measures proposed to improve collection, processing and dissemination of statistics related towood-products in Thailand include:
• Training of individuals involved in data collection.• Acquisition of equipment to support preparation and evaluation of data.• Employment of persons with experience in data collection.
These proposals can be integrated into existing systems through the following measures:• A task force should be organised to work on forest products data.• Organisations involved with forests products should assemble and agree on ideas
for creation of a master plan and subsequently work together under the definedframework.
• Each organisation involved with forests products should send representatives to aworkshop to allow the organisations to share results and to proceed in concert.
ReferencesForest Research Office, RFD, 2000. Technical Report ‘Status of Rubberwood Utilisation and
Marketing in Thailand. Bangkok.Royal Forest Department, 2000. Forestry Statistics of Thailand. Bangkok.The Thai Pulp and Paper Industries Association 2001. 2001 Directory.
Web siteshttp://www.forest.go.thhttp://www.dedp.go.th/reports/energy.asp?http://www.dedp.go.th/reports/document.asp?book=2&name=sitener42http://www.custom.go.th/cgi-bin/statistic/normal.cgihttp://www.fti.or.th/nfti/group/http://www.fti.or.th/nfti/group/thai/g02/panel-index.htmlhttp://www.fti.or.th/nfti/group

180
National forest products statistics, Viet Nam
INTRODUCTION
Prior to 1995, the former Ministry of Forestry collated data on production and trade of forestproduct in Viet Nam. A large amount of timber and fuelwood was harvested from natural forestswhilst plantations were small in area and had not yet reached harvesting age. However, since1998, natural forests have been closed and the permitted annual cut has been set at 300 000 m3.
Production of wood-based products in Viet Nam for 1990 and 1995-2000 are shown in Table 1. Incomparison to pre 1990 levels, annual roundwood production decreased between 1996 and 2000.At present, 1.5 million m3 of roundwood are harvested annually from plantation forests andscattered trees. Production is rising rapidly as more plantations reach maturity, despiteconsiderable reductions in fuelwood consumption as a result of increasing use of alternative fuels.
Table 1. Production of wood-based products in Viet NamQuantity producedProduct
1990 1995 1996 1997 1998 1999 2000Roundwood(1000 m3) 33 467.8 33 621.1 29 105.2 30 836.4 28 741.6 28 754.4 29 024.7
Woodfuel(1000 m3)
30 445.6 29 828.0 28 272.2 27 356.4 25 490.8 25 229.6 24 842.7
Industrialroundwood (1000m3)
3 022.2 3 793.1 3 833 3 480 3 250.8 3 524.8 4 182.0
Sawlogs andveneer logs (1000m3)
2 822.2 2 793 2 833 2 480 2 216.8 2 122.5 2 570.6
Sawnwood (1000m3) 1 606 1 398 1 184 2 705 2 937 2 950
Wood panels(1000 m3) 6 6
Pulp for paper(MT) 44.6 60 70 77.8 58 7 61 513 72 863
Paper andpaperboard (MT) 79 216.9 220 263 311 349 377
Prior to 1999, volume figures for timber harvested from plantations were collated from cuttingpermits by MARD. Data included timber harvested by State Forest Enterprises and organisationsmanaging large areas of forest, but did not account for harvests from small scale plantations andtrees outside forests. The latter were excluded because many farmers felled trees without cuttingpermits due to the laborious application procedures. Furthermore, even when permits wereobtained, data was not effectively collected and volumes unaccounted for were significant,particularly in remote areas. In 1998, the volume of timber harvested with permits was 320 000 m3
The figure for plantations and trees outside forests, collated from several organisations, exceeded980 000 m3 in 1998 and 1.4 million m3 in 2000. The organisations from which data was takenincluded the Provincial Departments of Agriculture and Rural Development, Local ForestProtection Departments and Provincial Statistical Offices. Institutions within the Department ofAgriculture and Rural Development are shown in Figure 1.

181
Figure 1. Institutions within the Department of Agriculture and Rural Development
Since 1998, plantation wood markets, particularly in remote areas, have faced many difficultiesdue to market unavailability, low prices and policy hurdles. As the majority of householdsdependent on revenue from plantations were already poor, the economic impacts of the situationwere accentuated. To improve matters, the Government abolished cutting permits for plantationforests in 1999, and households have since only needed to inform local forestry agencies ofplanned harvests. This simplification encouraged greater farmer involvement in plantationactivities, made it easier for provincial forestry agencies to approach forest owners and increasedfarmers’ willingness to declare harvests. It has also been suggested that simplification of cuttingpermit procedures has aided macro regulation and planning by helping prevent data ‘leaks’.However, the simplifications have also created new difficulties in assessing national timberproduction from remote areas and small-scale plantations. Overall, the simplification of plantationforest harvest procedures did not have a great effect on figures for volumes harvested fromplantation forests.
FOREST PRODUCTS DATA SOURCES AND COLLECTION METHODOLOGIESIn Viet Nam, forest products data are collected by a range of organisations using differentmethodologies. A full list of organisations involved in collection, analysis and dissemination offorest products statistics is given in Appendix 1; for this report data were obtained from thesources detailed in the following sections.
Provincial Departments of Agriculture and Rural DevelopmentThe Provincial Departments of Agriculture and Rural Development and the General Departmentof Statistics collect data on timber volumes from plantations and trees outside of forests,Woodfuel (including wood for charcoal), sawlogs and veneer logs, sawnwood, wood chips,particles, wood-based panels, wood pulp and paper and paper board. Data on roundwood,fuelwood and sawnwood are collected from provinces, districts and communes using two mainmethods: (i) information extracted from cutting permits; and (ii) countrywide inventories ofhouseholds to determine roundwood quantities harvested by local communities. The latter areconducted every two and a half years in all 61 provinces of the country. Each province is stratifiedinto areas with similar environmental and socio-economic conditions and in each a representative
Ministry of Agriculture and Rural Development
Provincial Departments of Agricultureand Rural Development
Sub-Department of Forest Protection atProvincial Level
District Divisions of Agriculture andRural Development
District Level Division of ForestProtection
Commune Forestry Staff

182
district is selected. Communes representing different ecological, economic and social conditionsare then and surveys of households are carried out.
The General Department of Customs of Viet NamThe General Department of Customs of Viet Nam collect data on forest products exports andimports. Customs data collection is governed by the 1990 Ordinance on Customs and since 1995,the statistical system has improved greatly. All information on customs declaration forms, frommore than 100 checkpoints, is processed by computer and transmitted each day to the informationand statistical centre of the General Department of Customs. In 1988 the Customs Departmentbegan to publish the ‘Viet Nam Customs Yearbook on Foreign Merchandise Trade’. TheHarmonised System (HS) of the World Customs Organisation is presently adhered to, andquantity and value data on forestry exports and imports are included under code HS 96, with 4digits.
Viet Nam Paper Making AssociationAnnual reports of the Viet Nam Paper Making Association include information on plantationtimber consumption, wood pulp, wood chips, a number of types of paper and also quantities ofwood chips exported to Japan, Taiwan and Korea (Vinachip Co. Ltd.). The membersorganisations that provide data include the Viet Nam Paper Corporation, the Viet Nam PaperMaking Association, the Korean Panel Association, the Korean Customs and Japan FinanceMinistry42. Data are neither regularly updated nor highly reliable.
District and Provincial Forest Protection UnitsDistrict and Provincial Forest Protection Units in the Forest Protection Department collect data ontimber use of households living near forest from cutting permits. Figures are only a reference asthey do not include all timber harvested by households in remote areas.
Other data sourcesData sources other than those listed above include:
• Reports or yearbooks of Ministry of Industry (data on paper andpaperboard).
• Other Vietnamese organisations and units using plantation timber.
There is no good source of data on wood charcoal or wood based panels although some data canbe found in certain documents. These products have not been produced in large quantities in VietNam; at present, an MDF factory with annual capacity of 50 000 tonnes and a particle boardfactory of 16 000 tonnes per year are under construction.
FOREST PRODUCTS STATISTICAL PUBLICATIONS IN VIET NAM
Publications including forest products statistics in Viet Nam include:• ‘Statistical Year Book’ of the General Department of Statistics, published
by the Statistics Publishing House. The publication includes data on industrialroundwood, fuelwood, sawnwood, paper and particle board, and gross output ofindustrial roundwood by province. Data are collected by Provincial and DistrictStatistical Offices.
• ‘Statistical Year Book’ of the Provincial Departments of Statistics.• ‘Viet Nam Customs Year Book on Foreign Merchandise’ of the Viet Nam
General Department of Customs. 42 Viet Nam mainly export wood chips to Japan, Taiwan, and South Korea

183
• Statistical reports and year books of the Ministry of Agriculture and RuralDevelopment (MARD); includes data on national forest cutting permits granted toprovinces and timber harvested from plantation forests by state owned units43.
• Statistical reports of the Provincial Departments of Agriculture and RuralDevelopment, Provincial Departments of Industry, Provincial Statistics Centres,and local Customs Departments.
• Statistical reports of the Timber Association and Paper Association.
MAIN WEAKNESSES AND CONSTRAINTS IN THE CURRENT STATISTICALSYSTEMIn general, data on forest products from existing document in Viet Nam are not adequatelyupdated or synthesised and are spread across a number of organisations that collect raw data fromdifferent sources and with different levels of precision. A number of products are not fullyinventoried and information is often lacking on either the quantity or value of forest productstraded. In addition, various names of forest products have not been defined according tointernational standards.
Trade figures are also of low precision and the data and data collection approaches are oftenincoherent. For instance, the diverse definitions of various product types as well as the differentapproach to data collection lead to different statistical results for one product. The statisticalstructure from central to local level for collecting trade data is not well organised and the staffinvolved frequently lack adequate training.
Production of wood charcoal, wood chips and particles and wood residues has not been includedin the forestry statistics of Viet Nam and is only found scattered in a number of reports.
Data on wood-based panels published in statistical documents in Viet Nam are incomplete. This isparticularly the case with plywood as the plywood production units are backward, use semi-manual technology, are scattered and have unstable production levels.
RECOMMENDATIONS TO IMPROVE FOREST PRODUCTS STATISTICAL SYSTEMS
Recommendations to improve the current forest products statistical system include the following:• Forest products data collection networks should be streamlined at all
levels. The system may be based on the existing forestry department structure.• Staff, and particularly grassroots level staff, should be trained in forest
product statistical procedures. Training should include staff in related Ministriesand sectors, such as the General Department of Statistics and the GeneralDepartment of Customs.
• Units working on forest products data should be adequately equipped withappropriate information technology to improve the data collection process.
• A financial mechanism should be put in place for collection, compilationand dissemination of forest product data and a fee may be charged for data use.
• The function and tasks of agencies working with forest product productionand trade data should be clarified, as should linkages between them and betweennational and international organisations.
43 Only data for 1998 and before are available. Since 1999, MARD has not administered cutting fromplantation forests and cutting has been at the liberty of the forest owners.

184
Appendix 1
ORGANISATIONS INVOLVED IN COLLECTION, ANALYSIS AND DISSEMINATION
OF FOREST PRODUCTS DATA
General Department of Statistics of Viet Nam, No. 2 Hoang Van Thu Street, Hanoi,Provincial Statistical Offices (in every province),Ministry of Agriculture and Rural Development, (MARD) No.2 Ngoc Ha Street, Hanoi,Provincial Departments of Agriculture and Rural Development,Forest Development Department, MARD, 2. Ngoc Ha Street, Hanoi, Viet Nam,Forest Protection Department, MARD, No. 2 Ngoc Ha Street, Hanoi, Viet Nam,Provincial Forest Protection Departments,Department of Planning and Projection (statistical Division), MARD, No. 2 Ngoc HaStreet, Hanoi,Viet Nam Paper Making Association, 18C Pham Dinh Ho Street, Hanoi,Paper Corporation of Viet Nam, 31 Ly Thuong Kiet Street, Hanoi, Viet Nam,Forestry Corporation of Viet Nam, 127 Lo Duc Street, Hanoi, Viet Nam,Timber Association of Viet Nam, 127 Lo Duc Street, Hanoi, Viet Nam,District Statistical Divisions,District Division of Agriculture and Rural Development,Ministry of Trade (Ngo Quyen Street, Hanoi, Viet Nam),General Department of Customs of Viet Nam, 162 Nguyen Van Cu, Gia Lam, Hanoi,Provincial Departments of Customs,Customs Clearance Checkpoints.