Embed Size (px)
Citation preview

1
Department of Economics
Department Discussion Paper DDP1403
ISSN 1914-2838
WP0604
ISSN 1485-6441
The Dynamics of Rural Non-farm Employment in India:
Gender, Agricultural Productivity, and Literacy
Jane Doe & Mary Smith
David E. Giles
Alok Kumar Department of Economics, University of Victoria
Victoria, B.C., Canada V8W 2Y2
&
Kam Shergill Department of Economics, University of Victoria
Victoria, B.C., Canada V8W 2Y2
July, 2014
Author Contact: Alok Kumar, Dept. of Economics, University of Victoria, P.O. Box 1700, STN CSC, Victoria, B.C., Canada
V8W 2Y2; e-mail: [email protected]; Voice: (250) 721-8543; FAX: (250) 721-6214
V8W 2Y2; e-mail: [email protected]; FAX: (250) 721-6214
Abstract
This paper analyzes the determinants of the rural non-farm employment in the fifteen major
states of India by using panel data analysis for the period 1972-2010. The analysis indicates
that there are significant gender differences in the factors affecting the level and the growth
of rural non-farm employment. The level of urbanization, the rural literacy rate and the rural
unemployment rate have a significant positive effect on the incidence of non-farm
employment for male workers. For female workers, agricultural productivity and the
incidence of rural poverty have a significant positive effect. There is evidence of
convergence in the incidence of rural non-farm employment for both male and female
workers, indicating that states with initially low incidence of rural non-farm employment
experienced a higher growth rate in the rural non-farm employment than states with initially
high incidence.
Keywords: Rural Non-Farm Employment, Male, Female, Convergence, Panel Data
JEL Classifications: J22, I20, D60
JEL Classifications:
The Dynamics of Rural Non-farm Employment in India:
Gender, Agricultural Productivity, and Literacy
Alok Kumar* and Kam Shergill**
July 2014
Abstract
This paper analyzes the determinants of the rural non-farm employment in the fifteen major
states of India by using panel data analysis for the period 1972-2010. The analysis indicates
that there are significant gender differences in the factors affecting the level and the growth
of rural non-farm employment. The level of urbanization, the rural literacy rate and the rural
unemployment rate have a significant positive effect on the incidence of non-farm
employment for male workers. For female workers, agricultural productivity and the
incidence of rural poverty have a significant positive effect. There is evidence of convergence
in the incidence of rural non-farm employment for both male and female workers, indicating
that states with initially low incidence of rural non-farm employment experienced a higher
growth rate in the rural non-farm employment than states with initially high incidence.
Key Words: Rural Non-Farm Employment, Male, Female, Convergence, Panel Data JEL Code: J22, I20, D60
Address: * Corresponding Author: Department of Economics, University of Victoria,
Victoria, British Columbia, Canada, V8W 2Y2, Email: [email protected]
** Department of Economics, University of Victoria, Victoria, British Columbia, Canada,
V8W 2Y2, Email: [email protected]

1
1. Introduction
The process of economic development involves the structural transformation of the
economy. One important facet of the development process is the diversification of
occupations and employment with workers moving away from primary activities to
secondary and tertiary activities. In this paper, we analyze the process of diversification of
employment in the rural areas of India, in particular the growth of rural non-farm
employment, across fifteen major states in the last forty years
There are two contrasting views about the role of rural non-farm employment in the
development process. One view is that it is a residual sector and its relative importance in the
rural areas should decline with agricultural development (Hymer and Resnick 1969). This
sector mainly employs workers who are unable to find jobs in the agricultural sector. The
growth of the rural non-farm employment is largely a manifestation of the economic distress
caused by the failure of agriculture to gainfully absorb the growing rural population
(Vaidyanathan 1986).
The other view is that it is an integral part of the rural development strategy in the
developing countries. The growth of rural non-farm sector plays a critical role in the
alleviation of rural poverty, particularly in the case of small and marginal farmers (Ravallion
and Datt 1995). It plays a central role in the skill and the human capital formation in the rural
areas (Hazell and Haggblade 1991). There is a symbiotic relationship between the growth of
agricultural and non-farm sectors. The growth of rural non-farm sector is crucial for the
agricultural development due to its strong forward and backward production linkages (Ranis
and Stewart 1993).
In this paper, we analyze the determinants of the incidence (proportion) of rural non-
farm employment and its growth in the fifteen major states for the period 1972-2010 using

2
National Survey Organization (NSSO) data on employment and unemployment. There are
three distinctive features of our analysis.
Firstly, we use panel data method for the econometric analysis which allows us to
incorporate time-invariant unobserved characteristics of states. Secondly, we analyze the
rural non-farm employment of both male and female workers. Existing studies on the rural
non-farm employment focus on male workers (e.g. Dev 1990, Unni 1991, Kumar 1993,
Basant et.al 1998, Kashyap and Mehta 2007). Thirdly, we analyze the dynamics of the rural
non-farm employment by using dynamic panel data regression model. In particular, we
examine the issue of convergence in the rural non-farm employment i.e. whether states with
initially low incidence of rural non-farm employment have a higher growth rate in the non-
farm employment than the agricultural employment compared to states with initially high
incidence of rural non-farm employment.
The issue of convergence in the rural non-farm employment has received scant
attention from researchers, though data suggests that the proportion of rural non-farm
employment in the total rural employment varies significantly across states. In addition, these
differences have been persistent over time. This raises the issue whether states with low share
of non-farm employment would catch up with states with high share. One may expect that
states with relatively low levels of rural non-farm activities will have higher rate of return
from this sector than agricultural sector. Other things remaining the same, this sector will
receive relatively more investment and over time there will be convergence in the share of
rural non-farm activities in total rural output and total rural employment across states.
However, there is also a possibility that some states can specialize in the agricultural sector
and some states in the non-farm sector depending on geographical, social and economic
factors. In this case there will be non-convergence.

3
The main findings of our analysis are as follows. Firstly, there are significant gender
differences in the determinants of the rural non-farm employment. The incidence of non-farm
employment of male workers is positively affected by urbanization, rural literacy and rural
unemployment. On the other hand, the incidence of rural non-farm employment of female
workers is positively affected by agricultural productivity and the incidence of rural poverty.
Secondly, there is a strong evidence of convergence in the incidence of rural non-farm
employment for both male and female workers.
The rest of the paper is organized as follows. Section 2 examines the trend in the non-farm
employment across states. Section 3 discusses the econometric model and explanatory
variables used in the regression. Section 4 analyzes the regression results. This is followed
by conclusion.
2. Trend in the Rural Non-Farm Employment
The term ‘rural non-farm employment’ refers to all those economic activities that are
carried out in rural areas, but are not directly related to agricultural production and its allied
activities1. For our analysis, the information on employment and unemployment is taken from
the employment and unemployment survey reports of the National Sample Survey
Organization (NSSO) of the Government of India. We have used data for eight NSSO data
rounds i.e. 27th
(1972-73), 32nd
(1977-78), 38th
(1983), 43rd
(1987-88), 50th
(1993-94), 55th
(1999-00), 61st
(2004-05) and 66th
(2009-10) round. We use data for the following major
states of India: Andhra Pradesh, Assam, Bihar and Jharkhand, Gujarat, Haryana, Karnataka,
Kerala, Madhya Pradesh and Chhattisgarh, Maharashtra, Orissa, Punjab, Rajasthan, Tamil
Nadu, Uttar Pradesh and Uttarkhand, West Bengal. The information for the states created
1 The common convention is to include animal husbandry, poultry farming, bee keeping, hunting, fishing, forestry and logging in the allied
activities of agriculture.

4
after 1991 such as Uttarakhand2, Jharkhand
3 and Chhattisgarh
4 are clubbed with their parent
states of Uttar Pradesh (U.P.), Bihar and Madhya Pradesh respectively because separate data
for the newly created states did not exist for the pre-1991 period.
The NSSO uses different concepts in measuring employment and unemployment. In
this analysis, we use measures of employment and unemployment based on the usual
principal activity status. Data shows that at all India level, the incidence of non-farm
employment for rural male workers increased from 16.8 percent in 1972-73 to 37.2 percent
in 2009-10 and the incidence of non-farm employment for rural female workers doubled
over this period; from 10.3 percent in 1972-73 to 20.7 percent in 2009-10. Figures 1 and 2
show the trend in the incidence of rural non-farm employment at state level for male and
female workers respectively. It can be observed from the bar graphs that considerable
variation across fifteen states exists in the incidence of rural non-farm employment both for
male and female workers. In addition, these variations have been persistent.
On the basis of information presented in figures 1 and 2, the major states of India can be
divided into three categories of high, low and medium incidence of rural non-farm
employment both for males and female workers. The states of Kerala, Haryana, Punjab,
Rajasthan, Tamil Nadu, Uttar Pradesh, West Bengal and Bihar can be termed as the high
incidence states. On the other hand, the states of Madhya Pradesh, Karnataka, Gujarat and
Maharashtra can be categorized as the low incidence states. All the remaining states fall in
between these two categories and can be labeled as the medium incidence states.
2 Uttarakhand was carved out as a separate state from the northern part of the state of Uttar Pradesh (U.P) in November, 2000. The NSSO data on U.P prior to the 55th round treats Uttarakhand and U.P. as one state. 3 Jharkhand was carved out as a separate state of the southern part from the state of Bihar on 15th November, 2000.. 4 Chhattisgarh was formed when the 16 Chhattisgarhi-speaking South-Eastern districts of Madhya Pradesh gained separate statehood on 1st November 2000.
5
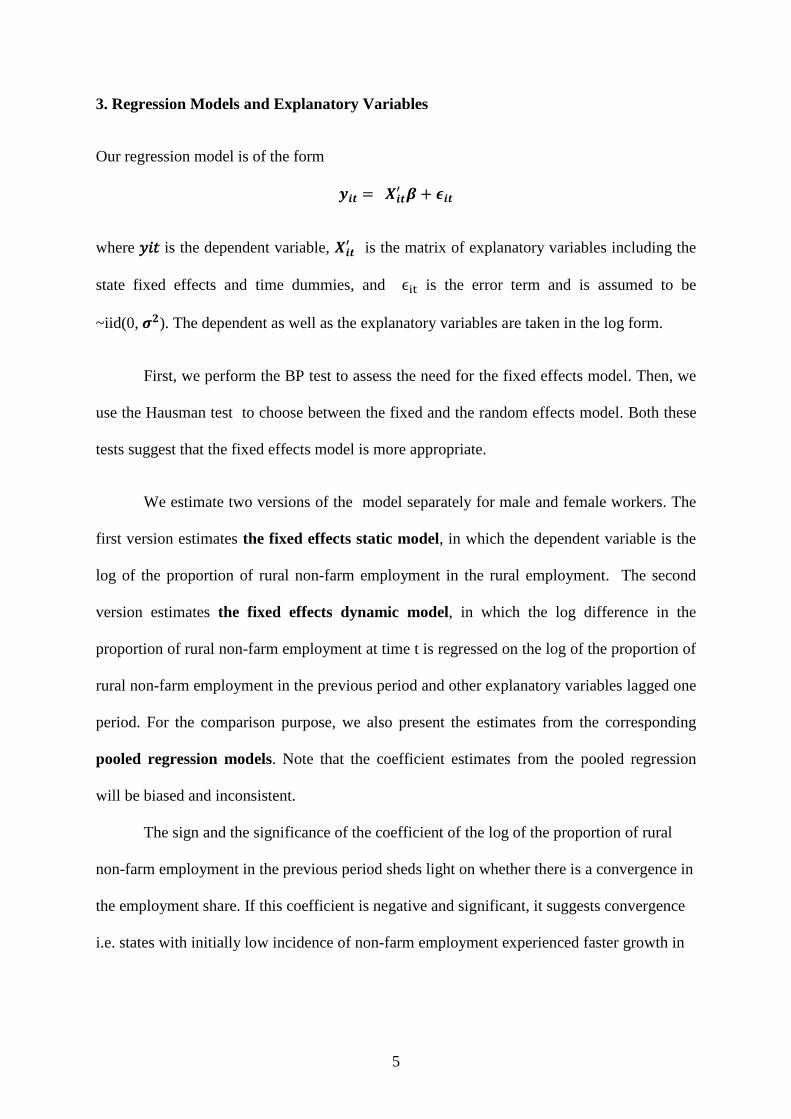
3. Regression Models and Explanatory Variables
Our regression model is of the form
where 𝑦𝑖𝑡 is the dependent variable, is the matrix of explanatory variables including the
state fixed effects and time dummies, and is the error term and is assumed to be
~iid(0, ). The dependent as well as the explanatory variables are taken in the log form.
First, we perform the BP test to assess the need for the fixed effects model. Then, we
use the Hausman test to choose between the fixed and the random effects model. Both these
tests suggest that the fixed effects model is more appropriate.
We estimate two versions of the model separately for male and female workers. The
first version estimates the fixed effects static model, in which the dependent variable is the
log of the proportion of rural non-farm employment in the rural employment. The second
version estimates the fixed effects dynamic model, in which the log difference in the
proportion of rural non-farm employment at time t is regressed on the log of the proportion of
rural non-farm employment in the previous period and other explanatory variables lagged one
period. For the comparison purpose, we also present the estimates from the corresponding
pooled regression models. Note that the coefficient estimates from the pooled regression
will be biased and inconsistent.
The sign and the significance of the coefficient of the log of the proportion of rural
non-farm employment in the previous period sheds light on whether there is a convergence in
the employment share. If this coefficient is negative and significant, it suggests convergence
i.e. states with initially low incidence of non-farm employment experienced faster growth in

6
the non-farm employment than in the agricultural employment compared to states with
initially high incidence of non-farm employment.
The explanatory variables used in the models are agricultural productivity, the
incidence of urbanization, the incidence of rural poverty, the rural unemployment rate, and
the rural literacy rate. These variables are widely used in the literature. The data for the rural
unemployment rate is taken from the NSSO reports.
The agricultural productivity is proxied by the value of output per hectare. The data is
taken from Bhalla and Singh (2010). The incidence of rural poverty is proxied by the
head-count ratio. The data is taken from Planning Commission of India documents. The
data for the rural literacy rate and the incidence of urbanization are from the Census of
India publications for 1971 to 2011.
4. Regression Results
In this section, we present and discuss the regression results.
4.1 Static Models
4.1.1 Male workers
Table 1 presents the results from the static models for male workers. The results from
the pooled regression model (column 2) show that agricultural productivity, the rural
unemployment rate and the rural literacy rate have a significant positive effect on the
proportion of rural non-farm employment. On the other hand, the incidence of rural poverty
and the urbanization level have a significant negative effect. The negative significant
coefficient of the urbanization level is surprising and is difficult to rationalize in view of the
positive effect of this factor indicated by earlier studies and also by theoretical reasoning.
7
The fixed effects model (column 3), however, yields very different results. It shows that
agricultural productivity and the incidence of rural poverty have an insignificant effect. In
addition, unlike pooled regression model, the level of urbanization has a positive significant
effect. The effects of the rural unemployment rate and the rural literacy rate remain positive
and significant similar to the pooled regression results.
The change in the sign of the coefficient of the incidence of urbanization and also
changes in the significance of the coefficients of agricultural productivity and the incidence
of rural poverty indicate that these variables are highly correlated with time-invariant
characteristics of states. They also suggest that time-invariant geographic and social factors
have significant effect on the incidence of rural non-farm employment.
The result that the rural literacy rate and urbanization have a significant positive effect
on the incidence of rural non-farm employment for male workers is similar to finding of
earlier studies. In addition, the positive significant effect of the rural unemployment rate on
the incidence of non-farm employment of male workers are found by many earlier studies
based on mostly single point cross-section data, e.g. Dev (1990), Unni (1991), Kumar (1993),
Basant et.al (1998), and Kashyap and Mehta (2007).
4.1.2 Female workers
Table 2 presents the results from the static models for female workers. The
comparison of the coefficients of the pooled regression model and the fixed effects model
show substantial differences between the two as in the case of male workers. We focus on
the estimates from the fixed effects model.
The results from the fixed effects model show that agricultural productivity and the
incidence of poverty have a positive and significant effect on the incidence of rural non-farm
employment of female workers. Urbanization, rural literacy and unemployment have an

8
insignificant effect. These results show that the determinants of the rural non-farm
employment of female workers are substantially different from male workers.
4.2 Dynamic Models
Tables 3 and 4 present the results from the dynamic models for male and female
workers respectively. Both tables show that the coefficient of the log of the proportion of
non-farm employment lagged one period is negative and significant for both pooled
regression and fixed-effect models for male and female workers. This provides strong
evidence of convergence in the incidence of non-farm employment across states i.e. states
with initially low proportion of rural non-farm employment experienced higher growth in the
non-farm employment than in the agricultural employment compared to states with initially
high proportion of rural non-farm employment.
Table 3 (column 3) indicates significant positive effect of urbanization and the rural
literacy rate on the growth of the incidence of rural non-farm employment of male workers.
It may be recalled that these two factors were also found to have a similar significant effect
on the incidence of the rural non-farm employment of male workers. For female workers
(Table 4, column 3) only the rural literacy rate is found to have a positive significant effect.
For both male and female workers estimated coefficients of pooled regression and fixed
effect models are substantially different. These results show that time-invariant geographic
and social factors have significant effect on the growth rate of the incidence of rural non-farm
employment.
4.3 Gender Differences
The results show that agricultural productivity and the incidence of poverty have a
positive significant effect on the incidence of non-farm employment of female workers, but

9
not on male workers. On the other hand, urbanization has a positive significant effect on the
incidence of non-farm employment of male workers only.
The different effect of agricultural productivity on female workers may be the result
of interaction of many factors. The gains of agricultural development brought about by the
green revolution and farm mechanization have percolated unevenly among farmers. It has
been the case that the fruits of agricultural development have predominantly gone to large
and medium farmers and not so much to small and marginal farmers. As a result the greater
prosperity of large and medium farmers may have increased the demand for those non-farm
goods and services that are mostly produced /supplied by female workers. For example,
females workers are greatly preferred for households chores as compared to their male
counterparts. The expansion of dairy farming, milk processing etc. undertaken by large and
medium farmers has also led to a greater demand for female workers.
A push factor may also be responsible for shifting female workers from the
agricultural sector to the rural non-farm employment. The introduction of new agricultural
technology and mechanization of farm operations have largely been responsible for higher
agricultural productivity. It has affected rural female and male workers very differently. It has
reduced the demand for female workers (who are mostly casual workers) in agriculture
relatively more. The farm operations in which females are predominantly employed (such as
priming, sowing, harvesting, threshing, winnowing) have been mechanized. This has pushed
out many female workers from agriculture and they have been compelled to take up jobs in
the rural non-farm sector.
The positive significant effect of the incidence of rural poverty on the non-farm
employment of female workers aligns with the push factors discussed above. The greater
incidence of rural poverty has compelled many rural females of poor marginal
10
rural households to take up non-farm jobs to supplement their household income. Rural
poverty has also forced many rural males to migrate to cities to supplement their family
income. This has created a void in the rural labor force which is filled by female workers.
Regarding the differential effect of urbanization, the positive effect of urbanization on
the non-farm employment primarily originates from the growth of employment opportunities
in urban centers. The development of better and inexpensive transport facilities have made it
possible for many members of rural households to shift to non-farm occupations, without
changing their residence by daily commuting to neighboring towns for work. For example
Basant (1993) reported that in 30 villages of Gujarat that he surveyed more that 25 % of non-
farm workers were commuting daily to nearby towns for work. However, given the cultural
factors and security issues, male workers have been the primary beneficiary of increased
employment opportunities in urban centers.
5. Conclusion
This paper examined the determinants of the incidence and the growth of rural non-
farm employment in India for both male and female workers. It finds that there are significant
gender differences in the determinants of the incidence and the growth of rural non-farm
employment. Urbanization, the rural literacy rate, and the rural unemployment rate have a
positive significant effect on the incidence of rural non-farm employment for male workers.
In the case of female workers, agricultural productivity and the incidence of rural poverty
have a positive significant effect. The study also finds evidence of convergence in the
incidence of rural non-farm employment with states with initially lower incidence of rural
non-farm employment experiencing relatively higher growth rate of non-farm employment
compared to states with initially higher incidence of rural non-farm employment.
11
Bibliography
Basant, R. (1993). "Diversification of Economic Activities in Rural Gujarat: Key Results of a
Primary Survey." The Indian Journal of Labour Economics, 36(3), 361-86.
Basant, R, B Kumar, and R Parthasarthy (1998). Non-Agricultural Employment in Rural
Gujarat. Jaipur: Rawat Publications.
Bhalla, G.S, and G Singh (2010). "Final Report on Planning Commission Project Growth of
Indian Agriculture:A District Level Study." Centre for the Study of Regional Development, 2.
Dev, Mahendra (1990). "Non-agricultural employment in Rural India: Evidence at a
Disaggregate Level." Economic and Political Weekly, 25(28) 1526-36.
Hymer, S and Resnick, S (1969). “A Model of an Agrarian Economy with Non-agricultural
Activities.” The American Economic Review, 59(4), 493 - 506.
Hazell, P.B.R, and S Haggblade (1991). "Rural Growth Linkages in India." Indian Journal of
Agricultural Economics), 46(4), 515-29.
Kashyap, S, and Niti Mehta (2007). "Non-farm sector in India: Temporal and Spatial aspects"
The Indian Journal of Labour Econoimics, Vol 50, No.4, 611-32.
Kumar, A (1993). "Rural Non-Farm Employment: A Static and Dynamic Study of Inter-State
Variations." The Indian Journal of Labour Economics, 36(3), 440-453.
Lanjouw, Peter, and Rinku Murgai (2008). “Poverty Decline, Agricultural Wages, and Non-
Farm Employment in Rural India 1983–2004.” Policy Research Working Paper 4858, The
World Bank Development Research Group Poverty Team.
Ranis, Gustav, and Frances Stewart (1993). "Rural Non-Agricultural Activities in
Development: Theory and Application." Journal of Development Economics, 40, 75-101.
Ravallion, Martin, and G Datt (1995). "Growth and Poverty in Rural India." Working Paper
Series 1405, World Bank, Washington, DC.
Reardon, T (1998). “Rural Non-Farm Income in Developing Countries: Importance and
Policy Implications.” The state of food and agriculture. FAO, Rome.
Unni, J (1991). "Regional Variations In Rural Non-agricultural Employment - An
Exploratory Analysis." Economic And Political Weekly: 26(3), 109-22.
Vaidyanathan, A (1986). "Labor Use In Rural India - A Study Of Spatial And Temporal
Variations." Economic And Political Weekly, 21( 52), A130-133.
12

13
Figure 2: Proportion of Male Workers in Rural Non-Farm Employment: State Wise (1972-73 to 2009-10)
Source: NSSO, Employment and Unemployment Situation in India, survey report for various rounds.
22.1
18.1
24.6
15.5
20.6
18.4
17.6
9.6
44.3
14.8
19.9
16.1
17.8
18.5
21.4
22.2
19.7
26
18
22.1
15.5
19.6
10.8
41
16.9
22.9
15.7
17
14.5
19.7
27.5
22.1
33.7
21.7
25.4
22.5
22.4
12.8
42.6
17.6
27.5
20.1
19.5
20.3
24.5
27.8
21.1
34.8
34.7
31.2
25.1
24.2
14.7
45.8
20.4
29.1
31.4
20
23.5
25.9
35.3
23.7
36
30.4
31.8
21.3
24.7
12.8
46.8
21.2
39.1
28.9
18
21.8
24.4
33.6
28.2
31.8
32.7
36.3
33
26.2
15.8
57.2
21.5
40.4
28.6
21
35.3
25.6
36.1
33.7
41.3
39.8
45.3
34.1
28.6
20.9
62.9
22.3
50.6
30.7
24.2
30.4
33.6
40.6
40.47
42.5
43
46.8
36
29
20
67.3
27.4
49.1
28.7
40.31
33.4
36.9
0 50 100 150 200 250 300 350 400 450
West Bengal
Uttar Pradesh and Uttaranchal
Tamil Nadu
Rajasthan
Punjab
Orissa
Maharashtra
Madhya Pradesh and Chhatisgarh
Kerala
Karnataka
Haryana
Gujarat
Bihar and Jharkhand
Assam
Andhra Pradesh
Non-Farm Male Workers as percent of All Rural Male Workers
Proportion of Male Workers in Rural Non-Farm Employment (1972-73 to 2009-10)
1972-73
1977-78
1983
1987-88
1993-94
1999-2000
2004-05
2009-10

14
Figure 3: Proportion of Female Workers in Rural Non-Farm Employment: State wise (1972-73 to
2009-10)
Source: NSSO, Employment and Unemployment Situation in India, survey report for various rounds.
43.1
15
15.6
8.4
37
18.3
6.6
4.4
41.4
10.9
15.6
8.7
14.8
18.5
13.8
31.1
10.9
16.4
4.7
10
14.2
7.8
5.3
27.4
12.5
9.5
5.6
11
20.6
14.6
24.9
10.3
18.2
6.1
7.4
19
7.16.1
29.1
11.8
9.7
7.4
11.8
21.9
18.7
29.2
8.7
22.9
16.7
8.4
22
8.6
8.9
34.3
14.5
7.5
24.2
9.8
17.7
17.9
41
10
21.5
7.3
7.3
15
8.8
6.1
37
15.4
6.8
9.4
8.1
16.8
16.3
45.9
12.5
24.1
8.1
9.4
19.6
6.1
8.4
40.2
12.2
7.9
8
14.3
20.6
15.7
41.2
13.5
26.2
10.5
10.3
25.4
9.3
11.9
48.3
14.5
9.4
10.9
13.6
11.7
21.5
58.7
13.6
27.6
27.2
17.7
23.8
8
11
57.2
19.3
18.6
7.8
20.4
13.8
23.6
0 50 100 150 200 250 300 350
West Bengal
Uttar Pradesh and …
Tamil Nadu
Rajasthan
Punjab
Orissa
Maharashtra
Madhya Pradesh and …
Kerala
Karnataka
Haryana
Gujarat
Bihar and Jharkhand
Assam
Andhra Pradesh
Non-Farm female workers as percent of all rural female workers
Proportion of Female Workers in Rural Non-Farm Employment (1972-73 to 2009-10)
1972-73 1977-78
1983 1987-88
1993-94 1999-00
2004-05 2009-10

15
Table1. Regression Results for Static Models (Male Workers)
Dependent Variable: Log of Proportion of Male Non-Farm Workers in Total Rural Male Workers
Explanatory Variables
Estimated Coefficients
Pool OLS LSDV FE Static
Log (Urbanization) -0.130589**
(0.054627)
0.350667*
(0.100067)
Log (Rural Literacy) 0.435200*
(0.067164)
0.514835*
(0.048877)
Log (Rural Unemployment) 0.182556*
(0.038080)
0.065878*
(0.018066)
Log (Agricultural Productivity) 0.099143**
(0.055051)
0.002133
(0.025252)
Log ( Rural Poverty)
-0.223371*
(0.042795)
0.006758
(0.050524)
0.752560 0.931722
Notes: (i) *, **, *** indicate respectively significant at 1%, 5% and 10% levels for a two tailed test. (ii) No. of observations = 120
(iii) Numbers in parentheses are standard errors.
(iv) The standard errors are White Heteroskedasticity-Consistent (v) Regression model included time-dummies and a constant.
Table2. Regression Results for Static Models (Female Workers)
Dependent Variable: Log of Proportion of female Non-Farm Workers in Total Rural female Workers
Explanatory Variables
Estimated Coefficients
Pool OLS LSDV FE Static
Log (urbanization) -0.268884**
(0.120618)
0.488842
(0.346561)
Log (Rural Literacy) 0.135274
(0.097789)
0.067808
(0.140308)
Log (Rural Unemployment) 0.360077*
(0.081741)
-0.023884
(0.111246)
Log (Level of Agriculture
Development)
0.478240*
(0.120901)
0.126958***
(0.075254)
Log ( Incidence of Rural Poverty) 0.247226**
(0.095684)
0.294779***
(0.170992)
0.484845 0.787876
Notes: (i) *, **, *** indicate respectively significant at 1%, 5% and 10% levels for a two tailed test.
(ii) No. of observations = 120
(iii) Numbers in parentheses are standard errors. (iv) The standard errors are White Heteroskedasticity-Consistent
(v) Regression model included time-dummies and a constant.

16
Table 3. Regression Results for Dynamic Models (Male Workers)
Dependent Variable: Log (NFE)-Log (NFE (-1))
NFE = Proportion of Non-Farm Male workers in Total Rural Male Workers
Explanatory Variables Estimated Coefficients
Pool OLS LSDV FE- Dynamic
(B) Log (NFE (-1)) -0.238172*
(0.070086)
-0.861712*
(0.104961)
Log (Urbanisation (-1) ) -0.054425
(0.041044)
0.433765**
(0.167596)
Log (Rural Literacy(-1)) 0.126222**
(0.060419)
0.480624*
(0.105972)
Log (Rural Unemployment (-1) ) 0.031914
(0.032286)
0.033384
(0.044391)
Log (Agricultural Development (-1)) -0.000311
(0.040644)
-0.019183
(0.029740)
Log (Incidence Rural Poverty (-1)) -0.097591*
(0.034553)
-0.024483
(0.041742)
R2
0.216188 0.545087
Notes: (i) *, **, *** indicate respectively significant at 1%, 5% and 10% levels for a two tailed test.
(ii) No. of observations = 105
(iii) Numbers in parentheses are standard errors. (iv) The standard errors are White Heteroskedasticity-Consistent.
(v) Regression model included time-dummies and a constant.
Table 4. Regression Results for Dynamic Models (Female Workers)
Dependant Variable: Log (NFE)-Log (NFE (-1))
NFE= Proportion of Non-Farm Female workers in Total Rural female Workers
Explanatory Variables
Estimated Coefficients
Pool OLS LSDV FE- Dynamic
(B) Log (NFE (-1)) -0.339292*
(0.080201)
-0.817930*
(0.073632)
Log (Urbanisation (-1) ) -0.137651
(0.096958)
-0.146932
(0.432682)
Log (Rural Literacy(-1)) 0.224319*
(0.077568)
0.357520*
(0.123552)
Log (Rural Unemployment (-1) ) 0.081337
(0.072407)
-0.137244
(0.091919)
Log (Agricultural Development (-1)) 0.056880
(0.101667)
0.011480
(0.084141)
Log (Incidence Rural Poverty (-1)) 0.031096
(0.075113)
-0.125114
(0.110714)
R2
0.296458 0.630307
Notes: (i) *, **, *** indicate respectively significant at 1%, 5% and 10% levels for a two tailed test.
(ii) No. of observations = 105 (iii) Numbers in parentheses are standard errors.

17
(iv) The standard errors are White Heteroskedasticity-Consistent.
(v) Regression model included time-dummies and a constant.