Embed Size (px)
Citation preview

University of South FloridaScholar Commons
Graduate Theses and Dissertations Graduate School
5-19-2010
The Dynamic Graphic Organizer and its Influenceon Making Factual, Comparative, and InferentialDeterminations within Comparative ContentCameron SpearsUniversity of South Florida
Follow this and additional works at: http://scholarcommons.usf.edu/etd
Part of the American Studies Commons, and the Secondary Education and Teaching Commons
This Dissertation is brought to you for free and open access by the Graduate School at Scholar Commons. It has been accepted for inclusion inGraduate Theses and Dissertations by an authorized administrator of Scholar Commons. For more information, please [email protected].
Scholar Commons CitationSpears, Cameron, "The Dynamic Graphic Organizer and its Influence on Making Factual, Comparative, and InferentialDeterminations within Comparative Content" (2010). Graduate Theses and Dissertations.http://scholarcommons.usf.edu/etd/3544

The Dynamic Graphic Organizer and its Influence on Making Factual,
Comparative, and Inferential Determinations within Comparative Content
by
Cameron Spears
A dissertation submitted in partial fulfillment
of the requirements for the degree of Doctor of Philosophy
Department of Secondary Education College of Education
University of South Florida
Major Professor: James A. White, Ph.D. Darlene DeMarie, Ph.D. Tina N. Hohlfeld, Ph.D. Dewey J. Rundus, Ph.D.
Date of Approval: May 19, 2010
Keywords: graphic organizer, generative learning, instructional
strategy, educational technology, research-based practices
Copyright © 2010, Cameron Spears

Dedication
I dedicate this dissertation to my wonderful wife, Mara. Without her love and
selfless encouragement, this endeavor would not have been possible.

Acknowledgements
I would like to thank the faculty members who helped me so much during my
years at USF. My first major professor, Dr. Bill Kealy, was instrumental in teaching me
how to think like a researcher; he helped me hit the ground running and was a great
mentor. My second (and last) major professor, Dr. Jim White, was not only an excellent
professor and mentor but also a pleasure to work with during each step of the process. He
always served as a guiding voice of reason—a great attribute for a major professor. I
would also like to thank my other committee members, Drs. Dewey Rundus, Darlene
DeMarie, and Tina Hohlfeld, for their helpful assistance and guidance throughout this
process.
I would like to thank other professors I have had at USF, especially Drs. John
Ferron, Tony Onwuegbuzie, Carol Mullin, and Doug Rohrer. These individuals all taught
me well in their respective fields. I would like to thank my 161 research participants
(without them there would be no data) and the various instructors who generously offered
extra course credit as an incentive to those participants. I would like to thank recent USF
computer science graduate Forrest Dix for his valuable assistance with the programming
portions of the research instrument used in this study.
I would like to thank my late mom and dad for being great parents, giving me the
opportunity to go to college after high school, and for teaching me the importance of
education at an early age. Finally, I would like to thank my wonderful wife, Mara, and
precious twins, Alexandra and Mitchell, for all the sacrifices they made while daddy was
working late so many nights and weekends.

i
Table of Contents
List of Tables iii
Table of Figures iv
Abstract vii
Chapter One: Introduction 1 Context of the Problem 2 Purpose of Research 3
Research Questions 5 Hypotheses 5
Summary 7 Definition of Terms 8 Organization of Remaining Chapters 9
Chapter Two: Literature Review 10 Graphic Organizer Origins 10 Modern Graphic Organizer Research 12
Reviews/Critiques 12 Significant studies 12
Generative Learning 16 Schema Theory 17 New Literacy 18 Theoretical Framework 18
Chapter Three: Method 26 Research Design and Participants 26 Materials and Measures 26
Displays 26 Computer programs 32 Design 34 Procedure 37
Chapter Four: Results 43 Overall Descriptive Statistics 43 Accuracy 46
Multivariate Analysis of Variance 47 Analysis of Variance 49
Latency 49 Multivariate Analysis of Variance 51

ii
Analysis of Variance 52 Text Viewing Time 53
Analysis of Variance 55 Click Events 56 Ancillary Questions 59
Trends YN 59 Trends Found 60 Mental Strategies Used 61 Effectiveness Query 64
Chapter Five: Discussion 65 Summary of Research Questions and Results 66 Discussion of Results 67
Research questions 67 Question one 67 Question two 68 Question three 69
Accuracy 69 Latency 71 Interactivity 73 Summary of Findings 75
Recommendations to Stakeholders 77 Learners 77 Instructors and Instructional Designers 78 Educational Researchers 79
Final Summary 79
References 83
Appendices 94 Appendix A. The original informational text passage 95 Appendix B. Informational text passage for the current study 96 Appendix C. Criterion items used in the study 98 Appendix D. Research instrument screen capture images 101 Appendix E. Pilot study screen capture images 123 Appendix F. Proposal defense outcomes and results 132 Appendix G. Final defense outcomes and results 148 Appendix H. IRB exempt certifications 152
About the Author END PAGE

iii
List of Tables
Table 1. Mapping of Mental Tasks to Original and Revised Bloom’s Taxonomies 4
Table 2. Independent Variable 35
Table 3. Dependent Variables 35
Table 4. Participant Distribution to Treatment Groups 44
Table 5. Descriptive Statistics for Accuracy Dependent Measures by Treatment 46
Table 6. Descriptive Statistics for Latency by Treatment 50
Table 7. Descriptive Statistics for TextTime (sec) by Treatment 54
Table 8. Descriptive Statistics for TextTime (sec) by Treatment (minus outliers) 54
Table 9. Descriptive Statistics for Sort Clicks by Treatment 59
Table 10. Descriptive Statistics for Shuffle Clicks by Treatment 59
Table 11. Descriptive Statistics for Trends Found 61
Table 12. Differences between Robinson & Schraw and this study 97
Table 13. Factual judgment-making criterion questions 98
Table 14. Comparative judgment-making criterion questions 98
Table 15. Inferential judgment-making criterion questions 99
Table 16. Aggregate criterion questions after having random sequence applied 100

iv
Table of Figures
Figure 1. A static graphic organizer 27
Figure 2. A sortable graphic organizer 31
Figure 3. A shuffle-sort graphic organizer 31
Figure 4. Steps in the experimental process 42
Figure 5. Mean Accuracy for mental task by graphic organizer type 47
Figure 6. Mean Latency in Seconds by Graphic Organizer Type 51
Figure 7. Mean TextTime (with and without outliers) 55
Figure 8. Participant responses to Trends Y/N question 60
Figure 9. Aggregate Reported Memory Strategies 63
Figure 10. Participant-reported effectiveness rating 64
Figure 11. Robinson and Schraw informational text passage 95
Figure 12. Current informational text passage 96
Figure 13. Opening screen 101
Figure 14. Second introduction screen 102
Figure 15. Third introduction screen 103
Figure 16. Example static graphic organizer 104
Figure 17. Example questions 105
Figure 18. Static treatment graphic organizer 106
Figure 19. Accompanying text passage 107

v
Figure 20. Interpolated memory task screen 108
Figure 21. Separator screen before criterion questions 109
Figure 22. Example factual criterion question 110
Figure 23. Example comparative criterion question 111
Figure 24. Example inferential criterion question 112
Figure 25. Separator screen before follow-up questions 113
Figure 26. Trends or relationships question 114
Figure 27. Trends or relationships list 115
Figure 28. Mental tricks question 116
Figure 29. Usefulness of graphic organizer question 117
Figure 30. Debriefing 118
Figure 31. Example sortable graphic organizer 119
Figure 32. Sortable graphic organizer 120
Figure 33. Example shuffle-sortable graphic organizer 121
Figure 34. Shuffle-sortable graphic organizer 122
Figure 35. Introductory screen from pilot study 123
Figure 36. Introductory screen from pilot study, cont’d 124
Figure 37. Example static graphic organizer from pilot study 125
Figure 38. Sample questions from pilot study 126
Figure 39. Introductory sortable graphic organizer screen from pilot study 127
Figure 40. Sortable graphic organizer from pilot study 128
Figure 41. Static graphic organizer from pilot study 129
Figure 42. Metacognitive strategies screen from pilot study 130

vi
Figure 43. Debriefing screen from pilot study 131
Figure 44. Outcomes from the proposal defense 132

vii
The Dynamic Graphic Organizer and its Influence on Making Factual,
Comparative, and Inferential Determinations within Comparative Content
Cameron Spears
Abstract
By augmenting an existing static medium (a graphic organizer) with attributes
such that learners were able to sort or rearrange information in multiple ways, two new
types of “dynamic” graphic organizers were created. An experiment was performed to
investigate the effectiveness of these dynamic graphic organizers as instructional tools.
One-hundred-sixty-one students were recruited for participation in the study from a two-
year community college and a four-year public university in the southeast United States.
Participants were randomly assigned to one of three graphic organizer treatment groups:
static, sortable, and shuffle-sortable. Response accuracy and response latency
measurements for three types of mental tasks (factual, comparative, and inferential) were
compared across the three treatment groups.
A multivariate analysis of variance showed no significant difference between the
three graphic organizer types for response accuracy. A within-groups analysis of variance
showed no significant differences in response accuracy between mental tasks within the
static or sortable treatment groups. However, analysis of variance indicated that accuracy
for inferential judgments was lower than that for factual judgments in the shuffle-sortable
group. With respect to response latency, a multivariate analysis of variance revealed no
significant difference between the three treatment groups. A within-groups analysis of

viii
variance showed significant differences in response latency between factual and
inferential judgment-making for both the sortable and shuffle-sortable treatments. The
sortable treatment had the most pronounced differences in latency between mental tasks,
whereas no significant differences in response latency were observed within the static
treatment.
Participants in the two dynamic treatments reported much higher percentages of
affirmative responses to the question, “Did you think your graphic organizer was an
effective instructional tool?” with 82.7% and 81.5% responding “yes” for the Sortable
and Shuffle-sort groups, respectively, and only 60.0% responding “yes” for the Static
group.
The graphic organizers in the study are known as adjunct displays and therefore
each was associated with an accompanying text passage. Participants had the capability
of viewing the accompanying text passage at will within the constraints of a five-minute
graphic organizer study period. Analysis of variance revealed that participants in the
shuffle-sortable group spent significantly less time viewing the text passage than
participants in the static group, possibly because the overhead associated with the shuffle-
sortable graphic organizer’s user interface controls consumed time or mental resources
that would have otherwise been used to view the text.
The results of this study suggest that dynamic graphic organizers are equivalent to
traditional static graphic organizers, at least for the educational subject matter used in this
study (comparative text comprising 204 words describing six fictitious species of fish,
their attributes, and the relationships between these attributes) for measures related to
accuracy. Additionally, participants in the two dynamic graphic organizer treatments took

ix
advantage of the affordances offered by those treatments (88.5% of the Sortable group
sorted, 75.9% of the Shuffle-sort group sorted, and 88.9% of the Shuffle-sort group
shuffled). This study may benefit both instructional designers and educational researchers
as new curricula are designed and new instructional tools are studied, respectively.

1
Chapter One: Introduction
Researchers have long sought ways to help readers both recall the information
contained in texts but also to better understand the relationships between the ideas and
concepts contained therein. Simultaneously, educators have continued to identify best
practices to follow when integrating sound instructional practices with educational
technologies in ways that most effectively enhance student learning (Kealy, 2001).
Commonly studied instructional strategies have included underlining, note-taking,
outlining, using bold typeface for keywords, and summarizing (Wade, Trathen, &
Schraw, 1990). These strategies are characterized by their tight coupling with the text
itself (e.g., boldface typeface is simply a special attribute of the text). In contrast, another
category of instructional strategies includes adjunct (that is, separate from the text)
displays such as photographs and maps; these types of displays elaborate text by
presenting information, such as spatial relationships, that would be difficult or
cumbersome to convey through words alone. Finally, a third category of instructional
strategies exists, one which Rieber (1994) classifies as “arbitrary graphics.” These types
of adjunct displays are not representational in nature but instead depict objects, concepts,
or their relations using various configurations of text, lines, symbols and/or the spatial
arrangement of these elements. Examples of arbitrary graphics include concept maps, tree
diagrams, and graphic organizers, the subject of this study. (A graphic organizer is an
array-like arrangement of key terms or concepts that also appear in an informationally
equivalent accompanying text.)

2
Context of the Problem
A large body of research “suggests that adjunct displays facilitate reading
comprehension almost without exception,” (Robinson & Schraw, 1994, p. 399). This
facilitative advantage is known as the adjunct display effect (Robinson, Katayama, &
Fan, 1996; Robinson, Robinson, & Katayama, 1999). Despite numerous studies,
however, there is still much to be investigated when considering how best to configure a
display such that it communicates information most effectively. For example, textbook
authors (one of the primary creators of graphic organizers), often implement
inappropriate types of graphic organizers, at least in part because educational researchers
have not identified which type of graphic organizer is best suited for a particular
educational application (Robinson, 1998).
A static graphic organizer is already an effective instructional device owing to its
inherent visual argument (Waller, 1981) and computational efficiency (Larkin & Simon,
1987). However, the inert nature of graphic organizers may limit their potential as they
exist today on the printed page or in static computer-based displays. One promising area
of investigation involves augmenting a graphic organizer with a computational capability
such that learners can reorder or otherwise reconfigure the graphic organizer’s elements.
Doing so (that is simply reconfiguring the elements in a display) can significantly
improve that display’s usefulness for learners (Winn, 1991, 1993). Similarly, reordering
and grouping the elements of an array-like display can sometimes lead to new insights
and reveal relationships between those elements (Wainer, 1992). Furthermore, imbuing a
graphic organizer with an interactive, dynamic attribute may enable a learner to overtly
uncover relations among the elements of the subject matter, thus exploiting generative
learning theory (Wittrock, 1991). In other words, this interactive component will

3
transport the learner from role of passive recipient to that of active participant, thus
enabling the learner to construct meaningful information thereby satisfying this basic
tenet of generative learning theory (Grabowski, 2004). Finally, this area of inquiry seems
well-suited for investigation, as “relatively few research studies have focused on ways to
make the reading of on-screen text an active experience” (Crooks, White, Barnard, 2007,
p. 369).
Adding an interactive, computational capability to graphic organizers would be of
little interest to educational practitioners if instructional materials existed only on the
printed page. Fortunately, the trend toward ubiquitous computing in schools and the
home (at least in the United States) continues to be positive, thus ensuring that
instructional designers and other educational practitioners have the technological
infrastructure in place to deliver dynamic graphic organizers. As one example of this
trend toward increased availability of computing resources, distance education enrollment
at colleges in the United States more than tripled from school years 1994-95 to 2000-01
(Kiernan, 2003). As another example, there is some degree of computer presence in
virtually all K-12 schools in the U.S. today (Morgan, 2006). Finally, the U.S. Census
Bureau reports that (as of 2003) nearly 62% of U.S. households owned at least one
computer and nearly 55% of U.S. households had Internet access (Day, Davis, & Lewis,
2005).
Purpose of Research
The purpose of this study was to investigate the effects of dynamic graphic
organizers on learners’ ability to encode, recall, and apply factual, comparative, and
inferential material contained in expository text having the comparative organizational
structure. The overarching goal of the study was to investigate the effects of using

4
generative learning theory to augment a previously static instructional device: the graphic
organizer. By doing so, the researcher aimed to fill an existing gap in the research
literature, as well as provide instructional designers and other educational practitioners
with an evidence-based tool that can be incorporated into learning materials.
Graphic organizers are also useful for presenting information of varying
intellectual complexity. For example, a single graphic organizer might convey three
distinct, increasingly complex, types of information: (1) factual (e.g., fish species x is
black); (2) comparative (e.g., fish species x is black and fish species y is white); and (3)
inferential (e.g., darker colored species of fish tend to swim at greater depths than lighter
colored ones). As depicted in Table 1, a mapping can be established between the three
levels of intellectual complexity noted (factual, comparative, and inferential) and the
graduated levels of abstraction codified in Bloom’s Taxonomy (Bloom, 1956). That is,
remembering factual information would map to knowledge on Bloom’s Taxonomy,
comparing would map to comprehension/application, and inferring would map to
analysis/synthesis.
Table 1. Mapping of Mental Tasks to Original and Revised Bloom’s Taxonomies
Mental Tasks Performed by Participants in
Proposed Study
Original Bloom’s Taxonomy (Bloom, 1956)
Revised Bloom’s Taxonomy (Krathwohl, 2002)
Remembering (Facts) Knowledge Remembering
Comparing Comprehension Understanding
Application Applying
Inferring Analysis Analyzing
Synthesis Evaluating
Evaluation Creating

5
The two types of dynamic graphic organizers investigated in the study were, first,
a sortable graphic organizer, that is, one whose rows can be reordered (sorted) under
learner control. The second type of dynamic organizer was a “shuffle-sort” graphic
organizer, that is, one whose columns can be arbitrarily rearranged by the learner.
Research Questions. The guiding research question was: What are the effects of a
dynamic sortable graphic organizer or dynamic shuffle-sort graphic organizer on
learners’ ability to accurately make factual, comparative, and inferential determinations
related to an expository text having a comparative organizational structure? More
specifically, the research questions addressed in the study were:
1) Is there a significant difference in accuracy for factual judgments
2) Is there a significant difference in accuracy for
among
learners presented with a static graphic organizer versus a dynamic
sortable graphic organizer versus a dynamic shuffle-sort graphic
organizer?
comparative judgments
3) Is there a significant difference in accuracy for
among learners presented with a static graphic organizer versus a dynamic
sortable graphic organizer versus a dynamic shuffle-sort graphic
organizer?
inferential judgments
Hypotheses. Because of the increasing intellectual complexity of the three mental
tasks (factual, comparative, inferential) accuracy was expected to decrease across those
among learners presented with a static graphic organizer versus a dynamic
sortable graphic organizer versus a dynamic shuffle-sort graphic
organizer?

6
measures for each of the three graphic organizer treatments. However, the decrease was
not expected to be equal across the three treatments. That is, an ordinal interaction
between graphic organizer treatment and mental task was expected. Specifically,
accuracy for factual judgments was predicted to be similar for each of the three
treatments. Accuracy for comparative judgments was predicted to be similar for both
dynamic graphic organizer treatments, with both treatments being significantly better
than the static graphic organizer treatment. For inferential judgment-making accuracy, the
dynamic shuffle-sort treatment was predicted to be significantly better than the dynamic
sortable graphic organizer while the dynamic sortable graphic organizer treatment was
predicted to be significantly better than the static treatment.
Response latency, that is, the difference between the time a question was
displayed and the time a participant responded to that question, was expected to vary with
the complexity of mental tasks. That is, response latency for inferential judgments was
expected to be greater than response latency for comparative judgments which was
expected to be greater than response latency for factual judgments.
Limitations and Delimitations
Generalizing the results of this study should be done with care. Any attempt to do
so should recognize that the participants were drawn only from undergraduate college
students at two urban postsecondary education institutions in the southeastern United
States. Generalizing results to populations with different characteristics may require
additional research. Similarly, generalizing the results to graphic organizers representing
other types of instructional materials should be done with caution, as the instructional
material in the study was characterized by a specific organizational structure, size, and

7
reading level.
Summary
This chapter has provided an introduction to the research, a context explaining
why this study is important, goals that the proposed research have addressed, specific
research questions and hypotheses, and finally limitations and delimitations of the study.

8
Definition of Terms
Comparative Organizational Structure: Meyer, Brandt, & Bluth (1980) proposed a
model to classify informational text into five different organizational structures:
description, sequence, causation, problem/solution, and comparison. Each organizational
structure is characterized by its purpose and by its “signals”, that is by words and phrases
that provide clues to a reader about the structure of a given passage. The prose passage
that serves as a component of the instructional materials in the current study falls into the
“comparative” organizational structure (a structure characterized by the use of signal
phrases such as “whereas” and “in contrast”).
Generative Learning Theory: A learning theory founded by Wittrock, in which the
learner becomes an active participant in the learning process, working to construct
meaningful understanding, rather than being a passive recipient of information
(Grabowski, 2004). Generative learning has been called “the practical cousin of
constructivism” (Bonn & Grabowski, 2001, p. 1) as both generative learning and
constructivism focus on “constructing meaningful understanding of information found in
the environment” (p. 1). The following Wittrock quotation helps to convey the gist of this
theory of learning: “Although a student may not understand sentences spoken to him by
his teacher, it is highly likely that a student understands sentences that he generates
himself” (1974b, p. 182).
Graphic organizer: A static graphical or spatial representation of text concepts.
Graphic organizers use relative spatial location to convey concept relations (Robinson,
Corliss, Bush, Bera, & Tomberlin, 2003).
Graphic organizer (sortable): A dynamic graphic organizer whose rows may be
reordered (say, by ascending or descending order) under learner control.

9
Graphic organizer (shuffle-sort): A dynamic, sortable graphic organizer whose
columns may be arbitrarily reordered (that is, shifted toward the right or left) under
learner control.
Response latency:
Organization of Remaining Chapters
The difference (in seconds) from the time a criterion question
was displayed and the time a participant responded to that criterion question.
This dissertation is organized into five chapters. In this, the first chapter,
introductory material is presented. The second chapter reviews related literature and
provides a theoretical framework for the study. The third chapter details the method used
during the investigation. In the fourth chapter, results of the study are presented. Finally,
the fifth chapter contains a discussion and summary of the research.

10
Chapter Two: Literature Review
Graphic organizers and their precursor, the advance organizer, have been studied
by educational researchers for nearly fifty years. This chapter first presents a historical
overview of graphic organizer development, followed by a review of relevant graphic
organizer research.
Graphic Organizer Origins
Ausubel (1960) first used the term advance organizer in the title of his study
intended to investigate the proposition that introducing concepts prior to the learning of
“meaningful verbal material” (p. 267) would enhance the “incorporability” of that
material. Since then, advance organizers (and their many derivatives) have become a
frequently used instructional strategy; in fact, the advance organizer is cited as one of the
“100 universal principles of design” by Lidwell, Holden, & Butler (2003, p. 16).
Ausubel’s original advance organizer study was designed to test the hypothesis
that “the learning of unfamiliar but meaningful verbal material can be facilitated by the
advance introduction of relevant subsuming concepts (organizers)” (Ausubel, 1960, p.
267). Participants in this study studied a 2,500-word passage detailing the metallurgical
properties of steel—retention of the material was tested three days later by means of a
multiple-choice instrument. In the cited paper Ausubel wrote, “Comparison of the mean
retention scores of the experimental and control groups unequivocally supported the
hypothesis” (p. 271). Ausubel’s rationale for using organizers introduced prior to learning
involved his assertion that learners must either create a new schema or activate an

11
existing schema before they can learn new material (Robinson, 1998). Ausubel, Robbins,
and Blake believed that meaningful materials were “invariably related to an existing
cognitive structure that is hierarchically organized in terms of highly stable and inclusive
conceptual clusters under which are subsumed less stable and more specific illustrative
data” (1957, p. 335).
Barron’s 1969 study advanced Ausubel’s work by introducing the notion of a
“structured overview.” These structured overviews were hierarchical representations of a
“taxonomy of content to be taught in a given length of time” (Barron, 1969, p. 32). These
outline-like structured overviews served to preserve the attributes of an advance
organizer by “relating new content information to relevant subsuming concepts that have
been previously learned” (p. 33) while giving learners an idea how the new learning unit
related to the course in its entirety.
The term “graphic organizer” seems to have first appeared in the literature in
1970 when Barron described graphic organizers as descendents of the structured
overview (Barron, 1970). These original graphic organizers were diagrams comprised of
nodes (representing concepts) with straight and circular vectors connecting some nodes.
The original graphic organizer paper also operationally defined graphic organizers by
providing a Steps in Constructing and Using Graphic Organizers procedure as an
appendix.
According to Robinson (1998) structured overviews metamorphosed into graphic
organizers because the former proved more effective as a postreading aid than it had as a
prereading aid (overviews are typically given in advance of reading, hence the shift in
nomenclature).

12
Modern Graphic Organizer Research
Reviews/Critiques. Moore and Readence (1984) performed a meta-analysis of 23
studies that included graphic organizer interventions. In this synthesis of the 23 studies,
they computed an average effect size of 0.22, with a standard deviation of 0.58. They
concluded that learners who received a graphic organizer intervention outperformed
control-group learners by roughly two-tenths of a standard deviation. They further noted
that graphic organizers produced a larger effect size when vocabulary was an outcome
(M = 0.68, SE = 0.19) versus when comprehension was an outcome (M = 0.29, SE =
0.06). This meta-analysis also suggested that “graphic post organizers seem to produce
greater effects than graphic advance organizers” (p. 15).
A somewhat later analysis was performed by Dunston (1992). In this critique of
graphic organizer research, she found results consistent with the results of Moore and
Readence (1984). The synthesis also suggested that graphic organizers tended to produce
greater effects when training in their use was offered, they were constructed by students,
they were used with more capable students, and they were used with descriptive texts.
Significant studies. Larkin and Simon‘s (1987) non-empirical paper titled “Why a
display is (sometimes) worth 10,000 words,” although not explicitly related to graphic
organizers, provided several foundation concepts that are relevant today in graphic
organizer research. In this paper, Larkin and Simon considered two forms (sentential and
diagrammatic) of an external problem representation taken from the real world (the
problem domain involved a system of weights, pulleys, and ropes). They concluded that
diagrams are often superior to verbal descriptions for three reasons: (1) diagrams group
like information, thus reducing search burden on learners; (2) diagrams typically place
relevant information near a single element, thus eliminating the extra step that would be

13
required were the information to be placed remotely with a symbolic label; and (3)
diagrams are more suited to representing perceptual inferences. Notable contributions
from this work include the taxonomy of sentential (sequential) displays and diagrammatic
displays (where information is not sequential but instead is indexed by location within a
plane). Larkin and Simon explicated the differences in computational efficiency and
informational equivalency between these types of displays by working through
representative math and physics problems. Larkin and Simon indicated that, “two
representations are informationally equivalent if all the information in the one is also
inferable from the other, and vice versa” (p. 67). Two representations are computationally
equivalent if and only if they are informationally equivalent and “any inference that can
be drawn easily and quickly from the information given explicitly in the one can also be
drawn easily and quickly from the information given explicitly in the other, and vice
versa” (p. 67). The significance of this study in graphic organizer (and other) research
would be difficult to overstate. In fact, Robinson (2008) cites the paper as the one having
the greatest influence on his research career. In addition, a search performed by means of
the Google Scholar web site (http://scholar.google.com/) reveals that Larkin and Simon
(1987) has been cited at least 1340 times by researchers from the fields of educational
technology, human factors, cognitive psychology, artificial intelligence, and many other
disciplines.
Robinson and Schraw (1994) investigated the computational efficiency of three
informationally equivalent instructional treatments: a matrix-like graphic organizer, an
outline, and plain expository text. For each of the three treatments, participants studied an
expository text for a fixed time period. Following the study period, the graphic organizer

14
and outline treatment groups received those displays, respectively, while the text-only
group received the text again for study. Participants were instructed to not only study
specific information but to also look for relations within the material. The results
suggested that matrices were more computationally efficient than both outlines and text,
even when the time to view the displays was reduced. However, when testing was
delayed the matrix’s advantage disappeared; Robinson and Schraw (1984) believed this
to be a result of the “matrix communicating the information too effectively, resulting in
little effort during encoding and low durability of the memory traces” (p. 410).
Robinson and Skinner (1996) investigated whether graphic organizers were easily
searchable because of fewer words or because of computationally efficient indexing.
Their work built upon Robinson and Schraw (1994) and was intended to examine “how
quickly and accurately various displays are searched” (p. 170). In each of the three
experiments, a shorter search time and/or fewer errors for a given display would imply its
greater computational efficiency. The results from this study suggested that the graphic
organizer treatment groups found the answer to a pattern question more quickly than both
the outline and text treatment groups. Robinson and Schraw concluded that the
facilitative advantage of graphic organizers is a result of their computationally efficient
indexing and not because they comprise fewer words than an accompanying text.
Kiewra, Kauffman, Robinson, Dubois, and Staley (1999) performed three
experiments comparing informationally equivalent text, outline, and matrix displays.
Their results revealed that both the outline and matrix displays outperformed the text
display with respect to relational learning (with the matrix display outperforming the
outline). The matrix display appeared to be more computationally efficient than both the
15
text and outline displays.
Spears and Kealy (2005) explored the use of “retinal variables” (e.g., size and
color) to improve a graphic organizer’s effectiveness toward helping learners perform
higher-order thinking skills such as inference-making. Using retinal variables, rather than
plain text, it was reasoned, would make a stronger visual argument. No differences in
inferential judgment performance were observed for the retinal variable treatments versus
the text-only treatment. However, participant response latency for inference questions
was significantly longer, leading to the conclusion that nonverbal elements introduced
with the retinal variables may have impeded processing time with no comparable benefits
in accuracy.
Robinson, Katayama, Beth, Odom, Hsieh, Vanderveen, and Katayama (2006)
investigated text comprehension and graphic note taking using partially completed
graphic organizers in a study designed around three quasi-experiments and one true
experiment. This study is relevant because normally static graphic organizers were
imbued with metacognitive, constructivist attributes, in a conceptual manner not unlike
the current study. In the partially completed graphic organizer tasks, participants
achieved increased overall performance on quizzes in all experiments. Also, participants
showed a propensity for note-taking on graphic organizers, as this activity increased over
the course of each of the experiments.
Kauffman and Kiewra (2009) by means of two experiments studied the relative
benefits of signaling, extraction, and localization with respect to standard text, text with
ideas extracted, an outline with ideas localized topically, and a matrix that localized ideas
both topically and categorically. Results from the first experiment suggested that the

16
matrix display outperformed the listed alternatives because of its ability to “localize”
related information within topics and categories. In the second experiment, the
researchers compared four manifestations of informationally equivalent matrices—the
matrices differed in that topics and categories were ordered either logically or randomly.
Participants were tested on local relations, global relations, and facts. For local relations,
a significant main effect was observed for topic only (a fact which is consistent with the
proposed research’s assertion that reducing the distance between similar topics, thereby
reducing or removing intervening information, may contribute to improved learning).
Global relations results also revealed a main effect for topical organization.
Generative Learning
Generative learning has been described as “the practical cousin of constructivism”
(Bonn & Grabowski, 2001, p. 1). Wittrock is credited with the founding of generative
learning theory. Although the fundamental premise of generative learning is that learners
tend to synthesize meaning and relationships consistent with prior knowledge (Wittrock,
1974a), the theory is a comprehensive one; it “builds upon knowledge about the
processes of the brain and upon cognitive research on comprehension, knowledge
acquisition, attention, motivation, and transfer” (Wittrock, 1992).
Lee and Grabowski (2009) theorized that students would learn complex material
related more effectively with generative learning (the researchers also investigated
generative learning plus metacognitive feedback as an additional treatment). In the cited
study, 36 participants were tested for prior knowledge, then studied material related to the
human heart while using either static visual instructional material, the same material with
a generative learning component, or the same material with a generative learning
component and metacognitive feedback. The generative learning treatment scored

17
significantly better on a recall test than the static visual group. The generative learning
with metacognitive feedback group scored significantly better than both the static visual
group and the generative learning group.
Schema Theory
Knowledge is stored in long-term memory in the form of schemata (Sweller, van
Merriënboer, & Paas, 1998). A schema helps an individual categorize things according to
attributes. Schemata may help reduce redundancy in the orderly representation of an
individual’s knowledge. For example, when learning the “tree” schema a child associates
various tree schema elements such as “has leaves” and “grows in the ground.” When
encountering a new type of tree, the child invokes the tree schema, closely followed by
the association of new facts (e.g., “bears fruit”) to be incorporated into the tree schema.
Schemata provide the elements of knowledge—it is through the progressively
complex building of higher-level schemata (based upon lower-level schemata) that an
individual achieves the capability for increasingly sophisticated mental performance
(Sweller, van Merriënboer, & Paas, 1998). Besides helping to reduce redundancy,
schema-based knowledge acquisition helps reduce cognitive load by reducing the number
of interacting elements that working memory must simultaneously store (Sweller &
Chandler, 1994).
Schema theory is especially relevant to graphic organizer research because
graphic organizers display concepts spatially, thus facilitating reading comprehension by
activating prior knowledge more quickly than text alone (Robinson, 1998). Schema
theory also dovetails well with generative learning, as it (generative learning) emphasizes
both the categorization of information into schemata as well as the active construction of
relations among concepts and experience toward the achievement of full comprehension

18
(Wittrock, 1991).
New Literacy
Traditional literacy, that is the ability to read and write, has customarily been
described as text-based and alphabetic (Ihator, 2001). So-called “new literacies” refer to
digitally mediated literacies, and the semiotic understandings necessitated by this form of
media (Haunstetter, 2008). Texts or related media that exploit these new literacies allow
learners, by keying, clicking, cropping, or dragging, to “create a diverse range of
meaningful artifacts using a strictly finite set of physical operations or techniques”
(Lankshear & Knobel, p. 7). Because of the affordances brought forth by these new
literacies, learners are presented with a fundamentally different set of conditions when
viewing a text. Where before a text was most likely linear and unchanging, today’s “new”
text might be reconfigurable in tens, hundreds, or even thousands of ways. Learners
presented with this type of dynamic material have a greater need to independently think,
adapt to novel situations, and problem-solve within those situations (Haunstetter, 2008).
The static and dynamic graphic organizers that served as the fundamental
instructional devices for the present study represent a microcosm of traditional versus
new literacies. While the static graphic organizer in the study models traditional text
(unchangeable with no requisite digital technology) the two dynamic graphic organizers
in the study model new literacy materials (malleable and dependent on digital technology
and its complementary user controls).
Theoretical Framework
An ongoing goal of educational researchers is and has been to devise ways such
that learners can both recall the information contained in text as well as better understand
the relationships between the concepts and ideas in that text. Over the last several

19
decades, researchers have studied various instructional strategies (adjunct aids in this
case) with these goals in mind. Commonly investigated strategies have included
underlining, note-taking, outlining, using bold typeface for keywords, and summarizing
(Wade, Trathen, & Schraw, 1990).
Besides the above-noted “embedded” instructional strategies, many types of
adjunct (that is, accompanying or separate) displays have also been used to improve the
recall or understanding of information contained in text. Pictures, photographs, and maps
are examples of displays that augment text by presenting information that would be
difficult to present using only words.
A wholly different category of adjunct display is one that Rieber calls “arbitrary”
graphics (1994, p. 29). Exemplars of this type of adjunct display include outlines,
flowcharts, bar charts, line graphs, and graphic organizers. The inherent structure of these
arbitrary graphics allows them to function as useful adjuncts to textual material. Certain
graphic organizers exhibit a structure that may be especially useful to learners who are
encoding or recalling information contained in text. Array-like graphic organizers, in
particular, have been shown to provide support to learners (Robinson & Schraw, 1994;
Robinson & Skinner, 1996). This type of graphic organizer spatially arranges key terms
such that their relative placement represents the relationships between those terms.
Information in this type of display can be indexed by a two-dimensional location; it is
therefore a diagrammatic representation (Larkin & Simon, 1987). (By contrast, a display
whose elements appear in a single, linear sequence is referred to as a sentential
representation.)
This type of graphic organizer is similar to a table—both are two-dimensional,

20
static matrix-like depictions of information, each orienting its individual elements in a
plane. Graphic organizers and tables often differ, however, in their potential for precisely
representing data. A table allows a reader to get single point values most accurately but
provides the least integrative information (Guthrie et al., 1993), whereas a graphic
organizer may better represent what Shah and Hoeffner refer to as the “qualitative gist of
relationships depicted in the data” (2002, p. 53).
Graphic organizers have the ability to help learners see conceptual relationships at
a glance, thus allowing them (graphic organizers) to function as effective alternatives for
extracting meaning from a text. For example, locating a single fact, the smallest unit of
information in an information array (Wainer, 1992), is a simple process for a learner with
access to a graphic organizer. Similarly, learners are also better able to make comparative
judgments using a graphic organizer than they would be able to with text only (Robinson
& Schraw, 1994).
Several theoretical explanations have been offered to explain the effectiveness of
graphic organizers. These include visual argument, dual coding, conjoint retention , and
schema theory, as discussed in the following paragraphs.
Visual argument relies on the visuospatial properties of graphical organizers to
facilitate side-by-side comparisons by learners (Robinson, Robinson, & Katayama, 1999;
Robinson & Kiewra, 1995; Vekiri, 2002). Graphic organizers appear in a form that
requires “minimal computation or untangling by the learner to discover relations among
concepts or the text’s structure” (Robinson & Kiewra, 1995).
Dual coding refers to encoding of verbal and visual information through separate
processing channels (Paivio, 1986). Because graphic organizers comprise both verbal and

21
visual information, dual coding has been cited as a theoretical explanation for the
effectiveness of graphic organizers (Schwartz, Ellsworth, Graham, Knight, 1998). Owing
to the bi-representational (verbal and visual) nature of graphic organizers, some
researchers (Kealy, Bakriwala, & Sheridan, 2003; Robinson, Corliss, Bush, Bera, &
Tomberlin, 2003) consider them to be a form of multimedia and therefore subject to
many of Mayer’s (2001) multimedia principles.
The conjoint retention hypothesis (Kulhavy, Lee, & Caterino, 1985) is
“essentially a rendition of dual coding theory” (p. 29) in that verbal and spatial elements
are encoded by means of separate memory channels. It goes beyond dual coding,
however, by stating that spatial information (typically a map) is encoded in an intact form
as a verbal as well as a spatial format; text not associated with the spatial information is
encoded only verbally. Conjointly retained information may be more likely to be recalled
than non-conjointly retained information (Robinson, Robinson, & Katayama, 1999).
Schema theory says that knowledge is stored in long-term memory in the form of
schemata (Sweller & Chandler, 1994). A schema helps a learner categorize new concepts.
For example, a learner who encounters a new teacup can simply incorporate that
information into his or her “cup” schema, thus avoiding the overhead of learning all the
basic details related to “cup” (only the new details relevant to “teacup” need be
catalogued). Because graphic organizers display concepts spatially, they can activate
prior knowledge (that is, an existing schema) more quickly than expository text would.
Once the prior knowledge has been activated, the learner is able to incorporate the new
information into the existing schema (Robinson, 1998).
Educational researchers recognize that the effectiveness of media used to deliver

22
and support instruction can be improved through message design (Fleming & Levie,
1978). Sometimes, simply reconfiguring the elements in a display can significantly
improve that display’s usefulness for learners (Winn, 1991, 1993). For example,
reordering and grouping the elements of a table may lead to new insights and reveal
relationships between those elements (Wainer, 1992).
From time to time opportunities may arise such that new technologies can be
exploited to enhance an existing medium with improved cognitive capacity and
instructional potential (Kozma, 1991). For example, hypertext technology has enabled the
use of hyperlinks in formerly static text, thereby altering the way this text is read and
mentally processing. Following this model, one might look for other opportunities where
the addition of processing capabilities might complement those of the learner (Kozma,
1991). Many studies have been undertaken to examine the processing capabilities of the
computer and to demonstrate how these capabilities can influence the mental
representations and cognitive processes of learners (Kozma, 1991). One high level
finding is that some learners will learn a particular task or concept regardless of the
delivery mechanism, while others will be able to take advantage of a particular medium’s
characteristics to help construct knowledge (Kozma, 1991). This premise informs the
proposed study, and helps provide a rationale for the proposed introduction of two types
of interactivity into a formerly static medium.
One medium that may benefit from the addition of processing capabilities is the
graphic organizer. This static, matrix-like informational display is already an effective
instructional medium owing to its inherent visual argument (Waller, 1981) and
computational efficiency (Larkin & Simon, 1987). Graphic organizers are also useful for

23
presenting information of varying intellectual complexity. For example, a single graphic
organizer might convey three distinct types of information: (1) factual (e.g., fish species x
is black), (2) comparative (e.g., fish species x is black and fish species y is white); (3)
inferential (e.g., darker colored species of fish tend to swim at greater depths than lighter
colored ones). Interestingly, a mapping can be established between the three types of
information noted (factual, comparative, and inferential) and the graduated levels of
abstraction codified in Bloom’s Taxonomy (Bloom, 1956). That is, remembering factual
information would map to knowledge on Bloom’s Taxonomy, comparing would map to
comprehension/application, and inferring would map to analysis/synthesis.
Another way to consider the three above-noted types of information would be to
use Wainer’s (1992) scheme. Wainer compares increasingly complex types of
information to increasingly complex parts of speech. When considering Wainer’s
nomenclature, a fact might correspond to a noun, a comparison might correspond to an
adjective-noun construct, and an inference might correspond to an adjective-noun-verb
construct.
For this study, the following nomenclature was used to distinguish the three types
of information just discussed. Factual information (Robinson & Schraw, 1994) was used
to convey an atomic and objective fact, for example, “Ponef swims at a depth of 600
feet.” Comparative information refers to concept comparisons along a single attribute. An
example of a comparison question is, “Which swims at a lesser depth (Goken or Taroz)?”
A learner responding to this type of query needs three elements of factual information
(Robinson & Schraw, 1994): (a) Goken swims at 200 feet, (b) Taroz swims at 400 feet,
and (c) 200 is less than 400 and therefore Goken swims at a lesser depth than Taroz.

24
Inferential information refers to information involving elements of two attributes with an
indirect link. An example of an inference question is, “Lesser-depth fish tend to be ____
in size (smaller/larger).” Responding to this question implies a five-step process
(Robinson & Schraw, 1994), to wit: (a) 200 feet is “lesser depth,” (b) Latuk and Goken
swim at 200 feet, (c) Latuk and Goken are 40 inches in size, (d) an inference must be
computed that 40 inches is small, (e) finally, an inference must be computed that 40
inches is not 90 inches.
By preserving the inherent benefits of the graphic organizer while enhancing it
with the integration of two distinct reordering capabilities two new types of dynamic
instructional displays were realized: a “sortable” graphic organizer and a “shuffle-sort”
graphic organizer. Investigating the effectiveness of these dynamic graphic organizers as
instructional media tools was the focus of this research.
These newly created dynamic graphic organizers allowed, under learner control,
the reconfiguration of their elements thus altering the way the presented content could be
read and mentally processed. For example, relationships between items physically distant
(as they might be in a static graphic organizer) may be less discernable by a learner than
relationships between adjacent items (as they might be in a dynamic graphic organizer).
Allowing a learner to reorder elements in a graphic organizer, and thereby facilitating the
discovery of relationships that otherwise might go undetected, may encourage the process
of generative learning, that is the dynamic construction of meaning by building
relationships (Wittrock, 1992). Similarly, allowing a user to reorient elements of a
graphic organizer such that related items are physically nearer to each other (thus
decreasing the semantic distance of those elements) may be useful for making trends in

25
the displayed information more apparent, while also improving a learner’s ability to make
inferential judgments (Winn & Holliday, 1982). Finally, providing a facility whereby
learners can overtly manipulate graphic organizer element positions may encourage
mindful, effortful actions, thus contributing to learning and transfer (Salomon &
Globerson, 1987).

26
Chapter Three: Method
Research Design and Participants
Participants were volunteer students from a public four-year research university
and a two-year community college, both located in an urban area of the southeastern
United States. Most participants received extra course credit for participation. Some
participants received only snacks for their participation. A small number received a token
cash payment for their participation.
Materials and Measures
Displays. The graphic organizers in the study were two-dimensional, matrix-like
configurations of text. These graphic organizers contained information about various
fictitious species of fish, including the size, color, preferred depth, and diet for each
species represented. This type of graphic organizer is often used to convey factual,
comparative, and inferential information. Figure 1 is a representation of the static graphic
organizer from that treatment group (it includes numeric prefixes in certain columns such
that the elements of the graphic organizer can be sorted when used in a sortable treatment
group). Robinson and Schraw’s (1994) text passage and static graphic organizer served as
a foundation for this study. Besides Robinson and Schraw, other researchers have
performed studies using these materials or derivatives thereof, including Robinson &
Skinner (1996), Kiewra, et al. (1999), and Spears & Kealy (2005).

27
Figure 1. A static graphic organizer
The graphic organizers functioned as adjunct learning materials to a 204-word
text passage that provided 30 facts about six fictitious species of fish. Robinson and
Schraw (1994) used this text passage in their adjunct displays study; their version was
adapted from a similar text passage used by Friedman & Greitzer (1972) in “Organization
and Study Time in Learning from Reading.” A representation of the Robinson and
Schraw text passage is shown in Appendix A.
The organizational structure of this text passage falls within the comparison
structure when evaluated against the five structures described by Meyer (1980). Several
textual signals (Meyer & Poon, 2001) are contained in the passage that would provide
clues to a reader about the passage’s comparison organizational structure. Example
signals include “they differ in several ways”, “whereas”, “vary along different
dimensions”, “for example”, and “in contrast.” With respect to the readability of the text
passage, it scores a Flesch-Kincaid Grade Level of 6.1 as calculated by the Microsoft
Office Word 2007 computer program. A reading level of grade 6.1 would be
characterized as “fairly easy” by Flesch (1949, p. 149).
The readability level of the text passage is not viewed as a limitation for several
reasons: First, this 204-word passage or its derivatives have been used in many studies,
DEPTH (ft.) SPECIES GROUPING COLOR SIZE (in.) DIET
200 Latuk 1-Solitary 6-Black 40 1-Algae
200 Goken 2-Small 5-Brown 40 1-Algae
400 Taroz 1-Solitary 4-Blue 60 2-Shrimp
400 Kupod 3-School 3-Orange 60 2-Shrimp
600 Ponef 2-Small 2-Yellow 90 3-Flounder
600 Somet 3-School 1-White 90 3-Flounder

28
including Robinson & Schraw (1994), Robinson & Skinner (1996), Kiewra et al. (1999),
Spears & Kealy (2005), Spears, Motes, & Kealy (2005), and Spears, Hubbard, & Kealy
(2007). Second, text passages with reading levels of grades 6-9 are frequently used in
studies of this type, even studies that use undergraduate college students as participants,
e.g., Griffin & Robinson (2005) provided materials with a grade level of 6.6 and Kealy,
Bakriwala, & Sheridan (2003) used a grade level of 9.5. Finally, using a text passage with
a higher (say, college-level) readability score might have been unwise, considering the
2006 ACT assertion that, “Only 51 percent of 2005 ACT-tested high school graduates are
ready for college-level reading” (ACT, 2006, p. 1).
A subset of this study’s research goals were investigated by Spears, Hubbard, and
Kealy (2007). That study served as a pilot for the current study. Appendix D contains
several representative screen captures of the pilot study’s instrument (a computer
program). The current study’s instrument is substantially similar; the major difference is
the inclusion of the new shuffle-sort experimental treatment. Additional differences are
documented in Appendix B. In the pilot study, a sortable graphic organizer was compared
to an informationally equivalent static graphic organizer to determine its influence on
learners’ comparison- and inference-making. Although analysis of variance (ANOVA)
revealed no differences between the two treatments, several lessons were learned—these
lessons have been incorporated into the current study’s design, as discussed in the
following paragraphs.
One observation from the pilot study was a strong ceiling effect (nearly every
participant scored 13, 14, or 15 out of 15 possible points) on accuracy for both
comparative and inferential judgments. On post-study analysis, it became clear that this

29
was a result of the study’s design, which involved simultaneous presentation of the
graphic organizer and criterion questions (typically, the graphic organizer and/or text are
presented to participants prior to the presentation of the criterion questions). In the
current study, the design was changed such that criterion questions were presented only
after the graphic organizer and informational text had been studied by the participants (an
intervening mental task was presented as well to help clear participants’ short-term
memory).
A second (and more promising) observation from the pilot study relates to the
willingness of the sortable graphic organizer treatment’s participants to use the sortability
feature (M=14.54 sort events, SD=11.42). The pilot study’s instrument counted the
number of times each participant “clicked” a sort button; each of these clicks was
considered a sort event. Interestingly, nine of the thirteen participants in the sortable
graphic organizer treatment group sorted the graphic organizer 10 or more times; two
participants sorted it more than 30 times.
In the current study, three treatment groups were used, in which the degree of
interactivity available to the learner was varied. The first group involved a conventional
static graphic organizer, where no interactive component was available and the distances
between graphic organizer elements was fixed. The second group studied a dynamic
graphic organizer that provided some interactivity; that is, participants had the ability to
sort graphic organizer rows by clicking one of the graphic organizer column headings.
Also in the second group, the distance between any two graphic organizer elements
varied as a function of the graphic organizer’s sort order. Figure 2 is a representation of a
sortable graphic organizer. The third group studied s a dynamic graphic organizer

30
providing a still higher level of interactivity than the second group; that is, participants
had the ability to both sort graphic organizer rows and “shuffle” individual graphic
organizer columns in either horizontal direction. Also in the third group, the distances
between any two graphic organizer elements varied as a function of the graphic
organizer’s sort order (for rows) and
shuffle order (for columns). The three graphic
organizers were informationally equivalent. Figure 3 is a representation of a shuffle-sort
graphic organizer.

31
Figure 2. A sortable graphic organizer
Figure 3. A shuffle-sort graphic organizer
Three treatments (static, sort, shuffle-sort) were decided upon although a four-
treatment design (static, sort, shuffle-sort, shuffle-only) was briefly considered. One
reason for doing so is that the shuffle capability can be thought of as an “enabler” for the
sortability feature of a dynamic graphic organizer. It (shuffling) allows a participant to
move items of interest closer to each other (thus decreasing semantic distance) but has
DEPTH (ft.) SPECIES GROUPING COLOR SIZE (in.) DIET
200 Latuk 1-Solitary 6-Black 40 1-Algae
200 Goken 2-Small 5-Brown 40 1-Algae
400 Taroz 1-Solitary 4-Blue 60 2-Shrimp
400 Kupod 3-School 3-Orange 60 2-Shrimp
600 Ponef 2-Small 2-Yellow 90 3-Flounder
600 Somet 3-School 1-White 90 3-Flounder
Reset
DEPTH (ft.) SPECIES GROUPING COLOR SIZE (in.) DIET
200 Latuk 1-Solitary 6-Black 40 1-Algae
200 Goken 2-Small 5-Brown 40 1-Algae
400 Taroz 1-Solitary 4-Blue 60 2-Shrimp
400 Kupod 3-School 3-Orange 60 2-Shrimp
600 Ponef 2-Small 2-Yellow 90 3-Flounder
600 Somet 3-School 1-White 90 3-Flounder
Reset

32
limited use otherwise. A second reason for this decision is that there is some precedent
for experimental designs in which experimental attributes are “added” to treatments. As
one example, Lee and Grabowski’s (2009) study on generative learning includes three
treatments in the following progression: materials with no generative learning, materials
with generative learning, and finally materials with generative learning and
metacognitive feedback.
The displays, materials, and criterion questions in the current study were derived
from similar components used in previous studies (e.g., Robinson & Schraw, 1994;
Robinson & Skinner, 1996; Spears & Kealy, 2005; and Spears, Motes, & Kealy, 2007).
Computer programs. A computer program served as both the instructional
delivery mechanism as well as the measurement and recording instrument. A single
version of this computer program was developed; this version was capable of
programmatically performing the random assignment of participants to groups then
taking the appropriate treatment-dependent and treatment-independent actions thereafter.
The primary treatment-dependent functions of the program included the presentation of
the example graphic organizer, the actual graphic organizer, and the accompanying
participant instructions. The primary treatment-independent functions of the program
included presentation of general information, criterion questions, and ancillary questions.
The program also recorded (both locally and remotely) all participant responses.
The computer program’s source code was primarily written in the Microsoft
Visual C# programming language. The program was tested on several systems running
the Windows XP operating system along with the Microsoft .NET Framework (the
program required the Microsoft .NET Framework in order to execute). Additional source

33
code, written using the JavaScript programming language, provided specific interactivity
elements in the graphic organizer displays for the two interactive treatments groups.
The computer program was also responsible for navigation and pacing related to
the flow of screens presented to participants. Informational screens typically had a Next
button that participants were free to click at their convenience. Other screens (e.g.,
demographic survey and criterion questions) required completion of one or more fields
before the Next button became active. The graphic organizer screen had a fixed display
time (5:00 minutes) with no Next button—once the study time expired, the subsequent
screen was presented. No Back button was provided on any screen; the experimental
program’s flow was designed to be linear and unidirectional.
The experimental program was also responsible for saving and transmitting
information collected from participants. Various everyday user interface controls (e.g.,
radio buttons, text boxes, navigation buttons) were used for the explicit collection of data
from participants during the study. Temporal data was also collected using various time-
based controls and timers. Examples of collected temporal data include start and stop
times for a study session, total time spent viewing the graphic organizer’s accompanying
text passage, and latency (“think time”) for every criterion question. Finally, the
experimental program recorded various participant interaction events, including the
number of times a participant sorted a graphic organizer (in either the sortable treatment
or the shuffle-sort treatment) and the number of times a participant reordered columns (in
the shuffle-sort treatment).
Because of the criticality of preserving all collected data, the experimental
program saved data in three locations, two geographically remote from the first, to

34
provide redundancy. At the end of each participant’s session, a comma-separated variable
file was prepared and attached to an email sent to the researcher’s email account. A copy
of this email was contained in a Google email (gmail) account dedicated to use by the
experimental program. Finally, a local copy of the comma-separated data file was written
to the local workstation’s hard drive such that it could be accessed in the event that
network issues prevented emails from being sent.
Design. The study’s design involved three Display treatment groups (static
graphic organizer vs. dynamic sortable graphic organizer vs. dynamic shuffle-sort graphic
organizer). The independent variable, Display, was varied between subjects. It is a
categorical variable, having three conditions; Table 2 shows the three treatment groups,
and the mapping of these groups to the independent variable.

35
Table 2. Independent Variable
Display Static Sortable Shuffle-Sort
Abbreviation ST SO SH
The dependent variables in the study were participant accuracy for making
factual, comparative, and inferential judgments. As shown in Table 3, all three are ratio
scale variables. Each of these variables can have the values 0 to 15 inclusive. Each point
on this scale represents a correct response to one of the criterion questions related to this
measure (there are fifteen factual questions, fifteen comparison questions, and fifteen
inference questions, thus the maximum of fifteen points for each scale). The value of this
dependent variable was derived programmatically during the study (that is, the computer
program that administered the factual, comparative, and inferential criterion questions
also objectively scored participant responses to these questions).
The remaining dependent variable was response latency. This is also a ratio scale
variable, but its value can range from 0 to 999 seconds, inclusive, depending on the
number of seconds a participant takes to choose a response after a criterion question has
been displayed.
Table 3. Dependent Variables
Variable Name Abbreviation Scale Possible values Scored by
Fact Accuracy FA Ratio 0-15 correct Computer program
Comparison Accuracy CA Ratio 0-15 correct Computer program
Inference Accuracy IA Ratio 0-15 correct Computer program
Fact Latency FL Ratio 0-999 seconds Computer program
Comparison Latency CL Ratio 0-999 seconds Computer program
Inference Latency IL Ratio 0-999 seconds Computer program

36
An a priori power analysis, based on an alpha level of α = .05, an estimated
medium effect size, multivariate analysis of variance of three groups, and a preferred
power of 0.8, yielded a desired sample size of 52 participants per group, or 156 total
participants for the three groups (Cohen, 1992, p. 158).
The criterion items of interest involved learner accuracy related to factual
judgments, comparative judgments, and inferential judgments. In other words, criterion
questions measured learner performance related to increasing levels of intellectual
complexity or abstractness. The accuracy of participant responses related to factual,
comparative, and inferential judgments was measured as participants were queried by the
computer program. (These queries were designed to elicit participant responses related to
the factual, comparative, and inferential information contained in the instructional
materials.)
These criterion questions, or substantially similar variations, have been used in
many prior studies, including Robinson & Schraw (1994), Robinson & Skinner (1996),
Kiewra et al. (1999), Spears & Kealy (2005), Spears, Motes, & Kealy (2005), and Spears,
Hubbard, & Kealy (2007). In the current study, the criterion questions comprise 15
questions designed to measure factual judgment-making, 15 questions designed to
measure comparative judgment-making, and 15 questions designed to measure inferential
judgment-making from the participants.
The validity of the criterion questions has been demonstrated by their use in the
multiple prior studies just cited. The criterion questions used in the study are presented in
Appendix C. Upon inspection, one can see that each question has been designed to
measure a learner’s accuracy in recalling facts, making comparisons, or making

37
inferences related to studied material. An example of a factual query might be, “What
color is Taroz?” The participant would then be presented with two on-screen choices:
Blue/Brown. An example of a comparative query might be, “Which is smaller in size?”
The participant would then be presented with two on-screen choices: Ponef/Latuk. An
example of an inferential query might be, “Prawn-eating fish tend to swim at a ______
depth.” The participant would then be asked to choose either “lesser” or “greater.”
In each of the above three examples, the participant would choose one of two
presented responses, which would then be evaluated programmatically. A correct
response would be internally recorded as “1” and an incorrect response would be
recorded as “0.”
The totality of facts and implicit/explicit relationships required to respond
correctly to the criterion questions is present in both the 204-word text passage as well as
in each of the graphic organizer treatments (they are all informationally equivalent). No
special prior knowledge is required or expected of the participants. In fact, fictitious
species of fish were used rather than existing species to help prevent participants from
exploiting prior knowledge during the study.
Response latency was also measured and recorded. Response latency represents
the elapsed time, in seconds, from when a question was displayed on the screen to when
the participant entered a response to that question. Response latency was recorded and
summarized for each question type (factual, comparative, inferential).
Procedure. Figure 4 graphically depicts the experiment’s procedural sequence,
while the narrative description follows: As participants arrived for an experimental
session, they were seated at computer workstations where the experimental program had

38
previously been installed. Before each research session, the program on each workstation
was launched by the researcher. The program was installed on computer workstations
such that participants could not readily see the screens of other participant workstations.
Once seated, participants saw only a dialog prompting for a password. Participants were
given a brief overview of the task, including an overview of Institutional Review Board
policies regarding human volunteer participants. Participants were asked to place any
papers, books, or similar materials aside before beginning the study. (During the study
sessions, the researcher observed the participants to ensure that notes and similar external
aids were not used.)
Once any procedural questions were addressed, participants were given a
password that allowed them to complete the login dialog. Immediately upon accepting
the password the computer program randomly assigned the participant to one of the three
treatment groups (participants did not know this). Participants were then asked to
complete a brief demographic survey by providing their gender, major, and name of the
institution where the study was taking place. The computer program then provided
participants with on-screen instructions, a brief introduction to graphic organizers, and an
opportunity to practice with the treatment-dependent user interface controls that the
participant would encounter during the study. Participants were also given an opportunity
to see sample questions for each of the three question types. Both the example graphic
organizer and associated example questions pertained to a topic unrelated to the material
contained in the experimental portions of the proposed study. (The example graphic
organizer and sample questions described species of buffalo.) The example instructional
material also contained at least one trend, which was annotated for the participants’
39
benefit. Similarly, annotations were provided that illustrated the linkage between a
graphic organizer and its accompanying text passage.
Participants in the two dynamic graphic organizer treatments received instructions
relevant to their respective graphic organizer treatments. Those in the dynamic sortable
group received instructions related to sorting the rows of their graphic organizer. Those in
the dynamic shuffle-sort group received the sortable group instructions, augmented by
instructions related to rearranging the columns of their graphic organizer. Participants in
the dynamic graphic organizer groups were encouraged to practice using the newly
described controls before proceeding. All participants were asked to study the
instructional materials for facts as well as trends contained in the materials.
Depending upon the outcome of the random assignment that the program had just
performed, participants in each treatment group were then presented with either an
onscreen static graphic organizer, an onscreen dynamic sortable graphic organizer, or an
onscreen dynamic shuffle-sort graphic organizer. In the dynamic graphic organizer
conditions, participants had access to user interface controls such that the graphic
organizer information could be sorted or shuffle-sorted (depending on treatment) under
participant control. Participants in the two dynamic graphic organizer treatments also had
a “Reset” button available—by clicking that button a participant would cause the graphic
organizer to revert to its original, i.e., default, state. Each treatment group was given five
minutes of graphic organizer study time. While studying the graphic organizer,
participants had the ability to invoke the display of the accompanying 204-word text
passage—this was accomplished by using the mouse to click a button labeled, Show Text.
Participants were also presented with a visual indicator of the time remaining in the

40
graphic organizer study period.
After the five-minute study period, participants were presented with an
interpolated arithmetic task to ensure that short-term memory had been cleared. The
interpolated memory task screen comprised six columns, each containing four sets of
two-digit integers. Participants were required to mentally compute the sum of each
column’s four numbers, then use the keyboard to enter Y or N to indicate whether the
displayed sum was correct or incorrect, respectively.
At the conclusion of the interpolated memory task, participants were presented
with 15 onscreen factual-judgment criterion questions, 15 comparative-judgment
criterion questions, and 15 inferential-judgment criterion questions in a random sequence.
The random sequence was prepared before data collection commenced—each participant
received the identical sequence of 45 criterion questions. Appendix C shows the criterion
questions sorted by category as well as by random sequence as delivered to participants.
As each criterion question was displayed, a pair of radio buttons were displayed, one with
the correct response and one with a distractor. A Next button was also displayed on the
screen; however, this button was not active until a participant selected one of the two
radio buttons. As each criterion question screen was completed by the participant, his or
her responses were evaluated and stored by the program. Correct responses were
recorded with a value of 1, and incorrect responses were recorded with the value of 0.
The response latency was also recorded for each criterion question. (Response latency is
defined as the difference in seconds between the time a criterion question was displayed
and the time the participant clicked the Next button. )
As participants completed the criterion questions, two progress indicator

41
messages were displayed: the first was after 15 questions and the second after 30
questions. The questions were intended to give the participants feedback such that they
had some perception of making progress through the 45 criterion questions.
Upon completion of the criterion question segment of the experiment participants
were asked to answer several ancillary questions. These questions were intended to elicit
information from participants that might be useful during data analysis and interpretation.
The first ancillary question presented to participants was the yes/no query, “While
studying the fish material, did you notice any trends or relationships?” Two radio buttons
(labeled Yes and No) were presented below the question, along with a Next button. The
Next button did not become active until the participant selected one of the radio button
choices.
Participants were then asked, “Please list any trends about the fish that you may
have noticed.” A free-form text entry area was provided below the question in which
participants could enter text. This screen also contained a Next button, which was always
active, thus giving participants the ability to skip this question.
Participants were then asked, “Please list any tricks or mental strategies that you
used while studying the material.” A free-form text entry area was provided below the
question, along with an always-active Next button.
Participants were then presented with the query, “Do you think that the graphic
organizer you just studied was an effective instructional tool?” Two radio buttons
(labeled Yes and No) were presented below the question, along with a Next button. The
Next button did not become active until the participant selected one of the radio button
choices.
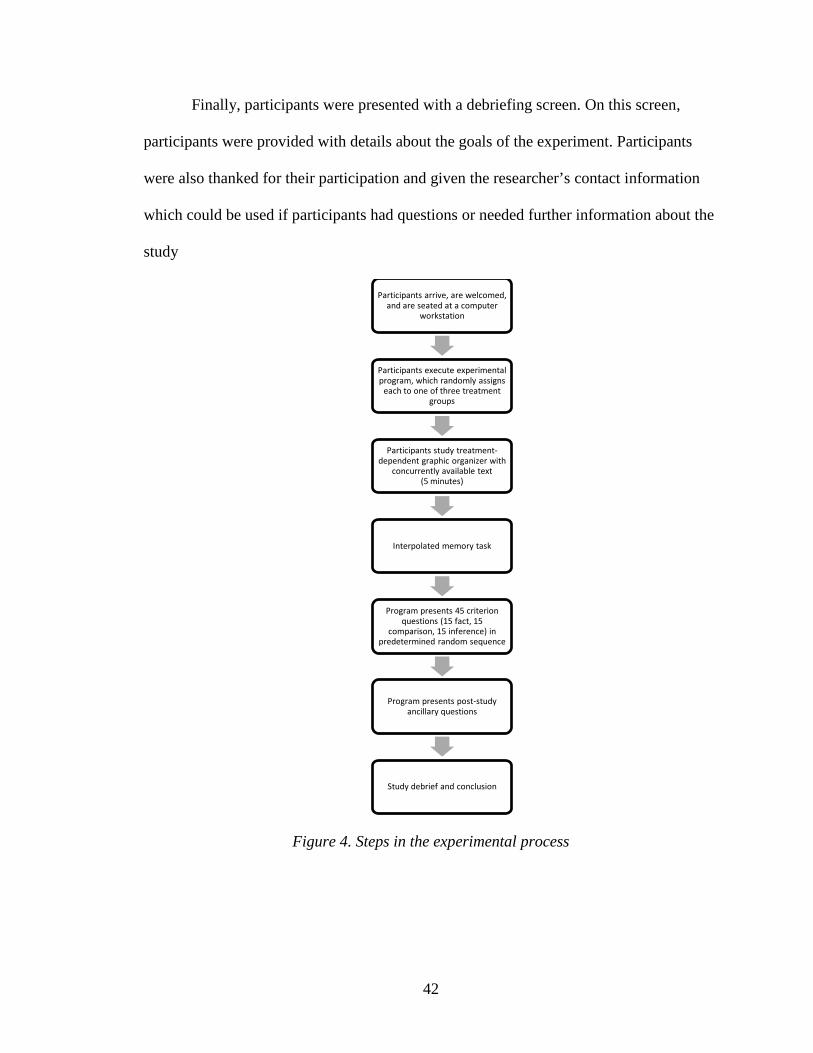
42
Finally, participants were presented with a debriefing screen. On this screen,
participants were provided with details about the goals of the experiment. Participants
were also thanked for their participation and given the researcher’s contact information
which could be used if participants had questions or needed further information about the
study
Figure 4. Steps in the experimental process
Participants arrive, are welcomed, and are seated at a computer
workstation
Participants execute experimental program, which randomly assigns
each to one of three treatment groups
Participants study treatment-dependent graphic organizer with
concurrently available text(5 minutes)
Interpolated memory task
Program presents 45 criterion questions (15 fact, 15
comparison, 15 inference) in predetermined random sequence
Program presents post-study ancillary questions
Study debrief and conclusion

43
Chapter Four: Results
This chapter details the data analyses performed on the collected data. Data were
collected from 161 research participants; each participant was assigned to one of three
experimental treatments which varied graphic organizer (display) type. Dependent
measures included accuracy for factual judgments, accuracy for comparative judgments,
and accuracy for inferential judgments. The results of this study are based on multivariate
analysis of variance (MANOVA) procedures using the above-noted treatments and
dependent measures. The level of significance for all statistical analyses was α = 0.05. All
data analyses were conducted using IBM’s SPSS Statistics 18 application program.
Overall Descriptive Statistics
Each of 161 research participants attended one of many one-hour research study
sessions offered during the fall semester of 2009 at a two-year community college and a
public four-year university, both located in an urban area of the southeast United States.
As participants arrived at a study session, they were seated at computer workstations and
asked to follow on-screen instructions provided by the research application program.
Participants were randomly assigned by the application program to one of the three
treatment groups. Participant gender was not considered during this random assignment
procedure. However, participant gender was recorded. Table 4 shows the participant
distribution by treatment group. All participants completed the study, so no mitigation
procedures for missing data were performed.

44
Table 4. Participant Distribution to Treatment Groups
Treatment Females Males Total
Static (ST) 37 (67%) 18 (33%) 55
Sortable (SO) 34 (65%) 18 (35%) 52
Shuffle-sort (SH) 38 (70%) 16 (30%) 54
Total 109 (68%) 52 (32%) 161
The desired number of participants per treatment group was 52. Because random
assignment does not guarantee an equal number of participants per group, the group sizes
were monitored closely during the data collection period. A pure random assignment
scheme was used for participants 1 through 144, when it was discovered that the shuffle-
sort treatment group was beginning to outpace the other two groups (the shuffle-sort
group had 54 participants, versus 45 participants for each of the other two groups). To
mitigate this unequal rate of growth, a restricted random assignment procedure was
performed on the final 17 participants, such that they were randomly assigned to one of
the two remaining unfilled groups. When each group’s size was equal to or greater than
the target group size of 52 participants, the data collection procedure was concluded.
The General Linear Model (GLM) procedure for MANOVA was used to examine
the study data. The Type III sums-of-squares was selected because it represents variation
attributable to an effect after correction in the model—it is also robust to unequal sample
sizes. MANOVA has a number of assumptions, including:
1. Sample size
2. Independence
3. Normality
4. Multivariate Outliers

45
The sample size assumption states that each cell must have more cases than the
number of dependent variables. In this study, the number of dependent variables was 3
and each cell contained at least 52 cases, so this assumption was met.
The independence assumption states that each observation is independent of all
other observations. Similarly, independence requires that no observation depends on
selection of one or more earlier cases (as in a before-after or repeated measures design).
In this study, the independence assumption was met because participants did not
communicate with each other during the study. Also, participants were seated such that
they could not easily view the displays of other research computers. Finally, this study
was neither a before-after nor a repeated measures design. Therefore, the independence
assumption was met.
The normality assumption in MANOVA is robust in the face of most violations of
this assumption if sample size is greater than or equal to 20 cases per cell and there are no
multivariate outliers. Samples sizes were significantly greater than 20 so this component
of the normality assumption was satisfied. The presence of multivariate outliers was
checked by calculating the Mahalanobis distance using IBMs SPSS Statistics 18. The
maximum computed Mahalanobis distance was 12.997, which was less than the critical
value of 16.27 (Pallant, 2005, p. 251) thus showing that no substantial multivariate
outliers were present in the data.
Normality was also considered by examining skewness and kurtosis values for
each of the nine dependent measures. Of the nine data sets, seven were slightly negatively
(rightward) skewed. The remaining two sample sets were slightly positively (leftward)
skewed. All nine data sets exhibited platykurtic shapes, with negative kurtosis values. All

46
skewness and kurtosis values were well within the acceptable range of -2 to +2 inclusive
thus demonstrating that no sample sets violated the normality assumption.
Accuracy
Response accuracy was captured by the research instrument for each question.
Participants were presented (by use of radio button user interface controls) with two
possible responses for each of the 45 criterion questions. The instrument
programmatically evaluated participant responses. Correct responses were scored as 1
while incorrect responses were scored as 0. For each participant, sums of accuracy
responses for each judgment type (factual, comparative, and inferential) were computed.
Descriptive statistics have been provided for each accuracy measure, as shown in Table
5. Figure 5 graphically depicts the mean accuracy measures for each judgment type and
graphic organizer type.
Table 5. Descriptive Statistics for Accuracy Dependent Measures by Treatment
Treatment DV M (%) SD (%) n Skewness Kurtosis Min. Max.
Static F 69.5 22.2 55 -.18 -1.04 3 15
C 68.6 18.5 -.14 -.48 3 15
I 68.3 20.2 -.35 -.95 4 15
Sortable F 64.6 18.1 52 -.21 -.27 4 15
C 63.3 21.0 .15 -1.09 4 15
I 63.6 20.5 -.19 -1.11 3 14
Shuffle-sort F 70.1 21.5 54 -.15 -.93 4 15
C 65.3 19.5 -.15 -.40 2 15
I 58.0 20.7 .40 -1.06 4 14

47
Figure 5. Mean Accuracy for mental task by graphic organizer type
Multivariate Analysis of Variance
A one-way between-groups multivariate analysis of variance was performed to
investigate accuracy differences between the graphic organizer types. Dependent
variables were Factual, Comparative, and Inferential judgment making. The independent
variable was graphic organizer type. Preliminary assumption testing was conducted to
check for sample size, normality, independence, and multivariate outliers, with no serious
violations noted.
The null hypothesis tested in this analysis stated that mean accuracy did not differ
across the groups, that is:
μ0 = μ1 = μ2
0%
10%
20%
30%
40%
50%
60%
70%
80%
90%
100%
Factual Comparative Inferential
Accu
racy
(pe
rcen
t co
rrec
t)
Static
Sortable
Shuf f le-Sortable
CHANCE

48
There was a statistically significant difference between graphic organizer types on
the combined dependent variables: F(6, 312)=2.378, p=.029; Wilks’ Lambda=0.914;
partial eta squared=.044. However, when the dependent variable results were considered
separately, none of the differences reached statistical significance using a Bonferroni-
adjusted alpha level of 0.017. Therefore, the null hypothesis that accuracy did not differ
across graphic organizer types was not rejected.
As noted previously, a restricted random assignment procedure was performed
such that the last 17 participants in the study were randomly assigned to one of two
(rather than three) possible groups. This restricted random assignment procedure was
undertaken to remedy the observed unequal growth rates of the three experimental groups
(the Shuffle-sort group size was outpacing both the Static and Sortable groups). To
mitigate this potential threat to internal validity, a second MANOVA was performed
using only participants 1-144 (that is, only the participants that had been assigned to
groups using a 1/3 chance of being assigned to any particular group). The results of this
MANOVA were not materially different from the MANOVA above that was based on all
participants: There was a statistically significant difference between graphic organizer
types on the combined dependent variables: F(6, 278)=2.378, p=.024; Wilks’
Lambda=0.901; partial eta squared=.051. However, when the dependent variable results
were considered separately, none of the differences reached statistical significance using
a Bonferroni-adjusted alpha level of 0.017. Therefore, the null hypothesis that accuracy
did not differ across graphic organizer types was also not rejected for this second,
restricted, data set.

49
Analysis of Variance
Because of the increasing intellectual complexity of the three mental tasks
(factual, comparative, inferential), accuracy was expected to decrease across those
measures for each of the three graphic organizer treatments. To test this prediction,
within-group analyses of variance were performed across the three measures for each of
the three graphic organizer treatments, with the following results:
A one-way analysis of variance comparing factual, comparative, and inferential
accuracy for the Static graphic organizer revealed no statistical difference between the
measures, with F(2, 162) = 0.05, p=.950.
A one-way analysis of variance comparing factual, comparative, and inferential
accuracy for the Sortable graphic organizer revealed no statistical difference between the
measures, with F(2, 153) = 0.06, p=.941.
A one-way analysis of variance comparing factual, comparative, and inferential
accuracy for the Shuffle-sortable graphic organizer revealed a statistical difference
between the measures, with F(2, 159) = 4.723, p=.01. Once this difference was noted, a
Tukey HSD (honestly significantly different) follow-up procedure was performed to
investigate the pair-wise comparisons among the accuracy results for this (the shuffle-
sortable) graphic organizer type. The results showed that inferential accuracy was
significantly lower than factual accuracy (mean difference = -1.81, p=.007).
Latency
Response latency, that is, the difference in seconds between the time a question
was displayed to a participant and the time a participant responded to that question, was
captured by the research instrument for each criterion question. For each participant,
sums of latency values for each judgment type (factual, comparative, and inferential)

50
were computed. Descriptive statistics were prepared for each latency measure, as shown
in Table 6. Figure 6 graphically depicts the mean latency measures for each judgment
type and graphic organizer type.
Table 6. Descriptive Statistics for Latency by Treatment
Treatment DV M SD n Skewness Kurtosis Min. Max.
Static F 91.53 44.67 55 1.31 1.60 25.45 223.48
C 85.48 38.13 .25 -.61 24.44 170.62
I 104.01 48.00 1.77 5.81 27.67 311.69
Sortable F 77.32 31.23 52 1.10 1.78 30.59 187.05
C 73.26 30.61 1.14 1.74 22.02 169.89
I 97.97 34.92 .466 -.75 33.50 166.53
Shuffle-sort F 80.20 28.43 54 .36 -.65 27.44 142.38
C 80.08 30.52 .49 -.73 31.10 146.54
I 99.15 35.89 .60 .37 30.54 207.27

51
Figure 6. Mean Latency in Seconds by Graphic Organizer Type
Multivariate Analysis of Variance
A one-way between-groups multivariate analysis of variance was performed to
investigate latency differences between the graphic organizer types (latency is defined as
the time, in seconds, between the time a question was displayed and the time a participant
responded to the question). Dependent variables were Factual Latency, Comparative
Latency, and Inferential Latency. The independent variable was graphic organizer type.
Preliminary assumption testing was conducted to check for independence, normality, and
multivariate outliers with no serious violations noted.
The null hypothesis tested in this analysis stated that mean latency did not differ
across the groups, that is:
μ0 = μ1 = μ2
0
20
40
60
80
100
120
Factual Comparative Inferential
Lten
cy (s
econ
ds)
Static
Sortable
Shuffle-Sortable

52
The multivariate analysis of variance showed no significant difference between
graphic organizer types on the combined dependent variables: F(6, 312)=1.31, p=.25;
Wilks’ Lambda=0.951; partial eta squared=.025. Therefore, the null hypothesis that
latency did not differ for the graphic organizer types was not rejected.
Analysis of Variance
A within-groups analysis of variance was performed to investigate latency
differences within each graphic organizer type. Dependent variables were Factual
Latency, Comparative Latency, and Inferential Latency. The independent variable was
judgment type.
A one-way analysis of variance comparing factual, comparative, and inferential
latency for the Static graphic organizer revealed no statistical difference between the
measures, with F(2, 162) = 2.56, p=.08.
A one-way analysis of variance comparing factual, comparative, and inferential
latency for the Sortable graphic organizer revealed a significant difference between the
measures, with F(2, 153) = 8.79, p=.00. Once this difference was noted, a Tukey HSD
follow-up procedure was performed to investigate the pair-wise comparisons among the
latency results for this (the sortable) graphic organizer type. The results showed that
inferential latency was significantly higher than comparative latency (mean difference =
24.71, p=.00). The results also showed that inferential latency was significantly higher
than factual latency (mean difference = 20.65, p=.004).
A one-way analysis of variance comparing factual, comparative, and inferential
latency for the Shuffle-sortable graphic organizer revealed a significant difference

53
between the measures, with F(2, 159) = 6.448, p=.002. Once this difference was noted, a
Tukey HSD follow-up procedure was performed to investigate the pair-wise comparisons
among the latency results for this (the shuffle-sortable) graphic organizer type. The
results showed that inferential latency was significantly higher than comparative latency
(mean difference = 19.08, p=.006). The results also showed that inferential latency was
significantly higher than factual latency (mean difference = 18.96, p=.006).
Text Viewing Time
Text viewing time (TextTime) represents the time, in seconds, that a participant
spent viewing the text passage that was available during the graphic organizer study
period. Participants viewed the text passage by using the mouse to click and hold a button
labeled Show Text. Participants were free to view the text as often and for as long as they
wished (within the constraints of the five-minute graphic organizer study period). For
each participant, sums of each text-viewing event were computed. Descriptive statistics
were prepared for the text viewing times, as shown in Tables 7 and 8 (owing to the
presence of several outliers and extreme outliers, the data is presented both with and
without the outliers).

54
Table 7. Descriptive Statistics for TextTime (sec) by Treatment
Treatment M SD N Skewness Kurtosis Min. Max.
Static 94.18 113.80 55 2.70 7.22 0 540.62
Sortable 59.66 46.59 52 1.94 7.28 0 271.70
Shuffle-sort 55.06 74.47 54 2.12 12.02 0 424.14
Table 8. Descriptive Statistics for TextTime (sec) by Treatment (minus outliers)
Treatment M SD n Skewness Kurtosis Min. Max.
Static 56.96 35.11 47 .18 -.62 0 126.65
Sortable 52.20 32.66 49 .21 -.39 0 124.02
Shuffle-sort 37.40 31.66 50 .57 -.53 0 111.63
Figure 7 graphically depicts the mean text viewing times (with and without
outliers) for each graphic organizer type.

55
Figure 7. Mean TextTime (with and without outliers)
Analysis of Variance
A one-way analysis of variance comparing TextTime (that is, the amount of time
a participant viewed the text passage during the graphic organizer study time) among the
three graphic organizer types revealed a statistically significant difference between
groups, F(2, 158) = 3.550, p=.031. Once this difference was noted, a Tukey HSD follow-
up procedure was performed to investigate the pair-wise comparisons among TextTime
results for the three graphic organizer types. The results showed that participants in the
Shuffle-sortable group spent significantly less time viewing the text than participants in
the Static group (mean difference = -39.06, p=.042).
Because of the number of outliers and extreme outliers present in the TextTime
0
10
20
30
40
50
60
70
80
90
100
All Observations Without Outliers
Text
Tim
e (s
econ
ds)
Static
Sortable
Shuf f le-Sortable

56
data, a second one-way analysis of variance was undertaken with all outliers and extreme
outliers removed. (The procedure of removing the outliers and extreme outliers reduced
the group sizes by 8, 3, and 4 participants for the Static, Sortable, and Shuffle-sort groups
respectively.) This analysis of variance comparing TextTime among the three graphic
organizer types still revealed a statistically significant difference between groups,
F(2, 143) = 4.46, p=.011. Once this difference was noted, a Tukey HSD follow-up
procedure was performed to investigate the pair-wise comparisons among TextTime
results for the three graphic organizer types. The results showed that, even with outliers
and extreme outliers removed, participants in the Shuffle-sort group spent significantly
less time viewing the text than participants in the Static group (mean difference = -19.56,
p=.012).
To probe for potential relationships between TextTime and overall accuracy, a
2-tailed Pearson’s correlation coefficient analysis was performed. For this analysis,
potential correlations between TextTime and Factual Accuracy, Comparative Accuracy,
and Inferential Accuracy were considered. There was a significant weak negative
correlation between TextTime and Factual Accuracy, r(161) = -.17, p = .018. There was
also a significant weak negative correlation between TextTime and Comparative
Accuracy, r(161) = -.22, p = .005. Finally, there was also a significant weak negative
correlation between TextTime and Inferential Accuracy, r(161) = -.23, p = .004.
Click Events
Click events represent overt actions taken by participants to either sort the rows in
a graphic organizer (for the sortable and shuffle-sort treatment groups) or “shuffle” the
columns (for the shuffle-sort treatment only). The opportunity for types of click events
varies qualitatively by graphic organizer type. That is, the Static graphic organizer type

57
has neither sort nor shuffle capability and therefore can have no associated click events;
the Sortable graphic organizer type has only a sort capability and therefore can have only
click events of type sort; finally the Shuffle-sort graphic organizer type has both sort and
shuffle capabilities and therefore may have click events of the sort and/or shuffle types.
Descriptive statistics are shown in Tables 9 and 10 for click events of types sort
and shuffle respectively. As shown in the tables, participants made use of the available
user interface controls afforded by each treatment.
For the Static treatment group, neither sorting nor shuffling were possible, so
these numbers were zero for those treatments as expected.
For the Sortable treatment group, participants sorted their graphic organizers
about 12 times (M = 12.15, SD = 11.79) with a max of 45 and a min of 0. Six participants
(11.5%) did no sorting. The remaining 46 participants (88.5%) sorted from 2 to 45 times
each.
For the Shuffle-sort treatment group, participants sorted their graphic organizers
about 8 times (M = 7.85, SD = 10.08) with a max of 45 and a min of 0. Thirteen
participants (24.1%) did no sorting. The remaining 41 participants (75.9%) sorted from 1
to 45 times each. The Shuffle-sort treatment also afforded participants with the capability
of “shuffling” columns in a horizontal direction. Participants shuffled their graphic
organizers about 10 times (M= 10.13, SD = 8.02) with a min of 0 and a max of 34. Six
participants (11.1%) did no shuffling. The remaining 48 participants (88.9%) shuffled
from 2 to 34 times each.
The above findings suggest evidence of mindful, effortful actions, which Saloman
and Globerson (1987) say should contribute to both learning and transfer. Learners took

58
such mindful, effortful actions 88.5% of the time for the Sortable treatment and 88.9% of
the time for the Shuffle-sort treatment.

59
Table 9. Descriptive Statistics for Sort Clicks by Treatment
Treatment M SD n Skewness Kurtosis Min. Max.
Static NA NA NA NA NA NA NA
Sortable 12.15 11.79 52 1.29 .86 0 45
Shuffle-sort 7.85 10.08 54 2.12 4.68 0 45
Table 10. Descriptive Statistics for Shuffle Clicks by Treatment
Treatment M SD n Skewness Kurtosis Min. Max.
Static NA NA 55 NA NA NA NA
Sortable NA NA 52 NA NA NA NA
Shuffle-sort 10.13 8.02 54 1.17 1.20 0 34
Ancillary Questions
At the conclusion of the criterion question portion of the research study
participants were asked a series of ancillary questions, that is, questions that were not
intended to be part of the formal statistical analysis just presented. Many of these
questions were intended to elicit amplifying data from participants—data that might be
useful when interpreting the results from the formal analysis. Other questions were
provided to give participants an opportunity to offer their own insights related to their
treatment-specific graphic organizers. The following sections provide the results for the
ancillary questions.
Trends YN
The first ancillary question presented to participants was the yes/no query, “While
studying the fish material, did you notice any trends or relationships?” Two radio buttons
(labeled “Yes” and ”No”) were presented below the question. Participants
overwhelmingly responded affirmatively to this question. All participants answered this

60
question, as the Next button did not become active until a response was provided. Of the
treatment groups, 87.3% of the Static group responded “yes,” 88.5% of the Sortable
group responded “yes,” and 90.7% of the Shuffle-sortable group responded “yes.” These
data are shown in figure 8.
Figure 8. Participant responses to Trends Y/N question
The above figure depicts the number of affirmative and negative participant
responses, by treatment group, to the question, “While studying the fish material, did you
notice any trends or relationships?”
Trends Found
Participants were then asked, “Please list any trends about the fish that you may
have noticed.” A free-form text entry area was provided below the question. The Next
button was always active for this screen, so participants who chose to skip this response
were able to do so (139 of the 161 participants , or roughly 86%, chose to provide a
response to this question).
4846
49
7 6 5
0
10
20
30
40
50
60
Static Sortable Shuffle-Sortable
Part
icip
ants
Yes
No

61
In order to score the free-form responses to this question a coding strategy was
followed. The researcher, without knowledge of the groups corresponding to each
participant response, independently scored each response on a numeric integer scale of 0-
4 inclusive. A grading rubric was prepared, which would award one point for each
correctly identified trend. An example of participant response that would earn one point
for a correctly identified trend might be, “lighter colored fish tend to swim deeper.” The
maximum of four points were awarded for a response in which the participant correctly
identified trends related to depth, size, color, diet, and social grouping. Participants who
stated the same trend in two ways were awarded only one point. Table 11 below depicts
the descriptive statistics for the participant results to the Trends Found ancillary question.
Table 11. Descriptive Statistics for Trends Found
Treatment M SD n Skewness Kurtosis Min. Max.
Static .84 1.09 55 .79 .95 0 3
Sortable .88 1.23 52 .95 .61 0 4
Shuffle-sort .74 1.09 54 1.47 1.52 0 4
Mental Strategies Used
Participants were then asked, “Please list any tricks or mental strategies that you
used while studying the material.” A free-form text entry area was provided below the
question. The Next button was always active for this screen, so participants who chose to
skip this response were able to do so (134 of the 161 participants, or about 83%, chose to
provide a response to this question).
To analyze the strategies participants reported using to remember the study
material information, each participant’s response was examined, without knowledge of

62
participant treatment group. During this examination, one or more codes were assigned
based on keywords or apparent meanings present in the participant responses. The codes
were taken from two prior graphic organizer studies (Spears & Kealy, 2005; Spears,
Motes, & Kealy, 2005). One new category, SO, was added to capture participant
responses related to graphic organizer sorting as a strategy used during study time.
AC acronyms or initials CA categorical assignment CL counting of letters on the display CO colors used – observing those GA game related KW key words LE letters of alphabet appearing on the display ME memorized the information provided PA patterns RE repetition of the information provided RL relationships – noting those evident RS rhyme or song SA sound-alike words SO sorted chart VC visualizing the chart x no meaningful response

63
Figure 9. Aggregate Reported Memory Strategies
By visual inspection of figure 9, one may see that the four most popular valid
strategies overall were “relationships—noting those evident” (RL), “acronyms or initials”
(AC), “memorized the information provided” (ME), and “letters of alphabet appearing on
display” (LE). Together, these strategies comprised roughly 72% of reported valid
strategies. (The “no meaningful response” (x) category included blank responses as well
as non-blank responses in which no study strategy was discernable.)
When considering the strategies with respect to treatments, the strategies seem to
be distributed more or less equally across treatments. One interesting observation is that
the shuffle-sortable treatment appears to have more “letters of alphabet” (LE), “repetition
of the information provided” (RE), and “categorical assignment” (CA) reports when
compared to the static and sortable treatments. Also worth noting is the strategy called
0
5
10
15
20
25
30
35
40
45
x RL AC ME LE RE CA RS KW PA VC CO SA SO
Part
icip
ants
Rep
ortin
g
Reported Memory Strategy
SH
SO
ST

64
“sorted chart” (SO) that was reported only by two sortable graphic organizer treatment
participants.
Effectiveness Query
Participants were then presented with the query, “Do you think that the graphic
organizer you just studied was an effective instructional tool?” Two radio buttons
(labeled Yes and No) were presented below the question, along with a Next button. The
Next button did not become active until the participant selected one of the radio button
choices.
All participants answered this question so there were no missing data. Of the
given responses, the two dynamic graphic organizer treatments each received a little over
80% affirmative responses while the static graphic organizer treatment group received
exactly 60% affirmative responses. These results are depicted in figure 10.
Figure 10. Participant-reported effectiveness rating
60.0%
82.7% 81.5%
0%
10%
20%
30%
40%
50%
60%
70%
80%
90%
Static Sortable Shuf f le-sort
Par
ticip
ants
resp
ondi
ng "y
es" (
%)
Do you think this was an effective instructional tool?

65
Chapter Five: Discussion
This study’s primary goal was to investigate the effects of two instances of a new
type of graphic organizer (the dynamic graphic organizer) on learners’ ability to recall
information, identify trends, and make comparative/inferential judgments after studying a
particular graphic organizer and accompanying informational text passage. Response
latency, that is the difference between the time a question was displayed and the time the
participant responded, was also recorded and analyzed as part of this study.
The two types of dynamic graphic organizer were designed to give learners
increasingly complex levels of available interactivity. The first dynamic graphic
organizer type, the sortable graphic organizer, allowed participants to sort rows, in
ascending or descending order, by the values of elements in any column contained within
the graphic organizer. The second dynamic graphic organizer type, the shuffle-sort
graphic organizer, provided the same capability and additionally provided a feature such
that learners could “shuffle” the contents of the graphic organizer in a column-wise
fashion. These two types of dynamic graphic organizers, plus a traditional static (non-
sortable) graphic organizer, were investigated by means of an experiment in which
participants were randomly assigned to graphic organizer treatment groups.
A multivariate analysis of variance was employed to investigate the relationship
between the independent variable (graphic organizer type) and the dependent variables
(accuracy and latency for factual, comparative, and inferential judgments). A second
multivariate analysis of variance was used to analyze the latency characteristics of both

66
the question types as well as the graphic organizer types. Ancillary questions related to
trends and mental strategies were also administered, recorded, and considered as part of
this study.
A total of 161 participants completed this research study. Sixty-eight percent of
the participants were female while the remaining 32% were male. Participants were
recruited using various means (extra course credit, small cash payment, token
compensation such as snacks) from various undergraduate classes and the general student
population at one two-year community college and one four-year research university
located in a mid-sized urban center in the southeast United States. Most participants
(59%) reported a major in education or related discipline; overall, 38 unique majors were
reported by participants.
This chapter summarizes the research questions and results, followed by
recommendations for learners, educators and instructional designers, and finally
educational researchers with respect to how this study’s findings might be best applied in
each context. Suggestions for future research directions by educational researchers are
also given in light of the present study.
Summary of Research Questions and Results
By augmenting an existing static medium (a graphic organizer) with attributes
such that learners can sort or rearrange information in multiple ways, two new types of
dynamic graphic organizers were created to enable the present study. An experiment to
investigate the effectiveness of these dynamic graphic organizers as instructional tools
was undertaken. Several predictions were made before this experiment took place, as
described in the following paragraphs.
Because of the increasing intellectual complexity of the three mental tasks

67
(factual, comparative, inferential) accuracy was expected to decrease across those
measures for each of the three graphic organizer treatments. However, the decrease was
not expected to be equal across the three treatments. That is, an ordinal interaction
between graphic organizer treatment and mental task was expected. Specifically,
accuracy for factual judgments was predicted to be similar for each of the three
treatments. Accuracy for comparative judgments was predicted to be similar for both
dynamic graphic organizer treatments, with both treatments being significantly better
than the static graphic organizer treatment. It was also expected that dynamic graphic
organizers would be useful for making trends in presented information more apparent,
thereby providing a device where learners are able to more accurately make comparative
and inferential judgments than would be possible with a static graphic organizer.
Furthermore, it was expected that a dynamic graphic organizer providing learners with a
“shuffle-sort” capability would permit learners to more accurately make inferential
judgments than a dynamic graphic organizer with a simple sort capability, with both
types allowing more accurate inferential judgments than would be possible with a static
graphic organizer.
Response latency, that is, the difference between the time a question was
displayed and the time a participant responded to that question, was expected to vary with
the complexity of mental tasks. That is, response latency for inferential judgments was
expected to be greater than response latency for comparative judgments which was
expected to be greater than response latency for factual judgments
Discussion of Results
Research questions
Question one: Is there a significant difference in accuracy for factual judgments

68
among learners presented with a static graphic organizer versus a dynamic sortable
graphic organizer versus a dynamic shuffle-sort graphic organizer?
A multivariate analysis of variance revealed a significant difference between
graphic organizer types on the combined dependent variables: F(6, 312)=2.378, p=.029;
Wilks’ Lambda=0.914; partial eta squared=.044. However, when the dependent variable
results were considered separately, none of the differences reached statistical significance
using a Bonferroni-adjusted alpha level of 0.017. Because factual judgment accuracy is
one of the constituent variables in the MANOVA, one cannot conclude that a significant
difference in accuracy for factual judgments among learners presented with a static
graphic organizer versus a dynamic sortable graphic organizer versus a dynamic shuffle-
sort graphic organizer exists.
The factual accuracy means (with standard deviations in parentheses) for the
graphic organizer types static, sortable, and shuffle-sortable were 10.42 (3.33), 9.69
(2.27), and 10.52 (3.23), respectively.
Question two: Is there a significant difference in accuracy for comparative
judgments
A multivariate analysis of variance revealed a significant difference between
graphic organizer types on the combined dependent variables: F(6, 312)=2.378, p=.029;
Wilks’ Lambda=0.914; partial eta squared=.044. However, when the dependent variable
results were considered separately, none of the differences reached statistical significance
using a Bonferroni-adjusted alpha level of 0.017. Because comparative judgment
accuracy is one of the constituent variables in the MANOVA, one cannot conclude that a
among learners presented with a static graphic organizer versus a dynamic
sortable graphic organizer versus a dynamic shuffle-sort graphic organizer?

69
significant difference in accuracy for comparative judgments among learners presented
with a static graphic organizer versus a dynamic sortable graphic organizer versus a
dynamic shuffle-sort graphic organizer exists.
The comparative accuracy means (with standard deviations in parentheses) for the
graphic organizer types static, sortable, and shuffle-sortable were 10.29 (2.78), 9.50
(3.15), and 9.80 (2.93), respectively.
Question three: Is there a significant difference in accuracy for inferential
judgments
A multivariate analysis of variance revealed a significant difference between
graphic organizer types on the combined dependent variables: F(6, 312)=2.378, p=.029;
Wilks’ Lambda=0.914; partial eta squared=.044. However, when the dependent variable
results were considered separately, none of the differences reached statistical significance
using a Bonferroni-adjusted alpha level of 0.017. Because inferential judgment accuracy
is one of the constituent variables in the MANOVA, one cannot conclude that a
significant difference in accuracy for inferential judgments among learners presented
with a static graphic organizer versus a dynamic sortable graphic organizer versus a
dynamic shuffle-sort graphic organizer exists.
among learners presented with a static graphic organizer versus a dynamic
sortable graphic organizer versus a dynamic shuffle-sort graphic organizer?
The inferential accuracy means (with standard deviations in parentheses) for the
graphic organizer types static, sortable, and shuffle-sortable were 10.24 (3.03), 9.54
(3.07), and 8.70 (3.10), respectively.
Accuracy
Because of the increasing intellectual complexity of the three mental tasks

70
(factual, comparative, inferential) accuracy was expected to decrease across those
measures for each of the three graphic organizer treatments. To test this prediction,
within-group analyses of variance were performed across the three measures for each of
the three graphic organizer treatments, with the following results:
A one-way analysis of variance comparing factual, comparative, and inferential
accuracy for the Static graphic organizer revealed no statistical difference between the
measures, with F(2, 162) = 0.05, p=.950.
A one-way analysis of variance comparing factual, comparative, and inferential
accuracy for the Sortable graphic organizer revealed no statistical difference between the
measures, with F(2, 153) = 0.06, p=.941.
A one-way analysis of variance comparing factual, comparative, and inferential
accuracy for the Shuffle-sortable graphic organizer revealed a statistical difference
between the measures, with F(2, 159) = 4.723, p=.01. Once this difference was noted, a
Tukey HSD follow-up procedure was performed to investigate the pair-wise comparisons
among the accuracy results for this (the shuffle-sort) graphic organizer type. The results
showed that inferential accuracy was significantly lower than factual accuracy (mean
difference = -1.81, p=.007).
From the above findings that it may be noted that, of the three graphic organizer
types, only the shuffle-sort treatment exhibited the predicted downward trend in accuracy
as mental task complexity increased. Figure 5 (p. 47) graphically represents this
observation: the slope of the static and sortable accuracy graphs is relatively flat, while
the slope of the shuffle-sort accuracy graph has an obvious downward trend. In fact, the
mean difference between factual accuracy and inferential accuracy for the shuffle-sort

71
graphic organizer is nearly two accuracy points (-1.81) on a scale having a range of 0-15
inclusive.
Latency
Response latency, that is, the difference between the time a question was
displayed and the time a participant responded to that question, was expected to vary with
the complexity of mental tasks for each graphic organizer type. That is, response latency
for inferential judgments was expected to be greater than response latency for
comparative judgments which was expected to be greater than response latency for
factual judgments.
Before investigating the above-stated prediction, a one-way between-groups
multivariate analysis of variance was performed to determine if latency differences
existed between graphic organizer types. For this analysis, the dependent variables were
Factual Latency, Comparative Latency, and Inferential Latency. The independent
variable was graphic organizer type.
The multivariate analysis of variance showed no significant difference between
graphic organizer types on the combined dependent variables, F(6, 312)=1.31, p=.25;
Wilks’ Lambda=0.951; partial eta squared=.025. Therefore, the null hypothesis that
latency did not differ for the graphic organizer types was not rejected.
To examine the expectation that response latency would increase within each
graphic organizer type as the complexity of mental tasks increased, within-groups
analyses of variance were performed. Dependent variables were Factual Latency,
Comparative Latency, and Inferential Latency. The independent variable was judgment
type.

72
A one-way analysis of variance comparing factual, comparative, and inferential
latency for the Static graphic organizer revealed no significant difference between the
measures, with F(2, 162) = 2.56, p=.08.
A one-way analysis of variance comparing factual, comparative, and inferential
latency for the Sortable graphic organizer revealed a significant difference between the
measures, with F(2, 153) = 8.79, p=.00. Once this difference was noted, a Tukey HSD
follow-up procedure was performed to investigate the pair-wise comparisons among the
latency results for this (the sortable) graphic organizer type. The results showed that
inferential latency was significantly higher than comparative latency (mean difference =
24.71, p=.00). The results also showed that inferential latency was significantly higher
than factual latency (mean difference = 20.65, p=.004).
A one-way analysis of variance comparing factual, comparative, and inferential
latency for the Shuffle-sort graphic organizer revealed a significant difference between
the measures, with F(2, 159) = 6.448, p=.002. Once this difference was noted, a Tukey
HSD follow-up procedure was performed to investigate the pair-wise comparisons among
the latency results for this (the sortable) graphic organizer type. The results showed that
inferential latency was significantly higher than comparative latency (mean difference =
19.08, p=.006). The results also showed that inferential latency was significantly higher
than factual latency (mean difference = 18.96, p=.006).
From the above findings it may be noted that, of the three graphic organizer types,
the predicted increase in latency associated with increased complexity of mental tasks
was only partially observed. For both dynamic graphic organizer types (sortable and
shuffle-sortable), latency for inferential judgments was greatest. However, factual and

73
comparative latencies were relatively similar for both of these graphic organizer types
(for the sortable treatment, mean comparative latency was actually about four seconds
less, although this difference was not significant). The static treatment, although
appearing to graph in a fashion similar to the two dynamic treatments, showed no
statistical differences between latency for each mental task. Figure 6 (p. 51) graphically
represents the measured response latencies for each mental task and each graphic
organizer. This figure, in concert with the MANOVA results, show the fairly dramatic
increase in response latency for the inferential judgment types. The greatest deltas
observed were for the sortable treatment, with mean latency differences of 24.71 seconds
(inferential versus comparative) and 20.65 seconds (inferential versus factual).
Interactivity
Participants seemed willing to exercise the interactive capabilities inherent to the
two dynamic graphic organizer treatments.
For the Sortable treatment group, participants sorted their graphic organizers
about 12 times (M = 12.15, SD = 11.79) with a max of 45 and a min of 0. Six participants
(11.5%) did no sorting. The remaining 46 participants (88.5%) sorted from 2 to 45 times
each.
For the Shuffle-sort treatment group, participants sorted their graphic organizers
about 8 times (M = 7.85, SD = 10.08) with a max of 45 and a min of 0. Thirteen
participants (24.1%) did no sorting. The remaining 41 participants (75.9%) sorted from 1
to 45 times each. (One might speculate that the shuffle-sort treatment’s apparently lower
number of mean sort events was influenced by the fact that the shuffle-sort treatment
offered two controls for rearranging the graphic organizer content while the sortable

74
treatment had but one.) The Shuffle-sort treatment also afforded participants with the
capability of “shuffling” columns in a horizontal direction. Participants shuffled their
graphic organizers about 10 times (M= 10.13, SD = 8.02) with a min of 0 and a max of
34. Six participants (11.1%) did no shuffling. The remaining 48 participants (88.9%)
shuffled from 2 to 34 times each.
The above findings suggest that learners, by overtly manipulating graphic
organizer elements in the two dynamic treatments, were taking mindful, effortful actions
expected to contribute to learning and transfer (Salomon & Globerson, 1987). Learners
took such mindful, effortful actions more than 88% of the time for the Sortable treatment
and more than 75% of the time for the Shuffle-sort treatment.
One treatment-independent user interface control available to participants was the
View Text button, displayed for each treatment during its five-minute graphic organizer
study period. One-hundred-forty-six participants (91%) used the View Text button to, at
least briefly, view the text passage that accompanied each graphic organizer. Because
some of these non-zero View Text values may represent participants who simply had a
brief investigatory look at the accompanying text passage (without any meaningful study
of the text passage) a metric characterizing a longer text study time might be more
valuable than a simple “clicks > 0”. A more meaningful text viewing time might be one
minute. When considering this criterion (that is, participants who viewed the text for at
least one minute) the number becomes 76 participants, or 47%. It should be noted that the
default study condition for each treatment was “study graphic organizer.” In other words,
participants who took no overt action to click/hold the View Text button saw only their
treatment-dependent graphic organizer. This was by design, as the primary focus of this

75
study was dynamic graphic organizers, not text passages. This characteristic of the
study’s design is not viewed as a limitation, as the researcher believes that this study’s
results would not have been materially different had the text passage been omitted
completely
Summary of Findings
This study’s primary goal was to investigate the effects of two instances of a new
type of graphic organizer (the dynamic graphic organizer) on learners’ ability to recall
information, identify trends, and make comparative/inferential judgments after studying a
particular informational passage. Response latency was also recorded and analyzed as
part of this study.
Graphic organizers arrange information in a manner that facilitates side-by-side
comparison, exhibiting a “visual argument” whereby interrelationships between
presented elements are readily perceivable (Robinson, Robinson, & Katayama, 1999). In
this study, the supposition was tested that providing learners with a mechanism that might
allow them to overtly influence the degree of visual argument (by reorienting display
elements nearer to each other) would increase learner accuracy, especially with respect to
more complex mental tasks such as comparative and inferential judgments. Similarly,
exploiting generative learning (Wittrock, 1991) while adding an interactive dimension to
a formerly static medium (Kozma, 1991) were projected to yield benefits for the two
dynamic graphic organizer treatments. Contrary to expectations, the graphic organizers
that gave learners this interactive capability seemingly performed no better than a
traditional, static graphic organizer. In fact, mean accuracy for inferential judgments (the
most complex type) actually decreased (although not to a statistically significant degree)

76
as the level of available graphic organizer interactivity increased.
One possible explanation for this observed phenomenon might be that the
inherent overhead associated with sorting (or shuffle-sorting) was not compensated by
any potential accuracy improvements gained by the newly arranged elements in the
graphic organizer. This overhead involved the opportunity cost associated with
manipulation of the user interface controls (i.e., a participant rearranging the items in the
graphic organizer was not studying the graphic organizer). Similarly, mindful processing
associated with rearranging the elements may not have benefited schema development
associated with the material under study, but instead benefited only knowledge associated
with learning the user interface controls themselves.
Rather than an overhead-based explanation for the dynamic graphic organizers’
performance, one could also describe it in terms of cognitive load (defined by Sweller
[1988] as the demand on mental resources imposed by both the number of elements and
the interrelatedness of these elements). The dynamic graphic organizers’ inherent
cognitive load could have conceivably been increased (unlike the static graphic
organizer) thus exhausting available mental resources in the learners, with relatively few
resources remaining for the actual learning.
Another factor to consider is the possible influence of text viewing time. Text
viewing time, or simply text time, is the cumulative time that a participant spent with the
View Text user interface button pressed. When this button was pressed, the on-screen
graphic organizer was replaced by the accompanying 204-word text passage. This
passage comprised the text-only version of instructional material, informationally
equivalent to the graphic organizers. Participants were required to keep constant pressure

77
on this button in order to keep the text displayed. Similarly, displaying the text required
overt action on the participant’s part. Taken together, these premises might suggest that
text time was more mindful study time. In contrast, during the non-text-time portion of
the five-minute study period participants might have been looking somewhere other than
the graphic organizer, randomly manipulating the dynamic graphic organizers’ controls,
or simply daydreaming.
A very promising finding is the fact that participants in both dynamic treatments
reported much greater percentages of affirmative responses to the question, “Did you
think your graphic organizer was an effective instructional tool?” with 82.7% and 81.5%
responding “yes” for the Sortable and Shuffle-sort groups, respectively, and only 60.0%
responding “yes” for the Static group. These findings are important, as it is conceivable
that learners with such positive perceptions might be more likely to use dynamic graphic
organizers. Similarly, metacomprehension (that is, a person’s ability to judge his or her
own learning and/or comprehension of text materials) research has shown that adult
learners often tend to make efficacious study choices (Metcalfe, 2009). It might follow,
therefore, that learners who perceived that a dynamic graphic organizer was more
effective than a static one might be more likely to study the former. Similarly, these
learners might have more confidence in their ability to learn from such devices.
Recommendations to Stakeholders
By drawing from both the review of the relevant literature as well as the findings
of the current study, this section puts forth recommendations for learners, instructors and
instructional designers, and finally for the design of future studies.
Learners
The ultimate goal of this study has been to benefit learners. Without individual

78
participants taking on the role of learners, this study would not have been possible. This
study’s results suggest that a dynamic graphic organizer may be no more effective than a
traditional static graphic organizer for making trends and relationships apparent to
learners. However, the subject material of the current study was of a fairly narrow scope
and size (a 204-word passage comprising declarative text related to several fictitious
species of fish and their characteristics). It is conceivable that a dynamic graphic
organizer might perform better when used with other educational content. Learners
encountering graphic organizers of any type may wish to be attentive to cues in the
instructional material related to trends or relationships, as matrix-like graphic organizers
are frequently used to convey information of this type.
Instructors and Instructional Designers
With respect to the unique perspective and requirements of instructional designers
and educators, this study’s findings may give pause to those considering the
implementation of a dynamic graphic organizer. For the type of comparative prose
studied in this research, a traditional static graphic organizer may serve the educational
requirements just as well as a dynamic graphic organizer. It should be noted that scope
and content of the present study’s instructional material represent a small subset of
instructional material types—this specific instructional material (a 204-word passage
comprising declarative text related to several fictitious species of fish and their
interrelationships) cannot begin to represent all types of instructional material. It is
plausible that a dynamic graphic organizer might perform better when used with other
educational content. Educators and instructional designers should also keep in mind the
increased learner engagement benefits potentially derivable from interactive entities such

79
as the dynamic graphic organizer.
Educational Researchers
The experiment conducted as part of this study used a relatively limited,
somewhat artificial subject material of a relatively small size (a 204-word passage
comprising declarative text related to several fictitious species of fish and their
interrelationships). Educational researchers may wish to retest this study’s baseline
hypothesis by using other types of instructional materials (e.g., more elements, increased
complexity). Similarly, educational researchers may wish to revisit the study’s hypothesis
using a different approach to study time. In this research, study time was fixed at five
minutes. An alternative approach might involve graphic organizer study time under the
control of the learner rather than the experimental program. It is possible that a dynamic
graphic organizer might perform better than static graphic organizers under one or both
conditions just noted, although the present study does not provide evidence for this.
Final Summary
This study was undertaken to determine what effects on learner recall might exist
when two instances of a new type of graphic organizer (the dynamic graphic organizer)
were used to convey information taken from a particular comparative text passage.
Learner responses were measured for both recall accuracy and latency when making
factual, comparative, and inferential judgments related to the information contained in the
graphic organizer and text.
The two dynamic graphic organizer treatments were designed to give learners two
distinct levels of interactive capability. The first dynamic treatment (sortable graphic
organizer) allowed participants to sort rows, in ascending or descending order, by the
content of a particular column within the graphic organizer. The second treatment

80
(shuffle-sort graphic organizer) added a feature such that learners could “shuffle” (that is,
reorient columns in a left-to-right or right-to-left fashion) the contents of the graphic
organizer in a column-wise fashion. These two dynamic graphic organizer treatments,
plus a traditional static (non-sortable) graphic organizer, were the basis of the subject
experiment.
A total of 161 volunteer participants completed this research study. Sixty-eight
percent of the participants were female; the remaining 32% were male. Participants were
recruited using various means (extra course credit, small cash payment, or with
compensation other than small snacks) from various undergraduate classes and the
general student population at one two-year community college and one four-year research
university located in a mid-sized urban center in the southeast United States.
Two multivariate analyses of variance were used to examine the relationships
between the independent variable (graphic organizer type) and the dependent variables
(accuracy and latency for factual, comparative, and inferential judgments). These
analyses showed no significant differences between the three graphic organizer types for
response accuracy or response latency, suggesting that a dynamic graphic organizer may
be equivalent to a static graphic organizer for the type of comparative material
represented in the graphic organizers. A within-groups analysis of variance showed no
significant differences in response accuracy or latency between mental tasks within the
static or sortable tasks. However, analysis of variance did indicate that accuracy for
inferential judgments was less than that for factual judgments in the shuffle-sortable
group, suggesting that the shuffle-sortable type of dynamic organizer may not be as
robust with respect to mental task type as the other two types of graphic organizers

81
evaluated.
Response latency within groups was also considered. A within-groups analysis of
variance showed significant differences in response latency between factual and
inferential judgment-making for both the sortable and shuffle-sort treatments; no
significant differences in response latency were observed within the static treatment.
Other findings revealed that participants in the shuffle-sort group spent
significantly less time viewing the accompanying text than participants in the static
group, suggesting that perhaps learners in the static group had more time available to do
so, in contrast to the shuffle-sort participants, who may have been occupied with the
unique controls provided in that treatment. This finding was consistent even when
outliers and extreme values were removed from the shuffle-sort group’s data.
Analysis also revealed a significant, although weak, negative correlation between
text viewing time and accuracy across all three mental task types, suggesting that learners
who spent more time viewing the text (and therefore less time viewing the graphic
organizer) did slightly worse than learners who did the opposite. This reinforces findings
from earlier studies that showed the overall effectiveness of graphic organizers as adjunct
displays to text.
This study investigated the effect of dynamic graphic organizers on learner recall
accuracy and response latency for various types of mental tasks associated with a
particular instance of instructional material. The results suggest that dynamic graphic
organizers may be equivalent to static graphic organizers, at least under the conditions of
the present study. However, a much higher proportion of dynamic treatment learners
(versus the static treatment learners) perceived that their respective graphic organizers

82
were effective instructional tools. Opportunities for future research exist to perhaps
reinforce or refute these findings, while simultaneously augmenting the instructional
technology research literature.

83
References
ACT, Inc. (2006). Reading between the Lines: College Readiness in Reading. Iowa City,
IA: Author.
Allen, I. E., & Seaman, J. (2007). Online nation: Five years of growth in online learning.
Retrieved March 15, 2009, from http://www.sloan-
c.org/publications/survey/pdf/online_nation.pdf
Ausubel, D.P. (1960). The use of advance organizers in the learning and retention of
meaningful behavior. Journal of Educational Psychology, 51, 267-272.
Ausubel, D. P. (1963). The psychology of meaningful verbal learning. New York: Grune
& Stratton.
Ausubel, D.P. (1968). Educational psychology: A cognitive view. New York: Holt,
Rinehart & Winston.
Ausubel, D., Robbins, L., & Blake, E. (1957, October). Retroactive inhibition and
facilitation in the learning of school materials. Journal of Educational
Psychology, 48(6), 334-343.
Barron, R. F. (1969). The use of vocabulary as an advance organizer. In H. L. Herber &
P. L. Sanders (Eds.), Research in reading in the content areas: First year report
(pp. 29-39). Syracuse, NY: Syracuse University, Reading and Language Arts
Center.

84
Barron, R. F. (1970). The effects of advance organizers upon the reception learning and
retention of general science content. (ERIC Document Reproduction Service No.
ED 061 554).
Barron, R. F. (1980). A systematic research procedure, organizers, and overviews: An
historical perspective. Paper presented at the meeting of the National Reading
Conference, San Diego.
Bera, S. J., & Robinson, D. H. (2004). Exploring the boundary conditions of the delay
hypothesis with adjunct displays, Journal of Educational Psychology, 96, 381-
386.
Bertin, J. (1983). Semiology of graphics. Madison, WI: The University of Wisconsin
Press.
Bertin, J. (1990). Semiology of graphics: Diagrams, networks, maps. Madison, WI: The
University of Wisconsin Press.
Bjork, R.A. (1994). Memory and meta-memory considerations in the training of human
beings. In J. Metcalfe & A. Shimamura (Eds.), Metacognition: Knowing about
knowing (pp. 185-205). Cambridge, MA: MIT Press.
Bloom, B. S., Krathwohl, D. R., & Masia, B. B. (1956). Taxonomy of educational
objectives: The classification of educational goals. New York: D. McKay.
Bogartz, R. S. (1994). An introduction to the analysis of variance. Westport, Connecticut:
Praeger.
Bonn, K. L., & Grabowski, B. L. (2001, January). Generative learning theory: A
practical cousin to constructivism. Paper presented at the Joint Meeting of
Mathematics, New Orleans, LA.

85
Boroditsky, L., & Griffiths, T. (n.d.). Psych 290 graduate research methods, Stanford
University. Retrieved from http://www-
psych.stanford.edu/~lera/290/lecture1.html on 09/01/2009.
Busch, T. (1995). Gender differences in self-efficacy and attitudes toward computers.
Journal of Educational Computing Research, 12,147-158.
Chandler, P., & Sweller, J. (1991). Cognitive load theory and the format of instruction.
Cognition and Instruction, 8: 293-332.
Christensen, L. (1977). Experimental methodology (1st ed.). Boston, Allyn & Bacon, Inc.
Cohen, J. (1992). A power primer. Psychological Bulletin, 112(1), 155-159.
Comber, C., Colley, A., Hargreaves, D., & Dorn, L. (1997). The effects of age, gender,
and computer experience upon computer attitudes. Journal of Educational
Research, 39(2), 123-133.
Crooks, S. M., White, D., & Barnard, L. (2007). Factors influencing the effectiveness of
note taking on computer-based graphic organizers. Journal of Educational
Computing Research, 37, 369-391.
Day, J., Janus, A., & Davis, J. (2005). Computer and internet use in the United States:
2003. U.S. Census Bureau, October 2005.
Field, A. P., & Hole, G. (2003). How to design and report experiments. London: Sage
Publications.
Fleming, M. & Levie, W.H. (1978). Instructional message design. Englewood Cliffs,
New Jersey: Educational Technology Publications.
Flesch, R. (1949). The art of readable writing. New York: Harper.

86
Friedman, M. P., & Greitzer, F. L. (1972). Organization and study time in learning from
reading. Journal of Educational Psychology, 63, 609-616.
Grabowski, B. J. (2004). Generative learning contributions to the design of instruction
and learning. In D. J. Jonassen (Ed.), Handbook of educational communications
and technology (2nd ed., pp. 719–743). Hillsdale, NJ: Lawrence Erlbaum
Associates, Publishers.
Greene, R. L. (1992). Human memory: paradigms and paradoxes. Hillsdale, NJ:
Lawrence Erlbaum Associates.
Griffin, M. M., & Robinson, D. H. (2005). Does spatial or visual information in maps
facilitate text recall? Reconsidering the conjoint retention hypothesis. Educational
Technology Research and Development, 53, 23–36.
Guthrie, J. T., Weber, S., & Kimmerly, N. (1993). Searching documents: Cognitive
process and deficits in understanding graphs, tables, and illustrations.
Contemporary Educational Psychology, 18: 186–221.
Hall, T. & Strangman, N. (2005). Graphic organizers. Retrieved February 28, 2009 from
http://www.cast.org/publications/ncac/ncac_go.html.
Haunstetter, D. (2008). Digitally implemented interactive fiction: Systematic development
and validation of "Mole, P.I", a multimedia adventure for third grade readers.
Ph.D. dissertation, University of South Florida, United States -- Florida. Retrieved
February 13, 2010, from Dissertations & Theses @ University of South Florida -
FCLA. (Publication No. AAT 3326072).
Hyde, J. S. (2005). The gender similarities hypothesis. American Psychologist, 60, 581–
592.

87
IBM SPSS Statistics 18 (2010). Computer software. 2010.
Ihator, A. S. (2001). Communication style in the information age, Corporate
Communications: An International Journal, 6(4), 199-204.
John, P. W. (1971). Statistical Design and Analysis of Experiments. Macmillan Co.
Johnson, B., & Christensen, L. (2004). Educational research (2nd ed.). Boston: Pearson.
Jonassen, D. H., Beissner, K., & Yacci, M. (1993). Structural knowledge: Techniques for
representing, conveying, and acquiring structural knowledge. Hillside, NJ:
Lawrence Erlbaum.
Kauffman, D. F., & Kiewra, K. A. (2009). What Makes a Matrix so Effective? An
Empirical Test of the Relative Benefits of Signaling, Extraction, and Localization.
Instructional Science., 1.
Kay, R. H. (1993). A critical evaluation of gender differences in computer-related
behaviour. Computer in the Schools, 9(4), 81-93.
Kealy, W. A., Bakriwala, D. J., & Sheridan, P. B. (2003). When tactics collide: Counter
effects between and adjunct map and prequestions. Educational Technology
Research & Development, 51, 17-39.
Kiernan, V. (2003, August 8). A survey documents growth in distance education in late
1990s. Chronicle of Higher Education, 49(48), A28. Retrieved March 17, 2009,
from Academic Search Premier database.
Kiewra, K. A., Kauffman, D. F., Robinson, D. F., Dubois, N. F., & Staley, R. K. (1999).
Supplementing floundering text with adjunct displays. Instructional Science, 27,
373-401.

88
Kozma, R. B. (1991). Learning with media. Review of Educational Research, Vol. 61,
No. 2. (Summer, 1991), pp. 179-211.
Krathwohl, D. R. (2002). A revision of Bloom’s taxonomy: An overview. Theory Into
Practice, 41(4), 212-218.
Kulhavy, R. W., Lee, J. B., & Caterino, L. C. (1985). Conjoint retention of maps and
related discourse. Contemporary Educational Psychology, 10, 28-37.
Kulhavy, R. W., Stock, W. A., and Kealy, W. A. (1993). How geographic maps increase
recall of instructional text. Educational Technology Research & Development,
41(4): 47–62.
Lankshear, C., & Knobel, M. (2007). Sampling "the new" in new literacies. In M. Knobel
& C. Lankshear (Eds.), A new literacies sampler (pp. 1-24), New York: Peter
Lang.
Larkin, J.H., & Simon, H.A. (1987). Why a diagram is (sometimes) worth 10,000 words.
Cognitive Science, 11, 65-100.
Lee, H. W. & Grabowski, B. L., (2009). Generative learning strategies and metacognitive
feedback to facilitate comprehension of complex science topics and self-
regulation. Journal of Educational Multimedia and Hypermedia, 18(1), 5-33.
Lidwell, W., Holden, K., & Butler, J. (2003). Universal principles of design. Gloucester,
Mass: Rockport.
Mayer, R. E. (2001). Multimedia learning. New York: Cambridge University Press.
Mayer, R. E., & Chandler, P. (2001). When learning is just a click away: Does simple
user interaction foster deeper understanding of multimedia messages? Journal of
Educational Psychology, 93(2), 390-397.

89
Metcalfe, J. (2009). Metacognitive judgments and control of study. Current Directions in
Psychological Science, 18, 159–163.
Meyer, B. J. F., Brandt, D. M., & Bluth, G. J. (1980). Use of top-level structure in text:
Key for reading comprehension of ninth-grade students. Reading Research
Quarterly, 16, 72-103.
Meyer, B. J. F., & Poon, L. W. (2001). Effects of structure strategy training and signaling
on recall of text. Journal of Educational Psychology, 93, 141-159.
Montgomery, D.C. (1997). Design and analysis of experiments. 1991. Wiley and Sons,
New York.
Morgan, J. (2006). Work, school, and computer ownership. Proceedings of the Academy
of Information and Management Sciences, 10(1), 13-17.
Noble, C. E. (1952). An analysis of meaning. Psychological Review, 59
Paivio, A. (1990). Mental Representations: A dual coding approach. Oxford University
Press, New York.
, 421-430.
Pallant, J. (2005). SPSS survival manual. Maidenhead: Open University Press.
Rieber, L. P. (1994). Computers, graphics & learning. Madison, Wis: Brown &
Benchmark.
Robinson, D. H. (1998). Graphic organizers as aids to text learning. Reading Research
and Instruction, 37:85–105.
Robinson, D. H. (Ed.). (2008). Spatial text adjuncts and learning. [Special issue.]
Educational Psychology Review, 14.

90
Robinson, D. H., Corliss, S. B., Bush, A. M., Bera, S. J., & Tomberlin, T. (2003).
Optimal presentation of graphic organizers and text: A case for large bites?
Educational Technology Research & Development, 51(4), 25-41.
Robinson, D. H., Katayama, A. D., Beth, A. B., Odom, S., Hsieh, Y., & Vanderveen, A.
(2006). Increasing text comprehension and graphic note taking using a partial
graphic organizer. The Journal of Educational Research, 100(2), 103-111.
Robinson, D. H., Katayama, A. D., & Fan, A. C. (1996). Evidence for conjoint retention
of information encoded from spatial adjunct displays. Contemporary Educational
Psychology, 21: 221-239.
Robinson, D. H., & Molina, E. (2002).The relative involvement of visual and auditory
working memory when studying adjunct displays. Contemporary Educational
Psychology, 27(1): 118-131.
Robinson, D. H., Robinson, S. L., & Katayama, A. D. (1999). When words are
represented in memory like pictures: Evidence for the spatial encoding of study
materials. Contemporary Educational Psychology, 24: 38-54.
Robinson, D. H., & Schraw, G. (1994). Computational efficiency through visual
argument: do graphic organizers communicate relations in text too effectively?
Contemporary Educational Psychology, 19(4), 399-415.
Robinson, D. H., & Skinner, C. H. (1996). Why graphic organizers facilitate search
processes: Fewer words or computationally efficient indexing? Contemporary
Educational Psychology, 21: 166–180.
Rowell, G. H., Perhac, D. G., Hankins, J. A., Parker, B. C., Pettey, C. C, & Iriarte-Gross,
J. M. (2003). Computer-related gender differences. The Proceedings of the Thirty-

91
fourth SIGCSE Technical Symposium on Computer Science Education, Reno,
Nevada, US, 54 - 58.
Salomon, G., & Globerson, T. (1987). Skill may not be enough: The role of mindfulness
in learning and transfer. International Journal of Educational Research, 11(6),
623-627.
Schwartz, N. H., Ellsworth, L. S., Graham, L., and Knight, B. (1998). Accessing prior
knowledge to remember text: A comparison of advance organizers and maps.
Contemporary Educational Psychology, 23: 65–89.
Schwarz N., Hippler H. J., Noelle-Neumann, E. (1992). A cognitive model of response
order effects in survey measurement. In Context Effects in Social and
Psychological Research, ed. N Schwarz, S Sudman, New York: Springer-Verlag.
Son, L. K., & Metcalfe, J. (2000). Metacognitive and control strategies in study-time
allocation. Journal of Experimental Psychology: Learning, Memory, and
Cognition, 26, 204-221
Spears, C., Hubbard, B. & Kealy, W. A. (2007, October). Improving data-driven
judgment with dynamic graphic organizers. Paper presented at the annual
conference of the Association for Educational Communications and Technology,
Anaheim, CA.
Spears, C., & Kealy, W. A. (2005, March). Do retinal variables enhance graphic
organizers? Paper presented at the Southeastern Conference in Instructional
Design and Technology, Mobile, AL.
Spears, C., Motes, G., & Kealy, W. A. (2005, October). Configuring graphic organizers
to support higher-order thinking skills. Paper presented at the annual conference

92
of the Association for Educational Communications & Technology, Orlando, FL.
Sweller, J., & Chandler, P. (1994).Why is some material difficult to learn. Cognition and
Instruction, 12(3): 185–233.
Sweller, J., van Merriënboer, J., & Paas, F. (1998). Cognitive architecture and
instructional design. Educational Psychology Review, 10, 251–296.
Terlecki, M. S. and Newcombe, N. S. (2005). How important is the digital divide? The
relation of computer and videogame usage to gender differences in mental
rotation ability. In Sex Roles, 53, 5-6, 433-441.
Thorsen, C. (2006). TechTactics: Technology for teachers, 2nd Edition. Boston: Allyn
and Bacon.
Tulving, E., & Craik, F. I. M. (2000). The Oxford handbook of memory. Oxford: Oxford
University Press.
Wade, S. E., Trathen, W., & Schraw, G. (1990). An analysis of spontaneous study
strategies. Reading Research Quarterly, 25(2), 147-166.
Wainer, H. (1992). Understanding graphs and tables. Educational Researcher, 21(1), 14-
23.
Waller, R. (1981). Understanding network diagrams. Paper presented at the Annual
Meeting of the American Educational Research Association, Los Angeles.
Weisberg, H. F., Krosnick, J. A., & Bowen, B. D., (1996). An introduction to survey
research, polling, and data analysis, 3rd ed. Newbury Park, CA: Sage.
Winn, W. D. (1991). Learning from maps and diagrams. Educational Psychology Review,
3, 211-247.

93
Winn, W. D. (1993). An account of how people search for information in diagrams.
Contemporary Educational Psychology, 18(2), 162-185.
Winn, W. D., & Holliday, W. G. (1982). Design principles for diagrams and charts. In D.
H. Jonassen (Ed.), The technology of text (pp. 277-299). Englewood Cliffs, NJ:
Educational Technology Publications.
Wittrock, M. C. (1974a). Learning as a generative process. Educational Psychologist, 11,
87-95.
Wittrock, M. C. (1974b). A generative model of mathematics education. Journal for
Research in Mathematics Education, 5(4), 181–196.
Wittrock, M. C. (1992). Generative learning processes of the brain. Educational
Psychologist, 27(4), 531-541.

94
Appendices

95
Appendix A. The original informational text passage
Fish fall into one of three social groupings: solitary, small, or school. Solitary fish do not socialize with other fish. Examples of solitary fish are the Hat and the Arch. Although the Hat and Arch are both solitary fish, they differ in several ways. The Hat swims at depths of 200 feet, whereas the Arch swims 400 feet below the surface. The Arch is 45 cm in length; the Hat is 30 cm. The Hat is a black color and eats shrimp. The Arch is blue and eats krill.
Fish in small groups also vary. They swim at depths of 200 feet like the Lup or at 600 feet like the Tin. The Lup is 30 cm, eats shrimp, and is brown. The Tin is 70 cm, eats prawn, and is yellow.
Fish in schools vary along different dimensions. The Bone, for example, is 45 cm and swims at 400 feet. In contrast, the Scale is 70 cm and can be found at 600 feet. The Bone is orange and eats krill, whereas the Scale is white and eats prawn.
Thus, it can be seen that fish which belong to various social groups are quite diverse with respect to size, color, depth and diet.
Figure 11. Robinson and Schraw informational text passage
The text shown above is the original 204-word passage from Robinson & Schraw (1994).
It contains various facts (and implicit relationships) related to six fictitious species of
fish.

96
Appendix B. Informational text passage for the current study
Fish fall into one of three social groupings: solitary, small, or school. Solitary fish do not socialize with other fish. Examples of solitary fish are the Latuk and the Taroz. Although the Latuk and Taroz are both solitary fish, they differ in several ways. The Latuk swims at depths of 200 feet, whereas the Taroz swims 400 feet below the surface. The Taroz is 60 inches in length; the Latuk is 40 inches. The Latuk is a black color and eats algae. The Taroz is blue and eats shrimp.
Fish in small groups also vary. They swim at depths of 200 feet like the Goken or at 600 feet like the Ponef. The Goken is 40 inches, eats algae, and is brown. The Ponef is 90 inches, eats flounder, and is yellow.
Fish in schools vary along different dimensions. The Kupod, for example, is 60 inches and swims at 400 feet. In contrast, the Somet is 90 inches and can be found at 600 feet. The Kupod is orange and eats shrimp, whereas the Somet is white and eats flounder.
Thus, it can be seen that fish which belong to various social groups are quite diverse with respect to size, color, depth and diet.
Figure 12. Current informational text passage
The text passage shown above was used in the study. It is based on Robinson & Schraw
(1994) with the following changes:
• The fictitious fish names used by Robinson and Schraw have been replaced. Although
the fish species used by Robinson and Schraw were intended to be fictitious, some of
the selected names are similar to genuine species of fish (e.g., bonefish and archer
fish). To help prevent prior fish species knowledge activation within the participants,
the fictitious fish species from the original passage were replaced with two-syllable
non-words having relatively low scores on Noble’s (1952) “index of meaning” rating;
these two-syllable non-words were originally used in Spears, Motes, & Kealy (2005).
• The units of measure for fish length were converted from centimeters to inches. This
was done to make the text passage more suited for participants in the United States,
the location of the proposed study. The fish sizes were also increased (but proportions
maintained) to make them more authentic as prawn- and shrimp-eating marine fishes.
• Finally, the diet species were changed to match Kiewra et al. (1999). This was done
for two reasons: (1) to use species that would be more familiar to participants (e.g.,

97
“krill” and “prawn” are likely not as familiar to participants as “algae” and “shrimp”);
and (2) to use species whose relative sizes would be more apparent to learners, thus
providing an opportunity to include another trend in the data.
The differences between the Robinson & Schraw and the current study
informational text passages are summarized below.
Table 12. Differences between Robinson & Schraw and this study
Robinson & Schraw (1994) Proposed Study
Lup Goken
Hat Latuk
Bone Kupod
Arch Taroz
Tin Ponef
Scale Somet
30 cm 40 inches
45 cm 60 inches
70 cm 90 inches
Shrimp Algae
Krill Shrimp
Prawn Flounder

98
Appendix C. Criterion items used in the study
Table 13. Factual judgment-making criterion questions
No. Criterion Question Choices Category Rand.1 What color is Latuk? Black/Blue F1 503422 What color is Taroz? Yellow/Blue F2 681683 What color is Ponef? Orange/Yellow F3 251264 At what depth does Goken swim? 200 ft. / 400 ft. F4 551045 At what depth does Kupod swim? 400 ft. / 600 ft. F5 398326 At what depth does Somet swim? 400 ft. / 600 ft. F6 152927 What does Goken eat? Algae/Shrimp F7 405318 What does Kupod eat? Shrimp/Flounder F8 752659 What does Somet eat? Shrimp/Flounder F9 5801210 What is Latuk’s social grouping? Solitary/Small F10 9681711 What is Goken’s social grouping? Small/School F11 245612 What is Taroz’s social grouping? Solitary/Small F12 3770613 What size is Kupod? 60 in. / 90 in. F13 4147714 What size is Ponef? 60 in. / 90 in. F14 9958915 What size is Somet? 60 in. / 90 in. F15 40643
(Correct answers shown in bold typeface.) Table 14. Comparative judgment-making criterion questions
No. Criterion Question Choices Category Rand.16 Which is darker in color? Goken/Kupod C1 8315117 Which is darker in color? Latuk/Ponef C2 5813018 Which is lighter in color? Kupod/Somet C3 9828919 Which swims at a lesser depth? Goken/Somet C4 5441120 Which swims at a greater depth? Goken/Taroz C5 8463221 Which swims at a greater depth? Latuk/Ponef C6 4394622 Which feeds more on shrimp? Kupod/Latuk C7 9024523 Which feeds more on algae? Goken/Ponef C8 1347224 Which feeds more on flounder? Taroz/Somet C9 7715025 Which forms into smaller groups? Latuk/Somet C10 7813726 Which forms into larger groups? Ponef/Kupod C11 2060327 Which forms into larger groups? Somet/Goken C12 9684328 Which is smaller in size? Taroz/Goken C13 3761629 Which is smaller in size? Ponef/Latuk C14 5401630 Which is larger in size? Somet/Kupod C15 82674
(Correct answers shown in bold typeface.)

99
Table 15. Inferential judgment-making criterion questions
No. Criterion Question Choices Category Rand.31 Lighter-colored fish tend to swim at a _____ depth. lesser/greater I1 9775532 Darker-colored fish tend to be _____ in size. smaller/larger I2 667633 Darker-colored fish tend to form _____ groups. smaller/larger I3 8545734 Lesser-depth fish tend to form _____ groups. smaller/larger I4 8873835 Greater-depth fish tend to be _____ colored. lighter/darker I5 7719136 Lesser-depth fish tend to be _____ in size. smaller/larger I6 9778037 Algae-eating fish tend to swim at a _____ depth. lesser/greater I7 1184638 Algae-eating fish tend to be _____ colored. lighter/darker I8 7591039 Flounder-eating fish tend to swim at a _____ depth. lesser/greater I9 8707340 Smaller groupings of fish tend to be _____ colored. lighter/darker I10 8117241 Smaller groupings of fish tend to be _____ in size. smaller/larger I11 1001442 Larger groupings of fish tend to be _____ colored. lighter/darker I12 1708143 Smaller-sized fish tend to be _____ colored. lighter/darker I13 3819244 Smaller-sized fish tend to form _____ groups. smaller/larger I14 3343845 Larger-sized fish tend to be _____ colored. lighter/darker I15 75589
Correct answers shown in bold typeface.)

100
Table 16. Aggregate criterion questions after having random sequence applied
No. Criterion Question Choices Category Rand.11 What is Goken’s social grouping? Small/School F11 245632 Darker-colored fish tend to be _____ in size. smaller/larger I2 667641 Smaller groupings of fish tend to be _____ in size. smaller/larger I11 1001437 Algae-eating fish tend to swim at a _____ depth. lesser/greater I7 1184623 Which feeds more on algae? Goken/Ponef C8 134726 At what depth does Somet swim? 400 ft. / 600 ft. F6 1529242 Larger groupings of fish tend to be _____ colored. lighter/darker I12 1708126 Which forms into larger groups? Ponef/Kupod C11 206033 What color is Ponef? Orange/Yellow F3 2512644 Smaller-sized fish tend to form _____ groups. smaller/larger I14 3343828 Which is smaller in size? Taroz/Goken C13 3761612 What is Taroz’s social grouping? Solitary/Small F12 3770643 Smaller-sized fish tend to be _____ colored. lighter/darker I13 381925 At what depth does Kupod swim? 400 ft. / 600 ft. F5 398327 What does Goken eat? Algae/Shrimp F7 4053115 What size is Somet? 60 in. / 90 in. F15 4064313 What size is Kupod? 60 in. / 90 in. F13 4147721 Which swims at a greater depth? Latuk/Ponef C6 439461 What color is Latuk? Black/Blue F1 5034229 Which is smaller in size? Ponef/Latuk C14 5401619 Which swims at a lesser depth? Goken/Somet C4 544114 At what depth does Goken swim? 200 ft. / 400 ft. F4 551049 What does Somet eat? Shrimp/Flounder F9 5801217 Which is darker in color? Latuk/Ponef C2 581302 What color is Taroz? Yellow/Blue F2 681688 What does Kupod eat? Shrimp/Flounder F8 7526545 Larger-sized fish tend to be _____ colored. lighter/darker I15 7558938 Algae-eating fish tend to be _____ colored. lighter/darker I8 7591024 Which feeds more on flounder? Taroz/Somet C9 7715035 Greater-depth fish tend to be _____ colored. lighter/darker I5 7719125 Which forms into smaller groups? Latuk/Somet C10 7813740 Smaller groupings of fish tend to be _____ colored. lighter/darker I10 8117230 Which is larger in size? Somet/Kupod C15 8267416 Which is darker in color? Goken/Kupod C1 8315120 Which swims at a greater depth? Goken/Taroz C5 8463233 Darker-colored fish tend to form _____ groups. smaller/larger I3 8545739 Flounder-eating fish tend to swim at a _____ depth. lesser/greater I9 8707334 Lesser-depth fish tend to form _____ groups. smaller/larger I4 8873822 Which feeds more on shrimp? Kupod/Latuk C7 9024510 What is Latuk’s social grouping? Solitary/Small F10 9681727 Which forms into larger groups? Somet/Goken C12 9684331 Lighter-colored fish tend to swim at a _____ depth. lesser/greater I1 9775536 Lesser-depth fish tend to be _____ in size. smaller/larger I6 9778018 Which is lighter in color? Kupod/Somet C3 9828914 What size is Ponef? 60 in. / 90 in. F14 99589
Correct answers shown in bold typeface.)

101
Appendix D. Research instrument screen capture images
Figure 13. Opening screen
This screen welcomes the participant to the study, provides a preview of the task
(looking for trends in instructional materials), and finally reminds each participant of his
or her rights as a volunteer research participant.
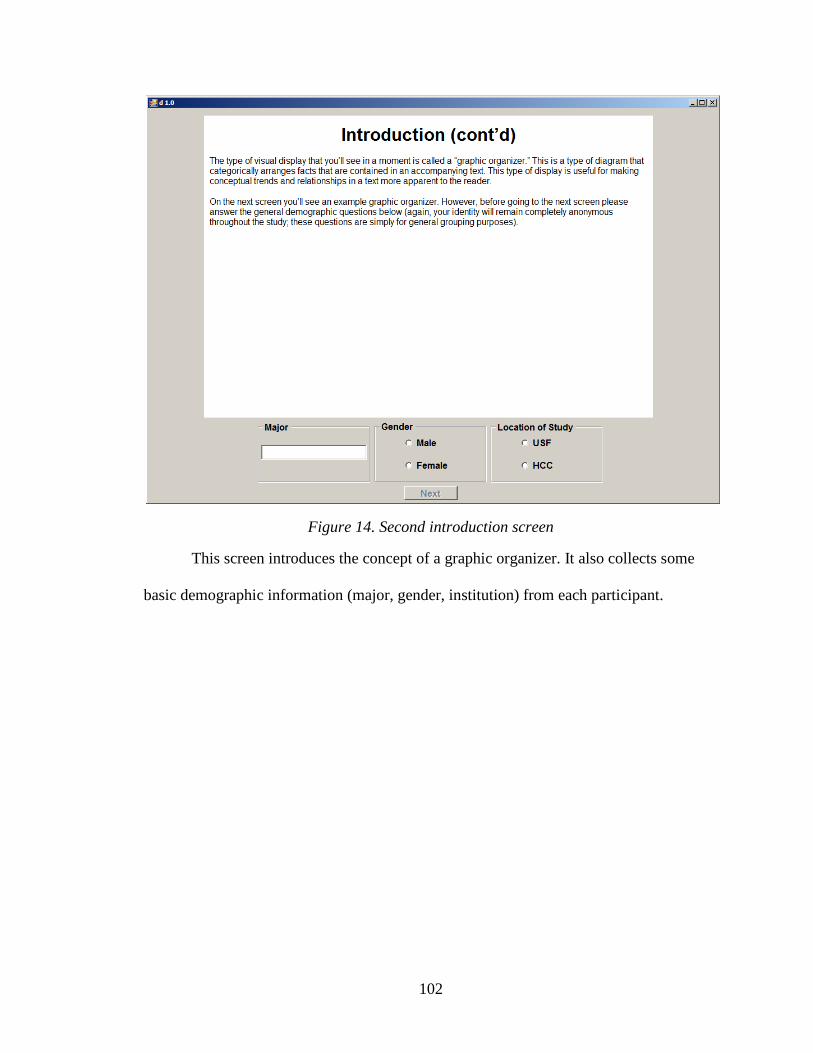
102
Figure 14. Second introduction screen
This screen introduces the concept of a graphic organizer. It also collects some
basic demographic information (major, gender, institution) from each participant.

103
Figure 15. Third introduction screen
This screen provides an overview of graphic organizers and shows how a linkage
often exists between a graphic organizer and the text it accompanies.

104
Figure 16. Example static graphic organizer
This screen lets the participant see an example graphic organizer. It is a treatment-
specific screen, i.e., the type of example graphic organizer displayed matches the type
that will be presented later in the study. In the image above, an example static graphic
organizer is shown.

105
Figure 17. Example questions
This screen introduces the participant to the three types of questions that he or she
will be asked to answer.

106
Figure 18. Static treatment graphic organizer
This is the static graphic organizer presented to participants in that treatment
group. Note the countdown timer that lets participants know how much time remains of
the five-minute study period. Also note the “Show Text” button—this button, when
clicked with the mouse, displays the text passage that accompanies the graphic organizer.
The text passage remains displayed as long as the participant keeps the mouse button
pressed.

107
Figure 19. Accompanying text passage
This is the text passage that accompanies the graphic organizer. The text passage
above is displayed only when a participant clicks (and holds) the “Show Text” button.
The text passage is not treatment-specific, i.e., each group’s participants will see the
screen above when the “Show Text” button is clicked and held. Participants who choose
not to click the “Show Text” button will not see the above text passage.

108
Figure 20. Interpolated memory task screen
Participants perform the above arithmetic task to accomplish the experiment’s
goal of preventing rehearsal of the previously studied graphic organizer information, thus
clearing short-term memory.

109
Figure 21. Separator screen before criterion questions
The above screen serves as a separator between the study portion of the study and
the criterion question portion of the study. It also provides participants with task
expectancy information by telling them what is about to occur. Finally, it asks
participants to answer the upcoming questions both quickly and accurately.

110
Figure 22. Example factual criterion question
This image shows one of the fifteen factual criterion questions. A total of 45
criterion questions (3 factual, 3 comparative, and 3 inferential) were presented to each
participant using one predefined random sequence.

111
Figure 23. Example comparative criterion question
This image shows one of the fifteen comparative criterion questions. A total of 45
criterion questions (3 factual, 3 comparative, and 3 inferential) were presented to each
participant using one predefined random sequence.

112
Figure 24. Example inferential criterion question
This image shows one of the fifteen inferential criterion questions. A total of 45
criterion questions (3 factual, 3 comparative, and 3 inferential) were presented to each
participant using one predefined random sequence.

113
Figure 25. Separator screen before follow-up questions
The above screen serves as a separator between the criterion question portion of
the study and the ancillary question portion of the study. It also provides participants with
task expectancy information by telling them what is about to occur.

114
Figure 26. Trends or relationships question
This screen allowed the participant to self-report his or her perception of whether
any trends or relationships had been noticed during the study.

115
Figure 27. Trends or relationships list
This screen allowed the participant to list any trends or relationships noticed
during the study.

116
Figure 28. Mental tricks question
This screen allowed the participant to list any mental tricks or strategies used
during the study.

117
Figure 29. Usefulness of graphic organizer question
This screen allowed the participant to provide his or her opinion on the usefulness
of the graphic organizer as an instructional tool.

118
Figure 30. Debriefing
This screen provided the participant with overview information related to the
purpose of the study (information that could not be disclosed at the beginning of the
study). It also thanks the participant and provides the researcher’s contact information.

119
Figure 31. Example sortable graphic organizer
This is an example sortable graphic organizer presented to participants in that
treatment group. This graphic organizer contains controls for sorting rows in the graphic
organizer. Each of the small rectangles can contain an arrow symbol (as shown above) to
indicate the most recently sorted column. Participants were given instructions on the use
of these controls as part of the onscreen text. Participants were also encouraged to
practice the use of these controls.

120
Figure 32. Sortable graphic organizer
This is the sortable graphic organizer presented to participants in that treatment
group. Note the countdown timer that lets participants know how much time remains of
the five-minute study period. Also note the “Show Text” button—this button, when
clicked, displays the text passage that accompanies the graphic organizer. The text
passage remains displayed as long as the participant keeps the mouse button pressed. A
“Reset Organizer” button was also provided, such that a participant could restore the
graphic organizer to its original state if desired.
This graphic organizer also contains controls for sorting graphic organizer. Each
of the small rectangles can contain an arrow symbol (as shown above) to indicate the
most recently sorted column. Participants were given instructions on the use of these
controls. Participants were also encouraged to practice the use of these controls.

121
Figure 33. Example shuffle-sortable graphic organizer
This is an example shuffle-sortable graphic organizer presented to participants in
that treatment group. This graphic organizer contains controls for sorting or “shuffling”
rows and columns respectively in the graphic organizer. Participants were given
instructions on the use of these controls as part of the onscreen text. Participants were
also encouraged to practice the use of these controls.

122
Figure 34. Shuffle-sortable graphic organizer
This is the shuffle-sortable graphic organizer presented to participants in that
treatment group. Note the countdown timer that lets participants know how much time
remains of the five-minute study period. Also note “Show Text” button—this button,
when clicked, displays the text passage that accompanies the graphic organizer. The text
passage remains displayed as long as the participant keeps the mouse button pressed. A
“Reset Organizer” button was also provided, such that a participant could restore the
graphic organizer to its original state if desired.
This graphic organizer also contains controls for sorting or “shuffling” graphic
organizer rows and columns, respectively. Participants were given instructions on the use
of these controls. Participants were also encouraged to practice the use of these controls.

123
Appendix E. Pilot study screen capture images
Figure 35. Introductory screen from pilot study
Above is a depiction of the introductory screen from the pilot study. This study
investigated the effects of a sortable graphic organizer on learners’ ability to make
comparative and inferential mental judgments.

124
Figure 36. Introductory screen from pilot study, cont’d
Above is a depiction of the second introductory screen from the pilot study. On
this screen, participants were reminded of their rights as human subjects, and given an
overview of the task about to be completed.

125
Figure 37. Example static graphic organizer from pilot study
This screen provided participants with an exemplar of a static graphic organizer.

126
Figure 38. Sample questions from pilot study
This screen introduced participants to the two types of criterion questions
(comparative and inferential) used by the pilot study.

127
Figure 39. Introductory sortable graphic organizer screen from pilot study
This screen introduced participants to the capabilities of the sortable graphic
organizer.

128
Figure 40. Sortable graphic organizer from pilot study
This screen shows the sortable graphic organizer. By clicking any of the Sort
buttons, participants caused the rows of the graphic organizer to be sorted by the contents
of the column of interest. Clicking an already sorted column would toggle the sort order
(e.g., from ascending to descending).
Also shown on this screen is an example of a criterion question requiring the
participant to perform an inferential judgment to derive his or her response.

129
Figure 41. Static graphic organizer from pilot study
This screen shows the static, or non-sortable graphic organizer. Other than the
absence of sort controls, its design and layout are the same as the sortable graphic
organizer
Also shown on this screen is an example of a criterion question requiring the
participant to perform a comparative judgment to derive his or her response.

130
Figure 42. Metacognitive strategies screen from pilot study
This screen prompted participants to describe any mental tricks or strategies used
during the graphic organizer study session.

131
Figure 43. Debriefing screen from pilot study
This screen thanked participants, provided some general information related to the
study’s goals, and provided the researcher’s contact information.

132
Appendix F. Proposal defense outcomes and results
At the proposal defense held in mid-2009, the members of the doctoral committee
documented several outcomes that were to be addressed by the candidate before data
collection could commence. This appendix details those outcomes and their
corresponding resolutions on the following pages.
I. Issues to be resolved before data collection a. The candidate should re-analyze past studies and existing pilot data or gather new data via
appropriate means to refine his procedures and instrumentation regarding the following issues: i. Potential for gender-based performance differences and means for controlling such
ii. Potential for problematic test items of the inference class – some inferences may be obvious without reference to the treatment data
iii. Ensure that interpolated activity is of sufficient duration iv. Potential for floor effect deriving from change in procedure to avoid ceiling effect by
removing access to GO during outcome measure b. Devise means of asking participants to identify other study strategies used c. Consider use of multiple random question order indices to minimize possible item order effects
II. Issues to be addressed in final document a. Clarify that multiple “in vivo” performance measures were recorded and analyzed – durations,
choices, etc. b. Clarify that multiple latencies/sub-latencies were observed for analysis c. Address reading comprehension theory and research in literature synthesis. (Possibly
characterize it and GO as different dimensions of a larger “digital literacy”
Figure 44. Outcomes from the proposal defense

133
“Potential for gender-based performance differences and means for controlling
such”
Background: At the proposal defense a committee member asked whether a
participant’s gender might affect his or her performance in the study (the committee
member mentioned male participants’ prior experience with texting and gaming as
possible contributors to gender-based performance differences in the planned study). The
committee member also suggested controlling the assignment of participants to groups
such that male participants were more or less equally distributed among the three
treatment groups.
Investigative Actions Taken: (1) Multiple searches of the literature were
performed in an attempt to identify evidence of gender differences relevant to the types of
tasks performed in the proposed study; (2) data from two graphic organizer studies that
used similar instructional materials and criterion questions to the planned study were
examined in an attempt to identify gender differences in participant performance; (3)
several influential graphic organizer experiments from the last 20 years were reviewed in
an attempt to determine if/how gender was managed in those studies; and (4) numerous
texts dealing with experimental design were consulted to gain further insight into random
assignment and its application in experiments.
(1)
Results from Investigative Actions:
Literature: Even a cursory literature search quickly reveals evidence of gender-
based differences among college students in attributes such as self-efficacy and
attitudes about computers, e.g., Busch (1995). Similarly, it is not difficult to find
evidence of gender-based differences related to computer experience (e.g.,

134
Terlecki & Newcombe, 2005) and computer confidence (e.g., Comber, et al.,
1997). Finding clear evidence of gender differences related to computer aptitude
or performance, however, is less straightforward, as explicated by Kay (1993)
who said, “out of 32 occasions of aptitude measurement, males outperformed
females 15 times, females outperformed males 5 times, and males and females
performed equally well on 12 occasions” (p. 81). One can also find evidence of
gender equality (or at least no significant difference) as noted in the following
studies: Kay (2003) indicates, “Our results from the computer confidence, career
understanding, and social-bias questions in our survey do not provide evidence of
strong gender differences as indicated in past research” (p. 57); North (2002)
states, “…the impact of psychological gender (sex and sex-role) was assessed and
found, in general, not to significantly influence attitudes or cognitions towards
computers” (p. 1); and finally Hyde (2005) noted, ”extensive evidence from meta-
analyses of research on gender differences supports the gender similarities
hypothesis. A few notable exceptions are some motor behaviors [e.g., throwing
distance] and some aspects of sexuality, which show large gender differences” (p.
590).
(2) Past studies by the candidate: Participant gender was recorded in two of three
previous studies undertaken by the candidate that used criterion questions and
instructional materials similar to the planned study. These studies collected
comparison-making and inference-making accuracy from participants who had
studied one of three types of graphic organizers. The results, broken down by
gender, are presented in tables 1 and 2 below. Although the samples were not of

135
sufficient size to perform statistical comparisons of means, one can still see from
the reported means that males could not have outperformed females overall, as the
female means were numerically greater than (but not necessarily significantly
different from) male means in nine of the 12 sets of means reported.
(3) Past studies by others
(4)
: Several influential visual learning experiments were
examined to determine whether gender was considered in these studies. Gender
was not mentioned in most studies. In the studies where gender was reported, it
was neither controlled nor analyzed separately. Table 3 depicts representative
quotes from several of the examined studies.
The importance of random assignment: The planned study is an experiment. The
importance of random assignment in an experiment cannot be overstated, as
exemplified by the quotes shown in table 4, e.g., “In a study with a between-
groups design, it is essential that we allocate participants randomly to our
experimental conditions” (authors’ emphasis) (Field & Hole, 2003, p. 71).
Conclusion
: In light of the above investigation and analysis, the candidate has
elected to retain the assignment strategy as documented in the original dissertation
proposal. That is, participants will be assigned to treatment groups in a purely random
fashion, without consideration for gender. However, each participant’s gender will be
recorded during the data collection procedure. This gender information will be available
for gender-based data analysis should a need for same arise later.
136
“Potential for problematic test items of the inference class – some inferences may be
obvious without reference to the treatment data”
Background: An issue was raised at the proposal defense that some inference
questions may be discernible by participants without reference to the treatment data. That
is, might participants be able to glean correct responses to some inference questions
based solely on prior knowledge and/or deductive reasoning?
Analysis: It is true that in fish biology many trends and relationships exist (for
example, schools of fish tend to comprise small fish, while solitary fish tend to be
medium or large in size). However, for many “rules of thumb” exceptions typically
exist—for example, bluefin tuna can weigh over 1000 lbs yet are schooling fish. The
treatment data in the planned study is based on fictitious fish species. The species names
were selected from lists of two-syllable non-words with very low familiarity scores, thus
preventing any participant prior knowledge about the fish species per se. For each of the
trends “hidden” in the experimental data, examples can be found from the real world that
both conform to the trend as well as contradict the trend (for example, one trend in the
experimental data is that deeper swimming fish tend to be larger – in the real world, one
can find both large and small species at both shallow and deep depths). Although
participants may attempt to use prior knowledge, as well as making “educated guesses”
when answering questions the candidate feels this is not a significant risk (participants
should be expected to attempt to use prior knowledge and/or deductive reasoning when
attempting to answer criterion questions, regardless of the study or its subject matter).
Conclusion: The candidate plans to use the inference questions as presented in the
original proposal. Any attempted use of prior knowledge by the participants is mitigated

137
because: (1) the trends in the experimental treatments may or may not be present in
nature, (2) there are fifteen inference questions based on five attributes, thus increasing
fidelity of this experimental measure and finally, (3) the instructions given to the
participants will include explicit directions to avoid using prior knowledge when
answering the questions.

138
“Ensure that interpolated activity is of sufficient duration”
Background: The original dissertation proposal’s plan described “a brief
interpolated arithmetic task to ensure that short-term memory has been cleared” (p. 35).
The committee directed the candidate to ensure that this interpolated memory task was of
sufficient duration to accomplish its desired purpose.
Analysis
One frequently cited distractor task is the Brown-Peterson paradigm (so named
because it was independently introduced by Brown in 1958 then Peterson and Peterson in
1959 (Tulving & Craik, 2000). Using this method, participants performed a task
(typically counting backwards by threes from a certain number) for time intervals ranging
from 3 to 18 seconds. Participants were then asked to recall consonants (learned
immediately before the distractor task) and were able to recall fewer than 10% of them
after a filled retention interval of 18 seconds (Greene, 1992).
: The interpolated arithmetic task is an example of a distractor task.
Distractor tasks are often used in experiments related to memory and learning. The
primary purpose of a distractor task is to prevent rehearsal (Greene, 1992). Inserting a
distractor task between the learning and recall tasks ensures that participants’ short-term
memory is cleared (by preventing rehearsal), thus helping to measure what has been
encoded in long-term memory during the recall portion of the study.
Other researchers use similar distractor tasks to prevent rehearsal. For example,
Schwartz, Ellsworth, Graham, & Knight (1998) wrote, “When the story was over,
learners were given 1 minute to complete the math task” (p. 78). Similarly, Spears &
Kealy (2005, March) presented three two-column simple addition problems to
participants; participants were prompted to confirm the accuracy of each sum presented

139
by pressing "Y" if correct or "N" if incorrect.
Conclusion
: The candidate will ensure that the interpolated memory task has a
duration of at least 18 seconds (to satisfy the common findings of the Brown-Peterson
paradigm). The candidate will further ensure that the interpolated memory task takes
roughly one minute to thoroughly ensure that participant short term memory has been
cleared.

140
“Potential for floor effect deriving from change in procedure to avoid ceiling effect
by removing access to GO during outcome measure”
Background: One observation from the pilot study was a severe ceiling effect
(nearly every participant scored 13, 14, or 15 out of 15 possible points on accuracy for
both comparative and inferential judgments). On post-study analysis, it became quite
clear that this was a result of the simultaneous presentation of the graphic organizer and
criterion questions (typically, the graphic organizer and/or text would be presented to
participants prior to the presentation of the criterion questions).
Analysis: The planned study uses the more traditional “study then answer”
strategy. Results from previous similar studies (see for example, tables 1 and 2) show that
with this scheme participant scores exhibit neither a ceiling nor a floor effect. In the data
in tables 1 and 2, random participant guessing would have yielded, on average, scores
around 0.5. Inspection of that data shows that typical scores were in a range around 0.6 to
0.8, or exactly where the candidate would like them to be (high enough to demonstrate
that participants were performing better than random guessing, yet low enough to still
show variability between participants).
Conclusion
: Past studies using the “study then answer” strategy with similar
instructional materials and criterion questions resulted in responses that tended neither
toward ceiling nor floor effects—the results instead tended toward the desired “sweet
spot” of response ranges. The candidate therefore plans to maintain the procedure
documented in the original dissertation proposal in the planned study.
141
“Devise means of asking participants to identify other study strategies used”
Background: The committee pointed out that making inferences about participant
performance based solely on accuracy and latency of responses might paint an
incomplete picture with respect to the effects of the various treatments. The committee
further recommended that participants be queried about any methods/strategies they
might have used while studying the treatment materials.
Analysis: Precedent exists from similar studies for doing this. For example, in
Spears & Kealy (2005, March), participants were asked to, “Please briefly describe any
mental tricks or strategies used” (p. 6). In Kealy, Bakriwala, & Sheridan (2003),
participants were asked to describe any “mental trick or strategy used to recall details of
the story” (p. 34). The candidate agrees that asking open-ended, self-reporting questions
related to study strategies is an excellent recommendation from the committee.
Conclusion
: Participants will be asked, at minimum, to “Please briefly describe
any mental tricks or strategies that you used while studying the graphic organizer.”
Participant responses will be recorded and analyzed.

142
”Use of multiple random question order indices to minimize possible item order
effects”
Background: At the proposal defense, a committee member inquired about the
possibility that sequence effects might influence the results. In the original proposal, the
45 total criterion questions (3 sets of 15) were to be presented to the participants in
random order. That is, a single random sequence would be generated before data
collection commenced such that every participant received the questions in the same
random sequence. Because the three sets of criterion questions (factual, comparative, and
inferential) were to be combined then randomized, participants would see a mix of
questions (for example, they might see one inferential question, then two factual
questions, then a comparison question, followed by another inference question, and so
on).
Investigative Actions Taken: (1) Literate was examined to learn about question
order effects, and the related topics of item randomization and counterbalancing; (2) past
influential studies were examined to determine if/how other researchers had addressed
issues of sequence effects in criterion questions; (3) the criterion questions for the
planned study were carefully inspected in an attempt to identify any potential order
effects; and (4) a measurement and research professor was consulted for guidance on this
issue.
1.
Results from Investigative Actions:
Literature: Abundant literature exists related to the ordering of responses for a
question (e.g., Schwarz, Hippler, & Noelle-Neumann, 1992). Much of this
literature seems concerned with surveys, especially opinion polls, psychological

143
surveys, and the like. The primacy effect and recency effect are just two of many
possible concerns that researchers should consider when designing a survey of
this type. Literature related to the ordering of questions is less easy to find. Some
heuristics related to the sequence of questions can be derived with just a little
careful thought (for example, open-ended questions should be asked before
closed-ended questions on similar topics [Weisberg, Krosnick, & Bowen, 1996]).
Similarly, surveys related to political candidates, new products, and similar
typically obscure the subject of the survey until toward the end of the survey to
avoid influencing participants’ answers during the earlier stages of the survey.
Literature related to question sequence for less survey-like studies (such as the
planned study) was not readily obtainable by the candidate. By contrast, one can
easily find techniques and guidance related to counterbalancing (e.g., Field &
Hole, 2003; Christensen, 1977). However, counterbalancing is not feasible when
more than a handful of questions are present and thus cannot be used in the
planned study. Therefore, the candidate considers the following advice from
Boroditsky & Griffiths (n.d.) to be both practical and valid: “How do you know
when to randomize and when to counterbalance? If you have lots of subjects or
lots of items, just randomize.”
2. Past studies: Several well-cited, similar studies from the past two decades were
examined in an attempt to determine if or how other researchers had managed the
sequencing of criterion questions. Some researchers presented different question
types in blocks of questions, with open-ended questions being presented prior to
closed-ended questions (for example, in Kiewra, et. al. (1999) the global relations

144
test was presented first followed by the local relations test). This makes sense, as
presenting the questions in the reverse order might taint participants’ responses
for the global relations test by exposing them to details that would later be
recalled. Other than this, however, information was typically absent with respect
to randomization or lack thereof. In fact, question sequence information was
typically just not present—a report might simply say, “Each quiz contained 30
multiple-choice items” (Robinson, et al. 2006, p. 105). Based on the candidate’s
examination of these studies, it seems that the order of individual questions was
not of great concern to these researchers.
3. Inspection of criterion questions for the planned study:
4.
The candidate carefully
examined the 45 criterion questions in the planned study in an attempt to identify
any obvious sequence effects that might be of concern. No obvious “bad”
sequences of questions were identified. With some effort, one might be able to
manually assemble an undesirable sequence of instructions such that participants
with excellent recall and deductive reasoning abilities might be able to better
answer certain questions solely because of question order. However, the
probability of this occurring in a random sequence seems inconsequential to the
candidate.
Consultation: Finally, the candidate consulted a full professor in measurement and
research after performing the above-noted procedures (this individual is not being
identified because the professor’s response was in a private email message). An
excerpt from the message follows, “We use tests (and surveys) all the time, where
each participant encounters the questions in the same order. Why for this set of

145
questions should we worry?” It is the candidate’s belief that no specific sequence
effect risk was identified for the planned study’s questions (in other words, the
concern was more of a “what if” scenario).
Conclusion
: In light of the above investigation and analysis, the candidate has
elected to maintain the question sequencing strategy as documented in the original
dissertation proposal. The absence of evidence showing that any strategy other than
randomization should be used, plus the mitigating factor that even if a sequence effect
existed that all participants would experience it equally, has convinced the candidate that
a single randomized sequence, delivered to all participants, is a sound research strategy.

146
Table 1. Mean response accuracy (SD) from Spears & Kealy (2005, March).
Treatment Gender Comparison Accuracy (SD)
Inference Accuracy (SD)
Colors Female (n=8) 0.75 (0.23) 0.68 (0.36) Male (n=1) 0.60 (0) 0.47 (0)
Labels Female (n=6) 0.78 (0.24) 0.86 (0.23) Male (n=7) 0.60 (0.32) 0.72 (0.26)
Size Female (n=5) 0.76 (0.26) 0.71 (0.33) Male (n=2) 0.77 (0.28) 0.57 (0.39)
Table 2. Mean response accuracy (SD) from Spears & Kealy (2005, October).
Treatment Gender Comparison Accuracy (SD)
Inference Accuracy (SD)
Color Female (n=14) 0.77 (0.15) 0.76 (0.20) Male (n=3) 0.58 (0.32) 0.58 (0.17)
Labels Female (n=14) 0.69 (0.19) 0.72 (0.24) Male (n=1) 0.87 (0) 1.00 (0)
Size Female (n=14) 0.75 (0.14) 0.81 (0.21) Male (n=2) 0.74 (0.09) 0.80 (0.09)

147
Table 3. Representative gender-related quotes from past studies “Students were randomly assigned to one of the four between-subjects conditions” (Bera & Robinson 2004, p. 382). Gender was not mentioned. “Each student was randomly assigned to one of four experimental conditions” (Crooks, White, & Barnard, 2007, p. 375). Gender of participants was noted but neither controlled nor analyzed. “Students were randomly assigned to one of the four conditions“ (Griffin & Robinson, 2005, p. 32). Gender was not mentioned. “Each student was randomly assigned to one of three experimental conditions” (Robinson, Corliss, Bush, Bera, & Tomberlin, 2003, p. 35). Gender of participants was noted (interestingly, with a ratio similar to USF’s College of Education: F=61, M=12) but it was neither controlled nor analyzed.
Table 4. Representative quotes related to the importance of random assignment “Statistical reasoning is dependent on the randomization process, so we emphasize again: Randomize whenever and wherever possible” (authors’ emphasis) (Johnson & Christensen, 2004, p. 280). “In a study with a between-groups design, it is essential that we allocate participants randomly to our experimental conditions” (authors’ emphasis) (Field & Hole, 2003, p. 71). “The word random should not be passed over lightly. The use of randomization is the keystone of the application of statistical theory to the design of experiments, and the validity of our deductions rests upon the principle of randomization” (John, 1971, p. 4). “Randomization is the cornerstone underlying the use of statistical methods in experimental design” (Montgomery, 1997, p. 13).
Table 5. Representative quotes related to question order “Students were then given eight practice items with corrective feedback that were randomly chosen from the 72 total items. All students received the same practice items. Then the 64 test items appeared” (Robinson & Schraw, 1994, p. 406). “Each quiz contained 30 multiple-choice items” (Robinson, et al. 2006, p. 105). There was no apparent mention of sequence of quiz items. “Participants then took the global relations test and the local relations test in that order without reference to their study materials (Kiewra, et. al., 1999, p. 383). No apparent mention of sequence of quiz items. “They were instructed on the first screen of the experiment that they would view 20 text screens and 7 GO screens, and complete two tests. They proceeded from 1 screen to the next by pressing the space bar, and were instructed not to go back to previous screens. Students wrote their answers to the free recall test and indicated their choice on the multiple choice relations test by circling the corresponding letter (a, b, c, d)” (Robinson, et al., 2003, p. 31). There was no apparent mention of item sequence. “Participants then completed the local relationship, global relationship, and fact tests in that order” (Kauffman, 2009-in-press, p. 30). There was no apparent mention of item sequence.

148
Appendix G. Final defense outcomes and results
At the final defense held in mid-2010, the members of the doctoral committee
documented several outcomes that were to be addressed by the candidate in order to
complete this dissertation. This appendix details those outcomes and their corresponding
resolutions.
The candidate’s defense was evaluated successful and his document approved by
all committee members pending revision to address the following
issues/recommendations. Each of these matters should be given consideration for
discussion in Chapter Five as alternate interpretations of outcomes, limitations, or bases
for further research.
Outcome Resolution 1. Discuss 6th grade reading level as a
potential limitation. Even though there was no ceiling effect (in fact, the means were closer to the 50% “floor”), could the low reading level, in comparison to the norm for college-level readers, have failed to catalyze the hypothetical affordances to higher-level cognition offered by dynamic GOs?
COMPLETED (pp. 27-28)
2. Discuss the potential limitations of the “press to hold text onscreen, with default back to GO upon release” functionality of the experimental software.
COMPLETED (pp. 74-75)

149
Outcome Resolution 3. Discuss the potential limitations of the
relatively “weak” practical utility of the “shuffle” feature in comparison to the sort feature.
NOT DONE -- Although it’s certainly possible that the shuffle feature is weak when compared to the sort feature, I can’t find evidence to support this. The shuffle feature should permit a learner to decrease the semantic distance between elements, thus making trends in the displayed information more apparent, while also improving a learner’s ability to make inferential judgments (Winn & Holliday, 1982). Similarly, juxtaposition of elements (made possible by shuffling) is one of the ways that spatial displays effectively communicate concepts and their relationships (MacDonald-Ross, 1979).
4. Incorporate the results of your post-hoc correlation of text-reading-time to performance. Consider the implications of the weakness of this correlation for your methods and outcomes.
COMPLETED (p. 56; p. 81)
5. Interpret the outcomes of the experiment more optimistically, with better overall balance. Although the “objective” observed outcomes were not significant, the significance of participant-reported preferences is important. Although it may have been the case that participants deluded themselves, it is also quite likely that the “objective” materials, measures and procedures weren’t potent/sensitive enough to reveal an effect.
COMPLETED (Abstract; pp. 77)

150
Outcome Resolution 6. Interpret the outcomes of the experiment
from the perspective of “metamemory” theory.
COMPLETED (p. 77) But framed as metacomprehension, rather than metamemory) -- Metamemory refers to knowledge about memory, which doesn’t seem appropriate to describe the participants’ higher “effective instructional tool” ratings for the dynamic graphic organizers. Metacomprehension, in contrast, refers to “a person’s ability to judge his or her own learning and/or comprehension of text materials.”
7. Report the observation that no participants wrote down any notes and consider the implications of that.
COMPLETED (p. 38)
8. Report the statistics on the degree to which participants who were afforded the opportunity to sort or shuffle actually did so (some didn’t at all) and consider the implications of that.
COMPLETED (Abstract; p. 56; p.72)
9. Discuss the degree to which learner performances were “mindful and effortful.”
COMPLETED (pp. 57-58; p. 74)
10. Reconsider/reduce the use of acronyms throughout the document in favor of using the complete terms more frequently.
COMPLETED (throughout manuscript, but mostly in the tables)
11. Discuss possible limitations owing to initial method of random assignment and later restrictions. Consider post-hoc analysis of only the non-restricted data set as a means of assessing the potential threat to validity.
COMPLETED (p. 48)
12. Consider changing tables to report percentage scores as opposed to raw scores.
COMPLETED (pp. 46-47)

151
Outcome Resolution 13. Consider adding post-hoc analyses by
“unit of effort” to develop the possible assertion that use of GOs alone can serve as an equivalent replacement, possibly a faster one, for the reading of text. E.g. “reading text is the current ‘gold’ standard, but GOs are just as good and may be faster.”
PARTIALLY DONE—The only reasonable “unit of effort” I can think of that could be extracted from the current study is time. The post-hoc analysis in item 4 above did show that learners who spent more time on the graphic organizer (at the expense of time spent on the text) performed slightly better in recall accuracy. The recommendation about “GOs are just as good and may be faster than text” has been done in past studies (and it was not even a peripheral goal of this one). Robinson (1998) showed that, “the facilitative advantage of graphic organizers in locating information is attributable to computationally efficient indexing rather than fewer words.” This premise was part of my theoretical framework and I believe was covered in my lit review. With respect to “GOs alone can serve as a replacement for text”: the GO heuristics I’ve seen recommend against making GOs so detailed that they replace text—they are considered adjunct (or pre- or post-) displays to accompany text.
14. Add the chance line to the charts to show the floor.
COMPLETED (p. 47)

152
Appendix H. IRB exempt certifications
This study met two conditions that made it eligible for exemption from
Institutional Review Board oversight: (1) participants in this study remained anonymous,
and (2) the materials, methods, and procedures used in the study were materially similar
to everyday classroom materials, methods, and procedures. Exempt status was requested
by the researcher and granted by the Institutional Review Board before data collection
commenced. Soon thereafter, a modification to the study’s protocol was requested and
received. This modification gave the researcher more flexibility in participant recruitment
procedures; it also added a second research site. The relevant Institutional Review Board
documents are reproduced on the following pages.

153

154

155

156

About the Author
Cameron Spears earned a BS in Computer Science from the University of South
Alabama followed by an MS in Computer Science from California State University,
Fullerton. He spent several years in the technology industry as a member of the technical
staff, group head, and senior manager in charge of various commercial and defense-
related computing products, including multiprocessor servers, advanced disk storage
devices, shipboard display systems, and server fault-tolerance solutions.
While working in product development at a well-known computer manufacturer
in Southern California, he took a part-time position as an adjunct faculty member at a
local university—this was when he discovered a passion for teaching. This breakthrough,
coupled with a life-long desire to conduct formal research, motivated Cameron to pursue
his Ph.D. in instructional technology at the University of South Florida. During this phase
of his career, Cameron taught from three to eight distance and face-to-face courses every
term, at up to three institutions of higher learning per term. After graduation, Cameron
looks forward to continuing his teaching, research, and writing as a full-time university
professor.