Embed Size (px)
Citation preview
The Duval County Pilot Early Learning Quality Rating System: Cost Assessment
Prepared byAnn CollinsFrederic GlantzJeremy Luallen
August 30, 2006Abt Associates Inc.
1
Cost Assessment of the Duval Pilot Quality Rating System
The project was developed to answer the following questions:What is the average cost for early learning centers at each of the 5 star levels?
What would it cost for early learning centers to move up star levels?
2
Methodology
Sample:
•47 of Duval’s 300 licensed early learning centers were randomly selected
•The sample is representative of the centers on Duval County
Data Collection:
•Surveys to directors asking for information on enrollment, staffing, and benefits

3
Methodology, continued
Analysis
•Rated programs by star level in domains with cost implications, based on survey results (NOT on observed quality).
•Combined survey results with detailed cost assumptions related to star domains with cost implications. Estimated costs for each star level.

4
Program Size
0 to 3031%
31 to 6025%
61 to 9019%
> 9025%
Average: 57 full-time children (national average is 75)

5
Infant Enrollment
022%
6 to 1022%
> 109%
1 to 547%
69% of the centers served five or fewer infants. 22% of those did not serve any infants.

6
Domain 1: Ratio and Group Size
1 STAR16%
3 STARS22%
4 OR 5 STARS
46%
2 STARS16%
Nearly half of the programs potentially had ratios and group sizes to rate 4 or 5 stars.
7
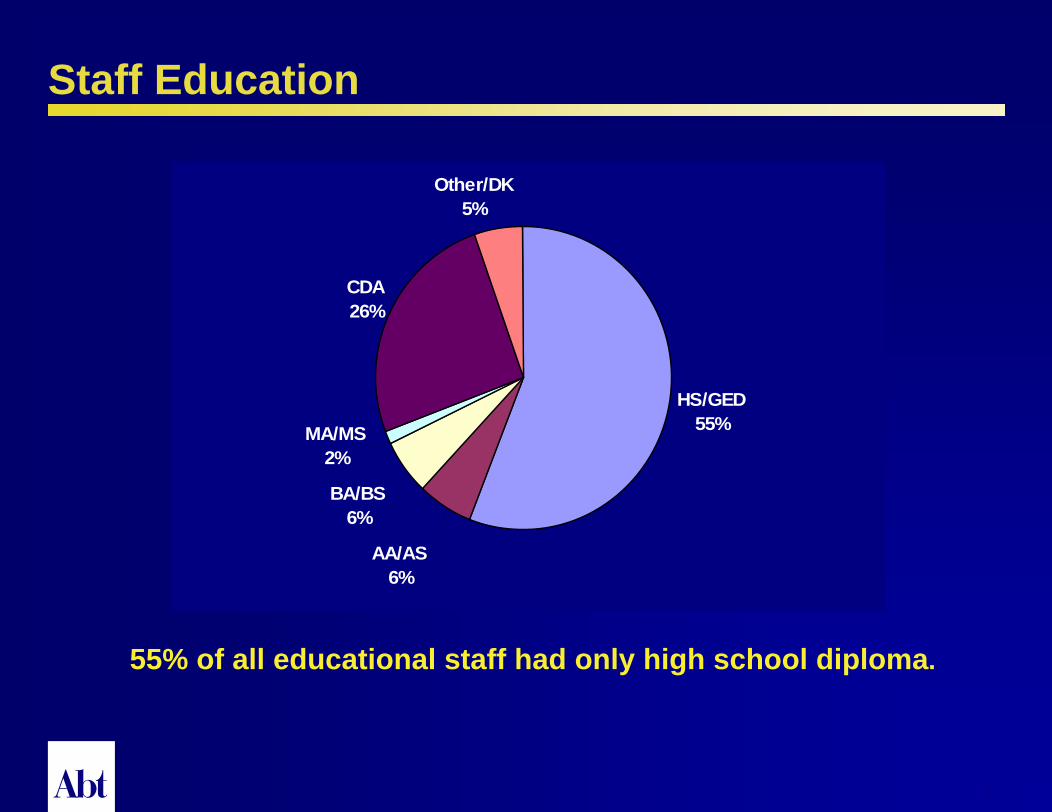
Staff Education
HS/GED55%
AA/AS6%
BA/BS6%
MA/MS2%
CDA26%
Other/DK5%
55% of all educational staff had only high school diploma.
8
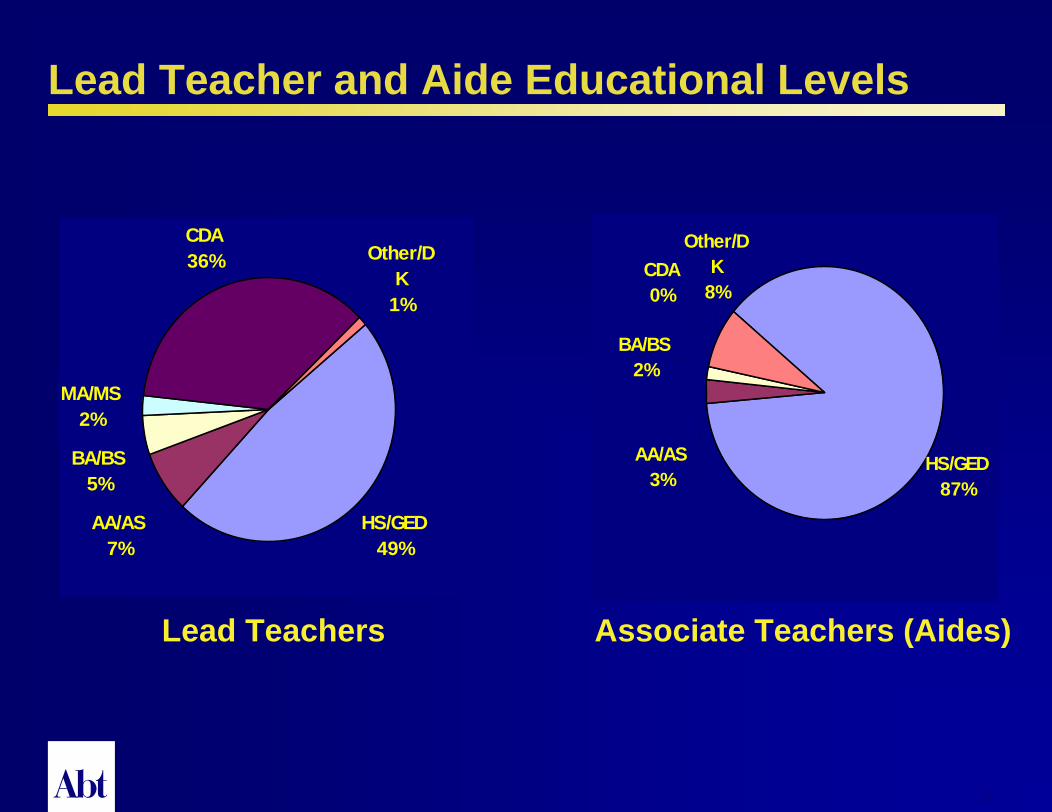
Lead Teacher and Aide Educational Levels
HS/GED49%
AA/AS7%
BA/BS5%
MA/MS2%
CDA36% Other/D
K1%
HS/GED87%
Other/DK
8%
BA/BS2%
CDA0%
AA/AS3%
Associate Teachers (Aides)Lead Teachers

9
Estimated Star Rating in Domain 3: Teacher Qualifications
1 Star70%
3 Stars3%
2 Stars10%
4 Stars0%
5 Stars17%
10
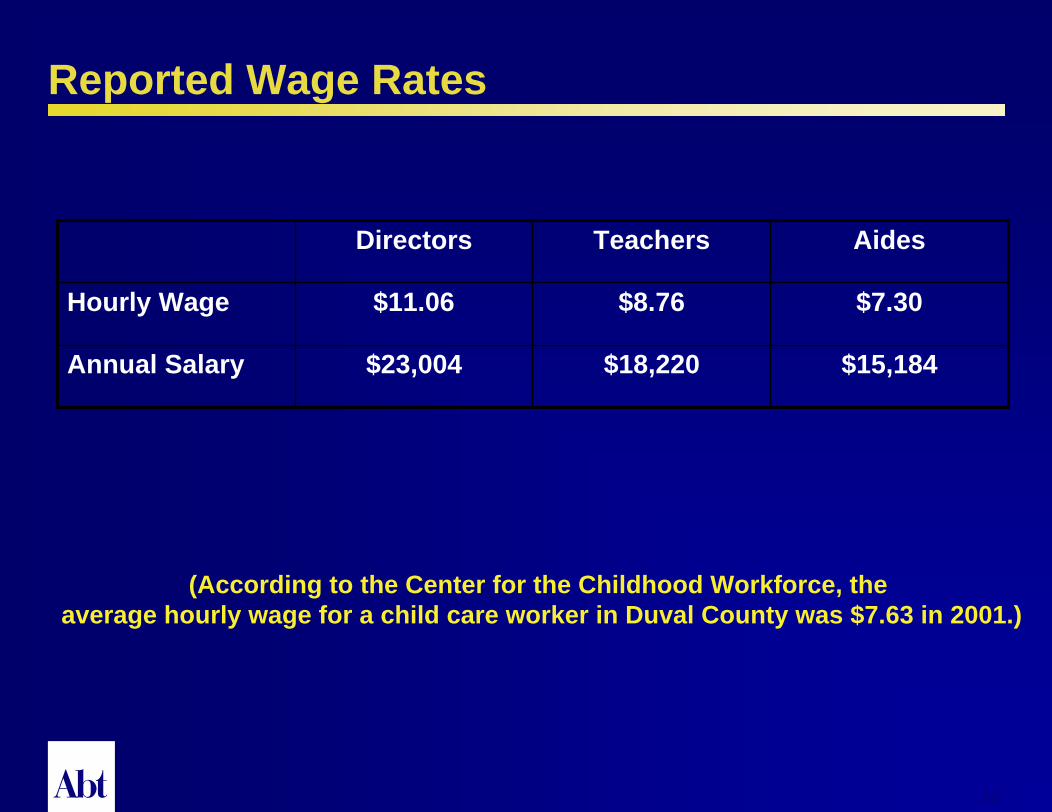
Reported Wage Rates
Directors Teachers Aides
Hourly Wage $11.06 $8.76 $7.30
Annual Salary $23,004 $18,220 $15,184
(According to the Center for the Childhood Workforce, theaverage hourly wage for a child care worker in Duval County was $7.63 in 2001.)

11
Benefits Offered
Percent of Centers Reporting They Offer The Following Benefits:Health Insurance 45%Other Insurance 32%Paid Leave 84%Membership Fees 45%Reduced Rate Early Care & Educ. 97%Bonuses 68%Retirement/Investments 10%Tuition Reimbursement 42%Paid Training 71%Flextime 52%Additional Benefits 19%

12
Star Rating For Domain 4: Staff Compensation - Benefits
1 Star19%
2 Stars3%
3 Stars16%
4 Stars13%
5 Stars49%
13
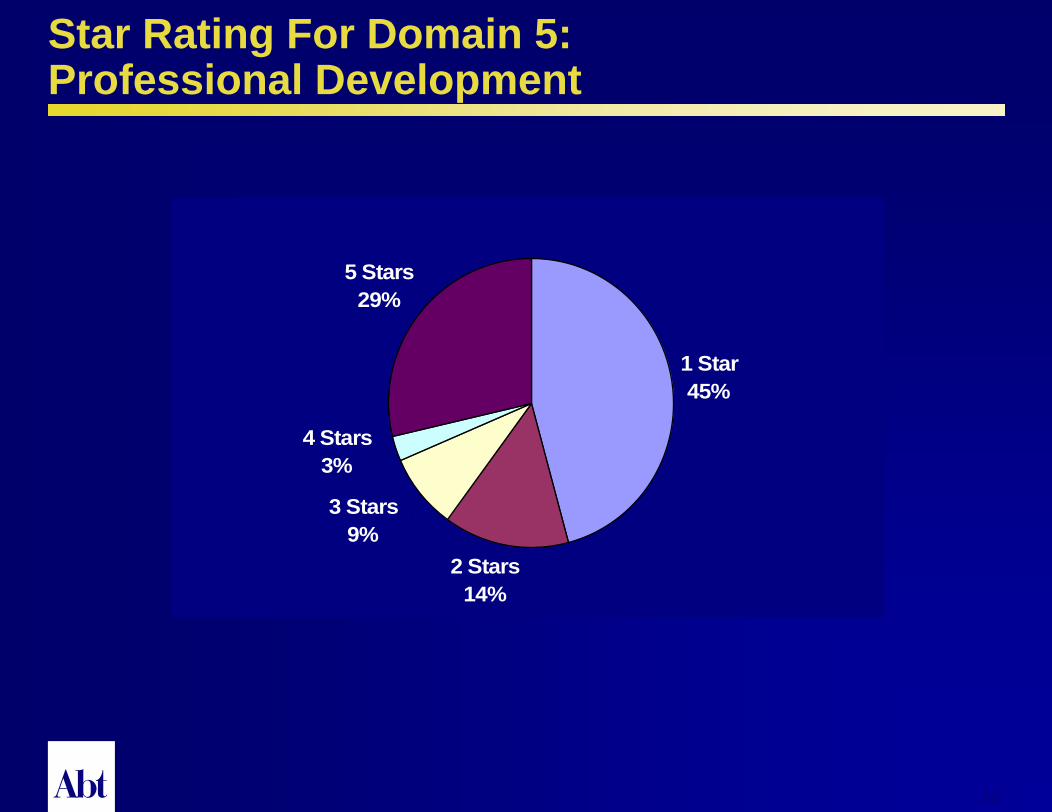
Star Rating For Domain 5: Professional Development
1 Star45%
2 Stars14%
3 Stars9%
4 Stars3%
5 Stars29%

14
Estimating Costs
What We Did:
•We did not have pure 3- 4- or 5-star programs in our sample so we had to estimate costs for them.
•We made assumptions about costs for each domain. (We assumed minimum costs associated with each domain.)
•We rated programs by star level for child:staff ratios and group size (Domain 1). We then used our cost assumptions for the other domains to make them “pure” 1 to 5 star programs.

15
Cost Assumptions
Domain
Large Direct Implication
Small Direct Implication
No Direct Implication
Cost Could Change With Definitions
1. Ratio and Group Size x2. Environmental Structure x3A. Staff Qualifications –
Directorx
3B. Staff Qualifications- Lead Teacher
x
3C. Staff Qualifications: Associate Teacher
x
4. Staff Compensation –Benefits
x x
5. Professional Development x6. Screening and Assessment x x7. Curriculum x8. Parent/Family Involvement x

16
Average Annual Per-Child Year Costs for Centers at Each Star Level
$3,080
$4,644$5,159
$8,373$8,995
$0$1,000$2,000$3,000$4,000$5,000$6,000$7,000$8,000$9,000
$10,000
Level 1 Level 2 Level 3 Level 4 Level 5
Quality Level

17
Average Costs Per Child Hour Costs for Centers at Each Star Level
$1.64$1.91 $1.98
$3.54 $3.58
$0.00
$0.50
$1.00
$1.50
$2.00
$2.50
$3.00
$3.50
$4.00
Level 1 Level 2 Level 3 Level 4 Level 5
Quality Level
18
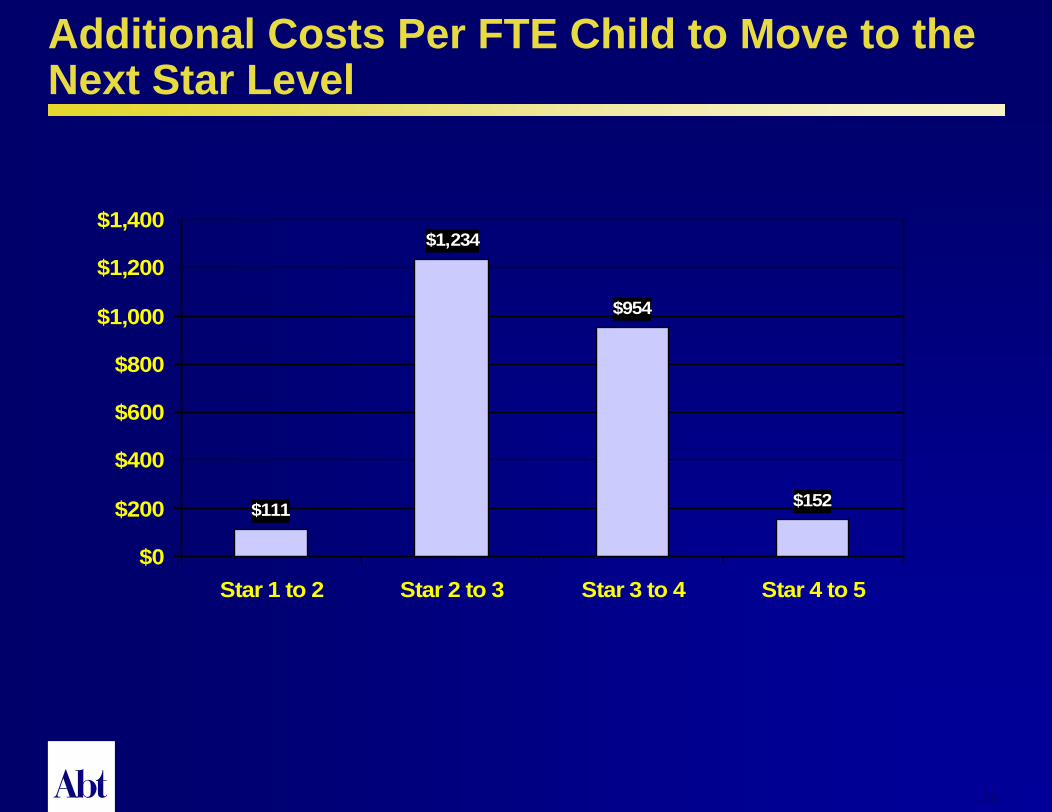
Additional Costs Per FTE Child to Move to the Next Star Level
$111
$1,234
$954
$152
$0
$200
$400
$600
$800
$1,000
$1,200
$1,400
Star 1 to 2 Star 2 to 3 Star 3 to 4 Star 4 to 5

19
Addition Costs Per Child Hour for Centers to Move to the Next Star Level
$0.05
$0.55
$0.42
$0.07
$0.00$0.10$0.20$0.30$0.40$0.50$0.60$0.70$0.80$0.90$1.00
Star 1 to 2 Star 2 to 3 Star 3 to 4 Star 4 to 5
20
ConclusionsStar Ratings:
•A high percentage of centers meet 4 and 5 star criteria in Domain 1 (Child Staff Ratios and Group Size). This may be due, in part, to programs being under-enrolled.
•Most programs will have to significantly increase educational levels of staff to meet 3, 4, and 5 star criteria in Domain 3.
•Many programs potentially had achieved relatively high star ratings in staff compensation (Domain 4).

21
Conclusions, Cont’d
Costs:
•The primary source of the costs for the quality rating system relate to Domain 1 (Child Staff Ratios and Group Size). The next important source of costs is Domain 3 (Staff Qualifications).
•The cost implications of the pilot quality rating system were bigger for smaller programs because they are not able to group children as efficiently.