Embed Size (px)
Citation preview

Instructions for use
Title The dusp1 immediate early gene is regulated by natural stimuli predominantly in sensory input neurons
Author(s) Horita, Haruhito; Wada, Kazuhiro; Rivas, Miriam V.; Hara, Erina; Jarvis, Erich D.
Citation The Journal of Comparative Neurology, 518(14): 2873-2901
Issue Date 2010-07-15
Doc URL http://hdl.handle.net/2115/43772
RightsThis is the pre-peer-reviewed version of the following article: J. Comp. Neurol.518:2873‒2901, 2010., which has been published in final form athttp://onlinelibrary.wiley.com/doi/10.1002/cne.22370/abstract
Type article (author version)
File Information 518_14.pdf
Hokkaido University Collection of Scholarly and Academic Papers : HUSCAP

For Peer Review
Horita et al
1
The dusp1 Immediate Early Gene is Regulated by Natural Stimuli Predominantly
in Sensory Input Neurons
Haruhito Horita1,2
, Kazuhiro Wada3*
, Miriam Rivas1, Erina Hara
1,4, Erich D. Jarvis
1*
1. Department of Neurobiology, Howard Hughes Medical Institute, Duke University Medical Center,
Durham, NC 27710
2. School of Fundamental Science and Technology, Keio University, Yokohama, 223-8522, Japan
3. Division of Integrated Life Science, Hokkaido University, Sapporo, Hokkaido, 060-0810, Japan
4. Graduate School of Advanced Integration Science, Chiba University, Chiba 263-8522, Japan
* co-corresponding authors: [email protected]; [email protected]
Indexing terms: mkp1, mkp-1, hvh1, ptpn10, cl100, vision, somatosensory, auditory, motor pathways,
brain organization, neural activity, motor behavior, brain evolution, parrot, hummingbird, songbird,
ring dove, bird, primary sensory, ZENK
Running title: dusp1 a sensory-modulated gene
HH performed most of the experiments and the analyses, and wrote the paper, KW cloned the dusp1
gene, performed pilot in situ hybridizations, helped supervised the project and wrote the paper, MR
performed egr1 in situ hybridizations on non-songbird species. EH performed the vision behavior
experiments, EDJ performed behavior experiments of non-songbird species, helped supervise the
project and wrote the paper.
Page 1 of 56
John Wiley & Sons
Journal of Comparative Neurology
For Peer Review
Horita et al
2
ABSTRACT
Many immediate early genes (IEG) have activity-dependent induction in a subset of brain subdivisions
or neuron types. However, none have been reported yet with regulation specific to thalamic-recipient
sensory input neurons of the telencephalon or in the thalamic sensory input neurons themselves. Here,
we report the first such gene, dual specificity phosphatase 1 (dusp1). Dusp1 is an inactivator of
mitogen-activated protein kinase (MAPK), and MAPK in turn activates expression of egr1, one of the
most commonly studied IEGs, as determined in cultured cells. We found that in the brain of naturally
behaving songbirds and other avian species, hearing song, seeing visual stimuli, or performing motor
behavior caused high dusp1 up-regulation respectively in auditory, visual, and somatosensory input cell
populations of the thalamus and thalamic-recipient sensory input neurons of the telencephalic pallium,
whereas high egr1 up-regulation occurred only in subsequently connected secondary and tertiary
sensory neuronal populations of these same pathways. Motor behavior did not induce high levels of
dusp1 expression in the motor-associated areas adjacent to song nuclei, where egr1 is up-regulated in
response to movement. Our analysis of dusp1 expression in mouse brain suggests similar regulation in
the sensory input neurons of the thalamus and thalamic-recipient layer IV and IV neurons of the cortex.
These findings suggest that dusp1 has specialized regulation to sensory input neurons of the thalamus
and telencephalon; they further suggest that this regulation may serve to attenuate stimulus-induced
expression of egr1 and other IEGs, leading to unique molecular properties of forebrain sensory input
neurons.
Page 2 of 56
John Wiley & Sons
Journal of Comparative Neurology

For Peer Review
Horita et al
3
INTRODUCTION
In the brain, IEGs are genes whose mRNA expression is dependent on neural activity in the
absence of new protein synthesis (Greenberg et al., 1986; Flavell and Greenberg, 2008). As such, these
genes are used as markers of neural activity to determine relationships between gene regulation and
neural firing, and to map functional domains of the brain (Tischmeyer and Grimm, 1999; Guzowski et
al., 2005; Mello and Jarvis, 2008). We have termed this use of IEGs as ‘behavioral molecular brain
mapping’ (Jarvis, 2004a; Mello and Jarvis, 2008). This approach has been successively used to identify
and characterize neural systems involved in perceiving and producing behaviors. For example, in
songbirds, hearing- and singing-driven IEG expression helped to discover and/or characterize most
nuclei of the vocal learning and auditory pathways, respectively (Fig. 1A,B; Mello et al., 1992; Jarvis
and Nottebohm, 1997; Clayton, 2004; Velho et al., 2005; Wada et al., 2006; Pinaud et al., 2008).
Likewise, behavioral molecular mapping has recently been used to map visual, somatosensory, and
motor pathways in birds (Fig. 1C,D; non-vocal motor pathways not shown; Feenders et al., 2008; Hara
et al., 2009). However, of the genes studied thus far, none have been shown to be regulated in the
sensory input neurons of the sensory pathways of the avian telencephalon. We use the terminology of
sensory input, secondary sensory, and tertiary sensory neurons to describe the order of connections
within a brain subdivision (i.e. within the midbrain, thalamus, or telencephalon), which is different
from the terminology of 1st-order (primary), 2
nd-order, 3
rd-order neurons that is commonly used to
described ascending order of connections starting with sensory neuron receptors in the periphery.
Sensory input neurons of the telencephalon are those that receive the direct synaptic input from sensory
neurons of the thalamus, and in turn sequentially project to higher (secondary, tertiary, etc) sensory
neurons within the same pathway (Fig. 1B-D). For example, for the two of the most commonly studied
IEGs, the egr1 (a.k.a. zif268, NGF-1A, Krox-24, and ZENK) and c-fos transcription factors, there is
little to no sensory-driven induction in avian telencephalic sensory input neurons of auditory (L2),
visual (E), or somatosensory (B) pathways, but there is high induction in secondary (surrounding
nidopallium) and tertiary (mesopallium) sensory neurons of these pathways when processing stimuli
for each specific sensory modality (Fig. 1B-D; Mello and Clayton, 1994; 1995; Jarvis and Nottebohm,
1997; Velho et al., 2005; Feenders et al., 2008; Hara et al., 2009). A similar lack or paucity of induction
of egr1 has been seen in avian and mammalian thalamic sensory input neurons (Mello and Clayton,
1994; 1995; Jarvis and Mello, 2000; Bisler et al., 2002; Soares et al., 2005). This lack of IEG induction
occurs despite the fact that the sensory input neurons have increased neural firing when processing
Page 3 of 56
John Wiley & Sons
Journal of Comparative Neurology

For Peer Review
Horita et al
4
sensory stimuli (Bigalke-Kunz et al., 1987; Zeigler and Bischof, 1993; Chew et al., 1995; Wild and
Williams, 2000). The lack of useful activity-dependent markers for sensory input cell populations
hampers the identification and study of neural systems involved in processing sensory stimuli.
In a search for genes with sensory- and motor-driven regulation in the brain during natural
stimuli and behavior (Wada et al., 2006), we discovered here that the dusp1 gene shows preferential
stimulus-driven regulation in sensory input neurons of the avian thalamus and telencephalon. The
sensory induced dusp1 expression patterns were complementary to the induced egr1 expression
patterns in secondary and tertiary sensory neurons of auditory, visual, and somatosensory populations.
Dusp1, also known as MAPK phosphatase 1 [mkp1], is a negative regulator for MAPK, and MAPK in
turn has been shown to up-regulate egr1 in cultured cells (Knapska and Kaczmarek, 2004; Machado et
al., 2008). Dusp1 has been mainly studied in cultured cells for its role in immunity or cancer (Liu et al.,
2007; Boutros et al., 2008). It also has been studied in-vivo in mammalian brains, but with strong
pharmacological manipulations, where the patterns of regulation were not linked to behavior (Qian et
al., 1994; Takaki et al., 2001; Kodama et al., 2005) or the anatomical and cellular specificity was not
well determined (Hu et al., 2009, but see Doi et al., 2007; Pizzio and Golombek, 2008). Our own
analyses of the data of these studies in mammalian brain as well as GENSAT dusp1 promoter-eGFP
mice indicate that dusp1 is also induced at its highest levels in the thalamic recipient sensory input
layers IV and VI of the mammalian cortex (also see Takaki et al., 2001) and in sensory input neurons
of the thalamus; layer IV consist of sensory input neurons that receive the direct input from sensory
nuclei in the thalamus and layer VI forms direct reciprocal cortical feedback pathways with the
thalamus (Karten, 1991; Shipp, 2007). These findings suggest dusp1 is largely a sensory-driven IEG in
the primary sensory areas of the brain, which we suggest could be linked to attenuation of stimulus-
induced expression of egr1 and other IEGs in these neurons.
Anatomical Abbreviations
A, arcopallium
AH, anterior hyperpallium
aIH, anterior part of the intercalated layer of the
hyperpallium
AMD, anterior dorsal mesopallium
AMV, anterior ventral mesopallium
AN, anterior nidopallium
Area X, a vocal nucleus
ASt, anterior striatum
Av, nucleus avalanche
B, basorostralis
Cb, cerebellum
CM, caudal mesopallium
CN, cochlea nucleus
cpd, cerebral peduncle
cSt, caudal striatum
Cu, cuneate nucleus
DIVA, dorsal intermediate ventral anterior
nucleus of the thalamus
Page 4 of 56
John Wiley & Sons
Journal of Comparative Neurology

For Peer Review
Horita et al
5
DLG, Dorsal Lateral geniculate nucleus
DLN, dorsal lateral nidopallium
DLM, dorsal lateral medial nucleus of the
thalamus
DM, dorsal medial nucleus of the midbrain
DT, dorsal thamalus
E, entopallium
GLd, dorsolateral geniculate nucleus
Gr, gracile nucleus
H, hyperpallium
Hp, hippocampus
HVC, a vocal nucleus (no acronym)
IGL, intergeniculate leaflet of the thalamus
IH, intercalated layer of the hyperpallium
IPc, Nucleus isthmi pars parvocellularis
LAI, lateral intermediate arcopallium
LAM, lateral nucleus of the anterior
mesopallium
LLD, lateral lemniscus, dorsal part
LLI, lateral lemniscus, intermediate part
LLV, lateral lemniscus, ventral part
M, mesopallium
MAN, magnocellular nucleus of the anterior
nidopallium
MG, medial geniculate body
MGD, medial geniculate body, dorsal nucleus
MLd, dorsal part of the lateral mesencephalic
nucleus
MMSt, magnocellular nucleus of the medial
striatum
MO, oval nucleus of the mesopallium
MD, dorsal mesopallium
MV, ventral mesopallium
MVb, ventral mesopallium near B
MVe, ventral mesopallium near to E
MV-L2, ventral mesopallium near L2 (same as
CM)
N, nidopallium
Nb, nidopallium adjacent to B
Ne, nidopallium adjacent to E
N-L2, nidopallium adjacent to L2
NAO, oval nucleus of the anterior nidopallium
NIf, interfacial nucleus of the nidopallium
nXIIts, 12th
nucleus, tracheosyringeal part
Ov, nucleus ovoidalis
P, pallidum
PH, posterior hyperpallium
PLMV, posterior lateral ventral mesopallium
PLN, posterior lateral nidopallium
PP, peripeduncular nucleus
PrV, principal sensory trigeminal nucleus
RA, robust nucleus of the arcopallium
Rt, nucleus rotundus
SO, superior olivary nucleus
SP, subpretectal nucleus
SpM, medial spiriform nucleus
St, striatum
Ste, striatum adjacent to E
SubG, subgeniculate nucleus
TeO, optic tectum
Uva, Nucleus Uvaeformis
v, ventricle
VP, ventral palidum
VPL, ventral posterior lateral nucleus of the
thalamus
VPM, ventral posterior medial nucleus of the
thalamus
MATERIALS AND METHODS
Animals
We used 33 male zebra finches, 12 budgerigars, and 6 ring doves from our breeding colonies at
the Duke University Medical Center. Some of these animals were from prior studies, where we used
brain sections for the visual experiments in zebra finches (Hara et al., 2009) and movement
experiments in zebra finches, budgerigars, and ring doves (Feenders et al., 2008). All animals were
Page 5 of 56
John Wiley & Sons
Journal of Comparative Neurology

For Peer Review
Horita et al
6
adults. Animal procedures were approved by the Institutional Animal Care and Use Committee of
Duke University.
Auditory stimuli experiments
For zebra finches, males were placed individually in sound attenuation boxes overnight. On the
following morning, while the lights remained off, two groups of birds were taken: a silent control group
that remained in the dark but awake (n = 3 males) and a hearing song group that was presented with
digitally recorded zebra finch songs through a speaker for 30 min (n = 3). The playbacks consisted of
three different songs, totaling 12 seconds in length, presented once every minute, similar to a described
protocol (Mello et al., 1992). The songs were from another colony of birds and thus were novel to the
hearing group; novel song is known to cause high levels of hearing-induced IEG expression in the
auditory pathway (Mello and Clayton, 1994; 1995). The lights were kept off to prevent IEG induction
in visual brain areas, in movement-associated brain areas due to the bird’s motivation to hop and make
other movements, and in the auditory areas by hearing self-singing when the lights are on (Jarvis et al.,
1998; Feenders et al., 2008; Hara et al., 2009). For budgerigars, after a 2-3 hour quiet period in a room
alone, males were presented with a playback of the recorded warbles for 30 min (three repetitions of a
10 minute segment of spontaneous warbles), as previously described (Jarvis and Mello, 2000). Animals
that did not sing were sacrificed immediately at the end of playback period and taken as the hearing
song groups.
Visual stimuli experiments
To identify brain areas activated by vision, we used brain sections from a previous study (Hara
et al., 2009) of male zebra finches that were unilaterally stimulated with visual stimuli. Briefly, one eye
of each bird was covered with several layers of black vinyl electrical tape; the innermost layer was
placed so that the smooth surface covered the eye to prevent irritation. The tape was sealed at the edges
with super glue to the surrounding skin and feathers to prevent light leakage. We alternated the
covering of the right and left eyes in different birds to prevent potential biases in the results. Birds were
then individually housed overnight in the dark in sound isolation boxes. They were divided into three
groups: silent alone and kept in the dark for 45 min in the morning during waking hours (n = 3 total;
right eye covered n = 1, left eye covered n = 2); silent alone with the light turned on for 45 min (n = 4;
right eye covered n = 2, left eye covered n = 2); and seeing a natural stimulus, a female with the light
Page 6 of 56
John Wiley & Sons
Journal of Comparative Neurology

For Peer Review
Horita et al
7
turned on while singing to her for ~45 min (n = 5; right eye covered n = 3 and left eye covered n = 2).
The rational for the female stimulus group of the previous study was to determine if there was visually-
associated IEG regulation in the vocal pathway during singing to females, which was found not to be
the case (Hara et al., 2009). A female was placed in the cage with the male, but separated by a cage
wall barrier, on the night before the recording session. The cage wall barrier was made from the same
metal bar material as the rest of the cage. Thus, the male and female could interact visually and
acoustically, but not physically. Another group of male zebra finches without one eye covered were
presented with females and those that did not sing were taken as a ‘seeing female only’ group (n = 5).
Behavior was videotaped and audio recorded using Avisoft Recorder (Avisoft Bioacoustics, Berlin,
Germany), to verify that singing or no singing occurred and that the males looked at the females (Hara
et al., 2009).
Hopping experiments
To identify activated brain areas involved in non-vocal movements, we used brain sections from
a previous study (Feenders et al., 2008) of birds that were induced to repeatedly hop. Briefly, hearing
intact or deafened birds were placed in a cylindrical, transparent plexiglass, rotating wheel (zebra
finches and budgerigars) or on a treadmill (ring doves). The wheel was inside a sound isolation
chamber and rotated by an attached metal rod that was controlled by a relatively quiet motor, outside of
the box, with variable speed control (Feenders et al., 2008). Birds were deafened to prevent hearing
induced expression due to hearing feet hops (or feet steps for the doves) and the mechanical sounds of
the rotating wheel (or moving treadmill). Behavior was observed and recorded via an infrared camera,
connected to an external video recorder. Before an experiment was started, the wheel was rotated (~20
rpm) or the treadmill run first with lights on for 5 min and then in the dark for an additional 10 min to
get the bird accustomed to the wheel (or treadmill) and to reduce stress in the new environment. The
wheel (or treadmill) was then turned off and the bird allowed to sit for 2-3h in darkness; most birds did
not go to sleep as determined by eyes open and head not resting on the back. The lights were kept off to
prevent light- and optic flow-induced gene expression in visual pathways. Thereafter, for zebra finches
and budgerigars, three control and experimental groups were taken: 1) hearing intact males that sat still
in the dark for an additional 30 min (n = 3 each species); 2) hearing intact males that hopped in the
rotating wheel in the dark for 30 min (n = 3 each species); and 3) deafened males that hopped in the
rotating wheel in the dark for 30 min (n = 3 each species). For ring doves, two groups were taken: 1)
Page 7 of 56
John Wiley & Sons
Journal of Comparative Neurology

For Peer Review
Horita et al
8
hearing intact males that sat still in the dark for 30 min (n = 3); and 2) walking while deaf in the dark
for 30 min (n = 3). In addition, in order to verify dusp1 induction in all primary sensory areas in the
same animals, and for the double labeling experiment (see below), freely behaving zebra finches
(hearing song in the light for 30 to 45 min) were also taken after being placed individually in the sound
attenuating boxes overnight in the dark (n = 3). Their behavior was monitored to confirm that they
didn’t either stay still or sing.
Cloning of zebra finch dusp1
We cloned a cDNA fragment of dusp1 from whole zebra finch male brain mRNA with
degenerate primers and RT-PCR. First, brain mRNA was reverse transcribed to cDNA using
Superscript Reverse Transcriptase (Invitrogen) with oligo dT primers. Then dusp1 was amplified using
degenerate primers to conserved regions of the coding sequence from human, mouse, rat, and chicken
in the NCBI database (Accession #s X68277, X61940, X84004, and AF026522 respectively). The
forward and reverse oligo DNA primers were 5'-CCCWCTSTACGAYCARGGNGG-3' and 5'-
ACRCCGATGGARACDGGRAARTT-3', respectively. PCR conditions were 94oC for 1 min, 58
oC for
1 min, and 72oC 30 sec, for 25 cycles in 1X PCR buffer (Takara). PCR products were examined on 1%
agarose gels, extracted from the gels, ligated into the pGEM-T Easy plasmid (Promega), and
transformed into XL-1 blue E. Coli cells. Plasmid DNA was isolated and the inserted cDNA was
sequenced from the 5'- and 3' ends, using plasmid sequencing primers. To confirm that dusp1 was
cloned, the sequences were BLAST searched against the NCBI nucleotide database and homologies to
other species were found. One of the zebra finch clones (Genbank accession # AB476742) was
identified as a 543bp fragment (in the forward orientation of the pGEM-T Easy plasmid) that showed
90% and 84% DNA sequence identity, respectively, to the homologous coding region of the chicken
and human dusp1 cDNAs. After the completion of our study, the draft zebra finch genome sequence
was made available (UCSC browser, Warren et al. 2010) and a full-length dusp1 sequence predicted
(NCBI accession # XM_002193132). Our partial cDNA clone is 100% identical to the predicted
sequence. It spans exon3 and the beginning of exon4 relative to the human dusp1 gene; however the
zebra finch dusp1 genomic sequence is not yet complete, so it is not possible at this time to determine
the total number of exons in songbirds. Our clone shows 84% identity to the zebra finch dusp4 gene,
which from our experience is on the borderline of cross hybridization (85% identity), but not sufficient
to show a strong signal at the high stringency conditions we used. To confirm our prediction, we used
Page 8 of 56
John Wiley & Sons
Journal of Comparative Neurology

For Peer Review
Horita et al
9
the genomic sequence and PCR to clone a zebra finch dusp4 cDNA (Genbank accession # AB546648),
hybridized it to brain sections of silent control and auditory stimulated animals, and found very low
dusp4 expression throughout the brain regardless of condition, with a pattern that did not match dusp1
(data not shown), as predicted. The forward and reverse oligo DNA primers were 5'-
CCTTTCCATGACCAGGGTG-3' and 5'-ACACTGGGAAGCTGAAGACA-3'. Our dusp1 clone
showed no other regions of high cross identity in the draft zebra finch genome.
In situ hybridizations
After each of the above behavioral sessions, birds were decapitated, their brains were removed,
embedded in OCT compound (Sakura Fine Technical) inside tissue block molds, frozen in a dry ice
ethanol bath, and stored at –80oC. In situ hybridizations were performed as previously described (Wada
et al., 2006). In brief, 12µm frozen sections were cut in the sagittal plane to maximize the amount of
brain tissue per section; for the monocular visual experiments, coronal sections were used to compare
differences of gene regulation in corresponding regions between hemispheres. Sections of all birds of a
given experiment were simultaneously fixed in 3% paraformaldehyde, washed in PBS (pH7.4),
acetylated, dehydrated in an ascending ethanol series (70%, 95%, and 100% for 2 min each), air dried,
and processed for in situ hybridization with antisense and sense 35
S-UTP labeled riboprobes of zebra
finch dusp1 or egr1. The egr1 clone is described in (Wada et al., 2006). To generate the riboprobes, the
dusp1 (543bp) and egr1 (1,100bp) inserts in the pGEM-T Easy vector were PCR amplified with
plasmid primers and the amplified products purified. With the amplified DNA, SP6 RNA polymerase
was used to synthesize the antisense 35
S-riboprobes and T7 RNA polymerase was used to synthesize
the sense 35
S-riboprobes. 1x10⁶ cpm of the
35S-probe was added to the hybridization solution.
Hybridization and washes were at 65oC. Slides were dehydrated in an ascending ethanol series,
exposed to X-ray film (Biomax MR, Kodak) for 1-4 days (dusp1) or 1-2 days (egr1), then dipped into
autoradiographic emulsion (NTB2, Kodak), incubated for 1-2 weeks at 4°C, processed with D-19
developer (Kodak) and fixer (Kodak), Nissl-stained with cresyl-violet acetate solution (Sigma), placed
in xylene, and coverslipped with Permount mounting medium (Sigma). We didn’t observe any specific
signals with the sense probes (not shown).
For double labeling in situ detection of dusp1 and egr1, a 35
S-UTP labeled riboprobe of dusp1
or egr1 was used in combination with a Digoxigenin (DIG)-UTP labeled riboprobe of the other gene.
The two probes were added simultaneously to the hybridization solution. After hybridization, the
Page 9 of 56
John Wiley & Sons
Journal of Comparative Neurology

For Peer Review
Horita et al
10
double labeled slides were not dehydrated in EtOHs, but washed in buffer 1 (100 mM Tris pH7.5, 150
mM NaCl, 0.1% Tween 20) at room temperature (RT) twice for 30 min, incubated in Blocking solution
(5% lamb serum and 1% BSA in buffer 1), and then with an anti-DIG-alkaline phosphatase (AP)
antibody (1:2000 in buffer 1) at 4oC overnight. The sections were then washed in buffer 1 at RT three
times for 30 min each and in buffer 2 (100 mM Tris pH9.5, 100 mM NaCl, 50 mM MgCl2) twice for 5
min each. Thereafter, the slides were reacted with either NBT/BCIP solution (NBT/BCIP Ready-to-Use
Tablets, Roche) or BM purple (Roche) for 5-6 hours in the dark, washed once in stop buffer (2mM Tris
pH8.0, 1mM EDTA pH8.0), then twice in PBS for 3 min each and in water for 10 sec. The slides were
dried overnight and dipped into Ilford autoradiography emulsion (Ilford K5, polyscience). We did not
use Kodak NTB emulsion (either NTB2 or 3) because it removes the AP chromogenic product from the
DIG probe (Young, 1989; Kerner et al., 1998). The slides were incubated for 1-2 weeks at 4°C,
processed with D-19 developer and fixer (Kodak), and coverslipped with mounting medium
(VECTASHIELD with DAPI, Vector).
Quantification and statistics
Brain images on X-ray films were digitally scanned from a dissecting microscope connected to
a SPOT-III CCD camera using SPOT imaging software (Diagnostic Instruments, Inc.). For
quantifications, care was taken to use the same light settings across all images of the same gene. We
used Adobe Photoshop CS3 to measure the mean pixel intensities on a 256 grey scale in the brain areas
of interest from at least two adjacent sections. We then quantified fold gene induction by measuring
expression levels of each gene in the region of interest in stimulated animals divided by the average
expression levels in control animals for a given experiment. For these comparisons, statistical
differences were determined by unpaired t-test (*s inside of bar graphs). A value of ~1 represents no
induction relative to controls; statistically significant values above or below 1 represent induced or
reduced expression, respectively. We also made comparisons between genes (dusp1 and egr1) within
the same brain region from adjacent sections of the same animals using paired t-test (*s above bar
graphs). For the vision experiments, we additionally performed ratio comparisons of stimulated gene
expression between hemispheres (contralateral to eye covered side:contralateral to eye open side),
using paired t-test, as a stringent test for differences within the same animals.
For the double label dusp1 and egr1 experiments, we used a compound microscope at 60X
magnification and Slidebook software (Olympus) to acquire images of the regions of interest. The total
Page 10 of 56
John Wiley & Sons
Journal of Comparative Neurology

For Peer Review
Horita et al
11
number of cells (range 51-61, n = 3 birds) within a given field from at least two adjacent sections were
counted. Of this total, the subsets of single and double labeled dusp1 and egr1 cells were estimated and
were corrected with the Abercrombie equation (N = n(T/(T+D)), where N is the corrected number of
the labeled cells, n the estimated number of the labeled cells, T the thickness of the section (12 µm),
and D the mean diameter of the nuclei; Guillery and Herrup, 1997). We only considered a cell labeled
if we could find a clear nucleus stained by DAPI or counterstained by the chromogenic background
signal (purple reaction product) associated with the DIG reaction product. From the total number of
cells, the mean percentage of dusp1+, egr1+, and dusp1+/egr1+ relative to labeled cells were
determined, and statistically compared within and across adjacent brain regions by ANOVA among
regions; e.g. L2 vs L1, followed by Fisher’s PLSD post hoc test.
Nomenclature
We used the new avian brain nomenclature (Reiner et al., 2004; Jarvis et al., 2005) with
modifications that have been discussed in several previous reports (Mouritsen et al., 2005; Feenders et
al., 2008; Hara et al., 2009; Kubikova et al., 2010). In particular, based on gene markers and other
evidence, the formally named dorsal hyperstriatum (HD) was originally revised to hyperpallium
densocellulare (HD) and the ventral hyperstriatum (HV) originally revised to simply as mesopallium
(Reiner et al., 2004; Jarvis et al., 2005). Our subsequent reports using mesopallium specific markers
(GluR1, FoxP1, D1B, and D3) in multiple avian species (Wada et al 2004; Mouritsen et al., 2005;
Feenders et al., 2008; Hara et al., 2009; Kubikova et al 2010) led us to modify this change, where we
argue that the formally named dorsal hyperstriatum (HD) is the dorsal mesopallium (MD) and the
formally named ventral hyperstriatum (HV) is the ventral mesopallium (MV). This nomenclature is an
alternative minority view to what others consider HD as a distinct brain subdivision, not part of or
related to the mesopallium. Additional studies are necessary to further resolve this issue. Secondary and
tertiary sensory areas of the telencephalon were given names associated with the name of sensory input
cell populations where the projection is from (Feenders et al., 2008). Thus, for the auditory areas
adjacent to or near Field L2 we called them N-L2 (for L1 and L3) and MV-L2 (for caudal
mesopallium, CM). For visual areas adjacent to or near the entopallium (E) that have been called lateral
nidopallium (LN) and lateral ventral mesopallium (LMV) we called them nidopallium adjacent to the
entopallium (Ne) and ventral mesopallium near the entopallium (MVe). For somatosensory areas
adjacent to or near basorostralis (B) we called them Nb and MVb as well. This naming scheme allowed
Page 11 of 56
John Wiley & Sons
Journal of Comparative Neurology

For Peer Review
Horita et al
12
us to universally compare functionally activated, homologous brain areas across species (Feenders et
al., 2008).
Figure preparation
The photomicrographs were adjusted in Adobe Photoshop CS3 (Adobe, San Jose, CA). The Levels
function was used to expand the range of image pixels within the full 250 range. The intensity of the
background outside the tissue was reduced equally for all brain sections, in order to see the brain
section with or without gene expression. Color images were further adjusted by the color adjustment
function so that the signals in white color had enough contrast within the visible spectrum. All images
of the same gene in control and experimental groups were adjusted in the same way to avoid
unintentional modification in gene expression across groups.
RESULTS
In situ hybridizations of brain sections from freely behaving zebra finches revealed that relative
to the rest of the brain, there was higher dusp1 expression in thalamic-recipient sensory input cell
populations of the telencephalon. These populations included Field L2 (auditory), Entopallium (E,
visual), Basorostralis (B, somatosensory), and the intercalated layer of the hyperpallium (IH, visual and
somatosensory; Fig. 2A-C). Moreover, L2, E, and B formed one continuum of labeled cells between
the nidopallium and striatum, whereas IH formed one continuum between the hyperpallium (H) and
dorsal mesopallium (MD). For these sensory input and higher sensory neuronal populations, we found
specific and complementary regulation of dusp1 and egr1, using stimulus and behavioral
manipulations.
Hearing-induced regulation in auditory input neural populations
Relative to silent control zebra finches sitting still in the dark, animals that heard 30 min of song
playbacks and also sat still in the dark had increased dusp1 expression throughout Field L2 (Figs. 3A1-6,
4A1,4, 4C red bars - * inside bar). In the secondary and tertiary auditory neuron populations that are
known to express high levels of egr1 in response to hearing song (Mello and Clayton, 1994; Jarvis and
Nottebohm, 1997), there was no detectable activation of dusp1. These populations included the
nidopallium adjacent to L2 (N-L2, consisting of L1, L3, PLN, and the HVC shelf; secondary sensory
Page 12 of 56
John Wiley & Sons
Journal of Comparative Neurology

For Peer Review
Horita et al
13
neurons), the caudal medial nidopallium (NCM), the caudal ventral mesopallium near L2 (MV-L2,
consisting of CM and PLMV; tertiary sensory neurons), the caudal striatum (cSt) adjacent to L2, and
the RA cup (also tertiary sensory neurons) in the arcopallium adjacent to RA (Figs. 3A1-6, 4A1,4, 4C red
bars). To be certain that these higher sensory neurons expressed egr1 in our birds, we hybridized
adjacent sections to egr1 and found robust hearing song-induced expression (Figs. 3B1-6, 4B1,4, 4C blue
bars - * inside bars). The anatomical contrast in activation between the two genes was prominent, such
that the dusp1 and egr1 expression domains formed complementary images of each other in primary vs
higher (secondary, tertiary, etc.) telencephalic auditory areas (Figs. 3A vs 3B and 4A vs 4B). This
differential regulation between the two genes in the telencephalic auditory areas was significant (Fig.
4C * above bars). Thus, the lack of dusp1 induction in the higher (secondary, tertiary, etc) auditory
neurons was not due to a lack of activity in these neurons.
Differential dusp1 and egr1 activation also occurred at earlier stations of the auditory pathway.
The thalamic auditory nucleus ovoidalis (Ov), which does not show hearing-induced egr1 expression
(Figs. 3B1,4, 4B2,5, 4C; Mello and Clayton, 1994; Jarvis and Nottebohm, 1997), showed hearing-
induced dusp1 expression (Figs. 3A1,4, 4A2,5, 4C). The up-regulation of dusp1 in Ov, though, was less
robust than it was in L2 (Fig. 4C). Conversely, the midbrain auditory nucleus MLd, which showed high
levels of hearing-induced egr1 expression (Figs. 3B3,6, 4B3,6, 4C), did not show detectable hearing-
induced dusp1 expression within the same part of MLd (Figs. 3A3,6, 4A3,6, 4C). Likewise, the Ov shell,
which receives descending auditory feedback from RA cup in the telencephalon (Fig. 1B; Mello et al.,
1998) and shows some hearing-induced egr1 expression (Fig. 4B5; Mello and Clayton, 1994), did not
appear to show cells with induced dusp1 expression in response to hearing song (Fig. 4A5).
The hearing-song-induced regulation of dusp1 was specific to the auditory pathway, as we did
not detect significant induction above silent control levels in telencephalic sensory input neurons of the
visual (E) and somatosensory (B) pathways (Fig. 4C). We also did not detect any increase in egr1
expression in the higher sensory neurons in visual and somatosensory nidopallium (secondary sensory)
and ventral mesopallium (tertiary sensory) adjacent to E (Ne and MVe) and B (Nb and MVb),
respectively (data not shown). In summary, the results suggest that hearing song specifically causes
induction of dusp1 gene expression in auditory input cell populations where egr1 is not or minimally
regulated, and vice versa for higher auditory populations where egr1 gene expression is induced. The
two genes combined functionally map the entire auditory pathway from the midbrain to the forebrain.
Page 13 of 56
John Wiley & Sons
Journal of Comparative Neurology

For Peer Review
Horita et al
14
Visually-induced regulation in visual input neural populations
To determine if dusp1 can be regulated in sensory input neurons other than auditory, we used
brain sections from a monocular occlusion experiment that we recently showed reduced egr1 induction
in the visual pathways (Fig. 1C; Hara et al., 2009). This reduction occurs because in birds with laterally
placed eyes, such as the zebra finch, the visual pathways are almost completely crossed at the optic
chiasm (Weidner et al., 1985), and thus blocking visual input from one eye significantly reduces the
activation in visual pathway regions of the contralateral hemisphere (Hara et al., 2009). We therefore
examined dusp1 expression in zebra finches with one eye covered. First, we found that relative to
animals that sat still in the dark, those that were then exposed to light for 45 min had higher dusp1
expression throughout most of the sensory input neuron populations of the telencephalon of both
hemispheres (L2, E, B, and IH; Figs. 5A1-6, 6C red bars). This increase is not surprising considering
that when the lights are turned on, the birds perform movements that can activate somatosensory
pathways (i.e. B) and make sounds that can activate auditory pathways (i.e. L2). However, when
expression was compared between hemispheres, dusp1 expression was higher contralateral to the open
eye only within E, the visual input neurons of the tectofugal visual pathway and for some animals in
posterior IH, the visual input neurons of the thalamofugal visual pathway (Figs. 5A1-6, 6A1,2,4,5, 6C * on
x-axis between bars). Although barely detectable in expression, there was a weak quantitative
hemispheric difference in dusp1 induction in some higher sensory neurons in the visual regions
adjacent to E (MVe and Ste; Figs. 5A2,5, 6A2,5, 6C * on x-axis between red bars). There was not a
significant difference in dusp1 levels in all other higher sensory neurons in the visual regions adjacent
to E or IH (Ne, the posterior hyperpallium [PH], and the posterior dorsal mesopallium [PMD]; Fig. 6C
red * on x-axis between red bars). In contrast, there was robust induced expression of egr1 in these
higher visual areas (Ne, MVe, Ste, PH, and PMD) contralateral to the open eye (Figs. 5B1-6, 6B1,2,4,5,
6C white * in blue bars, and blue * on x-axis). PMD is a dumbbell-shaped visual region in frontal
sections formally called HD (hyperstriatum dorsale or hyperpallium densocellulare) of past studies
(Shimizu and Bowers 1999; Medina and Reiner 2000; Kruztfeld and Wild 2004) that we now designate
as dorsal mesopallium (MD). PH is the overlying visual Wulst part of the posterior hyperpallium.
These regional differences between light-induced dusp1 in sensory input and egr1 in higher sensory
neurons of the visual pathway were significant (Fig. 6C black * above bars). In animals housed in the
dark with one eye covered, there was no hemispheric difference in dusp1 or egr1 expression in any of
Page 14 of 56
John Wiley & Sons
Journal of Comparative Neurology

For Peer Review
Horita et al
15
the brain regions measured (Figs. 5A1-3,B1-3; p = 0.72-0.92 paired t-test), demonstrating that light
stimulation was necessary for the observed hemispheric differences in the light stimulated group.
Within the thalamus, there was robust dusp1 induction in multiple visual nuclei contralateral to
the open eye. These included: a) nucleus rotundus (Rt), which is a thalamic sensory input nucleus that
sends input to E; and b) the subpretectal nucleus (SP), which is an inhibitory thalamic nucleus and
projects to Rt (Fig. 1C; Figs. 5A2,5, 6A2,3,5,6, 6C red bars; Benowitz and Karten, 1976; Deng and
Rogers, 1998b; Theiss et al., 2003). SP is not thought to be a sensory input nucleus of the thalamus,
however, its path of connectivity is similar to Rt (Fig. 1C), and thus technically it could be considered
sensory input. These thalamic nuclei did not show egr1 induction in response to light stimulation (Figs.
5B2,5, 6B2,3,5,6, 6C blue bars). Within the midbrain, light-stimulation caused an intense band of dusp1
induction in layer 8 of the optic tectum (OT) contralateral to the open eye, but no detectable induction
in other layers (Figs. 5A2,3,5,6, 6A3,6, 6C red bars). However, unlike the non-overlap of dusp1 and egr1
induction in the midbrain auditory nucleus MLd, egr1 induction was also found in the OT layer 8 (as
well as layers 6, 10-11, and 13) contralateral to the open eye (Figs. 5B2,3,5,6, 6B3,6, 6C blue bars).
Another midbrain nucleus, the isthmi pars parvocellularis (IPc), which encodes both visual and
auditory responses and is reciprocally connected with the OT (Maczko et al., 2006), showed high basal
dusp1 expression bilaterally (Figs. 5A3,6, 6A3,6; p = 0.4801; paired t-test between ipsilateral and
contralateral hemispheres of light stimulated animals). Dusp1 expression in IPc was high even in
animals in the dark and no different than animals stimulated with light (p = 0.8077; unpaired t-test
between animals in the dark and with light stimulated). There was no detectable egr1 expression in IPc
of any of the groups (Figs. 5B3,6, 6B3,6), consistent with differential regulation of the two genes.
We wondered if differential IEG induction occurred in visual areas in different social context,
such as looking at a female versus alone. In a previous report (Hara et al., 2009), we found higher
levels of induced egr1 expression in PH and lower induction in Ne contralateral to the open eye when
males viewed females relative to light alone. Interestingly, in three of five males with one eye covered
that sang to and viewed females with the open eye, there was higher dusp1 induction in IH of the
hemisphere ‘ipsilateral’ to the open eye (Fig. 7A,C). This finding is in stark contrast to the higher egr1
induction in the adjacent PH and PMD ‘contralateral’ to the open eye of the same animals (Fig. 7B,C),
as well as in the light stimulated only condition. This differential expression pattern (higher dusp1
induction on the ipsilateral side) was specific to IH of the thalamofugal visual pathway, as dusp1
induction in Rt of the tectifugal visual pathway was higher contralaterally to the open eye in these same
Page 15 of 56
John Wiley & Sons
Journal of Comparative Neurology

For Peer Review
Horita et al
16
males (Fig. 7C), similar to the light stimulation only condition (Fig. 6C). In males that viewed females
with both eyes open, as well as did not sing (n = 3), dusp1 was higher bilaterally in IH (not shown).
In summary, the results suggest that light stimulation specifically causes dusp1 up-regulation in
visual input cell populations where egr1 is not or minimally regulated and vice versa for higher visual
cell populations where egr1 is highly up-regulated. Further, seeing a female for some animals appears
to cause a more robust up-regulation of dusp1 in visual input cells of the thalamofugal visual pathway
(IH) ipsilateral to the open eye, whereas the egr1 induction in the adjacent higher visual regions is
blocked by this condition, suggesting an inverse excitatory-inhibitory relationship between IH and the
surrounding visual regions when viewing females. The two genes together effectively define and map
most if not all known regions of the visual pathways from the midbrain to the forebrain.
Hopping-induced regulation in somatosensory input neural populations
To determine whether high dusp1 induction is restricted to sensory pathways or can be induced
in motor systems, we examined dusp1 expression in animals that hopped in a rotating wheel in the
dark. Hopping in songbirds results in movement-associated egr1 up-regulation in both somatosensory
pathways and in putative motor pathway areas adjacent to the telencephalic song nuclei (Fig. 1A,D;
Feenders et al., 2008). These experiments have to be conducted with animals moving in the dark and
while deaf to prevent IEG induction in visual and auditory areas, respectively, from optic flow and
hearing the hopping sounds during movement (Feenders et al., 2008). Confirming this requirement, we
found that analogous to the egr1 findings in higher sensory neurons for hearing intact animals, hopping
in the dark resulted in dusp1 induction in auditory input (Ov and L2) populations as well as
somatosensory input populations - the anterior portion of IH [aIH] of the lemnothalamic somatosensory
pathway and B of the pseudo-collothalamic somatosensory pathway; aIH shown in Fig. 8A1 (Wild and
Farabaugh, 1996; Wild and Williams, 1999). The second pathway is called pseudo-collothalamic,
because it skips both the midbrain (collo) and thalamus, and projects directly from the trigeminal
principle sensory nucleus V (PrV) in the pons to B in the telencephalon (Fig. 1D; Jarvis, 2009).
Deafening eliminated the dusp1 induction in Ov and most of L2 (Fig. 8A1,2), but not the induction in
aIH and B (Figs. 8A1,2, 9A1-12; higher power in Fig. 10A1-4 and quantification in Fig. 10C red bars). As
observed in the sensory input neurons in the auditory and visual systems, dusp1 induction in the
somatosensory input populations of the hopping animals was complementary to the patterns of egr1
induction in higher somatosensory populations. These higher populations included the anterior
Page 16 of 56
John Wiley & Sons
Journal of Comparative Neurology

For Peer Review
Horita et al
17
hyperpallium (AH) and anterior dorsal mesopallium (AMD) of the lemnothalamic somatosensory
pathway surrounding aIH, the nidopallium adjacent to B (Nb) and ventral mesopallium near B (MVb)
of the pseudo-collothalamic somatosensory pathway (Figs. 8A2,B2, 9A7-12,B7-12, 10A3,4,B3,4). There was
some low level, detectable dusp1 induction in the higher somatosensory populations (AH, AMD, Nb,
and MVb) and likewise some egr1 induction in aIH (Figs. 9A,B, 10A-C). Despite this overlap of
induction, the differences between dusp1 (higher in somatosensory input populations) and egr1 (higher
in secondary and tertiary somatosensory populations) expression were large and significant (Fig. 10C *
above bars). There was no detectable dusp1 induction in E of the visual pathway in the deaf animals
that hopped in the dark (Figs. 10A2,4, C), consistent with the lack of visual input.
Interestingly, a lateral portion of L2 showed both hearing (Fig. 3A6) and hopping (Fig. 9A9)
induced dusp1 expression. This lateral portion of L2 was directly adjacent to the posterior lateral
nidopallium (PLN) and posterior lateral ventral mesopallium (PLMV), which we previously found
(Feenders et al., 2008) showed both hearing and hopping induced egr1 expression (Figs. 3B6, 9B9).
This part of L2 also abuts the NIf song nucleus, and NIf shows both robust auditory and singing-
associated motor activity and is necessary for auditory input into the song motor system (Jarvis and
Nottebohm, 1997; Cardin and Schmidt, 2004; Cardin et al., 2005; Bauer et al., 2008). These findings
further support the idea that this lateral portion of the auditory pathway (lateral L2, PLN, and PLMV)
adjacent to the NIf and Avalanche (Av adjacent to PLMV) song nuclei could be a source of auditory
input into the putative avian motor pathway (Feenders et al., 2008).
For the somatosensory nuclei of the brainstem, the dorsal intermediate ventral anterior (DIVA)
nucleus of the thalamus and PrV in the pons (Fig. 1D), we did not have a sufficient number of animals
with these regions in our sagittal brain dissections to quantitatively assess dusp1 and egr1 regulation.
However, we had frontal sections of one dark hopping animal with DIVA, as well as three visually
stimulated animals moving in the light, and three sitting still control animals in the dark with PrV. We
found that in these two nuclei there was bilateral induced dusp1 expression (p < 0.001; unpaired t-test
for PrV) and no noticeable egr1 expression in the moving animals relative to the sitting still animals
(Fig. 11A,B).
In contrast to the known somatosensory areas, we did not find detectable dusp1 induction in the
motor-associated areas adjacent to the song nuclei. These areas include the anterior striatum (ASt)
adjacent to Area X, the anterior nidopallium (AN) adjacent to MAN, and PLN and DLN adjacent HVC,
the anterior ventral mesopallium (AMV) adjacent to MO, PLMV adjacent Av, and the lateral
Page 17 of 56
John Wiley & Sons
Journal of Comparative Neurology

For Peer Review
Horita et al
18
intermediate arcopallium (LAI) adjacent to RA (Fig. 9A2-6,8-12, 10D red bars). An assessment of
specialized dusp1 expression in song nuclei of vocal learners will be reported separately (Horita, Oka,
Jarvis, and Wada in preparation). Intriguingly, egr1 is not induced by activity in the pallidum (P, Fig.
9B4-6,10-12; Feenders et al., 2008), and we found higher dusp1 expression in isolated cells of the ventral
pallidum (VP) at a location (Fig. 11C1,2) that was recently shown to receive a direct projection from the
striatum adjacent to Area X (Person et al., 2008). However, we did not note apparent differences in VP
between the sitting still and hopping animals, unlike the robust up-regulation of egr1 in the striatum
(St) between VP and Area X (Fig. 11C3,4). In another structure involved in motor behavior, the
cerebellum, there was increased dusp1 expression throughout the granular layer in the hopping animals,
whereas egr1 was increased in the granular layer of specific anterior (I-VII) and posterior (X) lobes
(Fig. 9A1,2,7,8,B1,2,7,8; Feenders et al., 2008). We do not know whether the overlap of expression in the
granular layer results from the same or different cells expressing dusp1 and egr1.
In summary, the results suggest that in the zebra finch brain high levels of induced dusp1
expression occurs in sensory input neurons of the thalamus and the telencephalon where egr1
expression is minimal or does not occur. Conversely, low to no dusp1 induction occurs in higher
sensory neurons of the thalamus and telencephalon, and telencephalic motor pathway neurons, where
egr1 induction is robust. The activated brain regions are specific to a given stimulus category and
behavior. Exceptions are layer 8 of the OT and the granule cell layer of the cerebellum, where both
dusp1 and egr1 were induced to high levels.
Segregation of dusp1 and egr1 expressing cells
To assess whether there is a distinct separation or co-expression of some cells with induced
dusp1 and egr1 expression in the adjacent or the same brain regions, we performed double labeling
experiments. We used brain sections from zebra finch males that had heard song and freely moved
within ~45 min after lights were on in the morning, in order to maximize dusp1 and egr1 induction in
multiple brain areas of the same animal. We found that within the central portions of the sensory input
neuronal populations (L2, E, B, and aIH), of the labeled cells, almost all (~98% in L2) or most (~74%
in aIH) were dusp1 positive only (Fig. 12A,C,F; E and B not shown). At the boundaries of these
regions with the surrounding nidopallium (e.g. L2-L1 and aIH-AH), there was an intermingling of
dusp1 only (~43-51%) and egr1 only (~31-45%) expressing cells (Fig. 12F). On the other side of the
boundaries (e.g. in higher sensory L1 and AH), of the labeled cells, the majority (>82%) were egr1
Page 18 of 56
John Wiley & Sons
Journal of Comparative Neurology

For Peer Review
Horita et al
19
positive only (Fig. 12B,D,F). A recognizable minority (12-18%) at the borders co-expressed both
dusp1 and egr1, whereas a small minority (~1-8%) did so within the sensory input neuronal populations
(L2, L1, and aIH; Fig. 12A-D,F).
Within the OT, a similar result was found. Although layer 8 had induction of both dusp1 and
egr1, the majority of the cells (~89%) were intermingled single labeled dusp1 (~33.5%) or egr1
(~55.2%) cells (Fig. 12E,F). The minority (~11%) was double labeled (Fig. 12E,F). We attempted to
measure expression in the cerebellum, which had high levels of dusp1 in the animals we collected,
however, the egr1 expression was too low to reliably detect. In summary, we find that it is possible for
cells to express both genes, but the majority of cells that express high levels of dusp1 or egr1 express
one gene or the other.
Other avian species
We wondered if the pattern of differential dusp1 induction in sensory input neurons was
specific to the zebra finch, a songbird, or was it present in other avian groups. Thus, we examined
dusp1 relative to egr1 induction in two other avian species: budgerigars, a parrot and like songbirds
belongs to a vocal learning order, and ring doves, which belongs to a vocal non-learning order
(Nottebohm, 1972; Jarvis, 2004b). We assessed dusp1 expression in adjacent sections that had been
hybridized to egr1 from experiments that mapped hearing and/or movement-associated brain areas in
these species (Jarvis and Mello, 2000; Feenders et al., 2008).
For quiet control budgerigars that sat relatively still in normal room light or in the dark alone
for >3hr, dusp1 expression was low throughout the telencephalic sensory input neural populations (Fig.
13A1,5). This is unlike the zebra finch, where basal levels were often higher in the sensory input neural
populations. However, similar to the zebra finch, the budgerigar cerebellum had high basal expression
of dusp1 (Fig. 13A1-4). Budgerigars that sat relatively still while hearing 30 min of warble song
playbacks showed distinct and robust up-regulation of dusp1 throughout L2 in the telencephalon and
Ov in the thalamus (Fig. 13A1,2,5,6). Those that hopped in the rotating wheel in the dark, but with
hearing intact also showed increased dusp1 expression in the lateral portion of L2 and in Ov (Fig.
13A1,3,5,7), as well as in nucleus B, the sensory input neurons of the pseudo-collothalamic
somatosensory pathway (Fig. 13A5,7). Deafening eliminated the hopping-associated dusp1 induction in
L2 and Ov, but not in B (Fig. 13A1,4,5,8,D). Interestingly, unlike zebra finches, hopping budgerigars did
not show robust dusp1 induction in aIH, the sensory input neurons of the lemnothalamic somatosensory
Page 19 of 56
John Wiley & Sons
Journal of Comparative Neurology

For Peer Review
Horita et al
20
pathway (Fig. 13A1,4,D). We also found high movement-associated dusp1 induction in a budgerigar
thalamic nucleus, what appears to be the medial spiriform nucleus (SpM; Fig. 13E; Roberts et al 2001).
We did not note such a nucleus in zebra finches.
As observed in zebra finch brains, the patterns of sensory-driven dusp1 expression in the
budgerigar brain were complementary to the patterns of the egr1 expression. Hearing song resulted in
induced egr1 expression in the higher sensory neurons adjacent to or near L2 (Fig. 13B1,2,5,6) and the
movement-induced egr1 expression in higher somatosensory populations in the nidopallium (Nb) and
ventral mesopallium (MVb) adjacent to B (Fig. 13B5,8,D). Further, although aIH did not have high
dusp1 induction in budgerigars (Fig. 13A4,D), the adjacent somatosensory regions of AH and AMD
had high egr1 induction (Fig. 13B4,D; Feenders et al 2008). But, similar to the zebra finch, the deaf
hopping budgerigars had some dusp1 induction throughout the granule layer of the cerebellum and high
egr1 induction in the granular layer of anterior cerebellum lobules II-VI (Fig. 13A4,B4,D). Unlike the
zebra finch, in budgerigars low-levels of dusp1 were found in the motor-associated areas adjacent to
budgerigar song nuclei. However, the expression relative to sitting still animals was not significant (p =
0.101, 0.359, 0.491 for ASt, AN, AMV adjacent to song nuclei MMSt, NAO, and MO; unpaired t-test;
n = 3/group). These dusp1 levels in budgerigar motor-associated regions were far lower than the robust
egr1 induction (Fig. 13A4,B4). Consistent with the differential telencephalic dusp1 and egr1 expression,
we did not find high levels of egr1 induction in thalamic nuclei of Ov or SpM of the hearing song or
hopping animals (Fig. 13B3).
Next, we wanted to determine if the lack or paucity of dusp1 induction in motor areas was a
feature specialized to vocal learners, so we examined these areas in the brains of a vocal non-learner,
ring doves. We compared dusp1 and egr1 expression in the brain of deaf ring doves that walked on a
treadmill for 30 minutes in the dark to those that sat relatively still in darkness (Feenders et al., 2008).
Similar to the zebra finch and budgerigar, we did not find high dusp1 induction in the putative motor
areas of the ring dove telencephalon (AN, AMV, ASt, PLN, PLMV, DLN, and AI; Fig. 14A1,4). These
brain areas show movement-associated egr1 induction (Fig. 14B1,4; Feenders et al., 2008). In the
cerebellum (Cb), in contrast to the findings in budgerigars and the zebra finch, there was robust
induction of both dusp1 and egr1 in the ring dove anterior lobules (Fig. 14A1,4,B1,4). As for
somatosensory pathways, similar to budgerigars, there was no robust induction of dusp1 in ring dove
aIH, although egr1 was induced in surrounding AH and AMD (Fig. 14A1,4,B1,4,D). There was no
detectable induction in B of the second somatosensory pathway, which was not unexpected as egr1 was
Page 20 of 56
John Wiley & Sons
Journal of Comparative Neurology

For Peer Review
Horita et al
21
not induced in the adjacent Nb and MVb of the walking ring doves (Fig. 14A2,5,B2,5,D; Feenders et al.,
2008). Instead, the region of the brain with the highest increased dusp1 expression was an anterior-
ventral portion of E laterally adjacent to B that we name here as E* (Fig. 14A3,6,C1,2,D); likewise, there
was strip of cells with egr1 induction within the nidopallium and mesopallium adjacent to E* (Ne* and
MVe* in Fig. 14B3,6,C3,4,D). There was no noticeable dusp1 induction in the thalamic visual nucleus
Rt that projects to E, and thus the increase in the anterior-ventral part of E* could be due to
somatosensory or some other sensory processing. There was no dusp1 induction in L2 and in fact
deafening reduced the basal expression in L2 (Fig. 14A1,4,D), consistent with the reduced egr1
expression in the adjacent N-L2 and MV-L2 (Fig. 14B1,4,D; Feenders et al., 2008).
In summary, with some exceptions, the pattern of dusp1 gene induction is similar in distantly
related avian groups. The exceptions relative to the zebra finch are that in the budgerigar the induction
in the sensory input neural populations is more prominent due to the lower basal levels in control
animals, but induction in aIH does not occur with hopping; there is some expression in budgerigar
motor-associated areas, but the levels are still much lower than that seen for egr1; in the dove, the
induction in aIH is also less, and the movement-induced expression of dusp1 and egr1 in the
cerebellum are anatomically coincident.
Dusp1 expression in a mammalian brain
We wondered if differential dusp1 expression in sensory input neural populations was specific
to birds, or could it be found in other vertebrate groups, such as mammals. Most prior experiments on
dusp1 regulation in mammalian neurons have been conducted with cells in culture, and some have been
conducted in the brain of rodents, but mainly in animals that received strong insults such as seizures,
brain lesions, and pharmacological manipulations, where the patterns of regulation can not be clearly
linked to a behavior (Qian et al., 1994; Takaki et al., 2001; Kodama et al., 2005). In a study that used
physiological levels of methamphetamine (a serotonin and dopamine receptor agonist) in rats, they
noted that high levels of dusp1 induction was restricted to layers IV and VI of the cortex, followed by
the thalamus (individual nuclei not specified), and moderate induction occurred in the striatum (Fig. 3
of Takaki et al., 2001). That study, however, did not point out any relationships with sensory input
neurons. But we note here that layer IV neurons in mammalian cortex are sensory input neurons that
receive direct input from sensory nuclei of the thalamus; layer VI neurons are reciprocally connected in
a feedback pathway with the thalamus (Shipp, 2007). Thus, to determine the pattern of dusp1 in rodents
Page 21 of 56
John Wiley & Sons
Journal of Comparative Neurology

For Peer Review
Horita et al
22
that freely behave, we examined dusp1 expression in mice from Gene Expression Nervous System
Atlas (GENSAT) database (Gong et al 2003). These transgenic mice have been constructed with a
BAC transgene containing the dusp1 promoter driving enhanced green fluorescent protein (eGFP)
expression.
First, we noted that dusp1-eGFP expression was present in the mouse cortex and differentially
so in two layers (Fig. 15A1,2,B1). We compared this layered pattern with other layer specific markers
(Rorb for layer IV, Dtx for layers I-III and part of IV, and Darpp32 for lower layer VI; Fig. 15A3-6,B2,3).
The analyses revealed that the two layers of dusp1 expression in the GENSAT mice were layer IV and
upper layer VI, with minimal expression in layer V between them (Fig. 15B). Second, not all brain
sections or all brain regions had equal dusp1 expression levels in layers IV and VI (Fig. 15A1,2),
indicative of immediate early gene activation. Third, similar to birds, dusp1-eGFP expression was low
throughout most of the remaining mouse telencephalon, including the striatum. Fourth, within the
thalamus, dusp1-eGFP soma expression was mostly absent, except in the sensory input nuclei,
including auditory (medial geniculate, MGD), visual (lateral geniculate, DLG) and somatosensory
(ventral posterior lateral and medial, VPL and VPM) nuclei (Fig. 15A2, 15C).
In summary, this analysis suggests that as in birds, dusp1 expression in mammals, under normal,
behavioral, physiological conditions, is expressed at its highest levels in sensory input neurons of the
thalamus and telencephalon. Future work will be necessary to determine if induced expression occurs
in specific brain areas by specific behaviors and to confirm the cortical layer cell types with double
labeling experiments of layer specific markers or tracers and dusp1/egr1 expression.
DISCUSSION
In this study, we examined dusp1 regulation in brains from awake behaving animals. We found
that dusp1 is regulated in distinct neuronal populations where egr1 and a number of other IEGs are not
or are minimally regulated. These areas are the sensory input populations of the thalamus and
telencephalon (Fig. 15A). Below we discuss the implications of our findings.
Functional molecular mapping of brain pathways
Our results show that the combination of dusp1 and egr1 can be used as a molecular tool kit to
anatomically and functionally map neurons of nearly entire brain systems. This is because the two
Page 22 of 56
John Wiley & Sons
Journal of Comparative Neurology

For Peer Review
Horita et al
23
genes, at least in birds, were induced mainly in complementary populations of neurons. In doing so, we
were able to identify and characterize nearly all avian brain regions from the midbrain to the
telencephalon of five pathways of three major sensory systems: one auditory, two visual, and two
somatosensory (Fig. 16A). The only sensory nuclei where we did not find evidence of dusp1 or egr1
induction were within the thalamic GLd complex of the thalamofugal visual pathway (gray in Fig.
16A). However, the avian GLd complex consists of ~6 non-contiguous small nuclei (Deng and Rogers,
1998a; Heyers et al., 2008) that are difficult to find in all of our sections, and thus the status of dusp1
and egr1 regulation in them is uncertain. Additional experiments are necessary, such as placing tracers
into visual IH and assessing dusp1 mRNA expression in the specific nuclei of the GLd complex that
project to IH. We would not be surprised to find that a specific GLd nucleus would show expression,
since the mouse homolog, the MG, shows distinct dusp1-eGFP expression. The somatosensory
pathway to basorostralis of the telencephalon in birds does not have a thalamic component (Wild and
Farabaugh, 1996), which are mammalian VPM and VPL. Instead, basorostralis in birds receives a
direct projection from the cranial sensory nucleus PrV, bypassing the midbrain and thalamus, and PrV
in turn receives somatosensory input from the face and neck. We find that PrV, like thalamic sensory
input populations and mouse VPM and VPL, shows dusp1 and not egr1 expression (Fig. 16A). In this
manner, avian PrV behaves like a thalamic sensory input cell group in its connectivity and its
dusp1/egr1 expression, in support of the pseudo-collothalamic hypothesis (Jarvis, 2009).
Within motor systems, we found low dusp1 expression in the ventral pallidum where egr1 is not
up-regulated. However the dusp1 expression in the pallidum generally did not appear to be regulated by
movement activity in birds. The pallidum in mammals (and presumed in birds) modulates movements
through parallel cortical-basal-ganglia-thalamic-cortical loops (Csillag and Montagnese, 2005; Doupe
et al., 2005; Nambu, 2008). Neurons throughout the pallidum show high spontaneous firing rates
(Bengtson and Osborne, 2000). It is possible that the high firing rates could lead to a constitutive dusp1
expression in the absence of movement.
The avian visual systems showed interesting patterns of dusp1 versus egr1 regulation. First,
unilateral eye occlusion did not completely block light-induced dusp1 expression in E and IH of the
hemisphere contralateral to the open eye. This finding is consistent with the presence of some bilateral
projections from the OT to Rt (then Rt unilaterally to E) and from the GLd complex to IH (Miceli and
Reperant, 1982; Zeigler and Bischof, 1993; Gunturkun et al., 1998). Second, differential hemispheric
expression occurred in IH of the thalamofugal pathway when males viewed and sang to females, but
Page 23 of 56
John Wiley & Sons
Journal of Comparative Neurology
For Peer Review
Horita et al
24
the up-regulation was higher ipsilateral to the open eye, whereas the egr1 regulation was higher in
secondary and tertiary sensory neurons contralateral to the open eye. These findings suggest that there
could be some bilateral feedback in the thalamofugal visual system, which would allow one population
of neurons to be more active when the other eye sees a natural stimulus of interest. Deciphering such a
mechanism requires more experimentation with manipulation of stimuli, neuronal tracing studies, and
electrophysiological studies.
Differences among species
We found species differences in dusp1 expression. In the zebra finch, the basal levels were
higher in sensory input populations of the telencephalon. In parrot, and apparently in mice, the basal
levels can be low in the telencephalic sensory input neurons. In the parrot and ring dove, aIH did not
show robust dusp1 expression in response to hopping or walking, although the surrounding AH and
AMD showed robust egr1 induction. The aIH is expected to be active in hopping and walking in birds,
as it receives somatosensory input from the feet and shows neuronal firing with feet somatic
stimulation in owls (Manger et al., 2002). It is possible that aIH was active during hopping and walking
in the budgerigars and doves, but dusp1 levels remained low, or that other input to the surrounding AH
and AMD activated egr1 in these regions. Also in ring doves, dusp1 induction in response to walking
occurred in the anterior-lateral part of the entopallium, a supposed visual system nucleus, even though
the animals were in the dark. As far as we know, there is no report of somatosensory input into the
lateral part of the entopallium, but this idea is testable. Finally, in zebra finches dusp1 levels were high
in the midbrain’s IPc, which receives auditory and visual input (Maczko et al., 2006), but we did not
note high basal levels in the other species. In zebra finches, it is possible that the high levels are due to
activity by both auditory and visual input. But this is unlikely the main explanation, as IPc still had
high dusp1 expression in the animals that sat still in the dark (no auditory and no visual visual stimuli).
Although IPc does not appear to be a sensory input nucleus, its high dusp1 and undetectable egr1
expression levels is consistent with the general relationship of these two genes throughout the brain.
This result emphasizes that whether differences between species are due to true species differences or
small differences in the stimuli presented or behaviors performed, a general principle is that where
dusp1 is high, egr1 tends to be low.
A possible general property of the vertebrate brain
Page 24 of 56
John Wiley & Sons
Journal of Comparative Neurology

For Peer Review
Horita et al
25
Our preliminary analyses of dusp1 in the GENSAT mice and that of Takaki et. al (2001) in rats
stimulated with methamphetamine suggest that in the mammalian brain, dusp1 is expressed in similar
types of neural populations as in the avian brain. In the two studies that examined dusp1 in brain
sections containing the cortex in response to seizures (Qian et al., 1994; Kodama et al., 2005), we noted
apparent increases of dusp1 in most, if not all, cortical layers, but the layers with the highest increases
appear to us to be IV and VI. It is possible that such strong stimulation leads to more spreading of
dusp1 induction to other cortical layers.
A corollary of these findings is that little to no egr1 induction occurs in sensory input thalamic
nuclei, such as in the rat VPM after somatosensory stimulation of whiskers (Bisler et al., 2002) and in
the cebus monkey’s DLG after light stimulation (Soares et al., 2005). However, within the cortex
contradictory results have been reported for egr1 expression. In the visual cortex, for example, light
stimulation has been reported to cause much less (Soares et al., 2005) or much higher (Pinaud et al.,
2003) egr1 expression in layers IV and VI relative to layers II and III. The differences between studies
could be due to differences in subdivisions of layer IV (which have different connectivity),
developmental age of the animals, or possibly species differences (reviewed in Kaczmarek and
Chaudhuri, 1997). In support of the connectivity hypothesis, a recent study in primates (Takahata et al.,
2009) has shown that layer IVCα, the source of visual input from magnocellular neurons of the lateral
geniculate in the thalamus (for form vision), has little if any light-stimulated egr1 expression, whereas
layer IVCβ, the source of visual input from parvocellular neurons of the lateral geniculate in the
thalamus (for color vision), has high levels of light-stimulated egr1 expression. Perhaps the avian
telencephalic sensory input neurons that lack egr1 and express high levels of dusp1 are analogous to
mammalian layer IVCα neurons. To be certain that the inverse regulation exists in mammals, double
label dusp1 and egr1 experiments in mammalian brains are necessary. Nevertheless, our analyses of the
overall findings suggest that in mammals, thalamic sensory input and thalamo-recipient sensory input
cell populations of the telencephalon express the highest levels of dusp1, and a subset of these
populations express very little egr1.
Given these partial parallels between birds and mammals, preferential activity-dependent
regulation of dusp1 in sensory input neurons may be a general principle of vertebrate brains. This
parallel is consistent with the nuclear to layered hypothesis of vertebrate brain evolution, where
different layers of mammalian cortex are proposed to be homologous to different subdivisions of the
Page 25 of 56
John Wiley & Sons
Journal of Comparative Neurology

For Peer Review
Horita et al
26
avian pallium, including homology of avian telencephalic sensory input neurons to mammalian layer
IV neurons (Karten, 1991; Jarvis et al., 2005).
Potential mechanisms of differential regulation
To explain the differential regulation of dusp1 and egr1, we propose two types of mechanisms:
1) one in which the two genes are regulated dependently (Fig. 16B) and 2) the other in which they are
independent of each other. For a dependent mechanism, the lack of significant overlap of dusp1 and
egr1 expression in the brain of naturally behaving animals is consistent with recent findings in cultured
mammalian neuroblastoma cells, which showed that dusp1 is a potent inhibitor of egr1 gene expression
(Rossler et al., 2008); over-expression of dusp1 completely blocks stimulus-induced egr1 expression
(Rossler et al., 2008). This block occurs through a MAP kinase signaling pathway. Dusp1, also known
as MAP kinase phosphatase 1 [mkp1], is a negative regulator for specific MAP kinases (i.e. ERK1) that
in turn activate the ETS-domain transcription factor (Elk1) and CREB, which in turn bind to the egr1
promoter to up-regulate egr1 mRNA expression (Fig. 16B; Knapska and Kaczmarek, 2004; Machado
et al., 2008). Dusp1 inactivates ERK1 and other MAP kinases by dephosphorylating them at two amino
acid resides, a tyrosine and a threonine (Farooq and Zhou, 2004; Liu et al., 2007), the reason why it is
called a dual specificity phosphatase. MAP kinases comprise three major subtypes: the extracellular
signal-regulated kinase (ERK) that induces cell growth and proliferation, the c-jun amino-terminal
kinase (JNK) and the p38 kinase that induces apoptosis and cell stress reactions. ERK1 activates the
Elk1 and CREB transcription factors via phosphorylation. ERK1/2 can also activate dusp1 expression
via CREB, and thus dusp1 theoretically can inhibit its own expression via a feedback inhibitory loop.
For ERK, there are five gene variants in mammals and each is expressed throughout most cortical
layers (Di Benedetto et al., 2007), but the highest activity-dependent activation (phosphorylation) of
ERK1/2 appears to occur, in our interpretation, in layer IV (Sgambato et al., 1998). This dependent
mechanism is consistent with other findings in songbirds, where ERK1 activation is necessary for the
hearing-induced egr1 expression in the songbird higher auditory neurons (i.e in NCM; Cheng and
Clayton, 2004).
The fact that a minority of cells showed co-expression of both dusp1 and egr1 suggest that an
independent pathway could be possible. For an independent mechanism, neuronal activity could be
linked to different signal transduction pathways for each gene (Fig. 16B, sensory input neuron), but it
Page 26 of 56
John Wiley & Sons
Journal of Comparative Neurology

For Peer Review
Horita et al
27
may also require an ERK independent or an alternative ERK mechanism between the two genes, to
prevent dusp1 suppression of egr1 induction (Fig. 16B).
The presence of double labeled cells could also be explained by a dependent mechanism where
most if not all neurons would have a balance between dusp1 and egr1 expression, but that the balance
is heavily tipped in one direction depending on the cell type (sensory input, higher sensory, and their
boundaries). What would be responsible for tipping the balance? We believe that neurotransmitter
receptors are good candidates (Fig. 16B). The regulation of specific IEGs by neuronal activity is
controlled by neurotransmitter release from pre-synaptic terminals onto specific neurotransmitter
receptor types (Flavell and Greenberg, 2008). We have previously shown that the glutamate receptors
mGluR1, GluR1 (an AMPA receptor subunit), GluR5 (a kainate receptor subunit) and NR2A (an
NMDA receptor subunit) are expressed at higher or lower levels in sensory input neurons relative to the
adjacent higher sensory neurons of the avian telencephalon (Wada et al., 2004). NMDA receptors are
required for dusp1 expression (Qian et al., 1994) and NMDA receptors activate dusp1 in mammalian
cortex but not in the striatum (Takaki et al., 2001). NMDA receptors also activate egr1 expression in
both the cortex and striatum (Gerfen, 2000). Thus, differential expression of one specific receptor
subtype (Fig. 16B) may over- or under-activate dusp1 in sensory input vs higher sensory neurons,
which would then determine the level of suppression of egr1 in those neurons. This hypothesis can be
tested by performing triple labeling experiments with dusp1, egr1, and ion channel receptors, from the
brains of sensory stimulated animals that have been manipulated with pharmacological and genetic
agents against the specific receptors.
In summary, we suggest a dependent mechanism where high dusp1 expression leads to low
egr1 expression. However, this does not mean that the converse is true. Low dusp1 expression will not
automatically lead to high egr1 expression, not until an increase occurs in the firing rate of those
neurons. Once the firing rate increases, we argue that high dusp1 will inhibit ERK and thus egr1
induction, whereas low dusp1 will allow egr1 induction.
Possible functional consequences
Our results raise a question as to what is unique about sensory input neurons that would make
them favor dusp1 over egr1 expression. The answer to this question may be related to the biological
role of dusp1. Dusp1 is thought to play an important role in the cellular response to environmental
stress and subsequent programmed cell death, by inactivating cellular survival responses induced by
Page 27 of 56
John Wiley & Sons
Journal of Comparative Neurology

For Peer Review
Horita et al
28
ERK and subsequent IEGs (Liu et al., 2007). We also argue it could play a role in dampening neural
plasticity of sensory input neurons by down-regulating egr1 and other IEGs. Concordant with this first
hypothesis, the sensory input neurons of the avian telencephalon and thalamus and layer IVC of the
primate visual cortex show some of the highest levels of cytochrome oxidase (CO) in the brain,
indicative of their higher metabolic activity relative to the rest of the telencephalon (Braun et al.,
1985a,b; Adret and Margoliash, 2002; Takahata et al., 2009). In fact all of the brain regions we noted
with high constitutive dusp1 expression in zebra finches (E, L2, B, Ov, Rt, IPc, SP) have the highest
CO activity in zebra finches (Braun et al., 1985a,b). In support of this idea, it was recently discovered
that the two genes, dusp1 and CO, in humans have the identical promoter binding site for the stress-
induced transcription factor p53 and are simultaneously up-regulated by p53 in response to cellular
stress (Liu et al., 2008). Alternatively or concordant with the second hypothesis, the sensory input
neurons of the songbird auditory pathway (L2; Chew et al., 1995) and mammalian layer IV neurons of
the adult visual pathway (Thompson, 2000) show the least neural plasticity in response to hearing novel
songs or to visual pathway manipulations, respectively, relative to higher sensory neurons (i.e. cortical
layers). Perhaps the sensory input neurons need to perform basic services that require greater metabolic
activity and dusp1 is needed to protect against this stress and reduce plasticity. These ideas can be
tested by inactivating dusp1 in sensory input neurons of birds and mammals and determining whether
activity-dependent induction of cellular stress and/or plasticity is converted to the type seen for higher
sensory neurons.
In conclusion, by using natural behavioral stimuli and behaviors, we have identified and
characterized an activity-dependent gene, dusp1, in the brains of awake behaving animals, which shows
complementary expression patterns relative to the commonly studied egr1 gene. The activated
expression patterns allowed us to generate novel and testable hypotheses on the mechanisms of how
dusp1 and egr1 regulation are linked in the intact brain, and the functions of the brain areas. Further,
the results have revealed unique properties of gene activation in sensory systems.
FIGURE LEGENDS
Fig. 1. Schematic diagrams of songbird brain areas involved in singing, hearing, vision, and somatic
sensation. A: Song system. Black solid arrows: vocal motor pathway (from HVC to RA to brainstem
motor nuclei) and vocal pallial-basal ganglia-thalamic loop (Area X-DLM-LMAN); dashed arrows:
Page 28 of 56
John Wiley & Sons
Journal of Comparative Neurology
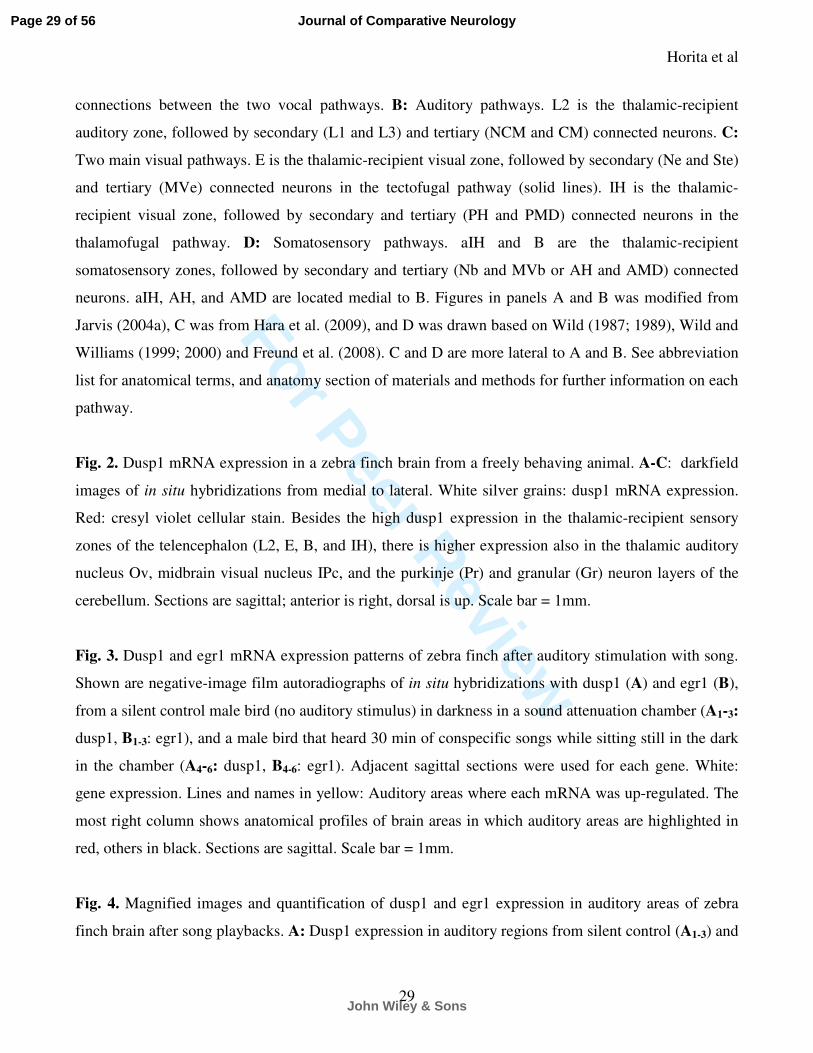
For Peer Review
Horita et al
29
connections between the two vocal pathways. B: Auditory pathways. L2 is the thalamic-recipient
auditory zone, followed by secondary (L1 and L3) and tertiary (NCM and CM) connected neurons. C:
Two main visual pathways. E is the thalamic-recipient visual zone, followed by secondary (Ne and Ste)
and tertiary (MVe) connected neurons in the tectofugal pathway (solid lines). IH is the thalamic-
recipient visual zone, followed by secondary and tertiary (PH and PMD) connected neurons in the
thalamofugal pathway. D: Somatosensory pathways. aIH and B are the thalamic-recipient
somatosensory zones, followed by secondary and tertiary (Nb and MVb or AH and AMD) connected
neurons. aIH, AH, and AMD are located medial to B. Figures in panels A and B was modified from
Jarvis (2004a), C was from Hara et al. (2009), and D was drawn based on Wild (1987; 1989), Wild and
Williams (1999; 2000) and Freund et al. (2008). C and D are more lateral to A and B. See abbreviation
list for anatomical terms, and anatomy section of materials and methods for further information on each
pathway.
Fig. 2. Dusp1 mRNA expression in a zebra finch brain from a freely behaving animal. A-C: darkfield
images of in situ hybridizations from medial to lateral. White silver grains: dusp1 mRNA expression.
Red: cresyl violet cellular stain. Besides the high dusp1 expression in the thalamic-recipient sensory
zones of the telencephalon (L2, E, B, and IH), there is higher expression also in the thalamic auditory
nucleus Ov, midbrain visual nucleus IPc, and the purkinje (Pr) and granular (Gr) neuron layers of the
cerebellum. Sections are sagittal; anterior is right, dorsal is up. Scale bar = 1mm.
Fig. 3. Dusp1 and egr1 mRNA expression patterns of zebra finch after auditory stimulation with song.
Shown are negative-image film autoradiographs of in situ hybridizations with dusp1 (A) and egr1 (B),
from a silent control male bird (no auditory stimulus) in darkness in a sound attenuation chamber (A1-3:
dusp1, B1-3: egr1), and a male bird that heard 30 min of conspecific songs while sitting still in the dark
in the chamber (A4-6: dusp1, B4-6: egr1). Adjacent sagittal sections were used for each gene. White:
gene expression. Lines and names in yellow: Auditory areas where each mRNA was up-regulated. The
most right column shows anatomical profiles of brain areas in which auditory areas are highlighted in
red, others in black. Sections are sagittal. Scale bar = 1mm.
Fig. 4. Magnified images and quantification of dusp1 and egr1 expression in auditory areas of zebra
finch brain after song playbacks. A: Dusp1 expression in auditory regions from silent control (A1-3) and
Page 29 of 56
John Wiley & Sons
Journal of Comparative Neurology
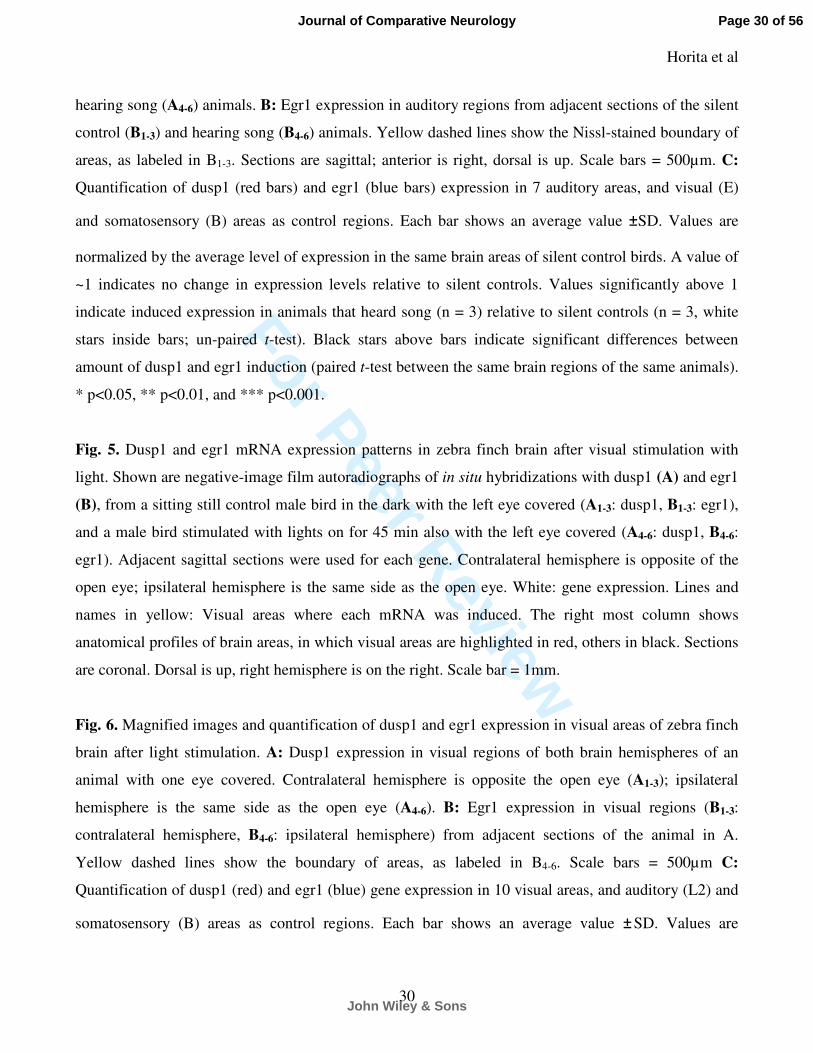
For Peer Review
Horita et al
30
hearing song (A4-6) animals. B: Egr1 expression in auditory regions from adjacent sections of the silent
control (B1-3) and hearing song (B4-6) animals. Yellow dashed lines show the Nissl-stained boundary of
areas, as labeled in B1-3. Sections are sagittal; anterior is right, dorsal is up. Scale bars = 500µm. C:
Quantification of dusp1 (red bars) and egr1 (blue bars) expression in 7 auditory areas, and visual (E)
and somatosensory (B) areas as control regions. Each bar shows an average value ±SD. Values are
normalized by the average level of expression in the same brain areas of silent control birds. A value of
~1 indicates no change in expression levels relative to silent controls. Values significantly above 1
indicate induced expression in animals that heard song (n = 3) relative to silent controls (n = 3, white
stars inside bars; un-paired t-test). Black stars above bars indicate significant differences between
amount of dusp1 and egr1 induction (paired t-test between the same brain regions of the same animals).
* p<0.05, ** p<0.01, and *** p<0.001.
Fig. 5. Dusp1 and egr1 mRNA expression patterns in zebra finch brain after visual stimulation with
light. Shown are negative-image film autoradiographs of in situ hybridizations with dusp1 (A) and egr1
(B), from a sitting still control male bird in the dark with the left eye covered (A1-3: dusp1, B1-3: egr1),
and a male bird stimulated with lights on for 45 min also with the left eye covered (A4-6: dusp1, B4-6:
egr1). Adjacent sagittal sections were used for each gene. Contralateral hemisphere is opposite of the
open eye; ipsilateral hemisphere is the same side as the open eye. White: gene expression. Lines and
names in yellow: Visual areas where each mRNA was induced. The right most column shows
anatomical profiles of brain areas, in which visual areas are highlighted in red, others in black. Sections
are coronal. Dorsal is up, right hemisphere is on the right. Scale bar = 1mm.
Fig. 6. Magnified images and quantification of dusp1 and egr1 expression in visual areas of zebra finch
brain after light stimulation. A: Dusp1 expression in visual regions of both brain hemispheres of an
animal with one eye covered. Contralateral hemisphere is opposite the open eye (A1-3); ipsilateral
hemisphere is the same side as the open eye (A4-6). B: Egr1 expression in visual regions (B1-3:
contralateral hemisphere, B4-6: ipsilateral hemisphere) from adjacent sections of the animal in A.
Yellow dashed lines show the boundary of areas, as labeled in B4-6. Scale bars = 500µm C:
Quantification of dusp1 (red) and egr1 (blue) gene expression in 10 visual areas, and auditory (L2) and
somatosensory (B) areas as control regions. Each bar shows an average value ±SD. Values are
Page 30 of 56
John Wiley & Sons
Journal of Comparative Neurology
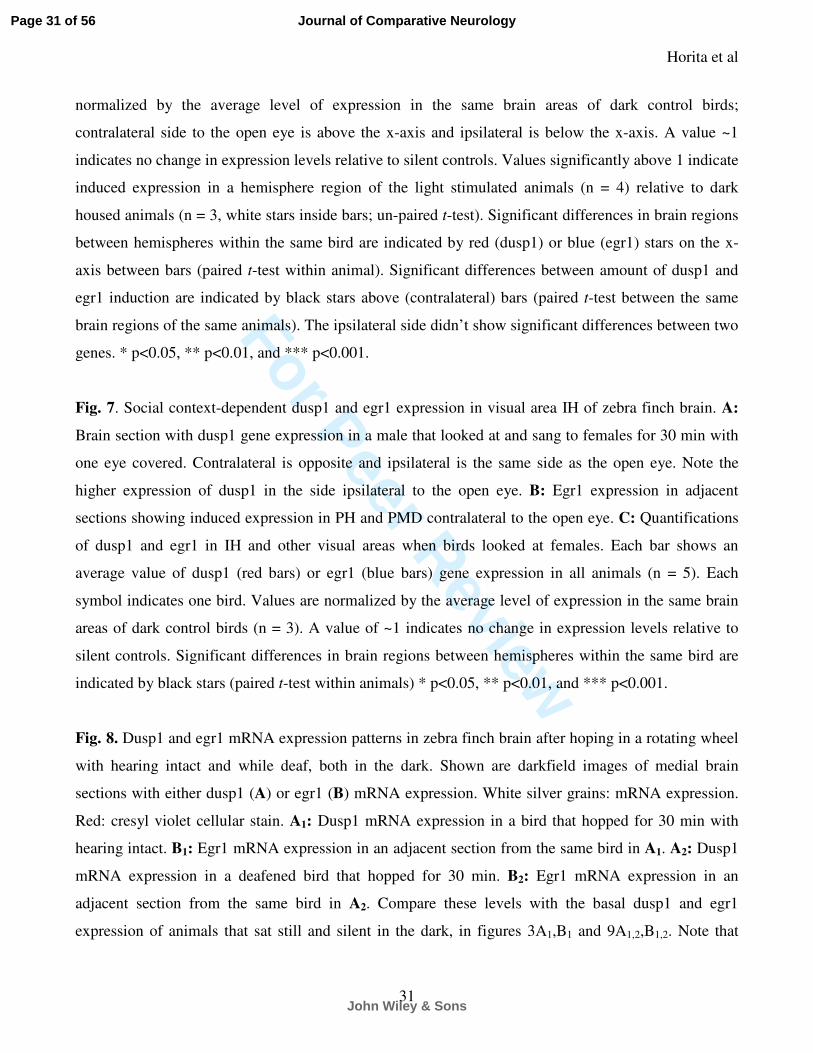
For Peer Review
Horita et al
31
normalized by the average level of expression in the same brain areas of dark control birds;
contralateral side to the open eye is above the x-axis and ipsilateral is below the x-axis. A value ~1
indicates no change in expression levels relative to silent controls. Values significantly above 1 indicate
induced expression in a hemisphere region of the light stimulated animals (n = 4) relative to dark
housed animals (n = 3, white stars inside bars; un-paired t-test). Significant differences in brain regions
between hemispheres within the same bird are indicated by red (dusp1) or blue (egr1) stars on the x-
axis between bars (paired t-test within animal). Significant differences between amount of dusp1 and
egr1 induction are indicated by black stars above (contralateral) bars (paired t-test between the same
brain regions of the same animals). The ipsilateral side didn’t show significant differences between two
genes. * p<0.05, ** p<0.01, and *** p<0.001.
Fig. 7. Social context-dependent dusp1 and egr1 expression in visual area IH of zebra finch brain. A:
Brain section with dusp1 gene expression in a male that looked at and sang to females for 30 min with
one eye covered. Contralateral is opposite and ipsilateral is the same side as the open eye. Note the
higher expression of dusp1 in the side ipsilateral to the open eye. B: Egr1 expression in adjacent
sections showing induced expression in PH and PMD contralateral to the open eye. C: Quantifications
of dusp1 and egr1 in IH and other visual areas when birds looked at females. Each bar shows an
average value of dusp1 (red bars) or egr1 (blue bars) gene expression in all animals (n = 5). Each
symbol indicates one bird. Values are normalized by the average level of expression in the same brain
areas of dark control birds (n = 3). A value of ~1 indicates no change in expression levels relative to
silent controls. Significant differences in brain regions between hemispheres within the same bird are
indicated by black stars (paired t-test within animals) * p<0.05, ** p<0.01, and *** p<0.001.
Fig. 8. Dusp1 and egr1 mRNA expression patterns in zebra finch brain after hoping in a rotating wheel
with hearing intact and while deaf, both in the dark. Shown are darkfield images of medial brain
sections with either dusp1 (A) or egr1 (B) mRNA expression. White silver grains: mRNA expression.
Red: cresyl violet cellular stain. A1: Dusp1 mRNA expression in a bird that hopped for 30 min with
hearing intact. B1: Egr1 mRNA expression in an adjacent section from the same bird in A1. A2: Dusp1
mRNA expression in a deafened bird that hopped for 30 min. B2: Egr1 mRNA expression in an
adjacent section from the same bird in A2. Compare these levels with the basal dusp1 and egr1
expression of animals that sat still and silent in the dark, in figures 3A1,B1 and 9A1,2,B1,2. Note that
Page 31 of 56
John Wiley & Sons
Journal of Comparative Neurology

For Peer Review
Horita et al
32
deafening eliminated the hopping induced dusp1 and egr1 expression in auditory areas (L2 for dusp1,
p<0.01; N-L2 for egr1, p<0.01), but not in somatosensory areas (aIH for dusp1, p = 0.634; AH and
AMD for egr1, p = 0.527) (n = 3/group; un-paired t-test). Difference in the red color in the anterior side
of the section in panel A1 was due to unintended variation in cresyl violet staining, and did not affect
the radioactive signal intensity. Scale bar = 1mm.
Fig. 9. dusp1 and egr1 mRNA expression patterns in zebra finch brain after hopping in a rotating wheel
when deaf. Shown are negative-image film autoradiographs of in situ hybridizations with dusp1 (A)
and egr1 (B), from a silent control hearing intact bird (sitting in the rotating wheel in the dark; A1-6:
dusp1, B1-6: egr1), and a hopping deaf bird (hopping for 30 min in the wheel in the dark; A7-12: dusp1,
B7-12: egr1). Adjacent sagittal sections were used for each gene. White: gene expression. Lines and
names in yellow: somatosensory areas where each mRNA was up-regulated. The most right column
shows anatomical profiles of brain areas, in which somatosensory areas are highlighted in red, putative
motor areas in light blue, and others in black. Scale bar = 1mm.
Fig. 10. Magnified images and quantification of dusp1 and egr1 expression in somatosensory areas and
several putative motor areas of zebra finch brain after hopping. A: Dusp1 expression in somatosensory
regions from a sitting still control male bird in the dark (A1,2), and a hopping deaf animal in the dark
(A3,4). B: Egr1 expression in adjacent sections of the sitting still control (B1,2) and the hopping deaf
(B3,4) animal. Yellow dashed lines show the boundary of areas, as labeled in B1,2. Sections are sagittal;
anterior is right, dorsal is up. Scale bars = 500µm C: Quantification of dusp1 (red bars) and egr1 (blue
bars) expression in 6 somatosensory areas, and auditory (L2) and visual (E) areas as controls. D:
Quantification of dusp1 (red bars) and egr1 (blue bars) expression in 4 motor-associated areas as
examples of regulation in the motor system. For (C) and (D), values are average expression levels in
hopping animals normalized by the average level in the same brain areas of sitting still control birds, ±
SD. A value of ~1 indicates no change in expression levels relative to controls. Values significantly
above 1 indicate induced expression in animals that hopped (n = 3) relative to still controls (n = 3,
white stars inside bars; un-paired t-test). Black stars above bars indicate significant differences between
amount of dusp1 and egr1 induction (paired t-test between the same brain regions of the same animals).
* p<0.05, ** p<0.01, and *** p<0.001.
Page 32 of 56
John Wiley & Sons
Journal of Comparative Neurology
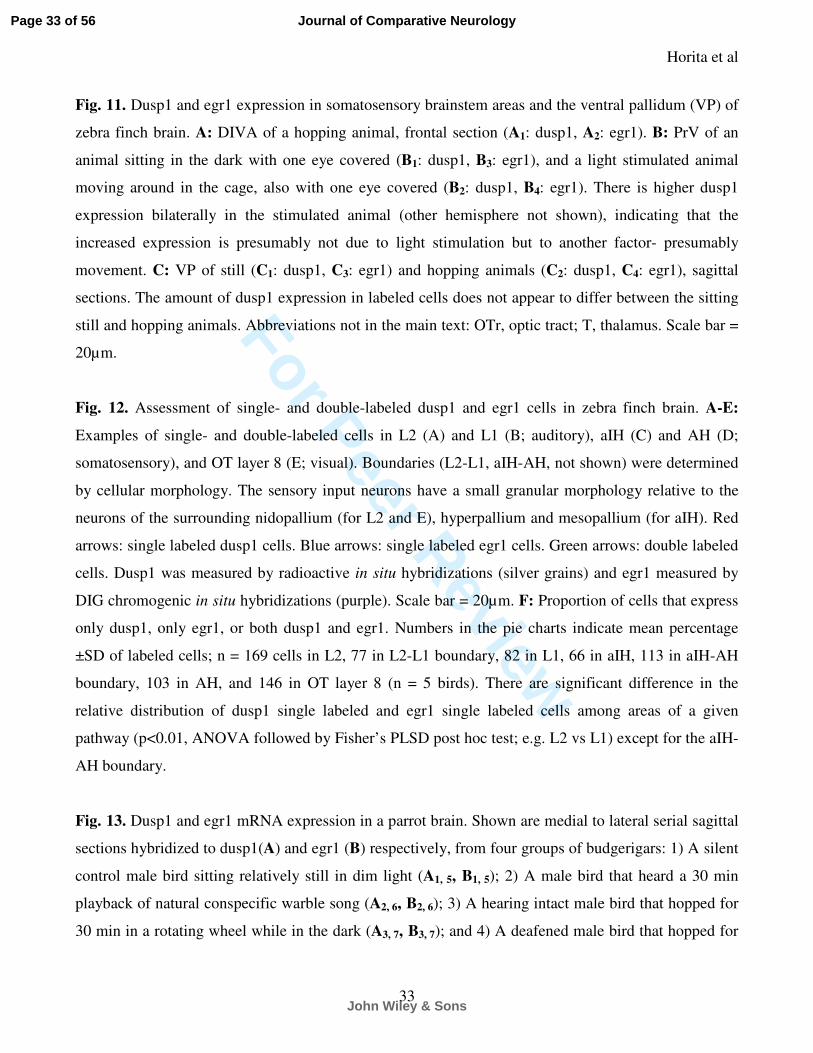
For Peer Review
Horita et al
33
Fig. 11. Dusp1 and egr1 expression in somatosensory brainstem areas and the ventral pallidum (VP) of
zebra finch brain. A: DIVA of a hopping animal, frontal section (A1: dusp1, A2: egr1). B: PrV of an
animal sitting in the dark with one eye covered (B1: dusp1, B3: egr1), and a light stimulated animal
moving around in the cage, also with one eye covered (B2: dusp1, B4: egr1). There is higher dusp1
expression bilaterally in the stimulated animal (other hemisphere not shown), indicating that the
increased expression is presumably not due to light stimulation but to another factor- presumably
movement. C: VP of still (C1: dusp1, C3: egr1) and hopping animals (C2: dusp1, C4: egr1), sagittal
sections. The amount of dusp1 expression in labeled cells does not appear to differ between the sitting
still and hopping animals. Abbreviations not in the main text: OTr, optic tract; T, thalamus. Scale bar =
20µm.
Fig. 12. Assessment of single- and double-labeled dusp1 and egr1 cells in zebra finch brain. A-E:
Examples of single- and double-labeled cells in L2 (A) and L1 (B; auditory), aIH (C) and AH (D;
somatosensory), and OT layer 8 (E; visual). Boundaries (L2-L1, aIH-AH, not shown) were determined
by cellular morphology. The sensory input neurons have a small granular morphology relative to the
neurons of the surrounding nidopallium (for L2 and E), hyperpallium and mesopallium (for aIH). Red
arrows: single labeled dusp1 cells. Blue arrows: single labeled egr1 cells. Green arrows: double labeled
cells. Dusp1 was measured by radioactive in situ hybridizations (silver grains) and egr1 measured by
DIG chromogenic in situ hybridizations (purple). Scale bar = 20µm. F: Proportion of cells that express
only dusp1, only egr1, or both dusp1 and egr1. Numbers in the pie charts indicate mean percentage
±SD of labeled cells; n = 169 cells in L2, 77 in L2-L1 boundary, 82 in L1, 66 in aIH, 113 in aIH-AH
boundary, 103 in AH, and 146 in OT layer 8 (n = 5 birds). There are significant difference in the
relative distribution of dusp1 single labeled and egr1 single labeled cells among areas of a given
pathway (p<0.01, ANOVA followed by Fisher’s PLSD post hoc test; e.g. L2 vs L1) except for the aIH-
AH boundary.
Fig. 13. Dusp1 and egr1 mRNA expression in a parrot brain. Shown are medial to lateral serial sagittal
sections hybridized to dusp1(A) and egr1 (B) respectively, from four groups of budgerigars: 1) A silent
control male bird sitting relatively still in dim light (A1, 5, B1, 5); 2) A male bird that heard a 30 min
playback of natural conspecific warble song (A2, 6, B2, 6); 3) A hearing intact male bird that hopped for
30 min in a rotating wheel while in the dark (A3, 7, B3, 7); and 4) A deafened male bird that hopped for
Page 33 of 56
John Wiley & Sons
Journal of Comparative Neurology

For Peer Review
Horita et al
34
30 min in the rotating wheel while in the dark (A4, 8, B4, 8). Note that deafening eliminated most of the
dusp1 and egr1 induction in caudal areas of the brain in the hopping animals. Yellow lines and names
indicate areas where each mRNA was up-regulated. C: Anatomical profiles of brain areas of medial
and lateral sections. D: quantifications of dusp1 (red bars) and egr1 (blue bars) gene expression in 6
somatosensory areas and the anterior cerebellum (Cb) of deaf hopping (n = 3) and sitting still (n = 3)
birds. For the quantifications, each bar shows an average value ±SD. Values are normalized by the
average level of expression in the same brain areas of sitting still control birds. A value of ~1 indicates
no change in expression levels relative to sitting still controls. Values significantly above 1 indicate
induced expression in animals that hopped relative to still control (white stars inside bars; un-paired t-
test). Black stars above bars indicate significant differences between amount of dusp1 and egr1
induction (paired t-test between the same regions of the same animals). * p<0.05, ** p<0.01, and ***
p<0.001. Scale bar = 1mm.
Fig. 14. Dusp1 and egr1 mRNA expression in Ring Doves. Shown are medial to lateral serial sagittal
brain sections hybridized to dusp1 (A) and egr1 (B) from two groups of doves: still- silent control male
birds sitting relatively still in the dark (A1-3, B1-3) and walking- deafened male bird that walked for 30
min in the rotating wheel while in the dark. Note that deafening eliminated most of the dusp1 and egr1
induction in auditory areas such as N-L2. Areas where each mRNA was induced are indicated by
yellow lines and names. The most right column shows anatomical profiles of brain areas. Scale bar =
2mm. C: Magnified images of dusp1 and egr1 expression in a portion of E, Ne, and MVe laterally
adjacent to B (highlighted by *) of a deafened ring dove, after walking in the dark. Scale bar = 1mm.
D: Quantification of dusp1 (red bars) and egr1 (blue bars) expression in 8 somatosensory areas (3 areas
E*, Ne*, MVe* were identified as putative somatosensory), the anterior cerebellum, and two auditory
areas of walking deaf birds. Each bar shows an average value ±SD. Values are normalized by the
average level of expression in the same brain areas of sitting still control birds. A value ~1 indicates no
change in expression levels relative to silent controls. Values significantly above 1 indicate induced
expression in animals that walked (n = 3) relative to still controls (n = 3, white stars inside bars; un-
paired t-test). Black stars above bars indicate significant differences between amount of dusp1 and egr1
induction (paired t-test between the same regions of the same animals). * p<0.05, ** p<0.01, and ***
p<0.001.
Page 34 of 56
John Wiley & Sons
Journal of Comparative Neurology
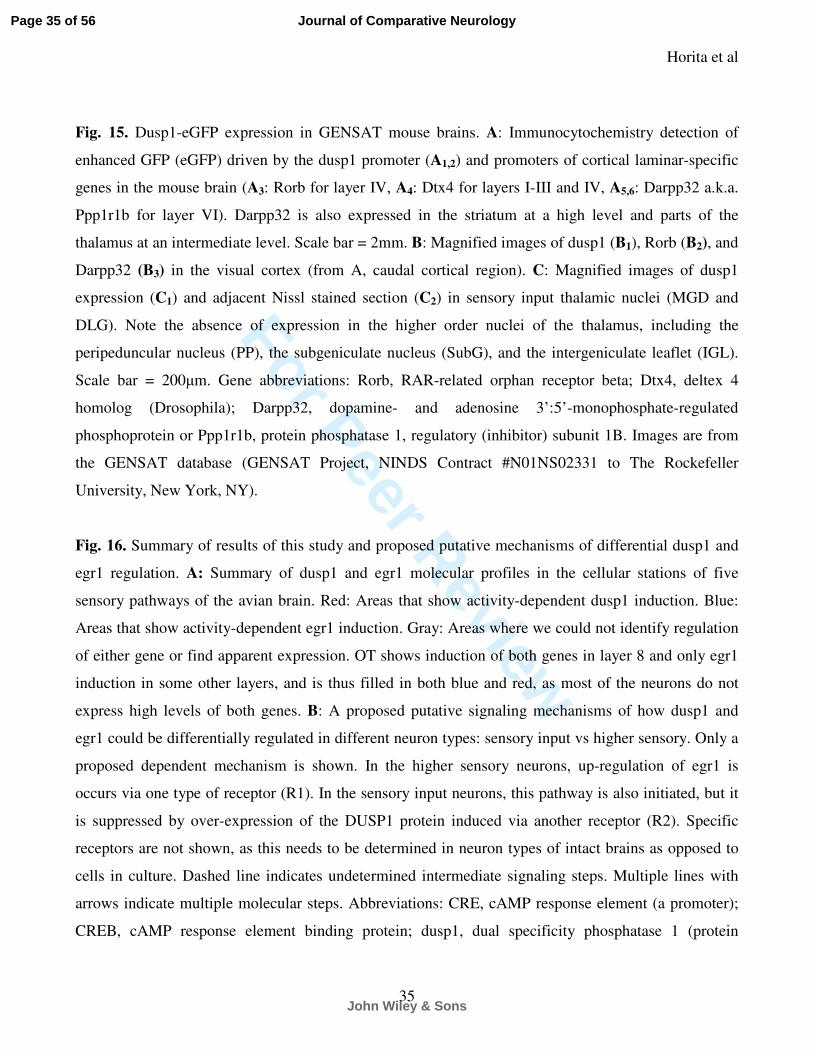
For Peer Review
Horita et al
35
Fig. 15. Dusp1-eGFP expression in GENSAT mouse brains. A: Immunocytochemistry detection of
enhanced GFP (eGFP) driven by the dusp1 promoter (A1,2) and promoters of cortical laminar-specific
genes in the mouse brain (A3: Rorb for layer IV, A4: Dtx4 for layers I-III and IV, A5,6: Darpp32 a.k.a.
Ppp1r1b for layer VI). Darpp32 is also expressed in the striatum at a high level and parts of the
thalamus at an intermediate level. Scale bar = 2mm. B: Magnified images of dusp1 (B1), Rorb (B2), and
Darpp32 (B3) in the visual cortex (from A, caudal cortical region). C: Magnified images of dusp1
expression (C1) and adjacent Nissl stained section (C2) in sensory input thalamic nuclei (MGD and
DLG). Note the absence of expression in the higher order nuclei of the thalamus, including the
peripeduncular nucleus (PP), the subgeniculate nucleus (SubG), and the intergeniculate leaflet (IGL).
Scale bar = 200µm. Gene abbreviations: Rorb, RAR-related orphan receptor beta; Dtx4, deltex 4
homolog (Drosophila); Darpp32, dopamine- and adenosine 3’:5’-monophosphate-regulated
phosphoprotein or Ppp1r1b, protein phosphatase 1, regulatory (inhibitor) subunit 1B. Images are from
the GENSAT database (GENSAT Project, NINDS Contract #N01NS02331 to The Rockefeller
University, New York, NY).
Fig. 16. Summary of results of this study and proposed putative mechanisms of differential dusp1 and
egr1 regulation. A: Summary of dusp1 and egr1 molecular profiles in the cellular stations of five
sensory pathways of the avian brain. Red: Areas that show activity-dependent dusp1 induction. Blue:
Areas that show activity-dependent egr1 induction. Gray: Areas where we could not identify regulation
of either gene or find apparent expression. OT shows induction of both genes in layer 8 and only egr1
induction in some other layers, and is thus filled in both blue and red, as most of the neurons do not
express high levels of both genes. B: A proposed putative signaling mechanisms of how dusp1 and
egr1 could be differentially regulated in different neuron types: sensory input vs higher sensory. Only a
proposed dependent mechanism is shown. In the higher sensory neurons, up-regulation of egr1 is
occurs via one type of receptor (R1). In the sensory input neurons, this pathway is also initiated, but it
is suppressed by over-expression of the DUSP1 protein induced via another receptor (R2). Specific
receptors are not shown, as this needs to be determined in neuron types of intact brains as opposed to
cells in culture. Dashed line indicates undetermined intermediate signaling steps. Multiple lines with
arrows indicate multiple molecular steps. Abbreviations: CRE, cAMP response element (a promoter);
CREB, cAMP response element binding protein; dusp1, dual specificity phosphatase 1 (protein
Page 35 of 56
John Wiley & Sons
Journal of Comparative Neurology

For Peer Review
Horita et al
36
capitalized); egr1, early growth response gene 1 (protein capitalized); ERK, extracellular signal-
regulated kinase; Elk1, Ets-domain transcription factor; MEK, MAP kinase kinase; P, phosphate; SRE,
serum response element (a promoter).
ACKNOWLEDGEMENTS
Research was supported by NIH R01DC7218 grant to EDJ, Grant-in-Aid for Scientific Research in
Japan, Takeda Science Foundation, and Kanae Foundation for promotion of medical science fellowship
to KW, and a Japan Student Services Organization fellowship to HH. We thank Gesa Feenders for use
of brain sections processed in the study of Feenders et al. (2008), and Masahiko Kobayashi for in situ
hybridization with dusp4 and sense probe of dusp1. We thank Dr. Kotaro Oka for critical reading of the
manuscript and supervision of HH, Maurice Anderson for animal care and breeding, and an anonymous
reviewer for pointing us to the GENSAT mice images.
LITERATURE CITED
Adret P, Margoliash D. 2002. Metabolic and neural activity in the song system nucleus robustus
archistriatalis: effect of age and gender. J Comp Neurol 454:409-423.
Bauer EE, Coleman MJ, Roberts TF, Roy A, Prather JF, Mooney R. 2008. A synaptic basis for
auditory-vocal integration in the songbird. J Neurosci 28:1509-1522.
Bengtson CP, Osborne PB. 2000. Electrophysiological properties of cholinergic and noncholinergic
neurons in the ventral pallidal region of the nucleus basalis in rat brain slices. J Neurophysiol
83:2649-2660.
Benowitz LI, Karten HJ. 1976. Organization of the tectofugal visual pathway in the pigeon: a
retrograde transport study. J Comp Neurol 167:503-520.
Bigalke-Kunz B, Rubsamen R, Dorrscheidt GJ. 1987. Tonotopic organization and functional
characterization of the auditory thalamus in a songbird, the European starling. J Comp Physiol
[A] 161:255-265.
Bisler S, Schleicher A, Gass P, Stehle JH, Zilles K, Staiger JF. 2002. Expression of c-Fos, ICER, Krox-
24 and JunB in the whisker-to-barrel pathway of rats: time course of induction upon whisker
stimulation by tactile exploration of an enriched environment. J Chem Neuroanat 23:187-198.
Boutros T, Chevet E, Metrakos P. 2008. Mitogen-activated protein (MAP) kinase/MAP kinase
phosphatase regulation: roles in cell growth, death, and cancer. Pharmacol Rev 60:261-310.
Braun K, Scheich H, Schachner M, Heizmann CW. 1985a. Distribution of parvalbumin, cytochrome
oxidase activity and 14C-2-deoxyglucose uptake in the brain of the zebra finch. I. Auditory and
vocal motor systems. Cell Tissue Res 240:101-115.
Braun K, Scheich H, Schachner M, Heizmann CW. 1985b. Distribution of parvalbumin, cytochrome
oxidase activity and 14C-2-deoxyglucose uptake in the brain of the zebra finch. II. Visual
system. Cell Tissue Res 240:117-127.
Page 36 of 56
John Wiley & Sons
Journal of Comparative Neurology

For Peer Review
Horita et al
37
Cardin JA, Raksin JN, Schmidt MF. 2005. Sensorimotor nucleus NIf is necessary for auditory
processing but not vocal motor output in the avian song system. J Neurophysiol 93:2157-2166.
Cardin JA, Schmidt MF. 2004. Auditory responses in multiple sensorimotor song system nuclei are co-
modulated by behavioral state. J Neurophysiol 91:2148-2163.
Cheng HY, Clayton DF. 2004. Activation and habituation of extracellular signal-regulated kinase
phosphorylation in zebra finch auditory forebrain during song presentation. J Neurosci 24:7503-
7513.
Chew SJ, Mello C, Nottebohm F, Jarvis E, Vicario DS. 1995. Decrements in auditory responses to a
repeated conspecific song are long-lasting and require two periods of protein synthesis in the
songbird forebrain. Proc Natl Acad Sci U S A 92:3406-3410.
Clayton DF. 2004. Songbird genomics: methods, mechanisms, opportunities, and pitfalls. Ann N Y
Acad Sci 1016:45-60.
Csillag A, Montagnese CM. 2005. Thalamotelencephalic organization in birds. Brain Res Bull 66:303-
310.
Deng C, Rogers LJ. 1998a. Bilaterally projecting neurons in the two visual pathways of chicks. Brain
Res 794:281-290.
Deng C, Rogers LJ. 1998b. Organisation of the tectorotundal and SP/IPS-rotundal projections in the
chick. J Comp Neurol 394:171-185.
Di Benedetto B, Hitz C, Holter SM, Kuhn R, Vogt Weisenhorn DM, Wurst W. 2007. Differential
mRNA distribution of components of the ERK/MAPK signalling cascade in the adult mouse
brain. J Comp Neurol 500:542-556.
Doi M, Cho S, Yujnovsky I, Hirayama J, Cermakian N, Cato AC, Sassone-Corsi P. 2007. Light-
inducible and clock-controlled expression of MAP kinase phosphatase 1 in mouse central
pacemaker neurons. J Biol Rhythms 22:127-139.
Doupe AJ, Perkel DJ, Reiner A, Stern EA. 2005. Birdbrains could teach basal ganglia research a new
song. Trends Neurosci 28:353-363.
Farooq A, Zhou MM. 2004. Structure and regulation of MAPK phosphatases. Cell Signal 16:769-779.
Feenders G, Liedvogel M, Rivas M, Zapka M, Horita H, Hara E, Wada K, Mouritsen H, Jarvis ED.
2008. Molecular mapping of movement-associated areas in the avian brain: a motor theory for
vocal learning origin. PLoS ONE 3:e1768.
Flavell SW, Greenberg ME. 2008. Signaling mechanisms linking neuronal activity to gene expression
and plasticity of the nervous system. Annu Rev Neurosci 31:563-590.
Freund N, Gunturkun O, Manns M. 2008. A morphological study of the nucleus subpretectalis of the
pigeon. Brain Res Bull 75:491-493.
Gerfen CR. 2000. Molecular effects of dopamine on striatal-projection pathways. Trends Neurosci
23:S64-70.
Gong S, Zheng C, Doughty ML, Losos K, Didkovsky N, Schambra UB, Nowak NJ, Joyner A, Leblanc
G, Hatten ME, Heintz N. 2003. A gene expression atlas of the central nervous system based on
bacterial artificial chromosomes. Nature 425:917-925.
Greenberg ME, Hermanowski AL, Ziff EB. 1986. Effect of protein synthesis inhibitors on growth
factor activation of c-fos, c-myc, and actin gene transcription. Mol Cell Biol 6:1050-1057.
Guillery RW, Herrup K. 1997. Quantification without pontification: choosing a method for counting
objects in sectioned tissues. J Comp Neurol 386:2-7.
Gunturkun O, Hellmann B, Melsbach G, Prior H. 1998. Asymmetries of representation in the visual
system of pigeons. Neuroreport 9:4127-4130.
Page 37 of 56
John Wiley & Sons
Journal of Comparative Neurology
For Peer Review
Horita et al
38
Guzowski JF, Timlin JA, Roysam B, McNaughton BL, Worley PF, Barnes CA. 2005. Mapping
behaviorally relevant neural circuits with immediate-early gene expression. Curr Opin
Neurobiol 15:599-606.
Hara E, Kubikova L, Hessler NA, Jarvis ED. 2009. Assessing visual requirements for social context-
dependent activation of the songbird song system. Proc Biol Sci 276:279-289.
Heyers D, Manns M, Luksch H, Gunturkun O, Mouritsen H. 2008. Calcium-binding proteins label
functional streams of the visual system in a songbird. Brain Res Bull 75:348-355.
Hu S, Ying Z, Gomez-Pinilla F, Frautschy SA. 2009. Exercise can increase small heat shock proteins
(sHSP) and pre- and post-synaptic proteins in the hippocampus. Brain Res 1249:191-201.
Jarvis ED. 2004a. Brains and birdsong. In: Marler P, Slabbekoorn H, editors. Nature's Music: The
Science of BirdSong. San Diego: Elsevier-Academic Press. p 226-271.
Jarvis ED. 2004b. Learned birdsong and the neurobiology of human language. Ann N Y Acad Sci
1016:749-777.
Jarvis ED. 2009. Evolution of the Pallium in Birds and Reptiles. In: Binder MD, Hirokawa N,
Windhorst U, Butler As-e, editors. Encyclopedia of Neuroscience. Berlin: Springer-Verlag
GmbH. p 1390-1400.
Jarvis ED, Gunturkun O, Bruce L, Csillag A, Karten H, Kuenzel W, Medina L, Paxinos G, Perkel DJ,
Shimizu T, Striedter G, Wild JM, Ball GF, Dugas-Ford J, Durand SE, Hough GE, Husband S,
Kubikova L, Lee DW, Mello CV, Powers A, Siang C, Smulders TV, Wada K, White SA,
Yamamoto K, Yu J, Reiner A, Butler AB. 2005. Avian brains and a new understanding of
vertebrate brain evolution. Nat Rev Neurosci 6:151-159.
Jarvis ED, Mello CV. 2000. Molecular mapping of brain areas involved in parrot vocal communication.
J Comp Neurol 419:1-31.
Jarvis ED, Scharff C, Grossman MR, Ramos JA, Nottebohm F. 1998. For whom the bird sings:
context-dependent gene expression. Neuron 21:775-788.
Jarvis ED, Nottebohm F. 1997. Motor-driven gene expression. Proc Natl Acad Sci U S A 94:4097-
4102.
Kaczmarek L, Chaudhuri A. 1997. Sensory regulation of immediate-early gene expression in
mammalian visual cortex: implications for functional mapping and neural plasticity. Brain Res
Brain Res Rev 23:237-256.
Karten HJ. 1991. Homology and evolutionary origins of the 'neocortex'. Brain Behav Evol 38:264-272.
Kerner JA, Standaert DG, Penney JB, Jr., Young AB, Landwehrmeyer GB. 1998. Simultaneous
isotopic and nonisotopic in situ hybridization histochemistry with cRNA probes. Brain Res
Brain Res Protoc 3:22-32.
Knapska E, Kaczmarek L. 2004. A gene for neuronal plasticity in the mammalian brain: Zif268/Egr-
1/NGFI-A/Krox-24/TIS8/ZENK? Prog Neurobiol 74:183-211.
Kodama M, Russell DS, Duman RS. 2005. Electroconvulsive seizures increase the expression of MAP
kinase phosphatases in limbic regions of rat brain. Neuropsychopharmacology 30:360-371.
Kubikova L, Wada K, Jarvis ED. in press. Dopamine receptors in a songbird brain. J Comp Neurol
Liu Y, Shepherd EG, Nelin LD. 2007. MAPK phosphatases--regulating the immune response. Nat Rev
Immunol 7:202-212.
Machado HB, Vician LJ, Herschman HR. 2008. The MAPK pathway is required for depolarization-
induced "promiscuous" immediate-early gene expression but not for depolarization-restricted
immediate-early gene expression in neurons. J Neurosci Res 86:593-602.
Maczko KA, Knudsen PF, Knudsen EI. 2006. Auditory and visual space maps in the cholinergic
nucleus isthmi pars parvocellularis of the barn owl. J Neurosci 26:12799-12806.
Page 38 of 56
John Wiley & Sons
Journal of Comparative Neurology

For Peer Review
Horita et al
39
Manger PR, Elston GN, Pettigrew JD. 2002. Multiple maps and activity-dependent representational
plasticity in the anterior Wulst of the adult barn owl (Tyto alba). Eur J Neurosci 16:743-750.
Mello CV, Clayton DF. 1994. Song-induced ZENK gene expression in auditory pathways of songbird
brain and its relation to the song control system. J Neurosci 14:6652-6666.
Mello CV, Clayton DF. 1995. Differential induction of the ZENK gene in the avian forebrain and song
control circuit after metrazole-induced depolarization. J Neurobiol 26:145-161.
Mello CV, Jarvis ED. 2008. Behavior-dependent expression of inducible genes in vocal learning birds.
In: Zeigler HP, Marler P, editors. Neuroscience of Birdsong: Cambridge University Press. p
381-397.
Mello CV, Vates GE, Okuhata S, Nottebohm F. 1998. Descending auditory pathways in the adult male
zebra finch (Taeniopygia guttata). J Comp Neurol 395:137-160.
Mello CV, Vicario DS, Clayton DF. 1992. Song presentation induces gene expression in the songbird
forebrain. Proc Natl Acad Sci U S A 89:6818-6822.
Miceli D, Reperant J. 1982. Thalamo-hyperstriatal projections in the pigeon (Columbia livia) as
demonstrated by retrograde double-labeling with fluorescent tracers. Brain Res 245:365-371.
Molyneaux BJ, Arlotta P, Menezes JR, Macklis JD. 2007. Neuronal subtype specification in the
cerebral cortex. Nat Rev Neurosci 8:427-437.
Mouritsen H, Feenders G, Liedvogel M, Wada K, Jarvis ED. 2005. Night-vision brain area in
migratory songbirds. Proc Natl Acad Sci U S A 102:8339-8344.
Nambu A. 2008. Seven problems on the basal ganglia. Curr Opin Neurobiol.
Nottebohm F. 1972. The origins of vocal learning. American Naturalist 106:116-140.
Person AL, Gale SD, Farries MA, Perkel DJ. 2008. Organization of the songbird basal ganglia,
including area X. J Comp Neurol 508:840-866.
Pinaud R, Osorio C, Alzate O, Jarvis ED. 2008. Profiling of experience-regulated proteins in the
songbird auditory forebrain using quantitative proteomics. Eur J Neurosci 27:1409-1422.
Pinaud R, Vargas CD, Ribeiro S, Monteiro MV, Tremere LA, Vianney P, Delgado P, Mello CV,
Rocha-Miranda CE, Volchan E. 2003. Light-induced Egr-1 expression in the striate cortex of
the opossum. Brain Res Bull 61:139-146.
Pizzio GA, Golombek DA. 2008. Photic regulation of map kinase phosphatases MKP1/2 and MKP3 in
the hamster suprachiasmatic nuclei. J Mol Neurosci 34:187-192.
Qian Z, Gilbert M, Kandel ER. 1994. Temporal and spatial regulation of the expression of BAD2, a
MAP kinase phosphatase, during seizure, kindling, and long-term potentiation. Learn Mem
1:180-188.
Reiner A, Perkel DJ, Bruce LL, Butler AB, Csillag A, Kuenzel W, Medina L, Paxinos G, Shimizu T,
Striedter G, Wild M, Ball GF, Durand S, Guturkun O, Lee DW, Mello CV, Powers A, White
SA, Hough G, Kubikova L, Smulders TV, Wada K, Dugas-Ford J, Husband S, Yamamoto K,
Yu J, Siang C, Jarvis ED. 2004. Revised nomenclature for avian telencephalon and some related
brainstem nuclei. Journal of Comparative Neurology 473:377-414.
Roberts TF, Brauth SE, Hall WS. 2001. Distribution of iron in the parrot brain: conserved (pallidal) and
derived (nigral) labeling patterns. Brain Res 921:138-149.
Rossler OG, Henss I, Thiel G. 2008. Transcriptional response to muscarinic acetylcholine receptor
stimulation: regulation of Egr-1 biosynthesis by ERK, Elk-1, MKP-1, and calcineurin in
carbachol-stimulated human neuroblastoma cells. Arch Biochem Biophys 470:93-102.
Sgambato V, Pages C, Rogard M, Besson MJ, Caboche J. 1998. Extracellular signal-regulated kinase
(ERK) controls immediate early gene induction on corticostriatal stimulation. J Neurosci
18:8814-8825.
Page 39 of 56
John Wiley & Sons
Journal of Comparative Neurology

For Peer Review
Horita et al
40
Shipp S. 2007. Structure and function of the cerebral cortex. Curr Biol 17:R443-449.
Soares JG, Pereira AC, Botelho EP, Pereira SS, Fiorani M, Gattass R. 2005. Differential expression of
Zif268 and c-Fos in the primary visual cortex and lateral geniculate nucleus of normal Cebus
monkeys and after monocular lesions. J Comp Neurol 482:166-175.
Takahata T, Higo N, Kaas JH, Yamamori T. 2009. Expression of immediate-early genes reveals
functional compartments within ocular dominance columns after brief monocular inactivation.
Proc Natl Acad Sci U S A 106:12151-12155.
Takaki M, Ujike H, Kodama M, Takehisa Y, Nakata K, Kuroda S. 2001. Two kinds of mitogen-
activated protein kinase phosphatases, MKP-1 and MKP-3, are differentially activated by acute
and chronic methamphetamine treatment in the rat brain. J Neurochem 79:679-688.
Theiss MP, Hellmann B, Gunturkun O. 2003. The architecture of an inhibitory sidepath within the
avian tectofugal system. Neuroreport 14:879-882.
Thompson I. 2000. Cortical development: Binocular plasticity turned outside-in. Current Biology
10:R348-R350.
Tischmeyer W, Grimm R. 1999. Activation of immediate early genes and memory formation. Cell Mol
Life Sci 55:564-574.
Velho TA, Pinaud R, Rodrigues PV, Mello CV. 2005. Co-induction of activity-dependent genes in
songbirds. Eur J Neurosci 22:1667-1678.
Wada K, Howard JT, McConnell P, Whitney O, Lints T, Rivas MV, Horita H, Patterson MA, White
SA, Scharff C, Haesler S, Zhao S, Sakaguchi H, Hagiwara M, Shiraki T, Hirozane-Kishikawa T,
Skene P, Hayashizaki Y, Carninci P, Jarvis ED. 2006. A molecular neuroethological approach
for identifying and characterizing a cascade of behaviorally regulated genes. Proc Natl Acad Sci
U S A 103:15212-15217.
Wada K, Sakaguchi H, Jarvis ED, Hagiwara M. 2004. Differential expression of glutamate receptors in
avian neural pathways for learned vocalization. J Comp Neurol 476:44-64.
Warren WC, Clayton DF, Ellegren H, Arnold
, AP, Hillier
LW, Kunstner
A, Searle
S, White
S, Vilella
AJ, Fairley S, Heger
A, Kong
L, Ponting
CP, Jarvis
ED, et al. 2010. The genome of a songbird.
Nature (in press).
Weidner C, Reperant J, Miceli D, Haby M, Rio JP. 1985. An anatomical study of ipsilateral retinal
projections in the quail using radioautographic, horseradish peroxidase, fluorescence and
degeneration techniques. Brain Res 340:99-108.
Wild JM. 1987. The avian somatosensory system: connections of regions of body representation in the
forebrain of the pigeon. Brain Res 412:205-223.
Wild JM. 1989. Avian somatosensory system: II. Ascending projections of the dorsal column and
external cuneate nuclei in the pigeon. J Comp Neurol 287:1-18.
Wild JM, Farabaugh SM. 1996. Organization of afferent and efferent projections of the nucleus basalis
prosencephali in a passerine, Taeniopygia guttata. J Comp Neurol 365:306-328.
Wild JM, Williams MN. 1999. Rostral wulst of passerine birds: II. Intratelencephalic projections to
nuclei associated with the auditory and song systems. J Comp Neurol 413:520-534.
Wild JM, Williams MN. 2000. Rostral wulst in passerine birds. I. Origin, course, and terminations of
an avian pyramidal tract. J Comp Neurol 416:429-450.
Young WS, 3rd. 1989. Simultaneous use of digoxigenin- and radiolabeled oligodeoxyribonucleotide
probes for hybridization histochemistry. Neuropeptides 13:271-275.
Zeigler HP, Bischof H-J. 1993. Vision, brain, and behavior in birds. Cambridge, MA: MIT Press. xxiii,
415 p. p.
Page 40 of 56
John Wiley & Sons
Journal of Comparative Neurology

For Peer Review
Fig. 1. Schematic diagrams of songbird brain areas involved in singing, hearing, vision, and somatic
sensation. A: Song system. Black solid arrows: vocal motor pathway (from HVC to RA to brainstem motor nuclei) and vocal pallial-basal ganglia-thalamic loop (Area X-DLM-LMAN); dashed arrows: connections between the two vocal pathways. B: Auditory pathways. L2 is the thalamic-recipient
auditory zone, followed by secondary (L1 and L3) and tertiary (NCM and CM) connected neurons. C: Two main visual pathways. E is the thalamic-recipient visual zone, followed by secondary (Ne and
Ste) and tertiary (MVe) connected neurons in the tectofugal pathway (solid lines). IH is the thalamic-recipient visual zone, followed by secondary and tertiary (PH and PMD) connected neurons in the thalamofugal pathway. D: Somatosensory pathways. aIH and B are the thalamic-recipient somatosensory zones, followed by secondary and tertiary (Nb and MVb or AH and AMD) connected neurons. aIH, AH, and AMD are located medial to B. Figures in panels A and B was modified from Jarvis (2004a), C was from Hara et al. (2009), and D was drawn based on Wild (1987; 1989), Wild
and Williams (1999; 2000) and Freund et al. (2008). C and D are more lateral to A and B. See abbreviation list for anatomical terms, and anatomy section of materials and methods for further
information on each pathway. 112x98mm (453 x 453 DPI)
Page 41 of 56
John Wiley & Sons
Journal of Comparative Neurology

For Peer Review
Fig. 2. Dusp1 mRNA expression in a zebra finch brain from a freely behaving animal. A-C: darkfield images of in situ hybridizations from medial to lateral. White silver grains: dusp1 mRNA expression. Red: cresyl violet cellular stain. Besides the high dusp1 expression in the thalamic-recipient sensory
zones of the telencephalon (L2, E, B, and IH), there is higher expression also in the thalamic auditory nucleus Ov, midbrain visual nucleus IPc, and the purkinje (Pr) and granular (Gr) neuron layers of the cerebellum. Sections are sagittal; anterior is right, dorsal is up. Scale bar = 1mm.
104x58mm (300 x 300 DPI)
Page 42 of 56
John Wiley & Sons
Journal of Comparative Neurology

For Peer Review
Fig. 3. Dusp1 and egr1 mRNA expression patterns of zebra finch after auditory stimulation with song. Shown are negative-image film autoradiographs of in situ hybridizations with dusp1 (A) and egr1 (B), from a silent control male bird (no auditory stimulus) in darkness in a sound attenuation chamber (A1-3: dusp1, B1-3: egr1), and a male bird that heard 30 min of conspecific songs while
sitting still in the dark in the chamber (A4-6: dusp1, B4-6: egr1). Adjacent sagittal sections were used for each gene. White: gene expression. Lines and names in yellow: Auditory areas where each mRNA was up-regulated. The most right column shows anatomical profiles of brain areas in which
auditory areas are highlighted in red, others in black. Sections are sagittal. Scale bar = 1mm. 175x91mm (363 x 363 DPI)
Page 43 of 56
John Wiley & Sons
Journal of Comparative Neurology

For Peer Review
Fig. 4. Magnified images and quantification of dusp1 and egr1 expression in auditory areas of zebra finch brain after song playbacks. A: Dusp1 expression in auditory regions from silent control (A1-3) and hearing song (A4-6) animals. B: Egr1 expression in auditory regions from adjacent sections of
the silent control (B1-3) and hearing song (B4-6) animals. Yellow dashed lines show the Nissl-stained boundary of areas, as labeled in B1-3. Sections are sagittal; anterior is right, dorsal is up. Scale bars = 500µm. C: Quantification of dusp1 (red bars) and egr1 (blue bars) expression in 7
auditory areas, and visual (E) and somatosensory (B) areas as control regions. Each bar shows an average value ±SD. Values are normalized by the average level of expression in the same brain
areas of silent control birds. A value of ~1 indicates no change in expression levels relative to silent controls. Values significantly above 1 indicate induced expression in animals that heard song (n = 3)
relative to silent controls (n = 3, white stars inside bars; un-paired t-test). Black stars above bars indicate significant differences between amount of dusp1 and egr1 induction (paired t-test between
Page 44 of 56
John Wiley & Sons
Journal of Comparative Neurology

For Peer Review
the same brain regions of the same animals). * p<0.05, ** p<0.01, and *** p<0.001. 168x225mm (317 x 317 DPI)
Page 45 of 56
John Wiley & Sons
Journal of Comparative Neurology

For Peer Review
Fig. 5. Dusp1 and egr1 mRNA expression patterns in zebra finch brain after visual stimulation with light. Shown are negative-image film autoradiographs of in situ hybridizations with dusp1 (A) and egr1 (B), from a sitting still control male bird in the dark with the left eye covered (A1-3: dusp1,
B1-3: egr1), and a male bird stimulated with lights on for 45 min also with the left eye covered (A4-6: dusp1, B4-6: egr1). Adjacent sagittal sections were used for each gene. Contralateral
hemisphere is opposite of the open eye; ipsilateral hemisphere is the same side as the open eye. White: gene expression. Lines and names in yellow: Visual areas where each mRNA was induced.
The right most column shows anatomical profiles of brain areas, in which visual areas are highlighted in red, others in black. Sections are coronal. Dorsal is up, right hemisphere is on the
right. Scale bar = 1mm. 185x91mm (377 x 377 DPI)
Page 46 of 56
John Wiley & Sons
Journal of Comparative Neurology

For Peer Review
Fig. 6. Magnified images and quantification of dusp1 and egr1 expression in visual areas of zebra finch brain after light stimulation. A: Dusp1 expression in visual regions of both brain hemispheres
of an animal with one eye covered. Contralateral hemisphere is opposite the open eye (A1-3); ipsilateral hemisphere is the same side as the open eye (A4-6). B: Egr1 expression in visual regions (B1-3: contralateral hemisphere, B4-6: ipsilateral hemisphere) from adjacent sections of the animal in A. Yellow dashed lines show the boundary of areas, as labeled in B4-6. Scale bars = 500µm C:
Quantification of dusp1 (red) and egr1 (blue) gene expression in 10 visual areas, and auditory (L2) and somatosensory (B) areas as control regions. Each bar shows an average value ±SD. Values are
normalized by the average level of expression in the same brain areas of dark control birds; contralateral side to the open eye is above the x-axis and ipsilateral is below the x-axis. A value ~1
indicates no change in expression levels relative to silent controls. Values significantly above 1 indicate induced expression in a hemisphere region of the light stimulated animals (n = 4) relative to dark housed animals (n = 3, white stars inside bars; un-paired t-test). Significant differences in
brain regions between hemispheres within the same bird are indicated by red (dusp1) or blue (egr1) stars on the x-axis between bars (paired t-test within animal). Significant differences between
Page 47 of 56
John Wiley & Sons
Journal of Comparative Neurology

For Peer Review
amount of dusp1 and egr1 induction are indicated by black stars above (contralateral) bars (paired t-test between the same brain regions of the same animals). The ipsilateral side didn’t show
significant differences between two genes. * p<0.05, ** p<0.01, and *** p<0.001. 178x200mm (300 x 300 DPI)
Page 48 of 56
John Wiley & Sons
Journal of Comparative Neurology

For Peer Review
Fig. 7. Social context-dependent dusp1 and egr1 expression in visual area IH of zebra finch brain. A: Brain section with dusp1 gene expression in a male that looked at and sang to females for 30
min with one eye covered. Contralateral is opposite and ipsilateral is the same side as the open eye.
Note the higher expression of dusp1 in the side ipsilateral to the open eye. B: Egr1 expression in adjacent sections showing induced expression in PH and PMD contralateral to the open eye. C:
Quantifications of dusp1 and egr1 in IH and other visual areas when birds looked at females. Each bar shows an average value of dusp1 (red bars) or egr1 (blue bars) gene expression in all animals
(n = 5). Each symbol indicates one bird. Values are normalized by the average level of expression in the same brain areas of dark control birds (n = 3). A value of ~1 indicates no change in expression levels relative to silent controls. Significant differences in brain regions between hemispheres within the same bird are indicated by black stars (paired t-test within animals) * p<0.05, ** p<0.01, and
*** p<0.001. 168x71mm (319 x 319 DPI)
Page 49 of 56
John Wiley & Sons
Journal of Comparative Neurology
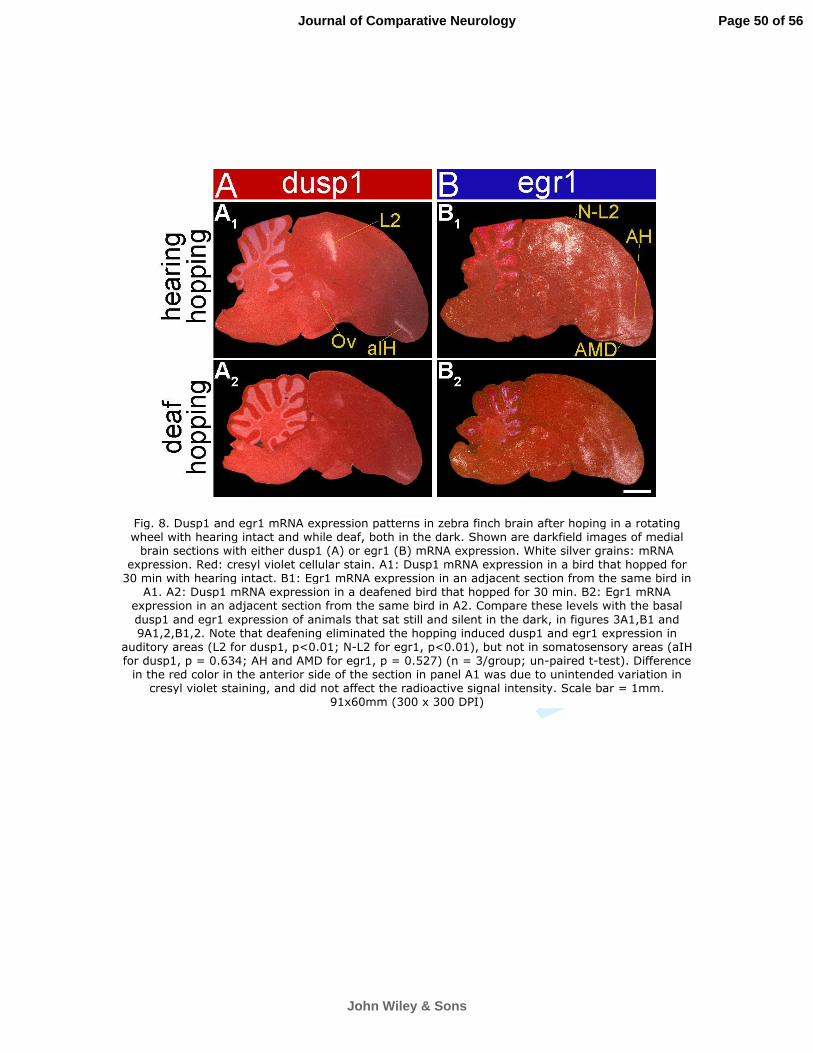
For Peer Review
Fig. 8. Dusp1 and egr1 mRNA expression patterns in zebra finch brain after hoping in a rotating wheel with hearing intact and while deaf, both in the dark. Shown are darkfield images of medial
brain sections with either dusp1 (A) or egr1 (B) mRNA expression. White silver grains: mRNA expression. Red: cresyl violet cellular stain. A1: Dusp1 mRNA expression in a bird that hopped for
30 min with hearing intact. B1: Egr1 mRNA expression in an adjacent section from the same bird in A1. A2: Dusp1 mRNA expression in a deafened bird that hopped for 30 min. B2: Egr1 mRNA
expression in an adjacent section from the same bird in A2. Compare these levels with the basal
dusp1 and egr1 expression of animals that sat still and silent in the dark, in figures 3A1,B1 and 9A1,2,B1,2. Note that deafening eliminated the hopping induced dusp1 and egr1 expression in
auditory areas (L2 for dusp1, p<0.01; N-L2 for egr1, p<0.01), but not in somatosensory areas (aIH for dusp1, p = 0.634; AH and AMD for egr1, p = 0.527) (n = 3/group; un-paired t-test). Difference
in the red color in the anterior side of the section in panel A1 was due to unintended variation in cresyl violet staining, and did not affect the radioactive signal intensity. Scale bar = 1mm.
91x60mm (300 x 300 DPI)
Page 50 of 56
John Wiley & Sons
Journal of Comparative Neurology

For Peer Review
Fig. 9. dusp1 and egr1 mRNA expression patterns in zebra finch brain after hopping in a rotating wheel when deaf. Shown are negative-image film autoradiographs of in situ hybridizations with
dusp1 (A) and egr1 (B), from a silent control hearing intact bird (sitting in the rotating wheel in the dark; A1-6: dusp1, B1-6: egr1), and a hopping deaf bird (hopping for 30 min in the wheel in the
dark; A7-12: dusp1, B7-12: egr1). Adjacent sagittal sections were used for each gene. White: gene
expression. Lines and names in yellow: somatosensory areas where each mRNA was up-regulated. The most right column shows anatomical profiles of brain areas, in which somatosensory areas are
highlighted in red, putative motor areas in light blue, and others in black. Scale bar = 1mm. 179x158mm (387 x 387 DPI)
Page 51 of 56
John Wiley & Sons
Journal of Comparative Neurology

For Peer Review
Fig. 10. Magnified images and quantification of dusp1 and egr1 expression in somatosensory areas and several putative motor areas of zebra finch brain after hopping. A: Dusp1 expression in
somatosensory regions from a sitting still control male bird in the dark (A1,2), and a hopping deaf animal in the dark (A3,4). B: Egr1 expression in adjacent sections of the sitting still control (B1,2) and the hopping deaf (B3,4) animal. Yellow dashed lines show the boundary of areas, as labeled in B1,2. Sections are sagittal; anterior is right, dorsal is up. Scale bars = 500µm C: Quantification of dusp1 (red bars) and egr1 (blue bars) expression in 6 somatosensory areas, and auditory (L2) and
visual (E) areas as controls. D: Quantification of dusp1 (red bars) and egr1 (blue bars) expression in 4 motor-associated areas as examples of regulation in the motor system. For (C) and (D), values are average expression levels in hopping animals normalized by the average level in the same brain
areas of sitting still control birds, ±SD. A value of ~1 indicates no change in expression levels relative to controls. Values significantly above 1 indicate induced expression in animals that hopped (n = 3) relative to still controls (n = 3, white stars inside bars; un-paired t-test). Black stars above
Page 52 of 56
John Wiley & Sons
Journal of Comparative Neurology
For Peer Review
bars indicate significant differences between amount of dusp1 and egr1 induction (paired t-test between the same brain regions of the same animals). * p<0.05, ** p<0.01, and *** p<0.001.
185x215mm (300 x 300 DPI)
Page 53 of 56
John Wiley & Sons
Journal of Comparative Neurology

For Peer Review
Fig. 11. Dusp1 and egr1 expression in somatosensory brainstem areas and the ventral pallidum (VP) of zebra finch brain. A: DIVA of a hopping animal, frontal section (A1: dusp1, A2: egr1). B: PrV of an animal sitting in the dark with one eye covered (B1: dusp1, B3: egr1), and a light stimulated
animal moving around in the cage, also with one eye covered (B2: dusp1, B4: egr1). There is higher dusp1 expression bilaterally in the stimulated animal (other hemisphere not shown),
indicating that the increased expression is presumably not due to light stimulation but to another factor- presumably movement. C: VP of still (C1: dusp1, C3: egr1) and hopping animals (C2: dusp1, C4: egr1), sagittal sections. The amount of dusp1 expression in labeled cells does not
appear to differ between the sitting still and hopping animals. Abbreviations not in the main text: OTr, optic tract; T, thalamus. Scale bar = 20µm.
193x181mm (300 x 300 DPI)
Page 54 of 56
John Wiley & Sons
Journal of Comparative Neurology

For Peer Review
Fig. 12. Assessment of single- and double-labeled dusp1 and egr1 cells in zebra finch brain. A-E: Examples of single- and double-labeled cells in L2 (A) and L1 (B; auditory), aIH (C) and AH (D;
somatosensory), and OT layer 8 (E; visual). Boundaries (L2-L1, aIH-AH, not shown) were determined by cellular morphology. The sensory input neurons have a small granular morphology
relative to the neurons of the surrounding nidopallium (for L2 and E), hyperpallium and mesopallium (for aIH). Red arrows: single labeled dusp1 cells. Blue arrows: single labeled egr1 cells. Green arrows: double labeled cells. Dusp1 was measured by radioactive in situ hybridizations (silver
grains) and egr1 measured by DIG chromogenic in situ hybridizations (purple). Scale bar = 20µm. F: Proportion of cells that express only dusp1, only egr1, or both dusp1 and egr1. Numbers in the
pie charts indicate mean percentage ±SD of labeled cells; n = 169 cells in L2, 77 in L2-L1
boundary, 82 in L1, 66 in aIH, 113 in aIH-AH boundary, 103 in AH, and 146 in OT layer 8 (n = 5 birds). There are significant difference in the relative distribution of dusp1 single labeled and egr1
single labeled cells among areas of a given pathway (p<0.01, ANOVA followed by Fisher’s PLSD post hoc test; e.g. L2 vs L1) except for the aIH-AH boundary.
198x90mm (300 x 300 DPI)
Page 55 of 56
John Wiley & Sons
Journal of Comparative Neurology

For Peer Review
Fig. 13. Dusp1 and egr1 mRNA expression in a parrot brain. Shown are medial to lateral serial sagittal sections hybridized to dusp1(A) and egr1 (B) respectively, from four groups of budgerigars:
1) A silent control male bird sitting relatively still in dim light (A1, 5, B1, 5); 2) A male bird that heard a 30 min playback of natural conspecific warble song (A2, 6, B2, 6); 3) A hearing intact male bird that hopped for 30 min in a rotating wheel while in the dark (A3, 7, B3, 7); and 4) A deafened male bird that hopped for 30 min in the rotating wheel while in the dark (A4, 8, B4, 8). Note that
deafening eliminated most of the dusp1 and egr1 induction in caudal areas of the brain in the hopping animals. Yellow lines and names indicate areas where each mRNA was up-regulated. C: Anatomical profiles of brain areas of medial and lateral sections. D: quantifications of dusp1 (red
bars) and egr1 (blue bars) gene expression in 6 somatosensory areas and the anterior cerebellum
(Cb) of deaf hopping (n = 3) and sitting still (n = 3) birds. For the quantifications, each bar shows an average value ±SD. Values are normalized by the average level of expression in the same brain
Page 56 of 56
John Wiley & Sons
Journal of Comparative Neurology
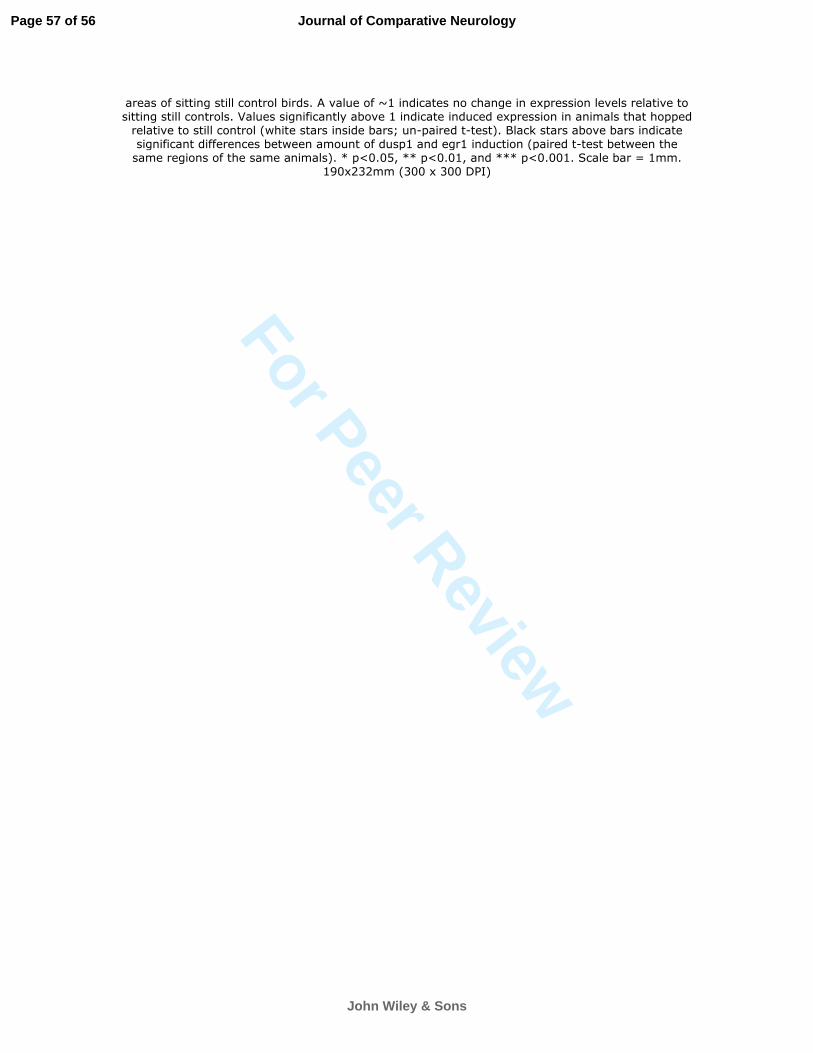
For Peer Review
areas of sitting still control birds. A value of ~1 indicates no change in expression levels relative to sitting still controls. Values significantly above 1 indicate induced expression in animals that hopped
relative to still control (white stars inside bars; un-paired t-test). Black stars above bars indicate significant differences between amount of dusp1 and egr1 induction (paired t-test between the
same regions of the same animals). * p<0.05, ** p<0.01, and *** p<0.001. Scale bar = 1mm. 190x232mm (300 x 300 DPI)
Page 57 of 56
John Wiley & Sons
Journal of Comparative Neurology

For Peer Review
Fig. 14. Dusp1 and egr1 mRNA expression in Ring Doves. Shown are medial to lateral serial sagittal brain sections hybridized to dusp1 (A) and egr1 (B) from two groups of doves: still- silent control
male birds sitting relatively still in the dark (A1-3, B1-3) and walking- deafened male bird that
walked for 30 min in the rotating wheel while in the dark. Note that deafening eliminated most of the dusp1 and egr1 induction in auditory areas such as N-L2. Areas where each mRNA was induced are indicated by yellow lines and names. The most right column shows anatomical profiles of brain areas. Scale bar = 2mm. C: Magnified images of dusp1 and egr1 expression in a portion of E, Ne,
and MVe laterally adjacent to B (highlighted by *) of a deafened ring dove, after walking in the dark. Scale bar = 1mm. D: Quantification of dusp1 (red bars) and egr1 (blue bars) expression in 8
somatosensory areas (3 areas E*, Ne*, MVe* were identified as putative somatosensory), the anterior cerebellum, and two auditory areas of walking deaf birds. Each bar shows an average value
±SD. Values are normalized by the average level of expression in the same brain areas of sitting still control birds. A value ~1 indicates no change in expression levels relative to silent controls.
Values significantly above 1 indicate induced expression in animals that walked (n = 3) relative to
still controls (n = 3, white stars inside bars; un-paired t-test). Black stars above bars indicate significant differences between amount of dusp1 and egr1 induction (paired t-test between the
same regions of the same animals). * p<0.05, ** p<0.01, and *** p<0.001. 214x181mm (300 x 300 DPI)
Page 58 of 56
John Wiley & Sons
Journal of Comparative Neurology

For Peer Review
Fig. 15. Dusp1-eGFP expression in GENSAT mouse brains. A: Immunocytochemistry detection of enhanced GFP (eGFP) driven by the dusp1 promoter (A1,2) and promoters of cortical laminar-specific genes in the mouse brain (A3: Rorb for layer IV, A4: Dtx4 for layers I-III and IV, A5,6:
Darpp32 a.k.a. Ppp1r1b for layer VI). Darpp32 is also expressed in the striatum at a high level and parts of the thalamus at an intermediate level. Scale bar = 2mm. B: Magnified images of dusp1
(B1), Rorb (B2), and Darpp32 (B3) in the visual cortex (from A, caudal cortical region). C: Magnified images of dusp1 expression (C1) and adjacent Nissl stained section (C2) in sensory input thalamic
nuclei (MGD and DLG). Note the absence of expression in the higher order nuclei of the thalamus, including the peripeduncular nucleus (PP), the subgeniculate nucleus (SubG), and the
intergeniculate leaflet (IGL). Scale bar = 200µm. Gene abbreviations: Rorb, RAR-related orphan receptor beta; Dtx4, deltex 4 homolog (Drosophila); Darpp32, dopamine- and adenosine 3’:5’-
monophosphate-regulated phosphoprotein or Ppp1r1b, protein phosphatase 1, regulatory (inhibitor) subunit 1B. Images are from the GENSAT database (GENSAT Project, NINDS Contract
#N01NS02331 to The Rockefeller University, New York, NY). 169x158mm (300 x 300 DPI)
Page 59 of 56
John Wiley & Sons
Journal of Comparative Neurology

For Peer Review
Fig. 16. Summary of results of this study and proposed putative mechanisms of differential dusp1
and egr1 regulation. A: Summary of dusp1 and egr1 molecular profiles in the cellular stations of five sensory pathways of the avian brain. Red: Areas that show activity-dependent dusp1 induction. Blue: Areas that show activity-dependent egr1 induction. Gray: Areas where we could not identify regulation of either gene or find apparent expression. OT shows induction of both genes in layer 8 and only egr1 induction in some other layers, and is thus filled in both blue and red, as most of the neurons do not express high levels of both genes. B: A proposed putative signaling mechanisms of how dusp1 and egr1 could be differentially regulated in different neuron types: sensory input vs higher sensory. Only a proposed dependent mechanism is shown. In the higher sensory neurons, up-regulation of egr1 is occurs via one type of receptor (R1). In the sensory input neurons, this
pathway is also initiated, but it is suppressed by over-expression of the DUSP1 protein induced via another receptor (R2). Specific receptors are not shown, as this needs to be determined in neuron
types of intact brains as opposed to cells in culture. Dashed line indicates undetermined
Page 60 of 56
John Wiley & Sons
Journal of Comparative Neurology
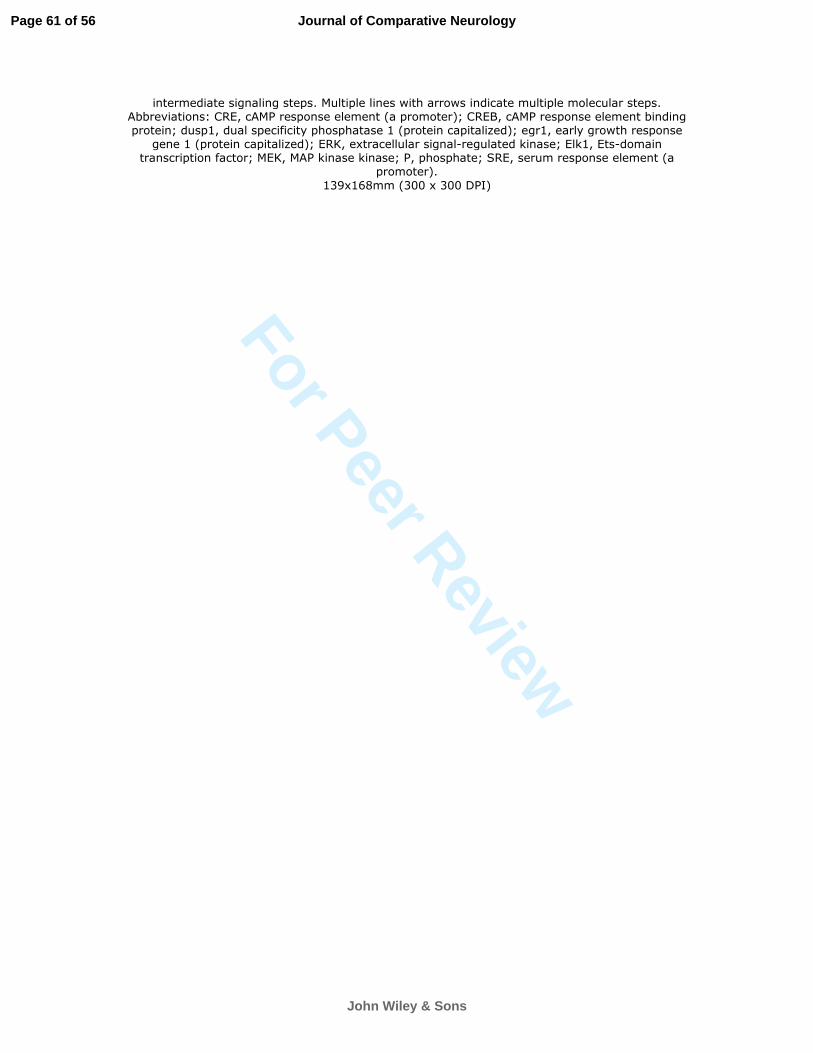
For Peer Review
intermediate signaling steps. Multiple lines with arrows indicate multiple molecular steps. Abbreviations: CRE, cAMP response element (a promoter); CREB, cAMP response element binding protein; dusp1, dual specificity phosphatase 1 (protein capitalized); egr1, early growth response
gene 1 (protein capitalized); ERK, extracellular signal-regulated kinase; Elk1, Ets-domain transcription factor; MEK, MAP kinase kinase; P, phosphate; SRE, serum response element (a
promoter).
139x168mm (300 x 300 DPI)
Page 61 of 56
John Wiley & Sons
Journal of Comparative Neurology

![Adult zebra finches: males with orange cheeks, females are grey. Previous studies [1,2] showed that exposure of adult male zebra finches (Taeniopygia guttata;](https://img.dokumen.tips/doc/110x75/56649cbf5503460f949846e2/adult-zebra-finches-males-with-orange-cheeks-females-are-grey-previous-studies.jpg)