Embed Size (px)
Citation preview

The Duke FacultyQuality, Challenges and Opportunities
A Report from the Provost toThe Alumni BoardFebruary 8, 2013

Some History• 1999 – “Reputation gap”
– Quality spottier and more fragile than our reputation focus on faculty development in Building on Excellence
• 2006 – “Bottom of the top”– Can we hire the faculty we really want and need
for what Duke wants to be? Making a Difference
2012 - Where are we now?

Some metrics of faculty quality today
• Academic Analytics• Teaching programs and innovations• Hiring built on Duke distinctiveness and
distinction• Changing research profile

Duke’s Standing
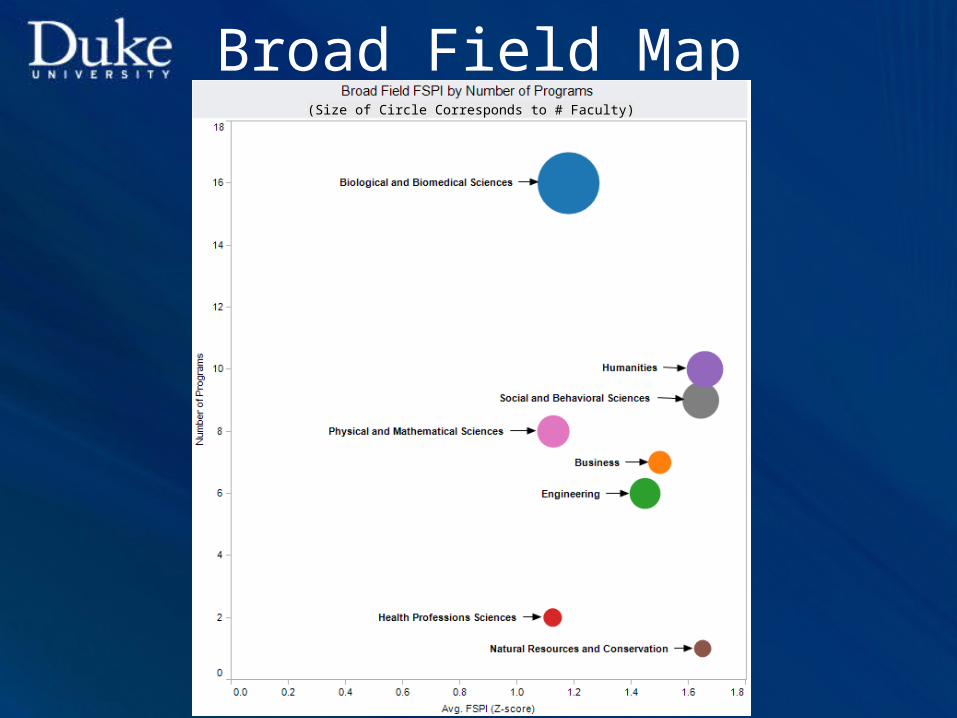
Broad Field Map(Size of Circle Corresponds to # Faculty)

Breadth of Quality across Ranks
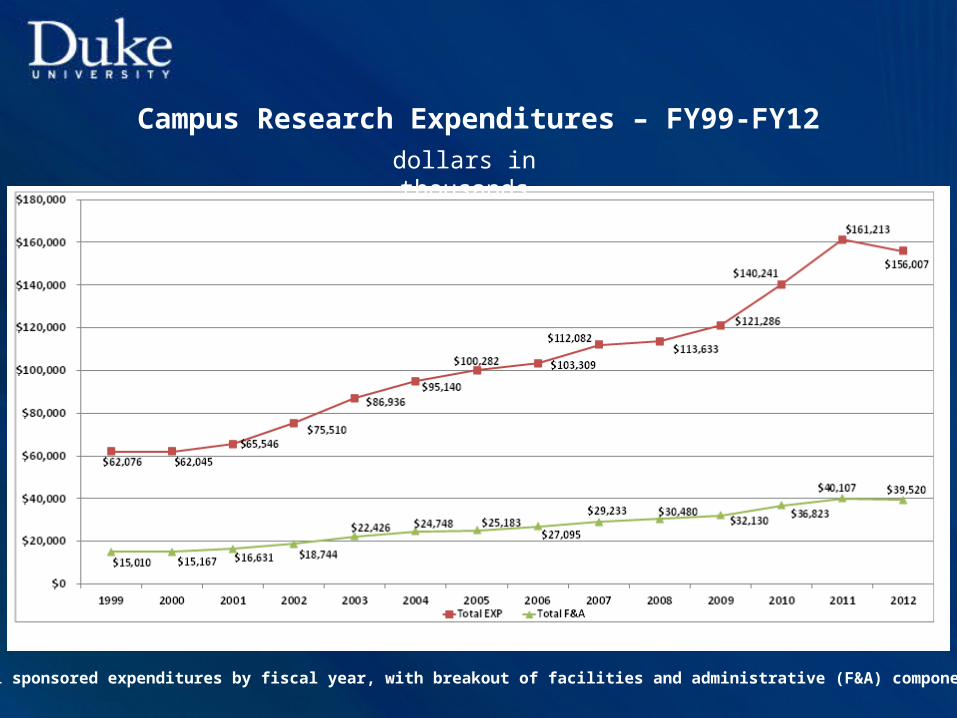
Campus Research Expenditures – FY99-FY12dollars in thousands
203 and 3x3 total sponsored expenditures by fiscal year, with breakout of facilities and administrative (F&A) component of total
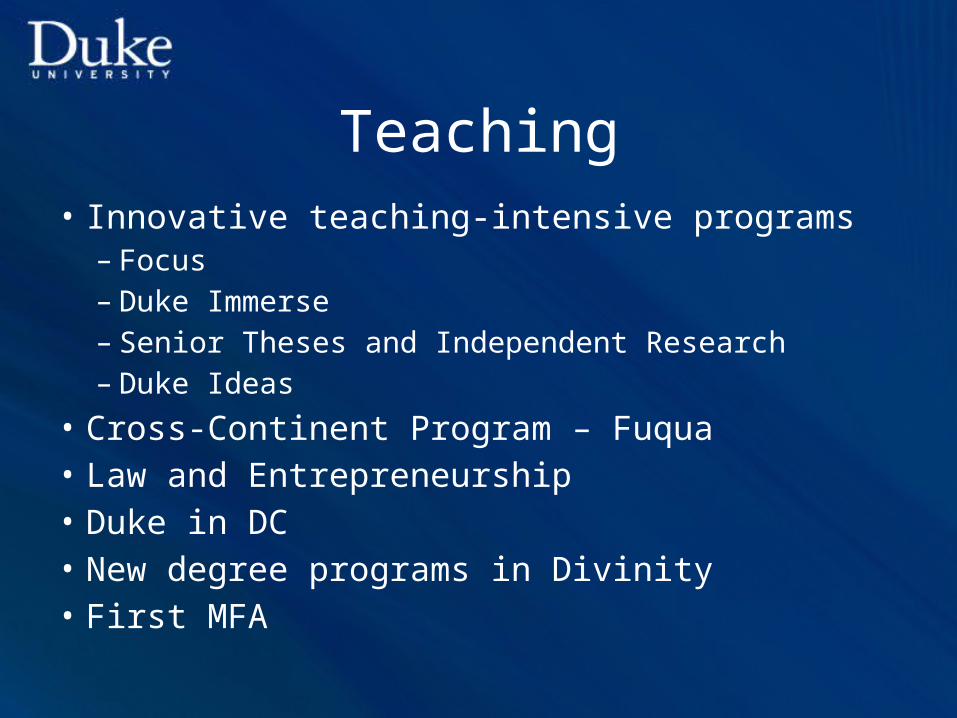
Teaching• Innovative teaching-intensive programs
– Focus– Duke Immerse– Senior Theses and Independent Research– Duke Ideas
• Cross-Continent Program – Fuqua• Law and Entrepreneurship• Duke in DC• New degree programs in Divinity• First MFA

Superb Hiring through Strategic Distinctiveness
• Interdisciplinarity• Knowledge in the Service of Society• Close Collaboration with Medical School
Guillermo SapiroProfessor of Computer ScienceCollege of Arts and SciencesCame to Duke in 2012
Richard Newell, Gendell Associate Professor of Energy and Environmental Economics,Director, Duke University Energy InitiativeNicholas School of the Environment,Came to Duke in 2007
Ingrid DaubechiesJames B. Duke Professor of MathematicsProfessor of Electrical and Computer EngineeringCame to Duke in 2010
Laurent DuboisMarcelo Lotti Professor in Romance Studies and History Director, Center for French and Francophone StudiesDirector of Scholars & Publics InitiativeCo-director of Haiti Humanities LaboratoryCollege of Arts and Sciences Came to Duke in 2007

Guy Charles, Charles S. Rhyne Professor of Law,Director of the Duke Center on Law, Race and PoliticsLaw SchoolCame to Duke in 2009
Terri Moffitt, Knut Schmidt Nielsen Professor, Psychology and NeuroscienceProfessor, Psychiatry & Behavioral SciencesCollege of Arts and SciencesCame to Duke in 2007

How has the Faculty Changed• Size• Age• Are they staying?• Balance of tenure/tenure track to non-tenure
track

Regular Rank Faculty Growth
Fall 1999 Fall 2012 Growth Fall 1999 to Fall 2012 Average Annual Growth RateTTK NTT Total TTK NTT Total TTK NTT Total TTK NTT Total
Humanities 132 52 184 154 77 231 17% 48% 26% 1% 3% 2%Social Sciences 153 17 170 177 26 203 16% 53% 19% 1% 4% 1%Natural Sciences 141 25 166 160 41 201 13% 64% 21% 1% 4% 2% Total Arts & Sciences 426 94 520 491 144 635 15% 53% 22% 1% 4% 2%Divinity 24 10 34 27 16 43 13% 60% 26% 1% 4% 2%Pratt 69 20 89 102 21 123 48% 5% 38% 3% 0% 3%Nicholas 36 9 45 51 18 69 42% 100% 53% 3% 6% 4%Law 35 2 37 47 14 61 34% 600% 65% 2% 18% 4%Fuqua 75 11 86 91 11 102 21% 0% 19% 2% 0% 1%Sanford 18 14 32 37 26 63 106% 86% 97% 6% 5% 6%School of Medicine - Clinical Sciences 575 505 1080 750 1112 1862 30% 120% 72% 2% 7% 5%School of Medicine - Basic Sciences 147 49 196 147 62 209 0% 27% 7% 0% 2% 1% Total School of Medicine 722 554 1276 897 1174 2071 24% 112% 62% 2% 6% 4%School of Nursing 14 15 29 32 42 74 129% 180% 155% 7% 9% 8%University Institutes and Centers 0 0 0 0 22 22 - 100% 100% - - -Total Regular Rank Faculty 1419 729 2148 1775 1488 3263 25% 104% 52% 2% 6% 4%
Division/School

Faculty Age Tenured and Tenure Track
Count of 20-29 Count of 30-39 Count of 40-49 Count of 50-59 Count of 60-69 Count of 70+School 1999 2012 1999 2012 1999 2012 1999 2012 1999 2012 1999 2012
Arts & Sciences 3 5 90 86 132 125 117 146 74 94 10 35Divinity School 4 4 7 6 7 9 6 7 1Fuqua School of Business 4 2 31 24 19 23 14 21 7 18 3Law 5 6 7 17 14 7 8 11 1 6Nicholas 7 10 13 14 12 15 3 11 1 1Pratt 1 1 18 22 18 29 16 30 15 13 1 7Sanford 1 2 5 9 2 11 9 6 1 8 1School of Medicine 1 2 173 147 277 296 185 250 74 150 11 52School of Nursing 1 4 8 10 4 13 1 4 1Grand Total 10 12 334 312 483 531 378 497 189 316 24 107
Count of 20-29 Count of 30-39 Count of 40-49 Count of 50-59 Count of 60-69 Count of 70+School 1999 2012 1999 2012 1999 2012 1999 2012 1999 2012 1999 2012
Arts & Sciences 1% 1% 21% 18% 31% 25% 27% 30% 17% 19% 2% 7%Divinity School 0% 0% 17% 15% 29% 22% 29% 33% 25% 26% 0% 4%Fuqua School of Business 5% 2% 41% 26% 25% 25% 19% 23% 9% 20% 0% 3%Law 0% 0% 14% 13% 20% 36% 40% 15% 23% 23% 3% 13%Nicholas 0% 0% 19% 20% 36% 27% 33% 29% 8% 22% 3% 2%Pratt 1% 1% 26% 22% 26% 28% 23% 29% 22% 13% 1% 7%Sanford 6% 5% 28% 24% 11% 30% 50% 16% 6% 22% 0% 3%School of Medicine 0% 0% 24% 16% 38% 33% 26% 28% 10% 17% 2% 6%School of Nursing 0% 0% 7% 13% 57% 31% 29% 41% 7% 13% 0% 3%Grand Total 1% 1% 24% 18% 34% 30% 27% 28% 13% 18% 2% 6%

Faculty Retention
School
Total Hires 1999 to
2012
Still at Duke Fall
2012Retention
RateArts & Sciences 324 282 87%Divinity School 23 20 87%Fuqua School of Business 98 76 78%Nicholas School of the Environment 32 28 88%Pratt School of Engineering 64 59 92%Sanford School of Public Policy 22 21 95%School of Law 33 17 52%School of Medicine -Basic Sciences 95 72 76%School of Nursing 39 30 77%Total Tenured and Tenure Track 730 605 83%

Non-Tenure Track FacultyFall 1999 Fall 2012
TTK NTT Total %NTT TTK NTT Total %NTTHumanities 132 52 184 28% 154 77 231 33%Social Sciences 153 17 170 10% 177 26 203 13%Natural Sciences 141 25 166 15% 160 41 201 20% Total Arts & Sciences 426 94 520 18% 491 144 635 23%Divinity 24 10 34 29% 27 16 43 37%Pratt 69 20 89 22% 102 21 123 17%Nicholas 36 9 45 20% 51 18 69 26%Law 35 2 37 5% 47 14 61 23%Fuqua 75 11 86 13% 91 11 102 11%Sanford 18 14 32 44% 37 26 63 41%University Institutes and Centers 0 0 0 - 0 22 22 100%Total Regular Rank Faculty 683 160 843 19% 846 272 1118 24%
Division/School
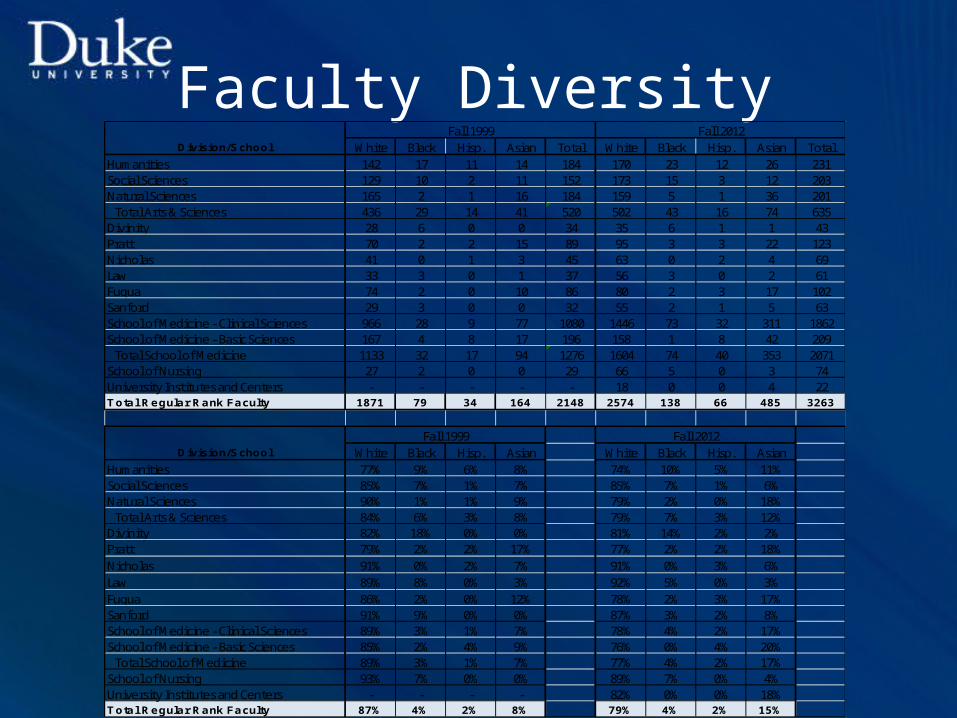
Faculty DiversityFall 1999 Fall 2012
White Black Hisp. Asian Total White Black Hisp. Asian TotalHumanities 142 17 11 14 184 170 23 12 26 231Social Sciences 129 10 2 11 152 173 15 3 12 203Natural Sciences 165 2 1 16 184 159 5 1 36 201 Total Arts & Sciences 436 29 14 41 520 502 43 16 74 635Divinity 28 6 0 0 34 35 6 1 1 43Pratt 70 2 2 15 89 95 3 3 22 123Nicholas 41 0 1 3 45 63 0 2 4 69Law 33 3 0 1 37 56 3 0 2 61Fuqua 74 2 0 10 86 80 2 3 17 102Sanford 29 3 0 0 32 55 2 1 5 63School of Medicine - Clinical Sciences 966 28 9 77 1080 1446 73 32 311 1862School of Medicine - Basic Sciences 167 4 8 17 196 158 1 8 42 209 Total School of Medicine 1133 32 17 94 1276 1604 74 40 353 2071School of Nursing 27 2 0 0 29 66 5 0 3 74University Institutes and Centers - - - - - 18 0 0 4 22Total Regular Rank Faculty 1871 79 34 164 2148 2574 138 66 485 3263
Fall 1999 Fall 2012White Black Hisp. Asian White Black Hisp. Asian
Humanities 77% 9% 6% 8% 74% 10% 5% 11%Social Sciences 85% 7% 1% 7% 85% 7% 1% 6%Natural Sciences 90% 1% 1% 9% 79% 2% 0% 18% Total Arts & Sciences 84% 6% 3% 8% 79% 7% 3% 12%Divinity 82% 18% 0% 0% 81% 14% 2% 2%Pratt 79% 2% 2% 17% 77% 2% 2% 18%Nicholas 91% 0% 2% 7% 91% 0% 3% 6%Law 89% 8% 0% 3% 92% 5% 0% 3%Fuqua 86% 2% 0% 12% 78% 2% 3% 17%Sanford 91% 9% 0% 0% 87% 3% 2% 8%School of Medicine - Clinical Sciences 89% 3% 1% 7% 78% 4% 2% 17%School of Medicine - Basic Sciences 85% 2% 4% 9% 76% 0% 4% 20% Total School of Medicine 89% 3% 1% 7% 77% 4% 2% 17%School of Nursing 93% 7% 0% 0% 89% 7% 0% 4%University Institutes and Centers - - - - 82% 0% 0% 18%Total Regular Rank Faculty 87% 4% 2% 8% 79% 4% 2% 15%
Division/School
Division/School

Challenges and Opportunities (1)Sustaining a Great Faculty
• Declining turnover and maintaining a trajectory of faculty improvement– Slow or no faculty growth in some schools– An aging faculty– Strong retention rates

TeachingInnovation, Flexibility, Quality
• New modes of teaching– The sometimes changing “lecture”– The expansion of team and small group learning: the return of the
“tutorial”?– Digital and Online learning elements
• An increasingly diversified faculty– Research faculty– Professors of the Practice– “Teaching Specialists”
• New ways of accounting for teaching effort• Continued efforts to assess effectiveness of innovations

Research• The threat of declining funding opportunities:
– The threat is real, but what how big is the danger?• Focusing our research efforts on the most vibrant
opportunities– The genius of our faculty– Interdisciplinary and team research
• On the base of disciplinary excellence
– Knowledge in the service of society– Seeking new sources of support
• Enabling stronger links to the private sector while sustaining academic independence
• Global opportunities

Building a Great 21st Century Faculty
• Sustaining our momentum• Underlining our distinctiveness
– Multi-disciplinary collaborations and teams– Engagement with the globe’s greatest challenges– A teaching program built around our special
strengths• Further building and demonstrating our
distinction

What’s Needed?• Strong financial and faculty management • Resources
– Duke/Forward– Rebuild SIP alongside strong school financials– Innovative financially rewarding new programs
• Innovative and dynamic leadership– Deans– In the Faculty

End of Planned Presentation