Embed Size (px)
Citation preview
The Diversity and Biogeography of Western IndianOcean Reef-Building CoralsDavid Obura*
CORDIO East Africa, Mombasa, Kenya
Abstract
This study assesses the biogeographic classification of the Western Indian Ocean (WIO) on the basis of the species diversityand distribution of reef-building corals. Twenty one locations were sampled between 2002 and 2011. Presence/absence ofscleractinian corals was noted on SCUBA, with the aid of underwater digital photographs and reference publications forspecies identification. Sampling effort varied from 7 to 37 samples per location, with 15 to 45 minutes per dive allocated tospecies observations, depending on the logistics on each trip. Species presence/absence was analyzed using the Bray-Curtissimilarity coefficient, followed by cluster analysis and multi-dimensional scaling. Total (asymptotic) species number perlocation was estimated using the Michaelis-Menten equation. Three hundred and sixty nine coral species were named withstable identifications and used for analysis. At the location level, estimated maximum species richness ranged from 297(Nacala, Mozambique) to 174 (Farquhar, Seychelles). Locations in the northern Mozambique Channel had the highestdiversity and similarity, forming a core region defined by its unique oceanography of variable meso-scale eddies that conferhigh connectivity within this region. A distinction between mainland and island fauna was not found; instead, diversitydecreased radially from the northern Mozambique Channel. The Chagos archipelago was closely related to the northernMozambique Channel region, and analysis of hard coral data in the IUCN Red List found Chagos to be more closely relatedto the WIO than to the Maldives, India and Sri Lanka. Diversity patterns were consistent with primary oceanographic driversin the WIO, reflecting inflow of the South Equatorial Current, maintenance of high diversity in the northern MozambiqueChannel, and export from this central region to the north and south, and to the Seychelles and Mascarene islands.
Citation: Obura D (2012) The Diversity and Biogeography of Western Indian Ocean Reef-Building Corals. PLoS ONE 7(9): e45013. doi:10.1371/journal.pone.0045013
Editor: Mikhail V. Matz, University of Texas, United States of America
Received February 22, 2012; Accepted August 15, 2012; Published September 19, 2012
Copyright: � 2012 David Obura. This is an open-access article distributed under the terms of the Creative Commons Attribution License, which permitsunrestricted use, distribution, and reproduction in any medium, provided the original author and source are credited.
Funding: Funding was provided by the Western Indian Ocean Marine Science Association’s (WIOMSA) Marine Science for Management (MASMA) programme.The funders had no role in study design, data collection and analysis, decision to publish, or preparation of the manuscript.
Competing Interests: The author has declared that no competing interests exist.
* E-mail: [email protected]
Introduction
The reef-building coral fauna of the Western Indian Ocean
(WIO) is one of the least known globally. Dedicated taxonomic
and diversity studies are spread over a broad period of time and
have tended to be geographically constrained, such as for
Tanzania [1], South Africa [2,3], southwest Madagascar [4],
Seychelles [5] and the Mascarene Islands [6–8]. A greater number
of studies have recently been undertaken in the northern parts of
the Indian Ocean, including the Red Sea and Gulfs regions e.g.
[9–11], Yemen [12,13], Socotra [14], Oman [15], the Lakshad-
weep archipelago [16] and the Maldives [17]. Using datasets from
studies with highly unequal levels of sampling, the main regional
coral distribution analyses [18,19] found that coral species
diversity across the Indo-Pacific region is one of approximately
linear decline in all directions from the high-diversity center in the
southeast Asian region, currently known as the Coral Triangle
[20]. Sheppard [18] noted that this decline does not hold for the
Red Sea, finding a regional peak in diversity in the Red Sea, but
species richness for mainland East Africa and adjacent island sites
showed a clear decline. Recently work in the WIO and Red Sea
has highlighted a number of new records for the region as well as
previously unknown coral species [21–23], and cryptic species or
genetic disjunctions between Indian and Pacific Ocean popula-
tions [24–27].
Biogeographic patterns are determined by past and present day
currents that define connectivity among sites, as well as by
historical patterns of speciation, extinction and immigration. The
present-day oceanography of the WIO [28] can be characterized
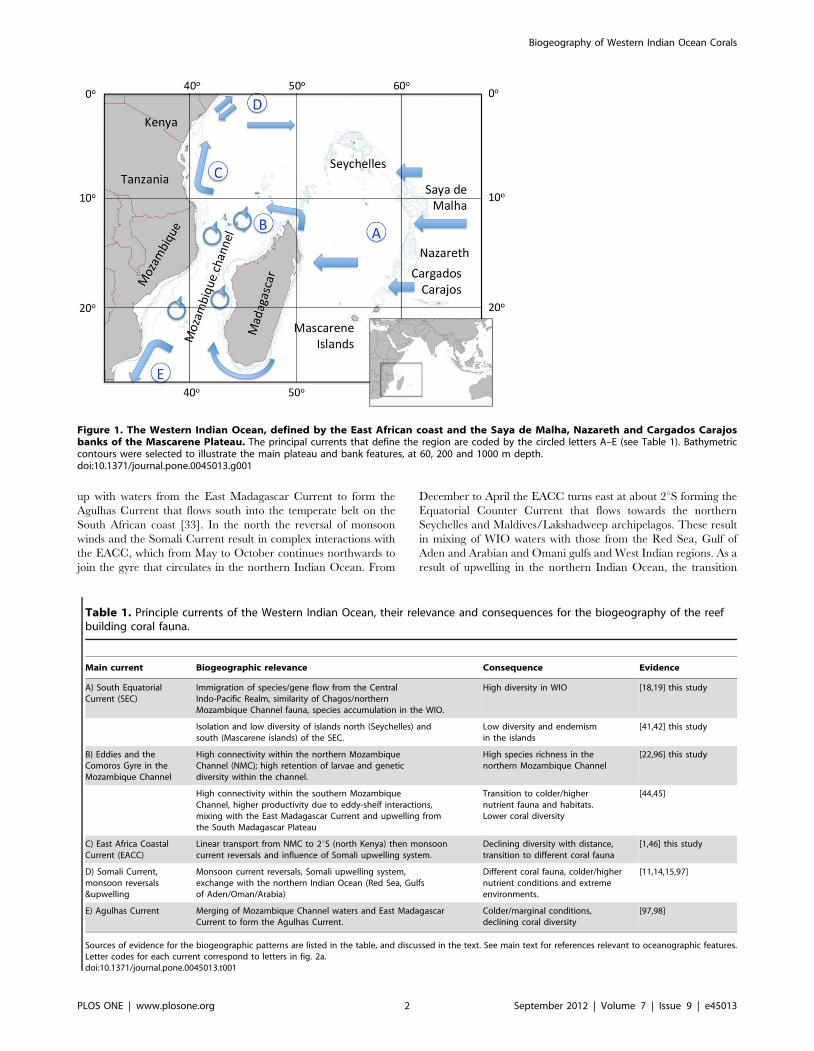
as follows (fig. 1, Table 1). The east-west flow of the South
Equatorial Current (SEC) carries waters from the Indonesian
region across the Indian Ocean between 10–20uS, with primary
flow centered at 12–13uS through the gap between the Saya de
Malha and Nazareth banks [29] and at about 16–17uS where it
reaches the Madagascan coastline and bifurcates north and south.
The zonal flow of the SEC isolates the northern (Seychelles) and
southern (Mascarene islands) islands and banks from the main flow
and from each other, and establishes a clear upstream-downstream
gradient between these and the Mozambique Channel and East
Africa mainland coast. On the east coast of Madagascar the
northern branch of the SEC accelerates around the northern tip of
Madagascar, where instabilities in the current result in the
formation of the Glorioso Front [30], the intermittent Comoros
gyre [31] and mesoscale eddies [32] that result in high mixing of
waters in the northern Mozambique Channel. Water flows out
from the northern Mozambique Channel in both northerly and
southerly directions - northwards in the linear East African Coastal
Current (EACC) that flows along the Tanzania and Kenya coasts,
and southwards as a net flow of the variable eddies initiated in the
northern Mozambique Channel. These eddies subsequently join
PLOS ONE | www.plosone.org 1 September 2012 | Volume 7 | Issue 9 | e45013
up with waters from the East Madagascar Current to form the
Agulhas Current that flows south into the temperate belt on the
South African coast [33]. In the north the reversal of monsoon
winds and the Somali Current result in complex interactions with
the EACC, which from May to October continues northwards to
join the gyre that circulates in the northern Indian Ocean. From
December to April the EACC turns east at about 2uS forming the
Equatorial Counter Current that flows towards the northern
Seychelles and Maldives/Lakshadweep archipelagos. These result
in mixing of WIO waters with those from the Red Sea, Gulf of
Aden and Arabian and Omani gulfs and West Indian regions. As a
result of upwelling in the northern Indian Ocean, the transition
Figure 1. The Western Indian Ocean, defined by the East African coast and the Saya de Malha, Nazareth and Cargados Carajosbanks of the Mascarene Plateau. The principal currents that define the region are coded by the circled letters A–E (see Table 1). Bathymetriccontours were selected to illustrate the main plateau and bank features, at 60, 200 and 1000 m depth.doi:10.1371/journal.pone.0045013.g001
Table 1. Principle currents of the Western Indian Ocean, their relevance and consequences for the biogeography of the reefbuilding coral fauna.
Main current Biogeographic relevance Consequence Evidence
A) South EquatorialCurrent (SEC)
Immigration of species/gene flow from the CentralIndo-Pacific Realm, similarity of Chagos/northernMozambique Channel fauna, species accumulation in the WIO.
High diversity in WIO [18,19] this study
Isolation and low diversity of islands north (Seychelles) andsouth (Mascarene islands) of the SEC.
Low diversity and endemismin the islands
[41,42] this study
B) Eddies and theComoros Gyre in theMozambique Channel
High connectivity within the northern MozambiqueChannel (NMC); high retention of larvae and geneticdiversity within the channel.
High species richness in thenorthern Mozambique Channel
[22,96] this study
High connectivity within the southern MozambiqueChannel, higher productivity due to eddy-shelf interactions,mixing with the East Madagascar Current and upwelling fromthe South Madagascar Plateau
Transition to colder/highernutrient fauna and habitats.Lower coral diversity
[44,45]
C) East Africa CoastalCurrent (EACC)
Linear transport from NMC to 2uS (north Kenya) then monsooncurrent reversals and influence of Somali upwelling system.
Declining diversity with distance,transition to different coral fauna
[1,46] this study
D) Somali Current,monsoon reversals&upwelling
Monsoon current reversals, Somali upwelling system,exchange with the northern Indian Ocean (Red Sea, Gulfsof Aden/Oman/Arabia)
Different coral fauna, colder/highernutrient conditions and extremeenvironments.
[11,14,15,97]
E) Agulhas Current Merging of Mozambique Channel waters and East MadagascarCurrent to form the Agulhas Current.
Colder/marginal conditions,declining coral diversity
[97,98]
Sources of evidence for the biogeographic patterns are listed in the table, and discussed in the text. See main text for references relevant to oceanographic features.Letter codes for each current correspond to letters in fig. 2a.doi:10.1371/journal.pone.0045013.t001
Biogeography of Western Indian Ocean Corals
PLOS ONE | www.plosone.org 2 September 2012 | Volume 7 | Issue 9 | e45013
from the warm EACC to the cool waters of this region mirrors the
tropical to temperate transition from the Mozambique Channel to
the Agulhas current, in the south.
Understanding biogeographic patterns and their causal mech-
anisms provides the foundation for conservation planning.
Kelleher et al. [34] laid the basis for recent marine biogeographic
analyses, identifying East Africa as a coherent region (here referred
to as the Western Indian Ocean). While that study joined the East
African coast and Madagascar as a single region, further work
based on practical planning for transboundary conservation
separated the mainland [35], from the oceanic islands and
Madagascar (RAMP-COI, unpublished). This work was most
recently revised in the Marine Ecoregions of the World (MEOW)
classification [36], which established a global hierarchy of 12
realms, 62 provinces and 232 ecoregions, and defines the WIO
province as used in this study, extending from central Somalia to
northern South Africa on the East African coast (including Kenya,
Tanzania and Mozambique), and extending east as far as the
banks of the Mascarene Plateau (Saya de Malha, Nazareth and
Cargados Carajos) and the Mascarene Islands (fig. 1), and
incorporating 9 ecoregions (fig. 2a). This classification is used for
marine species in the IUCN Red List of Endangered species [37],
which has compiled the most recent and publicly available
biogeographic dataset of scleractinian corals as part of its
assessment of coral species extinction risk [38]. Nevertheless, the
MEOW ecoregions are at a relatively coarse scale for local
considerations of biogeography and conservation planning. To
address this finer scale, a dataset on coral species presence/
absence compiled over a decade of surveys at locations spread
throughout the WIO is presented here. This study therefore builds
on the MEOW classification [36] through analysis first of the
global IUCN dataset on coral species [38], then of the field dataset
on coral distributions reported here, in the light of principal
oceanographic drivers of biogeographic pattern (Table 1). As a
result of this analysis, revisions to currently accepted biogeograph-
ic patterns are suggested.
Results
Red List coral distributionsAcross all tropical MEOW provinces, the Red List dataset on
corals shows a significant segregation of provinces between the
four Indo-Pacific Realms (ANOSIM, R = 0.558, p,0.001).
Provinces within the West Indo-Pacific realm (WIPR) cluster
strongly together (fig. 3a), except for the Andaman Seas (Andaman
and Nicobar Islands and Western Sumatra). When this province is
classified in the Central Indo-Pacific realm, a more significant
result is obtained (ANOSIM, R = 0.609, p,0.001), so for
subsequent analyses, the Andaman Seas ecoregions were excluded.
For ecoregions within the WIPR six significant clusters were found
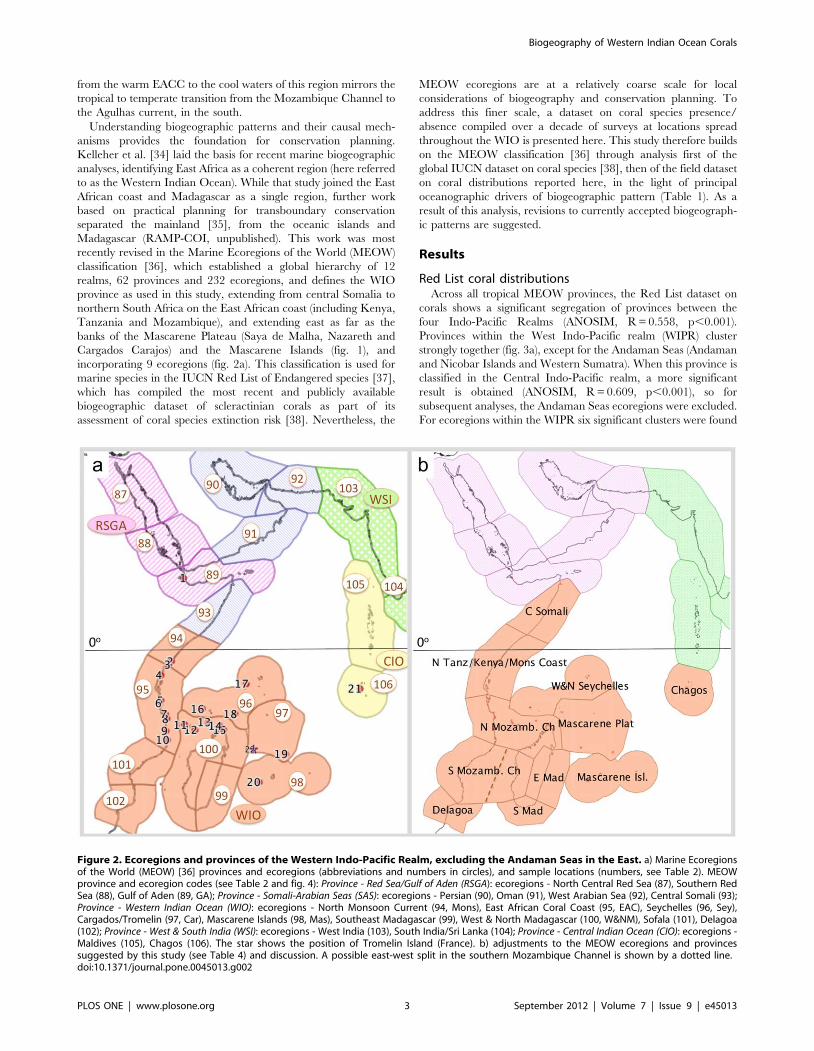
Figure 2. Ecoregions and provinces of the Western Indo-Pacific Realm, excluding the Andaman Seas in the East. a) Marine Ecoregionsof the World (MEOW) [36] provinces and ecoregions (abbreviations and numbers in circles), and sample locations (numbers, see Table 2). MEOWprovince and ecoregion codes (see Table 2 and fig. 4): Province - Red Sea/Gulf of Aden (RSGA): ecoregions - North Central Red Sea (87), Southern RedSea (88), Gulf of Aden (89, GA); Province - Somali-Arabian Seas (SAS): ecoregions - Persian (90), Oman (91), West Arabian Sea (92), Central Somali (93);Province - Western Indian Ocean (WIO): ecoregions - North Monsoon Current (94, Mons), East African Coral Coast (95, EAC), Seychelles (96, Sey),Cargados/Tromelin (97, Car), Mascarene Islands (98, Mas), Southeast Madagascar (99), West & North Madagascar (100, W&NM), Sofala (101), Delagoa(102); Province - West & South India (WSI): ecoregions - West India (103), South India/Sri Lanka (104); Province - Central Indian Ocean (CIO): ecoregions -Maldives (105), Chagos (106). The star shows the position of Tromelin Island (France). b) adjustments to the MEOW ecoregions and provincessuggested by this study (see Table 4) and discussion. A possible east-west split in the southern Mozambique Channel is shown by a dotted line.doi:10.1371/journal.pone.0045013.g002
Biogeography of Western Indian Ocean Corals
PLOS ONE | www.plosone.org 3 September 2012 | Volume 7 | Issue 9 | e45013
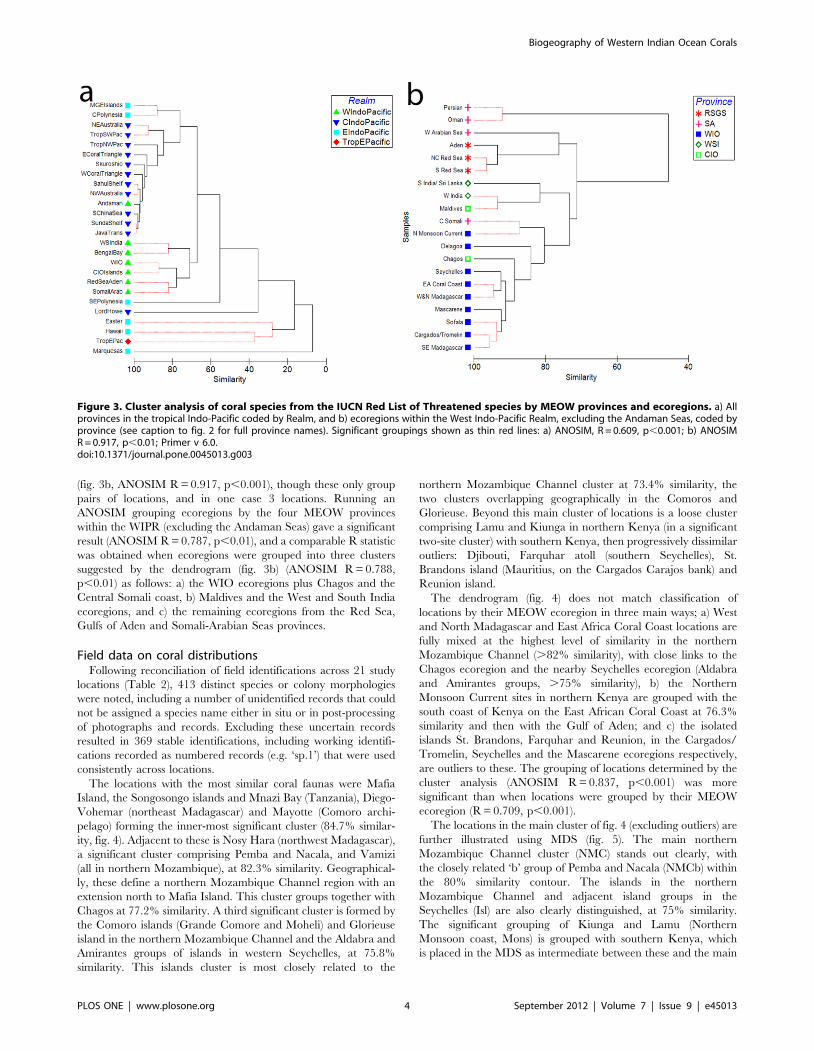
(fig. 3b, ANOSIM R = 0.917, p,0.001), though these only group
pairs of locations, and in one case 3 locations. Running an
ANOSIM grouping ecoregions by the four MEOW provinces
within the WIPR (excluding the Andaman Seas) gave a significant
result (ANOSIM R = 0.787, p,0.01), and a comparable R statistic
was obtained when ecoregions were grouped into three clusters
suggested by the dendrogram (fig. 3b) (ANOSIM R = 0.788,
p,0.01) as follows: a) the WIO ecoregions plus Chagos and the
Central Somali coast, b) Maldives and the West and South India
ecoregions, and c) the remaining ecoregions from the Red Sea,
Gulfs of Aden and Somali-Arabian Seas provinces.
Field data on coral distributionsFollowing reconciliation of field identifications across 21 study
locations (Table 2), 413 distinct species or colony morphologies
were noted, including a number of unidentified records that could
not be assigned a species name either in situ or in post-processing
of photographs and records. Excluding these uncertain records
resulted in 369 stable identifications, including working identifi-
cations recorded as numbered records (e.g. ‘sp.1’) that were used
consistently across locations.
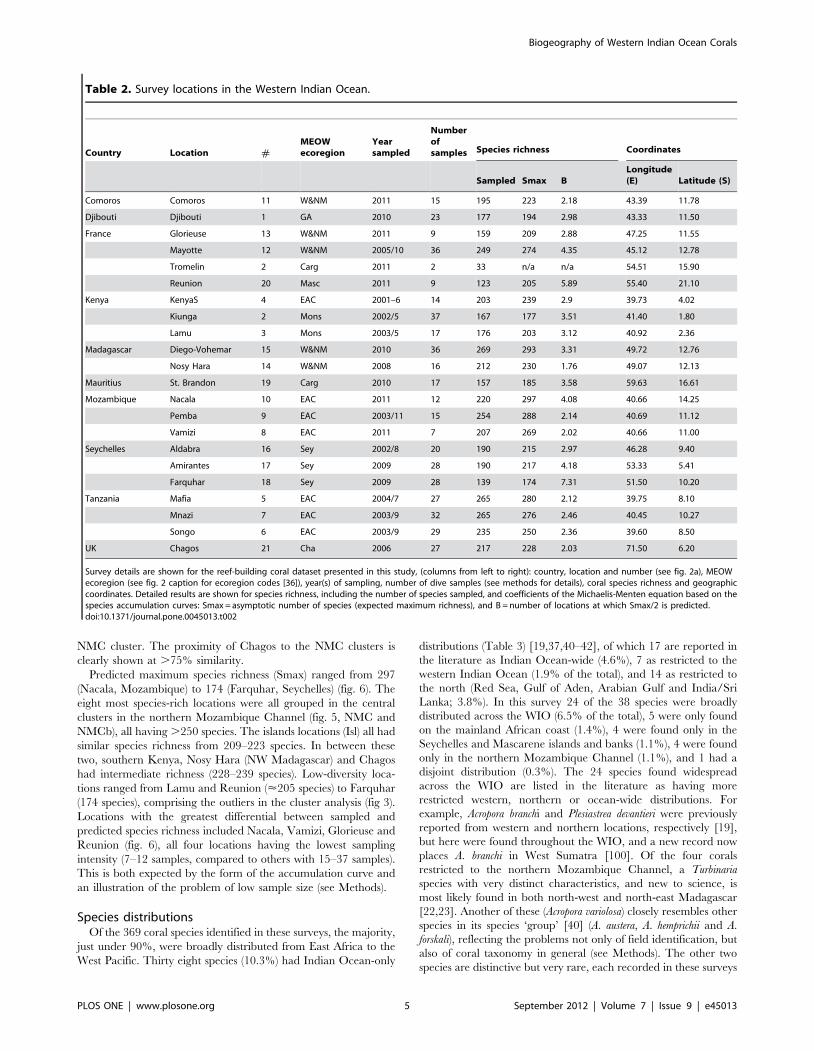
The locations with the most similar coral faunas were Mafia
Island, the Songosongo islands and Mnazi Bay (Tanzania), Diego-
Vohemar (northeast Madagascar) and Mayotte (Comoro archi-
pelago) forming the inner-most significant cluster (84.7% similar-
ity, fig. 4). Adjacent to these is Nosy Hara (northwest Madagascar),
a significant cluster comprising Pemba and Nacala, and Vamizi
(all in northern Mozambique), at 82.3% similarity. Geographical-
ly, these define a northern Mozambique Channel region with an
extension north to Mafia Island. This cluster groups together with
Chagos at 77.2% similarity. A third significant cluster is formed by
the Comoro islands (Grande Comore and Moheli) and Glorieuse
island in the northern Mozambique Channel and the Aldabra and
Amirantes groups of islands in western Seychelles, at 75.8%
similarity. This islands cluster is most closely related to the
northern Mozambique Channel cluster at 73.4% similarity, the
two clusters overlapping geographically in the Comoros and
Glorieuse. Beyond this main cluster of locations is a loose cluster
comprising Lamu and Kiunga in northern Kenya (in a significant
two-site cluster) with southern Kenya, then progressively dissimilar
outliers: Djibouti, Farquhar atoll (southern Seychelles), St.
Brandons island (Mauritius, on the Cargados Carajos bank) and
Reunion island.
The dendrogram (fig. 4) does not match classification of
locations by their MEOW ecoregion in three main ways; a) West
and North Madagascar and East Africa Coral Coast locations are
fully mixed at the highest level of similarity in the northern
Mozambique Channel (.82% similarity), with close links to the
Chagos ecoregion and the nearby Seychelles ecoregion (Aldabra
and Amirantes groups, .75% similarity), b) the Northern
Monsoon Current sites in northern Kenya are grouped with the
south coast of Kenya on the East African Coral Coast at 76.3%
similarity and then with the Gulf of Aden; and c) the isolated
islands St. Brandons, Farquhar and Reunion, in the Cargados/
Tromelin, Seychelles and the Mascarene ecoregions respectively,
are outliers to these. The grouping of locations determined by the
cluster analysis (ANOSIM R = 0.837, p,0.001) was more
significant than when locations were grouped by their MEOW
ecoregion (R = 0.709, p,0.001).
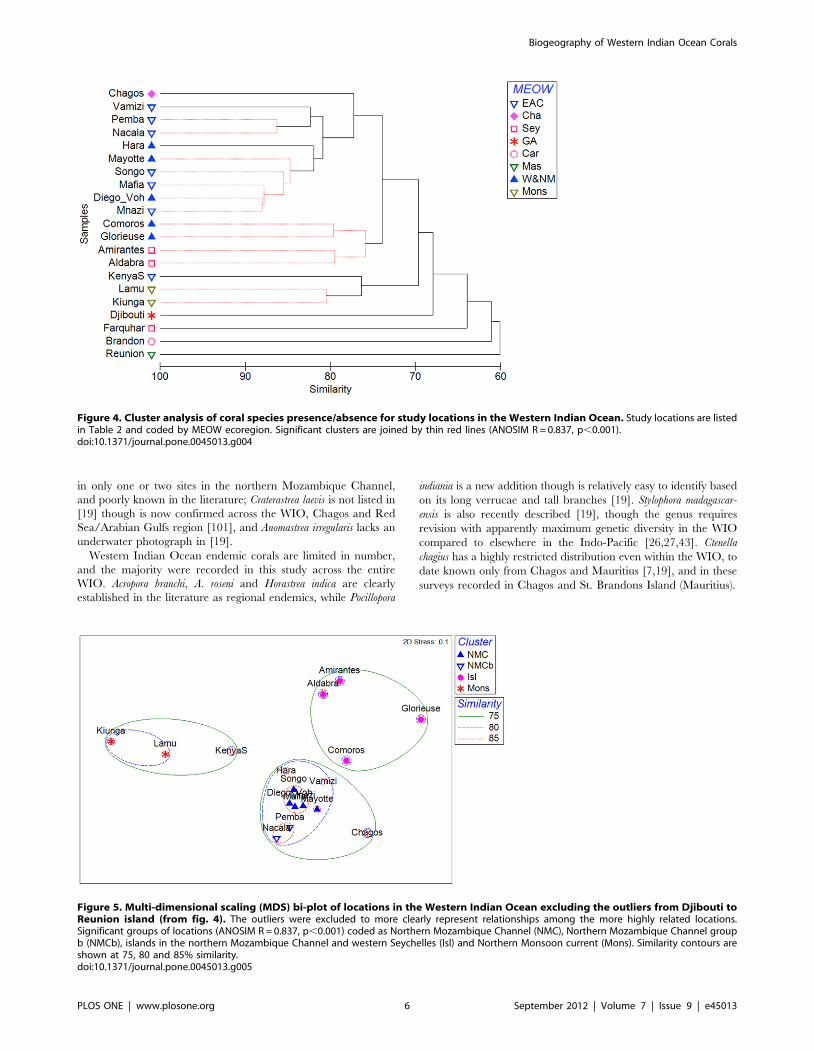
The locations in the main cluster of fig. 4 (excluding outliers) are
further illustrated using MDS (fig. 5). The main northern
Mozambique Channel cluster (NMC) stands out clearly, with
the closely related ‘b’ group of Pemba and Nacala (NMCb) within
the 80% similarity contour. The islands in the northern
Mozambique Channel and adjacent island groups in the
Seychelles (Isl) are also clearly distinguished, at 75% similarity.
The significant grouping of Kiunga and Lamu (Northern
Monsoon coast, Mons) is grouped with southern Kenya, which
is placed in the MDS as intermediate between these and the main
Figure 3. Cluster analysis of coral species from the IUCN Red List of Threatened species by MEOW provinces and ecoregions. a) Allprovinces in the tropical Indo-Pacific coded by Realm, and b) ecoregions within the West Indo-Pacific Realm, excluding the Andaman Seas, coded byprovince (see caption to fig. 2 for full province names). Significant groupings shown as thin red lines: a) ANOSIM, R = 0.609, p,0.001; b) ANOSIMR = 0.917, p,0.01; Primer v 6.0.doi:10.1371/journal.pone.0045013.g003
Biogeography of Western Indian Ocean Corals
PLOS ONE | www.plosone.org 4 September 2012 | Volume 7 | Issue 9 | e45013
NMC cluster. The proximity of Chagos to the NMC clusters is
clearly shown at .75% similarity.
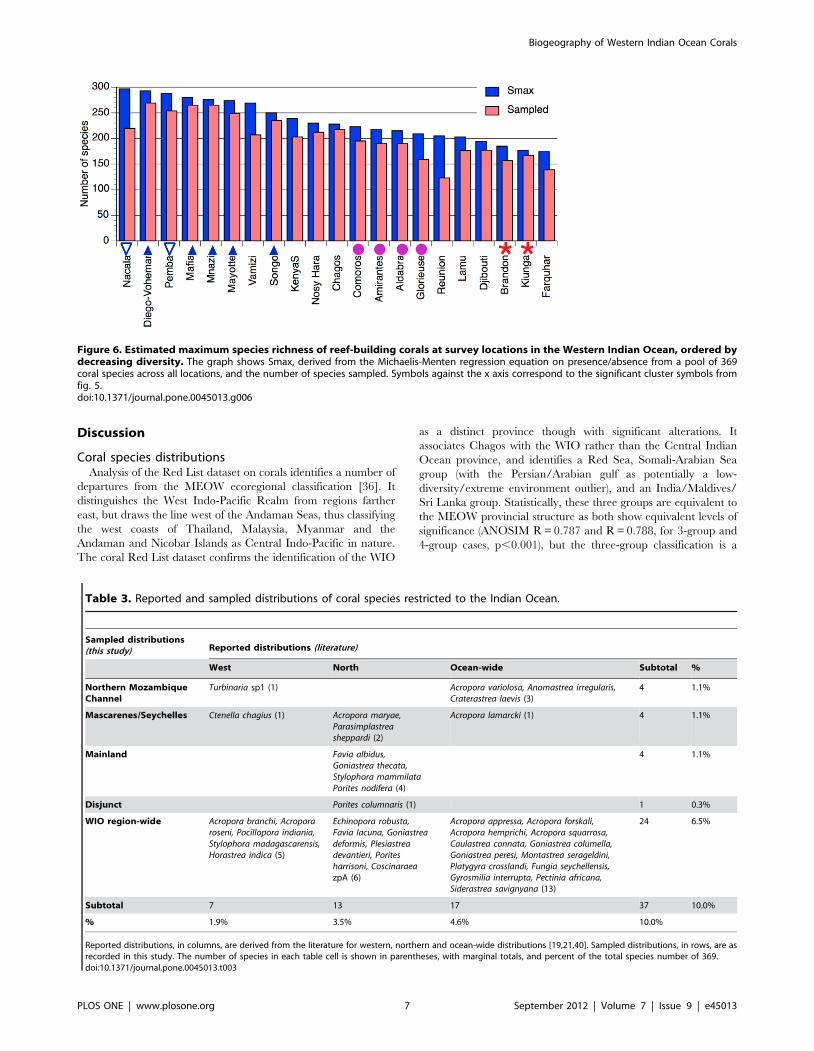
Predicted maximum species richness (Smax) ranged from 297
(Nacala, Mozambique) to 174 (Farquhar, Seychelles) (fig. 6). The
eight most species-rich locations were all grouped in the central
clusters in the northern Mozambique Channel (fig. 5, NMC and
NMCb), all having .250 species. The islands locations (Isl) all had
similar species richness from 209–223 species. In between these
two, southern Kenya, Nosy Hara (NW Madagascar) and Chagos
had intermediate richness (228–239 species). Low-diversity loca-
tions ranged from Lamu and Reunion (<205 species) to Farquhar
(174 species), comprising the outliers in the cluster analysis (fig 3).
Locations with the greatest differential between sampled and
predicted species richness included Nacala, Vamizi, Glorieuse and
Reunion (fig. 6), all four locations having the lowest sampling
intensity (7–12 samples, compared to others with 15–37 samples).
This is both expected by the form of the accumulation curve and
an illustration of the problem of low sample size (see Methods).
Species distributionsOf the 369 coral species identified in these surveys, the majority,
just under 90%, were broadly distributed from East Africa to the
West Pacific. Thirty eight species (10.3%) had Indian Ocean-only
distributions (Table 3) [19,37,40–42], of which 17 are reported in
the literature as Indian Ocean-wide (4.6%), 7 as restricted to the
western Indian Ocean (1.9% of the total), and 14 as restricted to
the north (Red Sea, Gulf of Aden, Arabian Gulf and India/Sri
Lanka; 3.8%). In this survey 24 of the 38 species were broadly
distributed across the WIO (6.5% of the total), 5 were only found
on the mainland African coast (1.4%), 4 were found only in the
Seychelles and Mascarene islands and banks (1.1%), 4 were found
only in the northern Mozambique Channel (1.1%), and 1 had a
disjoint distribution (0.3%). The 24 species found widespread
across the WIO are listed in the literature as having more
restricted western, northern or ocean-wide distributions. For
example, Acropora branchi and Plesiastrea devantieri were previously
reported from western and northern locations, respectively [19],
but here were found throughout the WIO, and a new record now
places A. branchi in West Sumatra [100]. Of the four corals
restricted to the northern Mozambique Channel, a Turbinaria
species with very distinct characteristics, and new to science, is
most likely found in both north-west and north-east Madagascar
[22,23]. Another of these (Acropora variolosa) closely resembles other
species in its species ‘group’ [40] (A. austera, A. hemprichii and A.
forskali), reflecting the problems not only of field identification, but
also of coral taxonomy in general (see Methods). The other two
species are distinctive but very rare, each recorded in these surveys
Table 2. Survey locations in the Western Indian Ocean.
Country Location #MEOWecoregion
Yearsampled
Numberofsamples Species richness Coordinates
Sampled Smax BLongitude(E) Latitude (S)
Comoros Comoros 11 W&NM 2011 15 195 223 2.18 43.39 11.78
Djibouti Djibouti 1 GA 2010 23 177 194 2.98 43.33 11.50
France Glorieuse 13 W&NM 2011 9 159 209 2.88 47.25 11.55
Mayotte 12 W&NM 2005/10 36 249 274 4.35 45.12 12.78
Tromelin 2 Carg 2011 2 33 n/a n/a 54.51 15.90
Reunion 20 Masc 2011 9 123 205 5.89 55.40 21.10
Kenya KenyaS 4 EAC 2001–6 14 203 239 2.9 39.73 4.02
Kiunga 2 Mons 2002/5 37 167 177 3.51 41.40 1.80
Lamu 3 Mons 2003/5 17 176 203 3.12 40.92 2.36
Madagascar Diego-Vohemar 15 W&NM 2010 36 269 293 3.31 49.72 12.76
Nosy Hara 14 W&NM 2008 16 212 230 1.76 49.07 12.13
Mauritius St. Brandon 19 Carg 2010 17 157 185 3.58 59.63 16.61
Mozambique Nacala 10 EAC 2011 12 220 297 4.08 40.66 14.25
Pemba 9 EAC 2003/11 15 254 288 2.14 40.69 11.12
Vamizi 8 EAC 2011 7 207 269 2.02 40.66 11.00
Seychelles Aldabra 16 Sey 2002/8 20 190 215 2.97 46.28 9.40
Amirantes 17 Sey 2009 28 190 217 4.18 53.33 5.41
Farquhar 18 Sey 2009 28 139 174 7.31 51.50 10.20
Tanzania Mafia 5 EAC 2004/7 27 265 280 2.12 39.75 8.10
Mnazi 7 EAC 2003/9 32 265 276 2.46 40.45 10.27
Songo 6 EAC 2003/9 29 235 250 2.36 39.60 8.50
UK Chagos 21 Cha 2006 27 217 228 2.03 71.50 6.20
Survey details are shown for the reef-building coral dataset presented in this study, (columns from left to right): country, location and number (see fig. 2a), MEOWecoregion (see fig. 2 caption for ecoregion codes [36]), year(s) of sampling, number of dive samples (see methods for details), coral species richness and geographiccoordinates. Detailed results are shown for species richness, including the number of species sampled, and coefficients of the Michaelis-Menten equation based on thespecies accumulation curves: Smax = asymptotic number of species (expected maximum richness), and B = number of locations at which Smax/2 is predicted.doi:10.1371/journal.pone.0045013.t002
Biogeography of Western Indian Ocean Corals
PLOS ONE | www.plosone.org 5 September 2012 | Volume 7 | Issue 9 | e45013
in only one or two sites in the northern Mozambique Channel,
and poorly known in the literature; Craterastrea laevis is not listed in
[19] though is now confirmed across the WIO, Chagos and Red
Sea/Arabian Gulfs region [101], and Anomastrea irregularis lacks an
underwater photograph in [19].
Western Indian Ocean endemic corals are limited in number,
and the majority were recorded in this study across the entire
WIO. Acropora branchi, A. roseni and Horastrea indica are clearly
established in the literature as regional endemics, while Pocillopora
indiania is a new addition though is relatively easy to identify based
on its long verrucae and tall branches [19]. Stylophora madagascar-
ensis is also recently described [19], though the genus requires
revision with apparently maximum genetic diversity in the WIO
compared to elsewhere in the Indo-Pacific [26,27,43]. Ctenella
chagius has a highly restricted distribution even within the WIO, to
date known only from Chagos and Mauritius [7,19], and in these
surveys recorded in Chagos and St. Brandons Island (Mauritius).
Figure 4. Cluster analysis of coral species presence/absence for study locations in the Western Indian Ocean. Study locations are listedin Table 2 and coded by MEOW ecoregion. Significant clusters are joined by thin red lines (ANOSIM R = 0.837, p,0.001).doi:10.1371/journal.pone.0045013.g004
Figure 5. Multi-dimensional scaling (MDS) bi-plot of locations in the Western Indian Ocean excluding the outliers from Djibouti toReunion island (from fig. 4). The outliers were excluded to more clearly represent relationships among the more highly related locations.Significant groups of locations (ANOSIM R = 0.837, p,0.001) coded as Northern Mozambique Channel (NMC), Northern Mozambique Channel groupb (NMCb), islands in the northern Mozambique Channel and western Seychelles (Isl) and Northern Monsoon current (Mons). Similarity contours areshown at 75, 80 and 85% similarity.doi:10.1371/journal.pone.0045013.g005
Biogeography of Western Indian Ocean Corals
PLOS ONE | www.plosone.org 6 September 2012 | Volume 7 | Issue 9 | e45013
Discussion
Coral species distributionsAnalysis of the Red List dataset on corals identifies a number of
departures from the MEOW ecoregional classification [36]. It
distinguishes the West Indo-Pacific Realm from regions farther
east, but draws the line west of the Andaman Seas, thus classifying
the west coasts of Thailand, Malaysia, Myanmar and the
Andaman and Nicobar Islands as Central Indo-Pacific in nature.
The coral Red List dataset confirms the identification of the WIO
as a distinct province though with significant alterations. It
associates Chagos with the WIO rather than the Central Indian
Ocean province, and identifies a Red Sea, Somali-Arabian Sea
group (with the Persian/Arabian gulf as potentially a low-
diversity/extreme environment outlier), and an India/Maldives/
Sri Lanka group. Statistically, these three groups are equivalent to
the MEOW provincial structure as both show equivalent levels of
significance (ANOSIM R = 0.787 and R = 0.788, for 3-group and
4-group cases, p,0.001), but the three-group classification is a
Figure 6. Estimated maximum species richness of reef-building corals at survey locations in the Western Indian Ocean, ordered bydecreasing diversity. The graph shows Smax, derived from the Michaelis-Menten regression equation on presence/absence from a pool of 369coral species across all locations, and the number of species sampled. Symbols against the x axis correspond to the significant cluster symbols fromfig. 5.doi:10.1371/journal.pone.0045013.g006
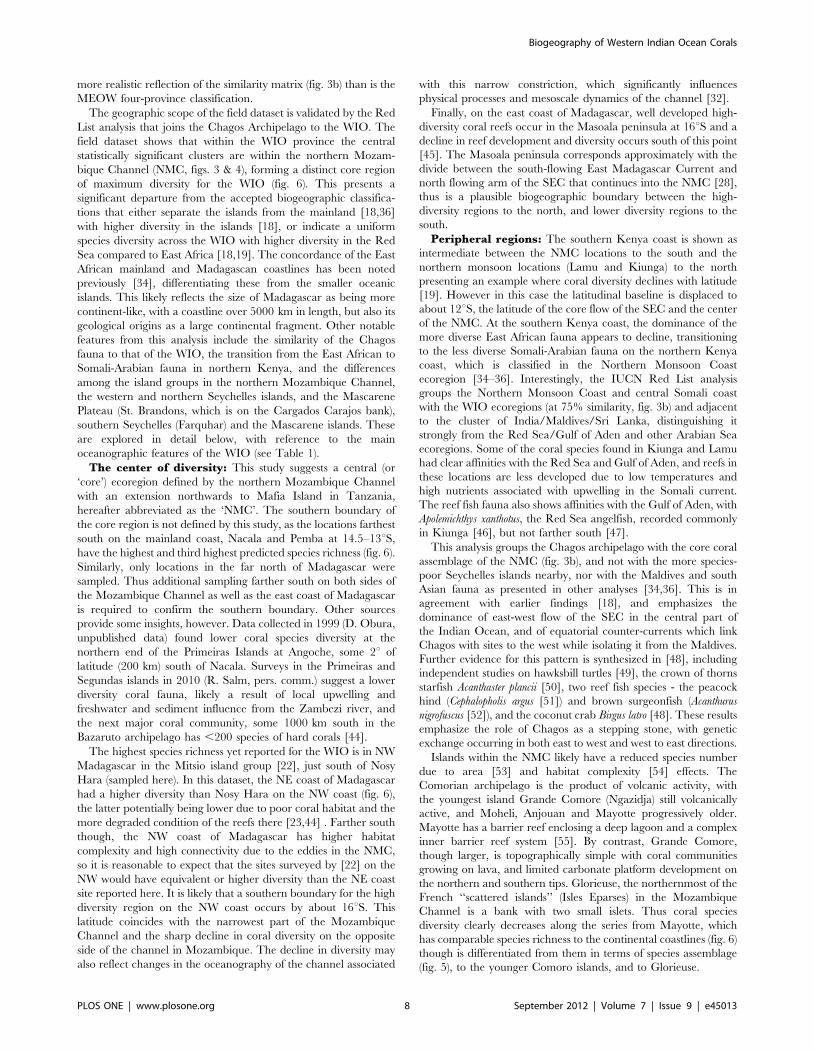
Table 3. Reported and sampled distributions of coral species restricted to the Indian Ocean.
Sampled distributions(this study) Reported distributions (literature)
West North Ocean-wide Subtotal %
Northern MozambiqueChannel
Turbinaria sp1 (1) Acropora variolosa, Anomastrea irregularis,Craterastrea laevis (3)
4 1.1%
Mascarenes/Seychelles Ctenella chagius (1) Acropora maryae,Parasimplastreasheppardi (2)
Acropora lamarcki (1) 4 1.1%
Mainland Favia albidus,Goniastrea thecata,Stylophora mammilataPorites nodifera (4)
4 1.1%
Disjunct Porites columnaris (1) 1 0.3%
WIO region-wide Acropora branchi, Acroporaroseni, Pocillopora indiania,Stylophora madagascarensis,Horastrea indica (5)
Echinopora robusta,Favia lacuna, Goniastreadeformis, Plesiastreadevantieri, Poritesharrisoni, CoscinaraeazpA (6)
Acropora appressa, Acropora forskali,Acropora hemprichi, Acropora squarrosa,Caulastrea connata, Goniastrea columella,Goniastrea peresi, Montastrea serageldini,Platygyra crosslandi, Fungia seychellensis,Gyrosmilia interrupta, Pectinia africana,Siderastrea savignyana (13)
24 6.5%
Subtotal 7 13 17 37 10.0%
% 1.9% 3.5% 4.6% 10.0%
Reported distributions, in columns, are derived from the literature for western, northern and ocean-wide distributions [19,21,40]. Sampled distributions, in rows, are asrecorded in this study. The number of species in each table cell is shown in parentheses, with marginal totals, and percent of the total species number of 369.doi:10.1371/journal.pone.0045013.t003
Biogeography of Western Indian Ocean Corals
PLOS ONE | www.plosone.org 7 September 2012 | Volume 7 | Issue 9 | e45013
more realistic reflection of the similarity matrix (fig. 3b) than is the
MEOW four-province classification.
The geographic scope of the field dataset is validated by the Red
List analysis that joins the Chagos Archipelago to the WIO. The
field dataset shows that within the WIO province the central
statistically significant clusters are within the northern Mozam-
bique Channel (NMC, figs. 3 & 4), forming a distinct core region
of maximum diversity for the WIO (fig. 6). This presents a
significant departure from the accepted biogeographic classifica-
tions that either separate the islands from the mainland [18,36]
with higher diversity in the islands [18], or indicate a uniform
species diversity across the WIO with higher diversity in the Red
Sea compared to East Africa [18,19]. The concordance of the East
African mainland and Madagascan coastlines has been noted
previously [34], differentiating these from the smaller oceanic
islands. This likely reflects the size of Madagascar as being more
continent-like, with a coastline over 5000 km in length, but also its
geological origins as a large continental fragment. Other notable
features from this analysis include the similarity of the Chagos
fauna to that of the WIO, the transition from the East African to
Somali-Arabian fauna in northern Kenya, and the differences
among the island groups in the northern Mozambique Channel,
the western and northern Seychelles islands, and the Mascarene
Plateau (St. Brandons, which is on the Cargados Carajos bank),
southern Seychelles (Farquhar) and the Mascarene islands. These
are explored in detail below, with reference to the main
oceanographic features of the WIO (see Table 1).
The center of diversity: This study suggests a central (or
‘core’) ecoregion defined by the northern Mozambique Channel
with an extension northwards to Mafia Island in Tanzania,
hereafter abbreviated as the ‘NMC’. The southern boundary of
the core region is not defined by this study, as the locations farthest
south on the mainland coast, Nacala and Pemba at 14.5–13uS,
have the highest and third highest predicted species richness (fig. 6).
Similarly, only locations in the far north of Madagascar were
sampled. Thus additional sampling farther south on both sides of
the Mozambique Channel as well as the east coast of Madagascar
is required to confirm the southern boundary. Other sources
provide some insights, however. Data collected in 1999 (D. Obura,
unpublished data) found lower coral species diversity at the
northern end of the Primeiras Islands at Angoche, some 2u of
latitude (200 km) south of Nacala. Surveys in the Primeiras and
Segundas islands in 2010 (R. Salm, pers. comm.) suggest a lower
diversity coral fauna, likely a result of local upwelling and
freshwater and sediment influence from the Zambezi river, and
the next major coral community, some 1000 km south in the
Bazaruto archipelago has ,200 species of hard corals [44].
The highest species richness yet reported for the WIO is in NW
Madagascar in the Mitsio island group [22], just south of Nosy
Hara (sampled here). In this dataset, the NE coast of Madagascar
had a higher diversity than Nosy Hara on the NW coast (fig. 6),
the latter potentially being lower due to poor coral habitat and the
more degraded condition of the reefs there [23,44] . Farther south
though, the NW coast of Madagascar has higher habitat
complexity and high connectivity due to the eddies in the NMC,
so it is reasonable to expect that the sites surveyed by [22] on the
NW would have equivalent or higher diversity than the NE coast
site reported here. It is likely that a southern boundary for the high
diversity region on the NW coast occurs by about 16uS. This
latitude coincides with the narrowest part of the Mozambique
Channel and the sharp decline in coral diversity on the opposite
side of the channel in Mozambique. The decline in diversity may
also reflect changes in the oceanography of the channel associated
with this narrow constriction, which significantly influences
physical processes and mesoscale dynamics of the channel [32].
Finally, on the east coast of Madagascar, well developed high-
diversity coral reefs occur in the Masoala peninsula at 16uS and a
decline in reef development and diversity occurs south of this point
[45]. The Masoala peninsula corresponds approximately with the
divide between the south-flowing East Madagascar Current and
north flowing arm of the SEC that continues into the NMC [28],
thus is a plausible biogeographic boundary between the high-
diversity regions to the north, and lower diversity regions to the
south.
Peripheral regions: The southern Kenya coast is shown as
intermediate between the NMC locations to the south and the
northern monsoon locations (Lamu and Kiunga) to the north
presenting an example where coral diversity declines with latitude
[19]. However in this case the latitudinal baseline is displaced to
about 12uS, the latitude of the core flow of the SEC and the center
of the NMC. At the southern Kenya coast, the dominance of the
more diverse East African fauna appears to decline, transitioning
to the less diverse Somali-Arabian fauna on the northern Kenya
coast, which is classified in the Northern Monsoon Coast
ecoregion [34–36]. Interestingly, the IUCN Red List analysis
groups the Northern Monsoon Coast and central Somali coast
with the WIO ecoregions (at 75% similarity, fig. 3b) and adjacent
to the cluster of India/Maldives/Sri Lanka, distinguishing it
strongly from the Red Sea/Gulf of Aden and other Arabian Sea
ecoregions. Some of the coral species found in Kiunga and Lamu
had clear affinities with the Red Sea and Gulf of Aden, and reefs in
these locations are less developed due to low temperatures and
high nutrients associated with upwelling in the Somali current.
The reef fish fauna also shows affinities with the Gulf of Aden, with
Apolemichthys xanthotus, the Red Sea angelfish, recorded commonly
in Kiunga [46], but not farther south [47].
This analysis groups the Chagos archipelago with the core coral
assemblage of the NMC (fig. 3b), and not with the more species-
poor Seychelles islands nearby, nor with the Maldives and south
Asian fauna as presented in other analyses [34,36]. This is in
agreement with earlier findings [18], and emphasizes the
dominance of east-west flow of the SEC in the central part of
the Indian Ocean, and of equatorial counter-currents which link
Chagos with sites to the west while isolating it from the Maldives.
Further evidence for this pattern is synthesized in [48], including
independent studies on hawksbill turtles [49], the crown of thorns
starfish Acanthaster plancii [50], two reef fish species - the peacock
hind (Cephalopholis argus [51]) and brown surgeonfish (Acanthurus
nigrofuscus [52]), and the coconut crab Birgus latro [48]. These results
emphasize the role of Chagos as a stepping stone, with genetic
exchange occurring in both east to west and west to east directions.
Islands within the NMC likely have a reduced species number
due to area [53] and habitat complexity [54] effects. The
Comorian archipelago is the product of volcanic activity, with
the youngest island Grande Comore (Ngazidja) still volcanically
active, and Moheli, Anjouan and Mayotte progressively older.
Mayotte has a barrier reef enclosing a deep lagoon and a complex
inner barrier reef system [55]. By contrast, Grande Comore,
though larger, is topographically simple with coral communities
growing on lava, and limited carbonate platform development on
the northern and southern tips. Glorieuse, the northernmost of the
French ‘‘scattered islands’’ (Isles Eparses) in the Mozambique
Channel is a bank with two small islets. Thus coral species
diversity clearly decreases along the series from Mayotte, which
has comparable species richness to the continental coastlines (fig. 6)
though is differentiated from them in terms of species assemblage
(fig. 5), to the younger Comoro islands, and to Glorieuse.
Biogeography of Western Indian Ocean Corals
PLOS ONE | www.plosone.org 8 September 2012 | Volume 7 | Issue 9 | e45013
Support for the Seychelles and Cargados/Tromelin ecoregions
(see fig. 2a) is equivocal in this dataset. At the far western end of
this region, the Aldabra and Amirantes groups of islands lie 150
and 900 km, respectively, from the high diversity NMC.
Nevertheless, they have a very similar coral assemblage, distinct
from that of the NMC. In the narrow gap between Aldabra and
the Comoros, the SEC, deflected northwards by the tip of
Madagascar forms a narrow jet that feeds into the EACC, in the
region of the Glorioso Front [30]. This current jet may isolate the
western Seychelles from the more diverse NMC and East African
coast, resulting in the differentiated fauna in the western Seychelles
that itself is well defined (fig. 5) and likely is consistent throughout
the northern and western islands [56,57].
St. Brandons and Farquhar islands lie in the main flow of the
SEC and upstream of the NMC, though Farquhar is classified in
the Seychelles ecoregion (96), and St. Brandons is in the
Cargados/Tromelin ecoregion [36]. They are both shallow reef
systems on broad banks with high sediment transport that is not
conducive to coral growth [58]. Farquhar experiences equatorial
upwelling on its southern side [59], which likely also occurs in
other parts of the banks [29] and may also influence St. Brandons
Island. The extensive banks of the Mascarene Plateau (the Saya de
Malha, Nazareth and Cargados Carajos banks) are relatively flat
with large areas between 50 and 20 m deep, and the shallowest
ridges do not break the surface of the water, except at St.
Brandons Island at the southern extremity. Habitat quality on
these bank systems appears to be poor for reef-building corals, and
those parts that have been surveyed are predominantly covered by
seagrass [61]. Tromelin island, an isolated volcanic peak, was
surveyed, but with only 2 sample points could not be included in
this analysis. An exceptionally low diversity of 33 species was
found, consistent with 26 species reported in [60], compared to an
average of 107 and range of 59–155 species in 2 samples at all the
other locations. This suggests its small size and isolation result in
low diversity in spite of it being in the main flow of the SEC, and
that it may not play an important role as a stepping stone in the
region except for its limited number of (common) species. These
disparate observations suggest that the depauperate coral fauna of
the Mascarene Plateau (e.g. St. Brandons) and isolated islands in
the Mascarene Basin (e.g. Tromelin, Farquhar) may warrant
combining them in a distinct ecoregion, covering the entire
Mascarene Plateau and southern Seychelles region. Further
research on the oceanography and habitats of the Mascarene
Plateau and Basin is needed, as existing studies on interactions
between the banks and the SEC [29,62] are suggestive of strong
and highly variable physical-biological coupling that may exert
control on these patterns.
To confirm the biogeographic patterns identified here requires
filling a number of gaps with future surveys: along the east and
west Madagascar and Mozambique coastlines to confirm the
southward boundary of the core region and gradient in coral
species diversity; northern Tanzania and Kenya to confirm the
gradient in diversity from central Tanzania to central Kenya; the
Seychelles granitic islands and Mascarene Plateau to determine
subregional structure in the Seychelles region; and the Mascarene
islands (Reunion, Mauritius, Rodrigues). In addition, further
integration of existing datasets (e.g. [18,42]) will enable revisions to
existing large-scale analyses to test the findings of this study.
Genetic research will also provide significant insights, at two levels:
within species, to identify population structure across the WIO in
relation to the main currents and present-day connectivity, and
across species, to resolve difficulties in determining species
boundaries and phylogeographic relationships that underlie
present-day biogeographic patterns with historical influences.
Finally, corroborating these patterns across multiple taxonomic
groups will be necessary to determine the generality of these
findings and fully justify the biogeographic conclusions of this
study.
The name gameThe results reported here confirm the low degree of endemism
in corals of the western Indian Ocean, with the added detail that
endemism to subregions within the WIO is highly limited. Only
seven species are apparently exclusive to the WIO (Table 3) [19,
v3: p412]: five of these are found across the entire region, while 1
is limited to Chagos and the Mascarene Plateau (Ctenella chagius),
and 1 may be limited to northern Madagascar (Turbinaria sp.). Of
the five widespread endemics, 1 is highly distinctive phylogenet-
ically (Horastrea indica), while the others are from genetically diverse
and phenotypically variable Indo-West Pacific genera (Acropora,
Pocillopora, Stylophora). The remaining 31 species occur in other
parts of the Indian Ocean, but due to limited work in the WIO
historically, many of these were thought to be absent from the
WIO and thus endemic to these other regions. For example,
Plesiastrea devantieri was identified recently [19,63] and thought to
be endemic to the Red Sea, but is widely distributed and common
throughout the WIO. In this study 11 of these 31 species had
restricted distributions within the WIO, likely a reflection of their
rarity and difficulty in finding them rather than true absence, while
20 were widespread.
Comparing the results from this study with other regional
analyses illustrates two of the key problems with coral species work
in the last century: taxonomic confusion resulting from coral
taxonomy being based on collected skeletons with until recently
very little ecological, physiological or genetic foundations, and very
low consistency in sampling and observations across geographic
locations and observers. The scale of the first problem is
underlined by the finding that most coral families and a significant
number of coral genera are not monophyletic [64,65], with a
variety of sources showing the lack of correspondence between
morphological and genetic data in several common genera, for
example Acropora [66], Platygyra [67], Porites [68], Stylophora [27] and
Psammocora [69], and major families, for example the Faviidae and
Mussidae [70,71]. Within the WIO, the problem is illustrated by
Sheppard’s [18] reduction of a compiled list of 796 nominal
species names from the literature to 439 synonymzed names that
he judged to be a correct reflection of species taxonomy. The
natural history method applied in this study, of iterative reanalysis
of in situ species and ecomorph identifications across reef habitats
and locations across a consistent biogeographic region, referenced
by a ‘voucher’ collection of underwater photographs [72], has the
benefit of a more holistic inclusion of potential variation in a
species appearance under many different settings. That these
identifications are not referenced to collected voucher specimens is
a major weakness in classical taxonomic terms, though the
problems of this latter approach demand exploration of alternative
approaches (see Methods).
The second problem, of low consistency in sampling and
observations among different studies and across geographic
locations is illustrated by comparing areas included in this study
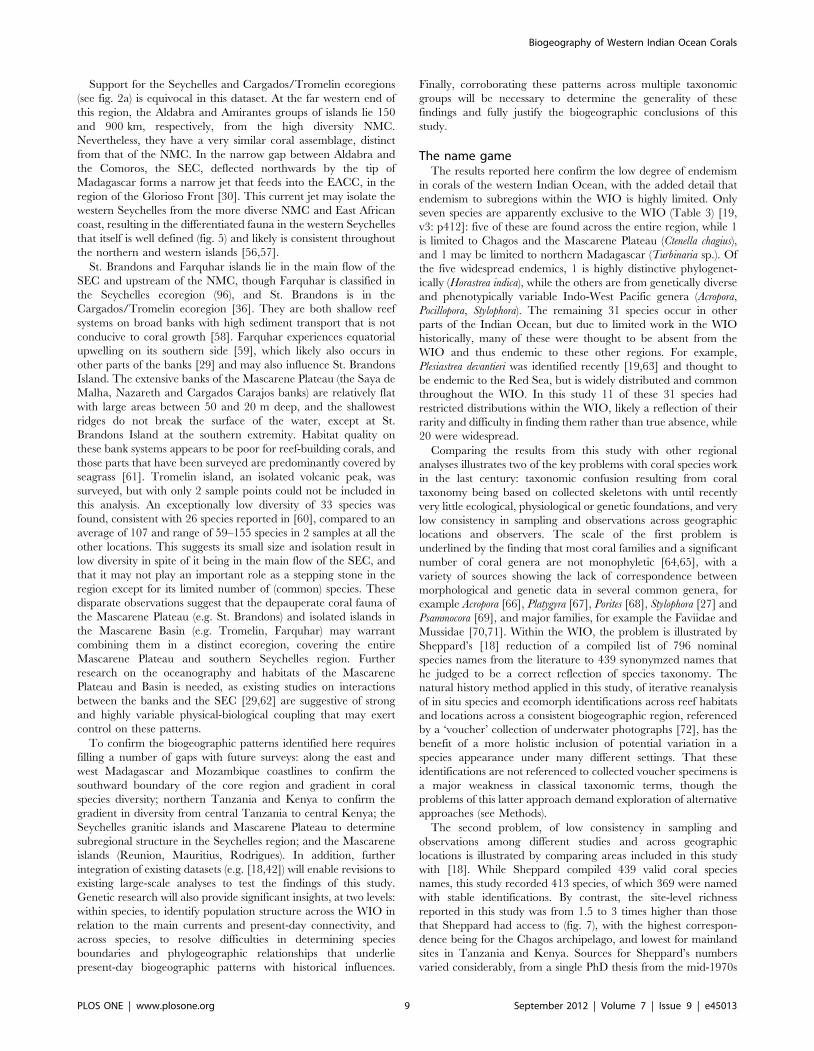
with [18]. While Sheppard compiled 439 valid coral species
names, this study recorded 413 species, of which 369 were named
with stable identifications. By contrast, the site-level richness
reported in this study was from 1.5 to 3 times higher than those
that Sheppard had access to (fig. 7), with the highest correspon-
dence being for the Chagos archipelago, and lowest for mainland
sites in Tanzania and Kenya. Sources for Sheppard’s numbers
varied considerably, from a single PhD thesis from the mid-1970s
Biogeography of Western Indian Ocean Corals
PLOS ONE | www.plosone.org 9 September 2012 | Volume 7 | Issue 9 | e45013
for northern Tanzania [1] to multiple higher level studies for the
Red Sea [73–75], and Sheppard’s own consistent body of work for
Chagos [76].
This comparison also introduces the question of what the total
pool of coral species may be for the area covered by this study.
Veron and Turak recorded a total of 323 species from their study,
which combined with past studies gave a total richness of 380 for
Madagascar [22]. This study compiled 369 identified species
across the whole WIO region, with an additional 44 species that
were un-named, for a total of 413 species. The IUCN Red List has
a total of 398 species for the WIO [37]. The difficulties of species
identification in several genera also suggests that further
taxonomic work in the WIO will add several tens of names to
existing species lists. Further, additional detailed sampling
particularly in the NMC will likely add more species, as has been
done in 2011 for Acropora specimens from Mayotte [77]. Therefore,
it is reasonable to expect that the regional species pool for the
WIO will climb higher, and may approach 450 species, equivalent
in diversity to areas such as the Andaman Sea, Coral Sea and
northern Great Barrier Reef.
Drivers of regional patternsSeveral patterns can be distinguished, integrating oceanograph-
ic drivers with the diversity patterns presented in Table 1. The net
result is that genetic material may be transported into the WIO on
the SEC and retained within the northern Mozambique Channel
by eddies within the channel, resulting in accumulation of genetic
and species diversity, equivalent to mechanisms identified that
maintain high diversity in the Coral Triangle [19,20]. Export of
this material north and south occurs along essentially linear
transport corridors, resulting in attenuation of diversity outside of
the core region and transitions to lower-diversity colder-water
systems to the north and south. Some circular flow is possible in
gyres and return flows north and south of the SEC in the
Seychelles and Mascarene islands. Some interaction with the
northwestern regions of the Indian Ocean occurs as a result of
monsoon oscillations in currents. The net result of these is a ‘core
region’ of high diversity within the NMC, set in a coherent
biogeographic province at the level of the WIO that includes the
Chagos archipelago.
These drivers of connectivity and the species patterns presented
here suggest revisions to existing ecoregional classifications should
be considered. Inconsistencies among various biogeographic
classifications of the WIO based on different factors have been
noted [34], such as between those based on general climate [78]
versus hydrography [79]. However, no further analytical work was
carried out on these issues, and these inconsistencies have been
carried forward into practical ecoregional exercises focused on
conservation planning, splitting the core ecoregion of the WIO
down the middle of the Mozambique Channel [35,36]. Further, a
focus on carbon and highly productive coastal systems that have
defined the Large Marine Ecosystem (LME) approach [80] has
guided global marine ecosystem planning efforts. This has resulted
in regional structures that in some cases are inconsistent with
tropical oligotrophic systems; in the WIO, the Agulhas and Somali
Current LMEs extend outside of the regions in which these
currents have a sphere of influence, in an upstream direction, and
paradoxically split the WIO at its primary unifying feature, the
South Equatorial Current. To reconcile these inconsistencies
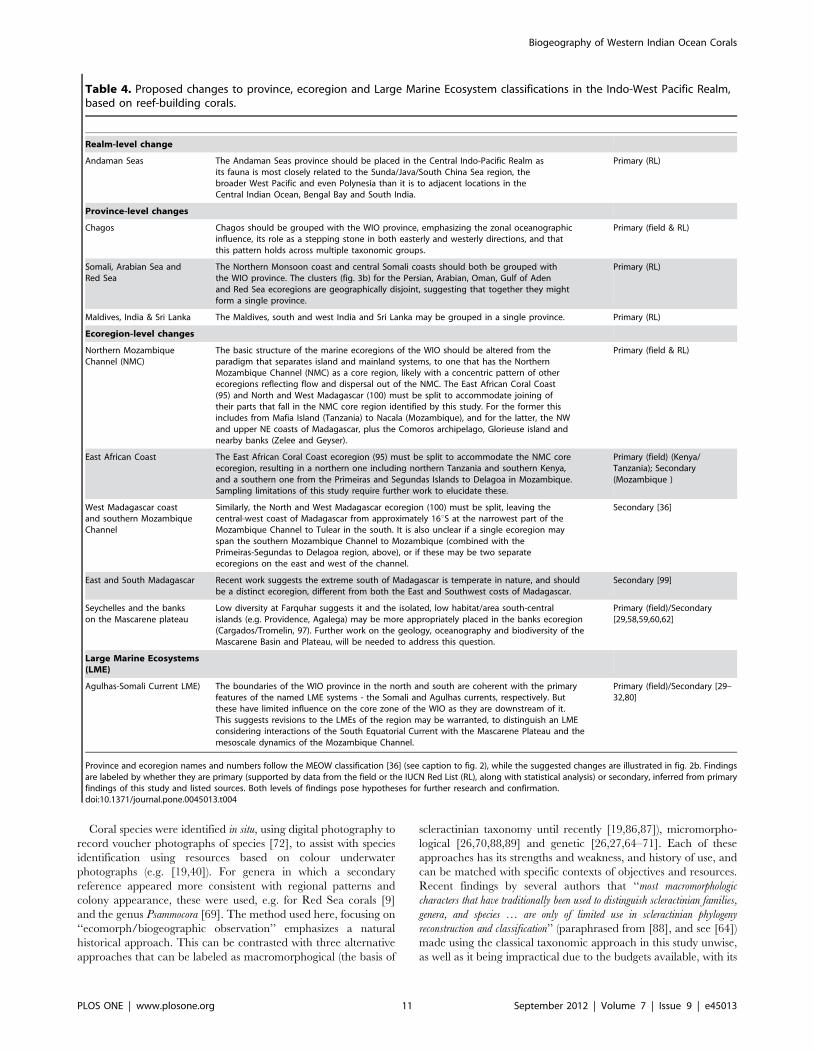
revisions to province and ecoregion level boundaries are proposed
(Table 4, fig. 2b). In considering these further, other species groups
and biogeographic processes need to be evaluated, to improve
understanding of diversity patterns in the Indian Ocean and
catalyze new work to fill in the glaring gaps in knowledge about
the marine biodiversity of the region [81,82].
This analysis has focused exclusively on present-day oceanog-
raphy as the driving force in establishing the biogeographic
patterns in the WIO. Historical forces are also important [83,84],
though beyond the scope of this analysis, and likely have a
significant influence on the diversity patterns and phylogenetic
origins of species of the western Indian Ocean [85].
Methods
Global coral species distributions were compiled for the IUCN
Red List of Threatened Species [37] as described in [38], and
extracted as presence/absence records by ecoregion [36]. Field
distributions of coral species were obtained for 22 locations in and
adjacent to the WIO, from October 2002 to September 2011
(fig. 2a, Table 2), though one location, Tromelin, was excluded
from analyses due to insufficient sample size. Due to variation in
the source of funding and principal objectives of each survey,
differing numbers and duration of in-water surveys for coral
species were possible. The intensity of sampling focused on coral
species presence/absence varied from entire dives dedicated to this
single task and lasting 45 to 70 minutes, to multi-tasking dives; of
the latter, only those dives in which at least 15 minutes of the dive
were dedicated to species observations are included in this analysis.
During dedicated species observation dives, all coral species
encountered were recorded, though with an emphasis on
searching for new species not recorded on prior dives in the same
expedition. On multi-tasking dives, only new species not previ-
ously observed were recorded. The overall goal of these surveys
was to build up a total list of coral species across all dives of a
survey trip and across multiple habitats. Surveys targeted
shoreline, lagoon and fore-reef habitats, the dominant habitats
on reefs in the WIO. Minor habitats, such as in high-sediment
environments near estuaries, or isolated pinnacles were generally
not sampled due to logistical limitations.
Figure 7. Comparison of coral species richness for areas in theWestern Indian Ocean, between this study and Sheppard [18].Reported species richness is from [18] and estimated asymptoticnumber of species (Smax) is from this study. Maximum Smax is shownwhere there were multiple locations from this study corresponding toareas in [18].doi:10.1371/journal.pone.0045013.g007
Biogeography of Western Indian Ocean Corals
PLOS ONE | www.plosone.org 10 September 2012 | Volume 7 | Issue 9 | e45013
Coral species were identified in situ, using digital photography to
record voucher photographs of species [72], to assist with species
identification using resources based on colour underwater
photographs (e.g. [19,40]). For genera in which a secondary
reference appeared more consistent with regional patterns and
colony appearance, these were used, e.g. for Red Sea corals [9]
and the genus Psammocora [69]. The method used here, focusing on
‘‘ecomorph/biogeographic observation’’ emphasizes a natural
historical approach. This can be contrasted with three alternative
approaches that can be labeled as macromorphogical (the basis of
scleractinian taxonomy until recently [19,86,87]), micromorpho-
logical [26,70,88,89] and genetic [26,27,64–71]. Each of these
approaches has its strengths and weakness, and history of use, and
can be matched with specific contexts of objectives and resources.
Recent findings by several authors that ‘‘most macromorphologic
characters that have traditionally been used to distinguish scleractinian families,
genera, and species … are only of limited use in scleractinian phylogeny
reconstruction and classification’’ (paraphrased from [88], and see [64])
made using the classical taxonomic approach in this study unwise,
as well as it being impractical due to the budgets available, with its
Table 4. Proposed changes to province, ecoregion and Large Marine Ecosystem classifications in the Indo-West Pacific Realm,based on reef-building corals.
Realm-level change
Andaman Seas The Andaman Seas province should be placed in the Central Indo-Pacific Realm asits fauna is most closely related to the Sunda/Java/South China Sea region, thebroader West Pacific and even Polynesia than it is to adjacent locations in theCentral Indian Ocean, Bengal Bay and South India.
Primary (RL)
Province-level changes
Chagos Chagos should be grouped with the WIO province, emphasizing the zonal oceanographicinfluence, its role as a stepping stone in both easterly and westerly directions, and thatthis pattern holds across multiple taxonomic groups.
Primary (field & RL)
Somali, Arabian Sea andRed Sea
The Northern Monsoon coast and central Somali coasts should both be grouped withthe WIO province. The clusters (fig. 3b) for the Persian, Arabian, Oman, Gulf of Adenand Red Sea ecoregions are geographically disjoint, suggesting that together they mightform a single province.
Primary (RL)
Maldives, India & Sri Lanka The Maldives, south and west India and Sri Lanka may be grouped in a single province. Primary (RL)
Ecoregion-level changes
Northern MozambiqueChannel (NMC)
The basic structure of the marine ecoregions of the WIO should be altered from theparadigm that separates island and mainland systems, to one that has the NorthernMozambique Channel (NMC) as a core region, likely with a concentric pattern of otherecoregions reflecting flow and dispersal out of the NMC. The East African Coral Coast(95) and North and West Madagascar (100) must be split to accommodate joining oftheir parts that fall in the NMC core region identified by this study. For the former thisincludes from Mafia Island (Tanzania) to Nacala (Mozambique), and for the latter, the NWand upper NE coasts of Madagascar, plus the Comoros archipelago, Glorieuse island andnearby banks (Zelee and Geyser).
Primary (field & RL)
East African Coast The East African Coral Coast ecoregion (95) must be split to accommodate the NMC coreecoregion, resulting in a northern one including northern Tanzania and southern Kenya,and a southern one from the Primeiras and Segundas Islands to Delagoa in Mozambique.Sampling limitations of this study require further work to elucidate these.
Primary (field) (Kenya/Tanzania); Secondary(Mozambique )
West Madagascar coastand southern MozambiqueChannel
Similarly, the North and West Madagascar ecoregion (100) must be split, leaving thecentral-west coast of Madagascar from approximately 16uS at the narrowest part of theMozambique Channel to Tulear in the south. It is also unclear if a single ecoregion mayspan the southern Mozambique Channel to Mozambique (combined with thePrimeiras-Segundas to Delagoa region, above), or if these may be two separateecoregions on the east and west of the channel.
Secondary [36]
East and South Madagascar Recent work suggests the extreme south of Madagascar is temperate in nature, and shouldbe a distinct ecoregion, different from both the East and Southwest costs of Madagascar.
Secondary [99]
Seychelles and the bankson the Mascarene plateau
Low diversity at Farquhar suggests it and the isolated, low habitat/area south-centralislands (e.g. Providence, Agalega) may be more appropriately placed in the banks ecoregion(Cargados/Tromelin, 97). Further work on the geology, oceanography and biodiversity of theMascarene Basin and Plateau, will be needed to address this question.
Primary (field)/Secondary[29,58,59,60,62]
Large Marine Ecosystems(LME)
Agulhas-Somali Current LME) The boundaries of the WIO province in the north and south are coherent with the primaryfeatures of the named LME systems - the Somali and Agulhas currents, respectively. Butthese have limited influence on the core zone of the WIO as they are downstream of it.This suggests revisions to the LMEs of the region may be warranted, to distinguish an LMEconsidering interactions of the South Equatorial Current with the Mascarene Plateau and themesoscale dynamics of the Mozambique Channel.
Primary (field)/Secondary [29–32,80]
Province and ecoregion names and numbers follow the MEOW classification [36] (see caption to fig. 2), while the suggested changes are illustrated in fig. 2b. Findingsare labeled by whether they are primary (supported by data from the field or the IUCN Red List (RL), along with statistical analysis) or secondary, inferred from primaryfindings of this study and listed sources. Both levels of findings pose hypotheses for further research and confirmation.doi:10.1371/journal.pone.0045013.t004
Biogeography of Western Indian Ocean Corals
PLOS ONE | www.plosone.org 11 September 2012 | Volume 7 | Issue 9 | e45013
requirements of collection, archiving, regional facilities and
expertise to work on the specimens. The genetic and micro-
morphological approaches have matured over the period of this
study, and are prohibitive financially and technically for applica-
tion across the breadth of the material and geography of this study.
Thus the approach used here, informed by incremental findings
from researchers applying the other approaches within specific
taxonomic groups and/or geographies (e.g. [66–71]), best matched
the opportunities and constraints of this study. It is clear that
future work on coral phylogeny and systematics will require
greater synthesis across these approaches [90]. Ethical clearance
for in-water observation of benthic invertebrates was obtained
from the Kenya National Council for Science and Technology.
AnalysisAnalysis of species distributions and accumulation curves were
conducted using Primer v 6.0 [39,91]. Presence/absence data
were used to generate similarity matrices using the Bray-Curtis
similarity index between a) provinces and ecoregions for IUCN
Red List data, and b) sample locations from field surveys (Table 2,
Dataset S1). The Bray-Curtis index was selected as it is among the
most widely used and researched indices [92] and because other
indices commonly used for presence/absence data are either
presence/absence forms of this index (e.g. Sorensen’s index), or
gave very similar results when trialed on this dataset (Jaccard’s
index). The resulting similarity matrices were analyzed by cluster
analysis (group averaging method) and multi-dimensional scaling
(MDS), and the significance of the similarity matrices assessed
using ANOSIM (Analysis of Similarities).
Species accumulation curves were derived from the same
presence/absence field data. For locations with surveys from
multiple years, all dive samples were used as independent samples,
and for all locations the order of samples was randomized and
resampled 999 times (Primer v 6.0). A variety of estimation
procedures were investigated with this dataset, to select the one
least impacted by variation in sampling and other factors.
Sensitivity of maximum diversity (richness) estimators is a large
field, as estimators have varying assumptions and are based on
different aspects of diversity, rarity or presence [93–95]. In
general, all estimators improve with increased sampling, and in
most cases estimated maximum diversity initially increases with
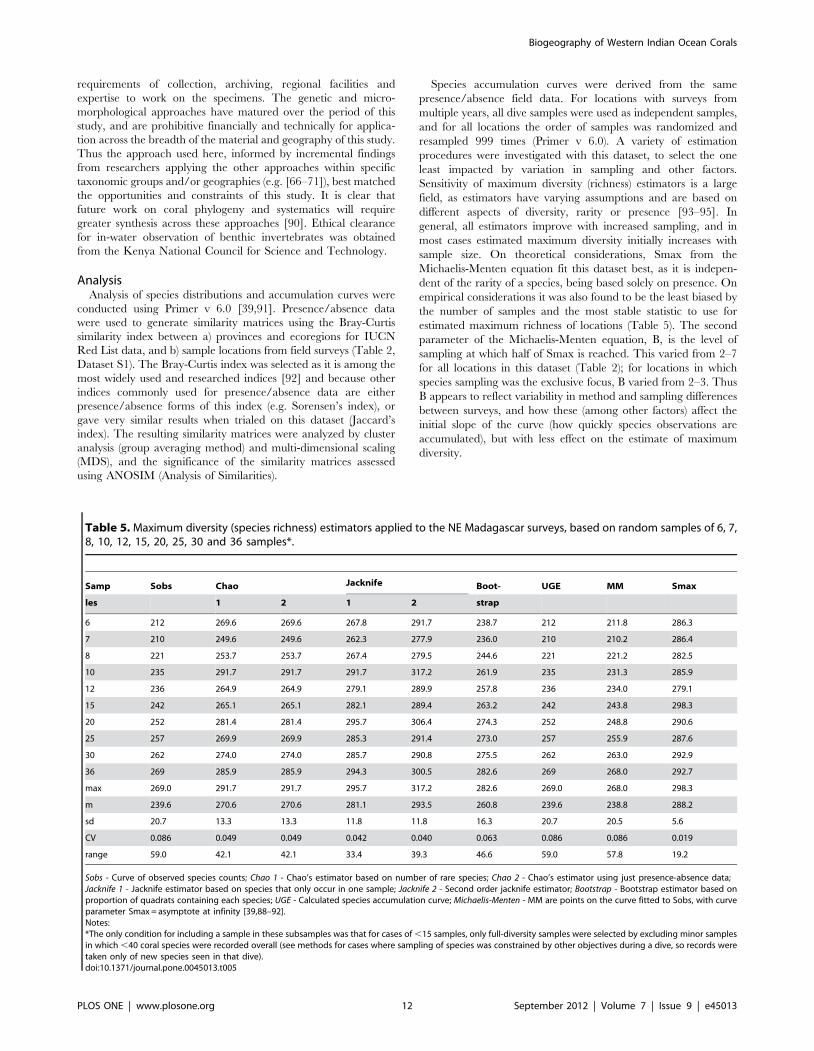
sample size. On theoretical considerations, Smax from the
Michaelis-Menten equation fit this dataset best, as it is indepen-
dent of the rarity of a species, being based solely on presence. On
empirical considerations it was also found to be the least biased by
the number of samples and the most stable statistic to use for
estimated maximum richness of locations (Table 5). The second
parameter of the Michaelis-Menten equation, B, is the level of
sampling at which half of Smax is reached. This varied from 2–7
for all locations in this dataset (Table 2); for locations in which
species sampling was the exclusive focus, B varied from 2–3. Thus
B appears to reflect variability in method and sampling differences
between surveys, and how these (among other factors) affect the
initial slope of the curve (how quickly species observations are
accumulated), but with less effect on the estimate of maximum
diversity.
Table 5. Maximum diversity (species richness) estimators applied to the NE Madagascar surveys, based on random samples of 6, 7,8, 10, 12, 15, 20, 25, 30 and 36 samples*.
Samp Sobs Chao Jacknife Boot- UGE MM Smax
les 1 2 1 2 strap
6 212 269.6 269.6 267.8 291.7 238.7 212 211.8 286.3
7 210 249.6 249.6 262.3 277.9 236.0 210 210.2 286.4
8 221 253.7 253.7 267.4 279.5 244.6 221 221.2 282.5
10 235 291.7 291.7 291.7 317.2 261.9 235 231.3 285.9
12 236 264.9 264.9 279.1 289.9 257.8 236 234.0 279.1
15 242 265.1 265.1 282.1 289.4 263.2 242 243.8 298.3
20 252 281.4 281.4 295.7 306.4 274.3 252 248.8 290.6
25 257 269.9 269.9 285.3 291.4 273.0 257 255.9 287.6
30 262 274.0 274.0 285.7 290.8 275.5 262 263.0 292.9
36 269 285.9 285.9 294.3 300.5 282.6 269 268.0 292.7
max 269.0 291.7 291.7 295.7 317.2 282.6 269.0 268.0 298.3
m 239.6 270.6 270.6 281.1 293.5 260.8 239.6 238.8 288.2
sd 20.7 13.3 13.3 11.8 11.8 16.3 20.7 20.5 5.6
CV 0.086 0.049 0.049 0.042 0.040 0.063 0.086 0.086 0.019
range 59.0 42.1 42.1 33.4 39.3 46.6 59.0 57.8 19.2
Sobs - Curve of observed species counts; Chao 1 - Chao’s estimator based on number of rare species; Chao 2 - Chao’s estimator using just presence-absence data;Jacknife 1 - Jacknife estimator based on species that only occur in one sample; Jacknife 2 - Second order jacknife estimator; Bootstrap - Bootstrap estimator based onproportion of quadrats containing each species; UGE - Calculated species accumulation curve; Michaelis-Menten - MM are points on the curve fitted to Sobs, with curveparameter Smax = asymptote at infinity [39,88–92].Notes:*The only condition for including a sample in these subsamples was that for cases of ,15 samples, only full-diversity samples were selected by excluding minor samplesin which ,40 coral species were recorded overall (see methods for cases where sampling of species was constrained by other objectives during a dive, so records weretaken only of new species seen in that dive).doi:10.1371/journal.pone.0045013.t005
Biogeography of Western Indian Ocean Corals
PLOS ONE | www.plosone.org 12 September 2012 | Volume 7 | Issue 9 | e45013
Acknowledgments
Research was undertaken under research permit 13/001/21C 242 and
ethical clearance from the Kenya National Council for Science and
Technology. Fieldwork at the different sites over the course of the study
was made possible by the support of many different organizations and
consultancies, and I would like to acknowledge the following organizations
and individuals, in alphabetical order: Administration of the British Indian
Ocean Territory, Adriano Macia, AIDE Comores, Bernard Thomassin,
Carl Gustav Lundin, Chagos Conservation Trust, Charles Sheppard,
Climate Change and Coral Reefs working group, Conservation Interna-
tional, Coastal Oceans Research and Development in the Indian Ocean
(CORDIO), D’Arros Research Station, Enric Sala, Fidy Ralison,
Francesca Benzoni, GIS-Lag May, Isabel Silva, Island Conservation
Society (Seychelles), IUCN East Africa Regional Office, IUCN Global
Marine Programme, Kenya Wildlife Service, Mafia Island Marine Park,
Marine Parks and Reserves Unit Tanzania, National Geographic Society,
National Research Council of Spain, Observatoire des sciences de l’univers
(OSU-Reunion), Pascale Chabanet, Pascale Cuet, Seychelles Island
Foundation/Aldabra Research Station, Territoire Antarctique et Australe
France (TAAF), Tara Expedition, Tara Oceans Foundation and Eric
Karsenti, Udo Englehardt, Vamizi Island, WWF Kiunga Marine National
Reserve Project, WWF Madagascar and WWF Tanzania. I would also like
to acknowledge Jonnell Sanciangco and the Global Marine Species
Assessment/IUCN Global Species Programme Marine Biodiversity Unit
for providing the IUCN Red List coral data. The manuscript was greatly
improved by the comments of three anonymous reviewers.
Author Contributions
Conceived and designed the experiments: DO. Performed the experiments:
DO. Analyzed the data: DO. Contributed reagents/materials/analysis
tools: DO. Wrote the paper: DO.
References
1. Hamilton HGH, Brakel WH (1984) Structure and coral fauna of East African
reefs. Bull Mar Sci 34: 248–26.
2. Boshoff P (1981) An annotated checklist of Southern African scleractinia.
Oceanographic Research Institute. Durban Investigational Report 49: 1–45.
3. Riegl B (1995) Description of four new species in the hard coral genus Acropora
Oken, 1815 (Scleractinia: Astrocoeniina: Acroporidae) from south-east Africa.
Zool J Linn Soc 113: 229–247.
4. Pichon M (1978) Recherches sur les peuplements a dominance d’anthozoaires
dans les recifs coralliens de Tulear (Medagascer). Atoll Res Bull 222: 1–477.
5. Rosen BR (1971) The distribution of reef coral genera in the Indian Ocean. In:
Stoddart DR, Yonge CM (eds) Regional Variation in Indian Ocean. Coral
Reefs Symp Zool Soc London no 28 Academic Press pp 263–299.
6. Faure G (1977) Annotated checklist of corals in the Mascarene Archipelago,
Indian Ocean. Atoll Res Bull 203: l–26.
7. Moothien Pillay R, Terashima H, Vebkatasami A, Uchida H (2002) Field
Guide to corals of Mauritius. Albion Fisheries Research Centre, Albion, Petite
Riviere, Mauritius, 334 pp. ISBN99903-964-2-6.
8. Turner J, Klaus R (2005) Coral reefs of the Mascarenes, Western Indian
Ocean. Phil Trans Royal Soc A: Mathematical, Physical and Engineering
Sciences 363: 229–250 doi:10 1098/rsta 2004 1489.
9. Sheppard CRC, Sheppard ALS (1991) Corals and coral communities of
Arabia. Fauna of Arabia 12: 3–170.
10. DeVantier L, Turak E, Al-Shaikh A, De’Ath G (2000) Coral communities of
the central-northern Saudi Arabian Red Sea. Fauna of Arabia 18: 23–66.
11. Riegl B, Benzoni F, Sheppard CRC, Samimi-Namin K (2012) The hermatypic
scleractinian (hard) coral fauna of the Gulf. In: Riegl B, Purkins S (eds) Coral
Reefs of the Gulf: Adaptation to Climatic Extremes. Coral Reefs of the World
3, Springer. DOI10 1007/978-94-007-3008-3_11.
12. Turak E, Brodie J, DeVantier L (2007) Reef-building corals and coral
communities of the Yemen Red Sea. Fauna of Arabia 23: 1–40.
13. Pichon M, Benzoni F, Chaineu CH, Dutrieux E (2010) Field Guide to the hard
corals of the southern coast of Yemen. BIOTOPE Parthenope, Paris, 256 pp.
14. DeVantier L, De’Ath G, Klaus R, Al-Moghrabi S, Abdulaziz M, et al. (2004)
Reef-building corals and coral communities of the Socotra Archipelago, a
zoogeographic ‘crossroads’ in the Arabian Sea. Fauna of Arabia 20: 117–168.
15. Coles SC (1996) Corals of Oman. Keech, Samdani, Coles. UK. 106 pp. ISBN
0 9527446 0 0.
16. Pillai CSG (1970) The distribution of shallow-water stony corals at Minicoy
atoll in the Indian Ocean with a check-list of species. Atoll Res Bull 141: 1–13.
17. Pichon M, Benzoni F (2007) Taxonomic re-appraisal of zooxanthellate
Scleractinian Corals in the Maldive Archipelago. Zootaxa 1441: 21–33.
18. Sheppard CRC (1987) Coral species of the Indian Ocean and adjacent seas: a
synonymized compilation and some regional distributional patterns. Atoll Res
Bull 307: 1–33.
19. Veron JEN (2000) Corals of the World. Australian Institute of Marine Science,
Townsville, Australia.
20. Carpenter KE, Barber PH, Crandall ED, Ablan-Lagman MCA, Ambariyanto,
et al. (2011) Comparative Phylogeography of the Coral Triangle and
Implications for Marine Management. J Mar Biol 2011: 1–14 doi:10 1155/
2011/396982.
21. Veron JEN (2002) New species described in Corals of the World. Australian
Institute of Marine Science, Townsville, Australia ISSN1037-3047.
22. Veron JEN, Turak E (2005) Reef corals of Northwest Madagascar. In:
McKenna S, Allen G (eds) A Rapid Marine Biodiversity Assessment of the
Coral Reefs of Northwest Madagascar. RAP Bull Biol Assessment 31: 23–30.
23. Obura DO, Di Carlo G, Rabearisoa A, Oliver T (Eds) (2011) A Rapid Marine
Biodiversity Assessment of the coral reefs of northeast Madagascar. RAP Bull
Biol Assessment 61 Conservation International Arlington, VA. 110 pp.
24. Pichon M, Chuang Y-Y, Chen CA (2012) A new species of Pseudosiderastrea,
Pseudosiderastrea formosana nov. sp. Zool Stud 51: 93–98.
25. Obura DO, Chuang Y, Olendo M, Amiyo N, Church JE, et al. (2007) Relict
Siderastrea savignyana (Scleractinia: Siderastreidae) in the Kiunga Marine
National Reserve, Kenya. Zoological Studies 46: 427.
26. Stefani F, Benzoni F, Yang S-Y, Pichon M, Galli P, et al. (2011) Comparison of
morphological and genetic analyses reveals cryptic divergence and morpho-
logical plasticity in Stylophora (Cnidaria, Scleractinia). Coral Reefs DOI10
1007/s00338-011-0797-4.
27. Flot J-F, Blanchot J, Charpy L, Cruaud C, Licuanan WY, et al. (2011)
Incongruence between morphotypes and genetically delimited species in the
coral genus Stylophora: phenotypic plasticity, morphological convergence,
morphological stasis or interspecific hybridization. BMC Ecology: 11, 22
doi:10 1186/1472-6785-11-22.
28. Schott F, McCreary J (2001) The monsoon circulation of the Indian Ocean.
Progress in Oceanography 51: 1–123.
29. New AL, Stansfield K, Smythe-Wright D, Smeed D, Evans A, et al. (2004)
Physical and biochemical aspects of the flow across the Mascarene plateau in
the Indian Ocean. Phil Trans Royal Soc (A) 363: 151–168.
30. Belkin IM, Cornillon PC, Sherman K (2009) Fronts in Large Marine
Ecosystems. Progress in Oceanography 81 (1–4): 223–236 doi:10 1016/j
pocean 2009 04 015.
31. Roman R (in prep) The circulation and transport in the Comores Basin.
32. Schouten W, de Ruijter WPM, van Leeuwen PJ, Ridderinkhof H (2003) Eddies
and variability in the Mozambique Channel. Deep Sea Research, Part II, 50:
1987–2003.
33. Lutjeharms JRE (2006) The Agulhas Current. Springer Berlin 329 pp ISBN-10
3-540-42392-3.
34. Kelleher G, Bleakley C, Wells S (Eds ) (1995) A Global Representative System
of Marine Protected Areas. Washington (DC): Great Barrier Reef Marine Park
Authority, World Bank, IUCN (World Conservation Union).
35. WWF Eastern African Marine Ecoregion (2004) The Eastern African Marine
Ecoregion Vision: A large scale conservation approach to the management of
biodiversity. WWF: Dar es Salaam, Tanzania 53pp.
36. Spalding MD, Fox HE, Allen GR, Davidson N, Ferdana ZA, et al. (2007)
Marine ecoregions of the world: a bioregionalization of coastal and shelf areas.
BioScience 57: 573–583.
37. IUCN (2011) IUCN Red List of Threatened Species. Version 2011 2.
Available: http://www iucnredlist org.
38. Carpenter KE, Abrar M, Aeby G, Aronson RB, Banks S, et al. (2008) One-
Third of Reef-Building Corals Face Elevated Extinction Risk from Climate
Change and Local Impacts. Science 321: 560–563.
39. Clarke KR, Warwick RM (2001) Change in marine communities: an approach
to statistical analysis and interpretation. 2nd Edition. Primer-E: Plymouth.
40. Wallace CC (1999) Staghorn corals of the world: a revision of the genus
Acropora. Victoria: CSIRO Publishing.
41. Faure G (1982) Etude comparative des recifs coralliens de l’archipel des
Mascareignes (Ocean Indien). Station Marine d/Endoume et Centre
d’Oceanographie, Marseillies et Centre Universitaire de La Reunion. p 153–
177.
42. Faure G, Pichon M, Geynet Y (2008) List of scleractinian coral species cited
from the Mascarene Archipelago based on Faure (1982), updated. Available
online at http://coraux.univ-reunion.fr/spip.php?article87&lang = en
43. Keshavmurthy S, Yang SY, Alamaru A, Chuang YY, Pichon M, et al. (in
review) DNA barcoding reveals the coral ‘‘laboratory-rat Stylophora pistillata
encompasses multiple identities. PNAS.
44. Everett BI, van der Elst RP, Schleyer MH (2008) A natural history of the
Bazaruto Archipelago, Mozambique. Oceanographic Research Institute/
SAAMBR and Worldwide Fund for Nature. Special Publication #8. 118 pp.
45. Cooke A (2003) Marine and coastal ecosystems of Madagascar. In: The Natural
History of Madagascar. Goodman SM, Benstead JP (eds.), pp 179–209.
University of Chicago Press.
Biogeography of Western Indian Ocean Corals
PLOS ONE | www.plosone.org 13 September 2012 | Volume 7 | Issue 9 | e45013
. .
46. Obura DO, Church JE (2004) Coral Reef Monitoring in the Kiunga Marine
Reserve, Kenya 1998–2003. CORDIO/WWF/KMNR, Lamu, Kenya.47. Lieske E, Myers R (1996) Coral reef fishes of the Indo-Pacific and Caribbean.
2nd edition Collins ISBN0 00 219974 2.
48. Sheppard CRC, Ateweberhan M, Bowen BW, Carr P, Chen CA, et al. (2012)Reefs and islands of the Chagos Archipelago, Indian Ocean: why it is the
world’s largest no-take marine protected area. Aquat Conserv doi:10 1002/aqc1248.
49. Mortimer JA, Day M, Broderick D (2002) Sea turtle populations of the Chagos
Archipelago, British Indian Ocean Territory. In: Proceedings of the TwentiethAnnual Symposium on Sea Turtle Biology and Conservation. Mosier A, Foley
A, Brost B (compilers) NOAA Technical Memorandum NMFS SEFSC-477:47–49.
50. Vogler C, Benzie J, Lessios H, Barber P, Worheide G (2008) A threat to coralreefs multiplied? Four species of crown-of-thorns starfish. Biol Lett 4: 696–699.
51. Gaither MR, Bowen BW, Bordenave TR, Rocha LA, Newman SJ, et al. (2011)
Phylogeography of the reef fish Cephalopholis argus (Epinephelidae) indicatesPleistocene isolation across the Indo-Pacific Barrier with contemporary overlap
in the Coral Triangle. BMC Evolutionary Biology 11: 189.52. Eble JA, Craig MT, Rocha L, Bowen BW (2011) Not all offspring stay close to
home: trans-Pacific dispersal and gene flow in Indo-Pacific reef fishes. J Mar
Biol Article ID518516. 12 pages doi:10 1155/2011/518516.53. McArthur RH, Wilson EO (1961) The theory of Island Biogeography. Monogr
Popul Biol 1, Princeton University Press 203 pp.54. Bellwood DR, Hughes TP (2001) Biodiversity assembly rules. Science 292:
1532–1534.55. Thomassin BA (2004) Travaux sur les milieux marins et littoraux, Mayotte &
bancs coralliens. Rapport GIS‘‘LAG-MAY’’ 91 p.
56. Braithwaite CJR (1971) Seychelles reefs: structure and development. In:Stoddart DR, Yonge M. (eds). Regional variation in Indian Ocean coral reefs.
Symp Zool Soc London 28: 39–64.57. Rosen BR (1971) Principal features of reef coral ecology in shallow water
environments of Mahe, Seychelles. In: Stoddart DR, Yonge M. (eds). Regional
variation in Indian Ocean coral reefs. Symp Zool Soc London 28: 163–184.58. Friedlander AM, Obura DO, Aumeeruddy R, Ballesteros E, Johnstone JE, et
al. (2009) Marine Ecosystem Assessment of Farquhar Atoll, Seychelles.National Geographic Society/Singita.
59. Novozhilov AV, Chernova YN, Tsukurov IA, Denisov VA, Propp LN (1992)Characteristics of oceanographic processes on reefs of the Seychelles Islands
Results of the USSR-USA expedition in marine biology to the Seychelles
Islands. Atoll Res Bull 366: 1–36.60. Bouchon C, Faure G (1979) Apercu sur les peuplements a base de
Scleractinaires du recif de l’ıle Tromelin (ocean Indien). Cahiers de l’Indo-Pacifique 1(1): 25–37.
61. Hilbertz W, Goreau T (2002) Saya de Malha expedition report. 107 pp. Sun &
Sea, Global Coral Reef Alliance.62. Gallienne CP, Smythe-Wright D (2004) Epipelagic mesozooplankton dynamics
around the Mascarene Plateau and Basin, Southwestern Indian Ocean. PhilTrans Royal Soc (A) 363: 191–202.
63. Benzoni F, Arrigoni R, Stefani F, Pichon M (2011) Phylogeny of the coralgenus Plesiastrea (Cnidaria, Scleractinia). Contrib Zool 80: 231–249.
64. Fukami H, Chen CA, Budd AF, Collins A, Wallace C, et al. (2008)
Mitochondrial and nuclear genes suggest that stony corals are monophyleticbut most families of stony corals are not (Order Scleractinia, Class Anthozoa,
Phylum Cnidaria). PLoS ONE3 (9): e3222 doi:10 1371/journal pone 0003222.65. Kitahara MV, Cairns SD, Stolarski J, Blair D, Miller DJ (2010) A
comprehensive phylogenetic analysis of the Scleractinia (Cnidaria, Anthozoa)
based on mitochondrial CO1 sequence data. PLoS ONE 5 (7): e11490 doi:101371/journal pone 0011490.
66. Wolstenholme JK, Wallace CC, Chen CA (2003) Species boundaries within theAcropora humilis pecies group (Cnidaria; Scleractinia): a morphological and
molecular interpretation of evolution. Coral Reefs 22: 155–166.
67. Miller KJ, Benzie JAH (1997) No clear genetic distinction betweenmorphological species within the coral genus Platygyra. Bull Mar Sci 61: 907–
917.68. Forsman ZH, Barshis DJ, Hunter CL, Toonen RJ (2009) Shape-shifting corals:
Molecular markers show morphology is evolutionarily plastic in Porites. BMCEvolutionary Biology 9 (1): 45 doi:10 1186/1471-2148-9-45.
69. Benzoni F, Stefani F, Pichon M, Galli P (2010) The name game: morpho-
molecular species boundaries in the genus Psammocora (Cnidaria, Scleractinia).Zool J Linn Soc. doi: 10 1111/j 1096-3642 2010 00622 x.
70. Huang D, Licuanan WY, Baird AH, Fukami H (2011) Cleaning up the‘‘Bigmessidae’’: Molecular phylogeny of scleractinian corals from Faviidae,
Merulinidae, Pectiniidae and Trachyphylliidae. BMC Evolutionary Biology 11
(1): 37 doi:10 1186/1471-2148-11-37.71. Arrigoni R, Stefani F, Pichon M, Galli P,Benzoni F (2012) Molecular
phylogeny of the Robust clade (Faviidae, Mussidae, Merulinidae, andPectiniidae): An Indian Ocean perspective. Molecular Phylogenetics and
Evolution, Available online 14 June 2012, ISSN 1055-7903, 10.1016/j.ympev.2012.06.001.
72. Sheppard CRC, Obura DO (2004) Corals and reefs of Cosmoledo and Aldabra
atolls: extent of damage, assemblage shifts and recovery following the severemortality of 1998. J Nat Hist 39 (2): 103–121.
73. Scheer G, Pillai CSG (1983) Report on the stony corals from the Red Sea.
Zoologica 133: l–198.
74. Head SM (1980) The ecology of corals in the Sudanese Red Sea. PhD Thesis.
Cambridge Univ.
75. Mergner H, Schuhmacher H (1985) Quantitative Analyse von Korallenge-
mein- schaften des Sanganeb Atolls (mittleres Rotes Meer) IDie Besiedlungs-
struktur hydrodynamisch unterschiedlich exponierter Auben- und Innenriffe.
Helgolander Meeresunters 39: 375–417.
76. Sheppard CRC (1999) Corals of Chagos, and the role of Chagos reefs in the
Indian Ocean. In: Ecology of the Chagos Archipelago. Sheppard CRC,
Seaward MRD (eds) Linnean Society/Westbury Publishing: London; 53–66.
77. Wallace CC, Muir P (2012) Catalogue of the Acropora & Isopora. Memoirs of the
Queensland Museum.
78. Hayden BP, Ray BC, Dolan R (1984) Classificatoin of coastal and marine
environments. Environ Conserv 11: 199–207.
79. Alusa AL, Ogallo LJ (1992) Implications of expected climate change in the
Eastern African coastal Region: An overview. UNEP Regional Seas Reports
and Studies 149, Nairobi.
80. Sherman K, Duda A (1999) Large marine ecosystems: an emerging paradigm
for fishery sustainability. Fisheries 24: 15–26.
81. Griffiths CL (2005) Coastal marine biodiversity of East Africa. Indian J Mar Sci
34:35–41.
82. Wafar M, Venkataraman K, Ingole B, Khan SA, LokaBharathi P (2011) State
of Knowledge of Coastal and Marine Biodiversity of Indian Ocean Countries.
PLoS ONE 6 (1):e14613.
83. Potts D (1985) Sea level fluctuations and speciation in scleractinia. Proc 5th Int
Coral Reef Symp 4: 127–132.
84. Wallace CC, Paulay G, Hoeksma BW, et al. (2000) Nature and origins of
unique high diversity reef faunas in the Bay of Tomini, Central Sulawesi: the
ultimate ‘‘center of diversity’’? Proc 10th Int Coral Reef Symp 1:185–192.
85. Obura DO (2012) Evolutionary mechanisms and diversity in a western Indian
Ocean center of diversity. Proc 12th Int Coral Reef Symp. Available: http://
www.reefbase.org/resource_center/publication/icrs.aspx?icrs = ICRS12.
86. Wells JW (1956) Scleractinia. In: Moore RC (ed) Treatise on Invertebrate
Paleontology. Geological Society of America and Univ. Kansas Press. F:328–
440.
87. Veron JEN, Pichon M, Wallace C, Wijsman-Best M (1976) Scleractinia of
Eastern Australia. Australian Institute of Marine Science Monograph Series I–
VI.
88. Budd AF, Stolarski J (2009) Searching for new morphological characters in the
systematics of scleractinian reef corals: Comparison of septal teeth and granules
between Atlantic and Pacific Mussidae. Acta Zool 90:142–165
89. Budd AF, Stolarski J (2011) Corallite wall and septal microstructure in
scleractinian reef corals: comparison of molecular clades within the family
Faviidae. J Morphology 272: 66–88. doi:10.1002/jmor.10899.
90. Budd AF, Romano SL, Smith N, Barbeitos MS (2010) Rethinking the
Phylogeny of Scleractinian Corals: A Review of Morphological and Molecular
Data. Integr Comp Biol 50: 411–427.
91. Clarke KR (1993) Non-parametric multivariate analyses of changes in
community structure Australian. J Ecol 18: 117–143.
92. Clarke KR, Somerfield PJ, Chapman MG (2006) On resemblance measures for
ecological studies, including taxonomic dissimilarities and a zero-adjusted Bray-
Curtis coefficient for denuded assemblages. J Exp Mar Biol Ecol 330: 55–80.
93. Colwell R, Coddington J (1994) Estimating species richness. Phil Trans Royal
Soc of London (B) 345: 101–118.
94. Colwell R (2009) EstimateS 8.2 User’s Guide. Department of Ecology &
Evolutionary Biology. University of Connecticut. http://purl oclc org/
estimates.
95. Keating KA (1998) Estimating species richness: the Michaelis-Menten model
revisited. Oikos 81: 411–416.
96. Obura DO, Mbije N, Church JE, Ngowo R, King A, et al. (2004) Ecological
status of coral reefs of Mnazi Bay and Ruvuma Estuary. Proc 10th Int Coral
Reef Symp 1077–1085.
97. Riegl B (2003) Climate change and coral reefs: different effects in two high-
latitude areas (Arabian Gulf, South Africa). Coral Reefs 22: 433–446 DOI10
1007/s00338-003-0335-0.
98. Schleyer MH, Kruger A, Celliers L (2008) Long-term community changes on
high-latitude coral reefs in the Greater St Lucia Wetland Park, South Africa.
Mar Poll Bull 56: 493–502.
99. Obura DO, Church JE, Gabrie C (2012) Assessing Marine World Heritage
from an Ecosystem Perspective: The Western Indian Ocean. World Heritage
Centre, United Nations Education, Science and Cultural Organization
(UNESCO). 124 pp. Reporting Bouchet, Philippe, unpublished data.
100. Rudi E, Campbell SJ, Hoey AS, Fadli N, Linkie, Baird AH (2012) The coral
triangle initiative: what are we missing? A case study from Aceh. Oryx 46: 483–
486. doi:10.1017/S0030605312000178
101. Benzoni F, Arrigoni R, Stefani F, Stolarski J (in review) Systematics of the coral
genus Craterastrea (Cnidaria, Anthozoa, Scleractinia) and description of a new
family through combined morphologic and molecular analyses. Systematics
and Biodiversity.
Biogeography of Western Indian Ocean Corals
PLOS ONE | www.plosone.org 14 September 2012 | Volume 7 | Issue 9 | e45013
. .