Embed Size (px)
Citation preview

Income After Transfers and Taxes
Income Before Transfers and Taxes
Thousands of Dollars
Average Income Before and After Means-Tested Transfers and Federal Taxes, by Income Group, 2014
0
50
100
150
200
250
300
LowestQuintile
SecondQuintile
MiddleQuintile
FourthQuintile
HighestQuintile
CONGRESS OF THE UNITED STATESCONGRESSIONAL BUDGET OFFICE
MARCH 2018
The Distribution of Household Income, 2014

NotesNumbers in the text, tables, and figures may not add up to totals because of rounding. Dollar amounts are generally rounded to the nearest hundred.
Unless otherwise indicated, all years referred to in this report are calendar years.
Unless otherwise stated, household income refers to income before accounting for the effects of means-tested transfers and federal taxes. Throughout this report, that income concept is called income before transfers and taxes. See the appendix and the “Definitions” section at the end of this report for a more detailed description of that income measure.
When examining household income over time, income is adjusted for inflation using the price index for personal consumption expenditures, which is calculated by the Bureau of Economic Analysis (BEA). Those data are updated regularly by BEA. The data used in this report are from the January 26, 2018, revision of the series.
Some of the figures have shaded vertical bars that indicate the duration of recessions. (A recession extends from the peak of a business cycle to its trough.)
Throughout the report, specific colors are used to represent certain income concepts: Green denotes income before transfers and taxes, blue denotes means-tested transfers, orange denotes federal taxes, and purple denotes income after transfers and taxes.
Supplemental data are posted along with this report on CBO’s website.
www.cbo.gov/publication/53597
Contents
Summary 1How Did Means-Tested Transfers and Federal Taxes Affect the Distribution of Income in 2014? 1What Are the Trends in Household Income and Income Inequality? 3How Do Current Estimates Differ From Those in Previous CBO Reports? 3
The Distribution of Household Income in 2014 5Income Before Transfers and Taxes, by Income Group 6Changes in Transfer and Tax Rules That Affected the Distribution of Income in 2014 7Distributional Effects of Major Provisions of the Affordable Care Act in 2014 8Means-Tested Transfer Rates, by Income Group 10Federal Tax Rates, by Income Group 13Income After Transfers and Taxes, by Income Group 17
Trends in Household Income, Means-Tested Transfers, and Federal Taxes 19Trends in Income Before Transfers and Taxes 20Trends in Means-Tested Transfer Rates, by Income Group 20Trends in Means-Tested Transfer Rates for the Lowest Quintile, by Source 21Trends in Average Federal Tax Rates, by Income Group 24BOX 1. THE DISTRIBUTIONAL EFFECTS OF MAJOR INDIVIDUAL INCOME TAX CREDITS 25Trends in Average Federal Tax Rates, by Tax Source 27Trends in Income After Transfers and Taxes 29
Trends in Income Inequality 31Effects of Social Insurance Benefits 31Effects of Means-Tested Transfers 32Effects of Federal Taxes 32
How CBO’s Current Estimates Differ From Those in Previous Reports 33CBO’s Revision to Its Income Measure 33Improved Estimates of Means-Tested Transfers 33
Appendix: CBO’s Distributional Methodology 35
Definitions 42
List of Tables and Figures 43
About This Document 44


The Distribution of Household Income, 2014
SummaryIn 2014, household income was unevenly distributed: Households at the top of the income distribution received significantly more income than households at the bottom of the distribution. According to the Congressional Budget Office’s estimates:
• Average income among households in the lowest quintile (or fifth) of the income distribution was about $19,000 (see Summary Figure 1).
• Average income among households in the highest quintile was about $281,000.
Furthermore, within the highest quintile, income was highly skewed toward the very top of the distribution: Average income among households in the bottom half of the highest quintile (the 81st to 90th percentiles) was about $151,000; average income among the 1.2 million households in the top 1 percent of the distribution was about $1.8 million.
Those amounts include social insurance benefits (such as benefits from Social Security and Medicare) but exclude the effects of governmental policies that directly affect the distribution of household income either through means-tested transfer programs or through the federal tax system. Means-tested transfers are cash payments and in-kind benefits from federal, state, and local govern-ments that are designed to provide assistance to individ-uals and families with low income and few assets. They include benefits from government assistance programs such as Medicaid and the Children’s Health Insurance Program (CHIP), the Supplemental Nutrition Assistance Program (SNAP, formerly known as the Food Stamp program), and Supplemental Security Income (SSI). Federal taxes consist of individual income taxes, payroll taxes, corporate income taxes, and excise taxes.
Means-tested transfers and federal taxes cause household incomes to be more evenly distributed. In 2014, those transfers and taxes:
• Increased income among households in the lowest quintile by $12,000 (or more than 60 percent), on average, to $31,000.
• Decreased income among households in the highest quintile by $74,000 (or more than 25 percent), on average, to $207,000.
CBO has analyzed the distribution of household income and federal taxes on a recurring basis for more than 30 years. For this report, the agency focused on the distribution of household income in 2014 because that is the most recent year for which relevant data were avail-able when the analysis began. In addition, CBO assessed trends in household income, means-tested transfers, fed-eral taxes, and income inequality over a 36-year period, beginning in 1979 and ending in 2014. An important distinction between this report and earlier ones is that it reflects significant changes to CBO’s methodology; those changes are described below.
How Did Means-Tested Transfers and Federal Taxes Affect the Distribution of Income in 2014?Means-tested transfers and federal taxes are both progressive—that is, low-income households receive a larger share of their income as means-tested transfers than high-income households do, and high-income households pay a larger share of their income in federal taxes than low-income households do. Because of the progressive structure of those systems, the distribution of income after transfers and taxes was more even than the distribution of income before transfers and taxes. In 2014, those transfers and taxes boosted the lowest quintile’s share of total income by more than 3 percent-age points. In contrast, among households in the highest quintile, the share of income after transfers and taxes was almost 7 percentage points lower than the share of income before transfers and taxes, CBO estimates.
In 2014, the average means-tested transfer rate among all households was about 5 percent, CBO estimates—that is, in total, means-tested transfers received by households

2 The DisTribuTion of householD income, 2014 march 2018
were equal to 5 percent of all income before accounting for such transfers and federal taxes. The average rate, however, varied significantly by income group. Among households in the lowest quintile of the income distribu-tion (ranked by income before transfers and taxes), the average means-tested transfer rate was about 64 percent; among households in the middle quintile the average rate was about 5 percent; and among households in the highest quintile the average rate was less than one-half of one percent. Although some households in the top 1 percent of the income distribution received some means-tested transfers in 2014, the average means-tested transfer rate among that income group was virtually zero.
Not all households receive means-tested transfers. As the rates imply, though, means-tested transfers went over-whelmingly to low-income households—almost half of such transfers went to households in the lowest income quintile and almost three-quarters to households in the lowest two quintiles.
In 2014, the average federal tax rate also varied signifi-cantly by income group. Among all households it was about 21 percent, CBO estimates—but among house-holds in the lowest quintile, the average rate was about 2 percent; among households in the middle quintile it was 14 percent; and among households in the highest
Summary Figure 1 .
Average Income, Means-Tested Transfers, and Federal Taxes per Household, by Income Group, 2014Thousands of Dollars
0
100
200
300
Income Before Transfers and Taxes
Means-TestedTransfers
plus FederalTaxes
Income After Transfers and Taxes
minus equals
Lowest Quintile
Highest Quintile
Lowest Quintile
Highest Quintile
Lowest Quintile
Highest Quintile
Lowest Quintile
Highest Quintile
*
Source: Congressional Budget Office.
Income before transfers and taxes is market income plus social insurance benefits. Market income consists of labor income; business income; capital income (including capital gains); income received in retirement for past services; and other nongovernmental income sources. Social insurance benefits consist of benefits provided through Social Security (Old Age, Survivors, and Disability Insurance); Medicare (measured as the average cost to the government of providing those benefits); unemployment insurance; and workers’ compensation.
Means-tested transfers are cash payments and in-kind transfers from federal, state, and local governments. The largest means-tested transfers consist of transfers provided through Medicaid and the Children’s Health Insurance Program (measured as the average cost to the government of providing those benefits); the Supplemental Nutrition Assistance Program (formerly known as the Food Stamp program); and Supplemental Security Income.
Federal taxes consist of individual income taxes, payroll taxes, corporate income taxes, and excise taxes.
Income after transfers and taxes is income before transfers and taxes plus means-tested transfers minus federal taxes.
Income groups are created by ranking households by income before transfers and taxes, adjusted for household size. Quintiles (fifths) contain an equal number of people. The lowest quintile does not include households with negative income.
For more detailed definitions of income, see the appendix and the section titled “Definitions.”
* = less than $500.

3march 2018 The DisTribuTion of householD income, 2014
quintile it was about 27 percent. The average federal tax rate among households in the top 1 percent of the income distribution in 2014 was about 34 percent.
Although all households have some form of federal tax burden, high-income households pay a majority of federal taxes. Households in the highest income quin-tile, which received about 55 percent of all income, paid more than two-thirds of federal taxes in 2014. In con-trast, households in the lowest quintile, which received about 4 percent of all income, paid less than one-half of one percent of federal taxes that year, CBO estimates.
Changes in the rules governing transfers and taxes had direct effects on the distribution of household income in 2014. The most significant effects resulted from imple-mentation of several provisions of the Affordable Care Act (ACA). Together, CBO estimates, the provisions of the ACA that were in effect in 2014 boosted household income, on average, for those in the lowest quintiles, and reduced income for households in the top quintile—especially for households in the top 1 percent of the income distribution.
What Are the Trends in Household Income and Income Inequality?According to the agency’s estimates, average household income before transfers and taxes was almost 60 percent higher in 2014 than it was in 1979 in real (inflation- adjusted) terms—an average growth rate of 1.3 percent per year. That growth, however, was not the same across the income spectrum. Income growth among households in the bottom 80 percent of the income distribution was less than half that overall growth rate—26 percent for households in the lowest quintile and 28 percent for households in the middle three quintiles. Meanwhile, among households in the highest quintile, average income in 2014 was 95 percent higher than it was in 1979. Because of those differences in cumulative growth rates, income inequality was greater in 2014 than it was in 1979 (see Summary Figure 2).
From 1979 through 2014, for households in the low-est income quintile, cumulative growth in income after transfers and taxes was significantly greater than cumulative growth in income before transfers and taxes—69 percent versus 26 percent. That faster growth was attributable both to the expansion of means-tested transfers (especially Medicaid) and to a reduction in fed-eral taxes—the latter largely the result of the expansion
of refundable tax credits provided through the individual income tax.
The expansion of means-tested transfers further up the income scale and generally declining average federal tax rates in the middle three income quintiles (the 21st to 80th percentiles) had a similar effect: Cumulative growth in income after transfers and taxes was significantly larger for that group than cumulative growth in income before transfers and taxes—42 percent versus 28 percent.
In contrast, in the highest quintile, cumulative growth in income before and after transfers and taxes was similar—95 percent versus 97 percent. The top 1 per-cent of the income distribution experienced the largest cumulative growth in income after transfers and taxes. In 2014, real income after transfers and taxes for that income group was 228 percent greater than it was in 1979, CBO estimates.
Because of the redistributive nature of means-tested transfers and federal taxes, the degree of income inequal-ity after transfers and taxes was lower than the degree of income inequality before transfers and taxes. Over the period examined, the extent to which redistributive fiscal policies reduced measures of income inequality was relatively stable.
How Do Current Estimates Differ From Those in Previous CBO Reports?The estimates in this report reflect two significant changes to CBO’s methodology:
• Income groups are defined using a new measure of income, and
• Estimates of income from means-tested transfers have been improved.
In previous CBO reports on the distribution of house-hold income, the primary income measure used to define income groups and calculate average federal tax rates was before-tax income. That income measure was equal to market income—labor income, business income, capital income (including realized capital gains), and other nongovernmental sources of income—plus gov-ernment transfers. In those earlier reports, government transfers consisted of both social insurance benefits—Social Security and Medicare benefits, for example—and

4 The DisTribuTion of householD income, 2014 march 2018
means-tested transfers—Medicaid and SNAP transfers, for example.
The new measure of income used in this report—income before transfers and taxes—is equal to market income plus social insurance benefits.1 That new measure is similar to the previous measure, except that means-tested trans-fers are no longer included, thus providing a basis for separately assessing the effects of those transfers on the distribution of household income.
1. For more details on the components of income, see the appendix and the section titled “Definitions.”
CBO relies on household survey data for information on both the receipt and dollar value of means-tested trans-fers. However, household surveys generally do not cap-ture the full extent to which means-tested transfers affect household income. Furthermore, over time, those survey data have become less representative of all the house-holds that receive means-tested transfers. Therefore, for its estimates of income that households receive from the three largest sources of means-tested transfers—Medicaid and CHIP (considered together), SNAP, and SSI—CBO adjusted the survey data to address that shortcoming.
As a result of those changes, estimates of the distribution of and trends in household income and average federal
Summary Figure 2.
Cumulative Growth in Average Income, by Income Group, 1979 to 2014
2628
95
-25
0
25
50
75
100
125
1980 1985 1990 1995 2000 2005 2010
69
42
97
-25
0
25
50
75
100
125
1980 1985 1990 1995 2000 2005 2010
Income After Transfers and TaxesIncome Before Transfers and Taxes
Percent
Highest Quintile
Middle Three Quintiles(21st to 80th Percentiles)
Lowest Quintile
Highest Quintile
Middle Three Quintiles(21st to 80th Percentiles)
Lowest Quintile
Source: Congressional Budget Office.
Income before transfers and taxes is market income plus social insurance benefits. Market income consists of labor income; business income; capital income (including capital gains); income received in retirement for past services; and other nongovernmental income sources. Social insurance benefits consist of benefits provided through Social Security (Old Age, Survivors, and Disability Insurance); Medicare (measured as the average cost to the government of providing those benefits); unemployment insurance; and workers’ compensation.
Income after transfers and taxes is income before transfers and taxes plus means-tested transfers minus federal taxes.
Means-tested transfers are cash payments and in-kind transfers from federal, state, and local governments. The largest means-tested transfers consist of transfers provided through Medicaid and the Children’s Health Insurance Program (measured as the average cost to the government of providing those benefits); the Supplemental Nutrition Assistance Program (formerly known as the Food Stamp program); and Supplemental Security Income.
Federal taxes consist of individual income taxes, payroll taxes, corporate income taxes, and excise taxes.
Income groups are created by ranking households by income before transfers and taxes, adjusted for household size. Quintiles (fifths) contain an equal number of people; percentiles (hundredths) contain an equal number of people as well. The lowest quintile does not include households with negative income.
For more detailed definitions of income, see the appendix and the section titled “Definitions.”

5march 2018 The DisTribuTion of householD income, 2014
tax rates presented in this report are different from what they would have been using the previous methodology. Consequently, the results in this report are not directly comparable with results presented in prior reports.
The Distribution of Household Income in 2014In 2014, there were approximately 310 million people living in 125 million households in the United States, CBO estimates.2 In total, the people living in those households received about $12.7 trillion in annual income; that income, however, was very unevenly distributed. By CBO’s estimates, the average income among households in the highest quintile was more than 10 times the average income of households in the lowest quintile.3 Income within the highest quintile was also significantly skewed toward the very top: The average income among the 1.2 million households in the top 1 percent of the income distribution was more than 10 times the average income of households in the bottom half of the highest quintile (the 81st to 90th percentiles).
Federal fiscal policies have significant and direct effects on the economic resources available to U.S. households.4 Before means-tested transfers and federal taxes are taken into account, average income across all households in 2014 was $101,700, CBO estimates. Means-tested transfers provided households an additional $4,900 in
2. The scope of this analysis is limited to the civilian noninstitutionalized population of the United States, which is consistent with the sampling frame (the register of housing addresses) the Census Bureau uses to collect household survey data for the Annual Social and Economic Supplement of the Current Population Survey.
3. Each quintile contains approximately 25 million households. The lowest quintile, however, has slightly fewer households because households with negative income are not included in that income group but are included in all income totals. The income quintiles used throughout this report are ordered: lowest, second, middle, fourth, and highest. In some places, the middle three quintiles (the 21st to 80th percentiles) are combined, and in other places the highest quintile is divided into the following income groups: the 81st to 90th percentiles, the 91st to 95th percentiles, the 96th to 99th percentiles, and the top 1 percent.
4. Federal monetary, regulatory, and trade policies also affect the distribution of household income. The direct distributional effects of those federal policies, however, are not examined in this report. Although some state-level means-tested transfers are included in this analysis, most state and local fiscal policies are not examined here.
income, on average, that year.5 Federal taxes that year amounted to $21,500 per household, on average.6 The net effect of means-tested transfers and federal taxes was to decrease household income by $16,700, on average: Household income after transfers and taxes was $85,100, on average. Those averages, however, obscure a signifi-cant amount of variation in household incomes and how means-tested transfers and federal taxes affect household income.
When the distribution of income is skewed toward the top—as is the case in the United States—average household income is not representative of the center of the distribution. That is because very high incomes can significantly raise the calculated average. A measure of median household income—which represents the midpoint of all household incomes—will be lower than the average household income when the distribution of income is skewed toward the top. In 2014, for example, the median household income before transfers and taxes was $77,100—or almost $25,000 less than the average household income that year, CBO estimates. Similarly, the median income after transfers and taxes in 2014 was $73,200—or about $11,900 less than average household income after transfers and taxes.
The estimates in this report were produced using the agency’s new framework for analyzing the distributional effects of both means-tested transfers and federal tax-es.7 That framework uses a new measure of household income—income before transfers and taxes—which consists of market income plus social insurance bene-fits.8 The new measure is used to rank households when creating income groups and as the denominator when
5. Not all households receive means-tested transfers. In contrast, all households paid some form of federal taxes in 2014.
6. Federal taxes allocated to households in this analysis are based on tax liabilities incurred in calendar year 2014.
7. See Kevin Perese, CBO’s New Framework for Analyzing the Effects of Means-Tested Transfers and Federal Taxes on the Distribution of Household Income, Working Paper 2017-09 (Congressional Budget Office, December 2017), www.cbo.gov/publication/53345.
8. Unless otherwise noted in the text, “income” refers to household income before accounting for means-tested transfers and federal taxes, “transfers” refers to means-tested transfers, and “taxes” refers to federal taxes.
6 The DisTribuTion of householD income, 2014 march 2018
calculating average means-tested transfer rates and aver-age federal tax rates.9
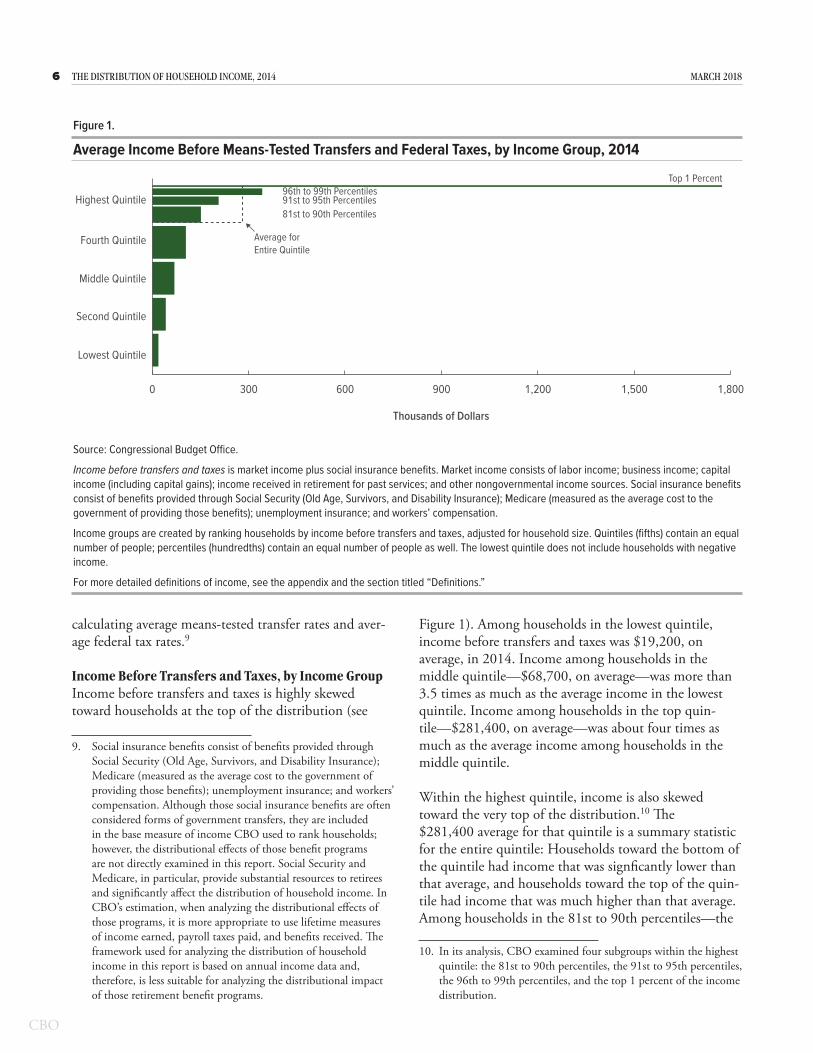
Income Before Transfers and Taxes, by Income GroupIncome before transfers and taxes is highly skewed toward households at the top of the distribution (see
9. Social insurance benefits consist of benefits provided through Social Security (Old Age, Survivors, and Disability Insurance); Medicare (measured as the average cost to the government of providing those benefits); unemployment insurance; and workers’ compensation. Although those social insurance benefits are often considered forms of government transfers, they are included in the base measure of income CBO used to rank households; however, the distributional effects of those benefit programs are not directly examined in this report. Social Security and Medicare, in particular, provide substantial resources to retirees and significantly affect the distribution of household income. In CBO’s estimation, when analyzing the distributional effects of those programs, it is more appropriate to use lifetime measures of income earned, payroll taxes paid, and benefits received. The framework used for analyzing the distribution of household income in this report is based on annual income data and, therefore, is less suitable for analyzing the distributional impact of those retirement benefit programs.
Figure 1). Among households in the lowest quintile, income before transfers and taxes was $19,200, on average, in 2014. Income among households in the middle quintile—$68,700, on average—was more than 3.5 times as much as the average income in the lowest quintile. Income among households in the top quin-tile—$281,400, on average—was about four times as much as the average income among households in the middle quintile.
Within the highest quintile, income is also skewed toward the very top of the distribution.10 The $281,400 average for that quintile is a summary statistic for the entire quintile: Households toward the bottom of the quintile had income that was signficantly lower than that average, and households toward the top of the quin-tile had income that was much higher than that average. Among households in the 81st to 90th percentiles—the
10. In its analysis, CBO examined four subgroups within the highest quintile: the 81st to 90th percentiles, the 91st to 95th percentiles, the 96th to 99th percentiles, and the top 1 percent of the income distribution.
Figure 1 .
Average Income Before Means-Tested Transfers and Federal Taxes, by Income Group, 2014
0 300 600 900 1,200 1,500 1,800
Highest Quintile
Fourth Quintile
Middle Quintile
Second Quintile
Lowest Quintile
Top 1 Percent96th to 99th Percentiles91st to 95th Percentiles81st to 90th Percentiles
Thousands of Dollars
Average for Entire Quintile
Source: Congressional Budget Office.
Income before transfers and taxes is market income plus social insurance benefits. Market income consists of labor income; business income; capital income (including capital gains); income received in retirement for past services; and other nongovernmental income sources. Social insurance benefits consist of benefits provided through Social Security (Old Age, Survivors, and Disability Insurance); Medicare (measured as the average cost to the government of providing those benefits); unemployment insurance; and workers’ compensation.
Income groups are created by ranking households by income before transfers and taxes, adjusted for household size. Quintiles (fifths) contain an equal number of people; percentiles (hundredths) contain an equal number of people as well. The lowest quintile does not include households with negative income.
For more detailed definitions of income, see the appendix and the section titled “Definitions.”

7march 2018 The DisTribuTion of householD income, 2014
bottom half of the top quintile—income before trans-fers and taxes was $151,200, CBO estimates. In con-trast, among the households in the top 1 percent of the income distribution, average household income was $1.77 million.11
Changes in Transfer and Tax Rules That Affected the Distribution of Income in 2014Changes in the rules governing transfers and taxes had direct effects on the distribution of household income in 2014. For example, largely as a result of those changes, for households in the lowest quintile, the average means-tested transfer rate—that is, total means-tested transfers as a percentage of all income before accounting for such transfers and federal taxes—rose from 57 percent in 2013 to 64 percent in 2014, CBO estimates, and the average federal tax rate dropped from 2.3 percent to 1.9 percent.
The most significant effects resulted from implemen-tation of several provisions of the Affordable Care Act (ACA).12 Major provisions of the ACA taking effect that year included:13
11. Although CBO has not examined the distribution of income for smaller slices of the top 1 percent of the income distribution, other researchers have. See Thomas Piketty and Emmanuel Saez, “Income Inequality in the United States, 1913–1998,” Quarterly Journal of Economics, vol. 118, no. 1 (February 2003), pp. 1–39, http://eml.berkeley.edu/~saez/pikettyqje.pdf (470 KB). Those researchers have found that, just as the distribution of income within the highest quintile is highly skewed toward the top 1 percent, the distribution of income within the top 1 percent is also highly skewed toward the very top of the income distribution.
12. As used in this report, the ACA comprises the Patient Protection and Affordable Care Act (Public Law 111-148), the health care provisions of the Health Care and Education Reconciliation Act of 2010 (P.L. 111-152), and the effects of subsequent judicial decisions, statutory changes, and administrative actions.
13. Many other provisions of the ACA are not examined in this report. For example, the ACA allows children up to age 26 to be covered by their parents’ health insurance plans and no longer allows insurance providers to deny individuals health insurance coverage because of preexisting health conditions. Although those provisions may have affected the distribution of income before transfers and taxes, they did not affect rules governing transfers or taxes and therefore are not examined in this report. In addition, several provisions—the employer mandate, medical-device excise tax, and excise tax on high-cost employment-based health insurance, for example—went into effect (or are currently scheduled to take effect) after 2014 and consequently are not examined here. However, two significant changes to tax law that went into effect in 2013—the net investment income tax and the additional Medicare tax—were included in the analysis presented in this report.
• Expanding eligibility for Medicaid,
• Offering subsidies to certain people who purchase health insurance through marketplaces,
• Imposing a penalty on many people who do not have qualifying health insurance, and
• Imposing a fee on certain health insurance providers.
The ACA allowed states to offer Medicaid to many more people—primarily to nonelderly, childless adults. Before the ACA was enacted, eligibility varied considerably by state but was generally limited to low-income parents and their children and pregnant women, as well as to certain disabled people with low income and few assets. In states that chose to expand their Medicaid programs under the ACA, eligibility was extended to most non-elderly residents—including childless adults—whose modified adjusted gross income was below 138 percent of the federal poverty guidelines (commonly known as the federal poverty level, or FPL). In 2014, 25 states and the District of Columbia implemented the ACA’s Medicaid expansion, which resulted in 9.4 million more adults receiving Medicaid coverage in 2014.14
The ACA also offers subsidies to certain people who purchase insurance through health insurance market-places. The ACA’s marketplace subsidies take two forms: premium tax credits, which defray some of the costs of people’s health insurance premiums, and cost-sharing reductions, which lower their out-of-pocket expenses for health care. In general, to receive a premium tax credit, a person must be a U.S. citizen or legal immigrant; have modified adjusted gross income of between 100 percent and 400 percent of the FPL; not be eligible for affordable health insurance through another qualifying source, such as an employer, Medicaid, or Medicare; and purchase insurance through a marketplace (where the person’s eligibility is verified).15 To qualify for a cost-sharing reduction, most enrollees must purchase a silver plan (which pays an average of 70 percent of the costs of cov-ered health care services) through the nongroup insur-
14. Most of those states expanded Medicaid coverage starting on January 1, 2014. Two states—Michigan and New Hampshire—expanded Medicaid coverage later in 2014. Nine states expanded Medicaid coverage to childless adults—primarily through state waiver programs—in 2013. The 9.4 million represents an estimate of the number of persons ever on Medicaid during calendar year 2014.
15. The premium tax credit is larger for eligible lower-income tax filers and declines as income rises over the income eligibility range.

8 The DisTribuTion of householD income, 2014 march 2018
ance marketplace in their area, generally have income between 100 percent and 250 percent of the FPL, receive a premium tax credit toward the silver plan, and not be eligible for other types of coverage, such as employ-ment-based coverage or Medicaid.16
Another provision of the ACA that went into effect in 2014, generally called the individual mandate, requires most U.S. citizens and noncitizens who lawfully reside in the country to have health insurance that meets specified standards. People who have no health insurance (and who are not exempt from the mandate) had to pay a penalty that is collected by the Internal Revenue Service in the greater of two amounts: either a fixed charge for every uninsured adult in a household plus half that amount for each child, or an income-based assessment set at a percentage of the household’s income above the filing threshold for its income tax-filing status.17
Finally, an annual fee imposed on health insurance pro-viders also took effect in 2014. Health insurance provid-ers paid $9 billion in such fees that year.18 CBO allocates those fees to households with employment-based health insurance.
Aside from routine indexing of various tax parameters for inflation, no other changes to tax law directly affecting average federal tax rates took effect in 2014.
Distributional Effects of Major Provisions of the Affordable Care Act in 2014Together, CBO estimates, the provisions of the ACA that were in effect in 2014 boosted household income, on average, for those in the lowest quintiles, and reduced income for households in the highest quintile—partic-ularly for those in the top 1 percent. Those provisions affected both means-tested transfers and federal taxes and
16. As with the premium tax credit, the amount of the cost-sharing reduction is larger for eligible lower-income tax filers and declines as income rises over the income eligibility range.
17. The tax legislation enacted at the end of 2017, P.L. 115-97, eliminated the penalties associated with the individual mandate.
18. The fee was in effect for calendar years 2014 through 2016 but was suspended for calendar year 2017 by the Consolidated Appropriations Act, 2016. The fee went back into effect for calendar year 2018, but a continuing resolution enacted in January 2018 suspended it for calendar year 2019. Under current law, the fee is scheduled to go into effect again after 2019.
consequently had direct effects on the distribution of household income. 19 In addition to the provisions that were implemented in 2014, two major revenue provi-sions went into effect in 2013: a tax on net investment income and an additional Medicare payroll tax. With all major provisions that were in place in 2014 taken into account, households received approximately $56 billion in new means-tested transfers or refundable tax credits and paid an additional $40 billion in new taxes tied to the ACA (see Table 1).20
Expanded Medicaid Eligibility. The largest change in means-tested transfers in 2014 was the expansion of Medicaid eligibility.21 That provision increased federal outlays for the Medicaid program by $38 billion.22 Most of those outlays went to lower-income house-holds. Almost a third of those benefits were provided to households in the lowest income quintile, and more than a quarter of the benefits were provided to households in the second income quintile.
Insurance Subsidies. Subsidies to purchase nongroup health insurance for low- and middle-income households
19. As with any means-tested transfer or federal tax, the new transfers and taxes introduced with the ACA probably reduce incentives to participate in the labor force. Those behavioral effects, which were probably smaller in 2014 than in later years, are not included in the distributional estimates shown here. See Edward Harris and Shannon Mok, Working Paper 2015-09, How CBO Estimates the Effects of the Affordable Care Act on the Labor Market (Congressional Budget Office, December 2015), www.cbo.gov/publication/51065.
20. Not all provisions of the ACA are considered here. Some provisions that did not have direct measurable effects on the distribution of household income are described in Footnote 13.
21. Since 2014, several additional states have opted to expand Medicaid coverage to adults in their states. As of 2017, 31 states and the District of Columbia had expanded Medicaid coverage, and the number of new expansion enrollees was approximately double the number in 2014.
22. As specified in the legislation, the costs associated with the expanded Medicaid eligibility—if states elected to expand Medicaid coverage—were fully borne by the federal government from 2014 through 2016. Starting in 2017, the states began paying for a small share of the additional costs associated with those new Medicaid recipients, and by 2020 states will pay for 10 percent of the additional costs. For other Medicaid recipients, the costs are shared between the federal government and state governments. On average, state governments have paid 43 percent of the costs.

9march 2018 The DisTribuTion of householD income, 2014
affected the distribution of both means-tested transfers and federal taxes. Cost-sharing reduction payments to insurers are federal outlays and are counted in this report as means-tested transfers.23 Premium tax credits, on the other hand, are refundable tax credits, which means that they lower federal revenues and often increase federal outlays; if the amount of a refundable credit exceeds a filer’s tax liability before the credit is applied, the govern-ment pays the excess to the filer. In the federal budget, those payments are counted as outlays. Here, however, the entire premium tax credit is counted as a reduction in federal revenues.
In 2014, the federal government spent $3 billion on pay-ments for cost-sharing reductions. Almost 40 percent of those were provided to households in the lowest income quintile and another third went to households in the second income quintile.
Premium tax credits totaled almost $15 billion in 2014 and provided benefits to households further up the income distribution. More than a quarter of those credits went to households in the lowest quintile, a third went to
23. The Administration stopped making cost-sharing reduction payments in October 2017.
households in the second quintile, more than a fifth went to households in the middle quintile, and about 10 per-cent and 5 percent of the tax credits went to households in the fourth and highest quintiles, respectively.24
New Taxes and Penalties. The revenue provisions that initially went into effect in 2013—the net investment income tax and the additional Medicare payroll tax—placed a combined burden of almost $30 billion dollars on high-income households in 2014. For tax filers with high income, the first provision imposed a 3.8 per-cent tax on net investment income, and the second, an additional 0.9 percent tax on earnings above a certain threshold. The burden of those two tax provisions fell entirely on households in the upper half of the highest income quintile but primarily on households within the top 1 percent of the income distribution.
24. The subsidies in 2014 are not representative of current subsidies. Between 2014 and 2016, the number of individuals and families receiving subsidies to purchase nongroup health insurance through federal health insurance marketplaces increased. Because of that growth, total nongroup health insurance subsidies were approximately twice as much in 2016 as they were in 2014, CBO estimates.
Table 1 .
Major Provisions of the Affordable Care Act That Affected Means-Tested Transfers and Federal Taxes in 2014, by Income Group
Shares (Percent)
ProvisionDollars
(Billions)Lowest Quintile
Second Quintile
Middle Quintile
Fourth Quintile
Highest Quintile
Means-Tested TransfersMedicaid Expansion + 38.4 30.0 25.7 19.0 14.0 10.9Cost-Sharing Reduction + 3.0 38.8 33.4 15.8 6.5 3.0
Federal TaxesPremium Tax Credit + 14.7 28.2 33.1 22.4 9.7 4.9Individual Mandate Penalty − 1.7 11.1 21.7 26.0 20.7 20.2Health Insurance Excise Tax − 8.6 3.4 11.1 18.9 27.6 38.8Net Investment Income Tax − 22.5 0 0 0 0 99.7Additional Medicare Tax − 6.9 0 0 0 0 99.7
Source: Congressional Budget Office.
Income groups are created by ranking households by income before transfers and taxes, adjusted for household size. Quintiles (fifths) contain an equal number of people. The lowest quintile does not include households with negative income.
A plus sign represents an increase in household income, and a minus sign represents a decrease.
For more detailed definitions of income, see the appendix and the section titled “Definitions.”

10 The DisTribuTion of householD income, 2014 march 2018
Another provision of the ACA levied an annual fee on health insurance providers beginning in 2014. In total, health insurance providers paid the federal government $8.6 billion as a result of those new fees. CBO allocated the new fees to households in proportion to the value of their employment-based health insurance premiums. On that basis, the burden of those health insurance fees was relatively skewed toward higher-income households—about 40 percent fell on households in the highest income quintile, and another quarter fell on households in the fourth quintile.
Another revenue provision of the ACA with direct effects on the distribution of household income was the indi-vidual mandate penalty, which required tax filers without adequate health insurance coverage in 2014 to pay a penalty when they filed their taxes. For 2014, households paid approximately $2 billion in individual mandate penalties. The distribution of tax filers paying the penalty was relatively evenly spread across the income distribu-tion, although the largest share of the burden fell on the middle quintile, and the smallest share fell on the lowest quintile.
Overall Effects. The combined effects of the major provi-sions of the ACA considered in this report made house-hold income more evenly distributed. Overall, house-holds in the lowest income quintile received additional resources as a result of that law, whereas households at the very top of the income distribution paid a significant additional amount in taxes (see Figure 2).25 In 2014, households in the lowest and second quintiles received an average of an additional $690 and $560, respectively, because of the ACA, CBO estimates. In contrast, house-holds in the highest quintile paid an additional $1,100,
25. The value of Medicaid and CHIP benefits allocated to households is based on the average cost to the government of providing those benefits. CBO did not attempt to estimate the value that households place on those benefits. Although sick people enrolled in federal health programs that provide assistance to low-income families may value those benefits more than the average cost to the government of providing them, some empirical evidence suggests that, on average, Medicaid recipients value the benefits at less than the average cost to the government of providing those benefits. See Amy Finkelstein, Nathaniel Hendren, and Erzo F. P. Luttmer, The Value of Medicaid: Interpreting Results From the Oregon Health Insurance Experiment, NBER Working Paper 21308 (National Bureau of Economic Research, June 2015), www.nber.org/papers/w21308.
on average, because of that law.26 Most of the burden of the ACA fell on households in the top 1 percent of the income distribution, and relatively little fell on the remainder of households in that quintile. Households in the top 1 percent paid an additional $21,000—primarily because of the net investment income tax and the addi-tional Medicare tax.
On a percentage basis, relative to income before transfers and taxes, the additional income received by households in the lowest quintile was much larger than were the neg-ative changes in income for households in the top 1 per-cent. The ACA increased income among the 24 million households in the lowest quintile by about 3.6 percent. In contrast, the average of $21,000 paid by households in the top 1 percent decreased their income, on average, by 1.2 percent.
Means-Tested Transfer Rates, by Income GroupBecause means-tested transfers are designed specifi-cally to help people who have relatively low income or few assets, they go overwhelmingly to households at the bottom of the income distribution. Households in the lowest quintile received almost half of all means-tested transfers, and households in the second quintile received another quarter of total transfers. The share of means-tested transfers going to households in the middle, fourth, and highest quintiles in 2014 was about 13 percent, 7 percent, and 4 percent, respectively, CBO estimates.
In 2014, the average means-tested transfer rate in the lowest quintile was about 64 percent, CBO estimates—that is, in total, means-tested transfers received by households in that quintile were equal to 64 percent of all income in that quintile before accounting for such transfers and federal taxes (see Figure 3).27 Means-tested transfer rates were significantly lower for higher income groups. The average rates for households in the sec-ond, middle, fourth, and highest quintiles were about
26. Households in the middle and fourth quintiles received slightly more in 2014 because of the ACA, less than $500, on average, for each income group.
27. Even within the lowest income quintile, not all households receive means-tested transfers.

11march 2018 The DisTribuTion of householD income, 2014
Figure 2 .
Average Net Effects of Major Means-Tested Transfer and Federal Tax Provisions of the Affordable Care Act in 2014, by Income Group
Thousandsof Dollars
Average Net E�ect as a Share of Income Before Transfers and Taxes
Average Net E�ect
Percent
81st to 90th Percentiles
91st to 95th Percentiles
96th to 99th Percentiles
Lowest Quintile
Second Quintile
Middle Quintile
Fourth Quintile
Lowest Quintile
Second Quintile
Middle Quintile
Fourth Quintile
Top 1 Percent
81st to 90th Perce
ntiles
91st to 95th Perce
ntiles
96th to 99th Perce
ntiles
Top 1 Percent
-25
-20
-15
-10
-5
0
5
-2
0
2
4
** * *
† † ††
Source: Congressional Budget Office.
Income groups are created by ranking households by income before transfers and taxes, adjusted for household size. Quintiles (fifths) contain an equal number of people; percentiles (hundredths) contain an equal number of people as well. The lowest quintile does not include households with negative income.
Income before transfers and taxes is market income plus social insurance benefits. Market income consists of labor income; business income; capital income (including capital gains); income received in retirement for past services; and other nongovernmental income sources. Social insurance benefits consist of benefits provided through Social Security (Old Age, Survivors, and Disability Insurance); Medicare (measured as the average cost to the government of providing those benefits); unemployment insurance; and workers’ compensation.
For more detailed definitions of income, see the appendix and the section titled “Definitions.”
* = less than $500; † = between -0.5 percent and 0.5 percent.
15 percent, 5 percent, 2 percent, and less than 0.5 per-cent, respectively.28
28. Although means-tested transfers are designed to assist people with low income, the data indicate that some high-income households receive benefits from those programs. That phenomenon may occur for several reasons. For instance, some people have income that varies during the year, and they may therefore qualify for benefits on the basis of low monthly income even though their annual income is high. In addition, some people who qualify for benefits because their own income is low live in high-income households. Finally, a portion of the benefits going to higher-income households probably reflects some misreporting of income, program participation, and benefit amounts in the survey data.
Medicaid and CHIP. Medicaid and CHIP benefits (measured as the average cost to the government of providing those benefits) constitute the largest source of means-tested transfers examined in this report. (Because of their similarities, CBO analyzed Medicaid and the Children’s Health Insurance Program together.) In 2014, those benefits—which accounted for about 70 percent of means-tested transfers received by households—went predominantly to households in the lowest income quin-tile. The average transfer rate—total Medicaid and CHIP benefits divided by total income—among households in the lowest income quintile was 41 percent (see Figure 4). The transfer rate fell precipitously as income increased—households in the second quintile received Medicaid and

12 The DisTribuTion of householD income, 2014 march 2018
CHIP benefits equal to 10 percent of their income, and households in the middle quintile received benefits equal to about 4 percent of their income. Among households in the fourth and highest quintiles, the transfer rates were about 1 percent and less than 0.5 percent, respectively.
Supplemental Nutrition Assistance Program. The sec-ond largest means-tested transfer examined in this report consisted of benefits provided through the Supplemental Nutrition Assistance Program. In 2014, SNAP benefits accounted for about 11 percent of the means-tested transfers households received, CBO estimates. The aver-age SNAP transfer rate among households in the lowest quintile was about 10 percent. The SNAP transfer rate among households in the second quintile was 2 percent;
the rate was less than 0.5 percent for the higher income quintiles.
Supplemental Security Income. The third largest means-tested transfer examined in this report consisted of cash payments from the Supplemental Security Income program. In 2014, SSI benefits accounted for about 9 percent of the means-tested transfers households received, CBO estimates. The average SSI transfer rate among households in the lowest quintile was 7 percent; the average rate was 1 percent among households in the second quintile and less than 0.5 percent for the higher income quintiles.
Figure 3 .
Average Means-Tested Transfer Rates, by Income Group, 2014
64.3
14.7
4.7
1.7
0.0
0 25 50 75
Lowest Quintile
Second Quintile
Middle Quintile
Fourth Quintile
Highest Quintile
Percent
*
Source: Congressional Budget Office.
Average means-tested transfer rates are calculated by dividing total means-tested transfers by total income before transfers and taxes in each income group.
Means-tested transfers are cash payments and in-kind transfers from federal, state, and local governments. The largest means-tested transfers consist of transfers provided through Medicaid and the Children’s Health Insurance Program (measured as the average cost to the government of providing those benefits); the Supplemental Nutrition Assistance Program (formerly known as the Food Stamp program); and Supplemental Security Income.
Income before transfers and taxes is market income plus social insurance benefits. Market income consists of labor income; business income; capital income (including capital gains); income received in retirement for past services; and other nongovernmental income sources. Social insurance benefits consist of benefits provided through Social Security (Old Age, Survivors, and Disability Insurance); Medicare (measured as the average cost to the government of providing those benefits); unemployment insurance; and workers’ compensation.
Income groups are created by ranking households by income before transfers and taxes, adjusted for household size. Quintiles (fifths) contain an equal number of people. The lowest quintile does not include households with negative income.
For more detailed definitions of income, see the appendix and the section titled “Definitions.”
* = less than 0.5 percent.

13march 2018 The DisTribuTion of householD income, 2014
Other Means-Tested Transfers. Other means-tested transfers accounted for the remaining 10 percent of transfers allocated to households in this analysis. Programs in this category include housing assistance programs, low-income subsidies for Part D of Medicare (which covers prescription drugs), Temporary Assistance for Needy Families, child nutrition programs, cost- sharing reductions as part of the Affordable Care Act,
the Low Income Home Energy Assistance Program, and state and local government general assistance programs.
Federal Tax Rates, by Income GroupAverage federal tax rates—which are calculated by dividing total federal taxes in an income group by total income before transfers and taxes in that income
Figure 4 .
Average Means-Tested Transfer Rates, for Selected Income Groups and by Transfer Source, 2014Percent
0
15
30
45
*
Lowest Quintile
Second Quintile
Middle Quintile
Medicaid and CHIP
* ** *
SNAP SSI Other Means-Tested Transfers
Source: Congressional Budget Office.
Average means-tested transfer rates are calculated by dividing total means-tested transfers by total income before transfers and taxes in each income group.
Means-tested transfers are cash payments and in-kind transfers from federal, state, and local governments. The largest means-tested transfers consist of transfers provided through Medicaid and the Children’s Health Insurance Program (measured as the average cost to the government of providing those benefits); the Supplemental Nutrition Assistance Program (formerly known as the Food Stamp program); and Supplemental Security Income.
Other means-tested transfers consist of housing assistance programs; low-income subsidies for Part D of Medicare (which covers prescription drugs); Temporary Assistance for Needy Families; child nutrition programs; cost-sharing reductions as part of the Affordable Care Act; the Low Income Home Energy Assistance Program; and state and local government general assistance programs.
Income before transfers and taxes is market income plus social insurance benefits. Market income consists of labor income; business income; capital income (including capital gains); income received in retirement for past services; and other nongovernmental income sources. Social insurance benefits consist of benefits provided through Social Security (Old Age, Survivors, and Disability Insurance); Medicare (measured as the average cost to the government of providing those benefits); unemployment insurance; and workers’ compensation.
Income groups are created by ranking households by income before transfers and taxes, adjusted for household size. Quintiles (fifths) contain an equal number of people. The lowest quintile does not include households with negative income.
Average means-tested transfer rates for the fourth and highest quintiles are less than 0.5 percent for all sources and transfer programs, except the fourth quintile for Medicaid, which is 1.4 percent.
For more detailed definitions of income, see the appendix and the section titled “Definitions.”
CHIP = Children’s Health Insurance Program; SNAP = Supplemental Nutrition Assistance Program; SSI = Supplemental Security Income; * = less than 0.5 percent.

14 The DisTribuTion of householD income, 2014 march 2018
group—generally rise with income.29 In 2014, house-holds in the bottom fifth of the income distribution paid about 2 percent of their income in federal taxes,
29. Federal taxes allocated to households in this analysis account for approximately 94 percent of all federal revenues, on average. The remaining federal revenue sources not allocated to U.S. households include states’ deposits for unemployment insurance, estate and gift taxes, net income earned by the Federal Reserve, customs duties, and miscellaneous fees and fines.
Because of the complexity of estimating state and local taxes for individual households, this report considers federal taxes only. Researchers differ about whether state and local taxes are, on net, regressive, proportional, or slightly progressive, but most agree that state and local taxes are less progressive than federal taxes. For estimates of the distribution of state and local taxes, see Gerald Prante and Scott A. Hodge, The Distribution of Tax and Spending Policies in the United States, Special Report No. 211 (Tax Foundation, November 2013), https://tinyurl.com/y7aszcwc; and Carl Davis and others, Who Pays? A Distributional Analysis of the Tax Systems in All 50 States, 5th ed. (Institute on Taxation and Economic Policy, January 2015), https://itep.org/whopays/.
households in the middle quintile paid 14 percent, and households in the highest quintile paid about 27 percent (see Figure 5). Average tax rates within the top quintile continued to increase as income rose: Households in the top 1 percent of the before-tax income distribution had an average federal tax rate of about 34 percent.
Another way to analyze the distribution of federal taxes across the income scale is to examine the share of total federal taxes paid by each income group, compared with that group’s share of income. Because the overall fed-eral tax system is progressive, the share of taxes paid by higher-income households exceeds their share of income, and the opposite is true for lower-income households. In 2014:
• Households in the highest income quintile received about 55 percent of all income and paid almost 70 percent of all federal taxes, CBO estimates.
Figure 5 .
Average Federal Tax Rates, by Income Group, 2014
0 10 20 30 40
Lowest Quintile
Second Quintile
Middle Quintile
Fourth Quintile
Highest Quintile81st to 90th Percentile91st to 95th Percentile96th to 99th Percentile
Top 1 Percent
Percent
Average for Entire Quintile
Source: Congressional Budget Office.
Average federal tax rates are calculated by dividing total federal taxes by total income before transfers and taxes in each income group.
Federal taxes consist of individual income taxes, payroll taxes, corporate income taxes, and excise taxes.
Income before transfers and taxes is market income plus social insurance benefits. Market income consists of labor income; business income; capital income (including capital gains); income received in retirement for past services; and other nongovernmental income sources. Social insurance benefits consist of benefits provided through Social Security (Old Age, Survivors, and Disability Insurance); Medicare (measured as the average cost to the government of providing those benefits); unemployment insurance; and workers’ compensation.
Income groups are created by ranking households by income before transfers and taxes, adjusted for household size. Quintiles (fifths) contain an equal number of people; percentiles (hundredths) contain an equal number of people as well. The lowest quintile does not include households with negative income.
For more detailed definitions of income, see the appendix and the section titled “Definitions.”

15march 2018 The DisTribuTion of householD income, 2014
• Within the highest quintile, households in the top 1 percent of the income distribution received about 17 percent of income and paid almost 27 percent of federal taxes.
• In all other quintiles, the share of federal taxes paid was smaller than the share of income received. The shares of total income received by households in the fourth, middle, second, and lowest quintiles were about 20 percent, 13 percent, 9 percent, and 4 percent, respectively. The shares of federal taxes paid by households in those quintiles were 17 percent, 9 percent, 4 percent, and less than 0.5 percent, respectively.
The distribution of federal taxes by income group is very different from the distribution of means-tested transfers. The former is highly concentrated in the highest quintile, whereas the latter is highly concentrated in the lowest two quintiles (see Figure 6).
Individual Income Taxes. The individual income tax is the most progressive component of the federal tax sys-tem. In 2104, households in the lowest income quintile had an average individual income tax rate—total individ-ual income taxes paid by that income group divided by total income before transfers and taxes received by that group—of about -11 percent; households in the second quintile had an average rate of -2 percent, CBO esti-mates (see Figure 7).30 The average individual income tax rate was about 3 percent for the middle quintile, 6 per-cent for the fourth quintile, and 16 percent for the top quintile. Households in the top 1 percent of the income
30. An income quintile has a negative average income tax rate if refundable tax credits in that quintile exceed other income tax liabilities. In the federal budget, the refundable portion of individual income tax credits is treated as an outlay. In this analysis, refundable tax credits comprise both the refundable and the nonrefundable portions of the credits, and the refundable portion of the credits is considered to be a negative tax liability rather than a budgetary outlay. The primary refundable credits in 2014 were the earned income tax credit, the child tax credit, and the premium tax credit created by the ACA.
Figure 6 .
Shares of Means-Tested Transfers and Federal Taxes, by Income Group, 2014Percent
0
20
40
60
80
LowestQuintile
SecondQuintile
MiddleQuintile
FourthQuintile
HighestQuintile
Highest QuintileFourth QuintileMiddle QuintileSecond QuintileLowest Quintile
81st to 99thPercentiles
Top 1 Percent
Means-TestedTransfers
FederalTaxes
**
Source: Congressional Budget Office.
Means-tested transfers are cash payments and in-kind transfers from federal, state, and local governments. The largest means-tested transfers consist of transfers provided through Medicaid and the Children’s Health Insurance Program (measured as the average cost to the government of providing those benefits); the Supplemental Nutrition Assistance Program (formerly known as the Food Stamp program); and Supplemental Security Income.
Federal taxes consist of individual income taxes, payroll taxes, corporate income taxes, and excise taxes.
Income groups are created by ranking households by income before transfers and taxes, adjusted for household size. Quintiles (fifths) contain an equal number of people; percentiles (hundredths) contain an equal number of people as well. The lowest quintile does not include households with negative income.
For more detailed definitions of income, see the appendix and the section titled “Definitions.”
* = less than 0.5 percent.

16 The DisTribuTion of householD income, 2014 march 2018
distribution paid significantly more in individual income taxes than did households in the rest of the income distribution, on average. The average individual income tax rate for that group was 24 percent, on average, CBO estimates.31
Payroll Taxes. Payroll taxes are levied primarily on wages and salaries and generally have a single rate and virtu-ally no exclusions, deductions, or credits. They are also referred to as social insurance taxes because the revenues collected from them are generally credited to federal trust funds—mainly for Social Security and Medicare Part A
31. In addition to varying across income groups, average tax rates can vary significantly within income groups. The variation within income groups is attributable to several factors, including differences in the composition of income, family structure, and the use of tax preferences, as well as the progressive rate structure. For more discussion of the variation in average tax rates within income groups, see Congressional Budget Office, The Distribution of Household Income and Federal Taxes, 2010 (December 2013), Appendix B, pp. 27–30, www.cbo.gov/publication/44604.
(the Hospital Insurance program)—from which social insurance benefits are paid.
Average rates for payroll taxes are similar across most of the income distribution but lower at the top of the distribution. In 2014, the average payroll tax rate was 9.8 percent for households in the lowest quintile, 8.5 percent for the second quintile, 9.0 percent for the middle quintile, and 9.3 percent for the fourth quintile, CBO estimates. The rate for the highest income quintile was significantly lower—at 6.4 percent—and the average rate among households in the top percentile was lower still—2.1 percent—than the rates for all other house-holds. The steep drop in average payroll tax rates at the top of the income distribution was attributable, in part, to the fact that a greater share of those households’ earn-ings was above the maximum amount subject to Social Security payroll taxes ($117,000 in 2014) and, in part, to the fact that earnings represented a smaller share of their total income.
Figure 7 .
Average Federal Tax Rates, by Income Group and Tax Source, 2014Percent
-20
-10
0
10
20
IndividualIncome Taxes
Payroll Taxes CorporateIncome Taxes
Excise Taxes
Lowest Quintile
Middle Quintile
Highest Quintile
Source: Congressional Budget Office.
Average federal tax rates are calculated by dividing total federal taxes by total income before transfers and taxes in each income group.
Income before transfers and taxes is market income plus social insurance benefits. Market income consists of labor income; business income; capital income (including capital gains); income received in retirement for past services; and other nongovernmental income sources. Social insurance benefits consist of benefits provided through Social Security (Old Age, Survivors, and Disability Insurance); Medicare (measured as the average cost to the government of providing those benefits); unemployment insurance; and workers’ compensation.
Income groups are created by ranking households by income before transfers and taxes, adjusted for household size. Quintiles (fifths) contain an equal number of people. The lowest quintile does not include households with negative income.
For more detailed definitions of income, see the appendix and the section titled “Definitions.”

17march 2018 The DisTribuTion of householD income, 2014
Among households in the highest income quintile, the average payroll tax rate is less than half the individual income tax rate, on average. For households in the bot-tom four quintiles, however, average payroll tax rates are significantly higher than individual income tax rates. In 2014, average payroll tax rates were almost 3 percentage points higher among households in the fourth quintile and about 6 percentage points higher for households in the middle quintile, CBO estimates. Because indi-vidual income tax rates were negative, on average, for households in the bottom two quintiles, the differences between payroll tax rates and income tax rates were even more significant. On average, payroll tax rates were about 10 percentage points and 21 percentage points higher than income tax rates for households in the second and lowest quintiles, respectively.
Corporate Income Taxes. The average corporate income tax borne by households increases with income. In its analysis, CBO allocated most of that tax in pro-portion to each household’s share of total capital income (including capital gains), which constitutes a larger share of income at the top of the distribution.32 In 2014, the average corporate income tax rate—the share of corpo-rate taxes allocated to the group divided by the group’s household income before transfers and taxes—was 3.8 percent for households in the highest quintile, CBO estimates. Among households in the top 1 percent of the income distribution, the average corporate income tax rate was 7.3 percent. The average rate was significantly lower among households in the first four quintiles—about 1 percent, CBO estimates. In that year, 78 percent of the total corporate tax burden was borne by house-holds in the highest income quintile; about 46 percent of all corporate taxes was borne by households in the top 1 percent of the income distribution.
32. CBO allocated 75 percent of the corporate income tax to households in proportion to their share of capital income and 25 percent to households in proportion to their share of labor income. Furthermore, when allocating the corporate income tax to households, CBO adjusted the measure of capital gains used in the calculation of each household’s share of capital income. To smooth out large year-to-year variations in capital gains, the agency used a measure of gains scaled to their historical level relative to the size of the economy. For more discussion of the incidence of the corporate income tax, see Congressional Budget Office, The Distribution of Household Income and Federal Taxes, 2008 and 2009 (July 2012), pp.16–18, www.cbo.gov/publication/43373.
Excise Taxes. Sales of a wide variety of goods and ser-vices are subject to federal excise taxes. Most revenues from excise taxes are attributable to the sale of motor fuels (gasoline and diesel fuel), tobacco products, alco-holic beverages, and aviation-related goods and services (such as aviation fuel and airline tickets). Added to those in 2014 was the excise tax levied on health insurance providers, which yielded about $8.6 billion. All in all, the federal government collected about $95 billion in revenues from excise taxes.
Excise taxes are regressive—that is, the burden of excise taxes relative to income is greatest for lower-income households, which tend to spend a larger share of their income on those taxed goods and services: Average excise tax rates in 2014 were 2.6 percent for households in the lowest quintile, 1.0 percent for households in the middle quintile, and 0.5 percent for households in the highest quintile, CBO estimates.
Income After Transfers and Taxes, by Income GroupHousehold income after transfers and taxes is highly skewed toward households at the top of the distribu-tion (see Figure 8). However, because of the progressive design of means-tested transfers and of the federal tax system (driven primarily by the size and structure of the individual income tax), income after transfers and taxes is less skewed than income before transfers and taxes:
• In the lowest income quintile in 2014, average income after transfers and taxes was about 62 percent higher than income before transfers and taxes—$31,100 versus $19,200—CBO estimates.
• Average income after transfers and taxes in the middle quintile—about $62,300—was more than twice as much as average income among households in the lowest quintile. Because, overall, households in the middle quintile paid more in federal taxes than they received in means-tested transfers, average income for that quintile after transfers and taxes was about $6,300 less than the average income before transfers and taxes for that group.
• Among households in the highest quintile, average income after transfers and taxes was about $207,300 in 2014—more than three times the average income after transfers and taxes among households in the middle-income quintile. Because households at the top of the income distribution pay

18 The DisTribuTion of householD income, 2014 march 2018
significantly more in federal taxes than they receive in means-tested transfers, income for that quintile after transfers and taxes was about $74,000 less than the group’s income before transfers and taxes, on average.
• Among households in the top 1 percent of the income distribution, income after transfers and taxes was $1.18 million, on average. That average income was about $595,000 less than that group’s income before transfers and taxes.
To assess the direct distributional effects of federal fiscal policies, it is useful to examine the shares of income across the income groups after accounting for the effects of means-tested transfers and federal taxes, relative to the distribution of the shares before transfers and taxes.
Households in the lowest three quintiles of the income distribution had shares of income after transfers and taxes that were larger than their shares of income before transfers and taxes (see Figure 9).
The greatest difference between the shares of income after transfers and taxes and the shares of income before transfers and taxes was in the lowest quintile—6.9 per-cent versus 3.6 percent. Among households in the middle quintile, the share of income after transfers and taxes was 1.1 percentage points higher than the share of income before transfers and taxes—about 14.6 percent versus 13.4 percent. Among households in the fourth quintile, the share of income after transfers and taxes was about the same as the share of income before transfers and taxes, at 20.4 percent and 20.3 percent, respectively.
Figure 8 .
Average Income After Transfers and Taxes, by Income Group, 2014
0 300 600 900 1,200 1,500 1,800
96th to 99th Percentiles91st to 95th Percentiles81st to 90th Percentiles
Top 1 Percent
Lowest Quintile
Second Quintile
Middle Quintile
Fourth Quintile
Highest Quintile
Average for Entire Quintile
Thousands of Dollars
Source: Congressional Budget Office.
Income after transfers and taxes is income before transfers and taxes plus means-tested transfers minus federal taxes.
Income before transfers and taxes is market income plus social insurance benefits. Market income consists of labor income; business income; capital income (including capital gains); income received in retirement for past services; and other nongovernmental income sources. Social insurance benefits consist of benefits provided through Social Security (Old Age, Survivors, and Disability Insurance); Medicare (measured as the average cost to the government of providing those benefits); unemployment insurance; and workers’ compensation.
Means-tested transfers are cash payments and in-kind transfers from federal, state, and local governments. The largest means-tested transfers consist of transfers provided through Medicaid and the Children’s Health Insurance Program (measured as the average cost to the government of providing those benefits); the Supplemental Nutrition Assistance Program (formerly known as the Food Stamp program); and Supplemental Security Income.
Federal taxes consist of individual income taxes, payroll taxes, corporate income taxes, and excise taxes.
Income groups are created by ranking households by income before transfers and taxes, adjusted for household size. Quintiles (fifths) contain an equal number of people; percentiles (hundredths) contain an equal number of people as well. The lowest quintile does not include households with negative income.
For more detailed definitions of income, see the appendix and the section titled “Definitions.”

19march 2018 The DisTribuTion of householD income, 2014
In contrast, for households in the highest quintile, the share of income after transfers and taxes was 6.6 per-centage points lower than the share of income before transfers and taxes—48.7 percent versus 55.3 percent, CBO estimates. About half of that difference was attrib-utable to the top 1 percent of the income distribution: The share of income for that group after transfers and taxes was 3.4 percentage points lower than the share of income before transfers and taxes—13.3 percent versus 16.7 percent.
Trends in Household Income, Means-Tested Transfers, and Federal TaxesOver time, shifting economic conditions and changes in federal fiscal policies have directly affected the annual distributions of household income. Because the data used in this analysis come from different samples of households and tax filers each year, the trends described in this section of the report do not reflect the growth
patterns for any fixed set of households. Instead, the trends described here reflect the income growth, means-tested transfer rates, and federal tax rates for four income groups: the lowest quintile, the middle three quintiles (21st to 80th percentiles), the 81st to 99th percentiles, and the top 1 percent of the income distribution each year.33
Before accounting for means-tested transfers and federal taxes, real (inflation-adjusted) income was almost 60 per-cent higher, on average, in 2014 than it was in 1979,
33. Much research has been conducted on the related topic of economic mobility. For a comprehensive overview of that research, see Federal Reserve Bank of St. Louis and the Board of Governors of the Federal Reserve System, Economic Mobility: Research and Ideas on Strengthening Families, Communities and the Economy (2016), https://tinyurl.com/ycykrhbv.
Figure 9 .
Shares of Income Before and After Transfers and Taxes, by Income Group, 2014Percent
0
20
40
60
80
LowestQuintile
SecondQuintile
MiddleQuintile
FourthQuintile
HighestQuintile
81st to 99thPercentiles
Income After Transfers and Taxes
Income Before Transfers and Taxes
Top 1 Percent
Highest QuintileFourth QuintileMiddle QuintileSecond QuintileLowest Quintile
Source: Congressional Budget Office.
Income before transfers and taxes is market income plus social insurance benefits. Market income consists of labor income; business income; capital income (including capital gains); income received in retirement for past services; and other nongovernmental income sources. Social insurance benefits consist of benefits provided through Social Security (Old Age, Survivors, and Disability Insurance); Medicare (measured as the average cost to the government of providing those benefits); unemployment insurance; and workers’ compensation.
Income after transfers and taxes is income before transfers and taxes plus means-tested transfers minus federal taxes.
Means-tested transfers are cash payments and in-kind transfers from federal, state, and local governments. The largest means-tested transfers consist of transfers provided through Medicaid and the Children’s Health Insurance Program (measured as the average cost to the government of providing those benefits); the Supplemental Nutrition Assistance Program (formerly known as the Food Stamp program); and Supplemental Security Income.
Federal taxes consist of individual income taxes, payroll taxes, corporate income taxes, and excise taxes.
Income groups are created by ranking households by income before transfers and taxes, adjusted for household size. Quintiles (fifths) contain an equal number of people. The lowest quintile does not include households with negative income.
For more detailed definitions of income, see the appendix and the section titled “Definitions.”

20 The DisTribuTion of householD income, 2014 march 2018
CBO estimates.34 Most income groups experienced substantially lower cumulative growth than that overall average growth rate, whereas the highest income groups experienced much greater growth.
Governmental policies directly affecting the distribution of household income are primarily implemented either through means-tested transfer programs or through the tax system. Over the 36-year period examined in this report, means-tested transfer rates have increased because of both greater participation in such programs and increased spending per recipient in many programs. In 1979, the overall average means-tested transfer rate was 2.1 percent, CBO estimates. By 2014, that rate more than doubled to 4.8 percent. The average federal tax rate has fluctuated, in part, because of changes to tax law and, in part, because of changes in economic conditions. The average federal tax rate in 1979 was 22.4 percent; in 2014, that rate was 21.2 percent. In between those end points, the rate reached a high of 23.1 percent in both 1999 and 2000 and a low of 17.9 percent in 2009.
Means-tested transfers and federal taxes are both progres-sive. On average, low-income households receive more in means-tested transfers and pay less in federal taxes than high-income households do. Because of that pro-gressivity—particularly because of the growth of means-tested transfers—the cumulative growth rate in income after transfers and taxes was substantially higher for the lowest income quintile than the cumulative growth in average income before transfers and taxes over the 36-year period examined here. The difference between the cumulative growth before and after transfers and taxes was also significant for the largest income group—the middle three income quintiles. In contrast, the difference between the cumulative growth measures for the highest income groups—the 81st to 99th percentiles and the top 1 percent—were relatively small.
Trends in Income Before Transfers and TaxesOver the 36-year period between 1979 and 2014, all income groups experienced positive cumulative growth in real (inflation-adjusted) income. That growth, how-ever, was not evenly distributed: The cumulative growth
34. When examining household income over time, income is adjusted for inflation using the price index for personal consumption expenditures, which is calculated by the Bureau of Economic Analysis (BEA). Those data are updated regularly by BEA. The data used in this report are from the January 26, 2018, revision of the series.
at the top of the income distribution was considerably greater than that for the other income groups.
Most income groups experienced relatively little cumula-tive growth in real income. Average income before trans-fers and taxes in the lowest income quintile was about 26 percent higher in 2014 than it was in 1979, CBO estimates (see Figure 10). The cumulative growth in income for the middle three income quintiles combined (the 21st through 80th percentiles) was only slightly greater—about 28 percent over the 36-year period. Those cumulative growth rates correspond to average annual growth rates of about 0.7 percent.
In contrast, income before transfers and taxes for the top quintile grew substantially more than it did for other income groups. Average income before transfers and taxes was about 69 percent higher in 2014 than it was in 1979 for most of the highest quintile (the 81st to 99th percentiles). Cumulative growth for the top 1 percent of the income distribution was more than three times faster: about 221 percent, CBO estimates. Those cumulative growth rates correspond to average annual growth rates of 1.5 percent and 3.4 percent, respectively.
Trends in Means-Tested Transfer Rates, by Income GroupAlthough means-tested transfers go predominantly to households in the lowest income quintile, the eligibil-ity thresholds for some means-tested transfer programs have been increased over time. Consequently, means-tested transfers provided to individuals and families with slightly higher income have increased over the period examined here.
Lowest Income Quintile. The means-tested transfer rate for the lowest income quintile more than doubled from 31 percent in 1979 to 64 percent in 2014 (see Figure 11). That growth was largely driven by spending for Medicaid, which was the largest—and fastest grow-ing—means-tested transfer program during the period examined. In addition to the general upward trend, that transfer rate also had a cyclical component—that is, it tended to increase leading up to and past economic recessions, but tended to fall between recessions as income grew faster than transfers.
Second Income Quintile. Although the means-tested transfer rate for the second quintile was much lower than the rate for the lowest quintile, it also increased

21march 2018 The DisTribuTion of householD income, 2014
significantly. In 1979, the means-tested transfer rate was 2.5 percent for that income group; in 2014, the rate was about 15 percent—an almost sixfold increase, CBO estimates.
Middle Income Quintile. The means-tested transfer rate for the middle quintile was significantly lower than the rates for the first and second quintiles; however, the rate of growth over the 36-year period for this group was similar to the rate of growth for the second quintile.35 In 1979, the means-tested transfer rate for the middle quintile was 0.8 percent, CBO estimates. By 2014, that rate had increased almost sixfold, to almost 5 percent.
Fourth and Highest Quintiles. The means-tested transfer rates in the fourth and highest quintiles were very low over the entire 36-year period. For the fourth quintile, the rate increased from virtually zero in 1979
35. Means-tested transfers are specifically designed to help households with low income; however, some middle- and upper-income household receive them. See Footnote 28.
to 1.7 percent in 2014. For the highest quintile, the rate was virtually zero over the entire period.
Trends in Means-Tested Transfer Rates for the Lowest Quintile, by SourceAs a source of income for low-income households, means-tested transfers have grown significantly over the past 36 years. In its analysis, CBO examined the trends in four sources of means-tested transfers: Medicaid and the Children’s Health Insurance Program, the Supplemental Nutritional Assistance Program, Supplemental Security Income, and other means-tested transfers.36 Among households in the lowest income
36. The means-tested transfer rates presented here incorporate adjustments to the household survey data used in this analysis—the Annual Social and Economic Supplement of the Census Bureau’s Current Population Survey—to correct for underreporting of transfer receipt. CBO adjusted both the number of households receiving transfers and the total dollars received by household for the largest means-tested programs—Medicaid and CHIP, SNAP, and SSI—to match totals in administrative data.
Figure 10 .
Cumulative Growth in Average Income Before Transfers and Taxes, by Income Group, 1979 to 2014Percent
262869
221
-100
0
100
200
300
400
1980 1985 1990 1995 2000 2005 2010
Top 1Percent
81st to 99thPercentiles
Middle Three Quintiles(21st to 80th Percentiles)Lowest Quintile
Source: Congressional Budget Office.
Income before transfers and taxes is market income plus social insurance benefits. Market income consists of labor income; business income; capital income (including capital gains); income received in retirement for past services; and other nongovernmental income sources. Social insurance benefits consist of benefits provided through Social Security (Old Age, Survivors, and Disability Insurance); Medicare (measured as the average cost to the government of providing those benefits); unemployment insurance; and workers’ compensation.
Income groups are created by ranking households by income before transfers and taxes, adjusted for household size. Quintiles (fifths) contain an equal number of people; percentiles (hundredths) contain an equal number of people as well. The lowest quintile does not include households with negative income.
For more detailed definitions of income, see the appendix and the section titled “Definitions.”

22 The DisTribuTion of householD income, 2014 march 2018
Figure 11 .
Average Means-Tested Transfer Rates, for Selected Income Groups, 1979 to 2014Percent
64
15
50
20
40
60
80
1980 1985 1990 1995 2000 2005 2010
Lowest Quintile
Second Quintile
Middle Quintile
Source: Congressional Budget Office.
Means-tested transfer rates are calculated as total means-tested transfers received divided by total income before transfers and taxes in each income group.
Means-tested transfers are cash payments and in-kind transfers from federal, state, and local governments. The largest means-tested transfers consist of transfers provided through Medicaid and the Children’s Health Insurance Program (measured as the average cost to the government of providing those benefits); the Supplemental Nutrition Assistance Program (formerly known as the Food Stamp program); and Supplemental Security Income.
Income before transfers and taxes is market income plus social insurance benefits. Market income consists of labor income; business income; capital income (including capital gains); income received in retirement for past services; and other nongovernmental income sources. Social insurance benefits consist of benefits provided through Social Security (Old Age, Survivors, and Disability Insurance); Medicare (measured as the average cost to the government of providing those benefits); unemployment insurance; and workers’ compensation.
Income groups are created by ranking households by income before transfers and taxes, adjusted for household size. Quintiles (fifths) contain an equal number of people. The lowest quintile does not include households with negative income.
For more detailed definitions of income, see the appendix and the section titled “Definitions.”
quintile in 1979, the transfer rates associated with each of those four sources were similar. Over the 36-year period, however, those rates diverged significantly: The value of Medicaid benefits increased much more than the value of benefits from other means-tested transfer programs (see Figure 12). In 2014, the other sources of means-tested transfers increased household income by significantly smaller amounts.
Medicaid and CHIP. Between 1979 and 2014, Medicaid (along with the Children’s Health Insurance Program) was the fastest growing means-tested transfer. In 1979, the Medicaid transfer rate—total benefits divided by total income before transfers and taxes—for the lowest income quintile was 9 percent, CBO estimates. In 2014, including CHIP, that rate had more than quadrupled, to 41 percent. That growth is attributable to increases in the number of individuals and families receiving benefits and
increases in the average cost of those benefits per recip-ient. Over the period examined, the number of people enrolled in Medicaid or CHIP increased almost fivefold, from about 20 million in 1979 to 95 million in 2014, CBO estimates. 37 Furthermore, the average benefit per recipient—in 2014 dollars—increased from $1,700 in 1979 to $4,500 in 2014.
Supplemental Nutrition Assistance Program. In 1979, the average SNAP transfer rate for the lowest income quintile was 5 percent, CBO estimates. That rate climbed slowly through the 1980s and early 1990s. It fell in the late 1990s, in part because of income growth
37. Those estimates represent the number of recipients who were ever on Medicaid or CHIP in a given calendar year. Furthermore, the estimates are for the noninstitutionalized population; they do not include recipients living in nursing homes and other long-term care facilities. The CHIP program began in 1998.

23march 2018 The DisTribuTion of householD income, 2014
at the bottom of the income distribution and in part because of welfare reform, which limited eligibility for benefits and placed a time limit on the receipt of benefits. The rate then climbed slowly starting in the late 1990s and jumped significantly during the 2007–2009 recession. Average SNAP benefits increased as a result of the American Recovery and Reinvestment Act of 2009, but the expansion of those benefits expired in November 2013. Because of those legislative changes, the rate for the lowest quintile peaked in 2012 at nearly 12 percent and fell to about 10 percent in 2014, CBO estimates.
Supplemental Security Income. Among means-tested programs, the SSI transfer rate has been the most stable over the 1979–2014 period. In 1979, the SSI transfer rate for the lowest income quintile was 5 percent, CBO estimates. In 2014, the rate was 7 percent. That growth was attributable, in part, to increased participation in the SSI program and, in part, to increased benefits per recipient. By law, the maximum monthly SSI benefit increases with the cost of living as measured by the consumer price index for urban wage earners and clerical workers. The SSI transfer rate for the lowest quintile climbed from 6 percent in 1990 to a peak of 8 percent in 1994 partly because of a change in the criteria used to determine whether a child is considered to be disabled
Figure 12 .
Means-Tested Transfer Rates, by Source, Among Households in the Lowest Income Quintile, 1979 to 2014Percent
41
1077
0
10
20
30
40
50
1980 1985 1990 1995 2000 2005 2010
SNAPOther Transfers
SSI
Medicaid and CHIP
Source: Congressional Budget Office.
Means-tested transfer rates are calculated as total means-tested transfers received divided by total income before transfers and taxes in each income group.
Means-tested transfers are cash payments and in-kind transfers from federal, state, and local governments. The largest means-tested transfers consist of transfers provided through Medicaid and the Children’s Health Insurance Program (measured as the average cost to the government of providing those benefits); the Supplemental Nutrition Assistance Program (formerly known as the Food Stamp program); and Supplemental Security Income.
Other means-tested transfers consist of housing assistance programs; low-income subsidies for Part D of Medicare (which covers prescription drugs); Temporary Assistance for Needy Families; child nutrition programs; cost-sharing reductions as part of the Affordable Care Act; the Low Income Home Energy Assistance Program; and state and local government general assistance programs.
Income before transfers and taxes is market income plus social insurance benefits. Market income consists of labor income; business income; capital income (including capital gains); income received in retirement for past services; and other nongovernmental income sources. Social insurance benefits consist of benefits provided through Social Security (Old Age, Survivors, and Disability Insurance); Medicare (measured as the average cost to the government of providing those benefits); unemployment insurance; and workers’ compensation.
Income groups are created by ranking households by income before transfers and taxes, adjusted for household size. Quintiles (fifths) contain an equal number of people. The lowest quintile does not include households with negative income.
For more detailed definitions of income, see the appendix and the section titled “Definitions.”
CHIP = Children’s Health Insurance Program; SNAP = Supplemental Nutrition Assistance Program; SSI = Supplemental Security Income.

24 The DisTribuTion of householD income, 2014 march 2018
and eligible to receive SSI benefits and partly because of Congressionally mandated outreach efforts. The rate decreased after the definition of disability for children was changed again by the Personal Responsibility and Work Opportunity Reconciliation Act of 1996.
Other Means-Tested Transfers. In contrast, the transfer rate for other means-tested transfers declined over the 36-year period examined in this report.38 In 1979, the combined means-tested transfer rate for those programs was 12 percent for the lowest income quintile, CBO estimates. The rate climbed to a peak of 15 percent in 1987, trended downward slightly for the next seven years, and then fell precipitously starting in 1995, in large part because of the Personal Responsibility and Work Opportunity Reconciliation Act; that law insti-tuted state block grants for certain welfare programs, set time limits on the receipt of benefits for certain pro-grams, and required recipients to work, look for work, or participate in job-training programs as a condition of receiving benefits. The means-tested transfer rate for this group of transfer programs has remained relatively stable since 2000 and was an estimated 7 percent for the lowest quintile in 2014.
Trends in Average Federal Tax Rates, by Income GroupYear-to-year fluctuations in average federal tax rates across the income groups are caused both by underlying changes in the income distribution and by legislative changes in federal tax rules. For most income groups, the average federal tax rate fell over the 36-year period examined here—most significantly for the lowest income quintile. The average federal tax rate for households in the middle of the income distribution had also been decreasing, but not as rapidly as that for the lowest quintile. In contrast, the average federal tax rate for the 81st to 99th percentiles of the income distribution was relatively stable over the period, and the average rate for the top 1 percent was significantly more volatile than that for other income groups (see Figure 13).
Lowest Quintile. After increasing slightly between 1979 and 1984, the average federal tax rate for the lowest income quintile decreased steadily over the next
38. Other means-tested transfer programs analyzed in this report consist of housing assistance programs; Temporary Assistance for Needy Families and its predecessor, Aid to Families With Dependent Children; child nutrition programs; the Low Income Home Energy Assistance Program; and state and local government general assistance programs.
two decades. Between 2007 and 2009, the average tax rate for the lowest quintile dropped markedly, largely because of economic stimulus tax credits in 2008, the creation of the Making Work Pay tax credit in 2009, and an expansion of the earned income and child tax credits in both of those years (see Box 1). In 2009, the average federal tax rate for this income group fell just below zero and reached its lowest point over the 36-year period. The average tax rate for the lowest quintile increased steadily after 2009, mainly because the Making Work Pay tax credit expired in 2011 and the temporary reduction in the employee’s share of the Social Security payroll tax expired in 2013. In 2014, the average tax rate for this group—about 2 percent—was significantly below the average rate over the entire 1979–2014 period (7 percent).
Middle Three Quintiles. Average federal tax rates between 1979 and 2014 were relatively stable for the largest segment of the income distribution—measured here as the second, middle, and fourth income quintiles, or the 21st to 80th percentiles. That stability, however, was disrupted by three notable drops in average rates—between 1981 and 1983, between 2000 and 2003, and between 2007 and 2009—and one notable increase, between 2012 and 2013. All of those changes in average federal tax rates were attributable to significant changes in tax law. In 2014, the average federal tax rate for this broad income group was 15 percent, which is below the average rate for the entire period, 17 percent, and signifi-cantly below the peak rate of 20 percent in 1981.
81st Through 99th Percentiles. The average federal tax rate for the 81st through 99th percentiles of the income distribution decreased in the early 1980s and then increased by a small amount, on balance, during the rest of that decade and in the 1990s. The rate then dropped by about 3 percentage points between 2000 and 2003, when a reduction in the rate for the top tax bracket enacted in 2001 took effect. After remaining steady between 2003 and 2007, the average rate fell during the 2007–2009 recession. It was relatively steady between 2009 and 2011 but trended slightly upward thereafter. In 2014, the average tax rate for this group was 24 percent, roughly equal to the average rate over the entire period.
Top 1 Percent. The average federal tax rate for the top 1 percent of the income distribution followed a very different pattern than the average tax rates for the other income groups. The average tax rate for those households

25march 2018 The DisTribuTion of householD income, 2014
Box 1 .
The Distributional Effects of Major Individual Income Tax Credits
Individual income tax credits reduce tax liabilities, dollar for dollar. Such credits are a type of tax expenditure, which is a provision in the tax code that resembles a governmental spending program.1 Most tax credits were created to address specific economic or social policy goals, such as encouraging participation in the labor force and reducing the costs of raising children, attending college, or purchasing health insurance. Furthermore, many credits were designed primarily to benefit low-income individuals: As income increases, the value of such credits diminishes—often until they no longer provide any benefits above certain income thresholds. In that respect, tax credits can have distributional effects similar to those of means-tested transfers.
In this box, the Congressional Budget Office examines the distributional effects of six major individual income tax credits:
• The earned income tax credit (EITC),
• The child tax credit,
• Postsecondary education tax credits,2
• The 2008 economic stimulus credit,
• The Making Work Pay credit,3 and
• The premium tax credit.
Most of the tax credits considered here are refundable—that is, they can result in net payments from the government.4 Specifically, if the amount of the refundable tax credit exceeds a filer’s tax liability before that credit is applied, the gov-ernment pays that excess to the individual.5 Because of the
1. More broadly, tax expenditures are commonly defined as exclusions, deductions, or credits in the tax code that provide financial assistance to specific groups of people or that encourage specific activities.
2. Postsecondary education tax credits comprise the American Opportunity Tax Credit (formerly the Hope credit) and the Lifetime Learning Credit.
3. The Making Work Pay credit was a temporary provision of the American Recovery and Reinvestment Act of 2009. The credit was in effect only in 2009 and 2010.
4. The Lifetime Learning Credit—part of the postsecondary education tax credits—is the only nonrefundable credit in the group of credits considered here.
5. In the federal budget, the portion of refundable credits that reduces the amount of taxes owed is counted as a reduction in revenues, and the portion that exceeds a filer’s tax liability is treated as an outlay. In the
refundability of those credits, the average individual income tax rates among households in the lowest and second quintiles were negative in 2014: –12 percent and –2 percent, respec-tively. Without those tax credits, however, the average individ-ual income tax rate for those two quintiles would have been positive: about 1 percent and 2 percent, respectively.
Between 1979 and 2014, the value of individual income tax credits grew considerably. In 1979, the tax credit rate—that is, total tax credits divided by income before transfers and taxes—among households in the lowest income quintile was approxi-mately 1 percent. By 2014, that rate climbed to 12 percent, CBO estimates (see the figure).
Among the credits examined here, the EITC was the only one in effect between 1979 and 1997. At its inception and for many years thereafter, the EITC was designed to offset the work disincentives created by the payroll tax for low-income workers with children.6 Between the mid-1980s and the mid-1990s, lawmakers expanded the EITC three times, which contrib-uted to the fast growth of the credit rate among households in the lowest income quintile. Those legislative expansions were as follows: Starting in 1987, credit amounts and income parameters for the EITC were indexed for inflation; after 1991, the credit varied by family size (with larger credit amounts for families with two or more children); and, after 1993, the credit amounts were significantly increased and the credit was extended to workers who do not live with children.
Tax credit rates were near zero for households in the second and middle quintiles through most of the 1980s.7 Starting in the late 1980s, however, the expansions in the EITC increased the credit rate among households in the second quintile. The credit rate for households in the middle quintile did not increase sig-nificantly until the introduction of the postsecondary education
analysis presented here, CBO treated the refundable and nonrefundable portions of the credit jointly. For more details on the history and economic impacts of refundable tax credits, see Congressional Budget Office, Refundable Tax Credits (June 2013), www.cbo.gov/publication/43767.
6. The EITC went into effect starting in 1975. The data analyzed here, however, start in 1979.
7. In almost every year between 1979 and 2014, tax credit rates among households in the fourth quintile were below 1 percent. The only exceptions were in 2009 and 2010, when the credit rate increased to 1.5 and 1.6 percent, respectively. Among households in the highest quintile, the tax credit rate was below 0.5 percent over the entire period.
Continued

26 The DisTribuTion of householD income, 2014 march 2018
credits and the child tax credit in 1998.8 Between 1998 and 2004, the child tax credit was expanded several times, leading to steady growth in the credit rates among households in the second and middle quintiles over that period.
Credit rates surged between 2008 and 2010, primarily because of two temporary refundable credits that were introduced to help stimulate the economy during the recession that began at the end of 2007. The Economic Stimulus Act of 2008 autho-rized payments of up to $300 for filers whose income was below certain thresholds in that year; and the American Recovery and Reinvestment Act of 2009 included the Making Work Pay tax credit, which was a refundable tax credit of up to $400 that was available to filers with income under specified thresholds in 2009 and 2010.9 As a result, the credit rate among households in the lowest quintile soared from 8 percent in 2007 to 14 percent in 2009. The rates among households in the second and middle quintiles jumped as well.
In 2014, a new refundable tax credit—the premium tax credit—became available to some filers to offset the premiums paid for health insurance purchased through newly created health insurance marketplaces. Those credits are available to filers with income between 100 and 400 percent of the federal poverty guidelines. The credit rates increased slightly among households in the lowest and second quintile—from 12.1 per-cent to 12.3 percent in the lowest quintile and from 3.6 percent to 4.0 percent in the second quintile—largely as a result of that new credit.
8. The child tax credit is the most widely claimed credit. For married filers with two children, the credit begins to phase out at $110,000, and it completely phases out at $150,000.
9. The EITC and the child tax credits were also expanded as part of the American Recovery and Reinvestment Act of 2009.
Box 1-1. Continued
The Distributional Effects of Major Individual Income Tax Credits
Tax Credit Rates for Major Individual Income Tax Credits for Selected Income Groups, 1979 to 2014
12
4
2
0
5
10
15
1980 1985 1990 1995 2000 2005 2010
Lowest Quintile
Middle Quintile
Second Quintile
Percent
Source: Congressional Budget Office.
Tax credit rates are calculated by dividing total major individual income tax credits by total income before transfers and taxes in each income group.
Major individual income tax credits consist of the earned income tax credit; the child tax credit; postsecondary education tax credits (the American Opportunity Tax Credit—formerly the Hope credit—and the Lifetime Learning credit); the premium tax credit; the 2008 economic stimulus payments; and the Making Work Pay tax credit. Major individual income tax credits include both the refundable and nonrefundable portions of the credit, when applicable.
Income before transfers and taxes is market income plus social insurance benefits. Market income consists of labor income; business income; capital income (including capital gains); and other income sources. Social insurance benefits consist of benefits provided through Social Security (Old Age, Survivors, and Disability Insurance); Medicare (measured as the average cost to the government of providing those benefits); unemployment insurance; and workers’ compensation.
Income groups are created by ranking households by income before transfers and taxes, adjusted for household size. Quintiles (fifths) contain an equal number of people. The lowest quintile does not include households with negative income.
For more detailed definitions of income, see the appendix and the section titled “Definitions.”

27march 2018 The DisTribuTion of householD income, 2014
fell in the early 1980s and then rose as a result of the enactment of the Tax Reform Act of 1986. The rate for that group then fell slightly again in the latter half of the 1980s before rising in the 1990s. That climb reflected both the changes in law that boosted tax rates and the group’s rapidly increasing income, which caused its average tax rate to rise to a peak of 35 percent as more income was taxed in higher tax brackets. The average tax rate for households in the top 1 percent declined after 2000, notably in 2003, when a reduction in the rate for the top tax bracket enacted in 2001 took effect and as further changes in law reduced tax rates on dividends and realized capital gains. The average rate fell again in 2007, mostly because of declines in corporate income taxes; it then rose somewhat from 2007 to 2009, as sharp declines in income from capital gains subjected a larger portion of the income of that group to the tax rates on other income. The rate remained relatively stable between 2009 and 2012.
In 2013, when new taxes enacted as part of the Affordable Care Act and higher individual income tax rates (on ordinary income and capital gains) went into effect, average federal tax rates for this income group surged by about 5 percentage points, to almost 34 per-cent, CBO estimates. That surge was mitigated when some high-income taxpayers shifted income from certain sources—particularly capital gains—from 2013 into 2012. In 2014, capital gains realizations—which are taxed at a lower rate than ordinary income—rebounded, yet the average federal tax rate for this group (which con-sists of taxes from various income sources taxed at differ-ent rates) was unchanged from 2013. The average rate in 2014 was more than 3 percentage points higher than the average rate of 30 percent over the entire 36-year period.
Trends in Average Federal Tax Rates, by Tax SourceIn 2014, the average federal tax rate among all house-holds in the United States was 21 percent, which is
Figure 13 .
Average Federal Tax Rates, by Income Group, 1979 to 2014Percent
2
15
24
34
-10
0
10
20
30
40
1980 1985 1990 1995 2000 2005 2010
Top 1 Percent
81st to 99th Percentiles
Middle Three Quintiles(21st to 80th Percentiles)
Lowest Quintile
Source: Congressional Budget Office.
Average federal tax rates are calculated by dividing total federal taxes by total income before transfers and taxes in each income group.
Federal taxes consist of individual income taxes, payroll taxes, corporate income taxes, and excise taxes.
Income before transfers and taxes is market income plus social insurance benefits. Market income consists of labor income; business income; capital income (including capital gains); income received in retirement for past services; and other nongovernmental income sources. Social insurance benefits consist of benefits provided through Social Security (Old Age, Survivors, and Disability Insurance); Medicare (measured as the average cost to the government of providing those benefits); unemployment insurance; and workers’ compensation.
Income groups are created by ranking households by income before transfers and taxes, adjusted for household size. Quintiles (fifths) contain an equal number of people; percentiles (hundredths) contain an equal number of people as well. The lowest quintile does not include households with negative income.
For more detailed definitions of income, see the appendix and the section titled “Definitions.”

28 The DisTribuTion of householD income, 2014 march 2018
approximately equal to the average rate for the entire 1979–2014 period (see Figure 14). Each of the four sep-arate federal taxes that sum to make up that average—individual income taxes, payroll taxes, corporate income taxes, and excise taxes—had its own distinct pattern over the 36-year period examined in this report.
Individual Income Taxes. Over the past 36 years, the individual income tax has generally been the largest tax source.39 In 2014, the average individual income tax rate—total individual income taxes divided by total income before transfers and taxes—was 10 percent, which was approximately equal to the average rate for the entire period. In 1981, the average individual income tax rate peaked at just over 12 percent but then began to decline because of the reduction in tax rates enacted that year. It rose again after 1993 because of changes in tax law and rapidly rising incomes. After peaking again at almost 12 percent in 2000, the rate fell to about 9 percent in 2003, because of tax cuts in 2001 and 2003 and because of the 2001 recession and subsequent slow
39. Between 2008 and 2010, the average individual income tax rate was equal to or slightly less than the average payroll tax rate.
recovery. The rate dropped further in 2008 and 2009, to a low of about 7 percent, because of declines in income and changes in tax law.
Between 2009 and 2014, individual income tax rates rose steadily as various tax provisions enacted during the 2007–2009 recession expired and new, higher tax rates went into effect for high-income taxpayers in 2013.40
40. Although changes in tax law were the most significant factor driving the increase in average individual income tax rates between 2009 and 2014, at least two other factors contributed to the higher rates over that period. First, during the 2007–2009 recession, wage growth dipped below growth in consumer prices, which is the gauge used to adjust various parameters of the tax code for inflation. After 2009, wage growth was higher than growth in consumer prices—a return to its historical relationship. When wage growth exceeds growth in consumer prices, an increasing share of income falls into higher tax brackets over time—a phenomenon referred to as real bracket creep—which pushes average individual income tax rates higher. The second contributor to the increase in individual income tax rates over the 2009–2014 period was the increase in wage inequality, which also results in relatively more income being taxed at higher rates—because of the progressive structure of the individual income tax system—thus boosting the overall average individual income tax rate.
Figure 14 .
Average Federal Tax Rates, by Source, 1979 to 2014Percent
21
108
310
5
10
15
20
25
1980 1985 1990 1995 2000 2005 2010
All Federal Taxes
Payroll Taxes
Corporate Income Taxes
Excise Taxes
Individal Income Taxes
Source: Congressional Budget Office.
Average federal tax rates are calculated by dividing total federal taxes by source by total income before transfers and taxes.
Income before transfers and taxes is market income plus social insurance benefits. Market income consists of labor income; business income; capital income (including capital gains); income received in retirement for past services; and other nongovernmental income sources. Social insurance benefits consist of benefits provided through Social Security (Old Age, Survivors, and Disability Insurance); Medicare (measured as the average cost to the government of providing those benefits); unemployment insurance; and workers’ compensation.
For more detailed definitions of income, see the appendix and the section titled “Definitions.”

29march 2018 The DisTribuTion of householD income, 2014
The average individual income tax increased by 0.4 per-centage points from 2013 to 2014, CBO estimates.
Payroll Taxes. Between 1979 and 1991, the average pay-roll tax rate rose steadily, from 6.9 percent to a high of 8.7 percent, mostly because of legislated increases in the Social Security payroll tax rate and increases in the max-imum earnings subject to that tax. The payroll tax rate declined slightly in the late 1990s as labor income grew more slowly than other income sources and as earnings above the maximum amount subject to Social Security taxes grew more rapidly than earnings below that amount. The 2001 recession and ensuing slow recovery reversed those trends, leading the average tax rate to rise slightly in the early 2000s.
The rate resumed its decline in the mid-2000s when economic growth picked up, before climbing in 2008 and 2009 as the recession caused nonlabor income (that is, income from dividends, interest, and capital gains) to fall more sharply than labor income and caused earnings above the maximum subject to Social Security taxes to fall more than earnings below that amount. The Tax Relief, Unemployment Insurance Reauthorization, and Job Creation Act of 2010 reduced employees’ share of Social Security payroll taxes by 2 percentage points (from 6.2 percent to 4.2 percent) for two years, which decreased the average payroll tax rate to 6.7 percent in 2012, the lowest observed over the 1979–2014 period. That temporary reduction in payroll taxes expired at the end of 2012. In addition, as part of the Affordable Care Act, the Medicare payroll tax rate was increased by 0.9 percentage points for taxpayers earning more than $200,000 (for individual filers) or $250,000 (for joint filers) in 2013. Those two changes pushed the average payroll tax rate up by 1.2 percentage points to 7.9 per-cent in 2013; that rate fell slightly in 2014 to 7.7 per-cent, just below the average rate over the 36-year period examined here (7.9 percent).
Corporate Taxes. The average corporate income tax rate declined significantly in the early 1980s and then stead-ied over the next two decades, with some slight shifts that generally corresponded to economic expansions and contractions. After the 2001 recession, strong growth in corporate profits pushed up the corporate income tax rate through the mid-2000s. The rate then fell by more than half between 2006 and 2009—from 3.5 percent to 1.5 percent—because of the sharp drop in corporate profits during the most recent recession. As corporate
profits rebounded after the recession, the average corpo-rate income tax rate increased by 0.6 percentage points between 2009 and 2010 and rose by another 0.7 per-centage points between 2011 and 2014. In 2014, the average corporate income tax rate was 2.7 percent, CBO estimates, which is slightly above the average rate of 2.4 percent between 1979 and 2014.
Excise Taxes. The average excise tax rate was the smallest of all the components of the overall federal tax rate. In addition, unlike tax rates for other sources of revenue, the average excise tax rate was fairly stable over the entire 1979–2014 period. In 1979, the average excise tax rate was 1.0 percent, and in 2014, the rate was 0.7 percent.
Trends in Income After Transfers and TaxesChanges in economic conditions, expanding means-tested transfer programs, and federal tax laws have caused income after transfers and taxes—adjusted for the effects of inflation—to grow at different rates across the income spectrum over time (see Figure 15). Cumulative income growth at the very top of the income distribution was significantly faster than that for all other income groups. Furthermore, although federal fiscal policies had rela-tively little effect on the cumulative growth experienced by the highest income quintile (broken out here into two separate income groups—the top 1 percent and the 81st to 99th percentiles), those policies had significant impact on households in the middle and bottom of the income distribution.
Households in the top 1 percent of the income distri-bution—ranked by income before transfers and taxes—experienced the most volatile and significant cumulative growth in income after transfers and taxes. In 2014, real income after transfers and taxes for that income group was 228 percent greater than it was in 1979, CBO esti-mates. Most of that growth and volatility stemmed from the growth and volatility in income before transfers and taxes (which rose by 221 percent)—although changes in average federal tax rates over time for the group exacer-bated the variation in the cumulative growth rate.
Cumulative income growth for the remainder of the highest quintile—the 81st to 99th percentiles—was significantly slower than it was for the top 1 percent. Real income after transfers and taxes for this income group was 73 percent greater in 2014 than it was in 1979. Federal fiscal policies had relatively little effect on the trajectory of income for this group: The cumulative

30 The DisTribuTion of householD income, 2014 march 2018
growth in real income before transfers and taxes was about 69 percent over the period, CBO estimates.
For the middle of the income distribution—measured here as the middle three quintiles, which make up the 21st to 80th percentiles—cumulative growth in real income after transfers and taxes was significantly slower than that for the two higher income groups: about 42 percent. Real income after transfers and taxes grew much faster than income before transfers and taxes for this group (which rose by 28 percent). The faster cumulative growth in income after transfers and taxes is attributable to the combined effects of slightly increas-ing means-tested transfer rates and slightly decreasing average federal tax rates for this group over the 36-year period.
For the lowest income quintile, real income after trans-fers and taxes was 69 percent higher in 2014 than it was in 1979, CBO estimates. That cumulative growth surpassed the average cumulative growth in income after transfers and taxes of the middle of the income distri-bution. Federal fiscal policies with targeted increases in means-tested transfers and decreases in federal taxes con-tributed significantly to that faster income growth: The cumulative growth after transfers and taxes was signifi-cantly greater than the cumulative growth before transfers and taxes (26 percent) for this income group—the result of rapidly growing means-tested transfer rates and gradu-ally decreasing average federal tax rates over the period.
The cumulative growth rates for the four income groups considered here—the lowest quintile, the middle three quintiles, the 81st to 99th percentiles, and the top
Figure 15 .
Cumulative Growth in Average Income After Transfers and Taxes, by Income Group, 1979 to 2014Percent
6942
73
228
-100
0
100
200
300
400
1980 1985 1990 1995 2000 2005 2010
Top 1 Percent
Middle Three Quintiles(21st to 80th Percentiles)Lowest Quintile
81st to 99thPercentiles
Source: Congressional Budget Office.
Income after transfers and taxes is income before transfers and taxes plus means-tested transfers minus federal taxes.
Income before transfers and taxes is market income plus social insurance benefits. Market income consists of labor income; business income; capital income (including capital gains); income received in retirement for past services; and other nongovernmental income sources. Social insurance benefits consist of benefits provided through Social Security (Old Age, Survivors, and Disability Insurance); Medicare (measured as the average cost to the government of providing those benefits); unemployment insurance; and workers’ compensation.
Means-tested transfers are cash payments and in-kind transfers from federal, state, and local governments. The largest means-tested transfers consist of transfers provided through Medicaid and the Children’s Health Insurance Program (measured as the average cost to the government of providing those benefits); the Supplemental Nutrition Assistance Program (formerly known as the Food Stamp program); and Supplemental Security Income.
Federal taxes consist of individual income taxes, payroll taxes, corporate income taxes, and excise taxes.
Income groups are created by ranking households by income before transfers and taxes, adjusted for household size. Quintiles (fifths) contain an equal number of people; percentiles (hundredths) contain an equal number of people as well. The lowest quintile does not include households with negative income.
For more detailed definitions of income, see the appendix and the section titled “Definitions.”

31march 2018 The DisTribuTion of householD income, 2014
1 percent—are equivalent to average annual real growth rates in income after transfers and taxes of 1.5 percent, 1.0 percent, 1.6 percent, and 3.5 percent, respectively, over the 36-year period.
Trends in Income InequalityAs the distribution of income has shifted over time, so has the degree of income inequality.41 A standard measure of income inequality is the Gini coefficient, which summarizes an entire distribution in a single number that ranges from zero to one. At the theoretical extremes, a value of zero means that income is distrib-uted equally among all income groups, whereas a value of one indicates that all the income is received by the highest-income group, and none is received by any of the lower-income groups.
The increase in income inequality over the 36-year period examined here largely stems from the significant increase in inequality in market income—labor income, business income, capital income (including realized capital gains), and other nongovernmental sources of income—which has been driven primarily by substantial income growth at the top of the distribution. In 1979, the Gini coefficient for household market income was
41. A significant body of research has examined changes in U.S. income inequality over time using various data sources and measures of income. For example, Thomas Piketty and Emmanuel Saez rely on income tax data from the Internal Revenue Service’s Statistics of Income; see Piketty and Saez, “Income Inequality in the United States, 1913–1998,” Quarterly Journal of Economics, vol. 118, no. 1 (February 2003), pp. 1–39, http://eml.berkeley.edu/~saez/pikettyqje.pdf (470 KB). Gerald Auten and David Splinter also rely on income tax data, but reach different conclusions about how much income inequality has increased, relative to Piketty and Saez’s estimates; see Auten and Splinter, Using Tax Data to Measure Long-Term Trends in U.S. Income Inequality (draft, December 2016), https://tinyurl.com/ycrhr4ez (PDF, 686 KB). Timothy M. Smeeding and Jeffrey P. Thompson rely on the Federal Reserve’s Survey of Consumer Finances; see Smeeding and Thompson, “Recent Trends in Income Inequality,” in Herwig Immervoll, Andreas Peichl, and Konstantinos Tatsiramos, eds., Who Loses in the Downturn? Economic Crisis, Employment, and Income Distribution, vol. 32 (Research in Labor Economics), pp.1–50, http://tinyurl.com/qdk92x4. Philip Armour, Richard V. Burkhauser, and Jeff Larrimore rely on the Census Bureau’s Current Population Survey; see Armour, Burkhauser, and Larrimore, Levels and Trends in United States Income and Its Distribution: A Crosswalk From Market Income Towards a Comprehensive Haig-Simons Income Approach, NBER Working Paper 19110 (National Bureau of Economic Research, June 2013), www.nber.org/papers/w19110.
0.47. In 2014, the Gini coefficient was 0.60, 27 percent higher than the 1979 coefficient (see Figure 16).42
There were four temporary drops in income inequality over the 36-year period. The first and the last of the four (in 1987 and in 2013) were attributable to changes in tax laws. Specifically, both the Tax Reform Act of 1986 and the American Taxpayer Relief Act of 2012 changed how capital gains were taxed. As a result, high-income households shifted the realization of some capital gains into the prior tax year so they were taxed at lower rates. That shifting of capital income out of one year and into the previous year created a small spike in income inequality in 1986 and 2012, followed by a small drop in measured income inequality in 1987 and 2013. The middle two temporary drops in income inequality (in 2001 and in 2008) were largely attributable to economic recessions that brought about significant capital income losses—and, to a somewhat lesser extent, labor income losses—at the top of the income distribution.
Effects of Social Insurance BenefitsSocial insurance benefits have had the largest effect on reducing income inequality, relative to market income inequality. In 2014, for example, the Gini coefficient for income before transfers and taxes was 0.52, compared with the 0.60 Gini coefficient for household market income. That significant drop in income inequality has largely been attributable to Social Security and Medicare: Benefits from those sizable intergenerational transfer pro-grams are provided primarily to retired individuals, who have relatively small amounts of market income.
The overall trend in the Gini coefficients for income before transfers and taxes, however, tracks closely with the trend in Gini coefficients for market income. In 1979, the Gini coefficient for household income before
42. Gini coefficients in this report are calculated using incomes that have been adjusted for household size. A Gini coefficient can be interpreted and calculated as one-half of the average of the absolute differences in household income for every pair of households, divided by the overall average household income. As such, a Gini coefficient of 0.6 for market income in 2014 implies that the average absolute difference in income between every pair of households in that year was 120 percent (two times 0.6) of the overall average market income (adjusted for differences in household size), or about $79,700. For a more detailed discussion of CBO’s approach to calculating Gini coefficients, see Congressional Budget Office, Trends in the Distribution of Household Income Between 1979 and 2007 (October 2011), www.cbo.gov/publication/42729.

32 The DisTribuTion of householD income, 2014 march 2018
means-tested transfers and federal taxes was 0.41. The 0.52 coefficient in 2014 was 27 percent higher than the 1979 coefficient, which is about the same as the change in the Gini coefficient for market income over the same period. One notable divergence is a steeper drop in the Gini coefficient for income before transfers and taxes during the 2007–2009 recession. That steeper decline was attributable to a significant expansion of unemploy-ment insurance benefits, which were included as part of the social insurance benefits in the measure of income before transfers and taxes but not included in market income.
Effects of Means-Tested TransfersMeans-tested transfers also lower income inequality, as measured by the Gini coefficient, but by a substantially smaller amount than social insurance benefits do. The
degree to which means-tested transfers reduce income inequality has been increasing over time, however, as the amount of government spending on those programs has increased. The effectiveness of means-tested transfers in reducing income inequality can be measured by the difference between the Gini coefficient for income before transfers and taxes and the Gini coefficient for income after means-tested transfers are taken into account but before federal taxes are taken into account. In 1979, that difference was 0.02; by 2014, that difference had dou-bled to 0.04.
Effects of Federal TaxesFinally, the progressive structure of federal taxes—largely attributable to the progressivity of the individual income tax—also reduces income inequality. Over the 1979–2014 period, the degree to which federal taxes reduced
Figure 16 .
Gini Coefficients, 1979 to 2014Gini Coefficient (1.0 = highest inequality, 0 = least inequality)
Based on Income After Transfers and Taxes
Based on Market Income
Based on Income Before Transfers and Taxes
Based on Income After Transfers but Before Taxes
0.60
0.48
0.44
0.52
0.3
0.4
0.5
0.6
0.7
1980 1985 1990 1995 2000 2005 2010
Source: Congressional Budget Office.
The Gini coefficient is a measure of income inequality that ranges from zero (the most equal distribution) to one (the least equal distribution).
Market income consists of labor income; business income; capital income (including capital gains); and other income sources.
Income before transfers and taxes is market income plus social insurance benefits. Market income consists of labor income; business income; capital income (including capital gains); income received in retirement for past services; and other nongovernmental income sources. Social insurance benefits consist of benefits provided through Social Security (Old Age, Survivors, and Disability Insurance); Medicare (measured as the average cost to the government of providing those benefits); unemployment insurance; and workers’ compensation.
Income after transfers and taxes is income before transfers and taxes plus means-tested transfers minus federal taxes.
Means-tested transfers are cash payments and in-kind transfers from federal, state, and local governments. The largest means-tested transfers consist of transfers provided through Medicaid and the Children’s Health Insurance Program (measured as the average cost to the government of providing those benefits); the Supplemental Nutrition Assistance Program (formerly known as the Food Stamp program); and Supplemental Security Income.
Federal taxes consist of individual income taxes, payroll taxes, corporate income taxes, and excise taxes.
For more detailed definitions of income, see the appendix and the section titled “Definitions.”

33march 2018 The DisTribuTion of householD income, 2014
income inequality was greater than the degree to which means-tested transfers did so.
The degree to which the federal tax system reduces income inequality can be measured by the difference between the Gini coefficient for income after account-ing for means-tested transfers but before accounting for federal taxes, and the Gini coefficient for income after accounting for transfers and taxes. That difference has fluctuated over time, as the size and progressivity of the federal tax system has changed. In 1979, the difference between the two Gini coefficients was 0.04. In 2014, it was 0.05, which is only slightly higher than it was in 1979—and slightly higher than the effect of means-tested transfers.
How CBO’s Current Estimates Differ From Those in Previous ReportsThe estimates in this report reflect two significant changes to the methodology that CBO has used in the past to analyze the distribution of household income. In its new methodological framework, the agency has:
• Changed the measure of household income used both to rank households and as the denominator in its calculations of average federal tax rates, and
• Improved its estimates of income from means-tested transfers for the period examined in this report, which spans from 1979 to 2014.
Those methodological changes have slightly altered CBO’s estimates of the distribution of and trends in household income and average federal tax rates. The changes, however, allow CBO to analyze the distribu-tional effects of means-tested transfers—which have become an increasing source of income for households toward the bottom of the income distribution—on the same basis as the distributional effects of federal taxes. Analyzing the distributional effects of both means-tested transfers and federal taxes produces a more comprehen-sive picture of how federal fiscal policies directly affect the distribution of household income.
CBO’s Revision to Its Income MeasureIn previous CBO reports on the distribution of house-hold income, the primary income measure used to rank households and calculate average federal tax rates was a broad measure of before-tax income. That income measure was equal to market income plus government
transfers, which consisted of a broad set of cash and in-kind benefits from federal, state, and local govern-ments. Those government transfers included both social insurance benefits—Social Security, Medicare, unem-ployment insurance, and workers’ compensation—and means-tested transfers. Because prior reports focused on how federal taxes affect the distribution of household income, that broad measure was the most appropriate way to analyze the distribution of household income, given the constraints of available data and the goal of the analyses.
Although CBO’s previous income measure was appropri-ate for analyzing the distributional effects of federal taxes, the tax and transfer systems have become increasingly intertwined. In the analysis underlying this report, the primary income measure used to rank households and to calculate average federal tax rates is income before trans-fers and taxes. The difference between before-tax income and income before transfers and taxes is that means-tested transfers are included in the former but excluded from the latter. (In 2014, for example, total income before transfers and taxes was 5 percent less than total before-tax income, CBO estimates.) Cash and in-kind benefits from social insurance programs are still included in income before transfers and taxes. This new income mea-sure is also the denominator in the calculation of average federal tax rates and means-tested transfer rates.43
Improved Estimates of Means-Tested TransfersThe amounts of transfer income used in CBO’s analyses of the distribution of household income were obtained largely from household survey data, specifically, from the Census Bureau’s Annual Social and Economic Supplement to the Current Population Survey. In general, however, survey respondents tend to understate their income on household surveys, and for various
43. For more discussion on this methodological change, see Kevin Perese, CBO’s New Framework for Analyzing the Effects of Means-Tested Transfers and Federal Taxes on the Distribution of Household Income, Working Paper 2017-09 (Congressional Budget Office, December 2017), www.cbo.gov/publication/53345; Kevin Perese and Bilal Habib, Congressional Budget Office, “Methodological Improvements for CBO’s Analysis of the Distribution of Household Income” (presentation at the Distributional Tax Analysis Conference, Washington, D.C., September 13, 2017), www.cbo.gov/publication/53095; and Kevin Perese, Principal Analyst, Congressional Budget Office, “Frameworks for Distributional Analyses” (presentation at the Annual Meeting of the Allied Social Science Associations, San Francisco, Calif., January 4, 2016), www.cbo.gov/publication/51106.

34 The DisTribuTion of householD income, 2014 march 2018
reasons both the number of recipients and the total dol-lars received by households in the form of means-tested transfers are substantially lower in the household survey data than in administrative data sources.44 Furthermore, over time, the aggregate data collected from household surveys has increasingly fallen short of the administrative totals.45
To improve the representativeness of the means-tested transfer data in the household survey data used in this analysis, CBO imputed receipt of means-tested transfers to individuals and families who were likely to receive such transfers but may not have reported them in the survey. Those imputations were done for the largest means-tested transfer programs—Medicaid and CHIP (considered together), SNAP, and Supplemental Security Income.46 In addition, CBO estimated average benefit
44. Administrative data are collected by the agencies that operate specific programs and provide higher-quality—if not definitive—information on the number of recipients and total amount spent by the government in providing means-tested transfers to households.
45. See Robert A. Moffitt and John Karl Scholz, Trends in the Level and Distribution of Income Support, NBER Working Paper 15488 (National Bureau of Economic Research, November 2009), www.nber.org/papers/w15488; Bruce D. Meyer, Wallace K. C. Mok, and James X. Sullivan, The Under-Reporting of Transfers in Household Surveys: Its Nature and Consequences, NBER Working Paper 15181 (National Bureau of Economic Research, July 2009), www.nber.org/papers/w15181; and Laura Wheaton, Underreporting of Means-Tested Transfer Programs in the CPS and SIPP (Urban Institute, February 2008), https://tinyurl.com/yd4caq7n.
46. In addition, CBO made improvements to estimates of the value of Social Security and Medicare benefits received by households, which are the two largest social insurance benefits included in the new income measure—income before transfers and taxes. The discrepancies between the survey data and administrative data for
amounts for imputed recipients and aligned both the number of recipients and average recipient amounts so that the total amounts received in the household data—after adjustment—matched administrative totals.47 Those imputations significantly increased incomes for low-income households and better captured the effects of increasing federal expenditures on means-tested transfer programs over the 36-year period examined here.48 Those imputations result in means-tested transfer rates that are higher than they would be if they were calculated using survey data. Because transfer income is concentrated in lower-income households, the imputations increased incomes toward the bottom of the income distribution. Furthermore, because those transfers have been increas-ing over time, the imputations slightly reduced both the measured level of and trend in income inequality after transfers and taxes.
those two income sources were not as large as the discrepancies for mean-tested transfers. As such, estimates for only the average benefit amounts were improved; CBO made no changes to the underlying data regarding the number of households receiving benefits from those programs.
47. For an overview of the methodology used for those imputations, see Bilal Habib, Associate Analyst, Congressional Budget Office, “Correcting for Underreporting of Government Transfers: A Regression-Based Approach With Preliminary Results” (presentation at a workshop organized by the Washington Center for Equitable Growth, Washington, D.C., July 21, 2017), www.cbo.gov/publication/52915; and Kevin Perese and Bilal Habib, Congressional Budget Office, “Methodological Improvements for CBO’s Analysis of the Distribution of Household Income” (presentation at the Distributional Tax Analysis Conference, Washington, D.C., September 13, 2017), https://www.cbo.gov/publication/53095.
48. See Congressional Budget Office, Growth in Means-Tested Programs and Tax Credits for Low-Income Households (February 2013), www.cbo.gov/publication/43934.

Appendix: CBO’s Distributional Methodology
The Congressional Budget Office’s analyses of the dis-tribution of household income and federal taxes have been released on a regular basis for over 30 years.1 This appendix provides details about the most important assumptions underlying those analyses.
Unit of AnalysisCBO uses households as the unit of analysis in its distri-butional reports. A household consists of the people who share a housing unit, regardless of their relationship.2 The data used in CBO’s analyses come from two primary sources: one that provides data on tax-filing units and another that provides household-level data. A household can consist of more than one tax-filing unit, such as a married couple and their adult child. To incorporate data on tax-filing units into the analysis, the agency creates tax-filing units from the household-level data on the basis of the relationship and income information col-lected by the household surveys. Once both data sources are organized using the same unit of analysis—tax-filing units—they are statistically matched to create a database with information from both data sources (see the next section for details on the statistical matching methodol-ogy). For the final presentation of distributional results, data for those statistically matched tax-filing units are summed back to the household level.
DataThe core data used in CBO’s distributional analyses were obtained from the Statistics of Income (SOI), a nationally representative sample of individual income tax returns collected by the Internal Revenue Service.
1. See Congressional Budget Office, “Major Recurring Reports,” www.cbo.gov/about/products/major-recurring-reports, for links to reports in this series going back to 2001. Citations and links to earlier reports are provided below in the timeline of methodological changes.
2. The U.S. Treasury’s Office of Tax Analysis uses family units in its distributional analyses. Family units are similar to household units but exclude unrelated persons living together. The Internal Revenue Service, the Joint Committee on Taxation, and the Urban–Brookings Tax Policy Center all use tax-filing units as the unit of analysis in their distributional analyses.
The number of returns sampled grew over the period studied—1979 to 2014—rising from roughly 90,000 in some of the early years to more than 300,000 in later years.
Tax-return information is supplemented with data from the Annual Social and Economic Supplement of the Census Bureau’s Current Population Survey (CPS), which contains survey data on the demographic char-acteristics and income of a large sample of households.3 The two sources are combined by statistically matching each SOI record to a corresponding CPS record on the basis of demographic characteristics and income. Each pairing results in a new record that takes on some charac-teristics of the CPS record and some characteristics of the SOI record.4
The first step in the statistical matching process is to align the unit of analysis by constructing tax-filing units from CPS households. A tax-filing unit is a single person or a married couple plus any dependents. In CBO’s analysis, the heads of CPS households (and their spouses,
3. The CPS sampling frame seeks to represent the civilian noninstitutionalized population of the United States. As such, the scope of CBO’s analysis is limited to that target population. People living in correctional facilities, nursing homes, and military bases are not included in this analysis. However, members of the Armed Forces living in civilian housing units on a military base or in a household not on a military base are included.
In 2014, the Census Bureau split the CPS sample into two groups to test new income and health insurance questions on a smaller subsample. For this report, CBO used the data corresponding to survey questions that were consistent with those used in prior years.
4. For a general description and evaluation of statistical matching, see Michael L. Cohen, “Statistical Matching and Microsimulation Models,” in Eric A. Hanushek and Constance F. Citro, eds., Improving Information for Social Policy Decisions: The Uses of Microsimulation Modeling—Volume II: Technical Papers (National Academies Press, 1991), http://dx.doi.org/10.17226/1853; and Marcello D’Orazio, Marco Di Zio, and Mauro Scanu, Statistical Matching: Theory and Practice (John Wiley & Sons, 2006), http://dx.doi.org/10.1002/0470023554.

36 THE DISTRIBUTION OF HOUSEHOLD INCOME, 2014 march 2018
if present) are designated as tax-filing units. Tax rules are used to determine whether other members of the house-hold can be claimed as dependents on the basis of their age, relationship with the primary tax-filing unit, and income.5 People who meet those criteria are classified as dependents; those who do not are classified as separate tax-filing units within the household. When multiple people could potentially claim one member of a house-hold as a dependent, the agency assumes that the house-hold chooses the arrangement that results in the most advantageous tax situation—for example, two unmar-ried, cohabitating partners with two children might each claim one child and file as a head of household if doing so lowered their combined taxes.
Next, the agency divides tax-filing unit records in each file into 15 demographic groups on the basis of marital status (married or single); number of dependents (zero, one, or two or more); whether the tax-filing unit can be claimed as a dependent (yes or no); and whether the tax filer and his or her spouse (if applicable) are 65 or older (neither, one, or both). Records from the two files are matched within the same demographic groups, with certain exceptions. Because the CPS file contains fewer head-of-household tax-filing units (single parents with dependent children) than the SOI file does, some SOI head-of-household tax-filing units are matched with single tax-filing units without children and married tax-filing units from the CPS. The deficit in head-of-household filers in the CPS data probably reflects some combination of misreporting of filing status in the SOI and a failure of the algorithm that creates tax units for the CPS to account for complex living arrangements.
Within each demographic group, CBO estimates an ordinary least squares (OLS) regression model of total income as a function of all the income items that are common to both the SOI and the CPS—such as wages, interest, dividends, rental income, business income and losses, pension income, and unemployment insurance. The OLS models are estimated using the SOI data. CBO applies the coefficients estimated from the regres-sion models to the records in both files to construct a predicted total income variable. Tax-unit records in both files (independently within each demographic cell) are then sorted in descending order by predicted total income.
5. A dependent may be considered a tax-filing unit if he or she received income above a certain threshold in a given tax year.
The SOI data and the CPS data come from samples, and therefore each record from both files has a sample weight associated with it. The sum of all the sample weights in the SOI file represents the total number of tax units that filed taxes in a given year. The sum of all the weights in the CPS file represents all of the tax units in the United States—both those that filed a tax return and those that did not. The SOI file contains many more records than the CPS file yet represents fewer total tax units. Therefore, the average sample weight in the SOI file is lower than the average sample weight in the CPS file.
Because of those differences in sample weights, SOI and CPS records are not matched on a one-to-one basis. Within each demographic group, matching begins with the record from each file that represents the highest pre-dicted total income. Of the two records, the one with the lower sample weight is matched to only one correspond-ing record from the other file. The record with the higher weight is “split” and is available (with its weight reduced) to be matched to the next record in the other file. (In practice, the highest-income SOI records have very low sample weights, so the matching algorithm matches the top SOI record to many CPS records.)
That process is repeated until all the SOI records are exhausted. Each matched pairing results in a new record with the demographic characteristics of the CPS record and the income reported in the SOI. Residual CPS records (which have the lowest predicted income) are assumed to represent tax-filing units that did not file a tax return.
Some types of income, such as certain types of transfer payments and in-kind benefits, appear only in the CPS records. CBO has improved estimates of the largest means-tested transfers in the CPS—Medicaid and CHIP, SNAP, and SSI (see the section of the report titled “How CBO’s Current Estimates Differ From Those in Previous Reports”). Other means-tested transfer income data come directly from the CPS. For CPS records that represent nonfiling tax units, all income sources come from the CPS.
Finally, households are reconstructed from tax-filing units on the basis of relationships reported in the CPS. In general, CPS tax-filing units will have been matched to multiple SOI tax-filing units. When CPS tax-fil-ing units are summed to the household level, multiple replications of a given household are created to cover

37APPENDIX: CBO’S DISTRIBUTIONAL METHODOLOGY THE DISTRIBUTION OF HOUSEHOLD INCOME, 2014
all possible combinations of the matched SOI–CPS tax units. Each household replication is appropriately weighted so that the sum of all the replications equals the original CPS household-level sample weight.6
Income MeasuresMost distributional analyses rely on a measure of annual income as the metric for ranking households from least economically secure to most economically secure. In CBO’s analyses, information on taxable income sources comes from the SOI, whereas information on nontaxable income sources and income for tax-filing units that do not file individual income tax returns comes from the CPS.
The income measures used throughout this analysis are defined as follows:
Income before transfers and taxes consists of market income plus social insurance benefits.
Market income consists of the following components:
• Labor income. Cash wages and salaries, including those allocated by employees to 401(k) plans; employer-paid health insurance premiums (as measured by the CPS); the employer’s share of Social Security, Medicare, and federal unemployment insurance payroll taxes; and the share of corporate income taxes borne by workers.
• Business income. Net income from businesses and farms operated solely by their owners, partnership income, and income from S corporations.
• Capital income (including capital gains). Profits realized from the sale of assets (but not increases in the value of assets that have not been realized through sales); taxable and tax-exempt interest; dividends paid by corporations (but not dividends from S corporations, which are considered part of business income); positive rental income; and the share of corporate income taxes borne by capital owners.
6. For a graphical presentation of the statistical matching algorithm, see Kevin Perese, Principal Analyst, Congressional Budget Office, “Statistically Matching Administrative Tax Data With Household Survey Data” (presentation at a Washington Center for Equitable Growth workshop on distributional national accounts, Washington, D.C., July 21, 2017), www.cbo.gov/publication/52914.
• Other income sources. Income received in retirement for past services and other nongovernmental sources of income.
Social insurance benefits consist of the following components:
• Social Security benefits (which consist of benefits from Old Age, Survivors, and Disability Insurance),
• Medicare health insurance benefits (measured as the average cost to the government of providing those benefits),
• Unemployment insurance benefits, and
• Workers’ compensation benefits.
Income after transfers and taxes is income before trans-fers and taxes plus means-tested transfers minus federal taxes.
Means-tested transfers consist of both cash and in-kind benefits provided through the following programs:
• Medicaid and the Children’s Health Insurance Program (measured as the average cost to the government of providing those benefits),
• The Supplemental Nutrition Assistance Program (formerly known as the Food Stamp program),
• Supplemental Security Income,
• Housing assistance programs,
• Low-income subsidies for Part D of Medicare (which covers prescription drugs),
• Temporary Assistance for Needy Families and its predecessor, Aid to Families With Dependent Children,
• Child nutrition programs,
• Payments for cost-sharing reductions as part of the Affordable Care Act,
• State and local government general assistance programs, and

38 THE DISTRIBUTION OF HOUSEHOLD INCOME, 2014 march 2018
• The Low Income Home Energy Assistance Program.
Federal taxes consist of the following components:7
• Individual income tax liabilities,
• Payroll taxes (also known as social insurance taxes),8
• Corporate income taxes, and
• Excise taxes.
Incidence of Federal TaxesCBO allocates the individual income taxes and the employee’s share of payroll taxes to the households pay-ing those taxes directly. CBO also allocates the employ-er’s share of payroll taxes to employees because employers appear to pass on their share of payroll taxes to employ-ees by paying lower wages than they otherwise would.9
CBO allocates excise taxes to households according to their consumption of taxed goods and services. Excise taxes on intermediate goods, which are paid by busi-nesses, are allocated to households in proportion to their overall consumption. CBO assumes that house-hold spending patterns across income and demographic groups in the CPS are similar to those observed in the Bureau of Labor Statistics’ Consumer Expenditure Survey.
Far less consensus exists among researchers about how to allocate corporate income taxes (and taxes on capi-tal income generally). CBO allocates 75 percent of the
7. Federal taxes allocated to households in this analysis account for approximately 94 percent of all federal revenues, on average. The remaining federal revenue sources not allocated to U.S. households include states’ deposits for unemployment insurance, estate and gift taxes, net income of the Federal Reserve remitted to the Treasury, customs duties, and miscellaneous fees and fines.
8. Payroll taxes include those that fund the Social Security trust funds, the Medicare trust fund, and unemployment insurance trust funds. The federal portion of the unemployment insurance payroll tax covers only administrative costs for the program; state-collected unemployment insurance payroll taxes are not included in CBO’s measure of federal taxes.
9. In theory, if the payroll tax did not exist, an employee’s salary and wages would be higher by approximately the amount of the payroll tax. Therefore, CBO adds the employer’s share of payroll taxes to households’ earnings when calculating income before transfers and taxes.
burden of corporate income taxes to owners of capital in proportion to their income from interest, dividends, rents, and adjusted capital gains. CBO adjusts capital gains by scaling them to their long-term historical level given the size of the economy and the tax rate that applies to them; that method reduces the effects of large year-to-year variations in the total amount of gains real-ized. The remaining 25 percent of the corporate income tax is allocated to workers in proportion to their labor income.10
Adjusting Income to Account for Differences in Household SizeHouseholds with identical income can differ in ways that affect their economic status. For example, a larger household generally needs more income to support a given standard of living than a smaller one does. However, economies of scale in some types of consump-tion—housing in particular—can mean that two people generally do not need twice the income to live as well as one person who lives alone. Because of those known economies of scale, income is an imperfect measure of economic status.
To better rank households by their relative economic status, CBO adjusts the income measure, dividing household income by an adjustment factor known as an equivalence scale. Various equivalence scales are in use today, and a significant, if somewhat dated—though still useful—body of literature explores why and how alternative equivalence scales should be calculated for the purpose of setting public policy parameters—specifically, those related to measuring poverty and means-tested programs.11
To account for household economies of scale, the equivalence scale should take a value of between 1 and
10. For a more detailed discussion of CBO’s methodology for allocating corporate taxes, see Congressional Budget Office, The Distribution of Household Income and Federal Taxes, 2008 and 2009 (July 2012), www.cbo.gov/publication/43373.
11. See, for example, Patricia Ruggles, Drawing the Line: Alternative Poverty Measures and Their Implications for Public Policy (Urban Institute Press, 1990); National Research Council, Measuring Poverty: A New Approach (National Academies Press, 1995), http://dx.doi.org/10.17226/4759; and Organisation for Economic Co-opeartion and Development, OECD Project on Income Distribution and Poverty, “What Are Equivalence Scales?” (accessed September 11, 2017), www.oecd.org/els/soc/OECD-Note-EquivalenceScales.pdf (388 KB).

39APPENDIX: CBO’S DISTRIBUTIONAL METHODOLOGY THE DISTRIBUTION OF HOUSEHOLD INCOME, 2014
the number of people in the household. An equivalence scale equal to 1 would make no change to the income measure and would not account for the greater needs of larger households. At the other end of the spectrum, an adjustment factor equal to the number of people in the household would imply equal average household income per person, which would not capture the bene-fits of shared consumption—most significantly, housing expenses—within the household.
A generalized formula for calculating an equivalence scale can be expressed as follows:
= ,,
where where is the number of people in the household and is the number of people in the household and is the number of people in the household and is an elasticity parameter for household size that ranges from 0 and 1, with larger values implying smaller econ-omies of scale.12 To adjust household income for differ-ences in household size, CBO uses an equivalence scale known as the square root scale.13 Under that method, adjusted household income is calculated as household income divided by the square root of the number of people in the household.
Calculating the equivalence scale as the square root of the number of people in the household is the same as setting the elasticity parameter for household size to 0.5 because
e square root of the number of people in the household is because ≡ 0.5.. Using 0.5 as the elasticity parame-
ter for household size is convenient for several reasons:
12. Some equivalence scales have additional parameters to differentiate between the needs of additional adults and additional children, in which case the formula would be
= 1 + (α + γ ) where where α and and γ are weights between 0 and 1 applied to the additional number of adults and children (
+ γd to the additional number of adults and children (
and ) ,
and ) in the household, respectively.) in the household, respectively.
13. The most recent distributional analyses by the Treasury and the Organisation for Economic Co-operation and Development (OECD) also adjust for household or family size using the square root equivalence scale. By contrast, recent studies by government agencies in the United Kingdom and Australia use a more complex adjustment called the modified OECD equivalence scale (although it is no longer used by the OECD), which gives a full weight to the first adult in a household, a half weight to the second adult, and a 0.3 weight to each child. The Urban–Brookings Tax Policy Center, the Internal Revenue Service, Thomas Piketty and Emmanuel Saez, and the Joint Committee on Taxation all use tax units as their units of analysis and do not make any adjustments for differences in tax unit size.
Table A-1 .
Households With Different Unadjusted Income but Similar Adjusted Income
Number of People in Household Unadjusted Income Adjusted Income
Five People $89,440 $40,000($89,440/√5 ≈ $40,000)
Four People $80,000 $40,000($80,000/√4 ≈ $40,000)
Three People $69,280 $40,000($69,280/√3 ≈ $40,000)
Two People $56,570 $40,000($56,570/√2 ≈ $40,000)
One Person $40,000 $40,000($40,000/√1 = $40,000)
Source: Congressional Budget Office.
• It is the midpoint in the range of possible values for the parameter (It is the midpoint in the range of possible values for the parameter ( 0 < . < 1)).
• It implies that each additional person increases the household’s needs, but at a decreasing rate.
• The resulting household-size adjustment is similar to the family size adjustments the Census Bureau uses in setting U.S. poverty thresholds.
• It is transparent and relatively easy to understand.
Applying the square root equivalence scale to adjust income for differences in household sizes means that some households with higher income (but more people living in them) may be considered equivalent in income to households with lower income (but fewer people living in them). (See Table A-1).
CBO adjusts income for household size using the square root equivalence scale only for the purpose of rank-ing households and assigning them to income groups. All other income measures presented in the agency’s distributional analyses are unadjusted. CBO presents households in adjusted household income quintiles and provides additional detail for smaller, percentile-based groupings of households within the highest income quin-tile (the 81st through 90th percentiles, the 91st through 95th percentiles, the 96th through 99th percentiles, and the top 1 percent). Each quintile contains approximately 20 percent of the noninstitutionalized U.S. population,

40 THE DISTRIBUTION OF HOUSEHOLD INCOME, 2014 march 2018
and each percentile contains approximately 1 percent of the population. However, because household sizes vary, the adjusted household income quintiles contain slightly different numbers of households.
Changes in CBO’s Distributional Analyses Over TimeOver the past several decades, the frameworks and assumptions used by analysts conducting distributional analyses have evolved along several dimensions. The changes to CBO’s framework described in this report are consistent with the broader research community’s reassessments of the most informative way to treat var-ious components of distributional analyses. A constant tension exists between how a researcher would optimally measure economic resources and the data and methods available to do so. Changes over time have been attrib-utable to advances in data collection methods and new research on the economic incidence of various taxes.
Over the years, CBO has made such changes in its calcu-lation and presentation of the distribution of household income and federal taxes. Some of those methodological changes have resulted in significant shifts in the inter-pretations of trends in household income. Below is a chronology of the major methodological changes made in CBO’s distributional analyses.
October 1987 CBO published The Changing Distribution of Federal Taxes: 1975–1990.14 The analysis was based primarily on incomes reported in the CPS, although adjustments were made to ensure consistency with income as reported in the SOI data. The analysis used a measure of cash family income, which included cash transfers but not in-kind transfers. Estimates of the employer’s contribution to payroll taxes as well as federal corporate income taxes were added to family income to create a pretax measure. Incomes were not adjusted for differences in family size. For most taxes, the assumptions about which households bear the burden of a given tax were largely the same as those used in recent CBO reports. However, results were presented on the basis of two different assumptions about the incidence of the corporate income tax— allocating it all to capital income or all to labor income.
14. See www.cbo.gov/publication/16367.
February 1988 CBO published Trends in Family Income: 1970–1986.15 That analysis marked the beginning of CBO’s practice of adjusting income for differences in family size. Those adjustments were made by dividing income by the poverty threshold for a family of that size. Incomes were adjusted for inflation using the CPI-X1 (an alternative consumer price index based on a rental-equivalence approach to measuring housing costs).
May 1998CBO published Estimates of Federal Tax Liabilities for Individuals and Families by Income Category and Family Type for 1995 and 1999.16 The primary tables in that publication present distributional results that were based on unadjusted family income and adjusted gross income, although an appendix contains estimates with family income that was adjusted for the size of the family. CBO assumed that the burden of corporate income taxes falls on families and individuals in proportion to their real-ized income from capital.
October 2001CBO published Effective Federal Tax Rates, 1979–1997.17 That report introduced several changes to the agency’s methodology:
• Households, rather than families, were the primary unit of analysis.
• Household income was expanded to include in-kind benefits from government transfer programs such as the Food Stamp program and the Supplemental Nutrition Assistance Program, housing assistance programs, Medicare, Medicaid, and the Children’s Health Insurance Program (CHIP), as well as health insurance premiums paid by employers. (CBO used the so-called fungible value of Medicare, Medicaid, and CHIP as defined and estimated by the Census Bureau.)18
• Households were ranked by income that was adjusted for household size. That adjustment was made by
15. See www.cbo.gov/publication/20884.
16. See www.cbo.gov/publication/10811.
17. See www.cbo.gov/publication/42875.
18. For more details, see https://www.census.gov/cps/data/fungible.html.

41APPENDIX: CBO’S DISTRIBUTIONAL METHODOLOGY THE DISTRIBUTION OF HOUSEHOLD INCOME, 2014
dividing household income by the square root of household size.
• Both cash income and the payroll tax base included imputed pretax contributions made by families to 401(k)–type retirement funds.
• Dollar amounts were adjusted for inflation using the CPI-RS (the research series of the consumer price index for all urban consumers).
• SOI and CPS records were statistically matched; previous methods involved a series of adjustments to the CPS records to make income and tax totals consistent with the SOI data.
July 2012CBO published The Distribution of Household Income and Federal Taxes, 2008 and 2009.19 That report introduced several further changes to the agency’s methodology:
• CBO began allocating 75 percent of the corporate income tax to capital income and 25 percent to labor income.
• The measure of household income was expanded to include the full value of Medicare, Medicaid, and CHIP benefits, defined to equal the Census Bureau’s estimate of the average cost to the government for providing those benefits.
• CBO began adjusting for the effects of inflation using the personal consumption expenditures price index.
19. See www.cbo.gov/publication/43373.

Definitions
Household income, unless otherwise indicated, refers to income before accounting for the effects of means-tested transfers and federal taxes. Throughout this report, that income concept is called income before transfers and taxes. It consists of market income plus social insurance benefits.
Market income consists of labor income; business income; capital income (including capital gains); income received in retirement for past services; and other non-governmental sources of income.
Social insurance benefits consist of benefits from Social Security (Old Age, Survivors, and Disability Insurance); Medicare (measured as the cost to the government of providing those benefits); unemployment insurance; and workers’ compensation.
Income after transfers and taxes is income before taxes and transfers plus means-tested transfers minus federal taxes.
Means-tested transfers are cash payments and in-kind services provided through federal, state, and local gov-ernment assistance programs. Eligibility to receive such transfers is determined primarily on the basis of income, which must be below certain thresholds. The largest means-tested transfer programs consist of transfers provided through Medicaid and the Children’s Health Insurance Program (measured as the cost to the gov-ernment of providing those benefits); the Supplemental Nutrition Assistance Program (formerly known as the Food Stamp program); and Supplemental Security Income.
Federal taxes consist of individual income taxes, payroll taxes, corporate income taxes, and excise taxes. In this analysis, taxes for a given year are the amount a house-hold owes on the basis of income received that year, regardless of when the taxes are paid. Taxes from those four sources accounted for 94 percent of federal revenues in fiscal year 2014. Revenue sources not examined in this report include states’ deposits for unemployment insurance, estate and gift taxes, net income of the Federal Reserve remitted to the Treasury, customs duties, and miscellaneous fees and fines.
Average means-tested transfer rates are calculated as means-tested transfers divided by income before transfers and taxes.
Average federal tax rates are calculated as federal taxes divided by income before transfers and taxes.
Income groups are created by ranking households by their size-adjusted income before taxes and transfers. A household consists of people sharing a housing unit, regardless of their relationships. The income quintiles (fifths) contain approximately the same number of people but a slightly different number of households. Similarly, each percentile (hundredth) contains approx-imately the same number of people but a different number of households (see figure below). If a household has negative income (that is, if its business or investment losses are larger than its other income), it is excluded from the lowest income group but included in totals.
Percentiles
Lowest Second Middle Fourth HighestQuintiles
Middle Three Quintiles
0 to 20th 21st to 40th 41st to 60th 61st to 80th 81st to
90th
91st to
95th
96th to 99th
Top 1 Perce
ntPercentiles and Quintiles of the Income Distribution
Tables
1. Major Provisions of the Affordable Care Act That Affected Means-Tested Transfers and Federal Taxes in 2014, by Income Group 9
A-1. Households With Different Unadjusted Income but Similar Adjusted Income 39
Figures
S-1. Average Income, Means-Tested Transfers, and Federal Taxes per Household, by Income Group, 2014 2
S-2. Cumulative Growth in Average Income, by Income Group, 1979 to 2014 41. Average Income Before Means-Tested Transfers and Federal Taxes, by
Income Group, 2014 62. Average Net Effects of Major Means-Tested Transfer and Federal Tax
Provisions of the Affordable Care Act in 2014, by Income Group 113. Average Means-Tested Transfer Rates, by Income Group, 2014 124. Average Means-Tested Transfer Rates, for Selected Income Groups and
by Transfer Source, 2014 135. Average Federal Tax Rates, by Income Group, 2014 146. Shares of Means-Tested Transfers and Federal Taxes, by Income Group, 2014 157. Average Federal Tax Rates, by Income Group and Tax Source, 2014 168. Average Income After Transfers and Taxes, by Income Group, 2014 189. Shares of Income Before and After Transfers and Taxes, by Income Group, 2014 19
10. Cumulative Growth in Average Income Before Transfers and Taxes, by Income Group, 1979 to 2014 21
11. Average Means-Tested Transfer Rates, for Selected Income Groups, 1979 to 2014 2212. Means-Tested Transfer Rates, by Source, Among Households in the
Lowest Income Quintile, 1979 to 2014 2313. Average Federal Tax Rates, by Income Group, 1979 to 2014 2714. Average Federal Tax Rates, by Source, 1979 to 2014 2815. Cumulative Growth in Average Income After Transfers and Taxes, by
Income Group, 1979 to 2014 3016. Gini Coefficients, 1979 to 2014 32
List of Tables and Figures

About This Document
This Congressional Budget Office report was prepared at the request of the Ranking Member of the Senate Finance Committee. In keeping with CBO’s mandate to provide objective, impartial analysis, the report makes no recommendations.
Kevin Perese of CBO’s Tax Analysis Division wrote the report and Bilal Habib produced the estimates for means-tested transfers, with guidance from Edward Harris and John McClelland. Nadwa Mossaad and Marvin Ward Jr. (both formerly of CBO) contributed to the development of those new means-tested transfer estimates. Jessica Banthin, Katherine Fritzsche, Janet Holtzblatt, Peter Huether, Alexandra Minicozzi, and Robert Stewart provided helpful comments.
Jeffrey Kling, John Skeen, and Robert Sunshine reviewed the report, and Loretta Lettner edited it. Casey Labrack prepared the report for publication, and he and Kevin Perese developed interactive graphics that accompany it on CBO’s website. An electronic version of the report, supplemental data, and the interactive graphics are available at www.cbo.gov/publication/53597.
Keith Hall Director March 2018