Embed Size (px)
Citation preview

The Direct Support Workforce: A crisis or serious systems flaw? 5.25.18 Sponsored by Nisonger Institute, Columbus OH

CONTEXT IS EVERYTHING
Person. Family. Community. State. Region. Province. Country.

LTSS in a single word - UNCERTAINTY
• Healthcare reform • HCBS Settings Rule • DOJ litigation and settlement
agreements • Managed care • Budget implications of growth in
demand and shrinking wage earners
• Individualized supports

Advocacy and increased expectations

ID/DD expenditures over time, 1977–2015
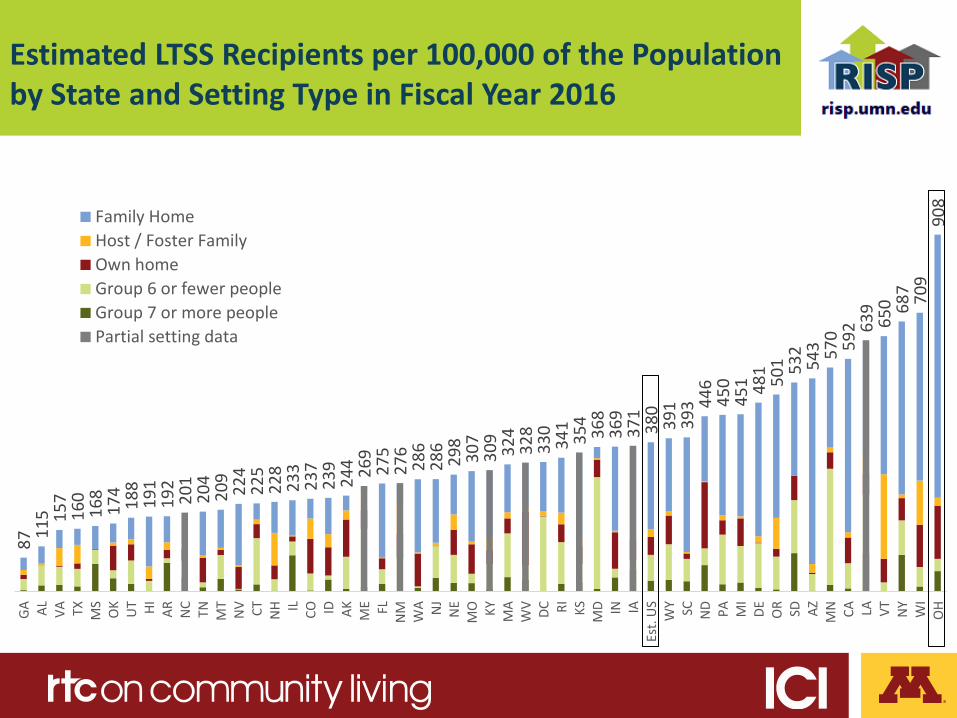
Estimated LTSS Recipients per 100,000 of the Population by State and Setting Type in Fiscal Year 2016
87 11
5 157
160
168
174
188
191
192
201
204
209
224
225
228
233
237
239
244 26
9 27
5 27
6 28
6 28
6 29
8 30
7 30
9 32
4 32
8 33
0 34
1 35
4 36
8 36
9 37
1 38
0 39
1 39
3 446
450
451 48
1 501 53
2 54
3 570 59
2 639
650 68
7 709
908
GA AL VA TX MS
OK UT HI AR NC TN MT
NV CT NH IL CO ID AK ME FL N
M WA NJ
NE
MO KY MA
WV DC RI KS MD IN IA
Est.
US
WY SC ND PA MI
DE OR SD AZ MN CA LA VT NY
WI
OH
Family HomeHost / Foster FamilyOwn homeGroup 6 or fewer peopleGroup 7 or more peoplePartial setting data

Per person Medicaid expenditures by age and setting in the U.S. and Ohio
For US, 51 (50 states and the District of Columbia) reported data, RISP FY 2016
$13
,831
$37
,360
$17
,404
$11
7,71
4
$26
,486
$72
,224
$52
,918
$14
2,49
9
$15
,861
$54
,451
$19
,184
$11
7,63
0
$24
,237
$66
,137
$45
,690
$11
8,25
5
Waiver (Family Home) Waiver (Non-Family) Waiver (all) ICF/IID
US: 21 years or younger US: 22 years or older
OH: 21 years or younger OH: 22 years or older
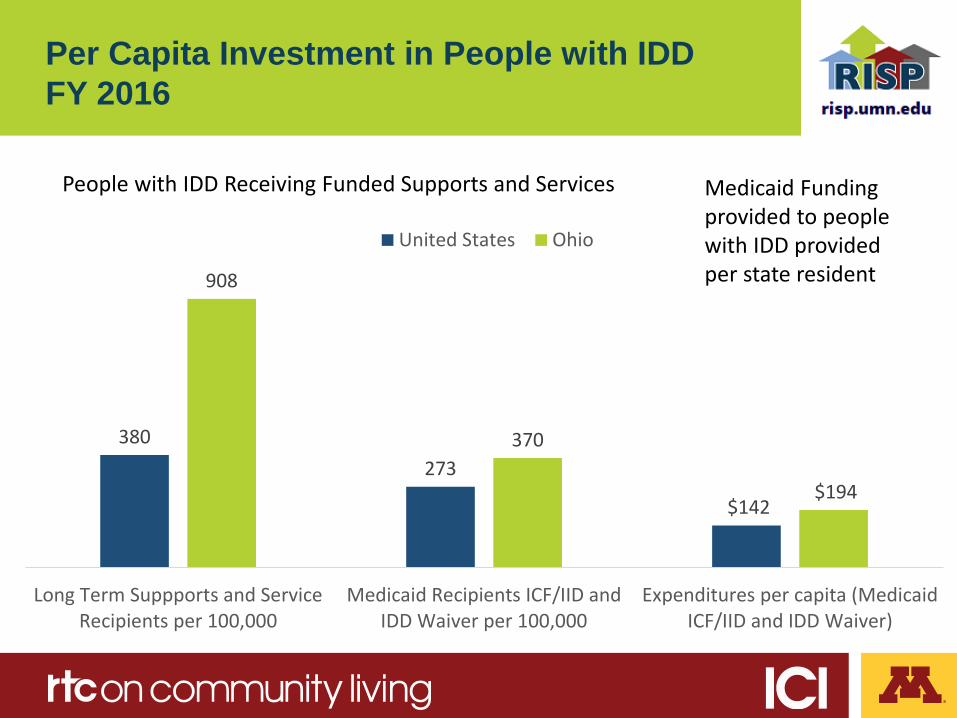
Per Capita Investment in People with IDD FY 2016
People with IDD Receiving Funded Supports and Services Medicaid Funding provided to people with IDD provided per state resident
380 273
$142
908
370
$194
Long Term Suppports and ServiceRecipients per 100,000
Medicaid Recipients ICF/IID andIDD Waiver per 100,000
Expenditures per capita (MedicaidICF/IID and IDD Waiver)
United States Ohio

2,593 5,624 11,736 26,735
35,245 36,817 3,505
6,816 -
-
30,526 31,467
1996 2000 2005 2010 2015 2016
Ohio
Waiver Recipients People Waiting
291,255 291,255
443,606 592,070
774,964 807,462
87,187 71,922
73,828
115,059
199,641 193,828
1996 2000 2005 2010 2015 2016
United States
Waiver Recipients People Waiting
People With IDD Waiting for Services…
% is the amount of growth needed to serve those waiting. From 2010 on, people waiting may include people waiting for residential services in addition to the Medicaid Waiver. In 2015-16 people waiting were those waiting in the family home for Waiver Services.
25%
17%
19%
26%
135% 121% no
data
85% 87% 24%
30% no
data
OUTCOMES Quality of services and support that promote community living

NQF FRAMEWORK FOR HOME & COMMUNITY BASED SERVICES
OUTCOME MEASUREMENT
11 Domains 2-7 Subdomains
Choice and Control Human and Legal
Rights
Community Inclusion
Holistic Health and Functioning
Workforce
Caregiver Support Person-Centered Service Planning and Coordination
Service Delivery & Effectiveness
Equity
System Performance & Accountability
Consumer Leadership in
System Development
National Quality Forum (NQF) framework

NQF HCBS Domains and Subdomains
Human and Legal Rights • Freedom from abuse and neglect • Informed decision-making • Optimizing preservation of legal & human rights • Privacy • Supporting exercise of human & legal rights
Person-Centered Planning & Coordination • Assessment • Coordination • Person-centered planning
Service Delivery and Effectiveness • Delivery • Person's identified goals realized • Person's needs met
System Performance & Accountability • Data management and use • Evidence-based practice • Financing and service delivery structures
Workforce • Adequately compensated with benefits • Culturally competent • Demonstrated competencies when appropriate • Person-centered
approach to services • Safety of and respect for the worker • Workforce engagement and
participation • Sufficient workforce numbers dispersion and availability

EMPLOYMENT Competitive. Sheltered. Day.
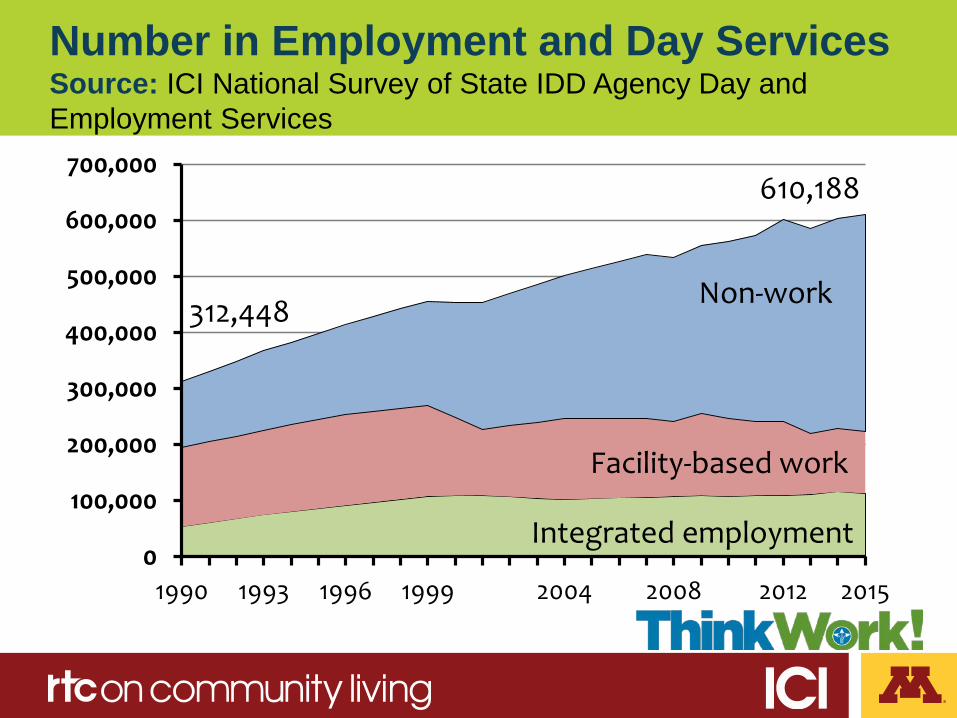
Number in Employment and Day Services Source: ICI National Survey of State IDD Agency Day and Employment Services
0
100,000
200,000
300,000
400,000
500,000
600,000
700,000
1990 1993 1996 1999 2004 2008 2012 2015
Non-work
Facility-based work
Integrated employment
610,188
312,448

State Employment Snapshot: New York How many individuals participate in integrated employment services provided by the state intellectual and developmental disability agency?
2016 United States Ohio
Total in day and employment services 638,568 35,948
Total in integrated employment services 120,244 8,909
% in Integrated Employment 19% 25%
From: https://www.statedata.info/statepages/Ohio

HOME Type of setting. Choice. With whom a person lives.

Children and adults in large state IDD facilities of 16 or more people 1950-2016
Source: RISP - Larson et al, 2018
0
20,000
40,000
60,000
80,000
100,000
120,000
140,000
160,000
180,000
200,000
1950 1955 1960 1965 1970 1975 1980 1985 1990 1995 2000 2005 2010 2015
Children (0-21 yrs) Adults (22+ Years)

Where did people with IDD live in 2016? (setting type) 7,374,402 (est.) people in the U.S. have IDD (2% of the population) 1,488,732 are on State IDD agency caseloads (20% of the estimated people with IDD) 1,228,700 receive services from State IDD agencies (17% of the estimated people with IDD)
RISP FY2016
63%
12%
25%
76%
15% 9%
Family, Host Family /Foster Care
Own Home / Spouse Group Setting
United States Ohio

% people who live outside their family homes with 3 or fewer people and 6 or fewer people with IDD FY 2016
35 35
71 73 72
62
42
88
57
76
97
73 71
81
90
67
90
84
93
99
82
72
85
90
76
83 88
76 77
95 94
78
96
83 78
85
100
92
100
86 90 88
95
88
95 90
96 98 98 95
98 100
7
16 17
26 26
33 34 35 38 39
42 42 46 47 48 48 49 50
54 55 56 56 57 59 59 59 60 61 62 63 65 67 68 69 69 69 69 71 74 75 75 75 77 78
83 84 86 87 87 89 93
95
ILM
SM
T SC NJ
NY AR MI
*IA FL OR
*LA
*NC
MA CT SD RI VA DE HI
Est.
US
OK
*WY
NV IN *KS
*TX
ND AL
*MN
*CA
OH AZ MO
*ID UT
DC GA*N
M*W
V PA NE
*WI
TN ME
WA AK *CO
MD
*KY
NH VT
6 or fewer people 1 to 3 people 90%
* Imputed values for 1-3 and 4-6 proportions based on national estimates.

Source: NCI, 2016
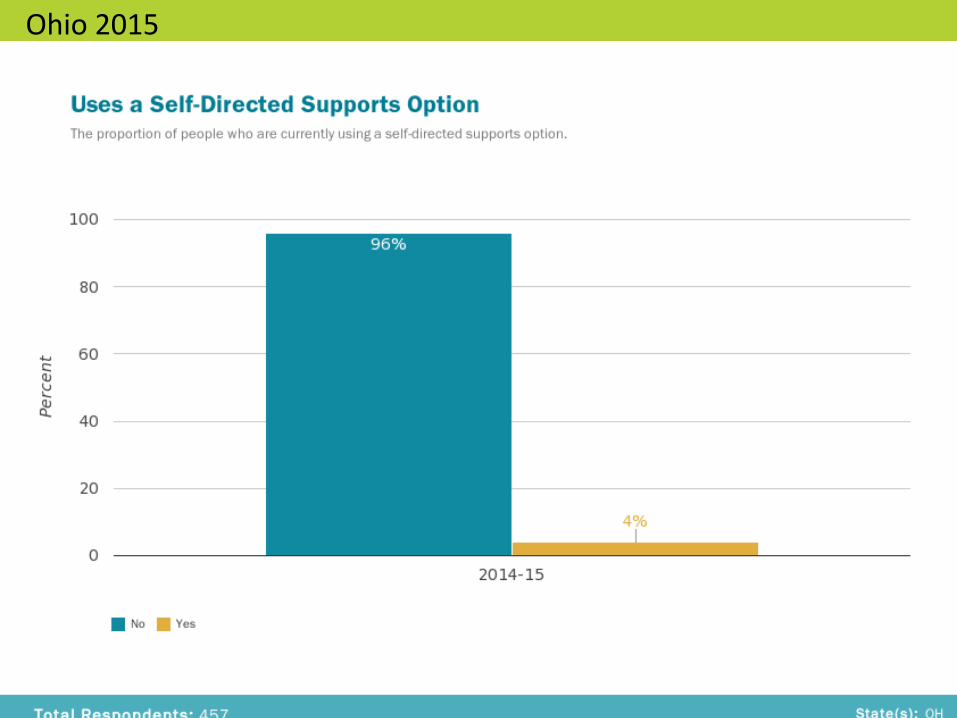
Ohio 2015

Source: NCI, 2016
Ohio 2015

Source: NCI, 2016
Ohio 2015

RELATIONSHIPS AND SELF-DETERMINATION
Friends. Family. Love. Fun. Things.
Ohio 2015

Source: NCI, 2016 Source: NCI, 2016
Ohio 2015

Source: NCI, 2016
Ohio 2015

DSP Workforce. Workforce Key to Quality

DSP recruitment and retention: A self-advocate perspective
• We want staff who show up on time and help us get the stuff done we need to get done
• We want people who are paid enough to stay so they like what they are doing
• We want people who respect us and are respected for what they do and the pay they earn
Cliff Poetz, Advocacy Leader Source: IMPACT 2008

Who are we talking about?
• Direct Support Professionals – Personal Care Attendant – direct care worker – direct support staff – community living specialist – job coach – employment specialist – ETC…..
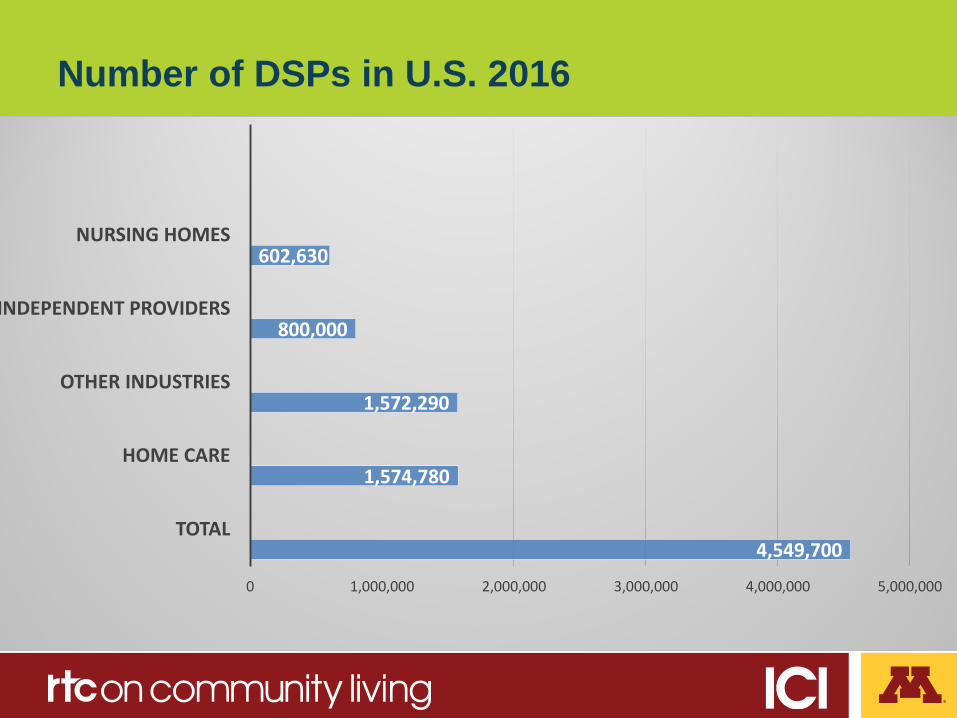
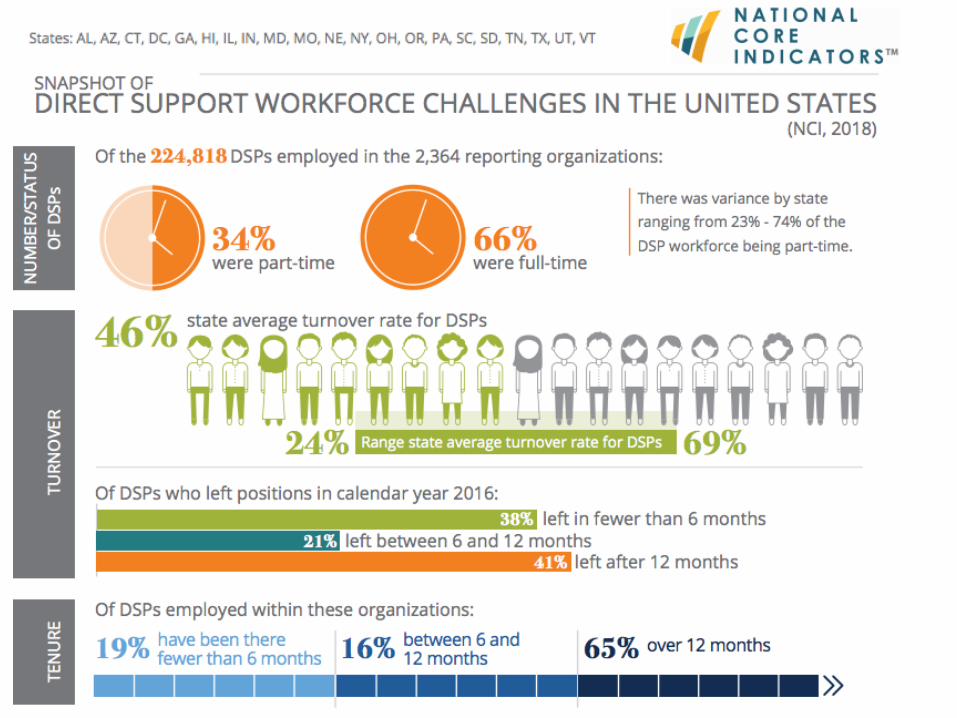
Number of DSPs in U.S. 2016
4,549,700
1,574,780
1,572,290
800,000
602,630
0 1,000,000 2,000,000 3,000,000 4,000,000 5,000,000
TOTAL
HOME CARE
OTHER INDUSTRIES
INDEPENDENT PROVIDERS
NURSING HOMES

LTSS and U.S. economy 2007-2017
• 1 million+ direct care jobs (54% growth)
• 1 in 6 new jobs in U.S. was in LTSS
• 4/5 new jobs were in home care
All LTSS

Projected growth of workforce 2016-2026 (BLS)
4,437,900
1,970,900
603,700
1,863,300
5,781,500
3,003,900
607,900
2,169,700
0 1,000,000 2,000,000 3,000,000 4,000,000 5,000,000 6,000,000 7,000,000
TOTAL
HOME CARE
NURSING HOME
OTHER INDUSTRIES
2026 21016PHI. “Workforce Data Center.” Last modified November 10, 2017. https://phinational.org/policy-research/workforce-data-center/.

U.S.

Age of DSPs in U.S. (2015 ACS)
16%
21%
18%
21%
17%
7%
percent by age
16-2425-3435-4445-5455-6465+
PHI. “Workforce Data Center.” Last modified November 10, 2017. https://phinational.org/policy-research/workforce-data-center/.

DSP citizenship status in U.S. (2015 ACS)
10%
77%
13% Not is citizen
U.S. citizen
U.S. citizen bynaturalization
PHI. “Workforce Data Center.” Last modified November 10, 2017. https://phinational.org/policy-research/workforce-data-center/.

DSP educational attainment in U.S. (2015 ACS)
19%
34% 14%
33% AS or higherhigh schoolless than high schoolsome college, no degree
PHI. “Workforce Data Center.” Last modified November 10, 2017. https://phinational.org/policy-research/workforce-data-center/.

Demographics of DSPs in Ohio (2015 ACS)?
• 90% women • Race, ethnicity, linguistic diversity
– 65% white – 30% black or African American – 3% Hispanic or Latino – 3% other
• 40% rely on public assistance – 29% food and nutrition – 23% Medicaid
• Poverty – 85% live <400% federal poverty level – 72% live <300% – 51% live <200% – 21% live <100%
PHI. “Workforce Data Center.” Last modified November 10, 2017. https://phinational.org/policy-research/workforce-data-center/.
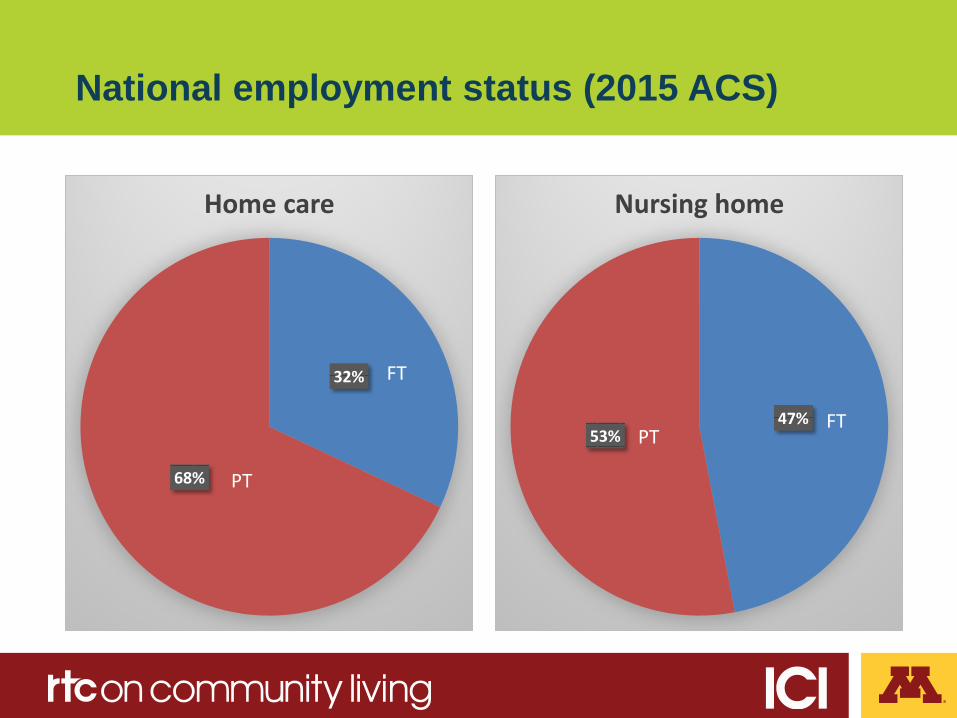
National employment status (2015 ACS)
47% 53%
Nursing home
PT FT
32%
68%
Home care
PT
FT
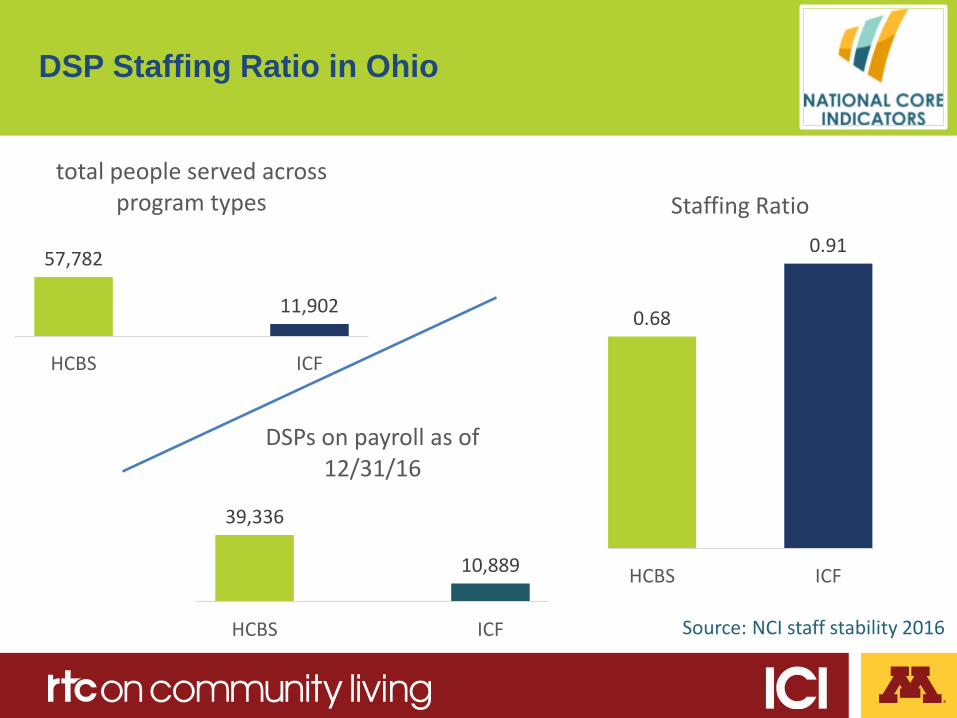
DSP Staffing Ratio in Ohio
0.68
0.91
HCBS ICF
Staffing Ratio
57,782
11,902
HCBS ICF
total people served across program types
39,336
10,889
HCBS ICF
DSPs on payroll as of 12/31/16
Source: NCI staff stability 2016
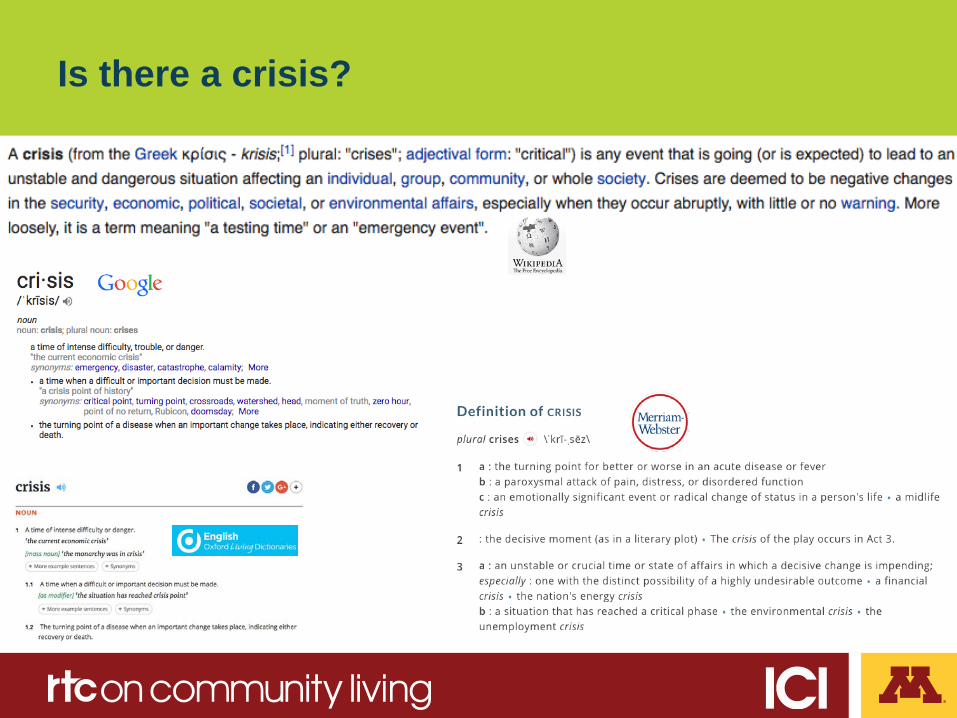
Is there a crisis?
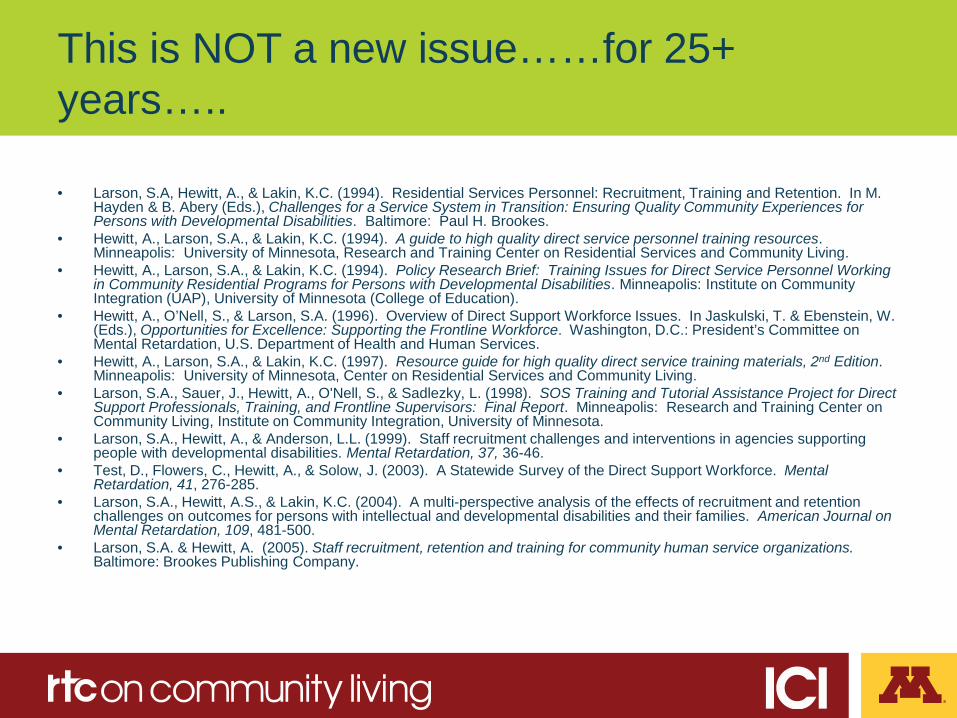
This is NOT a new issue……for 25+ years…..
• Larson, S.A, Hewitt, A., & Lakin, K.C. (1994). Residential Services Personnel: Recruitment, Training and Retention. In M. Hayden & B. Abery (Eds.), Challenges for a Service System in Transition: Ensuring Quality Community Experiences for Persons with Developmental Disabilities. Baltimore: Paul H. Brookes.
• Hewitt, A., Larson, S.A., & Lakin, K.C. (1994). A guide to high quality direct service personnel training resources. Minneapolis: University of Minnesota, Research and Training Center on Residential Services and Community Living.
• Hewitt, A., Larson, S.A., & Lakin, K.C. (1994). Policy Research Brief: Training Issues for Direct Service Personnel Working in Community Residential Programs for Persons with Developmental Disabilities. Minneapolis: Institute on Community Integration (UAP), University of Minnesota (College of Education).
• Hewitt, A., O’Nell, S., & Larson, S.A. (1996). Overview of Direct Support Workforce Issues. In Jaskulski, T. & Ebenstein, W. (Eds.), Opportunities for Excellence: Supporting the Frontline Workforce. Washington, D.C.: President’s Committee on Mental Retardation, U.S. Department of Health and Human Services.
• Hewitt, A., Larson, S.A., & Lakin, K.C. (1997). Resource guide for high quality direct service training materials, 2nd Edition. Minneapolis: University of Minnesota, Center on Residential Services and Community Living.
• Larson, S.A., Sauer, J., Hewitt, A., O'Nell, S., & Sadlezky, L. (1998). SOS Training and Tutorial Assistance Project for Direct Support Professionals, Training, and Frontline Supervisors: Final Report. Minneapolis: Research and Training Center on Community Living, Institute on Community Integration, University of Minnesota.
• Larson, S.A., Hewitt, A., & Anderson, L.L. (1999). Staff recruitment challenges and interventions in agencies supporting people with developmental disabilities. Mental Retardation, 37, 36-46.
• Test, D., Flowers, C., Hewitt, A., & Solow, J. (2003). A Statewide Survey of the Direct Support Workforce. Mental Retardation, 41, 276-285.
• Larson, S.A., Hewitt, A.S., & Lakin, K.C. (2004). A multi-perspective analysis of the effects of recruitment and retention challenges on outcomes for persons with intellectual and developmental disabilities and their families. American Journal on Mental Retardation, 109, 481-500.
• Larson, S.A. & Hewitt, A. (2005). Staff recruitment, retention and training for community human service organizations. Baltimore: Brookes Publishing Company.

Root of DSP workforce challenges
• No good planning • Departments of Labor allowed “off the hook” • Changing demographics
– Aging of Americans – Fewer younger Americans
• Shifts in laws and expectations
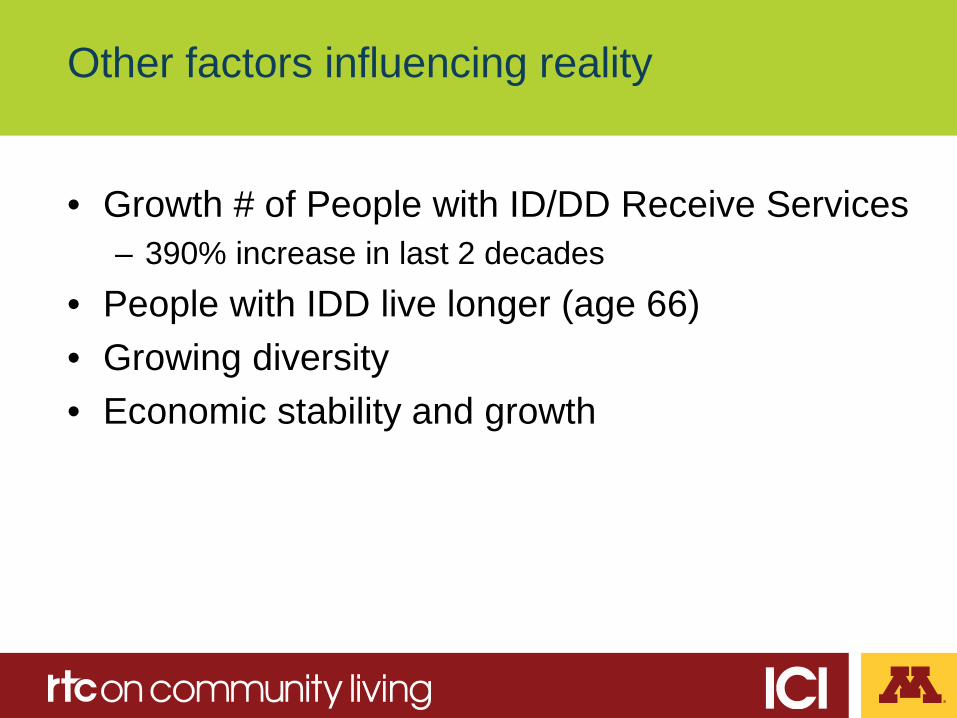
Other factors influencing reality
• Growth # of People with ID/DD Receive Services – 390% increase in last 2 decades
• People with IDD live longer (age 66) • Growing diversity • Economic stability and growth

DSP workforce reality is a public health crisis
• Primary public health concern due to: – size of the workforce and increases in demand to
support need – support provided is essential to the health, safety
and overall well-being of seniors, people with disabilities
– substandard work conditions undermine the ability to recruit and retain DSWs threatening the future supply
(Hewitt, A., Larson, S., Edelstein, S., Seavey, D., Hoge, M. A., & Morris, J., 2008).

Workforce conditions that deter entry into the profession

DSP Separation and Turnover in Ohio
19,977
7,521
HCBS ICF/IID
DSPs separated in last 12 months
51%
69%
HCBS ICF/IID
DSP turnover
Source: NCI staff stability 2016

Timing of DSP Separation in Ohio
48%
21%
31%
15% 17%
33%
separated DSPs leaving in <6mo separated DSPs leaving in 6-12 mos separated DSPs leaving in 12+
Timing of DSP Separation
HCBS ICF/IID
Source: NCI staff stability 2016

DSP Vacancy Rates in Ohio
9%
13% 12%
21%
full time vacacny rates part time vacancy rates
DSP Vacancy Rates HCBS ICF/IID
Source: NCI staff stability 2016
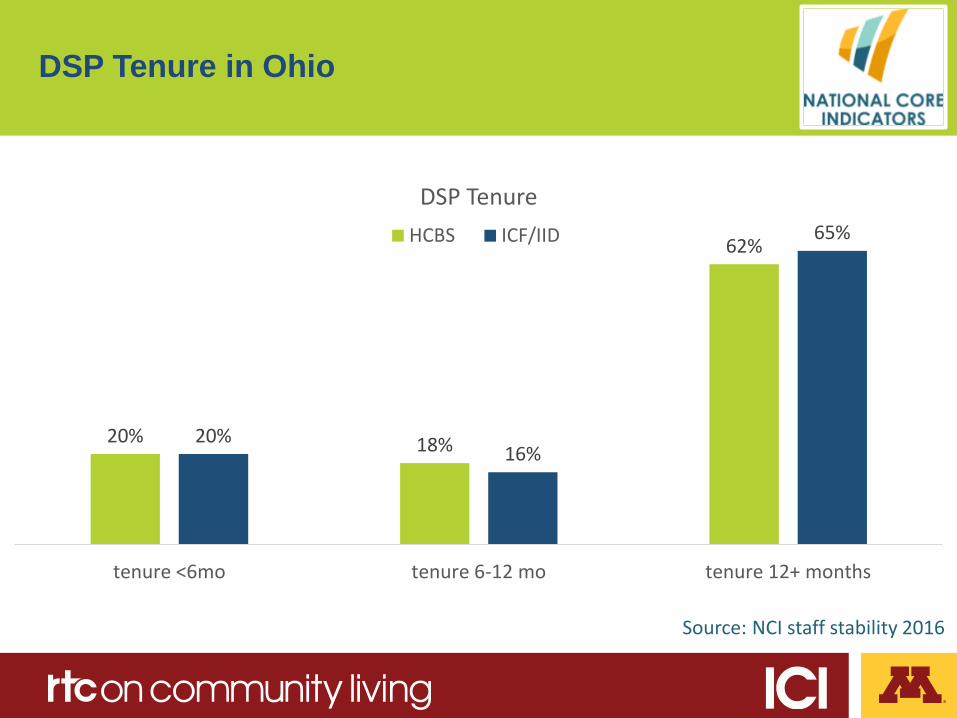
DSP Tenure in Ohio
20% 18%
62%
20% 16%
65%
tenure <6mo tenure 6-12 mo tenure 12+ months
DSP Tenure HCBS ICF/IID
Source: NCI staff stability 2016

DSP Wages in Ohio
Source: NCI staff stability 2016
$11.16
$28.80
$10.00
$22.00
$9.71 $9.84 $10.62 $11.18
$19.00
$9.75
$15.08
$9.88 $9.76 $10.04
$8.10 $7.25 $8.77 $8.15
wages all DSPsaverage
wages all DSPsrange
starting wageaverage
starting wagerange
residentialaverage
in homeaverage
non residential
DSP wages HCBS ICF

*
DSP = HHA + PCA + CAN + a whole lot more!!

Ohio DSP wages over time (2016 BLS)
10.36
10.68
9.72 9.82
10.27
11.09
10.55
9.84 9.94 10.09
12.8 12.65
11.71 11.74 11.96 11.99
11.61
10.66 10.71 10.91
9
9.5
10
10.5
11
11.5
12
12.5
13
2006 2009 2012 2015 2016
PCA HHA NA Total
Wage growth PCA -$0.09 HHA -$1.00 NA -$0.84 Total -$1.08
PHI. “Workforce Data Center.” Last modified November 10, 2017. https://phinational.org/policy-research/workforce-data-center/.
U.S.

Low wages: Correlation of entry wage to turnover
Source: 2009 DSP Wage Study, ANCOR

Wages matter… WY 2002 DSP wage pass-through
Source: Wyoming Department of Health, Developmental Disabilities Division (April 2005) “Direct Service Professionals Wages and Retention.”

WAGES ARE IMPORTANT BUT…… They aren’t the only thing
• Of all staff who leave – 45% leave in first 6
months – 23% leave between 6-
12 months
• 15% of new hires fired in the first year
• Reasons for leaving – Co-workers – Pay or benefits – Supervisors
Larson, Lakin, Bruininks, 1998

Ohio DSP health insurance (2015 ACS)
Health insurance status Home care Nursing home
total
Any health insurance coverage 72% 81% 79%
Employer/union 35% 54% 50%
Medicaid, Medicare, other pubic 36% 28% 29%
Purchased directly 9% 5% 7%
https://phinational.org/policy-research/workforce-data-center/.

DSP Health Insurance Benefits in Ohio
8.5%
43.0%
0%
45.9%
24.5%
71.4%
0% 3.1%
1 2 3 4
Health Insurance Benefits HCBS ICF
Source: NCI staff stability 2016

DSP benefits in New York
• 91.8% offer paid sick leave for FT DSPs • 83% offer paid vacation for FT DSPs • 94.6% offer health insurance to FT DSPs
• Only 41.9% of DSPs enrolled in health plans • Average $96.94 for monthly premium payments for
individual coverage (range $0.00 to $562.00). • 2-person average monthly payment was $241.26
(range from $0.00 to $1,060.23). • family average payment was $385.24 (range from
$0.00 to $1,568.00).
(Hewitt et al., 2015)

DSP Pooled Time Off in Ohio
5.40% 9.70% 0
77%
23% 23%
0
54%
1 2 3 4
Pooled Time Off HCBS ICF
Source: NCI staff stability 2016

DSP Paid Time Off in Ohio
6.40%
20.90%
0
63.60%
9.10%
45.50%
0
45.50%
1 2 3 4
Paid Time Off HCBS ICF
Source: NCI staff stability 2016

DSP Health Insurance Benefits in Ohio
8.5%
43.0%
0%
45.9%
24.5%
71.4%
0% 3.1%
1 2 3 4
Health Insurance Benefits HCBS ICF
Source: NCI staff stability 2016

NY FLS salary
• Average starting salary $33,598 • Average salary $38,690 • Average highest salary $50,156
**These data do not include two 2% wage increases that occurred on January 1, 2015 and April 1, 2015.
(Hewitt et al., 2015)

U.S. unemployment rate over time, 2007–2017

Three primary advocacy messages past 30 years….
1. DSPs deserve increase wages because they do critical and important work for vulnerable citizens
2. Private sector DSPs deserve increased wages because it is unfair that they make on average $2-3/hr less than DSPs who work in public run facilities
3. Increase provider rates so they can increase wages

Consequences of Crisis
Families
• Worried about access and quality • Unable to keep jobs or accept promotions • Family member at home longer • Stress and related health issues

Direct Support Professionals
• High stress/burnout • Working 2- 3 jobs • Injury • Poverty • Poor health outcomes

Isolated and alone

Teach
High expectation discrepancy

Organizations
• Focus on getting people in – Lowering expectations of qualifications
• Supervisors in crisis management vs mentoring and supervision
• Risks and high costs of injury – Employees – People supported

NY DSP shortage effect
• Delay, deny or limit services to prospective new individuals – 33% yes
(Hewitt et al, 2015)
Impact of staff turnover on UMN intervention implementation studies
• Active Support (Larson, Ticha & Qian, 2014)
• Self-Determination (Abery & Ticha, 2014)
• Comprehensive Training (Hewitt, Nord & Bogenshutz, 2014)
• Participatory Planning and Decision Making Group (PPDM) (Abery, Ticha & Qian, 2015)

Wasted Resources

NY overtime (past 30 days)
* Note – average DSP wage 12.74 + OT 6.37 = $19.11 average OT hourly rate $48,559 month in OT expenditures = $582,702 annually per org; across 354 orgs = $206,276,508. Just the half-time extra per hour is $194,234 annually per org; across 354 orgs = $68,758,836. ($1,240 per DSP)
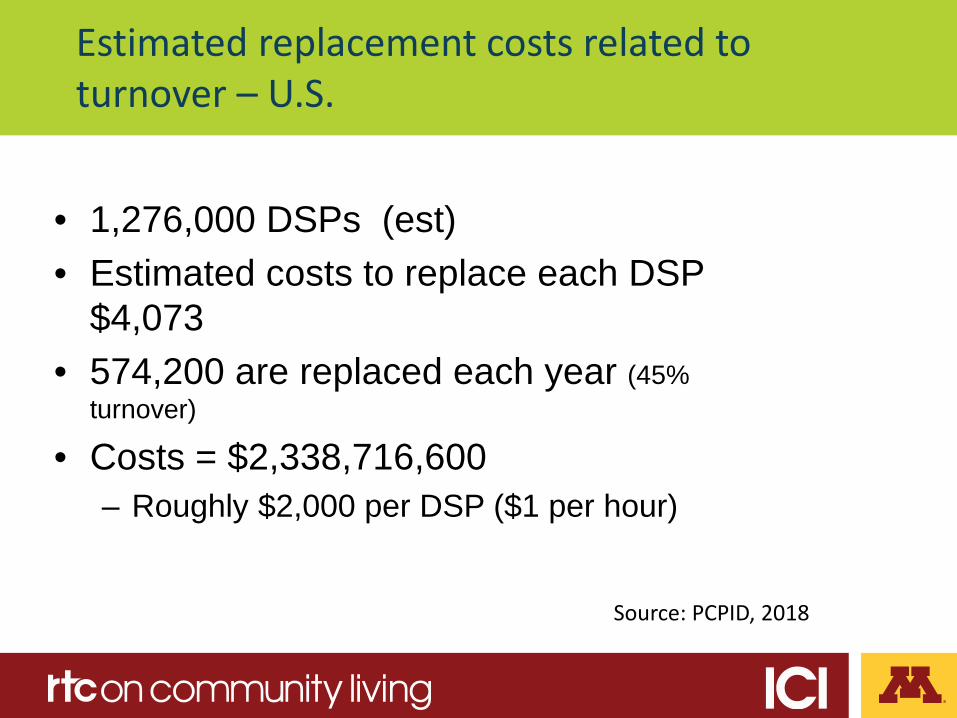
Estimated replacement costs related to turnover – U.S.
• 1,276,000 DSPs (est) • Estimated costs to replace each DSP
$4,073 • 574,200 are replaced each year (45%
turnover)
• Costs = $2,338,716,600 – Roughly $2,000 per DSP ($1 per hour)
Source: PCPID, 2018

Many solutions to consider
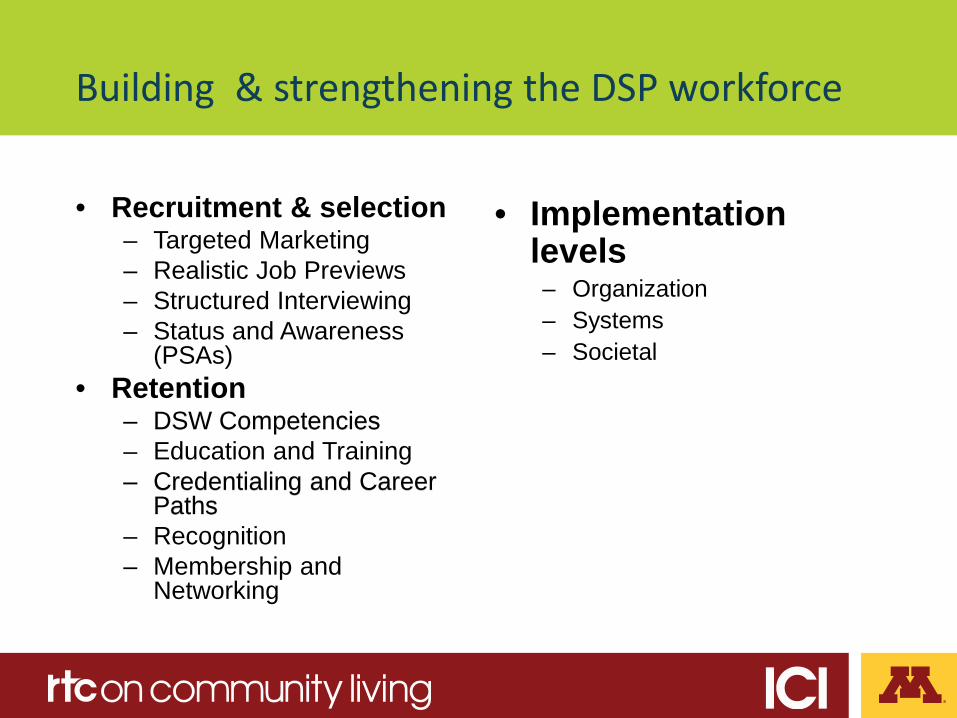
Building & strengthening the DSP workforce
• Recruitment & selection – Targeted Marketing – Realistic Job Previews – Structured Interviewing – Status and Awareness
(PSAs) • Retention
– DSW Competencies – Education and Training – Credentialing and Career
Paths – Recognition – Membership and
Networking
• Implementation levels – Organization – Systems – Societal

Emerging evidence based of interventions that help!
• Kansans Mobilizing for Change (Larson & Hewitt, 2004) – 12 organizations – Training on toolkit with RJP, marketing materials, on-line training, org assessment – 15% reduction in DSP turnover – 29% reduction in FLS turnover – Vacancy went from 3.1% in 200 to 2.4% in 2004
• Removing the Revolving Door (Hewitt, Keiling & Sauer, 2008) – 14 organizations 2004-2008 – 13 of 15 organizations I year of reduced turnover; 5 had 2 yrs; 4 had 3 years and 2 across all 4 years – All experience FLS turnover reduction
• National Technical Assistance and Training Initiative for FLSs (Taylor, Larson, Hewitt, McCulloh, & Sauer, 2007)
– 8 providers across 5 states – Train the trainer on assessment and mapping to intervention – Reduction in DSP turnover of 40% across orgs and FLS in 4/6
• Randomized controlled comprehensive training study (Hewitt, Nord & Bogenshutz, 2015)
– 11 organizations – Comprehensive hybrid training model linked to desired outcomes – DSP turnover reduced by 16.4% over 12 month period
Biggest challenge = sustaining and scaling up


DSP Recruitment and Retention Strategies in Ohio
31%
80%
44% 49% 51%
79%
39% 39%
1 2 3 4
Recruitment and retention strategies HCBS ICF
RJP: Realistic Job Preview Source: NCI staff stability 2016
Systems Level Solutions to Consider

DSP scope of practice - multidisciplinary

Changing our messages
• Why DSPs matter – Chumie Twerski • The ultimate goal of direct support – John
Raffaele

Consistent workforce data
• Number of DSPs – PT/FT/relief or temporary
• Demographics – Basics – Retirement age
• Wages • Benefits
– Taken up • Crude Separation
– Before 6 months • Average tenure • Vacancies • Overtime paid in last 30 days • Waiting lists, denials and authorized
vs delivered services • Frontline supervisor
– Number – Demographics – Wages – Crude separation – Vacancies
• Differences by – FT/PT and temp status – Setting type
• Individual characteristics – Service type – Provider – Zip Code
• Costs of recruitment, selection and on boarding
– Marketing – Advertising – Interviewing – Selection process – Background checks – Replacement DSP costs – Training delivery and time – Admin
• Ratio # people served to people served
• Qualitative stories where a DSP changed a life and saved money

Importance of DATA
• Legislative advocacy • Accuracy in separating information DSP who with
certain populations or types of services • Make informed policy and practice decisions • Create wage scales within organizations • Other reasons?.......

Can you answer these key questions (for your site, org or state)?
• What is your DSP turnover rate (crude separation)? • What is your vacancy rate for DSPs? # of vacancies? • What 3 issues most influence your retention rates? • What specific recruitment and selection interventions do you use and what
changes have they made in your data? • What percentage of you DSP are fired and why? • What are reasons DSPs leave? • What are the FLS turnover rates (crude separation)? What is your vacancy rate for
DSPs? # of vacancies? • How much are you spending each month in overtime expenses (extra 50% only)? • What is the average number of hours of training your DSPs receive during
orientation? Annually thereafter? • What are three characteristics of your most successful DSPs? • What are your best and worst performing sites related to DSP turnover and
vacancy rates? • What are the best things about your organizational culture and the most toxic?
Calculating crude separation, tenure and other….
Web link to data brief with instructions https://ici.umn.edu/products/docs/TurnoverCalculator.pdf

Service model redesign
• Shared living • Independent contractors • DSP worker cooperatives • Self-directed service expansion
– Direct Support Workforce Registries and Matching Services
Community and family as focus of interventions and services
• Putting faith to work • Social inclusion: A community intervention • Retirement • Targeted focused work with diverse communities
– Community liaisons • Direct support professionals providing direct intervention
and support with communities – Businesses – faith communities – recreational programs – adult education)
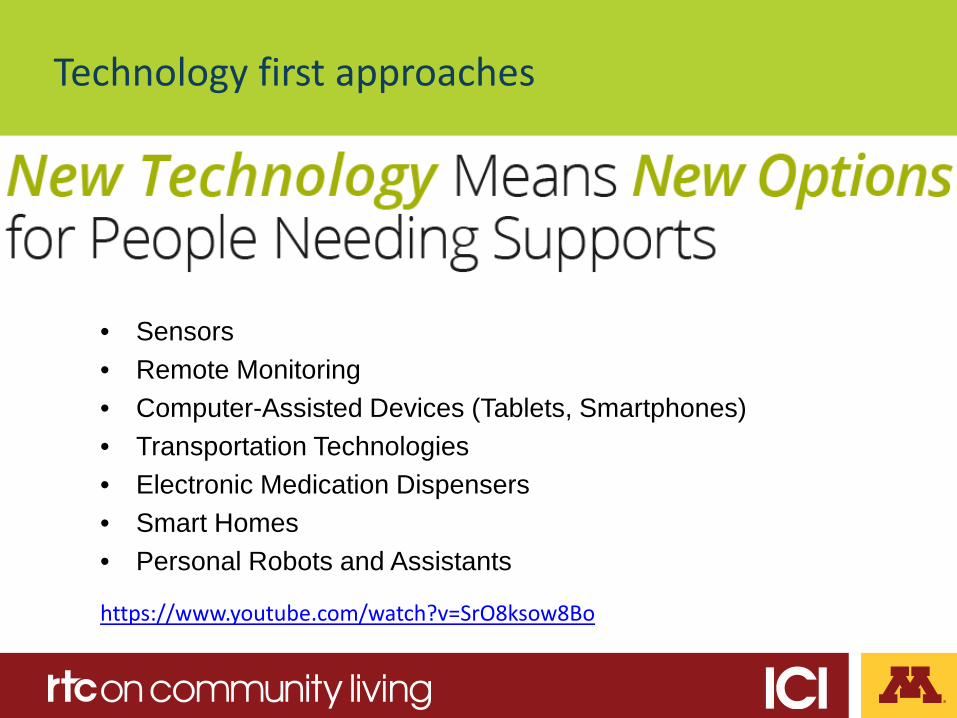
Technology first approaches
• Sensors • Remote Monitoring • Computer-Assisted Devices (Tablets, Smartphones) • Transportation Technologies • Electronic Medication Dispensers • Smart Homes • Personal Robots and Assistants
https://www.youtube.com/watch?v=SrO8ksow8Bo
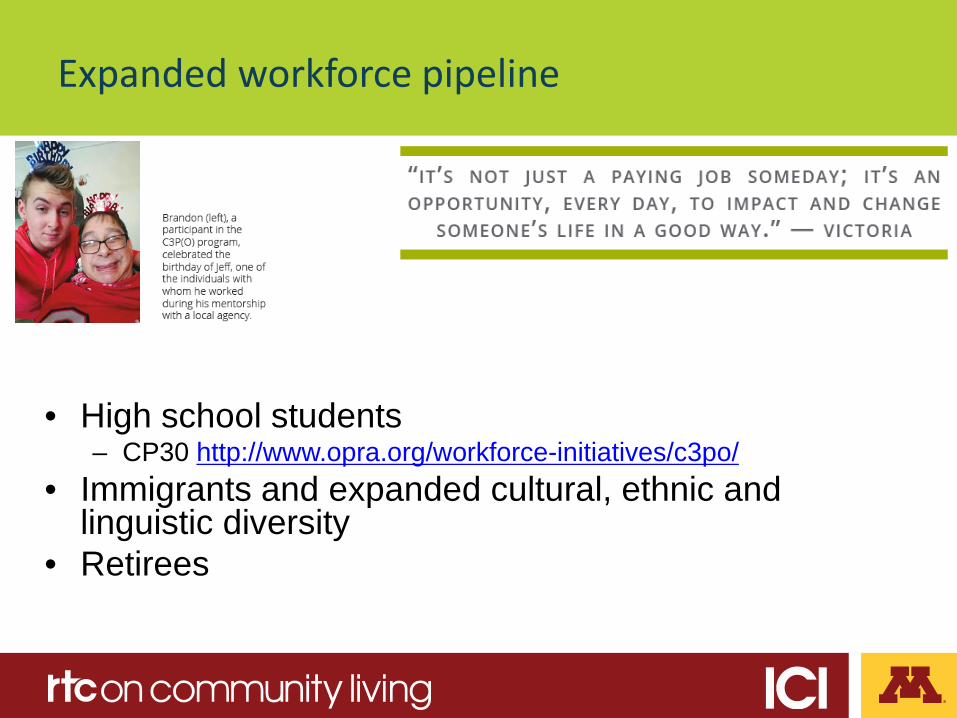
Expanded workforce pipeline
• High school students – CP30 http://www.opra.org/workforce-initiatives/c3po/
• Immigrants and expanded cultural, ethnic and linguistic diversity
• Retirees
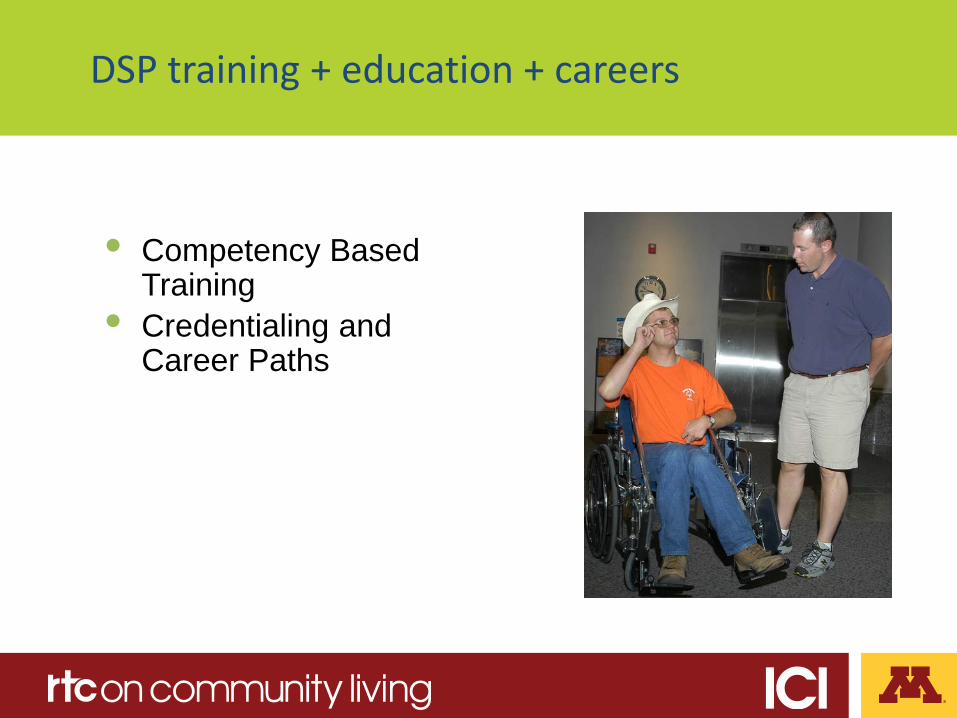
DSP training + education + careers
• Competency Based Training
• Credentialing and Career Paths

Knowledge Skills & Abilities Behaviors Application
& Transfer
Focus on what’s needed to be successful – outcomes.
What do I need to know? What theories or ideas?
What do I need to be able to do?
What dispositions must I display?
Where must I be able to apply these KSAs, and at what level?
Competency-based training and education
Source: Charla Long, 2017

Outcomes Associated with Competency-Based Training

DSP competency sets 1996 - 2014
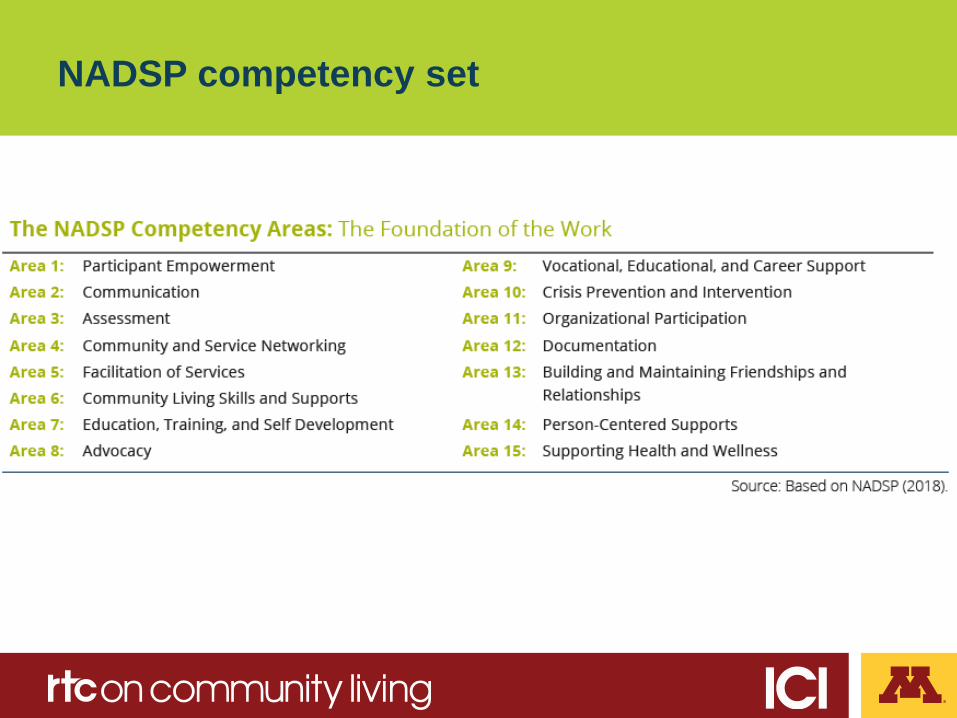
NADSP competency set
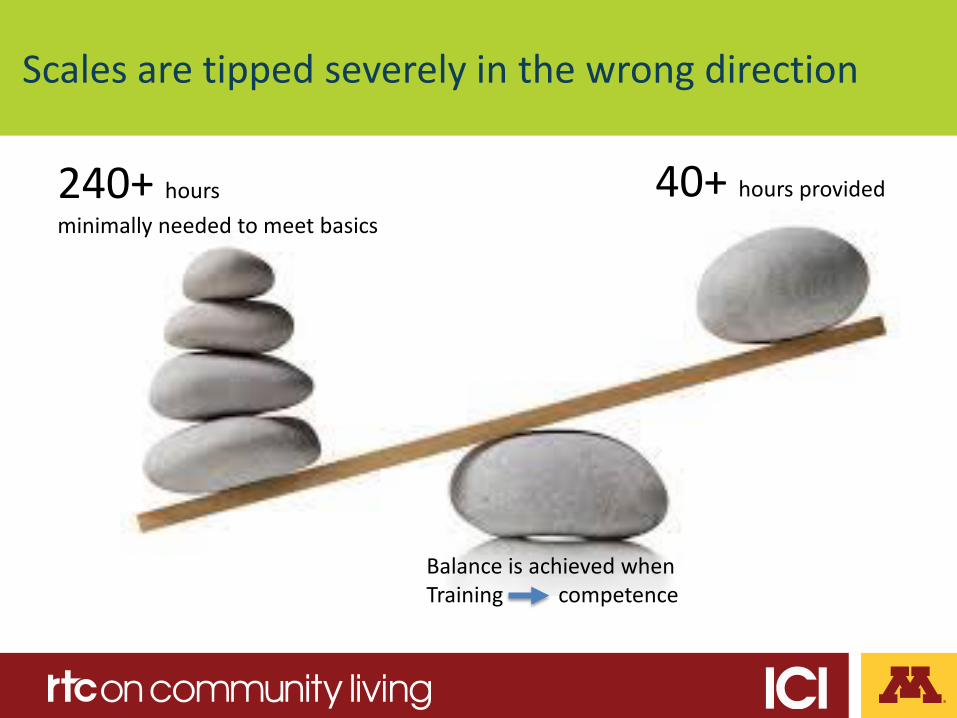
Scales are tipped severely in the wrong direction
240+ hours minimally needed to meet basics
40+ hours provided
Balance is achieved when Training competence

Competency based training matters

Align training with outcomes
Direct Support Professional : MODULE Individual with Disability: OUTCOME
Professionalism Satisfaction with Staff
Community Inclusion Person Centered Planning
Community Inclusion
Individual Rights and Choice Civil Rights and Advocacy
Choices & Rights
Safety at Home and in the Community Supporting Healthy Lives Personal Care
Health & Safety
You’ve Got a Friend Friends & Family
Employment Supports Home and Community Living Personal Care
Work, Day, and Home
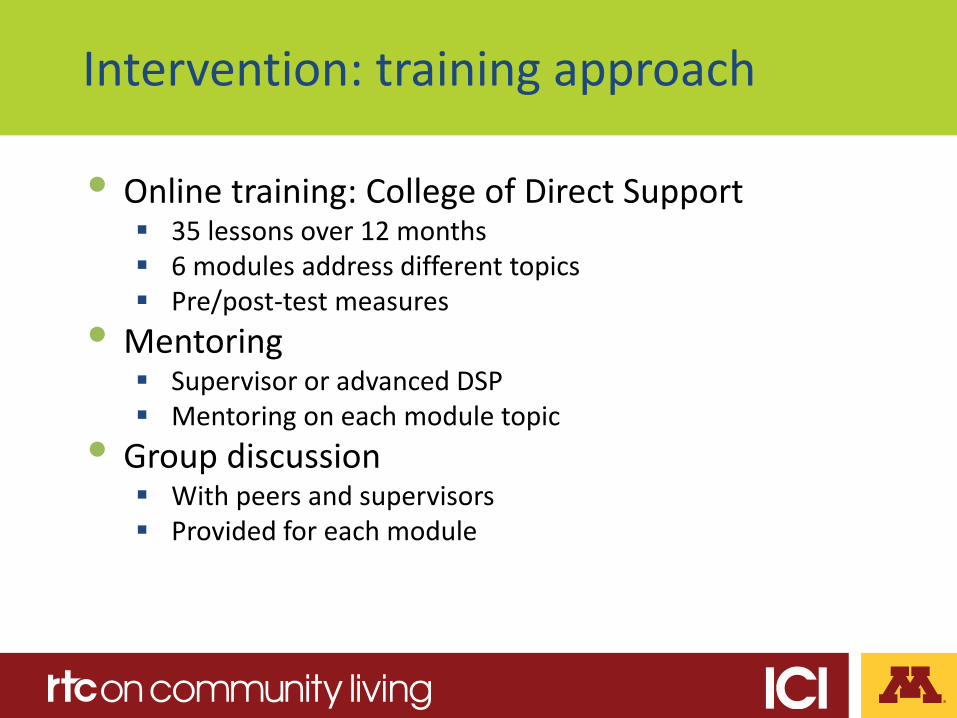
Intervention: training approach
• Online training: College of Direct Support 35 lessons over 12 months 6 modules address different topics Pre/post-test measures
• Mentoring Supervisor or advanced DSP Mentoring on each module topic
• Group discussion With peers and supervisors Provided for each module

Comprehensive training study
• Findings • Intervention sites experience 16.4%
decrease in turnover after one year • DSPs showed increased competence
(Rights & Choice, Health & Safety, Relationships)
• DSPs showed increased satisfaction with supervisors
• Individuals who received services had improved outcomes in all areas
Hewitt, Nord & Bogenshutz, UMN Comprehensive Training Study, 2014

People with Disabilities (N = 140 from 9 organizations)
Among the promising trends: • Across both settings—intervention group experienced:
– Decreases in loneliness compared to increases with control group.
– Greater proportion reporting best friends compared to a decrease in control group.
– Greater increase in social roles than control group. – Greater increase in choice making compared to control group.
RTC, 2013 (preliminary data)

NY recommended components of a credential structure
Desired program
components
Source: Hewitt, Kramme, &Taylor, 2016

ROI Calculator Financial model
2017 OPWDD Comparative Analysis of Credentialing Programs in New York
State
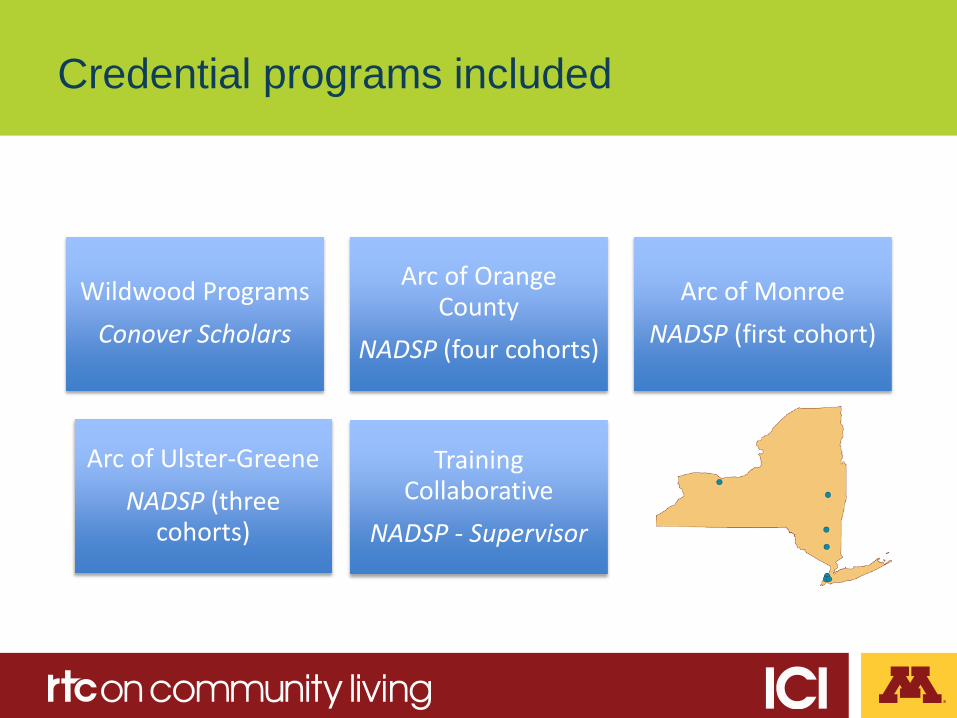
Credential programs included
Wildwood Programs Conover Scholars
Arc of Orange County
NADSP (four cohorts)
Arc of Monroe NADSP (first cohort)
Arc of Ulster-Greene NADSP (three
cohorts)
Training Collaborative
NADSP - Supervisor

Arc of Ulster Green 2017 NASDP credential cohort

Positive outcomes
• Stronger understanding and application of person-centered practices
• DSPs feeling more competence in performing their work
• DSPs attending planning meetings (finding that it is important to deliver quality supports)
• Higher wages after completion of credential • Longer retention; less turnover of credentialed staff • More competition for credential program spots after
about three years implementation
(OPWDD, 2018)
Credential in Ohio

of TN QuILTSS
Source: Charla Long, 2017

NADSP E-Badge Academy
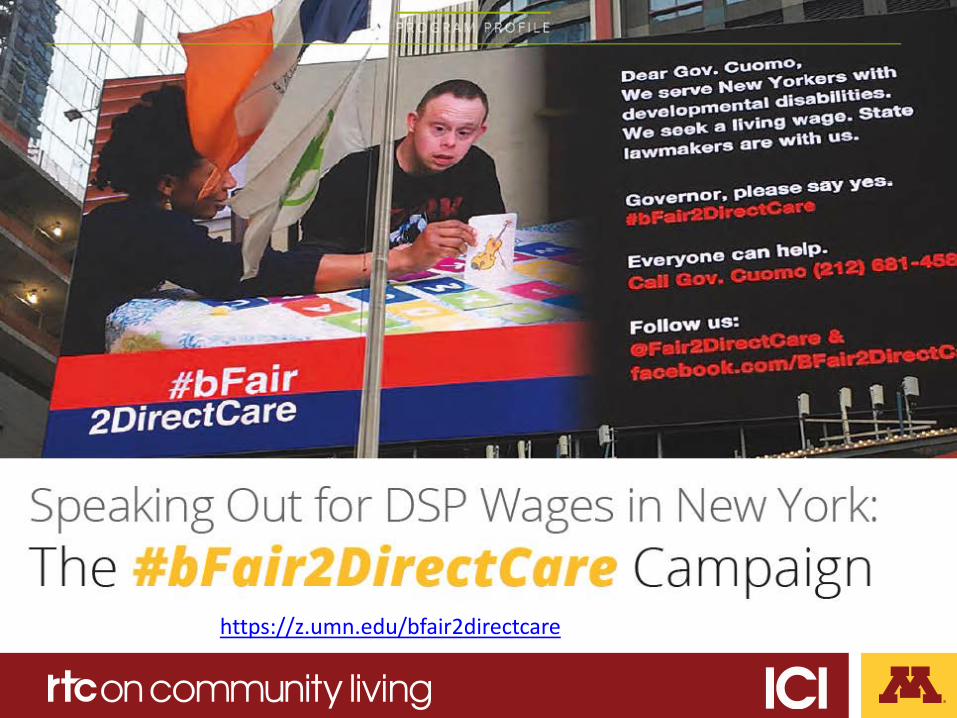
https://z.umn.edu/bfair2directcare

Marketing and public relations campaigns
• Coalition for a living wage (NJ) – njdspcoalition.org
• Fix the crisis (PA) – Fixthedspcrisis.com
• We are DSPs – Raise the Wage (IL) – Wearedsps.com
• The Case for DSP Wage Increases (IN) – Stonebelt.org/direct-support-professional-wages-need-to-
increase • National advocacy campaign (ANCOR)
– Nationaladvocacycampaign.org

• Component of recruitment campaign • Raise community awareness of DSPs • Celebrate profession • Combine with annual DSP national week ANCOR PSAs – http://www.nationaladvocacycampaign.org/toolkit/future-dsps NYSACRA PSAs – http://www.directsupportprofessional.org/
PSA – public service announcements

Who knows DSPs?
• Purposeful actions – your organization – other businesses
• EVERYONE in community knows DSPs – who, what and where
• How? – Neighborhood bar-b-ques that focus on the DSPs – Get to know me cards on doors – Media interviews – Celebrity spokespeople who celebrate DSPs

Organization Level Solutions to Consider

Building & Strengthening the DSP Workforce
• Recruitment & Selection – Targeted Marketing – Realistic Job Previews – Structured Interviewing – Status and Awareness (PSAs)
• Retention – DSW Competencies – Education and Training – Credentialing and Career Paths – Recognition – Membership and Networking
There is not a single solution!
Business Acumen – systematically use tools that work
• Targeted Marketing • Structured Behavioral Interview Questions and
Interviewers Guide • National Frontline Supervisor Competencies (NFSC)
http://rtc.umn.edu/docs/National_Frontline_Supervisor_comp_7-2-13.pdf
• Customized and Branded Public Service Announcements (PSAs)
• Customized Realistic Job Previews (RJPs) • Recruitment bonuses


Organizational culture
• Intentional learning • Leader who knows the direct line staff by
name • Goes out of their way to engage • Periodically practices direct support • Celebrates DSPs
• Individual story-driven • Data-driven
• Makes data driven decisions regarding workforce
• Monitoring is routine • Engages DSPs at all levels

Creating a competitive edge
• Organization culture is your competitive edge • It takes a lot of effort and work to create an
organizational culture that supports DSP • “DSP week” is 52 weeks a year!
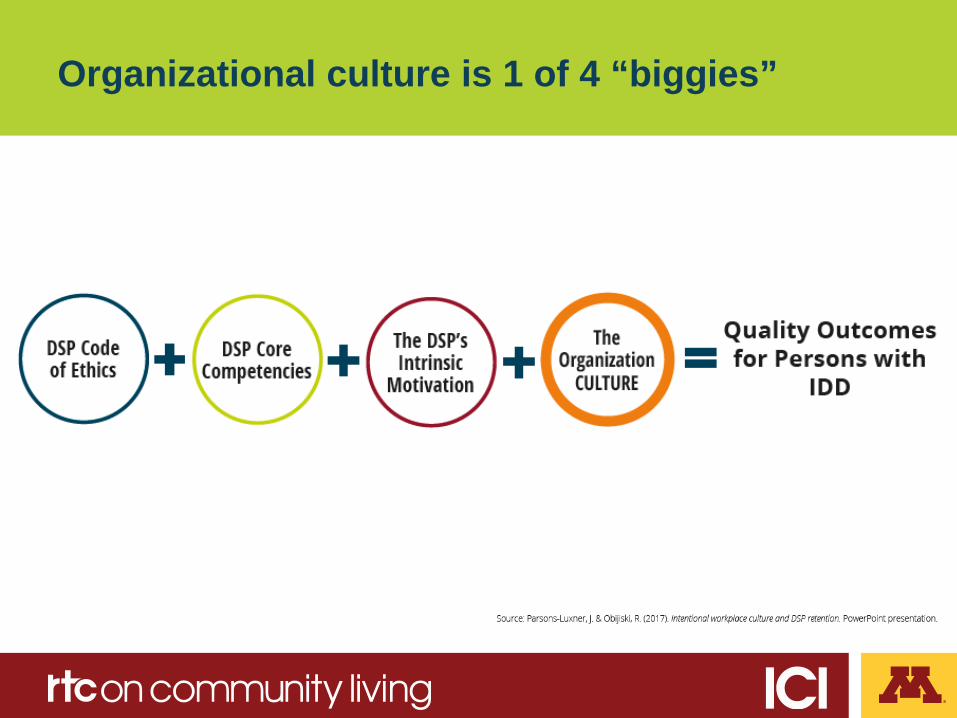
Organizational culture is 1 of 4 “biggies”

Know who your workforce is and support it

Workforce development toolkits
• ANCOR – http://www.nationaladvocacycampaign.org/wel
come • The Arc of the United States
– https://www.thearc.org/for-chapters/dsp-toolkit • Find, Choose and Keep Great DSPs (self-
direction) – https://rtc.umn.edu/rtc/index.php?product
The DSP workforce tools
• Targeted Marketing Flyers & Job Announcements
• Ready-made PSA’s • Realistic Job
Preview for DPS’s • Structural Behavior
Interview Guide for Hiring DSP’s

Realistic Job Previews
Who • Potential Recruits • Job Candidates
When
• Job Fairs • Recruiting Events • Workforce One Stop Centers • Early in interview Process

Benefits of Realistic Job Previews
Candidates understand job expectations before they start the job
Candidates make informed decision Candidates can self-select out

RJPs and retention
RJP’s improve retention rates by 9% - 17% RJP’s increase retention of workers
– 12% for agencies with annual retention rates of 50%, and
– 24% for agencies with annual retention rates of 20%

Realistic Job Preview
ANCOR RJP - http://www.nationaladvocacycampaign.org/newsroom/news/new-ancorrtc-realistic-job-preview-available-now
NYSACRA RJP – http://www.directsupportprofessional.org/

Realistic Job Previews
Present non-distorted information to job applicants • about the job • and the
organization/family/individual(s)
• before a job offer has been made
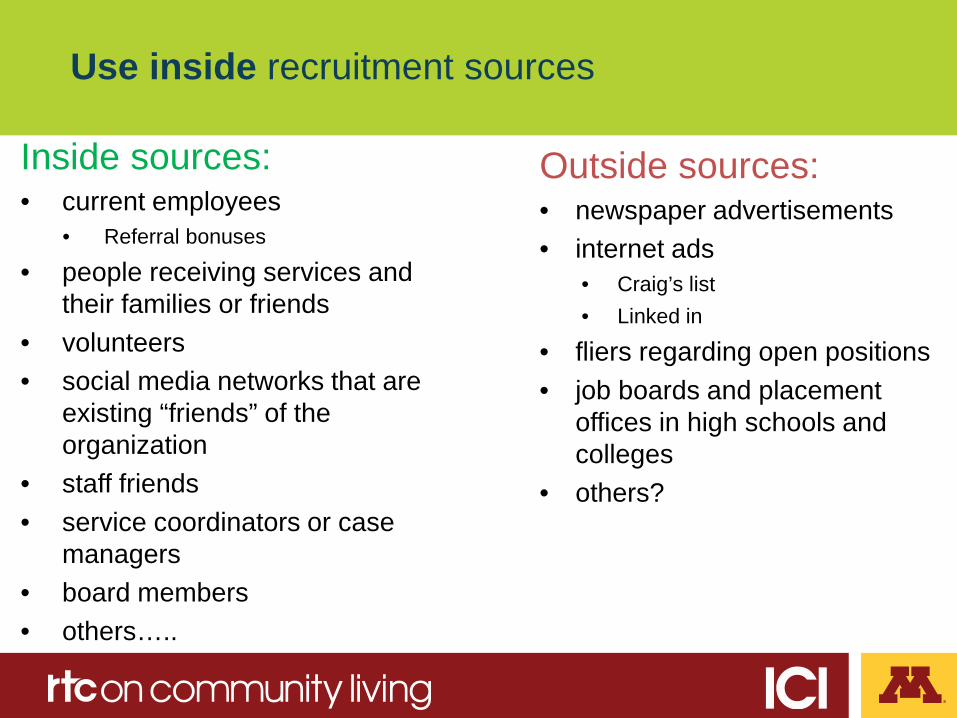
Use inside recruitment sources
Inside sources: • current employees
• Referral bonuses
• people receiving services and their families or friends
• volunteers • social media networks that are
existing “friends” of the organization
• staff friends • service coordinators or case
managers • board members • others…..
Outside sources: • newspaper advertisements • internet ads
• Craig’s list • Linked in
• fliers regarding open positions • job boards and placement
offices in high schools and colleges
• others?
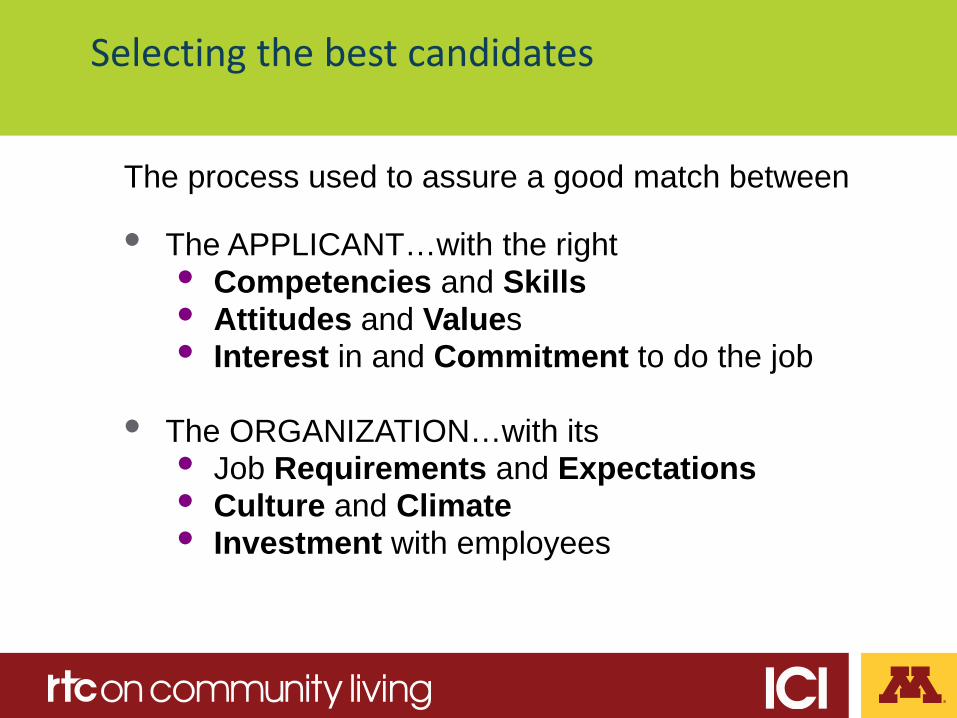
Selecting the best candidates
The process used to assure a good match between • The APPLICANT…with the right
• Competencies and Skills • Attitudes and Values • Interest in and Commitment to do the job
• The ORGANIZATION…with its • Job Requirements and Expectations • Culture and Climate • Investment with employees

Know your stayers
• What does the data you gather tell you about who stays longest in your organization?
• Who are your best employees? • Where can you gain access to more people with
similar characteristics? • How are you marketing and recruiting to find
their clones?

Customizable marketing materials
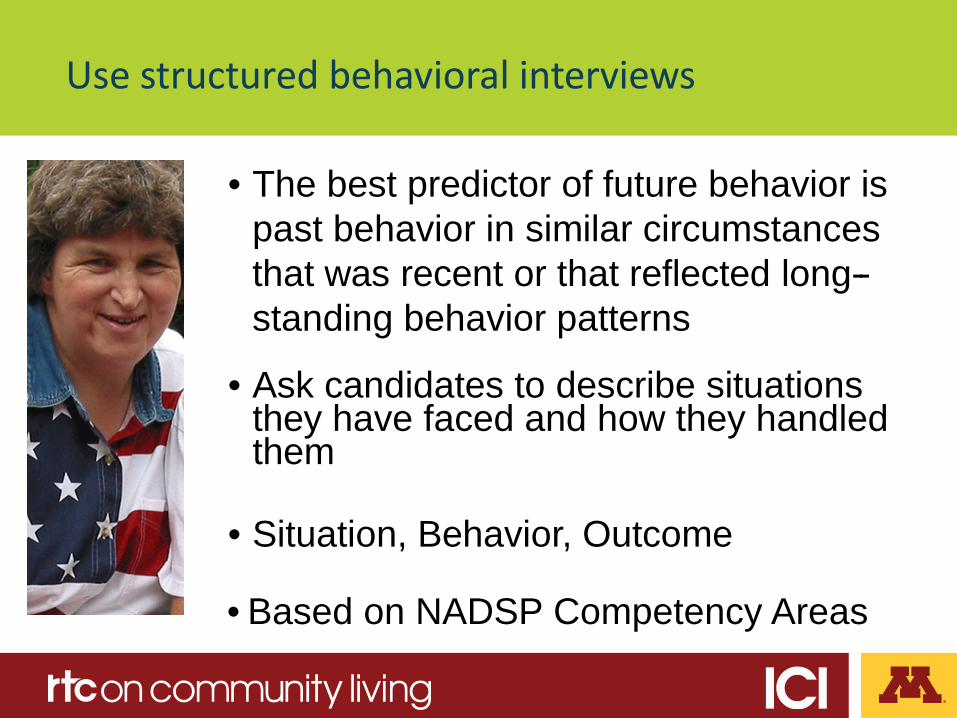
• The best predictor of future behavior is past behavior in similar circumstances that was recent or that reflected long--standing behavior patterns
• Ask candidates to describe situations they have faced and how they handled them
• Situation, Behavior, Outcome
• Based on NADSP Competency Areas
Use structured behavioral interviews

Sample Questions: Competency area 1: PARTICIPANT EMPOWERMENT Describe a situation when you assisted an individual to recognize that he or she had several choices in how to handle a difficult problem. What was the situation, what did you do, and what was the final outcome? Competency area 4: COMMUNITY & SERVICE NETWORKING Please describe some community resources you have had contact with in your own neighborhood. How might those resources be used by a person with a disability?
Structured behavioral interviews

Structured behavioral interviews

Where do I find solutions?
“When I am facing the most difficult challenges, I turn to the factory and I always find solutions
there.” - Hamdi Ulukaya
• Ask them, be on the pulse – Informal talking sessions with leadership – Engagement survey – Focused conversation at staff meeting with
supervisors – Text with simple question
Know what your DSPs see and think

Focus on frontline supervisors
• DSP turnover is lower when • DSPs feel valued • DSPs feel they are treated fairly
• Reasons DSPs leave • issues with co-workers • issues with supervisors
Source: Larson, 1997

FLS wages are not great and turnover is high
• FLS wages – Average starting salary was $34,956.06
($16.80/hr) – Average FLS salary was $40,253.54 ($19.35/hr) – Average highest FLS salary was $52,183.12
($25.08/hr) • FLS turnover
– Average FLS turnover rate was 13.0% (ranged from 0 to 50%)
– Average FLS vacancy rate for the entire sample was 5.3% (range from 0 to 33.3%).
(Hewitt et. al., 2015)
New York data
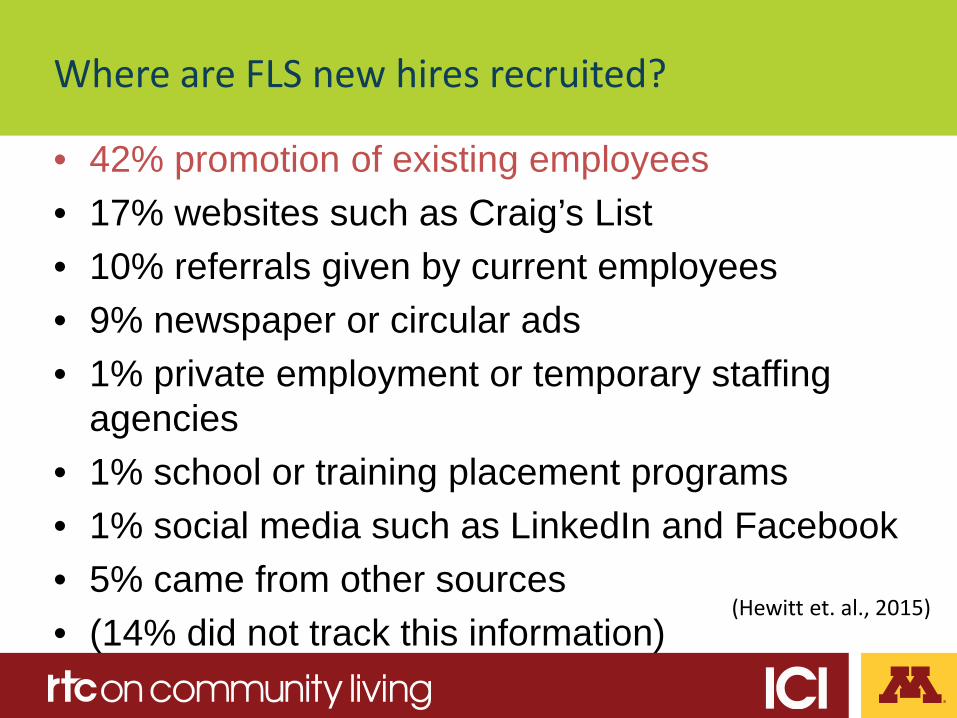
Where are FLS new hires recruited?
• 42% promotion of existing employees • 17% websites such as Craig’s List • 10% referrals given by current employees • 9% newspaper or circular ads • 1% private employment or temporary staffing
agencies • 1% school or training placement programs • 1% social media such as LinkedIn and Facebook • 5% came from other sources • (14% did not track this information)
(Hewitt et. al., 2015)

National frontline supervisor competencies
1. Direct Support 2. Health, Wellness, & Safety 3. Individual Support Plan Development,
Monitoring, and Assessment 4. Facilitating Community Inclusion Across
the Lifespan 5. Promoting Professional Relations and
Teamwork 6. Staff Recruitment, Selection, and Hiring 7. Staff Supervision, Training and
Development 8. Quality Assurance 9. Advocacy & Public Relations 10. Leadership, Professionalism, & Self-
Development 11. Cultural Responsiveness & Awareness

Supporting frontline supervisors
• Use evidence based Frontline Supervisor Competencies that reflect best practice in current service system.
• Use on-line workforce development tools utilizing these competencies, including: • candidate assessment tool • peer assessment • selection tool • training and development tool • performance evaluation

Implement strategies to increase effectiveness of remote supervision
• Communicate frequently and listen – Use technology – Staff –centered communication approach
• Phone, text, e-mail • Communicate accountabilities and follow up often • Use animated gifs and emoticons to convey emotion • Provide right tools • Insist on some face-to-face that is not all business (not staff
meetings) – Network focused – Relationship building
• Make time weekly for one-to-one • Small talk is key • Use video
– Skype – Google Hangouts – Sqwiggle

Professional Identify and Recognition

OADSP and NADSP
Source: retrieved from OADSP.com
VISION STATEMENT A world with a highly qualified and
professional direct support workforce that partners with, supports and empowers
people with disabilities to lead a life of their choosing.
MISSION STATEMENT To elevate the status of direct support
professionals by improving practice standards, promoting system reform, and
advancing their knowledge, skills and values.

1. Ensure that who DSPs are, what they do and why they are important is know to community members
2. Improve DSP identity, respect and recognition 3. Create an occupational title in BLS 4. Fund use of competency based training models that result in
credentialed or certified staff with wage increase 5. Develop industry specific pipeline programs 6. Gather comprehensive data at site, org, state and nat’l levels 7. Provide and use evidence based interventions 8. Promote increased use of self-directed options 9. Increase use of technology-enhanced supports
Source: Amy Hewitt (UMN RTC/CL), Joe MacBeth (NADSP), Barbara Merrill (ANCOR) & Barb Kleist (UMN RTC/CL), 2018

Other information Research and Training Center on Community Living Institute on Community Integration (UCEDD) University of Minnesota, Twin Cities 214 Pattee Hall, 150 Pillsbury Drive SE Minneapolis, MN 55455 [email protected]
This research was supported by grant from the National Institute on Disabilities and Rehabilitation Research, U.S. Department of Education #H133G080029 and #H133B080005. Grantees undertaking projects under government sponsorship are encouraged to express freely their findings and conclusions. Points of view or opinions do not, therefore necessarily represent official NIDRR policy.