Embed Size (px)
Citation preview

Unfulfilled Promise:
The Dimensions and Characteristics of
Philadelphia’s Dropout Crisis, 2000–2005
Ruth Curran Neild, Ph.D.
Robert Balfanz, Ph.D.

About the Authors
Dr. Ruth Curran Neild is a Research Scientist at the
Center for Social Organization of Schools, Johns
Hopkins University. During the academic year when
this research was conducted (2005–2006), she was an
assistant professor at the University of Pennsylvania’s
Graduate School of Education.
Dr. Robert Balfanz is a Principal Research Scientist
at the Center for Social Organization of Schools,
Johns Hopkins University.

ACKNOWLEDGEMENTS . . . . . . . . . . . . . . . . . . . . . . . . . . . . . . . . . . . . . . . . . . . . . . . 2
EXECUTIVE SUMMARY . . . . . . . . . . . . . . . . . . . . . . . . . . . . . . . . . . . . . . . . . . . . . . . . 3
INTRODUCTION . . . . . . . . . . . . . . . . . . . . . . . . . . . . . . . . . . . . . . . . . . . . . . . . . . . . . . 6
CHAPTER 1: High School Graduation and Dropout Trends in Philadelphia . . . . . . . . . 8
Which Is the Best Way to Determine the Graduation and Dropout Rates? . . . . . . 8
Who Is a Dropout? . . . . . . . . . . . . . . . . . . . . . . . . . . . . . . . . . . . . . . . . . . . . . . . . . . . . . 9
What Happened to Philadelphia Students in 2003–2004?:
Dropout Rates Using the Annual Method . . . . . . . . . . . . . . . . . . . . . . . . . . . . . . . . . 10
Variation in Annual Dropout Rates by Race/Ethnicity and Gender. . . . . . . . . . . . . 12
School Type and Dropout. . . . . . . . . . . . . . . . . . . . . . . . . . . . . . . . . . . . . . . . . . . . . . . 14
Annual Dropout Rates by Neighborhood . . . . . . . . . . . . . . . . . . . . . . . . . . . . . . . . . 15
Trends in Cohort Graduation and Dropout Rates:
The Classes of 2000 Through 2005 . . . . . . . . . . . . . . . . . . . . . . . . . . . . . . . . . . . . . . . 17
The First-Time Freshman Cohorts. . . . . . . . . . . . . . . . . . . . . . . . . . . . . . . . . . . . . . . . 17
The Freshman and Transfer Cohorts . . . . . . . . . . . . . . . . . . . . . . . . . . . . . . . . . . . . . . 19
Trends in the “Graduation Gap”:
Cohort Graduation Rates by Gender and Race/Ethnicity
for First-Time Freshman Cohorts. . . . . . . . . . . . . . . . . . . . . . . . . . . . . . . . . . . . . . . . . 21
CHAPTER 2: Who Does Not Graduate from High School?:
The First-Time Freshman Class of 2000 . . . . . . . . . . . . . . . . . . . . . . . . . . . 26
The Hazard of Dropping Out Within Eight Years of Starting High School . . . . . . 26
Identifying Students at Highest Risk of Dropping Out. . . . . . . . . . . . . . . . . . . . . . . 28
Predicting Dropout Among Upper-Grades Students . . . . . . . . . . . . . . . . . . . . . . . . 31
Non-Academic Predictors of Dropout . . . . . . . . . . . . . . . . . . . . . . . . . . . . . . . . . . . . 32
Re-engaging Students with School: The Class of 2000 in June 2004 . . . . . . . . . . . 33
CONCLUSION . . . . . . . . . . . . . . . . . . . . . . . . . . . . . . . . . . . . . . . . . . . . . . . . . . . . . . . . . . . . . . . . . . . . 35
APPENDIX 1: Defining Dropout . . . . . . . . . . . . . . . . . . . . . . . . . . . . . . . . . . . . . . . . . . . . . 39
APPENDIX 2: Comparing Graduation Rate Estimates . . . . . . . . . . . . . . . . . . . . . . . . . . 41
REFERENCES . . . . . . . . . . . . . . . . . . . . . . . . . . . . . . . . . . . . . . . . . . . . . . . . . . . . . . . 46
ENDNOTES . . . . . . . . . . . . . . . . . . . . . . . . . . . . . . . . . . . . . . . . . . . . . . . . . . . . . . . . . . . . . . . 48
1
TABLE OF CONTENTS

e are deeply indebted to the
vision and support of many
citizens and civic leaders in
Philadelphia, whose concern for the
futures of out-of-school youth led
them to initiate this research.
Our work was supported by the gen-
erosity of the William Penn Foundation.
Dr. Candace Bell, Education Program
Officer at the William Penn Foundation,
encouraged us to creatively use the city’s
data resources to map the landscape of
high school dropout in Philadelphia.
Throughout this project, School District
of Philadelphia CEO Paul Vallas was
genuinely supportive of our efforts to
learn more about the landscape of
dropout in Philadelphia.
At the University of Pennsylvania, Dr.
Dennis Culhane and Dr. John Fantuzzo,
who developed and currently direct
the KIDS data infrastructure, provided
invaluable guidance in negotiating and
understanding the data sets and the city
agencies that provided the data. The
staff at Penn’s Cartographic Modeling
Laboratory—Carnell Baugh, Jeanetta
Churchill, Dr. Tara Jackson, Nora Hunt-
Johnson, Vicky Tam, and Diane-Louise
(D.L.) Wormley—were collaborative and
sympathetic colleagues. We especially
thank Jeanetta Churchill and Carnell Baugh
for their unrelenting work in obtaining and
organizing data sets, and Vicky Tam for cre-
ating the map that appears in this report.
We express sincere thanks to research
assistants Christopher Boccanfuso and
Greg Katz at Johns Hopkins and Ching-fu
Lan at the University of Pennsylvania.
We are grateful for the enthusiasm and
sage advice of staff at the Philadelphia
Youth Network—among them Jenny
Hamilton, Melissa Orner, Laura Shubilla,
and Don Spangler—who have been a
pleasure to work with.
Finally, we thank the members of the
Philadelphia Youth Transitions Collab-
orative Steering Committee (JoAnn
Weinberger, Center for Literacy; Steve
Honeyman, Carmen LeBron, and Dolores
Shaw, Eastern Pennsylvania Organizing
Project; James Randolph and Ellen Walker,
Philadelphia Department of Human
Services; James Sharp, Philadelphia
Juvenile Probation Department; Colleen
McCauley Brown and Shelly Yanoff,
Philadelphia Citizens for Children and
Youth; Carol Fixman and Allie Mulvihill,
Philadelphia Education Fund; Paul Socolar,
The Philadelphia Public School Notebook;
Candace Putter, Reintegration Initiative;
Courtney Collins-Shapiro and Heather
Frattone, School District of Philadelphia;
and David Fair, United Way of Southeastern
PA). We also thank the members of the
KIDS Advisory Board (the City of Philadelphia’s
Department of Behavioral Health and
Mental Retardation Services, Department
of Human Services, Department of Public
Health, Division of Social Services, Office
of Emergency Shelter Services, and
Solicitor’s Office; Philadelphia Safe and
Sound; the School District of Philadelphia;
the University of Pennsylvania; and the
William Penn Foundation) who reviewed
and provided feedback on this report.
2
ACKNOWLEDGEMENTS

young person in the United
States who embarks on adult-
hood without a high school
diploma faces a grim economic future:
an annual income that is likely to be
insufficient to support a family, a greater
likelihood of long stretches of unemploy-
ment, and restricted opportunities for
occupational advancement. Cities with
large percentages of youth who lack high
school diplomas suffer as well: they can
take advantage of fewer economic devel-
opment opportunities, garner less tax
revenue, and experience higher social
service costs, more crime, less civic
participation, and high levels of concen-
trated and inter-generational poverty. A
city of the 21st century cannot prosper
when large numbers of its young people
lack this basic academic credential.
Despite the serious individual and collec-
tive costs that result when youth fail to
complete high school, until now we have
not had a clear picture of how many stu-
dents in the Philadelphia public schools
earn their high school diplomas and how
many drop out of school. Data are critical
for assessing the numbers of dropouts
and their characteristics, and ultimately
for determining whether we are succeed-
ing in our efforts to retain students in
school and to reconnect dropouts with
educational opportunities.
This Study
This report uses a unique set of data
obtained from the Kids Integrated Data
System (KIDS), which is housed at the
University of Pennsylvania’s Cartographic
Modeling Laboratory. The KIDS system
merges individual-level data on young
people from the School District of
Philadelphia and the city’s social service
agencies, including the Department of
Public Health, the Department of Human
Services, and the Office of Emergency
Shelter and Services. The resulting de-
identified data allow us to follow cohorts
of students over multiple years, examin-
ing their educational outcomes as well as
the predictors of graduation and dropout.
This report addresses three central sets
of questions:
u How many students in grades 6 through
12 drop out of Philadelphia’s public
schools in a single year? What are the
key characteristics of these students,
including their age, grade, race/ethnicity,
gender, type of school attended, and
neighborhood of residence?
u What percentage of 9th graders gradu-
ates within four years, five years, or six
years of starting high school? What has
been the trend in these cohort gradua-
tion rates over the past 5 years? What are
the trends in cohort graduation rates for
males and females and for students of
different racial/ethnic backgrounds?
u Which student characteristics, knowable
or potentially knowable by school
personnel and agency staff, can identify
students as being at high risk of dropping
out of high school?
3
EXECUTIVE SUMMARY

Findings
Dropout During a Single School Year:
2003–2004
u During the 2003–2004 school year,
approximately 6% of the students in
grades 6–12 in the city’s public schools
(including charter schools) dropped out of
school. An additional 4% of students
in grades 6–12 were technically enrolled
but were absent from school more than
half the time; we call these students
the “near-dropouts.” In all, over 13,000
students became dropouts or near-
dropouts during 2003–2004.
u Almost two-thirds of the students who
dropped out of school in 2003–2004 were
in grade 10 or lower; about one-third were
in grade 9 or lower. However, there is no
grade at which high school students are
immune to dropping out: over one-third
of the students who dropped out were in
11th or 12th grade. Despite being consid-
erably younger than the legal school-leav-
ing age, more than 500
students in grades 6–8 were officially
listed as having dropped out of school.
u During 2003–2004, 20% of the Latino
students at the city’s publicly supported
high schools were either dropouts or
near-dropouts, as were 18% of African
American students, 15% of White stu-
dents, and 12% of Asian students. Males
were more likely to be dropouts or near-
dropouts than females. Despite differ-
ences in severity, high school dropout in
Philadelphia is a serious problem in each
of the above racial/ethnic groups, and it
is a problem for both males and females.
Trends in Cohort Graduation Rates
u For cohorts of first-time freshmen who
form the Classes of 2000 through 2005,
the four-year (“on-time”) graduation
rates range from 45% to 52%. For the
four cohorts for which we have six-year
graduation data, the percentage of
students earning a high school diploma
ranges from 54% to 58%. If we include all
of the dropouts from the Classes
of 2000 through 2005, about 30,000
students who began 9th grade in Phila-
delphia’s public high schools left without
earning a diploma.
u In the six cohorts for which we have data,
not a single racial or ethnic group had an
on-time graduation rate greater than 71%.
Consistent with the annual dropout rate
for 2003–2004, Asian students were most
likely to graduate on-time, followed by
Whites, African Americans, and Latinos.
u For the Classes of 2000 through 2003,
only about 40% of Latino males earned
a high school diploma within six years;
only about half of African American and
White males finished high school; and
about 65% of Asian males graduated.
Among females, just over half of Latino
females graduated, about 65% of African
Americans and Whites graduated, and
75% of Asians earned a diploma.
Predictors of Dropping Out
u Two 8th grade factors gave students at
least a 75% probability of dropping out of
school: 1) attending school less than 80%
of the time in 8th grade (that is, missing
at least 5 weeks of school), and
2) receiving a failing final grade in mathe-
matics and/or English during 8th grade.
Of those 8th graders who attended
school less than 80% of the time, 78%
became high school dropouts. Of those
8th graders who failed mathematics
and/or English, 77% dropped out of high
school. Importantly, gender, race, age,
and test scores did not have the strong
predictive power of attendance and
course failure.
u A second group of dropouts, who were
not classified as at-risk in 8th grade
according to our definition, were at-risk
9th graders. These students 1) attended
less than 70% of the time during 9th
grade, and/or 2) earned fewer than 2
credits during 9th grade, and/or 3) were
not promoted to 10th grade on time.
A ninth grader with just one of these
characteristics (who was not at-risk in
8th grade) had at least a 75% probability
of dropping out of school.
u About half of the dropouts in the city’s
public schools can be identified in 8th
grade, prior to their entrance to high
school. Eighty percent of the students
who dropped out of school were either
at-risk 8th graders or at-risk 9th graders.
4

u The probability of dropping out decreas-
es dramatically for students who arrive at
10th grade on time after entering high
school. It is more difficult to predict who
will drop out among upper-grades stu-
dents, suggesting that the factors that
precipitate dropout may be more person-
al and idiosyncratic than those affecting
dropout in earlier grades.
u Agency-involved students had especially
high rates of high school dropout. Fully
90% of the students who had a juvenile
justice placement during their high school
years ultimately dropped out. About 70%
of the students who had a substantiated
case of abuse or neglect during the high
school years, had a
foster care placement, or who gave birth
within four years of starting high school,
became out-of-school youth.
Implications for Policy
u A broad-based coalition needs to be
mobilized to meet the challenge of high
school dropout in Philadelphia. This coali-
tion needs to be able to sustain
itself for the long term. Because the over-
whelming proximal cause of dropping out
in Philadelphia is failing in school
and student disengagement, the public
schools of Philadelphia must be the
locus of the campaign to end the dropout
crisis. But the school system alone cannot
be expected to solve this problem.
Getting adolescents to come
to school and to work hard to succeed
will require a substantial effort from
community, as well as families.
u Along with continual improvements
at the elementary school level and an
expansion of early childhood education, it
is necessary to have an integrated and
coordinated effort to reform education in
grades 6–12. During the onset of adoles-
cence, substantial numbers of students
begin to disengage from school, stop
attending school regularly, and fail their
courses. Because students who are at
highest risk of dropping out are concen-
trated in the highest-poverty middle
grades schools and high schools, these
schools will require additional reforms,
supports, and resources beyond system-
wide efforts.
u Even the most effective school-based
reforms will not prevent all students
from dropping out of school. About 20%
of Philadelphia’s students drop out late
in high school, when they are relatively
close to obtaining their diploma.
Moreover, it is more difficult to predict
which students in the 11th or 12th grade
are likely to drop out and, as a result,
it is more difficult to target them with
needed supports. An effective system of
credit recovery, second chance schools,
and alternative means of securing a high
school diploma will be required.
u The agencies that provide social
services to the city’s youth need to
be deeply involved in the effort to
stop the dropout crisis in Philadelphia.
Currently the adolescents who are in
their care drop out in alarming numbers.
For high school students who
have been abused and neglected, are
in foster care, or receive an out-of-home
placement in the juvenile justice system,
the probability of dropping out is 75%
or even higher. Similarly, two out of
three females who give birth within four
years of the start of high school drop
out. Social service agencies will need
to determine how the resources they
have at their disposal can be most effec-
tively marshaled to help ensure that
adolescents in their charge graduate
from high school.
5

6
hat is the graduation rate in
Philadelphia’s public schools?
How many students leave
school without earning a high school
diploma? What do we know about
those who leave? And what can we do
to keep students from dropping out of
high school and re-engage in education
those who do? The answers to these
questions are of critical importance for
the youth of Philadelphia, and ultimate-
ly, for the economic and civic health
of the entire city. Unlike the industrial
Philadelphia of the 19th century—or
even the Philadelphia of the mid-20th
century—ample employment opportuni-
ties are no longer available for individu-
als who have not earned at least a high
school diploma (Brookings, 2003). A
city of the 21st century cannot prosper
when large numbers of its young peo-
ple lack this basic academic credential.
A young person who has left high school
without earning a diploma faces a grim
economic future: an annual income that is
unlikely to be sufficient to support a family,
a greater likelihood of long stretches of
unemployment, and restricted opportuni-
ties for occupational advancement (Rouse,
2005). Young people without high school
diplomas are effectively blocked from post-
secondary training opportunities needed
for success in an information economy.
Further, high school dropouts experience
the social marginalization that arises from
lacking an educational credential pos-
sessed by most of their fellow citizens.
For the City of Philadelphia, large numbers
of high school dropouts lead to fewer eco-
nomic development opportunities as a
result of the weak educational credentials
of the workforce, less tax revenue, higher
social service costs, more crime, less civic
participation, and high levels of concentrat-
ed and inter-generational poverty (Junn,
2005; Moretti, 2005; Rouse, 2005;
Waldfogel et al., 2005).
The question of how many students gradu-
ate from Philadelphia’s public schools and
how many drop out of school appears to
be a simple one, but estimates of gradua-
tion and dropout rates have conflicted
wildly. Standard and Poor’s “School
Matters” website, which provides data
on school districts across the United States,
lists the School District of Philadelphia’s
2004–2005 graduation rate as 68.1%1; the
School District of Philadelphia reported
that the 2003–2004 graduation rate in
Philadelphia’s public schools was 63.1%2;
and in June 2006, Education Week esti-
mated that the 2002–2003 graduation rate
was considerably lower, at 55.5%. In this
report, we explore why these estimates
are so different and propose some esti-
mates of our own. Yet, while the method-
ologies vary for calculating the specific
dropout and graduation figure for Phila-
delphia, there is agreement on one central
fact: Philadelphia has a dropout crisis.
Even the most optimistic estimates
paint a disturbing picture in which large
numbers of young people attending
Philadelphia’s public schools fail to
graduate from high school.
INTRODUCTION
7
Finding answers to the questions of how
many students graduate, how many drop
out of school, and why they drop out is
critical to shaping a policy response. As
we emphasize throughout this report,
dropouts come in many shapes and sizes,
figuratively speaking. Until we are clear
about the many pathways to dropout—
for example, how many students drop
out shortly before graduation, how many
leave school after having earned very
few credits, how many have struggled
academically for years, and how many
have good grades and high test scores
but were thrown off-track by an unfore-
seen life event, such as pregnancy—we
will have difficulty crafting a set of inter-
ventions that meet the various needs of
out-of-school youth in Philadelphia.
Data are critical for assessing the numbers
of dropouts and their characteristics, and
ultimately for determining whether we are
succeeding in our efforts to retain students
in school and to reconnect dropouts with
educational opportunities. This report
draws on KIDS (Kids Integrated Data
System), a database infrastructure housed
at the Cartographic Modeling Laboratory
at the University of Pennsylvania. KIDS
enabled us to analyze an exceptional set
of merged data files, including data from
the School District of Philadelphia, the
Department of Public Health, and the
Department of Human Services. These
data enable us to follow students over
time as they move through Philadelphia’s
public schools—or drop out of school.
The data permit us to focus on students
with particular characteristics, for example,
students who drop out but eventually
return to a public school, students who
are served by Philadelphia’s social service
agencies, female students who have chil-
dren, students who drop out in the 9th
grade or before, or students who make
it almost all the way through to the 12th
grade but leave school before obtaining
a diploma. We are also able to consider a
single year in detail to examine who drops
out and from which types of schools. In
short, the KIDS data set provides a window
onto the dropout crisis in Philadelphia with
sufficient detail so that informed public
policy can result.
This report has three chapters. The first
chapter examines a basic question—
what are the high school graduation
and dropout rates in Philadelphia’s public
schools?—for which good data, including
data for key racial/ethnic and gender
subgroups, have been sorely lacking.
This chapter shows how these rates have
changed over time and how they vary by
age, race/ethnicity, and gender, as well
as by high school type and poverty level.
We look in depth at a single school year
(2003–2004) and also follow multiple
cohorts of students as they progress
through high school from the mid 1990s
to the spring of 2005. The second chapter
explores the characteristics of the stu-
dents who drop out. Specifically, it exam-
ines pre-high school characteristics of
dropping out and assesses which factors
are most predictive. It looks at how stu-
dents who drop out in the early grades
of high school (9th and 10th grade) differ
from students who drop out in the later
high school grades (11th and 12th grade).
Further, it shows the relationship between
dropping out of high school and social
service involvement (for example, foster
care or juvenile justice placements), and
for females, the relationship between
having a child and leaving school without
a diploma. The concluding chapter syn-
thesizes the key findings and highlights
implications for policy and practice.

8
n this chapter, we use recent
data from the School District
of Philadelphia to provide basic
information on high school completion:
how many students graduate and drop
out, demographic characteristics of gradu-
ates and dropouts, and graduation and
dropout trends over time. We present
several analyses, each of which provides
a complementary picture about student
progress through high school. When we
combine these pictures, we develop a
much more sophisticated image of gradua-
tion and dropout in Philadelphia. Before we
present this analysis, however, we address
two key methodological questions: Which
is the best way to calculate graduation
rates? And which students should be
classified as high school dropouts?
Which Is the Best Way to Determine
the Graduation and Dropout Rates?
The “best way” to determine rates of high
school completion and non-completion
involves two things: 1) high-quality data
and 2) a method of calculating graduation
and dropout that is appropriate to the
question being asked. The “gold standard”
for graduation and dropout calculations
uses data about individual students that
allow their progress through high school
to be followed over time. These are the
kind of data that are typically available to
school districts and, increasingly, to states.
Beginning in the 2006–2007 school year,
for example, each student attending a
Pennsylvania public school will have a
unique, anonymous identification number
that will allow the state to keep more accu-
rate records of graduation and dropout.3
The National Governors Association has
issued a call for states to upgrade their
data collection systems so that they can
track individual students over time.4
Graduation rate calculation methods gen-
erally fall into one of two types: annual
rates and cohort rates. The annual rate
(sometimes called the “event rate”) pro-
vides information on the number of stu-
dents who graduate or drop out of school
in a single year. When Pennsylvania reports
a statewide dropout rate of 1.9% for stu-
dents in grades 7 through 12, as it did
for the 2003–2004 school year,5 it is using
an annual rate. In contrast, the cohort rate
provides information about the graduation
and/or dropout rate of a single cohort of
students, for example, a group of students
who all started 9th grade in a given year.
Both methods have their advantages and
disadvantages. The annual method pro-
vides a window on the magnitude of the
dropout challenge that a district or state
faces in any given year. It can provide
information, for example, on how many
students might need a dropout recovery
program or intervention. At the same time,
the annual method has some drawbacks.
It only provides information on the number
of dropouts in a given year, and some of
those dropouts may return to school the
next year. In theory, if all of the dropouts
who left a district in a given year were to
return to school the next year and stay until
they graduate, the district would have a
high annual dropout rate even though
100% of its students ultimately earn a
high school diploma. In practice, however,
one of the drawbacks of the annual high
school graduation rate is that it tends to
make things seem better than they are.
Assuming that many dropouts do not
return to school, a district’s consistent
annual dropout rate of 10% means that
each year the district loses 10% of its high
school students. As a single cohort of fresh-
men passes through high school, it might
lose 10% in Year 1, 10% in Year 2, and so
on, until 40% of the cohort has dropped
out by the end of four years.
CHAPTER 1: High School Graduation and Dropout Trends in Philadelphia

9
The cohort rate (sometimes called the
“status rate”) corrects for some of the
problems associated with the annual
method. Calculating a cohort rate requires
that a cohort be defined, usually either
students in a particular grade or of a partic-
ular age, such as age 13.6 This group of
students is then tracked for at least four
years to determine how many have gradu-
ated, how many are still enrolled in school,
and how many have dropped out. In urban
districts like Philadelphia, it is important to
track cohorts for more than four years to
get a good picture of the cohort gradua-
tion rate. As we show later in this report,
a substantial subgroup of students who
earn high school diplomas take more
than four years to do so.
The cohort method, too, has drawbacks,
one of the most serious being that it
can be complicated to track individual
students over multiple years. But in gener-
al, researchers and policymakers agree
that the cohort rate provides better infor-
mation than the annual rate about how
well schools, districts, and states are doing
in terms of graduation. For example, both
Florida and Virginia, the two states identi-
fied by the National Governors Association
as leading the way in calculating gradua-
tion and dropout rates, both calculate four-
year graduation rates using the cohort
method. The public arguments among
researchers about how to best calculate
the dropout rate are arguments about how
the cohort rate is best determined (see
Appendix 2 for a discussion of different
methods of estimating the graduation rate).
Who Is a Dropout?
Deciding whether a student should be clas-
sified as not having completed high school
is more complex than it may first appear.
Most people could probably agree that
a student who is over the school-leaving
age (in Pennsylvania, 17 years) who formally
withdraws from school, and who reports
that she will work full-time without pursuing
any additional education, has dropped out
of high school. But how should we classify
a student who has been sent to a juvenile
justice facility that is outside the jurisdiction
of the school district? What about a stu-
dent who simply stops coming to school
and for whom no further information is
available? The choices that are made about
whether students in these kinds of circum-
stances should be counted as high school
dropouts can have a substantial effect
on the graduation and dropout rates
that are reported.
In the analyses for this report, we made
decisions about coding students as “gradu-
ates,” “dropouts,” or some other category
that accord with new guidelines from the
National Governors Association. Our goal
is to make our decisions and our reasoning
transparent so that others can assess the
quality of our decisions (for a detailed dis-
cussion of our coding, see Appendix 1).
In sum, we categorized students as gradu-
ates if they earned a regular high school
diploma from the School District of
Philadelphia. Because we use only school
district records to track students’ educa-
tional progress, we do not have information
about students who may have dropped out
of school and subsequently earned a GED.
In any case, many economists suggest that
the GED has less value in the labor market
than a regular high school diploma
(Cameron and Heckman, 1993; Boesel
et al., 1998; Murnane et al., 2000).
We defined students as high school
dropouts if they fell into one of the
following categories:
u Students who withdrew from the School
District of Philadelphia to go into the
workforce, the military, or Job Corps,
or because they were pregnant or were
needed to assist at home. Some students
who withdraw from school provide this
kind of information about their plans
for the future.
u Students who did not formally withdraw
from school but who were removed
from the school rolls for non-attendance.
This category includes students who
are under the legal school-leaving age
but who have stopped attending school,
have not given a reason for leaving,
and cannot be located.
u Students with incomplete information,
namely a) those who were removed from
the district rolls but are lacking an indica-
tion of why they withdrew (or were with-
drawn) and b) those who have neither
officially been removed from the rolls
nor are listed as being enrolled. In
essence, the second group of students
has “vanished,” with no indication of
enrollment or disenrollment. Our catego-
rization of these students as high school
dropouts is in accordance with the recom-
mendation of the National Governors
Association that students without infor-
mation on their whereabouts be counted
as dropouts7 and the Pennsylvania
Department of Education’s instructions
to districts on how to count dropouts.8
u Students who were expelled from school.
Because it is unclear whether these stu-
dents will be able to continue their educa-
tion, we coded them as dropouts. Only a
few students each year are expelled, how-
ever, so coding them one way or another
does not make much difference in our
estimates of graduation or dropout.

10
u Students who were incarcerated in a
juvenile justice facility not under the juris-
diction of the public schools.
Incarcerated students are perhaps the
most difficult to assess. Pennsylvania’s
reporting guidelines for school districts
call for students who are in detention
centers without secondary educational
programs to be classified as dropouts,
while those in facilities with educational
programs are not to be coded as
dropouts even though they have left
the school system.9 However, the data we
use for this report do not provide infor-
mation on whether the facility has
an educational program; for example,
we have no information on whether
the student was being held in an adult
or juvenile facility. Further, because
many students who are incarcerated
never return to the public schools, it is
reasonable to assume that a substantial
percentage have not earned a high
school diploma.
We classified as “incapacitated” any stu-
dent who was deceased or was withdrawn
from school because of mental or physical
illness. In addition, for any student who was
coded in district data as having transferred
to a private school or to another public
school district, we accepted the district’s
designation and classified them as “trans-
fers” in our analyses. In order to get the
best picture of the graduation and dropout
rates among students who were a) without
physical or mental impediments to obtain-
ing schooling and b) not enrolled in anoth-
er high school diploma-granting institution,
we often exclude the “incapacitated” and
“transfer” students from our subsequent
analyses. Each analysis indicates which
students are included.
What Happened to Philadelphia
Students in 2003–2004?
Dropout Rates Using the
Annual Method
In this section, we examine data for the
approximately 130,000 students who
were enrolled in grades 6 through 1210
in Philadelphia public schools, including
charter schools, at any point during the
2003–2004 school year.
From September 2003 through June
2004, 26,224 students left the rolls of
Philadelphia’s public schools.11 Of those
who left, 41% (10,653 students) were
graduating seniors. An additional 27%
transferred to another school or school
district.12 Transferring to another educa-
tional institution was most common in
the middle grades and in 9th grade;
70% of the transfers were in grades 6
through 9 when they left. Less than 15%
of the students who were coded as trans-
ferring were in 11th or 12th grade. About
one-half of one percent of the students
were removed from the rolls for involun-
tary reasons such as illness.
The rest of the school leavers—more than
8,000 students or about 30% of all students
in grade 6 through 12 who left during the
year—exited the district without earning a
diploma or giving any indication that they
were transferring to a private school or
another school district. Some of these
students re-enrolled in the district in a
subsequent school year, but most did not.
There is a great deal to learn about
dropouts simply by looking at descriptive
data from school district records. One
instructive type of information is the partic-
ular explanation (“code”) that the school
provides about why the student is being
removed from the rolls. Of the students
classified as dropouts, less than 5% had
withdrawal codes indicating that the
student had formally withdrawn (e.g.,
“voluntary withdrawal” or “Job Corps”).
Instead, two-thirds of the dropouts had a
code indicating that they were over the
compulsory school age and were being
dropped from the rolls because of non-
attendance. Twenty-two percent of the
dropouts had a code of “whereabouts
unknown,” indicating that they were less
than 17 years old but were not attending
school and could not be located. While
it is possible that the schools tended to
under-use the “voluntary withdrawal”
code, assigning instead the code indicat-
ing non-attendance, it is hard to imagine
why that would be the case. We suggest
that a more logical explanation is that
most dropouts do not announce that
they are leaving school. They simply
stop coming.
When they leave school, most of Philadel-
phia’s dropouts have earned few credits
toward graduation. If the “ungraded”
students are removed from the analysis,13
almost two-thirds of the students who
dropped out were in grade 10 or lower;
about one-third were in grade 9 or lower
(Table 1). It is also worth noting that more
than 500 students in grades 6 through 8
were officially listed as having dropped
out of school, despite being considerably
younger than the legal school-leaving age.

11
At the same time, it is clear that there is no
grade at which high school students are
immune to dropping out. Over one-third of
the students who dropped out were in 11th
or 12th grade. Among students who were
in 11th grade in 2003–2004, 11% dropped
out by the end of the school year. Notably,
8% of the high school seniors dropped
out, when graduation would appear to
be almost within reach.
Because Pennsylvania requires students to
attend school until they reach their 17th
birthday, it is not surprising that about two-
thirds of the students who dropped out
were at least 17 years old at the beginning
of the school year (Table 2). An additional
21% were 16 years old in September 2003
and could have reached their 17th birthday
before June 2004. Fully one-fifth of the
dropouts—about 1,750 students in total,
or enough to fill a medium-sized high
school—were at least 19 years old at the
beginning of the school year. It is also
notable that 15% of those who were offi-
cially listed as having dropped out were
no more than 15 years old. Some of these
younger students ultimately return to
school, and some even graduate, but the
larger point is that students can and do
stop coming to school before they are
legally allowed to do so.
In fact, some students effectively drop out
of school months or even years prior to
being listed as dropouts in school district
records. Dropouts come in two varieties:
the “formal” kind and the “informal”
kind. In addition to the 8,278 students
who officially became dropouts during
the 2003–2004 school year, there were
another 5,188 students who were techni-
cally enrolled but who came to school so
infrequently during the year that they were
more often absent than present. We call
these students the near-dropouts and
define them as students who attended
school less than 50% of the time.14 As was
the case with the formal dropouts, the vast
majority (about 70%) of the near dropouts
were in 9th or 10th grade. But in contrast
to formal dropouts, who tended to be
at least 17 years old, most of the near-
dropouts were 15 years old or younger
at the start of the school year—too young
to drop out of school officially. These
students are an important group for
schools to track and target for interven-
tion. Without a change in their attendance
behavior, they almost certainly become
formal dropouts when they reach the legal
school-leaving age, but until that point,
schools still have enough contact with
many of them that intervention may be
possible to redirect them onto a path
to graduation.
Age Distribution of Dropouts,2003–2004 School Year
Age Percentage
15 years or less 15.02%
16 years 21.4%
17 years 27.1%
18 years 15.3%
19 years or older 21.2%
Total 100%
n=8,278
Table 2
Grade Distribution of OfficialDropouts, 2003–2004 School Year(Ungraded students not included)
Grade Percentage
6th–8th 7.4%
9th 25.1%
10th 31.4%
11th 20.4%
12th 15.7%
Total 100%
n=7,441
Table 1
12
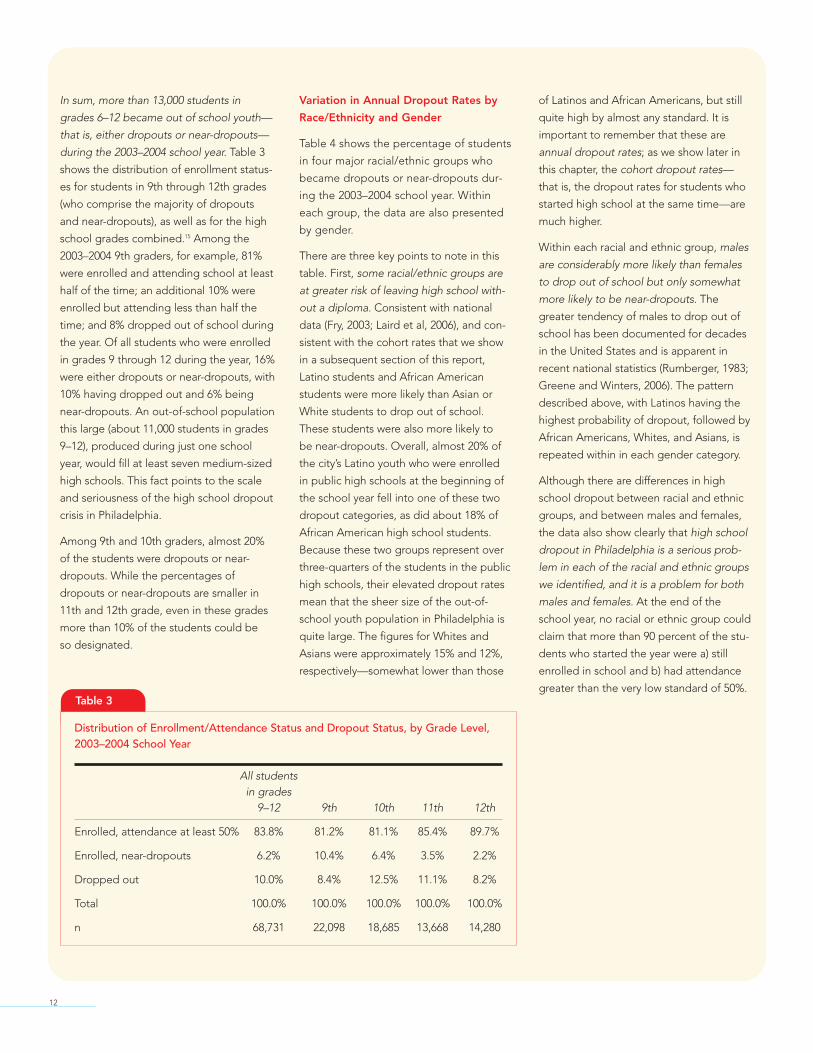
In sum, more than 13,000 students in
grades 6–12 became out of school youth—
that is, either dropouts or near-dropouts—
during the 2003–2004 school year. Table 3
shows the distribution of enrollment status-
es for students in 9th through 12th grades
(who comprise the majority of dropouts
and near-dropouts), as well as for the high
school grades combined.15 Among the
2003–2004 9th graders, for example, 81%
were enrolled and attending school at least
half of the time; an additional 10% were
enrolled but attending less than half the
time; and 8% dropped out of school during
the year. Of all students who were enrolled
in grades 9 through 12 during the year, 16%
were either dropouts or near-dropouts, with
10% having dropped out and 6% being
near-dropouts. An out-of-school population
this large (about 11,000 students in grades
9–12), produced during just one school
year, would fill at least seven medium-sized
high schools. This fact points to the scale
and seriousness of the high school dropout
crisis in Philadelphia.
Among 9th and 10th graders, almost 20%
of the students were dropouts or near-
dropouts. While the percentages of
dropouts or near-dropouts are smaller in
11th and 12th grade, even in these grades
more than 10% of the students could be
so designated.
Variation in Annual Dropout Rates by
Race/Ethnicity and Gender
Table 4 shows the percentage of students
in four major racial/ethnic groups who
became dropouts or near-dropouts dur-
ing the 2003–2004 school year. Within
each group, the data are also presented
by gender.
There are three key points to note in this
table. First, some racial/ethnic groups are
at greater risk of leaving high school with-
out a diploma. Consistent with national
data (Fry, 2003; Laird et al, 2006), and con-
sistent with the cohort rates that we show
in a subsequent section of this report,
Latino students and African American
students were more likely than Asian or
White students to drop out of school.
These students were also more likely to
be near-dropouts. Overall, almost 20% of
the city’s Latino youth who were enrolled
in public high schools at the beginning of
the school year fell into one of these two
dropout categories, as did about 18% of
African American high school students.
Because these two groups represent over
three-quarters of the students in the public
high schools, their elevated dropout rates
mean that the sheer size of the out-of-
school youth population in Philadelphia is
quite large. The figures for Whites and
Asians were approximately 15% and 12%,
respectively—somewhat lower than those
of Latinos and African Americans, but still
quite high by almost any standard. It is
important to remember that these are
annual dropout rates; as we show later in
this chapter, the cohort dropout rates—
that is, the dropout rates for students who
started high school at the same time—are
much higher.
Within each racial and ethnic group, males
are considerably more likely than females
to drop out of school but only somewhat
more likely to be near-dropouts. The
greater tendency of males to drop out of
school has been documented for decades
in the United States and is apparent in
recent national statistics (Rumberger, 1983;
Greene and Winters, 2006). The pattern
described above, with Latinos having the
highest probability of dropout, followed by
African Americans, Whites, and Asians, is
repeated within in each gender category.
Although there are differences in high
school dropout between racial and ethnic
groups, and between males and females,
the data also show clearly that high school
dropout in Philadelphia is a serious prob-
lem in each of the racial and ethnic groups
we identified, and it is a problem for both
males and females. At the end of the
school year, no racial or ethnic group could
claim that more than 90 percent of the stu-
dents who started the year were a) still
enrolled in school and b) had attendance
greater than the very low standard of 50%.
Distribution of Enrollment/Attendance Status and Dropout Status, by Grade Level,2003–2004 School Year
All studentsin grades
9–12 9th 10th 11th 12th
Enrolled, attendance at least 50% 83.8% 81.2% 81.1% 85.4% 89.7%
Enrolled, near-dropouts 6.2% 10.4% 6.4% 3.5% 2.2%
Dropped out 10.0% 8.4% 12.5% 11.1% 8.2%
Total 100.0% 100.0% 100.0% 100.0% 100.0%
n 68,731 22,098 18,685 13,668 14,280
Table 3

13
Table 4
Dropout Rates, by Race/Ethnicity and Gender, 2003–2004 School Year
Race/ethnicity
African American All Students Males Females
Grades 6–12 (n=80,104)
% who became dropouts 7.1% 8.3% 5.6%
Grades 9–12 (n=46,384)
% who became dropouts 11.4% 13.3% 9.4%
% who were near-dropouts 6.3% 6.5% 6.2%
Total % dropouts or near-dropouts 17.7% 19.8% 15.5%
Asian All Students Males Females
Grades 6–12 (n=6,214)
% who became dropouts 4.9% 6.3% 3.5%
Grades 9–12 (n=3,932)a
% who became dropouts 7.3% 9.2% 5.1%
% who were near-dropouts 4.6% 4.8% 4.3%
Total % dropouts or near-dropouts 11.8% 13.9% 9.4%
Latino All Students Males Females
Grades 6–12 (n=15,990)
% who became dropouts 7.1% 8.4% 5.8%
Grades 9–12 (n=8,827)
% who became dropouts 12.1% 14.3% 9.7%
% who were near-dropouts 7.3% 7.6% 7.1%
Total % dropouts or near-dropouts 19.4% 21.8% 16.8%
White All Students Males Females
Grades 6–12 (n=18,107)
% who became dropouts 6.3% 6.9% 5.8%
Grades 9–12 (n=11,077)
% who became dropouts 9.8% 10.7% 8.8%
% who were near-dropouts 4.8% 5.2% 4.3%
Total % dropouts or near-dropouts 14.6% 16% 13.1%

14
School Type and Dropout
Among students in grades 9 through 12,
dropouts and near-dropouts are much
more likely to be found in the city’s neigh-
borhood high schools and disciplinary
schools than in special admissions (“mag-
net”) schools or vocational schools. Table
5 shows the breakdown by school type for
students who were in grades 9 through
12 (or who were classified as “ungraded”)
during the 2003–2004 school year and who
attended neighborhood, vocational, special
admissions, or disciplinary schools.
Table 5, in and of itself, is evidence neither
for censure nor compliment for any partic-
ular school type. It certainly may be the
case that some schools or types of schools,
because of their size, mission, or dysfunc-
tional climate, are extremely good at pro-
ducing high school dropouts. At the same
time, some types of schools are able to
avoid dropout-prone students by screen-
ing applicants carefully before offering
admission or by “returning” students to
their neighborhood high schools when
they under-perform; this is certainly true of
the special admissions high schools such
as Central or Girls. Further, the neighbor-
hood high schools that serve students
not admitted to the special admissions
or vocational schools may simply be over-
whelmed by the magnitude of the aca-
demic and personal challenges that these
students bring with them. A study of the
effectiveness of certain schools or school
types at promoting graduation and dis-
couraging dropout would require a sophis-
ticated analysis with careful controls that is
beyond the scope of this report.
Of all of the school types, special admis-
sions schools have the lowest percentage
of students who leave high school without
graduating. Vocational schools also have a
relatively low percentage of students who
are dropouts or near dropouts. On aver-
age, neighborhood high schools—that
is, large comprehensive high schools
that serve primarily students from their
surrounding geographic areas—had
about 13% of their students drop out in
2003–2004. An additional 8% of students
at neighborhood high schools were near-
dropouts. In total, then, about one-fifth
of the students at neighborhood high
schools who were enrolled at any point
in the 2003–2004 school year did not
attend school on a regular basis.
Disciplinary schools—that is, schools that
serve students who have been involved
with the justice system or who need spe-
cial assistance to work on their behavior—
had the highest annual dropout rate of
any of the school types. Given the serious
challenges that students at disciplinary
schools face, it is not surprising that the
dropout rates at these schools are higher
than at the other school types. But because
the mission of these schools is to educate
effectively some of the school district’s
most challenging students, the extremely
high dropout rates in the disciplinary
schools is also cause for concern. Thirty-
six percent of the students at disciplinary
schools became dropouts during the year,
and an additional 9% were near-dropouts.
As we show in Chapter 2, the high annual
dropout rate for these students—70%
of whom are male, and 90% of whom are
minority—contributes to a cohort dropout
rate in disciplinary schools that is very
close to 100%.
Annual Dropout Rates, by School Type, for Students in Grades 9–12 (and Ungraded),2003–2004 School Year
High School Type
SpecialAdmissions(“Magnet”) Vocational Neighborhood Disciplinary
% who became dropouts 0.7% 2.9% 12.8% 36.1%
% who were near-dropouts 0.4% 2.0% 8.3% 9.1%
Total % dropouts ornear-dropouts 1.1% 4.8% 21.1% 45.2%
Total n (all students) 6,573 4,836 43,810 4,143
Table 5

Table 6 provides another perspective on
the types of high schools with the most
severe dropout and near-dropout prob-
lems. While none of Philadelphia’s public
high schools can be described as serving
an affluent student population, Table 6
shows that schools with the highest con-
centrations of low income students also
have the highest percentages of students
who have dropped out of school or who
attend infrequently. Among schools serv-
ing a student population with a moderate
degree of poverty (less than 40% low
income students16), 10% of the students
became dropouts or near dropouts, while
at the schools serving a very high poverty
population (75% or more low income stu-
dents), more than one-quarter of the stu-
dents were dropouts or near-dropouts.
Although these very high poverty schools
(24 in all) serve half of the city’s 9 through
12 graders, they contribute 71% of the
dropouts and 66% of the near-dropouts.
Annual Dropout Rates by
Neighborhood
To some extent, nearly every neighbor-
hood in Philadelphia experiences the
problem of their young residents becom-
ing dropouts or near-dropouts. Figure 1
shows that neighborhoods in which more
than 15% of high school students were
official dropouts or near-dropouts are
clustered primarily in South Philadelphia,
Southwest Philadelphia, North Philadel-
phia, and some areas of West Philadelphia.
In most of Center City and neighborhoods
like Wynnefield, Germantown, Frankford,
Olney, and Mayfair, the percentage of
students who are official dropouts or
near-dropouts ranges from 10% to 15%.
The northeast and northwestern areas of
the city have the lowest percentages of
students that are official or near-dropouts
(generally below 10%). It is important to
note that, despite neighborhood differ-
ences in the severity of the dropout crisis,
at least 10% of students in nearly every
neighborhood in Philadelphia are dropouts
or near-dropouts.
15
Table 6
Annual Dropout Rates, by School Percent Low Income, for Students in Grades 9–12(and Ungraded), 2003–2004 School Year
Moderate Poverty High Poverty Very High PovertyLess than 40% low low 40%–74% low 75% or more lowincome students income students income students
% who becamedropouts 5.9% 8.9% 16.8%
% who werenear-dropouts 4.2% 5.6% 8.9%
Total % dropoutsor near-dropouts 10.0% 14.6% 25.7%
Number of schools inthis income category 13 8 24
Number of studentsat these schools 17,563 10,842 29,630

16
Figure 1
Percent of Students in Grades 9–12 (and Ungraded) Who Were Dropouts
or Near Dropouts by Neighborhood, 2003–2004
Eastwick
Marconi Plaza
RichmondWynnefield
Elmwood
Tacony
TiogaFrankford
Overbrook
Pennsport
Kingsessing
Girard Estates
Fishtown
Hunting Park
Fairhill
East Falls
Belmont
Bridesburg
Grays Ferry
CobbsCreek
Byberry
Somerton
Roxborough
Bustleton
Holmesburg
West Torresdale
Lawncrest
Pennypack
Olney
Chestnut Hill
Mayfair
Rhawnhurst
Fox Chase
Oxford Circle
Logan
Poplar
WissahickonPark
Pennypack Park
JuniataPark
OgontzW. Mount Airy
Mill Creek
West Oak Lane
Germantown
StrawberryMansion
AlleghenyWest
EastGermantown
UniversityCity
Wharton
Fairmount
Riverfront
E. Mount Airy
Kensington
NorthCentral
East Oak Lane
Haddington
Hartranft
Manayunk
CenterCity East
Cedarbrook
PointBreeze
Schuylkill
CenterCity West
Powelton
CedarPark
Harrowgate
WestKensington
Brewerytown
SouthPhila. 6% to 10%
Legend
1% to 5%
11% to 15%
16% to 20%
21% to 25%
N/A
0 1 20.5Miles

17
Trends in Cohort Graduation
and Dropout Rates:
The Classes of 2000 Through 2005
Much of the debate among policymakers
and researchers focuses on how best to
estimate a cohort graduation rate (for a
discussion of these debates and methods,
see Appendix 2). Cohort graduation rates
enable us to determine the percentage
of students in a given group—for example,
all students who started high school in a
particular year—who have earned a high
school diploma within a specified period
of time (for example, within four years or
five years of entering 9th grade).
For this analysis, we consider only students
attending non-charter public high schools
and examine trends in Philadelphia’s cohort
graduation rates in two different ways.17
First, we consider just students whom
we know to be first-time freshmen (that
is, we can observe that they were in
8th grade in the Philadelphia public
schools in one year and in 9th grade
in Philadelphia during the next year).
We then determine the percentage of
these students who graduated from
the Philadelphia public schools within
four years, five years, and/or six years
of starting high school, depending on
how many years of data are available
for the cohort. We call the cohorts we
construct in this way the first-time
freshman cohorts.
Second, we conduct a set of comparison
analyses in which we define the freshman
class as any 9th grader not known to be
a repeater—that is, not known to have
been in 9th grade previously—as well as
any new student entering the Philadel-
phia public schools in subsequent years
who was in an on-track grade. For exam-
ple, the Class of 2001 analysis includes
any 9th grader not known to be a 9th
grade repeater in 1997–1998; any 10th
grader transferring into the district dur-
ing 1998–1999; any 11th grader transfer-
ring into the district in 1999–2000; and
any 12th grader entering in 2000–2001.
While it is possible that we have cap-
tured in this set of cohorts students who
are repeater 9th graders transferring
into the district, or students in the upper
grades who were already off-track to fin-
ish high school in four years when they
entered the district, the advantage of
this type of analysis is a broader picture
of all of the high school students in
Philadelphia, including transfers. We
refer to the cohorts in this second analy-
sis as the freshmen and transfer cohorts.
The First-Time Freshman Cohorts
Four years after beginning high school, the
majority of Philadelphia’s first-time fresh-
men were no longer enrolled in the city’s
public schools. Figure 2 shows the educa-
tional status of first-time freshmen in six
cohorts, four years after entering high
school.18 In each of the cohorts, approxi-
mately 10% of the students were listed in
school district records as transferring to a
private school or to another school dis-
trict.19 Between 12% and 20% of the cohorts
remained enrolled in the public schools at
the end of four years (that is, technically still
trying to earn a high school diploma), and
as we show later, some of those students
are able to graduate in subsequent years.
Among all students who began 9th grade
together (including those who ultimately
transferred to other schools), between 41%
and 46% graduated from a Philadelphia
public high school four years later. Likewise,
27% to 35% of the students had dropped
out within four years of starting high
school. There are no strong trends in the
data, with the possible exception of the
increase in students transferring to other
Status of First-Time Freshman Cohorts, Four Years Later
50%
40%
30%
20%
10%
0%Class of 2000
Graduated
Class of 2001 Class of 2002 Class of 2003 Class of 2004 Class of 2005
Dropped Out Enrolled Transfer
Figure 2*
*Graduation rates for the Class of 2004 are estimated. See Footnote 18.

18
schools, perhaps as a result of the increase
in the number of charter high school
options.20 The highest on-time graduation
rate is for the Class of 2005. At 46%, it is
about 3 percentage points greater than the
average for the preceding five years.
Figure 3 shows the on-time, five-year, and
six-year graduation rates for students who
did not transfer to other districts or to pri-
vate schools or who were not removed
from the system due to death or serious
illness. For the four cohorts for which we
have six-year graduation data, the percent-
age of students earning a high school
diploma ranges from 54% to 58%. The
percentage of students who had earned
diplomas by the six-year mark is higher
than the four-year percentage by about 8
percentage points to 10 percentage points.
Generally, the increase from the four-year
to the five-year graduation rate is greater
than that from the five-year to the six-year
rate. After six years in high school, while
some students continue to earn diplomas,
the probability of graduating is very low.
The Class of 2005—the most recent cohort
for which we have data—is the only first-
time freshman cohort in our analysis in which
at least 50% of the students graduated in
four years. Their on-time graduation rate
(52.4%) is about four percentage points
higher than the average for the preceding
four cohorts. As Figure 4 shows, this gain in
graduation rates occurred across magnet,
vocational, and neighborhood high schools.21
Vocational high schools saw the greatest
upswing, and magnet high schools crossed
the 90% threshold for the first time in the
years for which we have data. Notably, even
with a small gain, the on-time graduation
rate in Philadelphia’s neighborhood high
schools remained below 50%.
Among recent cohorts, the Class of 2005 is
tied for the highest percentage of students
listed as transferring out of the district to
other schools, and it also has the fewest
students still enrolled in school at the end
of four years. Thus, it is possible that the
gains in the four-year graduation rate could
reflect a higher percentage of students
graduating on time, rather than improve-
ments in the total number of students who
will graduate within six years; it will be
important to see whether the gains in the
on-time graduation rate carry over to its
five- and six-year graduation rates. Further,
graduation rates generally fluctuate some-
what from year to year, so it will be impor-
tant to see whether the Class of 2006 is
able to continue the higher graduation
rate of the previous cohort.
It is important to celebrate small success-
es, such as the higher on-time graduation
rate for the Class of 2005—after all, it is
very difficult to change large institutions
like public school districts and to create
the social conditions in families and com-
munities that encourage students to stay
in school. At the same time, it is also nec-
essary to face just how far Philadelphia has
to go. A six-year graduation rate of 58%
(as was the case for the Class of 2003)
means that 42% of the class had not yet
graduated and probably would not gradu-
ate from Philadelphia’s public schools.
Put differently, about 5,000 Philadelphia
students from the Class of 2003 alone
embarked on adulthood without the mini-
mal academic credential of a high school
diploma. If we include all of the students
from the Classes of 2000 through 2005,
about 30,000 students who began 9th
grade in Philadelphia’s public high schools
dropped out without earning a diploma.
Percentage of Students Graduating in Four, Five, or Six Years for Six Cohorts
of First-Time Ninth Graders
80%
60%
40%
20%
0%Class of 2000 Class of 2001 Class of 2002 Class of 2003 Class of 2004 Class of 2005
4 years 5 years 6 years
Figure 3*
*Graduation rates for the Class of 2004 are estimated. See Footnote 18.

19
The Freshmen and Transfer Cohorts
The first-time freshman cohorts that we
describe above and that we primarily focus
on in this report include only students who
attended 8th grade in the Philadelphia
public schools and who were promoted to
9th grade. As a result, these cohorts do not
include students who transferred into the
Philadelphia public schools in 9th grade
or later. One advantage of using first-time
freshman cohorts is that we have informa-
tion on attendance and academic achieve-
ment in the middle grades that we can use
in an analysis of the predictors of dropout
(see Chapter 2). However, a disadvantage
of defining the cohort in this way is that we
exclude some students who entered the
School District of Philadelphia after 8th
grade and spent their entire high school
careers in the public schools, for example,
students who transferred into the public
school system to attend special admissions
schools like Central or Girls.
The freshmen and transfer cohorts that we
examine below include any 9th grade stu-
dent not known to be a 9th grade repeater
(and therefore assumed to be a first-time
freshman) and any student transferring into
the district in a grade that would make him
or her on-time to graduate. Table 7 shows
the on-time, five-year, and six-year gradua-
tion rates for these freshmen and transfer
cohorts, with the first-time freshman
cohorts for comparison.
First-Time Freshman Four-Year Graduation Rates by School
100%
90%
80%
70%
60%
50%
40%
30%Class of 2001 Class of 2002 Class of 2003 Class of 2004 Class of 2005
4Ye
ar G
rad
uatio
n R
ate
Neighborhood Schools Vocational Schools Magnet Schools
Figure 4*
*Graduation rates for the Class of 2004 are estimated. See Footnote 18.

20
In all cases, the graduation rates for the
freshmen and transfer cohorts are three to
four percentage points lower than those
for the first-time freshman cohorts. A full
analysis of what drives the differences in
these rates is beyond the scope of this
report. However, some part of the explana-
tion may lie in the fact that the freshmen
and transfer cohorts are numerically domi-
nated by students who transfer into the
district’s neighborhood high schools. Many
of these students who transfer into the
district are 9th graders, but substantial
numbers of the transfers are in the upper
grades. We do not have access to data on
the academic histories of these students
prior to their entry into the Philadelphia
public schools, however, we can observe
that they have lower graduation rates than
students at neighborhood high schools
who did not transfer into the district after
8th grade. It is possible that many of the
“transfer-in” students experienced aca-
demic difficulty at their prior high schools
and transferred to Philadelphia public
schools for a second chance.
Most importantly, what we learn from a
comparison of these different ways of
defining cohorts is that the graduation
rates are not radically different. The rates
are within a few percentage points of
each other. Therefore, in the following
sections of this chapter, we will continue
to base our analyses on the first-time
freshman cohorts for consistency. Further,
our analysis of the predictors of dropping
out, presented in the next chapter,
requires that we have data on students
prior to entering high school.
Table 7*
Cohort Graduation Rates Calculated in Two Ways
Freshmen and Transfer Cohorts First-Time Freshman Cohorts
On-time 5-year 6-year Total n On-time 5-year 6-yeargraduation graduation graduation for graduation graduation graduation
Class of rate rate rate cohort rate rate rate
2001 50.7% 58.7% 61.0% 20,706 47.9% 55.8% 57.8%
2002 49.3% 59.1% 61.4% 20,986 44.2% 53.6% 55.9%
2003 53.8% 62.1% 63.0% 21,029 48.3% 55.7% 57.9%
2004 48.0% 56.7% n/a 22,382 42.9% 50.9% n/a
2005 54.0% n/a n/a 22,068 52.3% n/a n/a
*Graduation rates for the Class of 2004 are estimated. See Footnote 18.
21
Trends in the “Graduation Gap”:
Cohort Graduation Rates by
Gender and Race/Ethnicity
for First-Time Freshman Cohorts
Gender
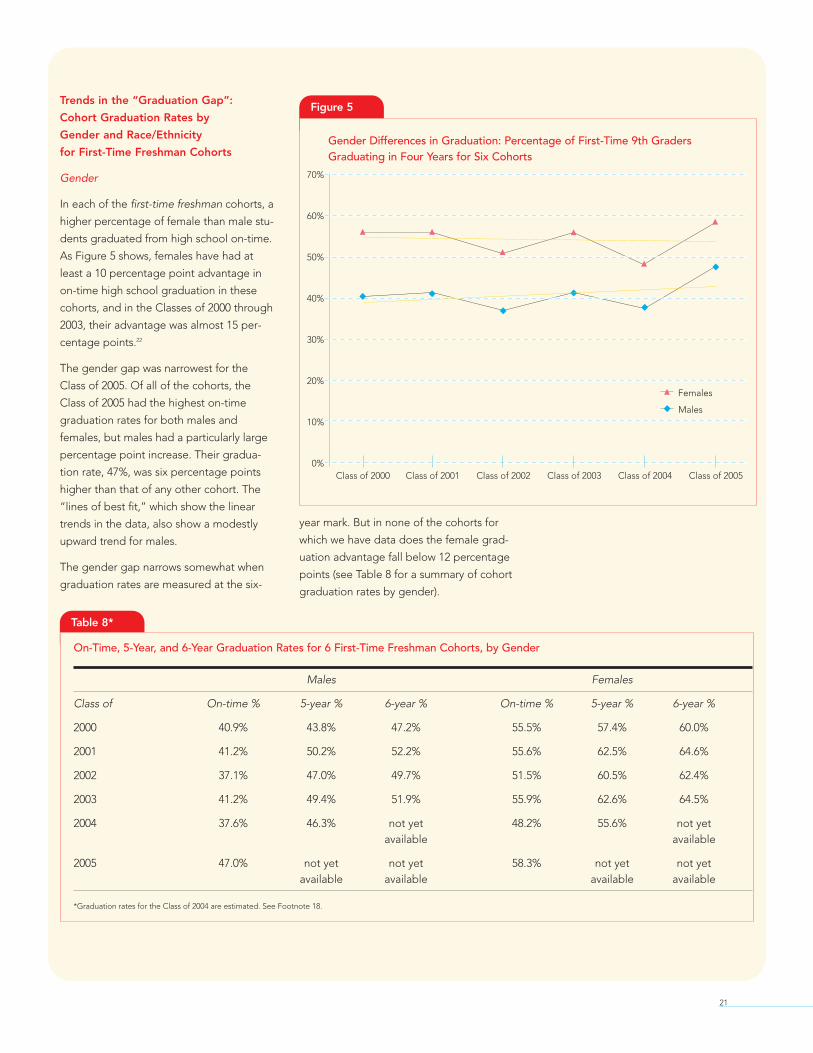
In each of the first-time freshman cohorts, a
higher percentage of female than male stu-
dents graduated from high school on-time.
As Figure 5 shows, females have had at
least a 10 percentage point advantage in
on-time high school graduation in these
cohorts, and in the Classes of 2000 through
2003, their advantage was almost 15 per-
centage points.22
The gender gap was narrowest for the
Class of 2005. Of all of the cohorts, the
Class of 2005 had the highest on-time
graduation rates for both males and
females, but males had a particularly large
percentage point increase. Their gradua-
tion rate, 47%, was six percentage points
higher than that of any other cohort. The
“lines of best fit,” which show the linear
trends in the data, also show a modestly
upward trend for males.
The gender gap narrows somewhat when
graduation rates are measured at the six-
year mark. But in none of the cohorts for
which we have data does the female grad-
uation advantage fall below 12 percentage
points (see Table 8 for a summary of cohort
graduation rates by gender).
Table 8*
On-Time, 5-Year, and 6-Year Graduation Rates for 6 First-Time Freshman Cohorts, by Gender
Males Females
Class of On-time % 5-year % 6-year % On-time % 5-year % 6-year %
2000 40.9% 43.8% 47.2% 55.5% 57.4% 60.0%
2001 41.2% 50.2% 52.2% 55.6% 62.5% 64.6%
2002 37.1% 47.0% 49.7% 51.5% 60.5% 62.4%
2003 41.2% 49.4% 51.9% 55.9% 62.6% 64.5%
2004 37.6% 46.3% not yet 48.2% 55.6% not yetavailable available
2005 47.0% not yet not yet 58.3% not yet not yetavailable available available available
*Graduation rates for the Class of 2004 are estimated. See Footnote 18.
Gender Differences in Graduation: Percentage of First-Time 9th GradersGraduating in Four Years for Six Cohorts
70%
60%
50%
40%
30%
20%
10%
0%Class of 2000 Class of 2001 Class of 2002 Class of 2003 Class of 2004 Class of 2005
Males
Females
Figure 5

22
Race and ethnicity variation
In the six first-time freshman cohorts for
which we have data, not a single racial or
ethnic group had an on-time graduation
rate greater than 71%. Consistent with
the annual dropout rate for 2003–2004,
Asian students were most likely to graduate
on-time, followed by Whites, African
Americans, and Latinos. Figure 6 breaks
down the on-time graduation rates by
race or ethnicity, for six cohorts of first-time
freshmen. The figure also includes the
linear trend for each group.
A shorthand description of the on-time
graduation rates prior to the Class of 2005 is
that Asian graduation rates tended to
be in the 60-percent range; White rates
were in the 50-percent range; African
American rates were in the 40-percent
range; and Latino rates were in the high
30-percent and low 40-percent range. The
linear trend for the six cohorts is modestly
upward for Asian, African American, and
Latino students, driven primarily by the
sharp increase in on-time graduation rates
for the Class of 2005. African Americans
in the Class of 2005, in particular, experi-
enced a substantial increase in on-time
graduation rates, breaking the 50% mark for
the first time in the six cohorts for which we
have data. The trend for Latino students has
been very modestly upward. While gradua-
tion rates for Whites show some year-to-
year variation, the on-time graduation
trend for this group is approximately flat.
Driven by the increase in African American
and Latino graduation rates, the on-time
graduation gap between White students
and these two groups was narrower for the
more recent cohorts than for the earlier
cohorts. In fact, on-time graduation rates
for Whites and African Americans in the
Class of 2005 were within two percentage
points of each other. However, the sharp
increase in the percentage of Asian
students graduating on-time in the Class of
2005 meant that the gap between Asians
and other racial or ethnic groups was wider
at the end of the time period under consid-
eration than at the beginning. As Figure 6
shows, on-time graduation rates bounce
around from year to year, and it may be
the case that the gap has narrowed again
for the Class of 2006.
On-Time Graduation Rates for Males in Six Cohorts:Percentages by Race/Ethnicity
80%
70%
60%
50%
40%
30%
20%Class of 2000
Asian
Class of 2001 Class of 2002 Class of 2003 Class of 2004 Class of 2005
White African American Latino
Figure 6*
*Graduation rates for the Class of 2004 are estimated. See Footnote 18.
23
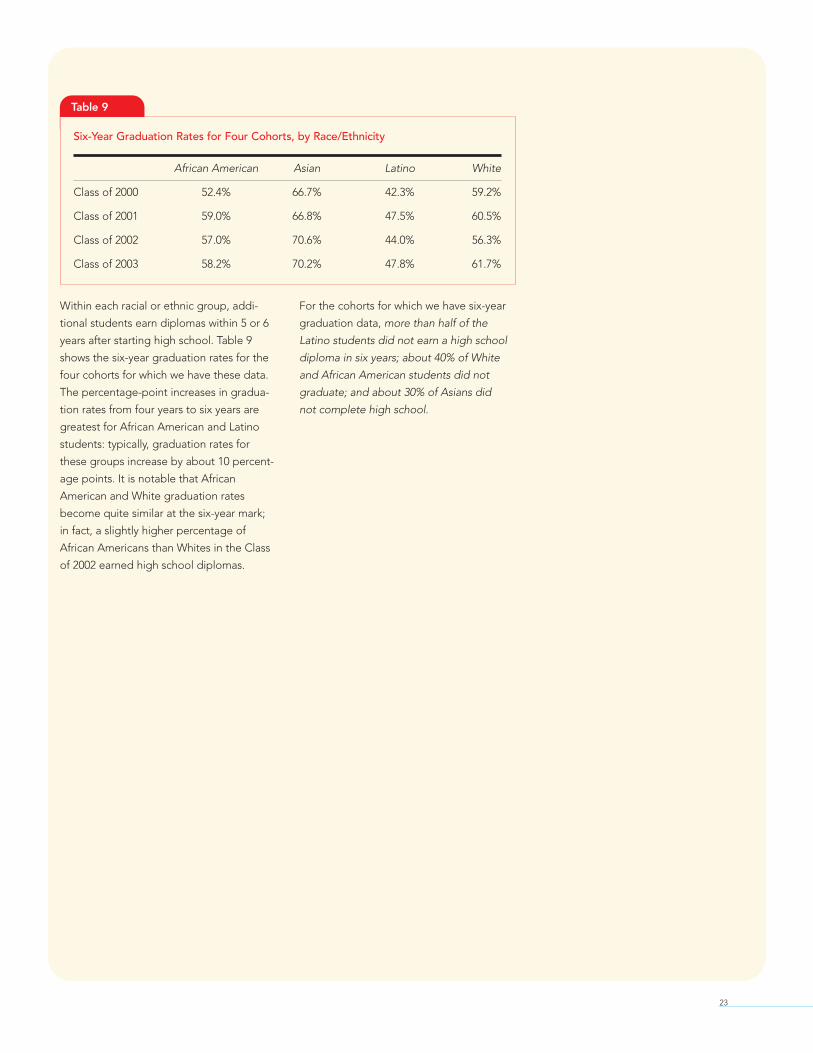
Within each racial or ethnic group, addi-
tional students earn diplomas within 5 or 6
years after starting high school. Table 9
shows the six-year graduation rates for the
four cohorts for which we have these data.
The percentage-point increases in gradua-
tion rates from four years to six years are
greatest for African American and Latino
students: typically, graduation rates for
these groups increase by about 10 percent-
age points. It is notable that African
American and White graduation rates
become quite similar at the six-year mark;
in fact, a slightly higher percentage of
African Americans than Whites in the Class
of 2002 earned high school diplomas.
For the cohorts for which we have six-year
graduation data, more than half of the
Latino students did not earn a high school
diploma in six years; about 40% of White
and African American students did not
graduate; and about 30% of Asians did
not complete high school.
Table 9
Six-Year Graduation Rates for Four Cohorts, by Race/Ethnicity
African American Asian Latino White
Class of 2000 52.4% 66.7% 42.3% 59.2%
Class of 2001 59.0% 66.8% 47.5% 60.5%
Class of 2002 57.0% 70.6% 44.0% 56.3%
Class of 2003 58.2% 70.2% 47.8% 61.7%

24
The intersection of race/ethnicity
and gender
In the six first-time freshman cohorts for
which we have on-time graduation data,
the linear trend in on-time graduation has
been modestly upward for males in each
of the four racial/ethnic groups we examine
even though the on-time graduation rate
for Latino males declined somewhat from
2004 to 2005. Figure 7 shows that on-time
graduation rates for Asian males moved
from 56% for the Class of 2000 to 62% for
the Class of 2005; for African American
males, the comparable figures are 38%
and 47%; and for Latino males, 31% and
37%. The trend for White males, although
slightly positive, is flatter than for other
groups, with 51% graduating on-time in
2000 and 52% in 2005.
For females, the graduation trends are
flatter than those for males, with the excep-
tion of Asian females, who widened their
already considerable advantage during
the period from 2000 to 2005 (Figure 8).
On-Time Graduation Rates for Males in Six Cohorts: Percentages by Race/Ethnicity
80%
70%
60%
50%
40%
30%
20%Class of 2000 Class of 2001 Class of 2002 Class of 2003 Class of 2004 Class of 2005
Asian White African American Latino
Figure 7*
*Graduation rates for the Class of 2004 are estimated. See Footnote 18.
On-Time Graduation Rates for Females in Six Cohorts: Percentages by Race/Ethnicity
80%
70%
60%
50%
40%
30%
20%Class of 2000 Class of 2001 Class of 2002 Class of 2003 Class of 2004 Class of 2005
Asian White African American Latina
Figure 8*
*Graduation rates for the Class of 2004 are estimated. See Footnote 18.
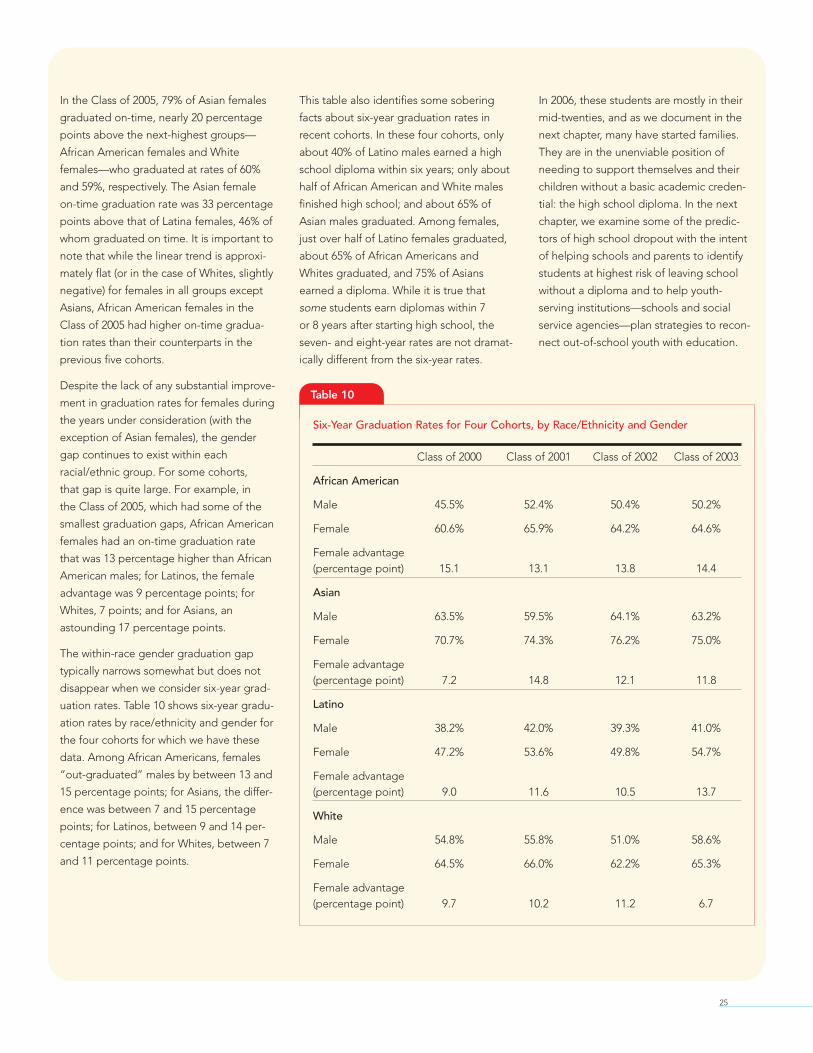
In the Class of 2005, 79% of Asian females
graduated on-time, nearly 20 percentage
points above the next-highest groups—
African American females and White
females—who graduated at rates of 60%
and 59%, respectively. The Asian female
on-time graduation rate was 33 percentage
points above that of Latina females, 46% of
whom graduated on time. It is important to
note that while the linear trend is approxi-
mately flat (or in the case of Whites, slightly
negative) for females in all groups except
Asians, African American females in the
Class of 2005 had higher on-time gradua-
tion rates than their counterparts in the
previous five cohorts.
Despite the lack of any substantial improve-
ment in graduation rates for females during
the years under consideration (with the
exception of Asian females), the gender
gap continues to exist within each
racial/ethnic group. For some cohorts,
that gap is quite large. For example, in
the Class of 2005, which had some of the
smallest graduation gaps, African American
females had an on-time graduation rate
that was 13 percentage higher than African
American males; for Latinos, the female
advantage was 9 percentage points; for
Whites, 7 points; and for Asians, an
astounding 17 percentage points.
The within-race gender graduation gap
typically narrows somewhat but does not
disappear when we consider six-year grad-
uation rates. Table 10 shows six-year gradu-
ation rates by race/ethnicity and gender for
the four cohorts for which we have these
data. Among African Americans, females
“out-graduated” males by between 13 and
15 percentage points; for Asians, the differ-
ence was between 7 and 15 percentage
points; for Latinos, between 9 and 14 per-
centage points; and for Whites, between 7
and 11 percentage points.
This table also identifies some sobering
facts about six-year graduation rates in
recent cohorts. In these four cohorts, only
about 40% of Latino males earned a high
school diploma within six years; only about
half of African American and White males
finished high school; and about 65% of
Asian males graduated. Among females,
just over half of Latino females graduated,
about 65% of African Americans and
Whites graduated, and 75% of Asians
earned a diploma. While it is true that
some students earn diplomas within 7
or 8 years after starting high school, the
seven- and eight-year rates are not dramat-
ically different from the six-year rates.
In 2006, these students are mostly in their
mid-twenties, and as we document in the
next chapter, many have started families.
They are in the unenviable position of
needing to support themselves and their
children without a basic academic creden-
tial: the high school diploma. In the next
chapter, we examine some of the predic-
tors of high school dropout with the intent
of helping schools and parents to identify
students at highest risk of leaving school
without a diploma and to help youth-
serving institutions—schools and social
service agencies—plan strategies to recon-
nect out-of-school youth with education.
25
Table 10
Six-Year Graduation Rates for Four Cohorts, by Race/Ethnicity and Gender
Class of 2000 Class of 2001 Class of 2002 Class of 2003
African American
Male 45.5% 52.4% 50.4% 50.2%
Female 60.6% 65.9% 64.2% 64.6%
Female advantage(percentage point) 15.1 13.1 13.8 14.4
Asian
Male 63.5% 59.5% 64.1% 63.2%
Female 70.7% 74.3% 76.2% 75.0%
Female advantage(percentage point) 7.2 14.8 12.1 11.8
Latino
Male 38.2% 42.0% 39.3% 41.0%
Female 47.2% 53.6% 49.8% 54.7%
Female advantage(percentage point) 9.0 11.6 10.5 13.7
White
Male 54.8% 55.8% 51.0% 58.6%
Female 64.5% 66.0% 62.2% 65.3%
Female advantage(percentage point) 9.7 10.2 11.2 6.7

26
ver the past several decades,
scholars have developed a large
body of literature identifying
predictors of dropping out of high school.
Many of the predictors have been demon-
strated so often, in so many different
studies, that they are widely considered
to be settled findings. For example, it
is well-known that, in the United States,
males, lower-income students, members
of racial or ethnic minority groups, those
with lower academic achievement, and
students who are older than the typical
student in their grade (usually the result
of being held back in elementary school)
are more likely than students without
these characteristics to leave high school
without graduating (Rumberger, 2004).
There is also a general consensus among
scholars that dropping out of school is the
culmination of a process of disengaging
from the academic or social aspects of
school, or both; students who ultimately
drop out tend to give “warning signals,”
such as attending school less frequently
or letting their grades slip (Finn, 1989;
Newmann et al., 1992; Wehlage et al.,
1989). Finally, there is growing evidence
that many dropouts can be identified prior
to entering high school (Alexander et al.,
1997) and that the rocky transition to 9th
grade often aggravates academic prob-
lems that students have been accumulat-
ing over their school years (Roderick and
Camburn, 1999).
In this report, we take a slightly different
approach, examining factors that are know-
able about students by school personnel or
by staff at social service agencies. These
factors could be used to identify students
who are at greatest risk of dropping out
based on what happened to similar stu-
dents in earlier cohorts. The variables that
we examine are gleaned from student
records kept by the public schools and the
social service agencies with which some of
the students are involved.
The Hazard of Dropping Out Within
Eight Years of Starting High School
To understand who does not graduate, we
employ an analytical method known as haz-
ard analysis. The idea behind this type of
analysis is simple: given that a student has
reached a certain point in his or her educa-
tion, we ask what the probability (“hazard”)
is of not graduating. Specifically, we ask
the following questions:
What is the probability of not graduating,
given that:
u A student is a first-time freshman?
u A student has reached 10th grade?
u A student has reached 11th grade?
u A student has reached 12th grade?
In this case, it is important to note that
when we say “10th grade,” we do not
mean simply “the second year in which
a student is enrolled in high school.”
Rather, we refer to those students who
have earned enough credits to be
classified by their school as 10th graders.
This type of analysis is important for a bet-
ter understanding of who drops out and
why they drop out because although the
majority of students who drop out of high
school do so when they are still in 9th or
10th grade, there is a substantial subgroup
of students who leave school in 11th or
12th grade, when graduation would seem
to be around the corner. Our motivation
in examining students who drop out at dif-
ferent points in their high school careers
is to see whether there are distinct differ-
ences between “early-grade leavers” and
“late-grade leavers.” From a policy and
intervention point-of-view, such information
is critical to tailoring programs that will
serve students’ unique needs. A student
who leaves school at age 17 with almost
no credits toward graduation will need a
different sort of program that will enable
him or her to earn a high school diploma
from a student who leaves at the same
age lacking just a few credits.
For simplicity’s sake, we use only the first-
time freshman Class of 2000 in this analysis.
Further, we use an eight-year dropout rate
rather than a six-year rate; by the end of
eight years after starting high school,
almost every student has exited the district
in one way or another. We have no reason
to believe that the general patterns and
relationships observed in the Class of 2000
data would be appreciably different for any
of the other cohorts for which we have data
(even though the overall levels of graduat-
ing or dropping out may be different, as
Chapter 1 demonstrates).
CHAPTER 2: Who Does Not Graduate from High School? The First-Time Freshman Class of 2000

27
Without question, the probability of
dropping out of school is greatest for 9th
graders. Figure 9 plots two hazard func-
tions. The first, represented by the dashed
line, indicates the probability of dropping
out for a student who was ever promoted
to a particular grade—that is, he was ever
that grade regardless of how many years
it took him to get there. The second,
represented by the solid line, indicates
the probability of dropping out for a
student who arrived at 10th, 11th, or
12th grade on-time—that is, a student
who never spent more than one year
in 9th, 10th, or 11th grade. Because our
cohort is defined as all identifiable first-
time 9th graders, all students have, by this
definition, arrived at 9th grade on time.
For example, of the 13,393 members of the
Class of 2000 who did not transfer out of
the district or exit the cohort through death
or illness, 8,674 (or 65%) were promoted
to 10th grade on time. Of these 8,674
students, 2,183 dropped out, yielding a
hazard probability of .25 (2183/8674). Not
all of the students who made it to 10th
grade on time subsequently were promot-
ed to 11th grade on time; in fact, only
7,118 did. This 11th grade group had
a hazard probability of .13 (946/7118).
As Figure 9 shows, the probability of drop-
ping out of school decreases with each
grade. For 9th graders, the hazard rate was
.45 (the same as the 8-year dropout rate);
for students in the cohort who ever were
promoted to 10th grade, the rate was .34;
for those who made it to 11th grade, .23;
and for those who got to 12th, the rate was
.16—about one-third the rate of the 9th
grade group. For those who arrived at the
upper grades on time, the hazard rates
were lower: .25 for 10th, .13 for 11th, and
.08 for 12th. The on-time hazard rates are
lower because students who arrive at a
grade on time are a more academically
select group than those who take at least
one more year to arrive at the same grade.
While the probability of dropout decreas-
es in the upper high school grades, it
does not go away entirely. Among those
who were ever promoted to 11th grade,
for example, almost one-quarter left
school without a diploma. And among
those who became 12th graders—within a
few credits of graduation—16% dropped
out of school. These data remind us that
schools, parents, and youth-serving agen-
cies need to be vigilant about keeping
students on-track to graduation regard-
less of their grade.
The Hazard of Dropping Out: Two Hazard Functions for the Class of 2000
0.50
0.40
0.30
0.20
0.10
0.009th Grade
Haz
ard
10th Grade 11th Grade 12th Grade
On-TimeEver
Figure 9

28
Identifying Students at Highest Risk
of Dropping Out
Forty-five percent of the first-time 9th
graders dropped out of school but, of
course, 55% did not. Which factors height-
en the probability that a first-time 9th grad-
er ultimately will drop out of high school?
In this analysis, we examine the predictive
power of factors that are known—or could
be known—by school and agency person-
nel, as well as by parents. We begin by
examining information that is knowable
about students when they are in 8th grade:
school attendance, report card grades, test
scores, age, and demographic factors such
as gender and race/ethnicity. We continue
by assessing which factors among 9th
graders and upperclassmen are most pre-
dictive of dropout. We do not argue that
these particular variables are the “root
causes” of dropout, which involve complex
issues related to the student’s academic
history, family and school environment,
community factors, and individual personal-
ity. For example, “poor grades” is a factor
that may be directly linked to dropping
out of school; researchers sometimes call
these kinds of factors proximal variables.
But the “root cause,” which produces
the low grades, may be more distal—for
example, an undiagnosed learning disabili-
ty or a family situation that makes it difficult
for a child to concentrate on schoolwork.
Proximal factors are relevant to our analysis,
however, because they serve as signals that
a child has a heightened probability of
leaving high school without a diploma.
Which 8th grade factors are strong
predictors of dropout?
For this analysis, we examine 8th grade
data for our entire first-time freshman
cohort that made up the Class of 2000; by
definition, these students had attended
Philadelphia public schools during the
1995–1996 school year. Eighth graders in
this cohort who had lower attendance,
weaker test scores, who failed core aca-
demic courses, were overage for their
grade, and/or who were male were more
likely to drop out of school. Each of these
factors exerted a statistically independent
effect on the odds of dropping out. How-
ever, while each of these factors contri-
buted something (in a statistical sense)
to dropping out, we were most interested
in factors that were strongly predictive of
dropping out.
We identified two factors from 8th grade
that gave students at least a 75% proba-
bility of dropping out of school: 1) attend-
ing school less than 80% of the time in
8th grade (that is, missing at least 5 weeks
of school), and 2) receiving a failing final
grade in mathematics and/or English dur-
ing 8th grade. Of those 8th graders who
attended school less than 80% of the
time, 78% became high school dropouts.23
Of those 8th graders who failed mathe-
matics and/or English, 77% dropped out
of high school. Importantly, gender, race
or ethnicity, age, and test scores did
not have the strong predictive power
of attendance and course failure.
Clearly, there are numerous factors that
contribute to the risk of dropping out.
But in this analysis, we define “at-risk 8th
graders” as those who attended less than
80% of the time and/or who failed mathe-
matics and/or English in 8th grade. Fifty-
four percent of the dropouts in the Class
of 2000 were at-risk 8th graders according
to this definition, even though they made
up only 34% of the entire cohort. These
data indicate that about half of the
dropouts in the city’s public schools can
be identified in 8th grade, prior to their
entrance to high school.
In fact, a separate analysis of a cohort of
middle grades students in the Philadelphia
public schools during the 1996–1997 school
year shows that many of the students who
became dropouts could be identified as
early as 6th grade using similar data on
Table 11
Percentage of Students At-Risk in 8th Grade and Percentage of At-Risk 8th GradersWho Dropped Out, by Key Categories, Class of 2000
% of students % of at-riskin this category 8th graders inwho were at-risk this category who
8th graders dropped out
African American 35.1% 74.1%
Asian 15.8% 83.8%
Latino 40.8% 77.3%
White 27.6% 78.4%
Females 31.4% 70.3%
Males 35.6% 79.8%
13 and under 27.7% 70.4%
14 and over 53.0% 84%
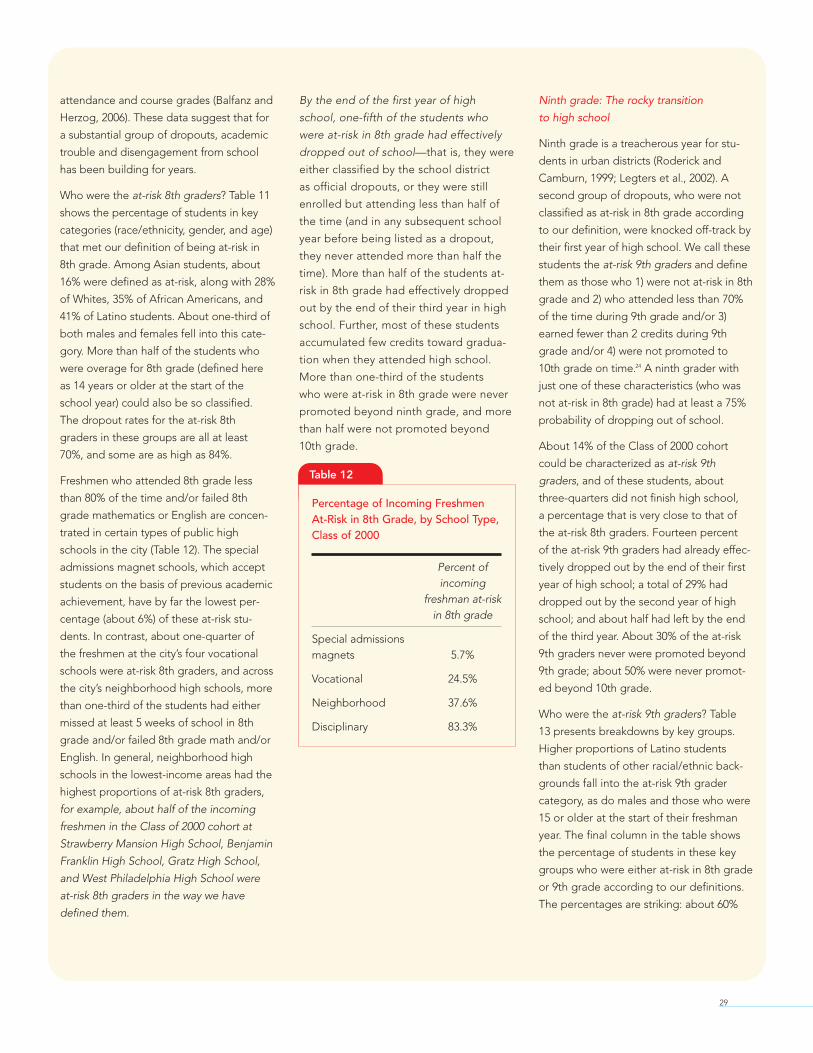
29
attendance and course grades (Balfanz and
Herzog, 2006). These data suggest that for
a substantial group of dropouts, academic
trouble and disengagement from school
has been building for years.
Who were the at-risk 8th graders? Table 11
shows the percentage of students in key
categories (race/ethnicity, gender, and age)
that met our definition of being at-risk in
8th grade. Among Asian students, about
16% were defined as at-risk, along with 28%
of Whites, 35% of African Americans, and
41% of Latino students. About one-third of
both males and females fell into this cate-
gory. More than half of the students who
were overage for 8th grade (defined here
as 14 years or older at the start of the
school year) could also be so classified.
The dropout rates for the at-risk 8th
graders in these groups are all at least
70%, and some are as high as 84%.
Freshmen who attended 8th grade less
than 80% of the time and/or failed 8th
grade mathematics or English are concen-
trated in certain types of public high
schools in the city (Table 12). The special
admissions magnet schools, which accept
students on the basis of previous academic
achievement, have by far the lowest per-
centage (about 6%) of these at-risk stu-
dents. In contrast, about one-quarter of
the freshmen at the city’s four vocational
schools were at-risk 8th graders, and across
the city’s neighborhood high schools, more
than one-third of the students had either
missed at least 5 weeks of school in 8th
grade and/or failed 8th grade math and/or
English. In general, neighborhood high
schools in the lowest-income areas had the
highest proportions of at-risk 8th graders,
for example, about half of the incoming
freshmen in the Class of 2000 cohort at
Strawberry Mansion High School, Benjamin
Franklin High School, Gratz High School,
and West Philadelphia High School were
at-risk 8th graders in the way we have
defined them.
By the end of the first year of high
school, one-fifth of the students who
were at-risk in 8th grade had effectively
dropped out of school—that is, they were
either classified by the school district
as official dropouts, or they were still
enrolled but attending less than half of
the time (and in any subsequent school
year before being listed as a dropout,
they never attended more than half the
time). More than half of the students at-
risk in 8th grade had effectively dropped
out by the end of their third year in high
school. Further, most of these students
accumulated few credits toward gradua-
tion when they attended high school.
More than one-third of the students
who were at-risk in 8th grade were never
promoted beyond ninth grade, and more
than half were not promoted beyond
10th grade.
Ninth grade: The rocky transition
to high school
Ninth grade is a treacherous year for stu-
dents in urban districts (Roderick and
Camburn, 1999; Legters et al., 2002). A
second group of dropouts, who were not
classified as at-risk in 8th grade according
to our definition, were knocked off-track by
their first year of high school. We call these
students the at-risk 9th graders and define
them as those who 1) were not at-risk in 8th
grade and 2) who attended less than 70%
of the time during 9th grade and/or 3)
earned fewer than 2 credits during 9th
grade and/or 4) were not promoted to
10th grade on time.24 A ninth grader with
just one of these characteristics (who was
not at-risk in 8th grade) had at least a 75%
probability of dropping out of school.
About 14% of the Class of 2000 cohort
could be characterized as at-risk 9th
graders, and of these students, about
three-quarters did not finish high school,
a percentage that is very close to that of
the at-risk 8th graders. Fourteen percent
of the at-risk 9th graders had already effec-
tively dropped out by the end of their first
year of high school; a total of 29% had
dropped out by the second year of high
school; and about half had left by the end
of the third year. About 30% of the at-risk
9th graders never were promoted beyond
9th grade; about 50% were never promot-
ed beyond 10th grade.
Who were the at-risk 9th graders? Table
13 presents breakdowns by key groups.
Higher proportions of Latino students
than students of other racial/ethnic back-
grounds fall into the at-risk 9th grader
category, as do males and those who were
15 or older at the start of their freshman
year. The final column in the table shows
the percentage of students in these key
groups who were either at-risk in 8th grade
or 9th grade according to our definitions.
The percentages are striking: about 60%
Table 12
Percentage of Incoming FreshmenAt-Risk in 8th Grade, by School Type,Class of 2000
Percent ofincoming
freshman at-riskin 8th grade
Special admissionsmagnets 5.7%
Vocational 24.5%
Neighborhood 37.6%
Disciplinary 83.3%

30
of Latinos, 50% of African Americans, 40%
of Whites, and 30% of Asians were at-risk.
More than half of the males, and close to
half of the females, were at-risk. And 70%
of those who were at least 15 years or older
at the start of the school year had one or
more of the risk factors we have identified.
Eighty percent of the students who
dropped out of school were either at-risk
8th graders or at-risk 9th graders, in the
way we have defined them. Given this
statistic, it is not surprising that when we
break down the data by school (that is, by
the high school attended during the 9th
grade) we find that the percentage of the
cohort who dropped out closely tracks the
percentage of students in the cohort who
were either at-risk in 8th grade or 9th
grade. Figure 10 presents in a graph the
close correspondence between these two
figures. Each school is represented by a
vertical line. In most cases, the percentage
of students at-risk in 8th or 9th grade in
the Class of 2000 was greater than the
percentage of students dropping out, a
reminder that some of the at-risk students
completed high school despite the odds.
The data in Figure 10, in and of themselves,
are not evidence that particular high
schools are especially good at producing
dropouts—or that they are powerless to
reduce the number of dropouts because
of the academic weaknesses that entering
students bring with them. How students
perform in high school, and ultimately
whether they drop out, is the result of the
interaction of factors operating before high
school and students’ experiences during
high school. What we are saying is that,
given our description of the risk factors
in recent cohorts, the vast majority of
potential dropouts can be identified—
and perhaps targeted for intervention—
at the start of high school.
In fact, many at-risk 9th graders who are
running into trouble can be identified as
early as the end of the first marking period
of the freshman year. For example, of the
at-risk 9th graders who had an overall
attendance rate for the year of less than
70%, almost half (49%) attended school less
than 70% of the time during the first mark-
ing period. And 80% had attendance rates
of less than 70% during the first and/or sec-
ond marking periods. These data, along
with similar recent findings from Chicago
(Allensworth and Easton, 2005), suggest
that high schools need not wait until the
end of the year to identify a large percent-
age of their dropouts—data from 8th grade
plus the information from the first and/or
second marking period will suffice.
By High School: Percentage of Dropouts and Percentage At-Riskin 8th or 9th Grade, Class of 2000
100%
80%
60%
40%
20%
0%
% at-risk, 8th or 9th % dropping outSchools
Figure 10
Table 13
Percentage of Students At-Risk in 9th Grade and Combined Percentage ofAt-Risk in 8th or 9th Grade, by Key Categories
% of students % of studentsin this category in this categorywho were at-risk who were at-risk
9th graders 8th graders orat-risk 9th graders
African American 16.6% 51.7%
Asian 14.5% 30.3%
Latino 21.3% 62.1%
White 14.6% 42.2%
Females 15.3% 46.7%
Males 18.1% 53.8%
14 and under at beginning of 9th grade 16.5% 44.2%
15 and over at beginning of 9th grade 17.4% 70.4%
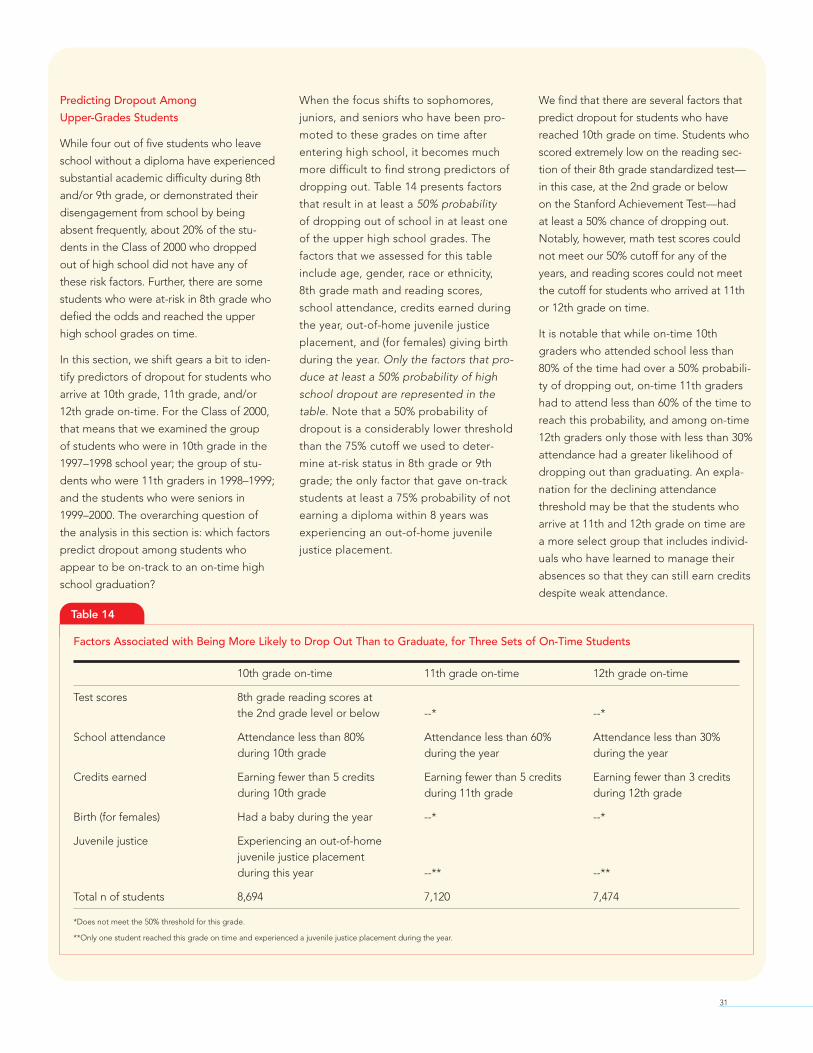
31
Predicting Dropout Among
Upper-Grades Students
While four out of five students who leave
school without a diploma have experienced
substantial academic difficulty during 8th
and/or 9th grade, or demonstrated their
disengagement from school by being
absent frequently, about 20% of the stu-
dents in the Class of 2000 who dropped
out of high school did not have any of
these risk factors. Further, there are some
students who were at-risk in 8th grade who
defied the odds and reached the upper
high school grades on time.
In this section, we shift gears a bit to iden-
tify predictors of dropout for students who
arrive at 10th grade, 11th grade, and/or
12th grade on-time. For the Class of 2000,
that means that we examined the group
of students who were in 10th grade in the
1997–1998 school year; the group of stu-
dents who were 11th graders in 1998–1999;
and the students who were seniors in
1999–2000. The overarching question of
the analysis in this section is: which factors
predict dropout among students who
appear to be on-track to an on-time high
school graduation?
When the focus shifts to sophomores,
juniors, and seniors who have been pro-
moted to these grades on time after
entering high school, it becomes much
more difficult to find strong predictors of
dropping out. Table 14 presents factors
that result in at least a 50% probability
of dropping out of school in at least one
of the upper high school grades. The
factors that we assessed for this table
include age, gender, race or ethnicity,
8th grade math and reading scores,
school attendance, credits earned during
the year, out-of-home juvenile justice
placement, and (for females) giving birth
during the year. Only the factors that pro-
duce at least a 50% probability of high
school dropout are represented in the
table. Note that a 50% probability of
dropout is a considerably lower threshold
than the 75% cutoff we used to deter-
mine at-risk status in 8th grade or 9th
grade; the only factor that gave on-track
students at least a 75% probability of not
earning a diploma within 8 years was
experiencing an out-of-home juvenile
justice placement.
We find that there are several factors that
predict dropout for students who have
reached 10th grade on time. Students who
scored extremely low on the reading sec-
tion of their 8th grade standardized test—
in this case, at the 2nd grade or below
on the Stanford Achievement Test—had
at least a 50% chance of dropping out.
Notably, however, math test scores could
not meet our 50% cutoff for any of the
years, and reading scores could not meet
the cutoff for students who arrived at 11th
or 12th grade on time.
It is notable that while on-time 10th
graders who attended school less than
80% of the time had over a 50% probabili-
ty of dropping out, on-time 11th graders
had to attend less than 60% of the time to
reach this probability, and among on-time
12th graders only those with less than 30%
attendance had a greater likelihood of
dropping out than graduating. An expla-
nation for the declining attendance
threshold may be that the students who
arrive at 11th and 12th grade on time are
a more select group that includes individ-
uals who have learned to manage their
absences so that they can still earn credits
despite weak attendance.
Table 14
Factors Associated with Being More Likely to Drop Out Than to Graduate, for Three Sets of On-Time Students
10th grade on-time 11th grade on-time 12th grade on-time
Test scores 8th grade reading scores atthe 2nd grade level or below --* --*
School attendance Attendance less than 80% Attendance less than 60% Attendance less than 30%during 10th grade during the year during the year
Credits earned Earning fewer than 5 credits Earning fewer than 5 credits Earning fewer than 3 creditsduring 10th grade during 11th grade during 12th grade
Birth (for females) Had a baby during the year --* --*
Juvenile justice Experiencing an out-of-homejuvenile justice placementduring this year --** --**
Total n of students 8,694 7,120 7,474
*Does not meet the 50% threshold for this grade.
**Only one student reached this grade on time and experienced a juvenile justice placement during the year.

32
In each year, the number of credits earned
is a good predictor of whether the student
will drop out of school. Among on-time
10th and 11th graders, students who
earned fewer than 5 credits during the year
had a higher probability of dropping out
than graduating within eight years of start-
ing high school. Among 12th graders, it is
only those who earn fewer than 3 credits
during the year who have more than a 50%
probability of dropping out; seniors may
not need to earn 5 credits in order to grad-
uate and, if they do, they may be more like-
ly to return for another year to acquire the
classes they need to graduate.
We find two non-academic factors that
also give students more than a 50% prob-
ability of dropping out of high school. Of
the 104 young women in the Class of 2000
who reached 10th grade on time but who
give birth to a baby during the school year
(or following summer), 55% left high
school without graduating. However, the
141 on-time 11th graders and the 135 12th
graders who gave birth during the year or
who had ever had a baby by that point
had relatively high probabilities of gradu-
ating (70% or above). Finally, we also find
that students who had a scrape with the
law and were assigned by the courts to an
out-of-home juvenile facility dropped out
of high school at very high rates. In this
case, of the 411 on-time 10th graders who
had one of these placements during 10th
grade (or during the previous summer),
93% did not earn a high school diploma
from the School District of Philadelphia.
Non-Academic Predictors of Dropout
The vast majority of the Class of 2000
who dropped out of school struggled
academically and/or attended infrequent-
ly, sometimes prior to entering high
school, sometimes after entering high
school, and sometimes both. Some of
these students also had contact with
the city’s social service agencies and/or
gave birth to at least one child. Table 15
shows the percentage of students who
had a substantiated case of abuse or
neglect25 after starting high school, a
foster care placement,26 a placement
in a juvenile justice facility,27 or who gave
birth in Philadelphia within four years of
starting high school. The percentages
for dropouts are presented, along with
percentages for graduates and dropouts,
for sake of comparison.
Students who dropped out of school were
more likely to have given birth to a child
and/or to have had contact with social serv-
ice agencies. Even among the dropouts,
however, relatively few—less than 3%—had
a substantiated case of abuse or neglect
during their high school years. Less than
10% of the dropouts had a foster care
placement. However, close to one-quarter
of the males who dropped out had been
placed in a juvenile justice facility for some
period of time after starting high school.
One-third of the young women who
dropped out of school had a baby within
four years of starting high school, and 40%
had a child within five years.
Table 15
Social Service Agency Contact After Starting High School,for Students Who Dropped Out of School
Percent of all Percent of all Percent of alldropouts graduates students*
Substantiated case of abuse or neglect 2.8% .89% 1.8%
Foster care placement 7.4% 2.0% 4.5%
Juvenile justice placement (all students) 14.4% 1.3% 7.2%
Juvenile justice placement (males only) 22.6% 2.2% 12.8%
Gave birth within 4 years of startinghigh school (females) 32.8% 9.7% 18.7%
Gave birth within 5 years of startinghigh school (females) 41.4% 15.2% 25.5%
Number of students (male and female) 6,053 7,296 13,393
*including those still enrolled in school
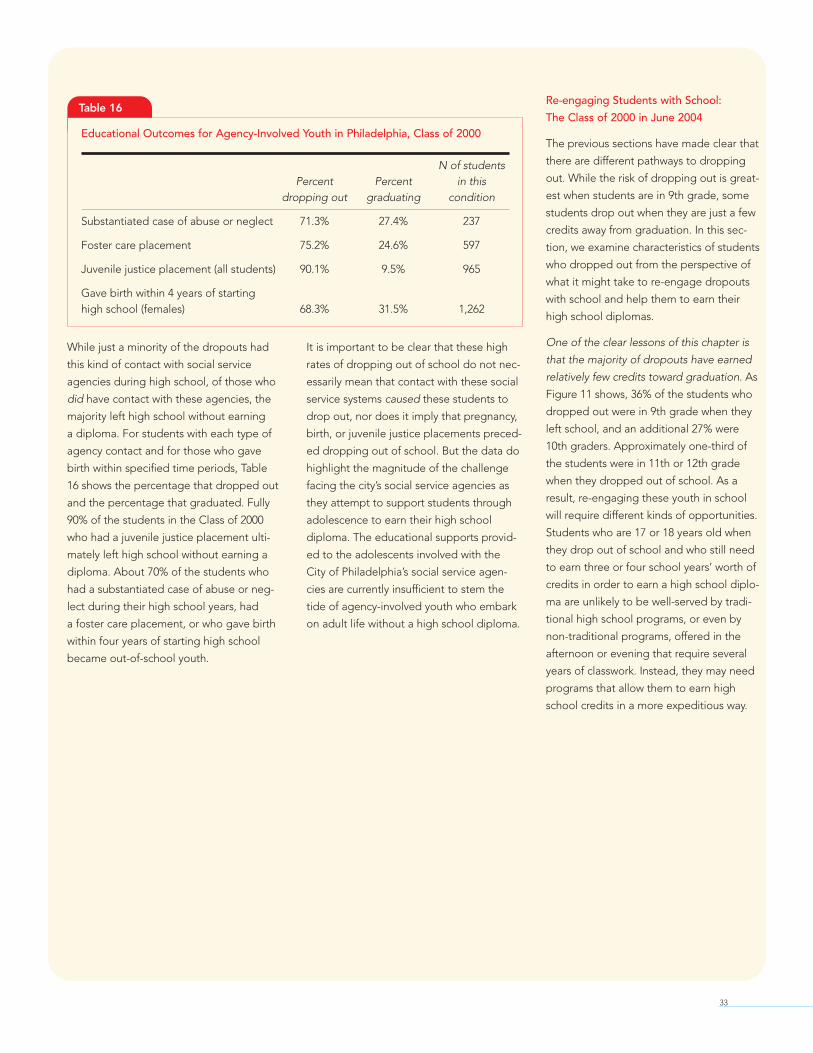
33
While just a minority of the dropouts had
this kind of contact with social service
agencies during high school, of those who
did have contact with these agencies, the
majority left high school without earning
a diploma. For students with each type of
agency contact and for those who gave
birth within specified time periods, Table
16 shows the percentage that dropped out
and the percentage that graduated. Fully
90% of the students in the Class of 2000
who had a juvenile justice placement ulti-
mately left high school without earning a
diploma. About 70% of the students who
had a substantiated case of abuse or neg-
lect during their high school years, had
a foster care placement, or who gave birth
within four years of starting high school
became out-of-school youth.
It is important to be clear that these high
rates of dropping out of school do not nec-
essarily mean that contact with these social
service systems caused these students to
drop out, nor does it imply that pregnancy,
birth, or juvenile justice placements preced-
ed dropping out of school. But the data do
highlight the magnitude of the challenge
facing the city’s social service agencies as
they attempt to support students through
adolescence to earn their high school
diploma. The educational supports provid-
ed to the adolescents involved with the
City of Philadelphia’s social service agen-
cies are currently insufficient to stem the
tide of agency-involved youth who embark
on adult life without a high school diploma.
Re-engaging Students with School:
The Class of 2000 in June 2004
The previous sections have made clear that
there are different pathways to dropping
out. While the risk of dropping out is great-
est when students are in 9th grade, some
students drop out when they are just a few
credits away from graduation. In this sec-
tion, we examine characteristics of students
who dropped out from the perspective of
what it might take to re-engage dropouts
with school and help them to earn their
high school diplomas.
One of the clear lessons of this chapter is
that the majority of dropouts have earned
relatively few credits toward graduation. As
Figure 11 shows, 36% of the students who
dropped out were in 9th grade when they
left school, and an additional 27% were
10th graders. Approximately one-third of
the students were in 11th or 12th grade
when they dropped out of school. As a
result, re-engaging these youth in school
will require different kinds of opportunities.
Students who are 17 or 18 years old when
they drop out of school and who still need
to earn three or four school years’ worth of
credits in order to earn a high school diplo-
ma are unlikely to be well-served by tradi-
tional high school programs, or even by
non-traditional programs, offered in the
afternoon or evening that require several
years of classwork. Instead, they may need
programs that allow them to earn high
school credits in a more expeditious way.
Table 16
Educational Outcomes for Agency-Involved Youth in Philadelphia, Class of 2000
N of studentsPercent Percent in this
dropping out graduating condition
Substantiated case of abuse or neglect 71.3% 27.4% 237
Foster care placement 75.2% 24.6% 597
Juvenile justice placement (all students) 90.1% 9.5% 965
Gave birth within 4 years of startinghigh school (females) 68.3% 31.5% 1,262

Other cities—Portland, Boston, and New
York City among them—currently have a
broad array of these types of options for
students wishing to return to school. In
addition, the School District of Philadelphia
has opened a number of small schools for
youth over age 17 who have few high
school credits. These schools are a strate-
gic part of the overall high school reform
agenda. Slots in these schools are being
expanded annually.
Many of the dropouts with few credits have
not demonstrated the academic skills
needed to succeed in high school. The
most recent standardized test data that we
have for these students is from their 8th
grade year,28 and students may have experi-
enced some academic advances during
their time in high school, making these
data an underestimate of their academic
skill when they dropped out. Nevertheless,
it is instructive to see that many students
who dropped out as 9th or 10th graders
had a grade equivalent of 5th grade or
below on the SAT-9 reading and/or mathe-
matics tests when they were in 8th grade
and that the vast majority scored below
grade level (Table 17). In order to enable
these students to produce high school-
level work to earn a diploma, high school
completion programs will need to help a
large proportion of dropouts develop the
reading comprehension skills and middle
grade mathematical knowledge assumed
by high school level work.
It is important to remember, however,
that a substantial subgroup of students
dropped out when they were not far from
high school graduation. These students
also scored higher on the standardized
math and reading tests in 8th grade than
the 9th and 10th grade dropouts did, and
they are more likely to be candidates for
post-secondary education. These students,
too, need a program tailored to their
needs. An example of a program that
works with such students is the Gateway
to College Program, which allows students
who 1) are within 10 credits of high school
graduation and 2) score at the 8th grade
level or above on an adult education test
to earn high school and community college
credits simultaneously. This model is based
on one at Portland Community College
and has been replicated in several cities,
including Philadelphia. Dual enrollment
legislation at the state level in Pennsylvania
was also specifically designed to include
this population of youth.
34
Table 17
Grade Equivalents on 8th Grade SAT-9 Reading and Math Tests, for Three Groups of Students, Class of 2000
Dropped out in 9th grade Dropped out in 10th grade All 8th graders
% at this % at this % at this % at this % at this % at thisReading level, Math level, Reading level, Math level, Reading level, Math level,
8th grade 8th grade 8th grade 8th grade 8th grade 8th grade
5th grade or below 57.9% 48.5% 49.5% 43.1% 34.4% 30.6%
6th–7th grade 20.4% 35.1% 22.7% 36.6% 22.4% 33.9%
8th grade or above 21.7% 16.4% 27.8% 20.3% 43.2% 35.6%
n 1,321 1,056 1,199 1,078 11,987 11,164
Highest Grade of Students WhoDropped Out, Class of 2000
12th Grade23%
11th Grade14%
10th Grade27%
9th Grade36%
Figure 11

35
y looking in depth at a single
year, 2003–2004, and by follow-
ing multiple cohorts of students
as they progress—and all too often,
fail to progress—through high school
in Philadelphia, we have been able to
establish a clear and detailed picture of
high school dropouts and graduates in
Philadelphia. This information provides a
starting point for informed public policy
and the formulation of an effective
response to the dropout crisis in
Philadelphia.
Synthesis of Key Findings
Dropout and graduation rate in
Philadelphia
After four years in high school, 46% of the
Class of 2005 had graduated, 30% had
dropped out, 12% were still enrolled in
school, and 12% had transferred to a pri-
vate school or another school district. Once
we remove from the analysis students who
transferred to private schools or other
school districts or who left the district due
to illness or death, we find that during the
period 2000–2005, Philadelphia’s on-time
graduation rate has hovered from a little
below to a little above 50%. Up to 10% of
students take an extra year or two to grad-
uate. Thus, Philadelphia’s total cohort grad-
uation rate is close to 60%. Ultimately, we
estimate that about 40% of the students
who begin high school in Philadelphia and
do not transfer to another school drop out.
There is some indication in the most recent
data (the Class of 2005) that the gradua-
tion rate may have begun to inch upward.
The on-time graduation rate for 2005 was
52%—about four percentage points higher
than the average rate of the prior five
years. However, it will be important to see
whether results for 2006 continue this trend
and whether the six-year total graduation
rate sustains the gains registered for the
on-time graduation rate.
The number of out-of-school youth
In any given year, approximately 8,000
Philadelphia students in the middle grades
or in high school drop out of the public
schools. Nearly 5,000 additional students
are “half way to dropout,” attending school
less than 50% of the time.
By examining the number of students
who have dropped out of high school from
2000 to 2005 (and the number who did not
return to a public school in Philadelphia),
we can estimate that there are approxi-
mately 30,000 out-of-school youth in Phila-
delphia. This means that for every five stu-
dents currently attempting to earn a high
school diploma in Philadelphia, there are at
least three out-of-school youth (or, in some
cases, now young adults) who could have
completed high school, and should have
completed high school but did not.
Age and grade of dropouts/distance
from graduation
More than half of Philadelphia’s dropouts
are not promoted past the 9th or 10th
grade. In most cases these students spend
several years attempting to succeed and
are 17 years old or older when they become
official dropouts. This means that the major-
ity of dropouts in Philadelphia are far away
from graduation, needing to earn three
to four years worth of high school credits.
When they leave school, a substantial sub-
group of dropouts are beyond the tradition-
al age of high school students (21% of all
dropouts are 19 years old or older). If these
dropouts were to start again in a traditional
high school program they would in many
cases be in their early twenties before they
could graduate, the age at which many of
their peers have graduated from college
and/or are starting families.
A third of Philadelphia’s dropouts, however,
persist until the 11th or 12th grade before
dropping out. In some cases, these students
are only a few credits shy of graduating.
CONCLUSION

36
School type and dropout
During the years examined in this report,
nearly all of Philadelphia’s students grad-
uated or dropped out from three types
of schools. Philadelphia’s academically
selective public high schools educate
about 10% of the high school students
in the non-charter public schools. Collect-
ively, from 2000 to 2005, these schools
had six-year cohort graduation rates near
80%. The school district’s vocational high
schools, which educate another 8% of
the enrolled high school students, had
collective six-year graduation rates in
the 60-percent range. During this time
period, nearly three-quarters of the dis-
trict’s high school students attended
neighborhood high schools, where the
collective on-time graduation rate from
2000 to 2005 was in the upper 40-percent
range and the six-year graduation rate in
the 50-percent range. This average rate
obscures considerable variation among
the neighborhood high schools.
Dropout and graduation rates are highly
correlated with a high school’s poverty
level. Twenty-nine thousand students in
Philadelphia attend 24 high schools in
which 75% or more of the students are
eligible for free or reduced price lunch.
These high-poverty high schools have
an annual total dropout rate (formal
dropouts and near dropouts combined)
of 25%.
Dropout rates by gender and
race/ethnicity
Depending on the year and the specific
comparison being made, there is a 10 to 15
percentage point graduation gap between
males and females in Philadelphia. This
gap holds true across all racial and ethnic
groupings, and while the female advantage
reflects national and historical trends, the
gender gap in Philadelphia is considerably
greater than the national average. The gen-
der gap for the four-year, on-time gradua-
tion rate appears to have slightly narrowed
from 2000 to 2005, with males obtaining
their highest graduation rate in 2005. But
even with this gain, males in Philadelphia
had a 47% on-time graduation rate com-
pared to 58% for females.
Asian students have the highest graduation
rates and lowest dropout rates in the school
district. Whites and African Americans have
similar rates. Latinos, who according to the
recent U.S. census data are the fastest
growing population in the Philadelphia
region, have the lowest graduation rates
and high dropout rates. Graduation rates,
however, are much too low across all racial
and ethnic groups. For the cohorts for
which we have six-year graduation data,
more than half of the Latino students, 40%
of White and African American students,
and about 30% of Asians did not earn a
high school diploma in six years.
Early identification of dropouts
Over half the eventual dropouts from
Philadelphia’s public schools can be identi-
fied prior to the start of high school. The
majority of the students who become drop
outs failed their English or mathematics
courses or attended school less than 80%
of the time when they were in the middle
grades. Another 15% do not show this level
of academic difficulty or disengagement
from school during the middle grades but
have a rocky transition to high school and
earn poor grades and/or attend school
infrequently in the 9th grade. This means
that by the first year of high school, 80% of
the students who eventually drop out have
signaled clearly that they have fallen off the
path to graduation. Students who attend
the 9th grade less than 70% of the time or
earn fewer than two credits, for example,
have dropout rates of over 75%. Sixty per-
cent of Latino and half of African American
high school students signal either at the
start of high school or by the end of their
first year in high school that they are on
the way to dropping out.
About 20% of eventual dropouts cannot
be readily identified by the first year in high
school. These are the students who make
it to 10th, 11th, or 12th, often on time,
before they dropout. Once a student has
advanced to the upper grades of high
school, it becomes more difficult to identify
who ultimately will drop out or graduate.
However, one constant remains: students
who do not earn sufficient credits in a given
grade to be promoted to the next grade on
time are at increased risk of dropping out.

37
Relationship of social service involvement
and dropping out
Only a very small percentage of students
who drop out of high school are involved
with the city’s social service agencies.
About 3% of dropouts have a documented
case of abuse or neglect while they are
in high school, and 7% are in foster care
during their high school years. Fourteen
percent of all dropouts, and 22% of male
dropouts, receive an out-of-home place-
ment within the juvenile justice system
during high school.
Yet, while most dropouts are not agency-
involved, those students who are involved
with the city’s social service agencies during
high school have extremely high dropout
rates. In the Class of 2000, 71% of the high
school students with a documented case of
abuse or neglect, 75% of the high school
students in foster care, and 90% of the
students with an out-of-home placement
in the juvenile justice system did not earn
a diploma from the School District of
Philadelphia nor did they have a record
of transferring to another school.
When combined with the very high annual
and cohort dropout rates for the school
district’s disciplinary schools, the fact that
nearly every student who received an out-
of-home juvenile justice placement eventu-
ally dropped out indicates that the current
systems are not working. Annually, approxi-
mately 1,000 high school students who
have attended a disciplinary school or
received an out-of-home juvenile justice
placement become out-of-school youth.
Relationship of teenage pregnancy
and dropping out
There is a strong relationship between
dropping out of high school and teenage
pregnancy. Thirty-three percent of female
dropouts gave birth within four years of
starting high school, and 41% gave birth
within five years of starting high school.
Overall 68% of females from the Class of
2000 who had a child within four years of
the start of high school ultimately dropped
out of school. Females who have a child
early in high school are more likely to drop
out than females who have a child in the
11th or 12th grade.
Implications for Policy and Practice
A clearer and deeper understanding of
who drops out and who graduates in
Philadelphia shows that in order to solve
the dropout crisis in Philadelphia four poli-
cy challenges will need to be overcome.
First, a broad-based coalition needs to be
mobilized to meet the challenge and this
coalition must be able to sustain itself for
the long term. The dropout crisis is not a
small problem, and it does not have quick
or easy answers. Among the cohorts we
examined in this report, dropping out of
high school was almost as common as
graduation. Routinely, less than half the stu-
dents who start high school in Philadelphia
walk across the stage four years later to
receive a diploma. This graduation deficit
continues to occur despite nearly continu-
ous school reform efforts and the existence
of many dedicated and effective organiza-
tions concerned with out-of-school youth.
Because the overwhelming proximal cause
of dropping out in Philadelphia is failing in
school and student disengagement, the
public schools of Philadelphia must be the
locus of the campaign to end the dropout
crisis. But the school system cannot be
expected to solve this problem alone.
Getting adolescents to come to school and
to work hard to succeed will require a sub-
stantial effort from the community, as well
as from families. Given that high school
graduation is not common in many neigh-
borhoods, it needs to be recognized that
expectations and outlooks have been
adjusted to this grinding reality. Simple
exhortations and promises will not suffice.
Students and families need to be shown
that a clear path to graduation exists and
that increased attendance and effort on
their part will be met with the necessary
supports and educational experiences
that all students need to succeed. Out-
of-school youth, as well as students still
enrolled in the school district’s high poverty
secondary schools, need to be supported
by a greater number of adults who are com-
mitted to their success and have the skills

38
needed to help them achieve it. This
means that a sustained campaign to end
the dropout crisis in Philadelphia will also
require an infusion of human and fiscal
capital and legislative support.
Second, a sustained effort to end Philadel-
phia’s dropout crisis will require profound
changes in how adolescents who live in
the city’s high poverty neighborhoods are
educated. Given that over half of the city’s
dropouts can be identified before they
enter high school, it is clear that, as critical
as they are, more effective high schools will
not alone end the dropout crisis. Along
with continued improvements in elemen-
tary school education and an expansion of
early childhood programs, an integrated
and coordinated grade 6–12 secondary
reform effort is needed. There is abundant
evidence that early adolescence is the
time when substantial numbers of students
begin to seriously disengage from school,
stop attending school regularly, and start
failing their courses. Thus, the middle
grades and high schools need to be
reformed together.
It is also important to recognize, however,
that not every middle grades school and
high school in Philadelphia will need the
same reforms. While all students benefit
from and require strong instructional pro-
grams, effective teachers, safe schools, and
good learning environments, students who
are falling off the graduation track need
additional supports that are targeted to
them and in some cases are intensive.
Because the students most at-risk of drop-
ping out are concentrated in the highest-
poverty middle grades schools and high
schools, these schools will require addition-
al reforms, supports, and resources beyond
system-wide efforts. Finally, organizational
reforms are needed so no school is over-
whelmed by the sheer number of students
who are not attending school or failing
their courses. In this regard the effort to
end the dropout crisis in Philadelphia may
be able to learn from the public health
field, which seeks to locate the source of a
problem and then develops a multi-tiered,
integrated, and comprehensive solution
including broad-based prevention, addi-
tional targeted supports for those in need,
and finally intensive support for the most
challenging cases.
Third, even the most effective school-
based reforms will not prevent all students
from dropping out of school. As we have
shown, about 20% of students drop out
late in high school when they are relatively
close to obtaining a degree. Moreover, it is
more difficult to predict which students in
the 11th or 12th grade are likely to drop
out and more difficult to target them with
needed supports. Thus, an effective sys-
tem of credit recovery, second-chance
schools, and alternative means of securing
a high school diploma will be required.
Many of those who drop out when they
are juniors or seniors are already in their
late teens and even their early twenties;
these young people will need programs
that not only offer a second chance to
obtain a high school diploma but also
provide direct avenues to post-secondary
schooling or training. Finally, while the
“late dropouts” are just a small subset of
dropouts, the sheer scale of the dropout
crisis in Philadelphia means that serving
just 20% of students who leave school in
11th or 12th grade would require a signifi-
cant scale up of existing second-chance
opportunities. Using our data, it is possible
to estimate that currently there might be
6,000 out-of-school youth who could
benefit from these opportunities.
Finally, the agencies that provide social
services to the city’s youth need to be
deeply involved in the effort to stop the
dropout crisis in Philadelphia. Currently,
the adolescents who are in their care drop
out in alarming numbers. For high school
students who have been abused and
neglected, are in foster care, or receive
an out-of-home placement in the juvenile
justice system, the odds of dropping
out are not 1 in 2 but 3 out of 4 or even
higher. Similarly, 2 out of 3 females who
give birth within four years of the start
of high school drop out. Social service
agencies will need to determine how the
resources they have at their disposal can
be most effectively marshaled to help
ensure that adolescents in their charge
graduate from high school.

39
e use two pieces of data kept by
the School District of Philadel-
phia to categorize a student as
a dropout, a graduate, still enrolled, or
withdrawn from the district as a result of
illness, death, or enrollment in another
school. The first piece of information
is the status code, which indicates, in
sum, whether the student is enrolled in
Philadelphia’s public schools or has been
withdrawn. Students who have a status
code of “withdrawn” are given a drop
code, which indicates the general reason
why the student is no longer enrolled.
Students who are withdrawn also receive
a drop date—the month, day, and year
when they left the school system.
There are approximately 30 “drop codes”
that can be assigned to Philadelphia stu-
dents when they leave the public schools.
However, during the 2003–2004 school
year, about 90% of those who left the dis-
trict were assigned one of just four drop
codes: graduated, “over the compulsory
school age,” “moved from Philadelphia,”
or “transferred to a non-public school in
Philadelphia.” Forty-two percent of all
drop codes assigned indicated gradua-
tion; 21% of the students who left the
district were given the code “over the
compulsory school age,” implying that
they had dropped out of school; 18%
were coded as “moved from Philadel-
phia,” indicating that they had left the city
and presumably were enrolled in another
school district; and 10% were identified
as enrolling in a private school in the city.
Other codes, such as “emotional distur-
bance” (.66%) or “migrants”(.03%), are
used, but relatively infrequently, and
others appear never to be used at all.
The table below provides detail on the
codes that we categorized as indicating
a) dropout or b) school transfers or non-
voluntary removal from the system. In most
of the analyses in this report, we remove
from the analysis students who were coded
as having transferred to another school or
having been removed from the school rolls
due to illness or death.
In addition to students who were with-
drawn from the district and received
codes indicating why they dropped out,
some students a) withdrew from the dis-
trict but received no drop code or b) were
not formally withdrawn from the district,
but were not listed as enrolled either.
We code these students with incomplete
enrollment/dropout information as high
school dropouts, consistent with recom-
mendations from the National Governors
Association and the Pennsylvania Depart-
ment of Education for the 2004–2005
reporting period.
Categorization of Drop Codes
School transfers andDropped out non-voluntary removal
u Parents in Philadelphia or office roll u Deceased
u Job Corps u Emotional disturbance
u Runaway u Hospital roll
u Whereabouts unknown u Went to private school
u Voluntary withdrawal u Moved from Philadelphia
u Marriage (over age 17) u Migrants
u Probable employment
u Needed at home
u Other (over compulsory school age)
u General employment certificate
u Correctional institution
u Involuntary withdrawal
u Beyond 2-mile limit – no transportation
APPENDIX 1: Defining Dropout

40
The reason a school district gives for why a
student leaves can make all the difference
in the dropout rate. Should a district inten-
tionally try to be deceptive, as was alleged
about some districts in Texas (Dobbs,
2003), there is plenty of opportunity for
gaming the statistics, particularly when stu-
dents have not formally withdrawn from the
district. Even without the intent to deceive,
dropout codes can be assigned in different
ways in different schools, using different
levels of evidence for a student’s where-
abouts (Hammack, 1986). For example,
districts contend with the question of
whether the statement from a student’s
friends that he or she moved from the
district is sufficient evidence to have him
count as a transfer (National Forum on
Education Statistics, 2006). A recent report
on dropout in the Pittsburgh Public School
system by RAND tries to correct for the
slipperiness of district data on dropout by
assessing the probability that a student
who is listed as transferring is actually a
dropout (Engberg and Gill, 2006). Our
understanding is that, like many districts
in the United States, the guidance given
to Philadelphia schools about how to
assign codes is relatively weak.
We cannot independently verify whether
the codes that have been assigned to stu-
dents are the best descriptors of why they
left the district. We do note that, in the
2003–2004 cohort, students in grades 9–12
who were assigned a code indicating
transfer to another school tended to be
younger (that is, not older than 15), and
almost half were listed as 9th graders.
Further, those who transferred were dis-
proportionately White: 27% of the trans-
fers were White, while 16% of all high
school students were White. Because
White students in the district are less likely
to be low-income, and thus more likely to
attend private schools, this statistic may
be an indication of some level of veracity
in the data on student transfers.
In the end, there are likely two kinds of
forces at work in the coding: students who
actually dropped out of school but were
mistakenly coded as transferring to another
school (which would bias the graduation
rates upward), and students who trans-
ferred to another school but were given a
code indicating dropout or whose informa-
tion was never entered into the computer
and so have been counted as dropouts in
this analysis (which would bias the gradua-
tion rates downward). We suggest that
these two forces cancel each other to some
degree, although the extent to which they
cancel each other cannot be determined
definitively from these data.
Clearly, one of the fundamental challenges
that districts and states face is coding stu-
dents’ whereabouts accurately. Earlier this
year, the National Forum on Education
Statistics released a report outlining a sug-
gested taxonomy of dropout codes, as well
as an exhortation to districts to clarify their
standards of evidence for assigning codes
to students (National Forum on Education
Statistics, 2006).
Over the past year, three different gradua-
tion rate estimates for Philadelphia have
been published in various studies and
news reports. In its Graduation Counts
issue, the newspaper Education Week
estimated a graduation rate for Philadel-
phia’s Class of 2003 of 55.5%. Jay Greene
and Marcus Winters, in their recent updat-
ing of their series of graduation rate
reports for the Manhattan Institute, esti-
mated Philadelphia’s graduation rate at
58% in 2003. The Commonwealth of Penn-
sylvania, by contrast, reports Philadelphia’s
2005 No Child Left Behind (NCLB) gradua-
tion rate as 68.6%.

41
ver the past year, three different
graduation rate estimates for
Philadelphia have been published
in various studies and news reports. In its
Graduation Counts issue, the newspaper
Education Week estimated a graduation
rate for Philadelphia’s Class of 2003 of
55.5%. Jay Greene and Marcus Winters,
in their recent updating of their series of
graduation rate reports for the Manhattan
Institute, estimated Philadelphia’s gradua-
tion rate at 58% in 2003. Standard and
Poor’s, by contrast, reports Philadelphia’s
2005 graduation rate as 68.6%.
Why Do These Estimated Graduation
Rates Differ?
Graduation rate estimates sometimes differ
because they are measuring rates among
different cohorts, and there is almost
always some year-to-year variation. The
fundamental reason why the estimates vary,
however, is that different researchers (or in
the case of NCLB graduation rate, the par-
ticular formula the state uses to calculate
graduation rates) are making different
choices on how best to estimate gradua-
tion rates. Without access to the individual-
level, longitudinal data we use for this
report, researchers typically must rely on
numbers of enrolled students and diplomas
granted at the aggregate level, either dis-
trict or state. A simple example of how
these numbers could be used to estimate
a graduation rate would be to divide the
number of diplomas granted in a district in
a given year by the number of 9th graders
enrolled in the district four years earlier.
These estimates, however, face two poten-
tially confounding data problems. The
number of students enrolled in a particular
grade in a given year includes those who
are in that grade for the first time and
those who are repeating the grade (for
example, the 9th grade numbers would
include first-time 9th graders and 9th grade
repeaters). Further, the number of students
earning a diploma in a given year includes
students who are on-time graduates and
those who took an extra high school year
or two or even more to obtain their diplo-
ma. In addition, students transfer in and
out of high school between the initial year
the enrollments were calculated and the
year of the diploma count. If the number
of 9th grade repeaters does not “balance”
the number of extra-time graduates, or
the number of “transfer ins” does not “bal-
ance” the number of “transfer outs,” then
graduation rate estimates comparing the
number of students enrolled in one year
to the number of graduates in another will
either over- or under-estimate the actual
graduation rate. Because these variables
can fluctuate from year to year, graduation
rate estimates calculated using enrollment
and diploma data can be fairly accurate
one year, an under-estimate the next year,
and an over-estimate the following year.
The researchers who make graduation rate
estimates are aware of these data issues
and make different choices on how to cor-
rect or control for them. As seen in the fol-
lowing charts and tables, the end result is
that some graduation rate estimates end
up being better estimates of Philadelphia’s
six-year or total cohort graduation rate and
others better estimates of Philadelphia’s
four-year or on-time graduation rate.
APPENDIX 2: Comparing Graduation Rate Estimates

42
How Do Graduation Rate Estimates
Compare to Our Longitudinal Cohort
Graduation Rates?
Figure A compares graduation rates
calculated in five ways:
1) The six-year graduation rate that
we calculated in Chapter 1 of this
report for the first-time freshmen
cohorts;
2) The six-year graduation rate that
we calculated for the freshmen and
transfer cohorts;
3) The Average Freshman Graduation
rate, used by the U.S. Department
of Education National Center on
Educational Statistics;
4) The Greene Method; and
5) The method that compares 8th
grade enrollment to diplomas.
The Average Freshman Graduation Rate
method, used by the U.S. Department of
Education, divides the number of diplo-
mas issued in a Year Y by the average of
the number of 8th, 9th, and 10th graders
enrolled in Year Y-4, Year Y-3, and Year Y-2,
respectively. The Greene Method, used in
reports issued by the Manhattan Institute,
follows a similar methodology but adds
a population change correction. The “8th
grade enrollment to diplomas” method
divides the number of diplomas issued
in Year Y by the number of 8th graders
in Year Y-5.
Both the Average Freshman Graduation
Rate method and the Greene method pro-
duced estimates that in nearly all cases
were within 5 percentage points of the
six-year graduation rates we calculated
for first-time freshman and freshmen with
transfers cohorts. However, the “8th grade
enrollments to diplomas” method led to
a consistent over-estimate of the six-year
graduation rate.
While the NCES Average Freshman Grad-
uation Rate and the Greene method pro-
duced estimates close to the six-year
graduation rate that we calculated for first-
time freshman, they produced consistent
over-estimates of the four-year graduation
rate. The averaging of 8th, 9th, and 10th
grade enrollments corrected for the
impact of grade repeaters on 9th grade
enrollment, but none of the methods
correct for students who take more than
four years to graduate. As a result, in the
case of Philadelphia, these methods are
much better estimates of the total gradua-
tion rate than the four-year rate. It should
be noted that Greene clearly indicates
that his method is not a measure of the
four-year graduation rate.
Comparing Graduation Rate Estimates to Philadelphia’sSix-Year Graduation Rate
75%
70%
65%
60%
55%
50%
45%
40%
Class of 2000
Gra
dua
tion
Rat
e
Class of 2001 Class of 2002 Class of 2003
Philadelphia 6 Year Longitudinal Cohort (Without Transfers In)
NCES Average Freshman Graduation Rate
8th Grade Enrollment to Diplomas (5 Years Later)
Greene Method (Average Freshmen Graduation Rate Plus Population Change Adjustment)
Philadelphia 6 Year Longitudinal Cohort (IncludingTransfers In)
Figure A

43
Figure B compares the four-year gradua-
tion rates for first-time freshman and fresh-
men and transfers with two additional
common methods of estimating gradua-
tion rates:
1) The Cumulative Promotion Index or
CPI (used by Education Week).
2) A method that compares the number
of 9th graders in a given year to the
number of diplomas issued four
years later.
Both of these methods produced esti-
mates that are typically within 5 percent-
age points of our calculated four-year
longitudinal graduation rate. The CPI
and the 9th grade-to-diploma measure,
however, consistently produce substantial
under-estimates of Philadelphia’s six-year
cohort graduation rate. In this case it
should be noted that the CPI was designed
to estimate four-year graduation rates.
Comparing Graduation Rate Estimates to Philadelphia’sFour-Year (On-Time) Graduation Rate
65%
60%
55%
50%
45%
40%
35%
30%
Class of 2000
Gra
dua
tion
Rat
e
Class of 2001 Class of 2002 Class of 2003
Philadelphia 4-Year Longitudinal Cohort (Without Transfers In)
Philadelphia 4-Year Longitudinal Cohort (IncludingTransfers In)
9th Grade Enrollment to Diplomas (4 Years Later)
CPI 4-Year Graduation Rate
Figure B
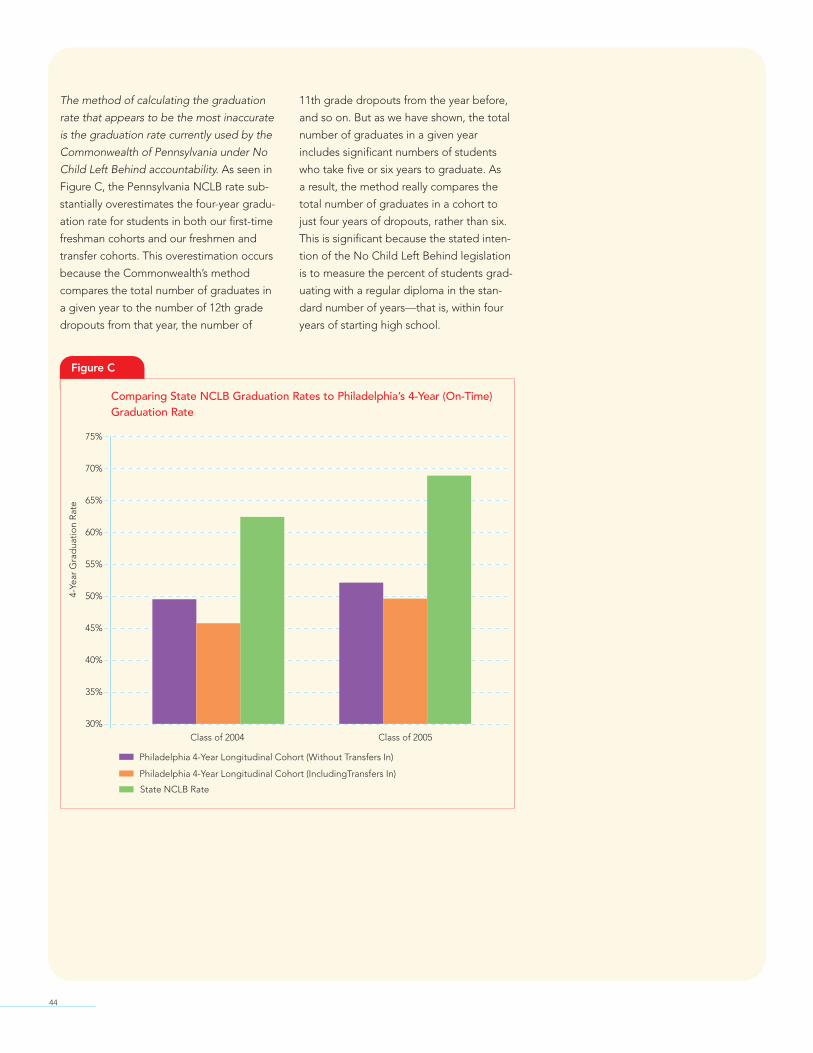
44
The method of calculating the graduation
rate that appears to be the most inaccurate
is the graduation rate currently used by the
Commonwealth of Pennsylvania under No
Child Left Behind accountability. As seen in
Figure C, the Pennsylvania NCLB rate sub-
stantially overestimates the four-year gradu-
ation rate for students in both our first-time
freshman cohorts and our freshmen and
transfer cohorts. This overestimation occurs
because the Commonwealth’s method
compares the total number of graduates in
a given year to the number of 12th grade
dropouts from that year, the number of
11th grade dropouts from the year before,
and so on. But as we have shown, the total
number of graduates in a given year
includes significant numbers of students
who take five or six years to graduate. As
a result, the method really compares the
total number of graduates in a cohort to
just four years of dropouts, rather than six.
This is significant because the stated inten-
tion of the No Child Left Behind legislation
is to measure the percent of students grad-
uating with a regular diploma in the stan-
dard number of years—that is, within four
years of starting high school.
Comparing State NCLB Graduation Rates to Philadelphia’s 4-Year (On-Time)Graduation Rate
75%
70%
65%
60%
55%
50%
45%
40%
35%
30%Class of 2004
4-Ye
ar G
rad
uatio
n R
ate
Class of 2005
Philadelphia 4-Year Longitudinal Cohort (IncludingTransfers In)
Philadelphia 4-Year Longitudinal Cohort (Without Transfers In)
State NCLB Rate
Figure C
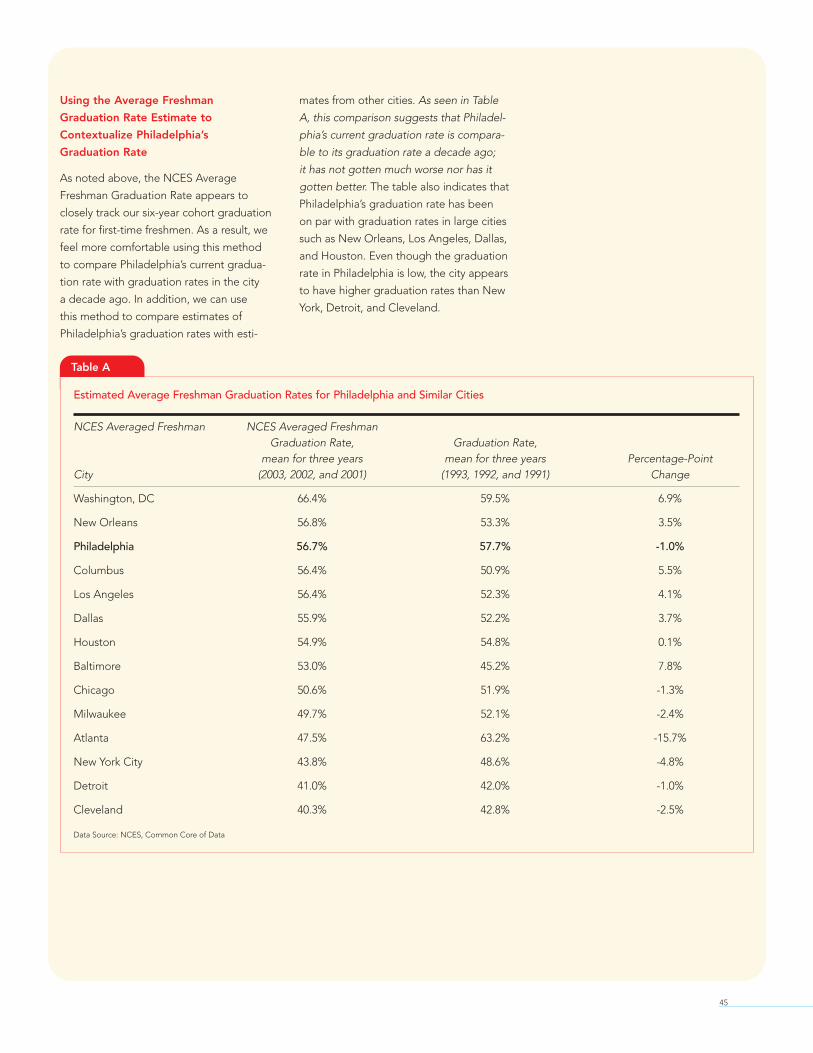
Using the Average Freshman
Graduation Rate Estimate to
Contextualize Philadelphia’s
Graduation Rate
As noted above, the NCES Average
Freshman Graduation Rate appears to
closely track our six-year cohort graduation
rate for first-time freshmen. As a result, we
feel more comfortable using this method
to compare Philadelphia’s current gradua-
tion rate with graduation rates in the city
a decade ago. In addition, we can use
this method to compare estimates of
Philadelphia’s graduation rates with esti-
mates from other cities. As seen in Table
A, this comparison suggests that Philadel-
phia’s current graduation rate is compara-
ble to its graduation rate a decade ago;
it has not gotten much worse nor has it
gotten better. The table also indicates that
Philadelphia’s graduation rate has been
on par with graduation rates in large cities
such as New Orleans, Los Angeles, Dallas,
and Houston. Even though the graduation
rate in Philadelphia is low, the city appears
to have higher graduation rates than New
York, Detroit, and Cleveland.
45
Table A
Estimated Average Freshman Graduation Rates for Philadelphia and Similar Cities
NCES Averaged Freshman NCES Averaged FreshmanGraduation Rate, Graduation Rate,
mean for three years mean for three years Percentage-PointCity (2003, 2002, and 2001) (1993, 1992, and 1991) Change
Washington, DC 66.4% 59.5% 6.9%
New Orleans 56.8% 53.3% 3.5%
Philadelphia 56.7% 57.7% -1.0%
Columbus 56.4% 50.9% 5.5%
Los Angeles 56.4% 52.3% 4.1%
Dallas 55.9% 52.2% 3.7%
Houston 54.9% 54.8% 0.1%
Baltimore 53.0% 45.2% 7.8%
Chicago 50.6% 51.9% -1.3%
Milwaukee 49.7% 52.1% -2.4%
Atlanta 47.5% 63.2% -15.7%
New York City 43.8% 48.6% -4.8%
Detroit 41.0% 42.0% -1.0%
Cleveland 40.3% 42.8% -2.5%
Data Source: NCES, Common Core of Data

46
Alexander, Karl, Doris Entwisle, and Carrie Horsey. (1997). "From first grade forward: Earlyfoundations of high school dropout." Sociology of education 70:87–107.
Allensworth, Elaine. (2005). Graduation and dropout trends in Chicago: A look at cohortsof students from 1991 through 2004. Chicago: Consortium on Chicago School Research.
Allensworth, Elaine, and John Easton. (2005). The on-track indicator as a predictor ofhigh school graduation. Chicago: Consortium on Chicago School Research.
Balfanz, Robert, and Liza Herzog. (2006). Keeping middle gradesstudents on track to graduation. PowerPoint accessed athttp://www.philaedfund.org/powerpoint/dropoutresearch_4.06.ppt
Boesel, David, Nabeel Absalam, and Thomas M. Smith. (1998). Education and labormarket outcomes of GED certification. Washington, DC: National Library of Education,Office of Educational Research and Improvement, U.S. Department of Education.
Brookings Institution Center on Urban and Metropolitan Policy. (2003). Philadelphia infocus: A profile from the Census 2000. Washington, DC: Brookings.
Cameron, Steven V., and James J. Heckman. (1993). “The nonequivalence of high schoolequivalents.” Journal of labor economics 11:1–47.
Dobbs, Michael. (November 8, 2003). “Education ‘miracle’ has a math problem.”The Washington Post. Page A01.
Engberg, John, and Brian Gill. (2006). Estimating graduation and dropout rates withlongitudinal data: A case study in the Pittsburgh Public Schools. RAND WorkingPaper WR-372-PPS.
Finn, Jeremy D. (1989). "Withdrawing from school." Review of educational research59:117–142.
Fry, Richard. (2003). Hispanic youth dropping out of U.S. schools: Measuring the chal-lenge. Washington, DC: The Pew Hispanic Center.
REFERENCES

47
Greene, Jay, and Marcus Winters. (2006). Leaving boys behind: Public high schoolgraduation rates. New York: Center for Civic Innovation, The Manhattan Institute.
Hammack, Floyd. (1986). "Large school systems' dropout reports: An analysis ofdefinitions, procedures, and findings." Teachers College Record 87:324–341.
Junn, Jane. (2005). “The political costs of unequal education.” Paper presentedat the Symposium on Social Costs of Inadequate Education, Teachers’ College,Columbia University.
Laird, Jennifer, Stephen Lew, Matthew DeBell, and Chris Chapman. (2006). Dropoutrates in the United States: 2002–2003. U.S. Department of Education NCES Report2006-062.
Legters, Nettie, Robert Balfanz, Will Jordan, and James McPartland. (2002).Comprehensive reform for urban high schools: A talent development approach.New York: Teachers College Press.
Moretti, Enrico. (2005). “Does education reduce participation in criminal activities?”Paper presented at the Symposium on Social Costs of Inadequate Education,Teachers’ College, Columbia University.
Murnane, Richard J., John B. Willett, and John H. Tyler. (2000). “Who benefits fromobtaining a GED? Evidence from high school and beyond.” Review of economicsand statistics 82:23–37.
National Forum on Education Statistics. (2006). Accounting for every student:A taxonomy for standard student exit codes (NFES 2006-804). U.S. Departmentof Education. Washington, DC: National Center for Education Statistics.
National Governors Association. (2005). Graduation counts: A report of the NationalGovernors Association Task Force on State High School Graduation Data.Washington, DC: National Governors Association.
Newmann, Fred M., Gary G. Wehlage, and Susie D. Lamborn. (1992). "The signifi-cance and sources of student engagement." Pp. 11–39 in Student engagement andachievement in American secondary schools, edited by Fred Newmann. New York:Teachers College Press.
Pennsylvania State Department of Education. (2005). Electronic dropout/graduatereport (EDGR): Dropout instructions for school year 2004–05.
Pennsylvania State Department of Education. (2005). Public secondary schooldropouts in Pennsylvania: 2003–04.
Roderick, Melissa, and Eric Camburn. (1999). "Risk and recovery from course failure inthe early years of high school." American Educational Research Journal 36:303–343.
Rouse, Cecelia Elena. (2005). “The labor market consequences of an inadequateeducation.” Paper presented at the Symposium on Social Costs of InadequateEducation, Teachers’ College, Columbia University.
Rumberger, Russell. (1983). “Dropping out of high school: The influence of race, sex,and family background.” American educational research journal 20:199–220.
Rumberger, Russell. (2004). “Why students drop out of school.” Pp. 131–155 inDropouts in America: Confronting the graduation rate crisis, edited by Gary Orfield.Cambridge, MA: Harvard Education Press.
Waldfogel, Jane, Irwin Garfinkel, and Brendan Kelly. (2005). “Public assistanceprograms: How much could be saved with improved education?” Paper present-ed at the Symposium on Social Costs of Inadequate Education, Teachers’College, Columbia University.
Wehlage, Gary, Robert Rutter, Gregory Smith, Nancy Lesko, and RicardoFernandez. (1989). Reducing the risk: Schools as communities of support.Philadelphia: Falmer Press.

48
1Standard and Poor’s data for Philadelphia may be accessed at www.schoolmatters.com.
2No Child Left Behind report cards published by the School District of Philadelphia maybe accessed at http://phila.schoolnet.com/outreach/philadelphia/nclbschoolreports/.
3Additional information about PAsecureID may be found onthe website of the Pennsylvania State Department of Education:http://www.pde.state.pa.us/ed_tech/cwp/view.asp?A=169&Q=117631.(Retrieved July 10, 2006).
4Graduation Counts: A Report of the National Governors Association TaskForce on State High School Graduation Data (2005) may be accessed athttp://www.nga.org/Files/pdf/0507GRAD.PDF. (Retrieved July 10, 2006).
5The state report on 2003–2004 high school dropout in Pennsylvania may be accessed athttp://www.pde.state.pa.us/k12statistics/lib/k12statistics/2003–04DROPOUTLISTINGrev1.pdf.(Retrieved July 10, 2006). The state calculates the annual dropout rate as the total num-ber of dropouts in grade 7–12 divided by the total number of enrollments in thosegrades. The state uses data reported by districts.
6An example of using an age cohort is found in Elaine Allensworth’s Graduation andDropout Trends in Chicago: A Look at Cohorts of Students from 1991 Through 2004,published by the Consortium on Chicago School Research. To take into account stricterpromotion standards in the elementary grades (which might have discouraged studentsto such a point that they dropped out before entering high school), Allensworth usedan age 13 cohort to track changes in graduation rates over time.
7National Governors Association, page 15.
8Electronic Dropout/Graduate Report (EDGR): Dropout Instructions forSchool Year 2004–2005. (2005). p. 4. The document can be accessed at:http://www.pde.state.pa.us/k12statistics/lib/k12statistics/2004-05dropinstrmanr.pdf.
9Ibid.
10A few schools are “ungraded.” These schools include Franklin Learning Center (a mag-net high school) and some disciplinary schools. We have included these students in theanalysis because, were they attending a school with a conventional system of grades,they would be in 6th grade or above. These “ungraded” students make up 1.3% of thecross-sectional data set.
11Students who left the district during the 2003–2004 school year but returned beforethe end of the school year are classified as not having left the district. For example, astudent who dropped out in March but returned in May and continued to be enrolledthrough June is classified as “enrolled.”
ENDNOTES

49
12In this analysis, students who left a Philadelphia charter school for a non-charter publicschool in Philadelphia are coded as transferring.
13Other analyses indicate that students at disciplinary schools (like the one that con-tributes most of the ungraded students to this analysis) have earned few credits. If theywere assigned to a grade, they would almost certainly substantially increase the per-centage of dropouts who were in 9th and 10th grade.
14Students who miss school for 10 consecutive school days can be disenrolled by theschool. To stay enrolled, then, the truant-dropouts would most likely have had anuneven pattern of showing up to school here and there, but not being absent formore than 10 days in a row.
15This table does not include students who were listed as transferring to another schoolor who were withdrawn from school because of death or illness.
16The percentage of students who are low income is defined as the percentage receiv-ing free or reduced price lunch. Data obtained from the Common Core of Data for2003–04.
17During the time period covered in this analysis, a small but growing number ofPhiladelphia high school students attended new, typically smaller high schools orcharter schools. Charter schools are included in our annual dropout rate analysis,because its goal was to understand how many students become out-of-school youthin Philadelphia in a single year. However, we do not include charter schools in our lon-gitudinal cohort analysis because of uneven data collection procedures with charterschools, particularly in their initial years. In the longitudinal cohort analysis, studentswho moved to charter schools are considered transfers. The movement to create newand typically smaller high schools in Philadelphia is too young to have impacted ouranalysis as only two of these schools (off-shoots of Bartram High School) have been inexistence long enough to have high school graduates in the time period we examined.
18Graduation and dropout rates for the Class of 2004 are estimated. Between the Classof 2003 and the Class of 2004, there was a more than fivefold increase in the numberof students in vocational and disciplinary schools who did not have a reported gradua-tion/dropout/enrollment outcome—their data in key fields was simply missing. Weimputed four- and five-year graduates for vocational and disciplinary school studentsusing the change in neighborhood school graduation rates between 2003 and 2004for both first-time freshmen and students who transferred in after 9th grade. Sevenhundred sixty-one students attending vocational or disciplinary schools are imputed asfour-year graduates, and a total of 781 students in these types of schools are imputedas graduating within five years. These imputed graduates were added to the raw totalsof students already coded as “graduates” from the Class of 2004 to create the adjustedClass of 2004 graduation rates. These imputed graduates were then subtracted fromthe dropout category in Figure 1. For all other cohorts, the percentages of studentswhose educational status was unknown are similar. Because of the relatively small num-ber of imputed graduates, this estimate should not have a large margin of error.
19We cannot verify the percentage of students who were coded as transferring to anoth-er educational institution who actually did so. Our analysis of the distribution of with-drawal codes in these cohorts suggests that the modal year for transferring was, withone exception (Class of 2002), the first year of high school; we suggest that many ofthese transfers occurred at the beginning of the year when parents informed the dis-trict that their 9th graders would be attending private or charter high schools. For eachcohort, more than half of the student transfers occurred within two years of enteringhigh school. However, it is likely that some of the students coded as transfers weredropouts, which would bias downward our estimate of dropout and bias graduationrates upward. But this bias is likely offset, at least to some degree, by our designationas dropouts of all students lacking withdrawal codes.
20A student transferring to a Philadelphia charter school from a non-charter school inPhiladelphia is counted as a transfer.
21Here, we define a student’s school as the school he or she attended for 9th grade. Astudent who attended a magnet school for 9th grade but enrolled in a neighborhoodhigh school for 10th–12th grade would be counted in the “magnet” category.
22Graduation rates for the Class of 2004 are estimated. See Footnote 18 for estimationmethods. Because the Class of 2004 has nearly a 50/50 split in gender, we added halfof imputed graduates to the raw number of male graduates and half to the raw num-ber of female graduates.
23That is, their status was “dropout” in June 2004, eight years after starting high school.
24During the 1996–1997 school year, 9th graders needed to earn at least 5 credits to bepromoted to 10th grade, including one credit each in science, math, and English.
25“Substantiated abuse or neglect” is defined as abuse or neglect that has been investigat-ed by a social worker, who has determined that there is evidence that the abuse or neglecttook place and who initiates court-ordered oversight and services to the child or family.
26A “foster care placement” includes traditional foster care placements in a family, aswell as placement in a group home, a shelter, or an independent living arrangement.
27Students who were arrested but had the charges dismissed, were placed on probation,or had some outcome other than being placed in a juvenile justice facility are notcounted as being in contact with a juvenile justice agency in this analysis.
28The next testing year for this cohort was 11th grade, which most dropouts did not reach.
For more information about the Philadelphia Youth
Transitions Collaborative and Project U-Turn,
please contact:
Philadelphia Youth Transitions Collaborative
c/o Philadelphia Youth Network
714 Market St., Suite 304
Philadelphia, PA 19106
1-877-TURN-180
www.projectUturn.net
Additional funding for Project U-Turn has been provided by: