Embed Size (px)
Citation preview

THE DIGITAL DIVIDE:
DEFINITIONS, MEASUREMENT, AND POLICY ISSUES
by
Roger G. Noll, Dina Older-Aguilar, Gregory Rosston and Richard R. Ross
Digital divide is the latest evocative term that refers to differences in access to and uses of information technology that are correlated with income, race and ethnicity, gender, age, place of residence, and other measures of socioeconomic status. According to the Department of Commerce, some people “have the most powerful computers, the best telephone service and fastest Internet service, as well as a wealth of content and training relevant to their lives.... [A]nother group of people ... don’t have access to the newest and best computers, the most reliable telephone service or the fastest or most convenient Internet services. The difference between these two groups is ... the Digital Divide.”i
The purpose of this essay is to provide a brief introduction to the concept of the digital divide. This essay will broadly outline the nature of the digital divide and the policy issues surrounding it, and will review the facts and research findings on three main themes: the magnitude of the gap in access to and usage of information technology (IT); IT usage patterns, especially among disadvantaged groups; and IT uses in elementary and secondary education. I. Describing the Digital Divide
As is apparent from the definition put forth by the Department of Commerce, the digital divide refers to many aspects of information technology, and so can not easily and simply be explained and measured. Nevertheless, a few generalizations stand at the core of the concept, and have shaped the policy debate.
In part the digital divide is about differential access to hardware. In this sense, the digital divide is a simple extension of the century-old goal of “universal service” in ordinary telephones, which refers to the notion that telephone service is so necessary for full participation in modern life that every household ought to have it. The rise of the Internet caused the policy debate over the definition of universal service to expand beyond telephones to include computers that are connected to the public telecommunications network. Thus, the first measurement task, summarized in the Section II, is to reveal the patterns of IT access across socioeconomic groups.
Another aspect of the digital divide refers to software and the uses of information technology. The point of acquiring the hardware to connect to the Internet is to gain access to information, entertainment, and other types of software and data bases. The extent to which a user can access all of these services is governed in part by hardware – the technical characteristics of the user’s computer and physical connection to the Internet.

In the case of telephones, the core service – the ability to hold audible conversations with others – has the same basic technical features and quality for all users. Product differentiation among consumers in telephony is limited to their number of lines and extensions, not the core quality of the service. For Internet services, consumers are offered several types of network access, from a relatively slow ordinary telephone line to technologies that can transmit much greater amounts of information, and so support far more complex computer services involving such things as full-motion video pictures. Thus, in the digital world, product differentiation in access technology involves considerable variability among consumers in the kinds of information services that, as a practical matter, are or could be made available to them. Because the Internet is in its infancy, the services that will emerge and the uses that people will make of them, especially members of disadvantaged groups, who generally use IT less intensively, are only just beginning to emerge. The little we know about this issue also is summarized in Section II.
Still another aspect of the digital divide refers to access to the full range of services through the consumer’s network connection, and is called the “equal access” issue. In general, information technology services differ substantially in the number and diversity of products that are available to consumers. Both computers and end-user information services are competitive industries, and the latter contains not only numerous commercial ventures but literally millions of free web sites, many of which are maintained by amateurs. Other components of the digital information technology system are not competitive, notably the hardware connecting customers to the network, the operating system on a personal computer, and network browser software.
At present, very few companies supply high-quality Internet access: telephone companies supply Digital Subscriber Lines (DSL), cable television companies supply roughly the same quality service through cable modem access, a few wireless companies, although high-speed wireless access is still in the developmental stage, and most recently satellite companies. Because the first three technologies are not fully rolled out, the majority of customers face only one or two realistic alternatives.
All high-capacity access technologies must access the Internet through some form of navigational gatekeeper, called an Internet Service Provider (ISP). In the case of cable, satellites and wireless, but not yet telephone companies, high-speed access usually is bundled with an ISP that is affiliated with the access provider. Likewise, almost all home computers use the Windows operating system, which incorporates Microsoft’s ISP as the default gateway to the Internet.
The “equal access” problem refers to the prospect that competition among ISP’s will be as limited as competition among hardware access alternatives and computer operating systems due to the bundling of access with a designated ISP. The potential problems arising from limited competition among only a few ISPs are, first, that service prices will be high, thereby denying Internet access to households that would be able to afford it at competitive prices, and, second, that ISPs that are affiliated with hardware or operating system companies will disadvantage unaffiliated Internet information service providers, thereby substantially reducing the extent of competition, diversity, and quality in Internet services.
The final element of the policy debate over the digital divide is to identify the specific
reasons that society might want to do something to narrow the gap in access to information technology. In part the policy debate is about standards and regulations, such as whether Microsoft should be permitted to bundle Internet Explorer with Windows and whether cable and telephone companies ought to be prevented from channeling their high-speed Internet access customers through their affiliated ISP. But the larger part of the debate is about the extent to which aspects of digital technology ought to be subsidized so that a larger number of customers can afford to use it. In the latter case, especially, the debate quickly focuses on precisely which kinds of information services ought to be ubiquitously available to all citizens.
The presence of gaps in access and usage of IT among various socioeconomic groups is hardly surprising, and raises the core question about the policy significance of the digital divide: Why is IT so special that society ought to intervene to encourage consumer utilization of IT rather than other goods and services that also are possessed and used less extensively by disadvantaged groups? Fundamentally, low income, social and geographic isolation, and poor education lead to “divides” in all aspects of life. We easily could document a nutritional divide (low socioeconomic status individuals are less likely to have a healthy diet), a residential divide (these households are less likely to have adequate housing, indoor plumbing, and heating), and a political divide (likewise, these households have lower political participation – they do not vote or engage in civic activities as frequently as higher socioeconomic status individuals). The proposed answer to this question is that advanced IT can help disadvantaged individuals overcome these other problems, including the over-riding cause of their disadvantage, which is low income. If disparities in access continue, advocates fear that “the gap between low-income and high-income communities is in danger of becoming worse.”ii
The possibility that information technology is capable of vastly improving the economic success and social conditions of disadvantaged groups is not new. In the early 1970s, many visionaries regarded cable television as a good candidate to educate and inform so as to enable consumers to qualify for and to find better jobs, to make better choices as consumers, and to become better parents.iii The arguments today about the potential of the Internet for elevating the conditions of the disadvantaged have surprisingly large overlaps with this earlier debate.
Probably the greatest attention has been given to educational uses of information technology, especially the use of computers and the Internet in elementary and secondary education. Indeed, the Telecommunications Act of 1996 specifically mentions ubiquitous Internet access from schools as one of the major goals of “universal service” policy, and many states have embarked on ambitious plans to achieve this objective. A great deal of research has been devoted to developing IT for educational purposes and then monitoring its effects on educational attainment. The results of this research are summarized in Section III of this report. II. Measuring the Digital Divide
In the past few years a large number of studies have examined the use of information technology in general, and computers and the Internet in particular. These studies employ many different methodologies and reach differing conclusions, but cumulatively they agree on
two core points: ordinary telephone technology is very near complete, ubiquitous coverage, while the use of computers and the Internet is in its early stages but growing rapidly.
The National Telecommunications and Information Agency (NTIA) has issued a series of reports that use Current Population Survey (CPS) data to examine the questions of computer and Internet access and usage. Other surveys and data gathering rely on different samples that are not directly comparable to the NTIA reports, but are useful for understanding different aspects of Internet connection and usage.
Obviously, a necessary condition for using the Internet and other software is access to a computer. Table 3 presents the information about computer ownership. Computer ownership is growing at an extremely rapid rate, and growth is rapid among all demographic categories.
NTIA data show that ownership of a computer is very likely to lead to Internet use. In 1997, only about half of computer-owning households were connected to the Internet. By 2000, more than 80 percent of those households were connected, while 15% more households had a computer. The difference between the proportion of households owning computers and having Internet connections is about ten percentage points.
The NTIA data also show that the proportion of households with an Internet connection has more than doubled in three years from 18.6% of all households in 1997 to 41.5% in 2000 (Table 1). Household Internet connection more than doubled for every income group below $50,000 from 1997 to 2000, but fewer than 20% of households with incomes below $20,000 have an Internet connection. Household Internet connections have at least doubled since 1997 for every racial category in the NTIA data. In fact, all racial groups now have connection rates higher than white connection rates were in 1997. More than one-fourth of older households have Internet connections, nearly triple the rate in 1997.
NTIA also has data on individual Internet connections as does a Summer 2000 survey by the Pew Internet and American Life Project. Both surveys show results similar to the household data. Connections are higher for people with higher incomes, for whites, and for those with more education. The connection rate for individuals is slightly higher than the connection rate for households because some people have connections at work, school, or a public library but not at home, and because households with Internet connections have more people in the household.
Internet connection rates have increased extremely rapidly, especially compared with the adoption of other communications technologies. For example, in 1991, forty years after the first introduction of cable, 58 percent of television households subscribed to basic cable service.4 By 1999, that had increased to 67 percent, a growth rate of about 1 percent of households per year from 1991.
Telephone service took a much longer time to reach a majority of households subscribe. In 1920, more than 40 years after the introduction of the telephone, only 30 percent of American households had telephone service.5 By 1983, this had increased to more than 90 percent of households. Since then, telephone penetration has increased about 3 percent. Differences by Socioeconomic Status
Tables 1-3 provide information about connection rates across groups. Differential connection rates have been the center of the much discussion about the Internet. The NTIA reports over the four years have been very concerned with this issue. They have all adopted the title Falling Through the Net and have focused on the differences between those who have connected to the Internet and those who have not.
It seems very clear that Internet connection increases with income. In each of the tables, the connection rate for the highest income group is around ¾ whereas the lowest income group connects at a rate between 18 and 30%. A second differential exists between racial groups. For example, the overall percentages show that black households connect at roughly half the rate of white households (23.5% vs. 46.1%); however, it is important to consider the effect of income when making these comparisons. Table 1 shows that even correcting for income, blacks and Hispanics have lower connection rates than white households, while Asian American and Pacific Islanders have connection rates that are higher than whites for all income levels.
While Internet access has increased significantly for all groups, it has increased at different rates, and the difference between access for low-income, black and Hispanic households and the national average has increased. This means that while both sets were approximately doubling connections, the lower initial level of disadvantaged groups means that the differential has increased. But if black, Hispanic, and low-income household connection rates continue their rate of increase, they will begin to catch up to the national averages. One can interpret these statistics in different ways: the gap between different groups is increasing, but every group is increasing its Internet connection rate and the growth rate is highest among disadvantaged groups.
According the Pew study, those who plan to get Internet connections also differ by income. Nearly ¾ of high-income households that are not currently connected plan to do so, whereas 38% percent of households with incomes below $30,000 plan to connect. Even though a smaller percentage of low income household plan to get online, because more are not connected growth in internet access will be higher among low-income households and the gap between high-income and low-income household connections will shrink, assuming the Pew results are accurate reflections of future interconnection rates.
The policy debate also focuses on making sure that rural America does not get left behind in the transition to a digital economy.6 The third column in Table 2 show that 38.9 percent of rural households are connected to the Internet, 2.6 percent below the nationwide average (41.5 percent from Table 1), up from 22.2% in 1998. This increase of more than 16% of rural households caused the differential between rural connections and the national average to fall from 4 percentage points to 2.6.7 At all income levels, the connection rates of rural residents are nearly equal to connection rates of the country as a whole.
It is not surprising that rural connections to the Internet are comparable to the nation as a whole. Downs and Greenstein undertook an extensive research project to calculate the percentage of households in the US that had the ability to connect to an Internet service provider with a local (non-toll) telephone call.8 They found that nearly 92 percent of the country could do so in early 1998. These results reflect the cost structure for providing dial-up Internet service, which exhibits relatively small scale economies for simple, content-free

service. Hence, areas with low population density do not face substantially higher costs of connection, and so are unlikely to be especially disadvantaged in access and usage other than for reasons that are captured by measures of socioeconomic status.
The second three columns in Table 2 show Internet connection data for central city households.9 All central cities have many local Internet service providers. The connection rates for each income level are very similar to the rural connection rates; however, the overall connection level for central city households is below that of rural areas because the former have a higher proportion of lower income households. Internet connections for the lower income levels at least doubled from 1997 to 2000. In contrast to the rural households, the connection rates in central cities grew at a slower rate than the nation as a whole.
The comparisons between rural and central city households provide some important insights into the possible causes of differential connection rates and shed light on the effectiveness and appropriateness of various policy alternatives. At current rates for Internet service and local telephone service, rural households appear to have similar opportunities to connect to the Internet as residents of urban areas and central cities. This circumstance is likely to change if high-speed access becomes the norm for Internet access, for the only current technology that can provide high-speed access to most rural areas is satellites, which has technical problems and is costly. Other than through telephone service, rural Internet service is not subsidized. If rural high-speed access begins to be subsidized, it is important to understand that taxing urban subscribers to subsidize rural areas will increase prices in other areas. Given that central cities have lower Internet subscription rates than rural areas, this cross-subsidization could have the perverse effect of lowering connection rates in the areas where Internet penetration is lowest.10 Internet Usage
The way that individuals use the Internet will have important implications for any public policy actions that seek to increase the penetration of the Internet. Many argue that connection to the Internet is vital to participation in the digital economy and the democratic process.
The UCLA Internet report examines how people use the Internet, and finds that people who have more experience online spend more time online working at home, looking for new Internet sites, and making investments. People with less than a year of experience online spend more time playing games and pursuing hobbies.11 At least two possible interpretations of these data are possible. The first is that people learn more about the possibilities of the Internet over time and feel more comfortable with the Internet as a tool as they gain experience. The other interpretation is that more serious Internet users signed up for service earlier. If the latter interpretation is correct, subsequent subscribers will tend to be less commercially oriented in their Internet use. The data presented in the survey provide no basis to distinguish between the two alternative interpretations.
High-speed Internet access has become an important feature of many policy debates. It was a major issue in the AOL-Time Warner merger proceeding at the Federal Trade Commission, and the Federal Communications Commission has an open proceeding asking questions about whether the Commission should take action to regulate or made open access

to high speed cable data lines. Residential consumers have two practical means to get high-speed access now – either cable modem or DSL service. In addition, new technologies for high-speed wireless access are, if one is to believe satellite and wireless carriers, about to become widely available. DSL service is limited to customers who live within about three miles of their central office telephone switch, and thus can not provide a good alternative for customers in rural areas where loop lengths are significantly longer; however, new technologies are expected to extend the reach of DSL to about eight miles. Cable modem service is an asynchronous service using a shared loop so that extensive use by neighbors can degrade service quality unless the cable company allocates more channel space to the service, which cable companies so far have not been willing to do.
High-speed access service provides the potential for advanced services like streaming video and other high-value content. NTIA found that 10.7 percent of Internet connected households had high-speed connections. This ranged from slightly above 7 percent for low income households to almost 14 percent for high-income households. None of these are extremely high – low-speed dial up represents the vast majority of connections in all income categories.
We are relatively early in the development of the Internet and corresponding content. Owning a computer is more valuable because of the ability to connect to the Internet. And connecting to the Internet is made valuable because of the content available. Computers, connection and content are complementary goods. As each becomes less expensive and better, demand for the complements will increase. As high-speed connections increase, there will be more specific additional high-speed content. With more variety of content, more specific content and content tailored to specific connection methods, the value to connecting to the Internet should increase.
This increase in usage may highlight more issues relating to differential access to the Internet even among those who are connected. It may be the case that some households have access to more and better services, much like some households subscribe to cable and pay cable services. Other issues like whether the network operator (eg. cable modem provider) can limit the services or affect competition are likely to arise as well.
The gap in home access and usage overstates the gap in access to computers and the internet. Survey data shows that some individuals without home computers are still able to use the internet. In 1998, 17% of Americans (16.1% of Californians) accessed the internet outside their home, largely at work. Fifty-six percent of Americans who access the internet outside the home used the internet at work, approximately 30% used the internet at school and about 13% accessed the internet on someone else’s computer. Library access was less common, with only around 7% of respondents reporting internet use at the library.12 Through these combined sources, almost as many people accessed the internet through sources outside the home (17.0%) as had home access (21.4%).13 While the division of access between home and other sites has likely tilted towards the home over the past two years, there is evidence that people without home connections are often still able to connect to the internet. A question for further research is how the nature and quality of use differs for users at different access points.

Reasons for Declining to Use the Internet Analysis of the connection differentials between different groups and any resulting
policy prescriptions need to take into account reasons why people are not connected to the Internet. The Pew Internet and American Life Project released the results of a survey in September 2000 that provides some insight into these questions. They found that “57% of those without Internet access say they do not plan to log on.”14
The survey results find that these attitudes depend upon age – older Americans are much less likely to desire to be connected than younger people. The majority of those not online who are under 50 years old plan to connect to the Internet. The report goes on to state that “[s]ignificant numbers of non-users cite issues besides the cost of computers and Internet access as problems when they think about the online world.”15
Pew examined demographically comparable people who used and did not use the Internet. They found that recreational activity and e-mail were important factors motivating internet connections. “This analysis suggests that high-minded pitches about the civic, educational, or even commercial virtues of the Internet would probably not be enticing to those in the Never group. Rather, it suggests that Nevers might be more open to the idea of going online if they are convinced that the Internet is useful, entertaining, and not-too-difficult to use.”16
Finally, Pew divided the group of non-connected people into those who have never had a connection and those who previously had a connection, but terminated it. Slightly more than 10 percent of the non-connected people previously had been connected. The previously connected users are slightly more minority, have less education and lower income than current Internet users, but are reflective of the overall population. Only 11 percent of these previously connected users claimed that the connection was too expensive as a reason they gave up their connection. No longer owning a computer and changing jobs were the top two reasons. Studies of Universal Service Policy
Existing universal service policies for telephone service provide two types of subsidies. The first is “lifeline” subsidies for households with low incomes, and the second is a general policy to set rates below cost in rural areas and small towns. Both subsidies are then paid for by setting other prices above cost, especially for long-distance calls and business access. Virtually all economists who have studied telecommunications universal services subsidies agree that this subsidy system is deficient in many ways. In general the criticisms fall into three categories: ineffectiveness, inefficiency, and inequity.
First, some studies conclude that universal service subsidies are ineffective.17 Generally, these studies show that local telephone service is extremely price inelastic, so that subsidies of basic telephone service have little or no effect on telephone penetration because almost all households would subscribe to telephone service even at substantially increased prices. Policy actions relating to Internet connection should consider the price elasticity of connections.
Second, many studies argue that universal service subsidies are inefficient.18 The

telephone service that is subsidized is basic monthly access, which is price inelastic, while the revenue to provide subsidies comes from taxes on more elastically demanded services such as long distance service. As a result, the demand for the elastic services is muted at the same time that there is little increased in demand for the inelastically demanded services. Hausman, Tardiff and Belinfante (1993) show that because of the higher elasticity of demand for long distance service, it may be possible that connections actually decrease because of the long distance taxes.
Finally, universal service subsidy programs are criticized because they transfer substantial wealth among households of the same income.19 Telephone subsidies transfer purchasing power from urban to rural customers, from business to residential customers, and from those who make many long distance calls to those who make few long distance calls. These transfers are not predominantly from high income to low income customers. Many low-income customers live in urban areas and many high-income customers live in rural areas that receive high-cost subsidies, while households with the same income display greater variance in long-distance calling than the average difference between high- and low-income households. Policy Implications
The Internet is growing at an exceptional rate, much more rapidly than telephones or cable television did at similar stages in their histories. Not surprisingly, socioeconomic groups differ in their adoption rates of IT. The primary difference appears to be due to income, although there are also racial differences even when income is held constant.
Given the rapid adoption of the Internet, it is not clear how these differences will change over the long run, or even over the next few years. It is possible that these differences will narrow significantly as more people decide that the Internet is valuable and decide to connect. This may occur because more and different content is developed, because prices (for connection and computers) decrease, or simply because people become more comfortable with the idea of using the Internet through learning and exposure.
Another possibility is that persistent gaps will remain, just as there are for cable television and, to a lesser degree, telephone penetration. Some telephone penetration differences remain despite significant subsidy programs, both for rural high-cost areas and also for low-income households. Because lifeline telephone rates are very low and demand is price inelastic, it seems unlikely that even cutting the price to zero would have much of an effect on telephone access.
Given that the subsidies for telephone service are inefficient and that rural Internet connection is higher than inner city connections, providing a general subsidy for rural Internet connections will subsidize many people who are likely to subscribe in any case, and so is not likely to be a very effective use of scarce resources. Instead, if Internet access is to be subsidized, the subsidies should be targeted at those who would not otherwise subscribe because of cost, as with lifeline service. Because some Internet service providers offer free or very low-cost connections, programs designed to educate consumers about low cost alternatives are likely to have a larger effect on total Internet use than a program that copies the existing policy to provide a general subsidy to high-cost areas. The issue of possible subsidies for high-cost Internet connections presents similar tradeoffs in that, with present

technology, providing high-speed connections to rural areas will be extremely expensive compared to the cost of subsidies for low-income consumers in urban areas.
Based on the survey results, many people might benefit from education about where to acquire Internet-ready second-hand computers, and about how to use computers and the Internet. In addition, consumer education programs might help reduce the uncertainty about the use of the Internet. Such programs would probably be relatively low cost compared to the subsidies for rural high-cost telephone service. In addition, given that the survey results indicate that younger people are much more familiar and comfortable with the Internet, such programs would not have to grow over time. Instead, as computers and Internet connection proliferate, such programs could be reduced, rather than increased as a connection subsidy would automatically. III. IT and Education
This section reviews the research on an important component of the “digital divide,” the extent to which differences in computer use and access create unequal educational opportunities and increase the achievement gap between high and low-performing students. The effect of computer use on this gap will be determined both by computers inherent effectiveness as a learning tool and by differences in use and implementation across student groups. In addition, the effectiveness of IT as an education tool may differ among groups of students, in which case widespread adoption of the technology could either increase or decrease outcome disparities.
Given the inherent usefulness of a technology, the implementation strategy for using it will affect the realized effect on both the level and distribution of student achievement. Poor implementation will attenuate outcome gains for all students. In addition, socioeconomic characteristics may affect access and implementation experienced by an individual child. If the educationally disadvantaged are exposed to less useful applications or less adept teachers, existing differences in outcomes across groups will be exacerbated by computers.
Starting with school-based computer use and following with home use, we examine what is known about the potential usefulness of computers, the limitations created by insufficient access and sub-optimal implementation and the interactions between individual characteristics and both the potential and realized benefits of computer use. We then conclude with a discussion of the cost effectiveness of computers as an educational tool and the resulting policy implications. First though, we will provide context for the review by briefly discussing what is generally known about the factors important to children’s educational success. Home- Versus School-Based Educational Inputs
Although proponents of computer-aided learning have high expectations for the ability of computers to increase student performance, the history of education research suggests that the main factor influencing educational performance is a student’s socioeconomic background, and that external inputs have relatively little influence on children’s achievement. In 1966 the Coleman Report, a national study of schools and children, was unable to find a strong relationship between observable school inputs and children’s educational outcomes (Coleman

et al., 1966). Subsequent research has found evidence that different schools produce different educational outcomes for students having the same socioeconomic characteristics, but that one can not predict which schools will be better from measures of observable resources such as school spending, teachers’ education or class size (Hanushek, 1997). This research suggests, but does not prove, that computers, like other educational tools, have a limited effect on children’s outcomes.
In contrast to the literature on school inputs, family characteristics are highly correlated with student outcomes (Haveman and Wolfe, 1995). At-home contributions to education seem to play a large role in children’s learning. Family and individual characteristics also affect outcomes through their interaction with school resources in that family income, ethnicity, gender or ability level can affect a child’s response to an educational input. Interactions are generated when parents with different characteristics differentially affect the way in which resources are used. Individual characteristics also can affect an input’s effectiveness if teachers use the resource differently based on a child’s gender, ethnicity, ability or income.
The limited potential of school resources, the importance of in-home activities, and the interaction effects of individual characteristics are all particularly relevant to a consideration of the digital divide. While computers may be important educational tools, their potential may be limited in the absence of home investments into children’s education. The general importance of home inputs should direct attention to this setting, but nearly all research on the effects of computers is focused on school-based use. Finally, because computers can be used in many ways, they are especially subject to the kind of indirect effects that individual characteristics have on the effectiveness of educational inputs.
With this background in place we now move to an analysis of the potential effect of computers, and the “digital divide” on disparities in educational outcomes. Overall Effectiveness of Computers
In order to assess the raw potential of computers as learning tools it is useful to examine the effect of programs that were carefully and, hopefully, optimally implemented. The bulk of research into the effectiveness of computers is of this nature, focusing on a specific application or implementation. The study of specific applications yields an upper bound estimate of the effectiveness of computer use and provides information on the elements of computer applications that increase effectiveness. Many of these studies show evidence that computer use can increase some measured outcomes.
Surveys summarizing this literature20 come to different conclusions regarding the overall evidence on computer’s effectiveness as learning tools. Sivin-Kachala and Bialo (1999) assert that “education technology has demonstrated a significant positive effect on achievement,” (p.3) while Kirkpatrick and Cuban (1998) conclude that “on the basis of the critical reviews we are unable to ascertain whether computers in classrooms have in fact been or will be the boon they have promised to be” (p.6). More often than not, individual studies find that computer use leads to outcome improvements, supporting Sivin-Kachala and Bialo’s optimistic statement; however, concerns regarding the quality and relevance of these studies explain Kirkpatrick and Cuban’s hesitance to accept that large positive effects truly exist.

We return to these concerns after a discussion of the estimated overall magnitude of effects. Much of the positive evidence supporting computers’ effectiveness comes from meta-
analyses. Meta-analysis, or the statistical study of studies, aggregates the findings from multiple studies into a single estimate of effectiveness. Meta-analyses examine the results of multiple studies to estimate an average effectiveness of computer use. To compare studies that use different measures of student outcomes (for example, different states’ standardized tests), estimates of the absolute impact on achievement are converted into a uniform measure of “effect size.” Effect sizes are calculated by taking the difference in the achievement gains of experimental and control group students (i.e., students receiving computer-based instruction and those receiving traditional instruction) and then dividing this difference by the standard deviation of the measured outcome change. Intuitively, the effect size measures the impact of computer usage relative to other factors that cause student achievement levels to vary.
Several meta-analyses have found positive effects of computers on learning. Kulik (1994) reviews twelve meta-analyses conducted from 1983 to 1991 and reports effect sizes ranging from .22 to .57 (p.11). An effect sizes in this range would raise a child performing at the 50th percentile level to between the 59th and 72nd percentile. In addition, students’ attitudes towards classes are shown to improve with access to computers (p.11). Positive effect sizes within this range are also found in more recent meta-analyses studying the effects of computer use on cognitive outcomes (Liao, 1992), of word-processor use on writing instruction (Bangert-Drowns, 1993), and of computer-assisted instruction (Fletcher-Flinn and Gravatt, 1995).
In addition to the focused individual studies, two large programs are especially noteworthy: the Apple Classrooms of Tomorrow and the Buddy System Project in Indiana. Both programs integrated computer use into both the school and home learning environments.
The Apple Classrooms of Tomorrow (ACOT) studies provided children and teachers with individual computers both at school and at home (Baker, Gearhart and Herman, 1993). The program also provided teacher training encouraging use of the computers for “instructional innovation, emphasizing … the potential of computers to support student initiative, long-term projects, access to multiple resources, cooperative learning, and instructional guidance rather than stand-up teaching” (Baker, et al, 1993. 2). Despite this intense application of resources, improvement in standardized test scores were comparable to national norms.
Similar to the ACOT studies, the Buddy System Project was an Indiana state program that introduced computer intensive curriculum into the classroom and provided home computers to children in test schools. Miller and McInerney (1994-5) compare school-wide test score gains in a Buddy System school to changes in a school with similar characteristics. The authors also examine achievement gains by sub-categories of gender, academic aptitude, socio-economic status, and the length of time that the program had been in place. In the few comparisons in which the schools had statistically significant differences, the comparison group actually outperformed the group with computers. These results mirror the findings of the ACOT program.
The ACOT and Buddy programs both highlight questions about the appropriate control

groups for such studies. Because the programs were accompanied by extensive training, the effects of computer use might be confused with the effects of teacher training. An appropriate control group, therefore, would have participated in a program with a similar level of teacher support but without increased computer usage. The two programs also combine the effects of home and school-based technology use. To separate the effects of computer use at school from increased use at home, researchers need a control group that is provided with similar at-home access, but no new school-based access. Differences across Sub-groups
As in the Buddy Program, many studies examine sub-groups separately to learn if computers affect children differently based on their gender, ethnicity or socio-economic status. The general sense in the literature is that computer learning tools can be particularly effective for the educationally disadvantaged. For example, in Bangert-Downs (1993) meta-analysis of word-processor use and writing instruction, the average effect size for the 9 studies that targeted students with weak writing skills was .49, much higher than the average effect size over all studies. Kirkpatrick and Cuban (1998) note that “a plethora of reports on at-risk student use of technologies in classrooms boast positive results, but few rigorous studies have examined this population” (p. 3).
Swan, Guerrero, Mitrani and Schoener (1990) focus on the educationally disadvantaged in their study of 13 different computer-based instruction programs implemented across 26 schools in New York City. The study found statistically significant improvements in standardized reading and math tests for program participants. Improvement tended to be highest for lower grade levels and for lower performing students. This differential improvement may be driven by smaller than average class sizes in program classes. Another weakness of the study is that effects were measured by the difference between pre- and post-program scores, rather than the difference in gains between students in and not in the program. If there is a regression toward the mean in test scores, the differential effect by ability level could be an artifact of the tendency for the highest and lowest achievers in any given year to move back towards average achievement levels in the following year. For example, higher performing students might be less challenged, and realize smaller achievement gains, while lower performing students work to “catch-up.”
Further evidence that lower achieving students benefit more from access to computers is found in West Virginia Basic Skills/Computer Education (BS/CE) program study. Differences in the access to elements of the (BS/CE) program was more strongly correlated with tests score gains for students with low grades (C’s) than for students with high grades (A’s). The authors hypothesize that students without access to other educational resources are more sensitive to program resources.
In most of these studies the focus of the computer intervention is on basic skills development. It makes intuitive sense that lower ability students would benefit more from these programs. It is quite possible, though, that other programs would have the opposite bias, disproportionately benefitting high ability students. Critiques
Education researchers have several concerns with these studies that mitigate the generally positive view of this literature. To begin, many studies are fundamentally limited in their relevance due to inadequate sample size. Insufficient study length is also a problem because short-term studies may actually measure “students’ responses to the novelty of using computers rather than to the instructional potential of the delivery system” (Krendl and Clark, 1994. 90). Other key issues include the failure adequately to control for other elements in the student environment that affect outcomes and a general reliance on standardized test scores as a measure of achievement gains.
In general, the failure to control for other educational components may lead researchers to attribute to computer use gains that are actually generated by superior teaching or other inputs. Kirkpatrick and Cuban (1998) review evidence that the failure to account for the role of individual teachers may lead to an overestimation of computers’ effects. Many studies lack a true control group and simply compare students’ pre- and post-program outcomes. This approach attributes all outcome gains to the computer application even though some improvement would have been expected even without a special program intervention, especially when the computer educational tool is accompanied by extensive training of teachers and the involvement of researchers in educational activities in the classroom.
Another major shortcoming is “the typical reliance on achievement test scores as the sole indicator of instructional effectiveness” (Krendl and Clark, 1994, p. 88). This reliance is understandable given the difficulty in measuring other criteria such as problem-solving skills or the ability to synthesize information. Nevertheless, these studies tell us little about the effect of computer use on many educational outcomes of interest.
The most fundamental concern in examining studies of specific programs is their dissimilarity from the common ways in which computers actually are used. If computers are typically used in a very different way than they are in a given study, the evaluation of that program will have little to tell us about the overall effect that computers have on children’s outcomes in all school settings. The next section will review studies of computers as they are typically used. Implementation and Access Methods
Knowledge about typical computer use is needed to evaluate investments in technology that will increase access without changing the nature of usage. Differences in implementation across groups is also key to the ultimate effect of computer use on achievement dispersion.
The evidence on the general usefulness of computers in education tends to come from statistical rather than experimental studies. The former studies use regression analysis to create statistical controls for non-computer related differences in schools and students that affect outcomes. These controls are used to separate the causal effect of computers from other factors that could generate a correlation between outcomes and computer use. For example, another causal factor, like student motivation, may lead to higher levels of computer use and higher achievement. If we do not account for this third factor, its causal effect on achievement erroneously could be attributed solely to computer use.
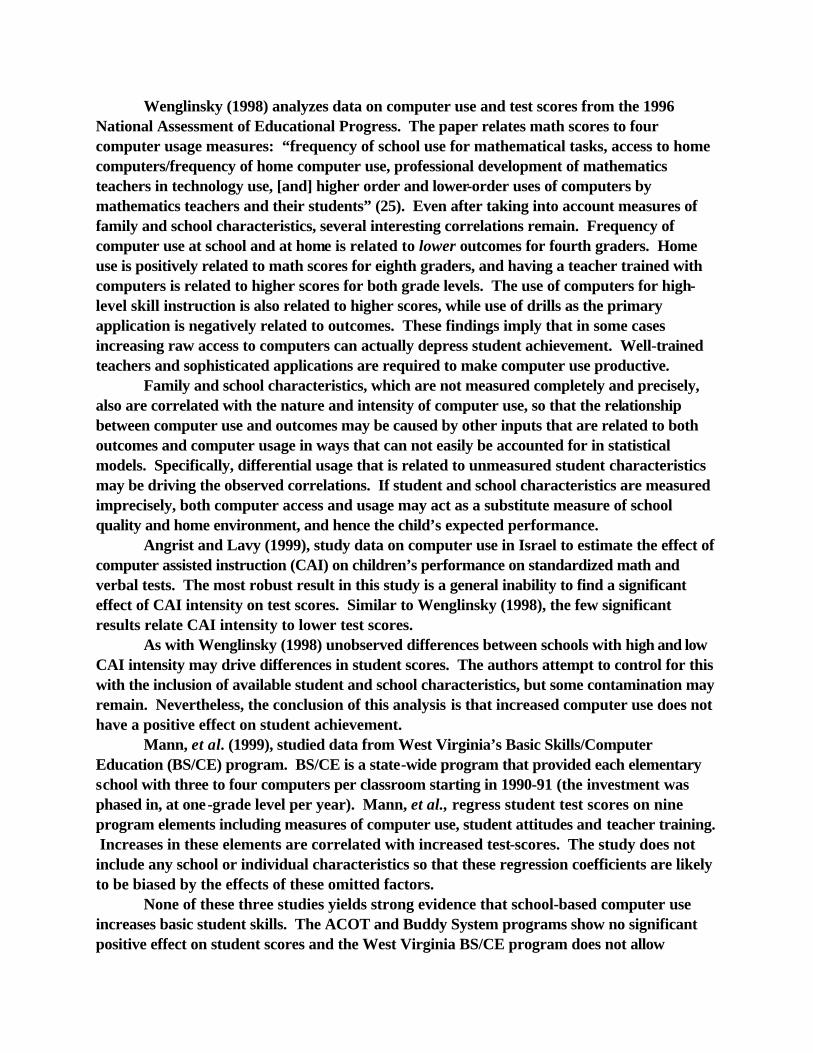
Wenglinsky (1998) analyzes data on computer use and test scores from the 1996 National Assessment of Educational Progress. The paper relates math scores to four computer usage measures: “frequency of school use for mathematical tasks, access to home computers/frequency of home computer use, professional development of mathematics teachers in technology use, [and] higher order and lower-order uses of computers by mathematics teachers and their students” (25). Even after taking into account measures of family and school characteristics, several interesting correlations remain. Frequency of computer use at school and at home is related to lower outcomes for fourth graders. Home use is positively related to math scores for eighth graders, and having a teacher trained with computers is related to higher scores for both grade levels. The use of computers for high-level skill instruction is also related to higher scores, while use of drills as the primary application is negatively related to outcomes. These findings imply that in some cases increasing raw access to computers can actually depress student achievement. Well-trained teachers and sophisticated applications are required to make computer use productive.
Family and school characteristics, which are not measured completely and precisely, also are correlated with the nature and intensity of computer use, so that the relationship between computer use and outcomes may be caused by other inputs that are related to both outcomes and computer usage in ways that can not easily be accounted for in statistical models. Specifically, differential usage that is related to unmeasured student characteristics may be driving the observed correlations. If student and school characteristics are measured imprecisely, both computer access and usage may act as a substitute measure of school quality and home environment, and hence the child’s expected performance.
Angrist and Lavy (1999), study data on computer use in Israel to estimate the effect of computer assisted instruction (CAI) on children’s performance on standardized math and verbal tests. The most robust result in this study is a general inability to find a significant effect of CAI intensity on test scores. Similar to Wenglinsky (1998), the few significant results relate CAI intensity to lower test scores.
As with Wenglinsky (1998) unobserved differences between schools with high and low CAI intensity may drive differences in student scores. The authors attempt to control for this with the inclusion of available student and school characteristics, but some contamination may remain. Nevertheless, the conclusion of this analysis is that increased computer use does not have a positive effect on student achievement.
Mann, et al. (1999), studied data from West Virginia’s Basic Skills/Computer Education (BS/CE) program. BS/CE is a state-wide program that provided each elementary school with three to four computers per classroom starting in 1990-91 (the investment was phased in, at one-grade level per year). Mann, et al., regress student test scores on nine program elements including measures of computer use, student attitudes and teacher training. Increases in these elements are correlated with increased test-scores. The study does not include any school or individual characteristics so that these regression coefficients are likely to be biased by the effects of these omitted factors.
None of these three studies yields strong evidence that school-based computer use increases basic student skills. The ACOT and Buddy System programs show no significant positive effect on student scores and the West Virginia BS/CE program does not allow

statements regarding the causal effect of computers on student learning. The Relationship between Family Characteristics and Implementation
Wenglinsky (1998) and Angrist and Lavy (1999) suggest that simple access to computers may not increase outcomes. The exact nature of computer use is likely to be more important than the simple presence of computers in schools. Contrary to common belief, computer access in schools is now relatively equal across socioeconomic groups, but the nature and intensity of use and the quality of teacher support varies with student characteristics.
Wenglinsky (1998) presents data on patterns of technology use by different student groups. In the 1996 National Assessment of Educational Progress, disadvantaged groups had equal or greater access to computers as measured by frequency of use; however, students from disadvantaged groups tended to have lower access to well-trained teachers and used computers in less sophisticated applications. The causal relationship between student outcomes and different measures of computer use is not entirely clear, but disadvantaged students seem to still lack equal access to the factors that are likely to make computer use productive.
Similar patterns are found in other reports on student access by ethnicity and income. Krendl and Clark (1994) review earlier figures showing that students in schools with high-SES student-bodies tended to have higher computer to pupil ratios. They also cite reports by Becker (1986) that low-income and minority students were more likely to use computers in applications with lower sophistication, “drill and practice” versus “exploratory computer activities” (p. 97). Becker (1994) reports that computer density in schools had almost been equalized across ethnic groups except for Hispanic students and students in schools that are “nearly all-minority.” He also reports evidence that children from high SES families, as well as children attending schools whose student body tends to come from families with high SES, are more likely to use computers in “higher-order” activities. Although low-SES background is related to more frequent low-order use Becker finds that “low school grades are more consistently related to low levels of computer use than is coming from a low-SES background” (section 8).
These studies paint a fairly consistent picture. Disparities in access to computer technology in schools as measured by computer density, or the ratio of students to computers, have largely been remedied. Differences in teacher training and the ways in which computers are used by students are still related to student race and income level. These latter differences are likely to affect the use of computers in schools, and so will tend to increase the achievement gap across socioeconomic groups. In short, the fundamental problem remains differences in teacher quality, not differences in the presence of computers or any other educational tool. In-Home Computer Use
The importance of family and home inputs into children’s academic success suggests that home computer use may have an equal or even larger effect on children’s outcomes than school-based use. Home access has received much less study than school-based use. This

may be because “experiments” introducing computers into homes are more intrusive and expensive than programs that alter computer use at school. Nonetheless some studies examine the effect of home-based computer use. Although some studies provide students with home access to computers, these programs have not focused on specific applications in the same way that school-based experimental programs have. Most of the evidence on home access is, by default, evidence on the combined effects of home computers and the usage patterns within the home. Experimental Evidence
Correlations between home computer use and educational success largely reflect the effect on achievement of coming from a family that is likely to own a computer (high income, SES and parental education, and white or Asian). One way to find the direct causal effect of access to a home computer is to measure the impact of an experiment that randomly distributes computers to students for home-use. The Apple Computers of Tomorrow and Buddy System provided students with computers for home use. The programs also increased classroom computer use, provided teacher training and encouraged curriculum redesign. The effect of additional home computer access from these other factors can not be isolated in these programs.
Other experimental evaluations of home computer use, as reviewed in Attewell and Battle (1999) have been unable to demonstrate general positive effects of home ownership; “home-computer users as a whole have not out-performed matched control groups” (p. 1). The results of these studies is similar in flavor to the evidence that increased school computer density does not in and of itself lead to improved student outcomes. Statistical Evidence
In addition to the experimental evidence, there is some statistical evidence on the effect of home computer access. Attewell and Battle (1999) analyze data in the 1988 National Educational Longitudinal Study on the presence of computers in the home and on student outcomes. Home computer use is positively related to standardized test scores and to self-reported grades even after taking into account several key demographic and individual characteristics. On average, students with home computers scored 3% to 5% higher than students without computers.
In addition to direct effects of home computer use, home access may affect students’ in-school use and attitudes towards computers. Selwyn (1998) finds a positive relationship between home use and sophisticated in-school use (programming, simulations, e-mail and Internet) as well as on attitudes towards computers. This study does not control for student socioeconomic status, but still highlights a the potentially important interaction between home access and school use. The Effects of Family Characteristics on Effectiveness
Differences in home access to computers are much greater than differences in school access. As documented elsewhere in this report, black and Hispanic families are less likely to have home access than are white and Asian students. Poorer families and families in which

parental education is lower are also less likely to own computers. Even more important may be the way in which computer use varies across these groups. Attewell and Battle (1999) investigate the effects of home use by sub-groups. They find that female, black and Hispanic students received less of a benefit from home computer use than did male students and white students. Low SES students also received less value from home computer use than did high SES children. Giacquinta, Bauer and Levin (1993) found that the bulk of children’s at-home computer use is non-educational. Based on this finding, Attewell and Battle hypothesize that parental intervention is required to make computers effective learning tools. Families with higher socioeconomic status may be better able to encourage educationally productive computer use. Similarly, female children may receive less in-home encouragement in computer use. Race may also be linked to home use, though the authors have no evidence on differences in use across racial groups.
Computer use also may vary with the idiosyncratic value that parents place on education. Parents who are already more involved in their children’s education will be more likely to encourage productive home computer use. This will tend to exacerbate differences in student achievement since those students with high levels of in-home support will also receive greater benefits from computer use.
Similar to the evidence regarding school-based use, simple measures of access to computers may miss important differences in the ways that children use computers. The same factors that affect the distribution of traditional educational inputs will also affect the likelihood that computers are put to educationally relevant use. Overall Assessment
The research to date on the educational effects of computer use are far from clear and complete. Certainly in some cases students are significantly benefitted by both in-class and in-home computer use. There is good evidence that specific computer applications can increase student outcomes. There is also some evidence that benefits can be greater for lower achieving students, tending to decrease the gap in student outcomes. But these effects appear to depend strongly on both the school and home environment of the student. And, other evidence indicates that higher socioeconomic status students have derived more benefit from educational uses of IT.
One should not conclude from these studies that reducing the digital divide in the educational system is likely to make differences in educational outcomes even worse. But studies to date do indicate that computers are much like educational advances of the past: without parallel activities to cope with other disadvantages and to improve teacher training, as well as the entire school and home environment, computers are not likely to have much of an effect on the educational achievement of disadvantaged children.
The research to date does not show that the potential achievement gains from computer use are worth the expenditures. A few studies have estimated the relative cost-effectiveness of computers as educational tools (Krendl and Clark, 1994, p.89). These studies suggest that spending on teacher education or the purchase of other resources would lead to greater gains than equal spending on educational IT.
Even if optimally implemented programs are cost-effective, current research shows

little evidence that typical usage has significant benefits. This may be due to a disconnect between raw access and productive use. Becker (2000) finds that students are more likely to actually use computers when they are located in the classroom, rather than a lab. Teacher training and philosophy also affect the frequency of student use. These results complement the broader belief that teacher training is key to effective use (Wenglinsky (1998), Shaw, et al (1997)).
While school-based access is high for students of all ethnic and income groups, disparities remain in teacher training levels, the ways computers are used by students, home access to computers, and parental computer skills. Parental and teacher support influences the benefits that children get from computer use. Computers may be important learning tools, but their value is not accessed simply by placing them in schools. Computers affect children’s educational performance as part of a larger system of inputs. Programs that recognize the importance of this existing structure will be better able to extract the potential benefits of the computers. IV. Policy Conclusion
As we have shown, computer ownership, internet connectivity and access to high-speed broad band connections are all lower in rural areas, in households with less education and lower income, and in black and Hispanic households. There are, however, similar divides in the consumption of most costly goods. If concern over the digital divide is purely redistributive, income support programs would redistribute resources without dictating consumption choices. Additional benefits to reducing the digital divide are required to justify subsidies and spending targeted specifically to increasing computer ownership and internet access.
The most plausible argument about a social effect of computer access and usage is with respect to education. Children may not have the power to make investments in computer technology on their own behalf. The same arguments that are put forth to justify public compulsory education could apply to public initiatives to increase children’s access to computing resources.
The research on the effects of computer usage in education is inconclusive. The most important finding is that without proper support in the school and home environment, computers in the schools probably do not provide much of an educational benefit. On the one hand, the importance of the home environment implies that home computers can help children do better in school, and so provides a potential rationale for worrying about the absence of home computer access. On the other hand, the importance of the nature of home computer usage and parental support implies that simply providing hardware is not enough. And, if parents are not motivated enough to have a home computer, how will simply giving them hardware overcome this problem?
Notwithstanding this puzzle, the evidence to date does not provide convincing evidence that the digital divide as traditionally measured is a significant policy problem. Like other information technologies, beginning with the printed page, simple physical access is not the primary issue. Moreover, physical access among even low socioeconomic groups is

surprisingly high and growing. In order for information technologies actually to matter in people’s lives, the “wetware” seems to be the primary barrier.

References Angrist, J., and V. Lavy. “New Evidence on Classroom Computers and Pupil Learning.”
NBER Working Paper No. 7424 (November 1999), 1-32. Attewell, P. and J. Battle. “Home Computers and School Performance.” The
Information Society 15:1 (1999), 1-10. Baker, E.L., M. Gearhart, and J.L. Herman. “The Apple Classrooms of Tomorrow:
The UCLA Evaluation Studies.” Center for the Study of Evaluation Technical Report No. 353 (January 1993), 1-20.
Bangert-Drowns, R.L. “The Word Processor as an Instructional Tool: A Meta-Analysis of Word Processing in Writing Instruction.” Review of Educational Research 63:1 (1993), 69-93.
Coleman, J., E. Campbell, C. Hobson, J. McPartland, A. Mood, F. Weinfeld, and R. York. Equality of Educational Opportunity. Washington, D.C.: Government Printing Office (1966).
Fletcher-Flinn, C.M. and B. Gravatt. “The Efficacy of CAI: A Meta-Analysis.” Journal of Educational Computing Research 12:3 (1995), 219-242.
Becker, H.J. Analysis and Trends of School Use of New Information Technologies. Report prepared for the U.S. Congress Office of Technology Assessment. (March 1994). http://www.gse.uci.edu/doehome/EdResource/Publications/EdTechUse/C-TBLCNT.HTM.
Becker, H.J. Findings from the Teaching, Learning, and Computing Survey: Is Larry Cuban Right? Special Report on the Teaching Learning and Computing Survey: 1998 (July 2000). http://www.crito.uci.edu/tlc/html/findings.html.
Downes, T.A., and S. M. Greenstein. “Do Commercial ISPs Provide Universal Access?” Gillett and Vogelsang (eds.), Competition, Regulation and Convergence. LEA Press, 1999.
Fletcher-Flinn, C. M., and B. Gravatt. “The Efficacy of CAI: A Meta-Analysis.” Journal of Educational Computing Research 12(3) (1995), pp. 219-242.
Hanushek, E.A. “Assessing the Effects of School Resources on Student Performance: An Update.” Educational Evaluation and Policy Analysis 19:2 (Summer 1997), 141-164.
Haveman, R. and B. Wolfe. “The Determinants of Children’s Attainments: A Review of Methods and Findings.” Journal of Economic Literature 33 (December 1995), 1829-1878.
Kirkpatrick, H. and L. Cuban. “Computers Make Kids Smarter -- Right?” Technos Quarterly for Education and Technology 7:2 (Summer 1998).
Krendl, K.A., and G. Clark. “The Impact of Computers on Learning: Research on In-School and Out-of-School Settings.” Journal of Computing in Higher Education 5:2 (1994), 85-112.
Kulik, J.A. “Meta-Analytic Studies of Findings on Computer-Based Instruction.” In Technology Assessment in Education and Training, eds. E.L. Baker and H.F. O'Neil, Jr. Hillsdale, NJ: Lawrence Erblaum Associates (1994), 9-33.

Lenhart, A. “Who’s Not Online?” Pew Internet and American Life Project, September 21, 2000 (http://www.pewinternet.org/reports/toc.asp?Report=21).
Liao, Y. “Effects of Computer-Assisted Instruction on Cognitive Outcomes: A Meta-Analysis.” Journal of Research on Computing in Education 24:3 (1992), 367-380.
Mann, D., C. Shakeshaft, J. Becker, R. Kottkamp. West Virginia Story: Achievement Gains from a Statewide Comprehensive Technology Program. Milken Family Foundation Report. http://www.mff.org/publications/publications.taf?page=155 (1999).
Miller, M.D. and W.D. McInerney. “Effects on Achievement of a Home/School Computer Project.” Journal of Research on Computing in Education 27:2 (1994), 199-211.
Mayfield, K. “Plugged In, Not Dropping Out.” Wired News. November 4, 1999 (http://www.wirednews.com/news/culture/0,1284,32159,00.html).
Moller, R.M. “Profile of California Computer and Internet Users.” California Research Bureau (January, 2000).
Mueller, M. L. Universal Service: Competition, Interconnection, and Monopoly in the Making of the American Telephone System. MIT Press and AEI Press, 1974.
National Telecommunications and Information Administration. Falling Through the Net: A Survey of the “Have Nots” in Rural and Urban America. NTIA, July 1995.
National Telecommunications and Information Administration. Falling Through the Net: Defining the Digital Divide. NTIA, July 1999.
National Telecommunications and Information Administration. Falling Through the Net: Toward Digital Inclusion. NTIA, October 2000.
Rosston, G. L., and B. S. Wimmer, “Winners and Losers from the Universal Service Battle,” in Vogelsang and Compaine (eds.), The Internet Upheaval, MIT Press, 2000.
Selwyn, N. “The Effect of Using a Home Computer on Students' Educational Use of IT.” Computers and Education 31 (1998), 211-227
Sivin-Kachala, J. and E. Bialo. Report on the Effectiveness of Technology in Schools, 1990-1997. Washington, D.C.: Software & Information Industry Association (1999).
Swan, K., F. Guerrero, M. Mitrani, and J. Schoener. “Honing in on the Target: Who Among the Educationally Disadvantaged Benefits Most From What CBI?” Journal of Research on Computing in Education 22:4 (1990), 381-403.
Wenglinsky, Harold. Does It Compute? The Relationship Between Educational Technology and Student Achievement in Mathematics. Princeton, NJ: Policy Information Center, Research Division, Educational Testing Service (1998), 1-38.
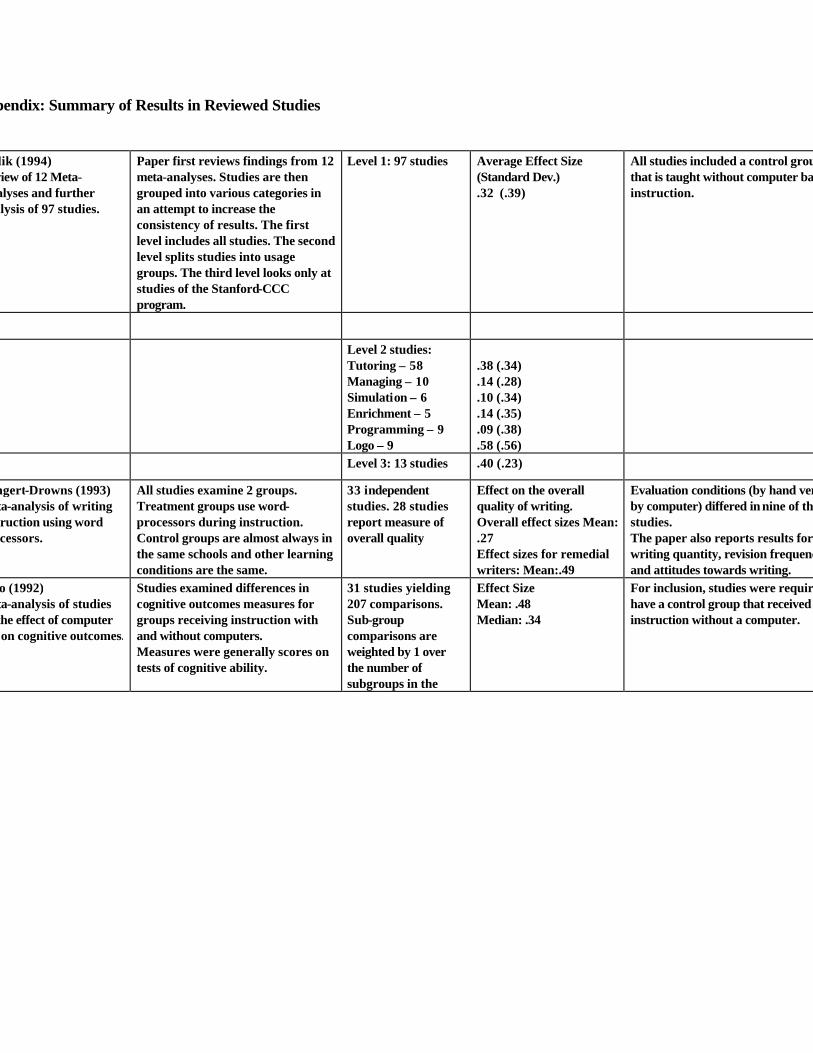
Appendix: Summary of Results in Reviewed Studies
Kulik (1994) Review of 12 Meta-Analyses and further analysis of 97 studies.
Paper first reviews findings from 12 meta-analyses. Studies are then grouped into various categories in an attempt to increase the consistency of results. The first level includes all studies. The second level splits studies into usage groups. The third level looks only at studies of the Stanford-CCC program.
Level 1: 97 studies
Average Effect Size (Standard Dev.) .32 (.39)
All studies included a control group that is taught without computer based instruction.
Level 2 studies: Tutoring – 58 Managing – 10 Simulation – 6 Enrichment – 5 Programming – 9 Logo – 9
.38 (.34) .14 (.28) .10 (.34) .14 (.35) .09 (.38) .58 (.56)
Level 3: 13 studies
.40 (.23)
Bangert-Drowns (1993) Meta-analysis of writing instruction using word processors.
All studies examine 2 groups. Treatment groups use word-processors during instruction. Control groups are almost always in the same schools and other learning conditions are the same.
33 independent studies. 28 studies report measure of overall quality
Effect on the overall quality of writing. Overall effect sizes Mean: .27 Effect sizes for remedial writers: Mean:.49
Evaluation conditions (by hand versus by computer) differed in nine of the studies. The paper also reports results for writing quantity, revision frequency, and attitudes towards writing.
Liao (1992) Meta-analysis of studies on the effect of computer use on cognitive outcomes.
Studies examined differences in cognitive outcomes measures for groups receiving instruction with and without computers. Measures were generally scores on tests of cognitive ability.
31 studies yielding 207 comparisons. Sub-group comparisons are weighted by 1 over the number of subgroups in the
Effect Size Mean: .48 Median: .34
For inclusion, studies were required to have a control group that received instruction without a computer.

Appendix: Summary of Results in Reviewed Studies
study.

Appendix: Summary of Results in Reviewed Studies
Program Design
Size
Effect2
Notes
Fletcher-Flinn and Gravatt (1995) Meta-analysis of computer assisted instruction studies conducted between 1987 and 1992
Later studies were examined separately and found to have higher effect sizes even after taking program implementation length and other design factors.
120 studies
Overall effect size: .24 Average effect size in later studies (conducted from 1989-1992): .33
Baker (1993) Apple Classrooms of Tomorrow, UCLA Evaluation Studies.
Children and teachers were provided with individual computers at school and home. Teachers were trained in computer integrated, project-based curriculum.
5 separate school sites.
Performance on standardized tests of basic skills was comparable to national norms.
Program students were compared to national standards and comparison classrooms. Implementation differed across sites. Treatment included significant teacher training as well as computer access.
Miller (1994-5) Buddy System Project.
Indiana program provides 4th-5th graders with home-computers and technology focused class room instruction.
142 students in the 4th and 5th grades from 1988-1992. All students were from a single Buddy Program school.
The comparison group scored significantly higher on standardized tests of reading, language and mathematics (the California Achievement Test and the Comprehensive Test of Basic Skills, 4 th ed.).
The participating school was compared to a similar school in the same district with a computer lab, but less focus on technology in the curriculum. About 1/3 of these students already had home computers.
Wenglinsky (1998) Statistical Analysis of the 1996 National Assessment of Educational Progress (NAEP).
Paper analyzes math scores from biannual testing of a national sample of students. Survey data also includes information from students, teachers and principals surveys.
6,227 Fourth-Graders 7,146 Eighth-Graders
Estimated fraction of a grade level advantage enjoyed by students with the characteristic. 4th / 8 th Graders School Use: -.20/-.11 Home Use: -.26/.14 Teacher Training: .09/.35
Regressions include measures of student SES, class size, teacher traits and other school traits. The negative effect of computers on outcomes may be due to an underlying positive correlation between educationally disadvantaged student bodies and computer access.

Appendix: Summary of Results in Reviewed Studies
Program Design Size Effect3 Notes Mann, Shakeshaft, Becker, and Kottkamp West Virginia Basic Skills/Computer Education program.
State program funds computer purchases sufficient to supply 3-4 computers per class in a targeted grade. The program was phased in one grade per year starting with the 1990-91 kindergarten class.
The entire state of West Virginia.
Standard deviation increases in outcome per unit increase in element. Time spent using comp.: .089 Software access: .367 Computer access:.068 Other tech. access: .051 Student attitude re. computers: .169 Teacher attitudes re. computers: .066 Teacher confidence: .030 Teacher involvement: -.097 Teacher training: .095
Effect measures are not comparable to each other or usual “effect sizes” since they are sensitive to units of individual elements. There are no controls for student and school characteristics other than those measured as a part of the program.
Swan, Guerrero, Mitriani, and Schoener (1990) Computer Pilot Program. Division of Computer Information Services, New York City Board of Education.
Study tracked improvement in test scores for students in 13 separate computer based instruction programs across 26 N.Y. City schools.
26 schools. 1,734 students, reading program. 1,351 students, mathematics.
Overall Effect Size on test scores (Degrees of Reading Power and Metropolitan Achievement Test.) Reading = .8; Mathematics = .9
There is no real control group; 1988 scores are compared to 1987 scores.Programs focused on basic-skills instruction rather than integrated learning. Teacher-student ratios were far below NY average. In general, improvement was inversely related to grade and prior ability level.

Appendix: Summary of Results in Reviewed Studies
Program Design
Size
Effect4
Notes
grist and Lavy (1999) Israel’s Tomorrow-98 program.
Lottery proceeds were used to fund computer purchases by selected state schools.
905 schools received funding from 1994-1996. Data is from national sample of student test scores and characteristics.
Regression coefficients on intensity of computer use are insignificant or negative, ranging from –2.71 to –8.65. A one unit increase in CAI intensity (on a scale of 0 to 3) is estimated to lead to a –2.71 to –8.65 point decline in test scores (ave. scores lie between 57 and 69 points).
Program funding was distributed based on student need and school’s ability to use the funds. This may negatively bias coefficients.
Attewell and Battle (1999) Analysis of NELS88 (National Educational Longitudinal Study 1988)
Analysis of survey data on home computer use and standardized tests in reading and mathematics, and students’ self-reported grades.
Nationally representative sample of approximately 18,000 8 th graders.
Standard deviation increase in outcome associated with standard deviation increase in home computer presence. Overall: .04 to .07 By subgroup: SES: .00 to .03 Gender: -.02 to -.04 Black: -.01 to -.02 Hispanic: -.02 to -.03 Native American and Asian: not significant
Regression includes controls for socioeconomic status, region, urbanization, gender, ethnicity, family structure and size, measures of parental involvement with children and of “cultural capital.”
Appendix: Summary of Results in Reviewed Studies
U.S. Department of Commerce, Falling Through The Net, July 1999, available on the department’s digital divide website,
www.digitaldivide.gov/about.htm. . Barbara Means, quoted in Mayfield, K. (1999).
. For example, see Sloan Commission on Cable Communications, On the Cable: The Television of Abundance, McGraw-Hill, 1971, which proposed devoting half the channels on cable television systems to various forms of information services (p. 142). A member of the Commission’s staff, Ralph Lee Smith, expanded upon this recommendation by writing a book about the range of services that could and ought to be mandatory for cable systems in his book, The Wired Nation, Harper and Row, 1972. Of course, cable television never fulfilled these promises, primarily because these services would have to be subsidized to be provided, and the subsidy costs were very large compared to the cost of cable television (see Roger G. Noll, Merton J. Peck and John J. McGown, “Cable and New Television Services,” Chapter 7 of Economic Aspects of Television Regulation, Brookings Institution, 1974, pp. 183-207).
. FCC Sixth Annual Report on Competition in Video Market, FCC Docket No 99-418 (rel. Dec. 30, 1999).
. Mueller (1997), p. 148.
. The title of the first NTIA “Falling Through the Net: A Survey of the ‘Have Nots’ in Rural and Urban America” was concerned specifically with this differential 4. Lenhart, A. (2000) presents survey data showing a 10% difference (57% vs. 47%)between rural and urban areas. Much of that she claims is due to a difference in computer usage between rural and urban residents. . Downes, T. and Greenstein, S. “Do Commercial ISPs Provide Universal Access?”
6. Central city is defined to be the largest city within a metropolitan area.
. Rosston and Wimmer (2000), “Winners and Losers from the Universal Service Subsidy Battle,” discuss the costs to low-income urban residents from an untargeted rural telephone subsidy.
. UCLA Internet Report, p-15.

Appendix: Summary of Results in Reviewed Studies
. Sum of sources can exceed 100% if people access the internet at multiple locations. Moller, R. M. (2000) Table 16, p.16. . Moller, R. M. (2000) Table 8, p.11.
. Lenhart, A. “Who's Not Online,” Pew Internet and American Life Project, released September 21,2000, available at http://www.pewinternet.org/reports/toc.asp?Report=21.
. Lenhart, A. p-3.
. Lenhart, A. p-9.
. See, e.g., “Cross-Subsidization in Telecommunications: Beyond the Universal Service Fairy Tale,” David L. Kaserman, John W. Mayo, and Joseph E. Flynn
. See eg. Crandall and Waverman (2000) “Who Pays for Universal Service?”
. Rosston and Wimmer (2000) “Winners and Losers from the Universal Service Battles,”
. See, for example, critical reviews by Kirkpatrick and Cuban (1998) and Krendl and Clark (1994) and annual comprehensive reviews conducted by the Software Information Industry Association.
Effect sizes represent the standard deviation increase in the outcome measure attributed to program participation. Effect sizes represent the standard deviation increase in the outcome measure attributed to program participation. Effect sizes represent the standard deviation increase in the outcome measure attributed to program participation.