Embed Size (px)
Citation preview
The Development of a Semtex-H Simulantfor Terahertz Spectroscopy
N. Greenall1 & A. Valavanis1 & H. J. Desai2 & D. O. Acheampong2 & L. H. Li1 &
J. E. Cunningham1 & A. G. Davies1 & E. H. Linfield1 & A. D. Burnett1,3
Received: 14 September 2016 /Accepted: 11 November 2016 /Published online: 29 November 2016# The Author(s) 2016. This article is published with open access at Springerlink.com
Abstract The development and use of terahertz (THz) frequency spectroscopy systems forsecurity screening has shown an increased growth over the past 15 years. In order to test thesesystems in real-world situations, safe simulants of illicit materials, such as Semtex-H, arerequired. Ideally, simulants should mimic key features of the material of interest, such that theyat least resemble or even appear indistinguishable from the materials of interest to theinterrogating technique(s), whilst not having hazardous or illicit properties. An ideal simulantshould have similar physical properties (malleability, density, surface energy and volatility tothe material of interest); be non-toxic and easy to clean and decontaminate from surfaces; berecyclable or disposable; and be useable in a public environment. Here, we present a methodfor developing such an explosive simulant (for Semtex-H) based on a database of THz spectraof common organic molecules, and the use of a genetic algorithm to select a mixture ofcompounds automatically to form such a simulant. Whilst we focus on a security application,this work could be applied to various other contexts, where the material of interest isdangerous, impractical or costly. We propose four mixtures that could then be used to testthe spectral response of any instrument, working at terahertz frequencies, without the need foran explosive substance.
Keywords Terahertz . Semtex . Genetic algorithm . Explosive . Simulant . Time-domainspectroscopy
J Infrared Milli Terahz Waves (2017) 38:325–338DOI 10.1007/s10762-016-0336-z
Electronic supplementary material The online version of this article (doi:10.1007/s10762-016-0336-z)contains supplementary material, which is available to authorized users.
* A. D. [email protected]
1 School of Electronic and Electrical Engineering, University of Leeds, Leeds LS2 9JT, UK2 Centre for Applied Science and Technology, St Albans, Hertfordshire, St. Albans AL4 9HQ, UK3 School of Chemistry, University of Leeds, Leeds LS2 9JT, UK
1 Introduction
Terahertz (THz) (300 GHz–10 THz) frequency spectroscopy has been shown to be a usefultechnique for the sensing, imaging and spectroscopic analysis of a range of explosives [1–5]. Anumber of high explosive compounds show spectral features (often at frequencies above1 THz) that can be used to identify their presence uniquely [2]. Conversely, a number of thenon-explosive compounds that are found in composite plastic explosives (such as Semtex-H)show little or no THz absorption [1]. The THz absorption spectra of these composites aretherefore dominated by the spectral features of their constituent explosives, making theirspectral identification relatively simple compared to other illicit compounds such as real-world drugs-of-abuse, which contain a range of common adulterants which also show anumber of sharp spectral features [6]. Furthermore, THz radiation is able to penetrate a numberof common packaging [2] and clothing materials [7], whilst being non-ionising [8–10].However, in order to determine the practical applicability of THz-frequency spectroscopy inthe real world, rather than laboratory conditions, a non-explosive simulant is required. In thiscase, a simulant is defined as a substance or formulation which mimics key spectral features ofthe material of interest to interrogating technique(s), but does not have the hazardous or illicitfeatures. Commercial simulants are available for other detection techniques but these eithermimic the elemental content or physical properties [11] of an explosive or contain only traceamounts of the explosive [12]. Neither of these methods would be suitable for simulants atTHz frequencies as they would not reproduce the spectral features used to identify theexplosive. Several compounds have been suggested as simulants suitable for THz spectros-copy including L-tartaric acid and glucose [13, 14]; however, neither of these compoundsreproduce the spectral features of the explosives well.
The majority of currently available commercial millimetre wave and THz security scannerswork in a reflection geometry at frequencies much lower than 500 GHz, where no character-istic spectral features exist. In this paper, we will develop a simulant for Semtex-H that issuitable for frequencies higher than 500 GHz which reproduces the relative spectral intensitiesof the spectral features seen in the THz spectrum of Semtex-H. To do this, we have developeda small library of THz spectra of common organic compounds. We demonstrate how thislibrary can be used, in conjunction with a spectral selection process based on geneticalgorithms, to select a suitable mixture of materials to act as a THz simulant for Semtex-Hautomatically. We then experimentally verify our simulants using THz time-domain spectros-copy (THz-TDS) and compare them to the target spectra. In this case, the target spectrum willbe a normalised absorption spectrum of Semtex-H. The normalisation gives preference to thefrequency of spectral features and their relative, rather than absolute, intensity. We note that ourmethod described not only pertains to explosive simulants, but could also be used more widely,and may be particularly useful to mimic toxic or costly materials, as long as a suitable libraryof compound spectra is available.
2 Experimental
THz spectra were acquired using two broadband (300 GHz–6 THz) THz-TDS systems eachdriven by one of two ultra-fast (<20 fs FWHM) Ti/sapphire laser systems [1]; the first used aFemtosource compact (Femtosource), and the second a Vitatra-HP (Coherent) laser. In bothsystems, the output beam was split into a pump beam (∼90%) and a probe beam (∼10%) by a
326 J Infrared Milli Terahz Waves (2017) 38:325–338

beam splitter. THz radiation was generated by focusing the pump beam onto the gap betweenthe two vacuum-deposited Ti/Au electrodes of a low-temperature-grown GaAs (LT-GaAs)photoconductive emitter. A 7-kHz AC square wave was used to bias the emitter, and also usedas a reference frequency for lock-in detection. To avoid absorption and dispersion in theundoped GaAs substrate, and to observe the high-frequency components more efficiently, theTHz radiation generated from the emitter was collected in a backwards geometry [15, 16] (i.e.from the same surface of the emitter that is excited by the laser) and then focused by a pair ofoff-axis parabolic mirrors onto the sample. A second pair of off-axis parabolic mirrorscollected the transmitted THz radiation and focused it onto a 150-μm-thick GaP electro-optic crystal, mounted collinearly with a near-infrared probe beam for detection. The electricfield comprising the THz waveform was then measured in the time-domain using electro-opticsampling and a lock-in detection scheme [15].
2.1 Terahertz Spectra of Plastic Explosives
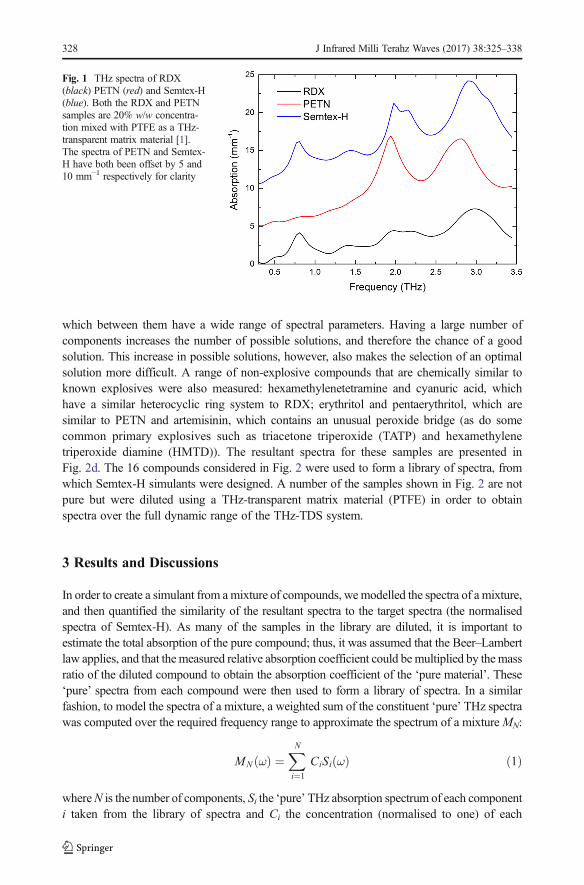
Semtex-H contains two explosive crystalline compounds, cyclotrimethylenetrinitramine (RDX)and pentaerythritol tetranitrate (PETN), whose individual THz spectra are shown in Fig. 1,along with a number of polymers, plasticisers and anti-oxidants, which we previously showedhad no significant THz absorption in the 300-GHz to 5.5-THz range [1]. A viable simulant forSemtex-H must reproduce spectral peaks at similar frequencies to the five main peaks in theSemtex-H spectrum (0.79, 1.44, 1.98, 2.15 and 2.92 THz), and have similar relative intensities.This poses a key challenge since the absorption peaks are not simply related to the presence ofspecific functional groups (as is the case in mid-infrared spectroscopy), but instead are mainlyattributed to translatory and rotary external modes, which are affected not just by the molecularstructure, but also by the crystalline structure of the material [17, 18]. The origin of the modes inboth RDX [19, 20] and PETN [17, 21–25] is relativity well understood at THz frequencies,however. We note that in principle it would be possible to modify the structure of RDX andPETN to form isomorphous crystals that are non-explosive [26], whilst at the same timeminimising the change to their THz spectra. This would represent a significant challenge inchemical synthesis. A more promising route, taken here, is to find spectra of simple organiccompounds, preferably with only a few peaks in this spectral range, and to then combine themto form a composite spectrum similar to that of Semtex-H. The simulant, at least in the firstinstance, needs to replicate both the general shape and relative intensity of the spectral featuresin the absorption spectra of Semtex-H. It, however, does not need to perfectly mirror thesefeatures, but rather, it is the relative change across the frequency window that is important inorder to test and calibrate equipment without using a hazardous compound.
Awide range of organic crystalline compounds which exhibit spectral features in the 1- to 6-THz band can potentially be used to simulate the spectrum of Semtex-H. However, only a smallnumber of solid compounds have been found to have spectral features below 1 THz reproducingthe 0.79-THz peak of RDX (Fig. 1). This spectral region is therefore the most difficult to representby a simulant, and it is likely that a compromise in mixture will be made in order match thisspectral feature, even if this is to the detriment of the match in other spectral regions.
2.2 Development of a Sample Database
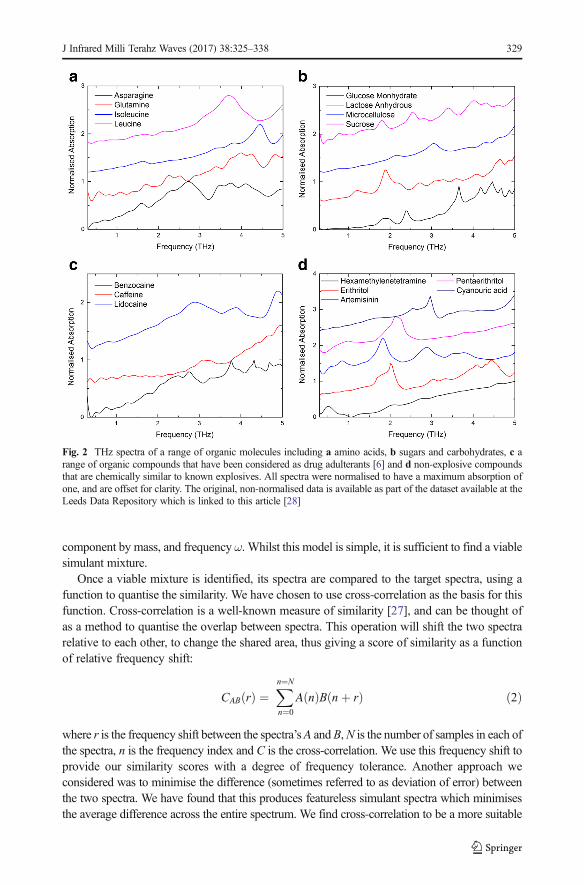
In order to determine compounds that could be included in the simulant mixture, the spectra ofa range of sugars and other commonly available organic compounds were measured (Fig. 2),
J Infrared Milli Terahz Waves (2017) 38:325–338 327
which between them have a wide range of spectral parameters. Having a large number ofcomponents increases the number of possible solutions, and therefore the chance of a goodsolution. This increase in possible solutions, however, also makes the selection of an optimalsolution more difficult. A range of non-explosive compounds that are chemically similar toknown explosives were also measured: hexamethylenetetramine and cyanuric acid, whichhave a similar heterocyclic ring system to RDX; erythritol and pentaerythritol, which aresimilar to PETN and artemisinin, which contains an unusual peroxide bridge (as do somecommon primary explosives such as triacetone triperoxide (TATP) and hexamethylenetriperoxide diamine (HMTD)). The resultant spectra for these samples are presented inFig. 2d. The 16 compounds considered in Fig. 2 were used to form a library of spectra, fromwhich Semtex-H simulants were designed. A number of the samples shown in Fig. 2 are notpure but were diluted using a THz-transparent matrix material (PTFE) in order to obtainspectra over the full dynamic range of the THz-TDS system.
3 Results and Discussions
In order to create a simulant from amixture of compounds, wemodelled the spectra of a mixture,and then quantified the similarity of the resultant spectra to the target spectra (the normalisedspectra of Semtex-H). As many of the samples in the library are diluted, it is important toestimate the total absorption of the pure compound; thus, it was assumed that the Beer–Lambertlaw applies, and that the measured relative absorption coefficient could bemultiplied by themassratio of the diluted compound to obtain the absorption coefficient of the ‘pure material’. These‘pure’ spectra from each compound were then used to form a library of spectra. In a similarfashion, to model the spectra of a mixture, a weighted sum of the constituent ‘pure’ THz spectrawas computed over the required frequency range to approximate the spectrum of a mixtureMN:
MN ωð Þ ¼XNi¼1
CiSi ωð Þ ð1Þ
whereN is the number of components, Si the ‘pure’ THz absorption spectrum of each componenti taken from the library of spectra and Ci the concentration (normalised to one) of each
Fig. 1 THz spectra of RDX(black) PETN (red) and Semtex-H(blue). Both the RDX and PETNsamples are 20% w/w concentra-tion mixed with PTFE as a THz-transparent matrix material [1].The spectra of PETN and Semtex-H have both been offset by 5 and10 mm−1 respectively for clarity
328 J Infrared Milli Terahz Waves (2017) 38:325–338
component by mass, and frequency ω. Whilst this model is simple, it is sufficient to find a viablesimulant mixture.
Once a viable mixture is identified, its spectra are compared to the target spectra, using afunction to quantise the similarity. We have chosen to use cross-correlation as the basis for thisfunction. Cross-correlation is a well-known measure of similarity [27], and can be thought ofas a method to quantise the overlap between spectra. This operation will shift the two spectrarelative to each other, to change the shared area, thus giving a score of similarity as a functionof relative frequency shift:
CAB rð Þ ¼Xn¼N
n¼0
A nð ÞB nþ rð Þ ð2Þ
where r is the frequency shift between the spectra’sA andB,N is the number of samples in each ofthe spectra, n is the frequency index and C is the cross-correlation. We use this frequency shift toprovide our similarity scores with a degree of frequency tolerance. Another approach weconsidered was to minimise the difference (sometimes referred to as deviation of error) betweenthe two spectra. We have found that this produces featureless simulant spectra which minimisesthe average difference across the entire spectrum. We find cross-correlation to be a more suitable
Fig. 2 THz spectra of a range of organic molecules including a amino acids, b sugars and carbohydrates, c arange of organic compounds that have been considered as drug adulterants [6] and d non-explosive compoundsthat are chemically similar to known explosives. All spectra were normalised to have a maximum absorption ofone, and are offset for clarity. The original, non-normalised data is available as part of the dataset available at theLeeds Data Repository which is linked to this article [28]
J Infrared Milli Terahz Waves (2017) 38:325–338 329
measure of similarity, which agrees with previous literature on the subject [24].We use aweightednormalised correlation coefficient to provide a normalised similarity score between 0 and 1 [27]:
CWsAB ¼
X r¼l
r¼−lCAB rð ÞW rð ÞffiffiffiffiffiffiffiffiffiffiffiffiffiffiffiffiffiffiffiffiffiffiffiffiffiffiffiffiffiffiffiffiffiffiffiffiffiffiffiX r¼l
r¼−lCAA rð ÞW rð Þ
r ffiffiffiffiffiffiffiffiffiffiffiffiffiffiffiffiffiffiffiffiffiffiffiffiffiffiffiffiffiffiffiffiffiffiffiffiffiffiffiX r¼l
r¼−lCBB rð ÞW rð Þ
r ð3Þ
where W(r) is a weight function, defined as:
W rð Þ ¼ 1−rj jl
ð4Þ
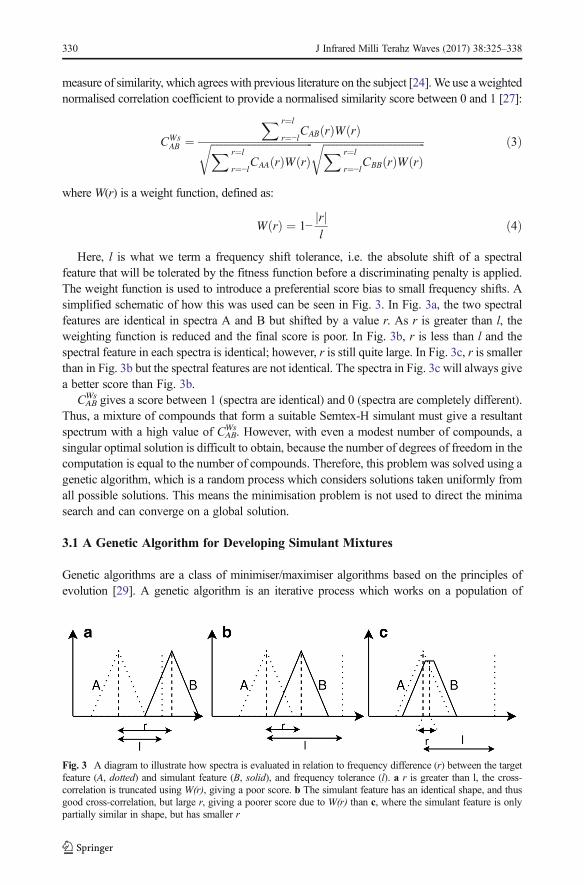
Here, l is what we term a frequency shift tolerance, i.e. the absolute shift of a spectralfeature that will be tolerated by the fitness function before a discriminating penalty is applied.The weight function is used to introduce a preferential score bias to small frequency shifts. Asimplified schematic of how this was used can be seen in Fig. 3. In Fig. 3a, the two spectralfeatures are identical in spectra A and B but shifted by a value r. As r is greater than l, theweighting function is reduced and the final score is poor. In Fig. 3b, r is less than l and thespectral feature in each spectra is identical; however, r is still quite large. In Fig. 3c, r is smallerthan in Fig. 3b but the spectral features are not identical. The spectra in Fig. 3c will always givea better score than Fig. 3b.
CABWs gives a score between 1 (spectra are identical) and 0 (spectra are completely different).
Thus, a mixture of compounds that form a suitable Semtex-H simulant must give a resultantspectrum with a high value of CAB
Ws. However, with even a modest number of compounds, asingular optimal solution is difficult to obtain, because the number of degrees of freedom in thecomputation is equal to the number of compounds. Therefore, this problem was solved using agenetic algorithm, which is a random process which considers solutions taken uniformly fromall possible solutions. This means the minimisation problem is not used to direct the minimasearch and can converge on a global solution.
3.1 A Genetic Algorithm for Developing Simulant Mixtures
Genetic algorithms are a class of minimiser/maximiser algorithms based on the principles ofevolution [29]. A genetic algorithm is an iterative process which works on a population of
Fig. 3 A diagram to illustrate how spectra is evaluated in relation to frequency difference (r) between the targetfeature (A, dotted) and simulant feature (B, solid), and frequency tolerance (l). a r is greater than l, the cross-correlation is truncated using W(r), giving a poor score. b The simulant feature has an identical shape, and thusgood cross-correlation, but large r, giving a poorer score due to W(r) than c, where the simulant feature is onlypartially similar in shape, but has smaller r
330 J Infrared Milli Terahz Waves (2017) 38:325–338
solutions, which in this case are the predicted mixture spectra. Each solution is evaluated againstthe target spectrum (the normalised spectrum of Semtex-H) by a fitness function, which providesa fitness score. Poorer scoring solutions are removed from the population and replacements areproduced based on modified higher-ranked solutions (see online resource 1 for a detaileddescription of the genetic algorithmmethodology). In this case, the fitness functionF is given by:
F ¼ 100 1− CWsAB
�� ��� � ð5Þ
F is, therefore, simply the weighted normalised correlation coefficient CABWs scaled between
0 and 100, with 0 representing a perfect match for the normalised spectrum of Semtex-H, and100 representing no correlation. This is done to create a minimisation problem suitable for thegenetic algorithm. The genetic algorithm was implemented using MATLAB’s global optimi-sation toolbox [30]; for further information on the implementation, please see the onlineresource 1. To create viable simulants, a two-stage process was used: the first being an initialselection of suitable compounds for a mixture, followed by a second stage, an optimisation ofthe concentrations of each component within the mixture.
For the component-selection stage (stage 1), the genetic algorithm was used to form fivecompound combinations, with each component making up 20% of the mixture. Repetitions ofeach component were allowed within an individual mixture. For instance, if the algorithmgenerated a mixture spectra formed from a combination of components ‘A, B, C, A, and A’ forexample, this would be converted to a three component mixture containing ‘A, B, and C’ withconcentrations of 60, 20 and 20% by mass, respectively. The initial population of mixturespectra used was uniformly randomly generated. The mixture spectra were then modelledusing Eq. 1, and then evaluated against the normalised spectrum of Semtex-H using the fitnessfunction, F, in Eq. 5. The population of mixture spectra were then modified with poorerscoring spectra removed and additional spectra generated from the remaining population (seeonline resource 1). The evaluation, using fitness scores, and modification of the populationwere repeated until a consistent best-ranked solution appeared, with a change in fitnessfunction less than 1 × 10⁻⁶ over 50 iterations.
This process (stage 1) of selecting a suitable component combination was repeated a total of30 times, deliberately making use of the non-deterministic selection process to producemultiple viable solutions. The highest-ranked mixture spectra from each of the 30 repeatswere then compared, duplicates were removed and the remaining mixture spectra ranked. Thetop two scoring solutions were then used as a basis for the second stage, in which the geneticalgorithm was used to optimise the concentration of each component of the simulant mixturewith the two highest-ranked mixtures, from stage 1, being used to form the initial population.The genetic algorithm was performed in a similar manner to the first stage, but changes werenow made to component concentrations for a fixed component selection. These concentrationswere then used to form the spectrum of the mixture, which was then compared to thenormalised spectra of Semtex-H using the fitness function F (Eq. 5).
As in stage 1, the process was repeated until a consistent best solution with a change infitness function of less than 1 × 10⁻⁶ occurred over 50 iterations was achieved. This secondstage was then repeated a further four times, and the mean concentrations from each run usedas the concentration for the final solution. A detailed account of the method used is includedwithin online resource 1, including flow diagrams of both stages.
The whole process (both initial selection, stage 1, and concentration optimisation, stage 2)was then repeated ten times, over eight different frequency tolerances (l) (see Eqs. 3 and 4),and the final solution to each run collated. Over all these repeats, four common mixtures were
J Infrared Milli Terahz Waves (2017) 38:325–338 331
produced. This full process takes roughly 3 hours running on a single core, and could beoptimised significantly using parallel processing techniques.
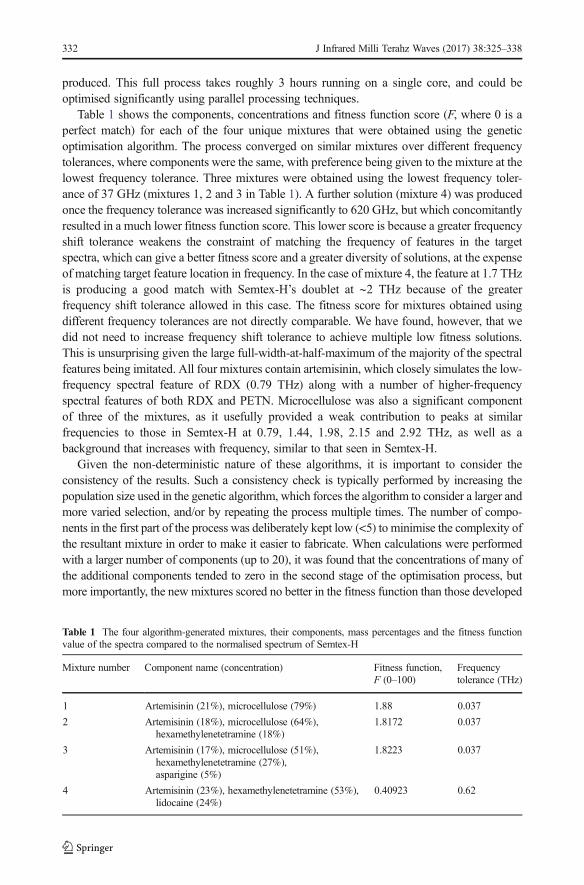
Table 1 shows the components, concentrations and fitness function score (F, where 0 is aperfect match) for each of the four unique mixtures that were obtained using the geneticoptimisation algorithm. The process converged on similar mixtures over different frequencytolerances, where components were the same, with preference being given to the mixture at thelowest frequency tolerance. Three mixtures were obtained using the lowest frequency toler-ance of 37 GHz (mixtures 1, 2 and 3 in Table 1). A further solution (mixture 4) was producedonce the frequency tolerance was increased significantly to 620 GHz, but which concomitantlyresulted in a much lower fitness function score. This lower score is because a greater frequencyshift tolerance weakens the constraint of matching the frequency of features in the targetspectra, which can give a better fitness score and a greater diversity of solutions, at the expenseof matching target feature location in frequency. In the case of mixture 4, the feature at 1.7 THzis producing a good match with Semtex-H’s doublet at ∼2 THz because of the greaterfrequency shift tolerance allowed in this case. The fitness score for mixtures obtained usingdifferent frequency tolerances are not directly comparable. We have found, however, that wedid not need to increase frequency shift tolerance to achieve multiple low fitness solutions.This is unsurprising given the large full-width-at-half-maximum of the majority of the spectralfeatures being imitated. All four mixtures contain artemisinin, which closely simulates the low-frequency spectral feature of RDX (0.79 THz) along with a number of higher-frequencyspectral features of both RDX and PETN. Microcellulose was also a significant componentof three of the mixtures, as it usefully provided a weak contribution to peaks at similarfrequencies to those in Semtex-H at 0.79, 1.44, 1.98, 2.15 and 2.92 THz, as well as abackground that increases with frequency, similar to that seen in Semtex-H.
Given the non-deterministic nature of these algorithms, it is important to consider theconsistency of the results. Such a consistency check is typically performed by increasing thepopulation size used in the genetic algorithm, which forces the algorithm to consider a larger andmore varied selection, and/or by repeating the process multiple times. The number of compo-nents in the first part of the process was deliberately kept low (<5) to minimise the complexity ofthe resultant mixture in order to make it easier to fabricate. When calculations were performedwith a larger number of components (up to 20), it was found that the concentrations of many ofthe additional components tended to zero in the second stage of the optimisation process, butmore importantly, the new mixtures scored no better in the fitness function than those developed
Table 1 The four algorithm-generated mixtures, their components, mass percentages and the fitness functionvalue of the spectra compared to the normalised spectrum of Semtex-H
Mixture number Component name (concentration) Fitness function,F (0–100)
Frequencytolerance (THz)
1 Artemisinin (21%), microcellulose (79%) 1.88 0.037
2 Artemisinin (18%), microcellulose (64%),hexamethylenetetramine (18%)
1.8172 0.037
3 Artemisinin (17%), microcellulose (51%),hexamethylenetetramine (27%),asparigine (5%)
1.8223 0.037
4 Artemisinin (23%), hexamethylenetetramine (53%),lidocaine (24%)
0.40923 0.62
332 J Infrared Milli Terahz Waves (2017) 38:325–338

using the method described above. If we compare to the number of features in the target spectra,the reason for this becomes clear. There are only four broad peaks in the target spectra; therefore,produced simulants will only require a similar number of components to mimic these features.
The resulting predicted spectra for each of the four mixtures are shown as dashed-dottedlines in Fig. 4, with each spectra showing four broad spectral features centred roughly at 0.75,1.5, 2 and 3 THz. Each mixture was then produced and diluted to 25% concentration withPTFE before being pressed into a solid pellet. The THz spectra for each of these samples areshown as solid lines in Fig. 4. Figure 4 also shows the normalised spectra of Semtex-H (blacksolid line) from Fig. 1 with all spectra being offset for clarity and comparison.
The experimentally measured spectra of each of the four mixtures are not identical to thepredicted spectra; peaks in the spectra are generally weaker and less prominent. Thesediscrepancies are likely caused by a number of factors. First, we have assumed that theabsorption intensity scales linearly with concentration both in the formation of the library,and then in Eq. 1 when forming the mixture spectra. A more advanced method would be to usean effective medium approximation, such as the Maxwell–Garnett approximation [31], toestimate both the permittivity of the ‘pure’ materials for the library and also to estimate theeffect of combining these library spectra in to a mixture. However, this would have signifi-cantly increased computation time, without a significant improvement in accuracy for thepermittivity, particle sizes and concentrations used here [32].
Secondly, to construct the library, we diluted our samples with a non-absorbing polymermatrix(PTFE) which can cause slight changes in peak positions [18, 33] compared to the spectra of thepure material. Finally, mixing a number of substances will certainly affect the THz scattering[34–36], particularly if the refractive indices of the components differ (which is often the case atTHz frequencies), and in addition to increasing the total scattering background, this may also leadto changes in spectral peak shape [35]. This change in scatteringmay lead to the greatest differencebetween the predicted and measured spectra, but there is no simple method to account for this.
The measured spectra do show a very high similarity to that of Semtex-H, with Table 2showing the fitness score for the four measured spectra. Although these fitness scores arepoorer than predicted, due to the approximations in predicting mixture spectra describedpreviously and inhomogeneities within the physical mixture, the four powdered samples areall suitable simulants for Semtex-H, showing broad spectral features at similar frequencies and
Fig. 4 The four predicted spectrafor the simulant mixtures areshown as dashed-dotted lines. Thesolid lines show the measuredspectra of the mixtures once theywere made, diluted with PTFE to25% by mass and pressed intosolid pellets. The solid black lineshows the normalised spectra ofSemtex-H previously shown inFig. 1 for comparison. Spectrahave been normalised and offsetfor clarity
J Infrared Milli Terahz Waves (2017) 38:325–338 333
with similar absorption ratios to those of the THz spectrum of Semtex-H. In order to determinewhy these four mixtures were chosen by the genetic algorithm discussed above, we broke thecontributions to the spectra down using mixture 1 as a test case, as it was the simplest mixtureproduced and has components common to almost all of the other mixtures.
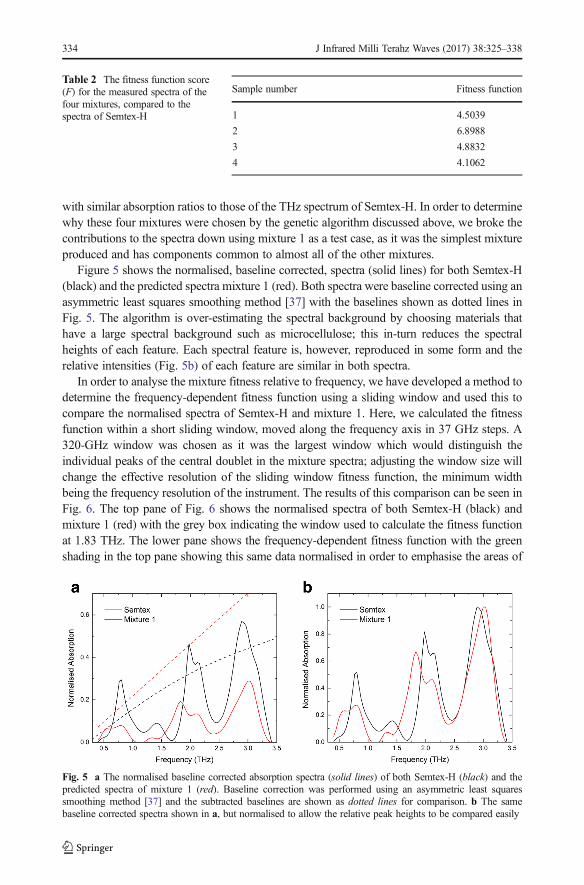
Figure 5 shows the normalised, baseline corrected, spectra (solid lines) for both Semtex-H(black) and the predicted spectra mixture 1 (red). Both spectra were baseline corrected using anasymmetric least squares smoothing method [37] with the baselines shown as dotted lines inFig. 5. The algorithm is over-estimating the spectral background by choosing materials thathave a large spectral background such as microcellulose; this in-turn reduces the spectralheights of each feature. Each spectral feature is, however, reproduced in some form and therelative intensities (Fig. 5b) of each feature are similar in both spectra.
In order to analyse the mixture fitness relative to frequency, we have developed a method todetermine the frequency-dependent fitness function using a sliding window and used this tocompare the normalised spectra of Semtex-H and mixture 1. Here, we calculated the fitnessfunction within a short sliding window, moved along the frequency axis in 37 GHz steps. A320-GHz window was chosen as it was the largest window which would distinguish theindividual peaks of the central doublet in the mixture spectra; adjusting the window size willchange the effective resolution of the sliding window fitness function, the minimum widthbeing the frequency resolution of the instrument. The results of this comparison can be seen inFig. 6. The top pane of Fig. 6 shows the normalised spectra of both Semtex-H (black) andmixture 1 (red) with the grey box indicating the window used to calculate the fitness functionat 1.83 THz. The lower pane shows the frequency-dependent fitness function with the greenshading in the top pane showing this same data normalised in order to emphasise the areas of
Table 2 The fitness function score(F) for the measured spectra of thefour mixtures, compared to thespectra of Semtex-H
Sample number Fitness function
1 4.5039
2 6.8988
3 4.8832
4 4.1062
Fig. 5 a The normalised baseline corrected absorption spectra (solid lines) of both Semtex-H (black) and thepredicted spectra of mixture 1 (red). Baseline correction was performed using an asymmetric least squaressmoothing method [37] and the subtracted baselines are shown as dotted lines for comparison. b The samebaseline corrected spectra shown in a, but normalised to allow the relative peak heights to be compared easily
334 J Infrared Milli Terahz Waves (2017) 38:325–338
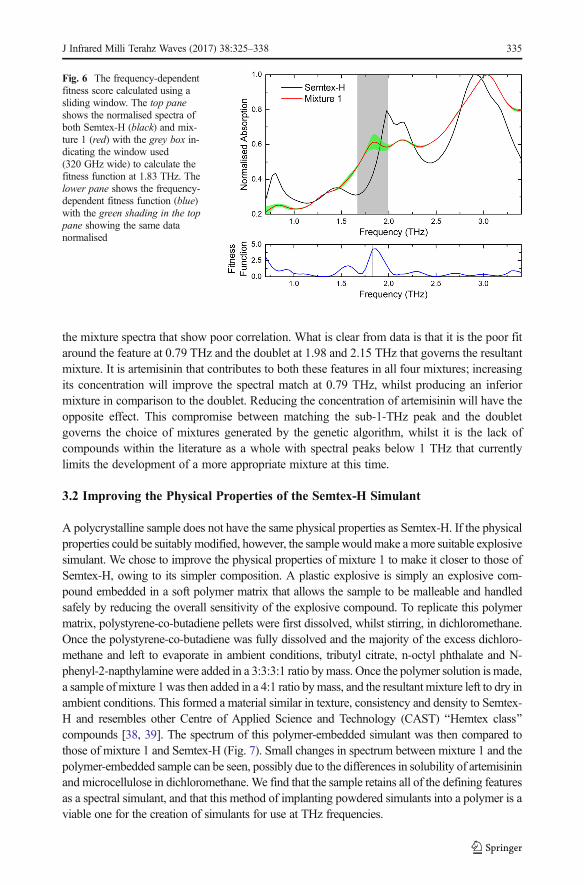
the mixture spectra that show poor correlation. What is clear from data is that it is the poor fitaround the feature at 0.79 THz and the doublet at 1.98 and 2.15 THz that governs the resultantmixture. It is artemisinin that contributes to both these features in all four mixtures; increasingits concentration will improve the spectral match at 0.79 THz, whilst producing an inferiormixture in comparison to the doublet. Reducing the concentration of artemisinin will have theopposite effect. This compromise between matching the sub-1-THz peak and the doubletgoverns the choice of mixtures generated by the genetic algorithm, whilst it is the lack ofcompounds within the literature as a whole with spectral peaks below 1 THz that currentlylimits the development of a more appropriate mixture at this time.
3.2 Improving the Physical Properties of the Semtex-H Simulant
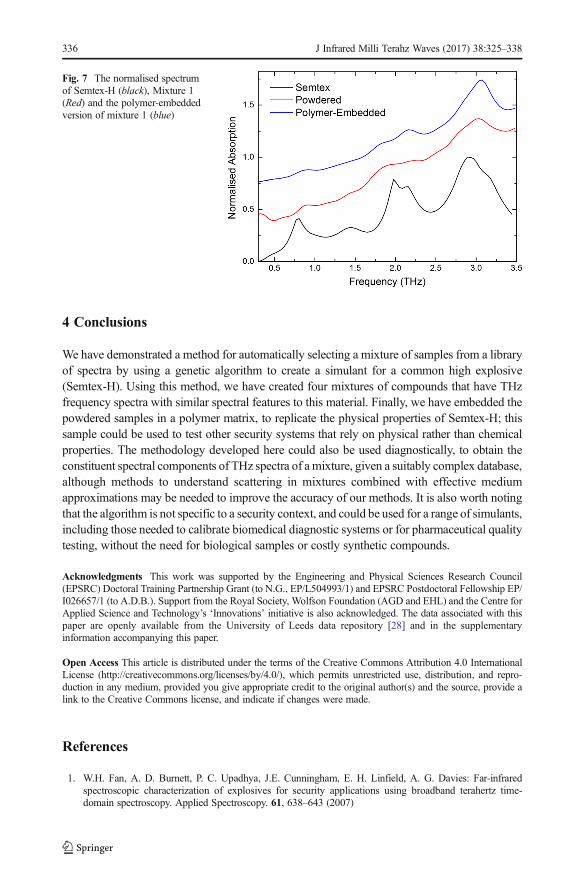
A polycrystalline sample does not have the same physical properties as Semtex-H. If the physicalproperties could be suitablymodified, however, the sample wouldmake amore suitable explosivesimulant. We chose to improve the physical properties of mixture 1 to make it closer to those ofSemtex-H, owing to its simpler composition. A plastic explosive is simply an explosive com-pound embedded in a soft polymer matrix that allows the sample to be malleable and handledsafely by reducing the overall sensitivity of the explosive compound. To replicate this polymermatrix, polystyrene-co-butadiene pellets were first dissolved, whilst stirring, in dichloromethane.Once the polystyrene-co-butadiene was fully dissolved and the majority of the excess dichloro-methane and left to evaporate in ambient conditions, tributyl citrate, n-octyl phthalate and N-phenyl-2-napthylamine were added in a 3:3:3:1 ratio bymass. Once the polymer solution is made,a sample of mixture 1 was then added in a 4:1 ratio bymass, and the resultant mixture left to dry inambient conditions. This formed a material similar in texture, consistency and density to Semtex-H and resembles other Centre of Applied Science and Technology (CAST) BHemtex class^compounds [38, 39]. The spectrum of this polymer-embedded simulant was then compared tothose of mixture 1 and Semtex-H (Fig. 7). Small changes in spectrum between mixture 1 and thepolymer-embedded sample can be seen, possibly due to the differences in solubility of artemisininand microcellulose in dichloromethane.We find that the sample retains all of the defining featuresas a spectral simulant, and that this method of implanting powdered simulants into a polymer is aviable one for the creation of simulants for use at THz frequencies.
Fig. 6 The frequency-dependentfitness score calculated using asliding window. The top paneshows the normalised spectra ofboth Semtex-H (black) and mix-ture 1 (red) with the grey box in-dicating the window used(320 GHz wide) to calculate thefitness function at 1.83 THz. Thelower pane shows the frequency-dependent fitness function (blue)with the green shading in the toppane showing the same datanormalised
J Infrared Milli Terahz Waves (2017) 38:325–338 335
4 Conclusions
We have demonstrated a method for automatically selecting a mixture of samples from a libraryof spectra by using a genetic algorithm to create a simulant for a common high explosive(Semtex-H). Using this method, we have created four mixtures of compounds that have THzfrequency spectra with similar spectral features to this material. Finally, we have embedded thepowdered samples in a polymer matrix, to replicate the physical properties of Semtex-H; thissample could be used to test other security systems that rely on physical rather than chemicalproperties. The methodology developed here could also be used diagnostically, to obtain theconstituent spectral components of THz spectra of amixture, given a suitably complex database,although methods to understand scattering in mixtures combined with effective mediumapproximations may be needed to improve the accuracy of our methods. It is also worth notingthat the algorithm is not specific to a security context, and could be used for a range of simulants,including those needed to calibrate biomedical diagnostic systems or for pharmaceutical qualitytesting, without the need for biological samples or costly synthetic compounds.
Acknowledgments This work was supported by the Engineering and Physical Sciences Research Council(EPSRC) Doctoral Training Partnership Grant (to N.G., EP/L504993/1) and EPSRC Postdoctoral Fellowship EP/I026657/1 (to A.D.B.). Support from the Royal Society, Wolfson Foundation (AGD and EHL) and the Centre forApplied Science and Technology’s ‘Innovations’ initiative is also acknowledged. The data associated with thispaper are openly available from the University of Leeds data repository [28] and in the supplementaryinformation accompanying this paper.
Open Access This article is distributed under the terms of the Creative Commons Attribution 4.0 InternationalLicense (http://creativecommons.org/licenses/by/4.0/), which permits unrestricted use, distribution, and repro-duction in any medium, provided you give appropriate credit to the original author(s) and the source, provide alink to the Creative Commons license, and indicate if changes were made.
References
1. W.H. Fan, A. D. Burnett, P. C. Upadhya, J.E. Cunningham, E. H. Linfield, A. G. Davies: Far-infraredspectroscopic characterization of explosives for security applications using broadband terahertz time-domain spectroscopy. Applied Spectroscopy. 61, 638–643 (2007)
Fig. 7 The normalised spectrumof Semtex-H (black), Mixture 1(Red) and the polymer-embeddedversion of mixture 1 (blue)
336 J Infrared Milli Terahz Waves (2017) 38:325–338
2. Davies, A.G., Burnett, A.D., Fan, W., Linfield, E.H., Cunningham, J.E.: Terahertz spectroscopy ofexplosives and drugs. Mater. Today. 11, 18–26 (2008)
3. Kemp, M.C., Taday, P., Cole, B.E., Cluff, J., Fitzgerald, A.J., Tribe, W.R.: Security applications of terahertztechnology. AeroSense 2003. 5070, 44–52 (2003)
4. Shen, Y., Lo, T., Taday, P., Cole, B., Tribe, W., Kemp, M.: Detection and identification of explosives usingterahertz pulsed spectroscopic imaging. Appl. Phys. Lett. 86, 241116 (2005)
5. Leahy-Hoppa, M., Fitch, M., Zheng, X., Hayden, L., Osiander, R.: Wideband terahertz spectroscopy ofexplosives. Chem. Phys. Lett. 434, 227–230 (2007)
6. Burnett, A.D., Fan, W., Upadhya, P.C., Cunningham, J.E., Hargreaves, M.D., Munshi, T., et al.: Broadbandterahertz time-domain spectroscopy of drugs-of-abuse and the use of principal component analysis. Analyst.134, 1658–1668 (2009)
7. Baker, C., Lo, T., Tribe, W., Cole, B., Hogbin, M., Kemp, M.: Detection of concealed explosives at adistance using terahertz technology. Proceedings of the IEEE. 95, 1559–1565 (2007)
8. Kleine-Ostmann, T., Jastrow, C., Baaske, K., Heinen, B., Schwerdtfeger, M., Karst, U., et al.: Field exposureand dosimetry in the thz frequency range. Terahertz Science and Technology, IEEE Transactions on. 4, 12–25 (2014)
9. Hintzsche, H., Stopper, H.: Effects of terahertz radiation on biological systems. Crit. Rev. Environ. Sci.Technol. 42, 2408–2434 (2012)
10. Berry, E.: Risk perception and safety issues. J. Biol. Phys. 29, 263–267 (2003)11. Kury, J.W., Anderson, B.L.: Explosive simulants for testing explosive detection systems. US5958299A,
(1999)12. Simpson, R.L., Pruneda, C.O.: Non-detonable and non-explosive explosive simulators. US5648636A,
(1997)13. Palka, N.: THz reflection spectroscopy of explosives measured by time domain spectroscopy. Acta Physica
Polonica A. 120, 713–715 (2011)14. Konek, C., Wilkinson, J., Esenturk, O., Heilweil, E., Kemp, M.: Terahertz spectroscopy of explosives and
simulants: RDX, PETN, sugar, and L-tartaric acid. 7311, 73110K-73110K-73117 (2009)15. Shen, Y., Upadhya, P., Linfield, E., Beere, H., Davies, A.: Ultrabroadband terahertz radiation from low-
temperature-grown GaAs photoconductive emitters. Appl. Phys. Lett. 83, 3117–3119 (2003)16. Upadhya, P., Fan, W., Burnett, A., Shen, Y., Beere, H., Davies, A., et al.: Ultra-broadband coherent terahertz
spectroscopy using asymmetric excitation of photoconductive structures. IRMMW-THz 2005. 2, 451–452(2005)
17. Burnett, A.D., Kendrick, J., Cunningham, J.E., Hargreaves, M.D., Munshi, T., Edwards, H.G., et al.:Calculation and measurement of terahertz active normal modes in crystalline PETN. ChemPhysChem.11, 368–378 (2010)
18. Burnett, A.D., Kendrick, J., Russell, C., Christensen, J., Cunningham, J.E., Pearson, A.R., et al.: Effect ofMolecular Size and Particle Shape on the Terahertz Absorption of a Homologous Series ofTetraalkylammonium Salts. Anal. Chem. 85, 7926–7934 (2013)
19. Allis, D.G., Zeitler, J.A., Taday, P.F., Korter, T.M.: Theoretical analysis of the solid-state terahertz spectrumof the high explosive RDX. Chem. Phys. Lett. 463, 84–89 (2008)
20. Pereverzev, A., Sewell, T.D., Thompson, D.L.: Molecular dynamics study of the pressure-dependentterahertz infrared absorption spectrum of α- and γ-RDX. J. Chem. Phys. 139, − (2013)
21. Pereverzev, A., Sewell, T.D.: Terahertz normal mode relaxation in pentaerythritol tetranitrate. J. Chem.Phys. 134, 014513 (2011)
22. Pereverzev, A., Sewell, T.D.: Terahertz spectrum and normal-mode relaxation in pentaerythritol tetranitrate:Effect of changes in bond-stretching force-field terms. J. Chem. Phys. 134, 244502 (2011)
23. Pereverzev, A., Sewell, T.D.: Molecular dynamics study of the effect of pressure on the terahertz-regioninfrared spectrum of crystalline pentaerythritol tetranitrate. Chem. Phys. Lett. 515, 32–36 (2011)
24. Pereverzev, A., Sewell, T.D.: Effect of vacancy defects on the terahertz spectrum of crystallinepentaerythritol tetranitrate. AIP Conf. Proc. 1426, 1187 (2012)
25. Pereverzev, A., Sewell, T.D., Thompson, D.L.: Calculation of anharmonic couplings and THz linewidths incrystalline PETN. J. Chem. Phys. 140, 104508 (2014)
26. Millar, D.I., Maynard-Casely, H.E., Allan, D.R., Cumming, A.S., Lennie, A.R., Mackay, A.J., et al.: Crystalengineering of energetic materials: Co-crystals of CL-20. CrystEngComm. 14, 3742–3749 (2012)
27. Hageman, J.A., Wehrens, R., de Gelder, R., Leo Meerts, W., Buydens, L.M.C.: Direct determination ofmolecular constants from rovibronic spectra with genetic algorithms. J. Chem. Phys. 113, 7955–7962(2000)
28. N. Greenall, A. Valavanis, H.J. Desai, D.O. Acheampong, L.H. Li, J.E. Cunningham, et al.: DatasetAssociated With The Development of a Semtex-H Simulant for Terahertz Spectroscopy. (2015)
29. Mitchell, M. An Introduction to Genetic Algorithms. MIT press, Cambridge, MA, USA (1998)
J Infrared Milli Terahz Waves (2017) 38:325–338 337
30. MATLAB and the Global Optimisation Toolbox Release 2015b, The MathWorks, Inc., Natick,Massachusetts, United States., (2015)
31. Garnett, J.C.M.: Colours in Metal Glasses and in Metallic Films. Philosophical Transactions of the RoyalSociety of London. Series A, Containing Papers of a Mathematical or Physical Character. 203, 385–420(1904)
32. Parrott, E.P., Zeitler, J.A., Gladden, L.F.: Accurate determination of optical coefficients from chemicalsamples using terahertz time-domain spectroscopy and effective medium theory. Opt. Lett. 34, 3722–3724(2009)
33. Balan, E., Saitta, A.M., Mauri, F., Calas, G.: First-principles modeling of the infrared spectrum of kaolinite.Am. Mineral. 86, 1321–1330 (2001)
34. Kaushik, M., Ng, B., Fischer, B.M., Abbott, D.: Reduction of scattering effects in THz-TDS signals. IEEEPhotonic. Tech. L. 24, 155–157 (2012)
35. Franz, M., Fischer, B.M., Walther, M.: The Christiansen effect in terahertz time-domain spectra of coarse-grained powders. Appl. Phys. Lett. 92, 021107-021107-021103 (2008)
36. Shen, Y., Taday, P., Pepper, M.: Elimination of scattering effects in spectral measurement of granulatedmaterials using terahertz pulsed spectroscopy. Appl. Phys. Lett. 92, 051103 (2008)
37. Peng, J., Peng, S., Jiang, A., Wei, J., Li, C., Tan, J.: Asymmetric least squares for multiple spectra baselinecorrection. Anal. Chim. Acta. 683, 63–68 (2010)
38. O’Flynn, D., Desai, H., Reid, C.B., Christodoulou, C., Wilson, M.D., Veale, M.C., et al.: Identification ofsimulants for explosives using pixellated X-ray diffraction. Crime Science. 2, 4 (2013)
39. Desai, H.J. et al.: CAST explosives simulant classified patent on class of compounds referred to locally as‘Hemtex’. (2016)
338 J Infrared Milli Terahz Waves (2017) 38:325–338