Embed Size (px)
Citation preview
THE DEVELOPMENT OF A RISK-OF-FAILURE EVALUATION TOOL FOR SMALL DAMS IN MZINGWANE CATCHMENT.
By Ngonidzashe .L Mufute
(R984029P)
Supervisors
Eng. E. Kaseke Dr. A. Senzanje
A thesis submitted in partial fulfilment of the requirements for the Master of Science Degree in Integrated Water Resources Management
Department of Civil Engineering
UNIVERSITY OF ZIMBABWE
June 2007

The Development of a Risk-of-Failure Evaluation Tool for Small Dams in Mzingwane Catchment.
Ngonidzashe. L Mufute Masters in IWRM June,2007
i
ABSTRACT World wide attention is given to the prevention of failure of medium to large sized dams, with little attention being paid to small dams. As a result the physical condition of small dams is generally poor, making them susceptible to failure. However, small reservoirs are an important source of both primary and productive water for rural communities. It is against this background that this study was carried out to assess the current physical condition of the small dams in the area of study and the factors responsible for this condition. The Information was used to develop a risk of failure evaluation tool for small dams. The tool is meant to assist those involved in maintenance and rehabilitation of small dams. It helps to systematically and objectively classify risk of failure of small dams, there by assisting in the ranking of dams to prioritise and attend to first. This is important where resources are limited. The tool makes use of factors or criteria such as seepage, erosion and others that are conventionally used to assess condition of dams. The description of the extent to which the criteria affect the physical condition of small dams was then standardised. This was mainly guided by similar methods used in other countries but mostly for large dams and by HR Wallingford’s methodology for estimating risk of soil erosion. Cause effect diagrams were used to determine the stage at which each factor is involved in contributing to dam failure. Weights were then allocated to each factor depending on its stage in the process of causing dam failure. Scores are allocated to each factor based on its description and weight. Small dams design and maintenance guidelines were also used to guide the ranking and weighting of the factors. The risk of failure was then classified as low, moderate, high or very high. The tool was used to classify 7 small dams in Mzingwane catchment. One was found to have a moderate risk of failure, 4 had a high risk of failure and 2 had a very high risk of failure. Also, results of the physical assessment carried out in the study area indicated that the majority of the reservoirs in the studied area were designed and constructed following the recommended design guidelines. However there was a general lack of maintenance on the dams, which resulted in deterioration of the reservoirs condition. At least 68% of the reservoirs were affected by erosion. At least 65% of the dams had trees growing and termite mounds on their embankment dam walls. A significant number of the dams (59%) were old, over 27 years old and probably past their economic lifespan. The physical condition was thus not inline with the recommended condition. The reasons can be broken down into lack of resources by responsible authorities such as DDF, limited stakeholder collaboration, unclear policies of handing over small dams to the communities. It was concluded in the study that the risk of failure of small dams in the area is high and security of water availability is threatened. The tool could be used to help prioritise the use of the little available resources to target the most threatened dams for repair or rehabilitation. The tool needs to be tested in a wider geographical area to improve its usefulness. Key words: Small Dams, risk of dam failure, risk of failure evaluation tool, security of water availability.

The Development of a Risk-of-Failure Evaluation Tool for Small Dams in Mzingwane Catchment.
Ngonidzashe. L Mufute Masters in IWRM June,2007
ii
DECLARATION I NGONIDZASHE L. MUFUTE hereby declare that this work has been done at my prior knowledge and in my own capacity in the Department of Civil Engineering at the University of Zimbabwe. Date…………… Name….…….Signed……………………………

The Development of a Risk-of-Failure Evaluation Tool for Small Dams in Mzingwane Catchment.
Ngonidzashe. L Mufute Masters in IWRM June,2007
iii
DEDICATION This is a dedication to my parents Mr. and Mrs. Lucky Mufute who created conducive environment for me to pursue my dreams.
The Development of a Risk-of-Failure Evaluation Tool for Small Dams in Mzingwane Catchment.
Ngonidzashe. L Mufute Masters in IWRM June,2007
iv
ACKNOWLEDGEMENTS Thanks to the Almighty for keeping me all the way through the study. I wish to express my sincere gratitude to the following: My supervisors: Eng. E Kaseke and Dr A Senzanje for their diligent guidance, constructive criticism, and careful reading and correction of the manuscript. I also thank them for providing logistics for my work. Department of Civil Engineering, WaterNet and CPWF Small Reservoir Project PN46 and for funding the field work . Department of Soil Science and Agricultural Engineering for giving me the opportunity to use their laboratories and consult their technical staff. Mr. P. Makwarimba and Mr. Masanganise of ZINWA Design and Construction Unit, who gave their professional advice to my work. Mr. S. Ncube and Mr Chitopo for providing technical and logistical assistance during the fieldwork. Geophry Mamba and Chipo Masona who were fellow researchers in the field for their moral and technical assistance especially during fieldwork. The community in the area of study and all the consulted institutions (NGOs, ZINWA, DDF) for their valuable assistance and cooperation that made my research possible. Lastly, but certainly, not least, my family, friends, classmates and workmates, for their encouragement and support throughout my study, and to whom I cannot thank enough.

The Development of a Risk-of-Failure Evaluation Tool for Small Dams in Mzingwane Catchment.
Ngonidzashe. L Mufute Masters in IWRM June,2007
v
TABLE OF CONTENTS ABSTRACT ........................................................................................................................................................... i DECLARATION .......................................................................................................................................................... ii DEDICATION ......................................................................................................................................................... iii ACKNOWLEDGEMENTS............................................................................................................................................. iv TABLE OF CONTENTS.................................................................................................................................................. v LIST OF TABLES ........................................................................................................................................................ vii LIST OF FIGURES ....................................................................................................................................................... viii LIST OF ACRONYMS ................................................................................................................................................... ix LIST OF ACRONYMS ................................................................................................................................................... ix CHAPTER 1. INTRODUCTION............................................................................................................................. 1
1.1 Background ............................................................................................................... 1 1.2 Problem Statement .................................................................................................... 2 1.3 Justification ............................................................................................................... 2 1.4 General Research Questions ..................................................................................... 2 1.5 Specific Research Questions..................................................................................... 2 1.6 Main Objective.......................................................................................................... 3 1.7 Specific Objectives ................................................................................................... 3
CHAPTER 2 DESCRIPTION OF THE STUDY AREA ....................................................................................... 4 2.1 Introduction............................................................................................................ 4 2.2.0 Physioghraphy........................................................................................................ 4 2.3.0 Climate................................................................................................................... 5 2.4.0 Water Availability and Water Uses ....................................................................... 6
CHAPTER 3. LITERATURE REVIEW................................................................................................................. 7 3.1 0 Introduction............................................................................................................ 7 3.1.1 Definition and Types of Dams............................................................................... 7 3.1.2 Definition of a Small Dam..................................................................................... 7 3.2.0 Issues of Dam Failure ............................................................................................ 8 3.3.0 Recommended Small Dams Design and Maintenance Guidelines...................... 13 3.4 Issues Related to the Physical Condition of Small Dams in Zimbabwe.............. 15 3.5.0 Dam Safety Evaluation. ....................................................................................... 16
CHAPTER 4. METHODOLOGY.......................................................................................................................... 26 4.1 Reviewing of Records and Literature on Small Dams............................................ 26 4.2 Interviews................................................................................................................ 26 4.3 Field Measurements, Inspections, and Assessments............................................... 26 4.4 Comparing the Physical Condition of the Dams to the Recommended Small Dams
Design and Maintenance Guidelines. ................................................................... 29 4.5 Identifying the Issues Resulting in the Present Physical Condition of the Dams in
the Area of Study.................................................................................................. 29 4.6.0 Development of the Risk-of-Failure Evaluation/Estimation Tool for Small Dams........................................................................................................................................ 29 4.6.6 Basis for the classification for the classification System..................................... 32 4.7 Data Handling and Processing ................................................................................ 33
CHAPTER 5 RESULTS AND DISCUSSION...................................................................................................... 34 5.1.0 Reviews................................................................................................................ 34 5.2.0 Interviews and Discussions.................................................................................. 35 5.3 Rapid Physical Assessments ................................................................................... 36 5.4.0 Detailed Assessment of the Physical Condition of Small Dams .................. 38 5.4.1 Results........................................................................................................... 38
The Development of a Risk-of-Failure Evaluation Tool for Small Dams in Mzingwane Catchment.
Ngonidzashe. L Mufute Masters in IWRM June,2007
vi
5.4.2 Discussion of Detailed Assessments Results....................................................... 39 5.5.0. Other Outcomes from the Assessments, Interviews and Discussions with Community Members ................................................................................................... 39 5.6 The Current Physical Condition of the Dams as Compared to the Recommended Small Dams Design and Maintenance Guidelines........................................................ 42 5.7 Issues Resulting in the Present Physical Condition of the Small Dams in the Study Area............................................................................................................................... 42 5.8 The Implication of the Physical Condition of the Small Dams to Dam Failure and Security of Water Availability. ..................................................................................... 43 5.9 0 The Risk of Failure Evaluation Tool ................................................................... 44 5.9.2 Using the Risk-of-Failure Estimation Tool.......................................................... 46
CHAPTER 7. CONCLUSIONS AND RECOMMENDATIONS ......................................................................... 50 7.1 Conclusions............................................................................................................. 50 Recommendations................................................................................................... 51 7.3 Areas for Further Research. .............................................................................. 52
8.0 REFERENCES ....................................................................................................................................................... 53 APPENDICES 56
Appendix 1 Interview Questions .............................................................................. 56 Appendix 2 Rapid Assessment Results Summary.................................................... 57 Appendix 3 Detailed Assessment Results Summary................................................ 60 Appendix 4 The Risk Evaluation Tool Development Process Issues....................... 63
Appendix 5 Risk Based Approaches from Around the World 75 Appendix 6. Assessed Dams in Insiza Sub Catchment (Godhlwayo Area) .......... 85
The Development of a Risk-of-Failure Evaluation Tool for Small Dams in Mzingwane Catchment.
Ngonidzashe. L Mufute Masters in IWRM June,2007
vii
LIST OF TABLES Table 4.1 An extract of the Description of Risk Factors ...........................................31 Table 4.2 Classification of the Overall a Dam’s Risk of Failure Score.......................32 Table 5.1 Detailed assessment of the physical condition of small dams- Results
Summary ..........................................................................................38 Table 5.2 Laboratory Soil Analysis Results ............................................................39 Table 5.3 The Risk Failure Evaluation Tool............................................................45 Table 5.4 Classification of the Overall a Dam’s Risk of Failure Score........................46 Table 5.5. Spreadsheet of the completed risk evaluation of Dewa Dam .......................47 Table 5.6 The Risk of Failure of Selected Dams in the Area of Study.........................48 Table A.1 Summary of Rapid Assessment Results ...................................................57 Table A.2 Sample Results of the Detailed Assessment of the Physical Condition of
Small Dams: Mzambani Dam..............................................................60 Table A.3 Detailed Assessment of the Physical Condition of Small Dams- Results :
Overall Summary...............................................................................62 Table A.4 Standardizing the Description of the Risk Factors / Criteria. ...................63 Table A.5 Erosion on Embankment(Descriptions based on observations from field
assessments) ......................................................................................66 Table A.6 Determination of Weights .....................................................................72 Table A.6 Determination of Weights .....................................................................73 Table A.7 Relationships between levels and weights. ..............................................74 Table A.8 Summary of Description of Catchment Characteristics in HR Wallingford’s
Methodology for Estimating Risk of Soil Erosion. ...............................74 Table A.9 ANCOLD’s guidelines used in the risk assessment approaches in Australia.75 Table A.10 . Portuguese Evaluation.........................................................................77

The Development of a Risk-of-Failure Evaluation Tool for Small Dams in Mzingwane Catchment.
Ngonidzashe. L Mufute Masters in IWRM June,2007
viii
LIST OF FIGURES Figure 1.1: Project Study Area. .............................................................................4 Figure 3.1: The principal parts of an earth fill dam. .................................................7 Figure 3.2: Risk Management Process. .................................................................18 Figure 5.1 Ages of the Assessed Dams .................................................................41 Figure A.6. Design Step Format ...........................................................................79 Table A.12. Benchmarks for Calibrating Point rating Algorithm For Use in Decision
Framework .......................................................................................80 Table A.13 Numerical Rating Format for Assessing Consequences of Dam Failure ...81 Table A. 14 Equations for Prioritization Ranking .........................................................82 Figure A.7 Rating Points for Prioritization............................................................83 Table A.15 Matrix for Evaluating Seriousness of Deficiencies ...................................84

The Development of a Risk-of-Failure Evaluation Tool for Small Dams in Mzingwane Catchment.
Ngonidzashe. L Mufute Masters in IWRM June,2007
ix
LIST OF ACRONYMS AEP Annual Exceedance Probabilities ANCOLD Australian National Committee on Large Dams
AREX Agricultural Research and Extension
ASWCC Arkansas Soil and Water Conservation Commission,
BOR Bureau of Reclamation
CADEC Catholic Development Commission
DDF District Development Fund
FEMA Federal Emergency Management Agency
FRF Flood Reduction Factor
GPS Global/Ground Positioning System
ICOLD International Commission on Large Dams
ICRAF International Centre for research in Agroforestry
IWRM Intergraded Water Resources Management
MPF Maximum Probable Flood
NGO Non Governmental Organization
NZSOLD New Zealand Society On Large Dams
PMF Probable Maximum Flood
PMP Probable Maximum Precipitation
RDC Rural District Council
RELMA Regional Land Management Unit
SSAE Soil Science and Agricultural Engineering
USA United States of America
USC Unified Soil Classification
USACE United States of Army Corps of Engineers
WEDC Water, Engineering and Development Centre
WV World Vision
ZINWA Zimbabwe National Water Authority
The Development of a Risk-of-Failure Evaluation Tool for Small Dams in Mzingwane Catchment.
Ngonidzashe. L Mufute Masters in IWRM June,2007
1
CHAPTER 1. INTRODUCTION 1.1 Background World wide much attention is given to the prevention of failure of medium sized to large dams with little attention being paid to small dams (Pisaniello et. al., 2006). However, small reservoirs are a very important source of both primary and productive water for rural communities. Failure of small dams reduces the security of water availability and therefore threatens the livelihoods of the affected communities. Little attention is normally given to the risk of failure of these small dams because dam failure is normally viewed in the context of the risk that is posed to life and property downstream of the dam (Rettermeier,2001). Consequently medium to large sized dams are considered to pose high risk if they fail as compared to small dams, which are usually considered to be of low risk, as they do not normally result in huge losses of life and property damage if they fail. As a result, small dams are neglected and are generally in a poor physical condition and are susceptible to failure. In this study dam failure in this study refers to the inability of a dam to hold water due to breaching or siltation. Risk of failure refers to the probability or possibility of failure. Physical condition refers to the state of the components of a dam such as spillways and dam wall in terms of the presence of deficiencies such as cracks, erosion and seepage. The Zimbabwean Department of Water Development defines a small dam as a structure which has vertical height of less than 8 metres measured from the non-overflow crest of the wall to the lowest point on the downstream face of such wall or is capable of storing less than 1 000 000 m3 of water at full supply level (Muyambo, 2000). This was taken as the definition of a small dam in this study. The frequency of failures of small dams is higher than that of large dams. This is mainly because of poor designing, poor quality construction and deterioration due to lack of proper maintenance mostly associated with small dams (FEMA, 1987;Pisaniello et. al., 2006). In China for instance, according to Fu and Qng quoted in Pisaniello et al (2006), between the years 1950 and 1980, there was a total of 2796 dam collapses in the whole country (roughly about 3.7% of all dams in China). Of the number, which failed, 80% were classified as small dams. It should however be noted that the above mentioned dams have been operating for 30 to 40 years and some for almost 50 years (Pisaniello et al, 2006) as a result, deterioration due to old age was also factor contributing to the collapses. Other than the reasons given above as to why attention should be given to the physical condition of small dams; they are very important for ensuring water availability and sustenance of livelihoods for the rural communities. The importance of small dams in this regard is especially pronounced in semi-arid and water scarce areas such as Mzingwane catchment in Zimbabwe (Sithole and Senzanje,2006). As many as 1000 small dams are located in the Limpopo basin where Mzingwane catchment is (Saunyama, 2005). In some places these small dams are the only source of water for domestic purposes as well as for
The Development of a Risk-of-Failure Evaluation Tool for Small Dams in Mzingwane Catchment.
Ngonidzashe. L Mufute Masters in IWRM June,2007
2
productive uses such as livestock watering, brick making, fishing and irrigation (Sithole and Senzanje,2006). In Zimbabwe, like in the rest of the world, inadequate care is being given to small dams (CARE Zimbabwe, 2002;). Without appropriate design, construction and maintenance, small dams eventually fail, depriving the communities and animals of the much-needed water that is vital for sustenance of life. It is against this background that this study was carried out to explore these issues and others that might lead to failure of small dams, and contribute towards solving this problem by developing a risk of failure evaluation tool. 1.2 Problem Statement Small dams are not being properly maintained in Mzingwane catchment. Lack of resources was noted by a socio economic survey by Sithole and Senzanje (2006) as the major reason for this. This means that there is need to prioritise the use of the limited resources available. However there is no simple tool that would help achieve this through evaluating and quantifying risk of failure of small dams in the study area. 1.3 Justification Small dams are an important source of water in semi-arid areas such as Mzingwane catchment (Sithole and Senzanje, 2006). Sustainable ways of preventing the failure of small dams should be found so as to ensure reliable water availability and sustenance of livelihoods in the area of study. Because of the limited availability of resources to maintain the small dams, there is need to stretch the effectiveness of the available resources by prioritising small dams to target for maintenance and rehabilitation programs. A risk of failure evaluation tool would assist in this regard. There is also lack of information on the actual factors determining the physical condition of small dams in the study area as there are no substantive records on the management of the dams. This came out in interviews held with District Development Fund personnel who are responsible for the design, construction and maintenance of communal small dams in Zimbabwe. Evaluation of risk of failure of dams require such information (Rettermeier,2001;Bowles,1989;FEMA, 1987). 1.4 General Research Questions
• How does the physical condition of small dams in Mzingwane catchment compare with the recommended design and maintenance guidelines for small dams, and relate to dam failure and water availability.
• How can risk of failure evaluation help prevent dam failure and secure livelihoods in the area of study?
1.5 Specific Research Questions
• What is the physical condition of small dams in the study area? • Is the state of the small dams in line with recommended design and maintenance
guidelines for small dams?
The Development of a Risk-of-Failure Evaluation Tool for Small Dams in Mzingwane Catchment.
Ngonidzashe. L Mufute Masters in IWRM June,2007
3
• What are the issues resulting in the small dams being in the current physical state? • Does the physical condition of small dams threaten dam failure and security of
water availability in the area of study? • How can the risk of failure of small dams be evaluated in the study area so as to
help prevent their failure? 1.6 Main Objective To develop a risk-of-failure evaluation tool for small dams in Mzingwane catchment. 1.7 Specific Objectives
• To qualitatively and quantitatively assess the physical condition of small dams in the study area.
• To compare the physical condition of the small dams to the recommended small dams design and maintenance guidelines.
• To identify the factors leading to the observed physical condition of the dams in the area of study.
• To develop a risk-of-failure evaluation tool for small dams.
The Development of a Risk-of-Failure Evaluation Tool for Small Dams in Mzingwane Catchment.
Ngonidzashe. L Mufute Masters in IWRM June,2007
4
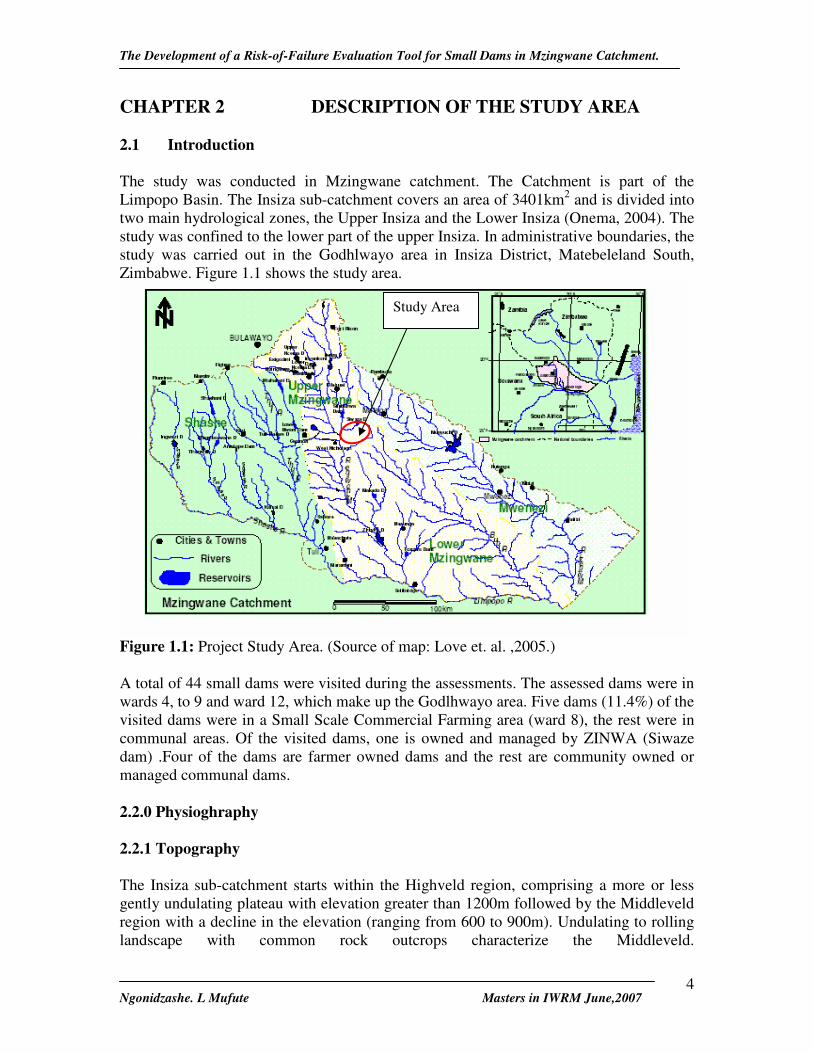
CHAPTER 2 DESCRIPTION OF THE STUDY AREA 2.1 Introduction The study was conducted in Mzingwane catchment. The Catchment is part of the Limpopo Basin. The Insiza sub-catchment covers an area of 3401km2 and is divided into two main hydrological zones, the Upper Insiza and the Lower Insiza (Onema, 2004). The study was confined to the lower part of the upper Insiza. In administrative boundaries, the study was carried out in the Godhlwayo area in Insiza District, Matebeleland South, Zimbabwe. Figure 1.1 shows the study area.
Figure 1.1: Project Study Area. (Source of map: Love et. al. ,2005.) A total of 44 small dams were visited during the assessments. The assessed dams were in wards 4, to 9 and ward 12, which make up the Godlhwayo area. Five dams (11.4%) of the visited dams were in a Small Scale Commercial Farming area (ward 8), the rest were in communal areas. Of the visited dams, one is owned and managed by ZINWA (Siwaze dam) .Four of the dams are farmer owned dams and the rest are community owned or managed communal dams. 2.2.0 Physioghraphy 2.2.1 Topography The Insiza sub-catchment starts within the Highveld region, comprising a more or less gently undulating plateau with elevation greater than 1200m followed by the Middleveld region with a decline in the elevation (ranging from 600 to 900m). Undulating to rolling landscape with common rock outcrops characterize the Middleveld.
Study Area

The Development of a Risk-of-Failure Evaluation Tool for Small Dams in Mzingwane Catchment.
Ngonidzashe. L Mufute Masters in IWRM June,2007
5
2.2.2 Soils Soils in the Insiza Sub-catchment are considered to be coarse-grained sandy loams. Slightly heavier textures often occur in upper slope positions close to rock outcrops. Associated soils are gravelly and shallow (Onema, 2004) . 2.2.3 Rivers in the area The rivers and streams in the area are tributaries of the Limpopo River. Most rivers are able to provide water only for short periods of time each year in the catchment. On major reaches of the Limpopo and many of its tributaries, the flow of water in the river in dry years can occur for 40 days or less. When the rivers do flow, river water can contain up to 30% sand and silt (Saunyama, 2005). 2.2.4 Vegetation According to Onema, (2004),the communal lands are characterized by relatively high population densities. The resultant disturbance of the vegetation by cultivation has greatly depleted the extent of climax woody cover . The north part of the Insiza sub-catchment with moderate rainfall has low open woodland of thorny acacia trees associated with granitic or gneissic derived sandy soils. Where drainage is restricted or on heavier textured soils, mopane trees become dominant. Towards the south of the sub-catchment, there is an area of transition with vegetation types and species changing with elevation from sparse low mopane woodland being gradually replaced by more open woodland. Some areas of the Insiza communal lands where rock outcrops are predominant are mainly bare apart from a small patch of multi- colored lichens and a few pockets of black humic sand supporting small bushes. The pediment slopes were under Miombo woodland although this has been largely replaced by cultivation. 2.3.0 Climate 2.3.1 Temperature, Rainfall and Evaporation Values for air temperature are closely related to altitude with mean annual temperatures ranging from about 120C to 290C. Temperatures are lowest in June and July and highest in October. The rainy season occurs between November and March and the spatial distribution of rainfall is quite variable over the entire catchment. The annual rainfall ranges from 250mm in the south to 550mm in the north of the catchment, with an average of about 350mm over the entire catchment (Love et. al, 2005). The study area is in the upper areas of the Mzingwane catchment were the average annual rainfall is 550mm as confirmed by rainfall records from ZINWA Siwaze dam station as well as Dekezi Meteorological Department Sub Station. These stations are located in the area of study. A short and intense rainy season in the study area just like the other parts of the Limpopo river basin with highly unreliable rainfall, leads to frequent droughts. As a result of the frequent droughts and high evapotranspiration rates the catchment is generally water scarce and crop production is not secure.

The Development of a Risk-of-Failure Evaluation Tool for Small Dams in Mzingwane Catchment.
Ngonidzashe. L Mufute Masters in IWRM June,2007
6
2.3.2 Run Off Mean Annual Runoff of the two hydrological zones is 50mm and 38mm respectively. Onema, 2004 2.4.0 Water Availability and Water Uses In the Godhlwayo area where the study was confined, there is only one medium sized dam with the rest being small dams. The community small dams are mostly under the management of the District Development Fund (DDF). The capacity of small dams could not be established due to lack of complete records in the area of study. The Medium sized dam called Siwaze is managed by the Zimbabwe National Water Authority (ZINWA).It has a capacity of 2.3 million cubic metres of water (ZINWA, 2006). The greater part of the catchment is composed of ancient igneous rock formations, where ground water potential is comparatively low. (Onema, 2004) However the ground water potential of the study area has not been fully investigated (Moyo, 2005). However evidence on the ground seem confirm that the potential is limited due to the poor yields of boreholes which were drilled in the area (Moyo,2005). The few boreholes that are found in the area are also usually not working due to lack of repair and maintenance (Sithole and senzanje, 2006). An analysis of the area during the assessments of dam condition during the course of this thesis study revealed that dry river beds are also used as sources of water for the communities. However these are the last resort, usually used when other sources such as dams and boreholes cannot be assessed. Major uses of water in the area are livestock watering, gardening and domestic purposes such as bathing, laundry and drinking (Sithole and Senzanje,2006). Irrigation of small communal plots is also carried out using water from larger small dams and Siwaze dam. For example Siwaze dam supports a 20 ha irrigation scheme near Avoca, in the Godhlwayo communal area. Given the above described scenario of water availability in the study area, it is evident that there are few alternative water sources to small dams. In fact, in some places of the study area, small dams are actually the only water source (Sithole and senzanje,2006). Small dams are therefore very important for ensuring water availability and sustenance of livelihoods for communities in the area of study.

The Development of a Risk-of-Failure Evaluation Tool for Small Dams in Mzingwane Catchment.
Ngonidzashe. L Mufute Masters in IWRM June,2007
7
CHAPTER 3. LITERATURE REVIEW 3.1 0 Introduction 3.1.1 Definition and Types of Dams A dam is a barrier constructed across a watercourse for the purpose of storing water. The most common type is the earth fill or earthen dam. There are also concrete dams (gravity, arch, multi-arch, and buttress types) and dams constructed of masonry, timber, rock fill, steel, and combinations of these materials. Earth dams may be further classified as simple, core, and diaphragm. The simple embankment type consists of reasonably uniform material throughout, sometimes with a blanket of highly impervious material placed on its upstream face. This type of dam is also referred to as a homogeneous embankment dam. Core embankments have a central zone or core of carefully chosen material, which is less pervious than the rest of the dam. This dam is also referred to as a zoned embankment dam. Diaphragm type dams incorporate a relatively thin section of concrete, steel, or wood - sometimes referred to as a cut-off wall - in the central portion of the embankment, which forms a barrier to the flow of water percolating through the dam. (ASWCC, 2002: Muyambo, 2000; Shaw, 1977). Figure 2.1 illustrates the principal parts of an earth fill dam. Understanding the purpose of these is essential to any evaluation of a dam’s condition.
Figure 3.1: The principal parts of an earth fill dam. Source: (ASWCC, 2002) 3.1.2 Definition of a Small Dam. The definition of a small dam varies worldwide. However it is based on the height and the storage capacity of the reservoir (Saunyama,2005). The World Commission on Reservoirs defines it as having a dam wall of less than 15 m in height and holding less than one million cubic metres of water. In the United States of America (USA), a small dam is defined as having a wall height of six metres or less, or having a capacity of less than 1.23 * 105 m3 of water (Senzanje and Chambari, 2002 quoted in Saunyama,2005).

The Development of a Risk-of-Failure Evaluation Tool for Small Dams in Mzingwane Catchment.
Ngonidzashe. L Mufute Masters in IWRM June,2007
8
The Zimbabwe Water Act of 1998 defines a small dam as a structure which: i.) has a vertical height of more than 8 metres but less than 15 metres measured from the non overflow crest of the wall to the lowest point on the downstream face of such wall or ; ii.) is capable of storing more than 500 000 m3 but less than 1 000 000 m3 of water at full supply level. Muyambo (2000) defines a small dam as a structure which: i.) has a vertical height of 10 metres or less measured from the non-overflow crest of the wall to the lowest point on the downstream face of such wall or; ii.) is capable of storing 1 000 000 m3 of water or less at full supply level. The Department of Water defines a small dam as a structure which: i.) has vertical height of less than 8 metres measured from the non-overflow crest of the wall to the lowest point on the downstream face of such wall or; ii.) is capable of storing less than 1 000 000 m3 of water at full supply level. In this study, the definition of a small reservoir is taken as implied by the Zimbabwean Department of Water definition. This is because it is the local definition that best suit the type of reservoirs in the area this study was conducted. The Zimbabwe water act definition the excludes dams with a capacity of less than 500 000 m3 which are the majority of the small dams in the area (CARE,2002). Muyambo’s definition is not much different from that of the department of water. However the later is chosen as it comes from an official government organisation. 3.1.3 The Role of Small Dams in Water Provision Water scarcity is one of the most pressing issues facing humanity today. Provision of sufficient water is necessary for human health and poverty reduction. The most extreme shortages are experienced by those least able to cope with them – the most impoverished inhabitants of developing countries. This situation is especially pronounced in semi arid areas such as Mzingwane catchment were there are also very few alternative sources of water to small reservoirs. In some places these small reservoirs are the only sources of water for communities (Sithole and Senzanje, 2006).Water from small dams is used for many purposes. For humans, they provide water for primary purposes such as drinking, cooking and bathing and for productive purposes such as irrigation, livestock watering and brick making. (CARE, 2002). Thus they can play an important role in household income generation and livelihood strategies, for example by reducing over reliance on single production activities such as rain fed cultivation in areas where rainfall is not reliable. 3.2.0 Issues of Dam Failure 3.2.1 Problems Resulting From Failure of Small Dams. Below are summarized effects of dam failure in general:
- Loss of life and damage to communities which live downstream of the dam. Loss of investment. Dam construction is capital intensive and there for if the dam fails a lot of investment money is lost and more resources have to be pulled together to reconstruct the dam if this is still feasible Small dams especially those in rural settings are however usually assumed to have a low hazard risk. This means that in the event of failure, it is

The Development of a Risk-of-Failure Evaluation Tool for Small Dams in Mzingwane Catchment.
Ngonidzashe. L Mufute Masters in IWRM June,2007
9
likely that very few lives and property will be lost as there are few permanent structures of high economic value or homes that are along water courses and can be affected by floods from a failed small dam. (FEMA,1987),
- Dam failure can have a negative impact on the environment. It may result in loss of certain species that would have established there niche in the reservoir. Failure of dam means loss of habitat to the species.
Loss of water for both productive and primary uses which were depending on the dam for water supply. From the point of view of small dams, especially for those in arid areas, this is probably the most serious consequence of dam failure. As there very few alternatives to small dams in some semi arid areas such as Mzingwane catchment, failure of a small dam in a locality can cause serious water problems in the particular area. All the water uses including domestic and those uses that support livelihoods such as gardening and livestock watering are seriously affected. Cases were reported of communities having to move livestock to the next water source which is usually another dam located kilometres away (Sithole and Senzanje`, 2006). 3.2.2 Causes of dam failure There are many complex reasons - both structural and non-structural - for dam failure. Many sources of failure can be traced to decisions made during the design and construction process and to inadequate maintenance or operational mismanagement (FEMA, 1987). Failures have also resulted from the natural hazards such as large scale flooding, earthquake movement and poor environmental protection. Dam structure itself can be a source of risk due to possible construction flaws and weaknesses which develop because of aging. The site immediately surrounding the structure may also increase structural risk if the dam is not positioned or anchored properly or if excessive reservoir seepage erodes the foundation or abutments (ASWCC, 2002: FEMA, 1987).
Poor catchment practices can result in land degradation which in turn results in soil erosion. The eroded material eventually travels down the streams and river into reservoirs, causing siltation if they are in large amounts. As a result the dam will fail as it is would no longer be able to hold water for the purposes it was constructed. In fact siltation is regarded as one of the greatest risks to the failure of small dams especially in communal areas where environmental protection practices are absent or ineffective (RELMA, 2005; CARE Zimbabwe, 2002 and Muyambo, 2000). However, from the perspective of the owner managers, the structure of a dam is the starting point for thorough understanding of the potentials for failure (FEMA, 1987).
3.2.3 Types of Failures According to FEMA (1987), types of dam failure can be classified as rainy day and sunny day failures. A rainy day failure could occur when heavy precipitation, in excess of that normally observed in the watershed above the dam, leads to a high runoff period. If the high water was to overtop the dam or add too much pressure, a rapid failure could result. A normal storm event could lead to overtopping the dam if the outlet works are plugged with debris, if the gates jammed or were broken, or if a power failure prevented operation of key mechanisms. All the items can be controlled by proper operation and maintenance of the dam.

The Development of a Risk-of-Failure Evaluation Tool for Small Dams in Mzingwane Catchment.
Ngonidzashe. L Mufute Masters in IWRM June,2007
10
Dams have also failed without any heavy precipitation. These failures are called sunny day failures. They are usually the result of neglected inspection programs and poor maintenance and operation of the dam. As an example, failure to consider embankment seepage could lead to piping (internal erosion).A sunny day failure could be caused by vandalism of the outlet works, such as damage to gate mechanisms, or if the outlet works are plugged with debris. Both rainy and sunny day failures can occur at new dams. New dams are very susceptible during initial filling and for a few years after filling. In fact, many dams have failed during their first filling.
3.2.4 Categories of structural failure of dams
The International Commission of Large Dams (ICOLD) as discussed in FEMA, (2006), conducted a study on the causes of dam failure. According to the results of this study, for embankment or earth fill dams, the major structural cause for failure of fill or embankment dams was piping or seepage. Other hydrologic failures were significant, including overtopping and erosion from water flows. All earthen dams exhibit some seepage; however, as discussed earlier, this seepage can and must be controlled in velocity and amount. Seepage occurs through the structure and, if uncontrolled, can erode material from the downstream slope or foundation backward toward the upstream slope. This "piping" phenomenon can lead to a complete failure of the structure. Piping action can be recognized by an increased seepage flow rate, the discharge of muddy or discoloured water below the dam, sinkholes on or near the embankment, and a whirlpool in the reservoir.
Earth dams are particularly susceptible to hydrologic failure since most sediments erode at relatively low water flow velocities. Hydrologic failures result from the uncontrolled flow of water over the dam, around the dam, adjacent to the dam, and the erosive action of water on the dam's foundation. Once erosion has begun during overtopping, it is almost impossible to stop.
3.2.5 Examples of Failure of Earthen Small Dams. The frequency of failures of small dams is much higher than that of large dams. This is mainly because of poor designing or lack of designing, poor quality construction and deterioration due to lack of proper maintenance mostly associated with small dams. In China for instance, according to Fu and Qing quoted in Pisaniello et al (2006), between the years 1950 and 1980, there was a total of 2796 dam collapses in the whole of China (roughly about 3.7% of all dams in China). Of this number 80% or 2263 were classified as small dams. It should however be noted that the above mentioned dams have been operating for 30 to 40 years and some for almost 50 years (Pisaniello et al, 2006) as a result, deterioration due to old age was also factor contributing to the collapses. Other cases of failed dam in the world are abundant; a few cases are illustrated below. In the USA, the Kelley Barnes Lake dam only 8m high, failed in 1977 killing a total of 39 people. Lake Lawn dam in Colorado which was also 8m high and stored only 830 000 m 3, failed in 1982 killing 3 people and causing US $31million in damage (Pisaniello et. at., 2006). In Southern Zimbabwe a lot of small dams have failed, putting the livelihoods of local people at risk in the area of study (CARE, Zimbabwe, 2002)
The Development of a Risk-of-Failure Evaluation Tool for Small Dams in Mzingwane Catchment.
Ngonidzashe. L Mufute Masters in IWRM June,2007
11
3.2.6 The development of a dam safety programme. The significance of the dam failure problem points out the need for a dam safety management and risk failure evaluation program. Such a program should be based on an evaluation to determine a dam's structural condition. The evaluation should identify problems and recommend remedial repairs, operational restrictions and modifications, or further analyses and studies to determine solutions to the problems.
A safety program comprises several components addressing the spectrum of possible actions to be taken over the short and long term. (FEMA, 2002; ASWCC, 2002; NZSOLD, 1997) These actions include:
Assessing the condition of the dam and its components
Conducting preliminary and detailed inspections
Identifying repairs and continuing maintenance needs
Establishing periodic and continuous monitoring capabilities over the long-term
Establishing an emergency action plan to help minimize adverse impacts should the dam fail
Establishing operations procedures which recognize dam failure hazards and risks
Documenting the safety program so that the information established is available at times of need and can be readily updated
Development of a safety program involves a phased process beginning with collection and review of existing information, proceeding to detailed inspections and analyses, and culminating with formal documentation. Much of the preliminary work can be accomplished by the dam owner with the assistance of state and local public agencies. However, depending upon the number and seriousness of problems identified by the initial assessment, professional assistance by qualified engineers and contractors may be required.
The guidelines for assessing existing conditions are sequences of steps that will enable a dam owner to secure the information needed to determine the need for subsequent detailed investigations, repairs and maintenance (FEMA, 1987) The steps include:
• Reviewing existing data
• Visiting the site
• Inspecting the dam
• Assessing significance of observed conditions
• Deciding what to do next. (FEMA, 2002; ASWCC, 2002; NZSOLD, 1997)
Reviewing Existing Data
The Development of a Risk-of-Failure Evaluation Tool for Small Dams in Mzingwane Catchment.
Ngonidzashe. L Mufute Masters in IWRM June,2007
12
The important first step is to collect and review available information on the dam - its design, construction, and operation. A first requirement is a good map of the site. Maps of the watershed and the downstream channel reaches are also valuable.
The design of the dam and its appurtenant structures should be reviewed to assess its actual performance compared to that intended. Engineering records originating during construction should be reviewed to determine if structures were constructed as designed. Records of subsequent construction modifications should be collected, as well as operation records which document the performance of the dam and reservoir.
Any previously prepared dam safety plans should be reviewed to determine if it is up to date and workable.
All these records should be incorporated into a notebook or file; they are most important in establishing a safety program and its supporting documentation.
Visiting the Dam Site
A careful look at the structure and its surroundings from the point of view of its potential hazard is required.
Inspecting the Dam - It will be necessary to take a detailed and systematic look at all components of the lam and reservoir system. The description of the site's components should aid this inspection. The descriptions are generalized, and it must be recognized that dams and their components and in various shapes and sizes and differ greatly in detail. Features to inspect include:
• Access roads and ways
• Upstream slope
• Crest
• Downstream slope
• Left and right abutments
• Spillways
• Outlets and drains
• Reservoir area (exposed and submerged)
Conditions to look for include deterioration, cracks and lumps, seepage, internal corrosion and weathering, settlement, and foundation rock deterioration and/or dissolution. A dam may look stable but is susceptible to failure resulting from gradual deterioration of its internal structure. Regular and very detailed inspections and follow-up monitoring and maintenance are needed to assure the maximum level of safety.
Assessing Significance of Observed Conditions
The Development of a Risk-of-Failure Evaluation Tool for Small Dams in Mzingwane Catchment.
Ngonidzashe. L Mufute Masters in IWRM June,2007
13
Detailed information on conducting inspections and assessing the significance of observed conditions can be obtained from inspection guidelines (FEMA, 2002; ASWCC, 2002; NZSOLD, 1997).Typically, eroded areas, seepage, slides, and outflow draw the most attention.
Deciding What to Do Next
These initial activities will have provided a good start to establishing a dam safety program. Available information on design and construction of the dam and later structural modifications provides perspective on its existing condition relative to that intended. If no documentation exists then development of equivalent detail should be a first priority.
3.3.0 Recommended Small Dams Design and Maintenance Guidelines. This section will highlight the recommendations on design, inspection and maintenance of small dams that were the basis of the assessments that were done in the study. 3.3.1 Design Guidelines Embankment
o Slope gradient should be 1: 2.5 (vertical to horizontal distance) upstream and 1:2 downstream (Muyambo, 2000; Shaw, 1977) and on dams less than 3m in height; it should be 1: 3 maximum upstream and 1:2.5 maximum on the downstream slope (RELMA, 2005).
o Dams should have riprap to protect upstream face from erosion and wave action. The constituent rock should not be single sized, but well graded mixture, have a maximum rock dimension of 600mm and have a limited proportion of fines (material less than 25mm) to less than 10% by weight.
o Fast growing, short rooted spreading grasses such as couch, star, kikuyu grasses should be used for downstream protection in wet environments,
o Riprap as on the upstream slope, should be used for downstream protection in semi arid and arid climates, else grass cover should be established with the aid of irrigation.
o The crest width should not be less than 4 m for dams larger than 3m in wall height. And must not be smaller than 2m for dams smaller than 3m in height.
o Crest must have a slope of 1:50 towards the upstream slope (Muyambo, 2000; Shaw, 1977; RELMA, 2005;CARE Zimbabwe,2002)

The Development of a Risk-of-Failure Evaluation Tool for Small Dams in Mzingwane Catchment.
Ngonidzashe. L Mufute Masters in IWRM June,2007
14
Spillways.
o The sill should be located on solid rock that will not undercut or erode under the action of water. If this is not possible, the toe of the spillway must be protected and a lined return channel must be constructed to lead the water back to the main watercourse. This is done to prevent damage by floodwaters to the main dam wall or other works. Training walls should be used for this purpose.
o The end of any lined channel must terminate on solid rock or have a cut off down to solid ground to prevent undercutting and degradation (Muyambo, 2000; Shaw, 1977)
o Dry free board should not be less than 0.75 m (Muyambo, 2000; Shaw, 1977;) (For dams higher than 3m) and 0.5 for those less than 3 m (RELMA, 2005)
o An excavated spillway should have a slope of 3:100 towards reservoir (upstream) and 3:100 towards downstream on the downstream side. (RELMA, 2005; www.lboro.ac.uk)
o Maximum velocity of water flowing on the spill way should be 2.5m/s. (www.lboro.ac.uk)
Soils Coarse-grained material containing sufficient clay or silt to ensure reasonable imperviousness would be preferred over soils high in percentage of fines. Preferred soils are; gravel-sand-clays, sandy clays, gravel with excess silt or clay. Silty clays, organic clays and sands are not recommended. For dams less than 3m high, soils with 20 –30% clay content (especially clayey gravel, clayey sands) should be used. Alternatively inorganic clays can be used. Soils with a plasticity index of greater than 30 should be avoided. (Muyambo, 2000; Shaw, 1977; RELMA, 2005) 3.3.2 Inspection and Maintenance Guidelines. It is recommended that a dam should be kept under regular visual inspection to note any deterioration taking place and taking appropriate action. All dams should be inspected regularly under normal operating conditions and immediately following any unusual event such as first filling, a flood, or an earthquake (ASWCC, 2002; NZSOLD,1997;FEMA,1987). Suggested times for normal inspections, at specific locations and for potential problems, are summarized in Table 2.1. To encourage the early detection and repair of any abnormalities and/ or deteriorating conditions, all dam owners should prepare inspection checklists and keep inspection records for their structures. Checklists or records should be tailored to reflect the particular characteristics of the dam and its associated structures.
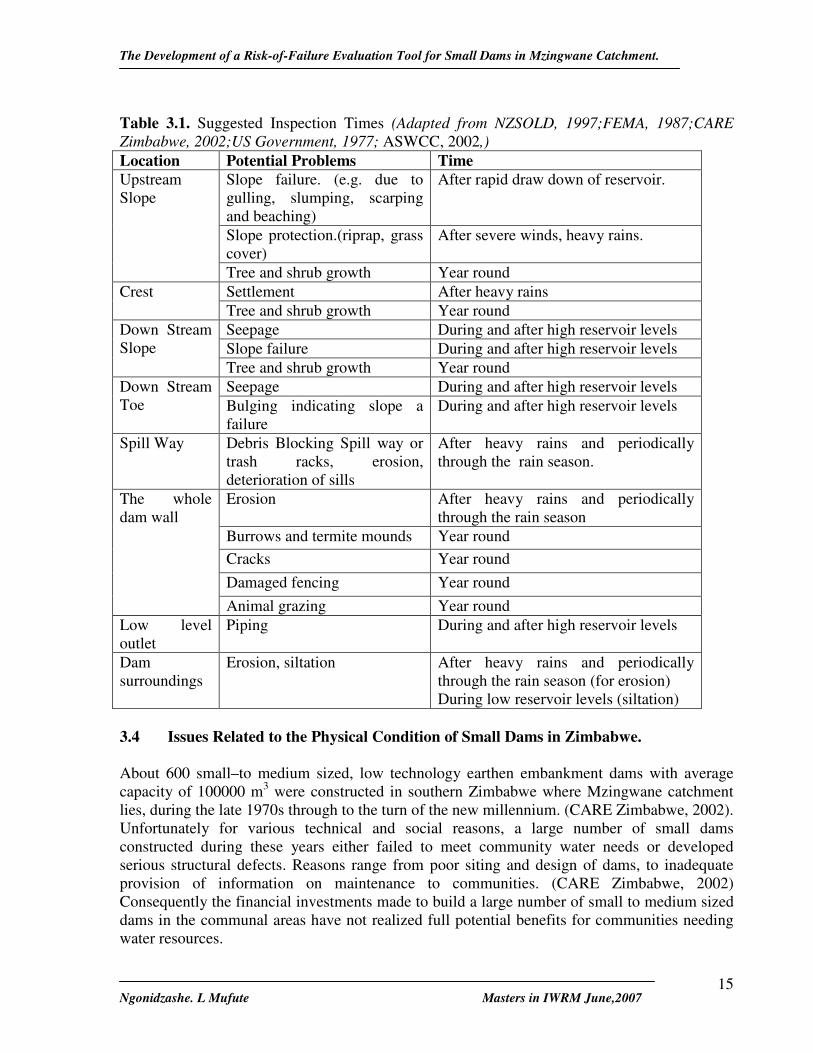
The Development of a Risk-of-Failure Evaluation Tool for Small Dams in Mzingwane Catchment.
Ngonidzashe. L Mufute Masters in IWRM June,2007
15
Table 3.1. Suggested Inspection Times (Adapted from NZSOLD, 1997;FEMA, 1987;CARE Zimbabwe, 2002;US Government, 1977; ASWCC, 2002,) Location Potential Problems Time
Slope failure. (e.g. due to gulling, slumping, scarping and beaching)
After rapid draw down of reservoir.
Slope protection.(riprap, grass cover)
After severe winds, heavy rains.
Upstream Slope
Tree and shrub growth Year round Settlement After heavy rains Crest Tree and shrub growth Year round Seepage During and after high reservoir levels Slope failure During and after high reservoir levels
Down Stream Slope
Tree and shrub growth Year round Seepage During and after high reservoir levels Down Stream
Toe Bulging indicating slope a failure
During and after high reservoir levels
Spill Way Debris Blocking Spill way or trash racks, erosion, deterioration of sills
After heavy rains and periodically through the rain season.
Erosion After heavy rains and periodically through the rain season
Burrows and termite mounds Year round Cracks Year round Damaged fencing Year round
The whole dam wall
Animal grazing Year round Low level outlet
Piping During and after high reservoir levels
Dam surroundings
Erosion, siltation After heavy rains and periodically through the rain season (for erosion) During low reservoir levels (siltation)
3.4 Issues Related to the Physical Condition of Small Dams in Zimbabwe.
About 600 small–to medium sized, low technology earthen embankment dams with average capacity of 100000 m3 were constructed in southern Zimbabwe where Mzingwane catchment lies, during the late 1970s through to the turn of the new millennium. (CARE Zimbabwe, 2002). Unfortunately for various technical and social reasons, a large number of small dams constructed during these years either failed to meet community water needs or developed serious structural defects. Reasons range from poor siting and design of dams, to inadequate provision of information on maintenance to communities. (CARE Zimbabwe, 2002) Consequently the financial investments made to build a large number of small to medium sized dams in the communal areas have not realized full potential benefits for communities needing water resources.

The Development of a Risk-of-Failure Evaluation Tool for Small Dams in Mzingwane Catchment.
Ngonidzashe. L Mufute Masters in IWRM June,2007
16
In analyzing this situation CARE Zimbabwe (2002) found that the most debilitating impacts on dam sustainability were due to poor or non existent community management resulting in excessive siltation .This was especially the case with regard to the unchecked use of dam reservoirs as livestock watering holes, poor agricultural practices in the catchment areas, and no local management of common property resources. Care Zimbabwe also recognized that many small dams were either under used relative to the purposes for which they were intended, or were rapidly degrading because of competitive multi-purpose uses. CARE’s study was however concentrated in Masvingo province were they are mostly active in their work on small dams. These conditions are likely to be applicable to dams in Mzingwane subcatchment as it is also in Southern Zimbabwe and experiences similar climatic, physiographical rural conditions. This is evidenced by the general poor condition of both community owned and farmer owned small dams in inzisa district according to a socio economic survey by Sithole and Senzanje (2006) 3.5.0 Dam Safety Evaluation. There are two view points to dam safety evaluation; the conventional safety oriented or standards based approach ,and the risk based approach ( Rettermeier et.al.,2001;Bowles et.al.,1997). 3.5.1 Standards Based Approach This is a safety evaluation system based on design, construction, inspection and maintenance guidelines or standards usually set by the responsible authority mandated to over see dam issues in a country or part of country (Bowles et.al., 1997). The system is based on monitoring, surveillance, inspections and maintenance programmes. These are carried out on a particular dam according to the laid down standards or guidelines. This is done so as to keep the dam in a condition that is prescribed by, or to check whether the dam is performing according to the guidelines or standards. This ensures that the dam remains safe from failing. The standards or design-based approach assumes that there is no risk of failure associated with a dam (Rettermeier et.al., 2001).This is based on the assumption that dams are built to high design criteria. Thus the approach does not attempt to rank the dams involved according to the risk of failure. Besides inspections, monitoring and surveillance, the safety evaluation can also be carried out through monitoring, taking measurements or readings from instrumentation installed on the dam. An example of the use of instrumentation is the monitoring of seepage levels downstream of a dam wall in relation to design specifications (FEMA, 1987). The observations from inspections and instrumentation are then assessed or evaluated in comparison to standards or guidelines specifications. Standards or design guidelines also specify the type of maintenance activities that need to be carried out on a dam. Examples of maintenance activities include making sure that no trees are growing and termite mounds or animal burrows are destroyed on the embankments. A

The Development of a Risk-of-Failure Evaluation Tool for Small Dams in Mzingwane Catchment.
Ngonidzashe. L Mufute Masters in IWRM June,2007
17
conclusion is then made based on the assessments, on whether the dam is safe or not. Recommendations on what ever needs to be done are then given. 3.5.2 The Risk Based Approaches. The term “Risk Based Approach” refers to the approach to design and evaluation of dams in which an acceptable safety condition is defined using information provided from a risk assessment and other decision inputs (Bowles et. al., 1997).Thus the risk based approach takes a risk of failure into account. Therefore the residual risk has to be determined, evaluated and managed even if failure seams unlikely (Rettermeier et.al., 2001). Risk assessment is a systematic process where experienced dam engineering professionals provide decision makers with estimates of the risks and associated uncertainties of system responses, outcomes, and consequences (Bowles,1989).These words are explained in section 3.5.3. Risk based approaches focus on predicting dam performance and the confidence (or uncertainty) associated with these predictions. If properly conducted, risk assessments can provide valuable information that may not otherwise be available from the standards based approaches, which are conventional. It provides a means for quantifying the uncertainties that exist in defining worst-case event scenarios such as the Probable Maximum Flood (PMF). Quantitative examples of this information include: estimated probabilities of dam failure, the consequences of failure, and estimates of risk reduction for various structural and non-structural rehabilitation alternatives (Bowles et. al, 1997). In addition, the process of conducting a risk assessment can provide qualitative benefits such as insights into the relative importance of various failure modes and loading types and ranges. A failure mode is a series of processes that lead to dam failure, where as loading types refers to the conditions under which a dam is operating. Therefore the systematic risk assessment process can be useful as a quality assurance tool for identifying risk reduction options in the design of rehabilitation measures, project operation, ranking and prioritization of risks or emergency action planning (Bowles, 1989). 3.5.3 The General Procedure of the Risk Based Approach Below is the description of the general approach that has been used in the development of most of the Risk based models that are currently used in different countries. Risk model development commences with the identification of a sequence of events, beginning with events that can initiate dam failure and ending with the consequences of failure (Bowles, 1989).
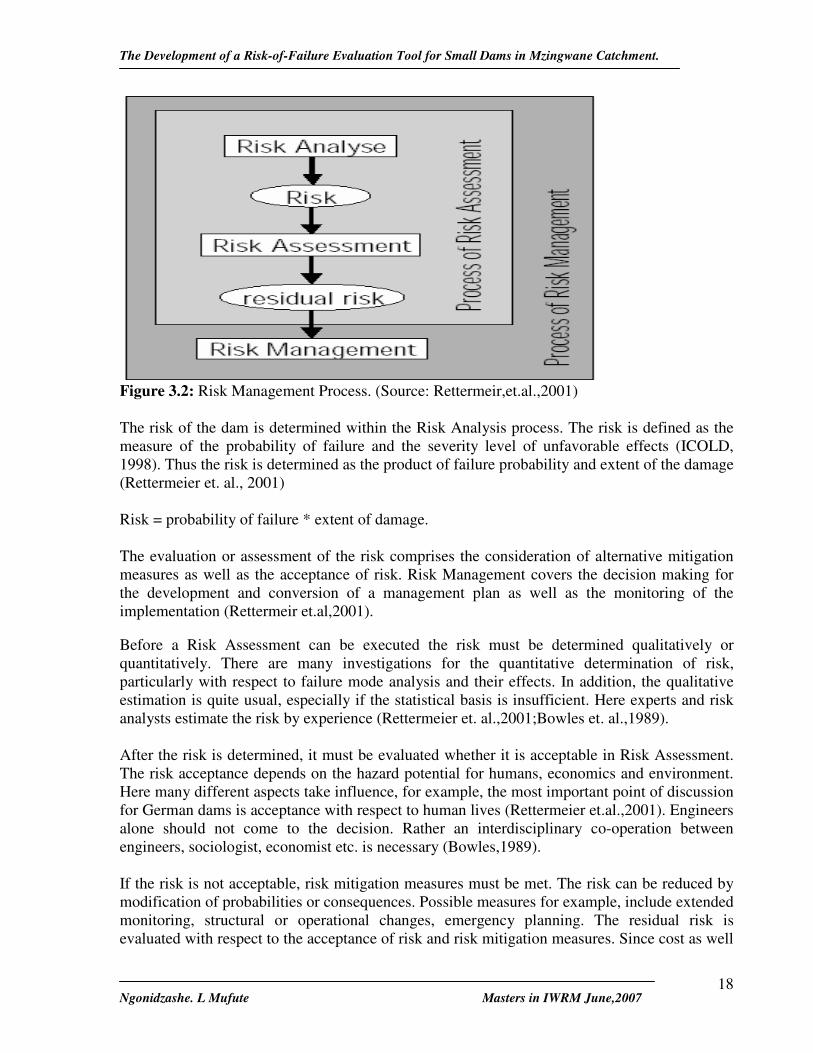
The process of Risk Management can be divided into three stand alone processes; Risk Analysis, Risk Assessment and Risk Management. The flow chart figure 3.2, gives an overview of the fundamental terms and represents both the relationship of the individual steps (Risk Analysis, Risk Assessment, Risk Management) and their integration into the entire process of Risk Management.
The Development of a Risk-of-Failure Evaluation Tool for Small Dams in Mzingwane Catchment.
Ngonidzashe. L Mufute Masters in IWRM June,2007
18
Figure 3.2: Risk Management Process. (Source: Rettermeir,et.al.,2001) The risk of the dam is determined within the Risk Analysis process. The risk is defined as the measure of the probability of failure and the severity level of unfavorable effects (ICOLD, 1998). Thus the risk is determined as the product of failure probability and extent of the damage (Rettermeier et. al., 2001) Risk = probability of failure * extent of damage. The evaluation or assessment of the risk comprises the consideration of alternative mitigation measures as well as the acceptance of risk. Risk Management covers the decision making for the development and conversion of a management plan as well as the monitoring of the implementation (Rettermeir et.al,2001). Before a Risk Assessment can be executed the risk must be determined qualitatively or quantitatively. There are many investigations for the quantitative determination of risk, particularly with respect to failure mode analysis and their effects. In addition, the qualitative estimation is quite usual, especially if the statistical basis is insufficient. Here experts and risk analysts estimate the risk by experience (Rettermeier et. al.,2001;Bowles et. al.,1989). After the risk is determined, it must be evaluated whether it is acceptable in Risk Assessment. The risk acceptance depends on the hazard potential for humans, economics and environment. Here many different aspects take influence, for example, the most important point of discussion for German dams is acceptance with respect to human lives (Rettermeier et.al.,2001). Engineers alone should not come to the decision. Rather an interdisciplinary co-operation between engineers, sociologist, economist etc. is necessary (Bowles,1989). If the risk is not acceptable, risk mitigation measures must be met. The risk can be reduced by modification of probabilities or consequences. Possible measures for example, include extended monitoring, structural or operational changes, emergency planning. The residual risk is evaluated with respect to the acceptance of risk and risk mitigation measures. Since cost as well
The Development of a Risk-of-Failure Evaluation Tool for Small Dams in Mzingwane Catchment.
Ngonidzashe. L Mufute Masters in IWRM June,2007
19
as human demands need to be considered the risk evaluation should not only comprise cost-benefit analysis but also take non economic values into account (Rettermeier et.al.,2001).
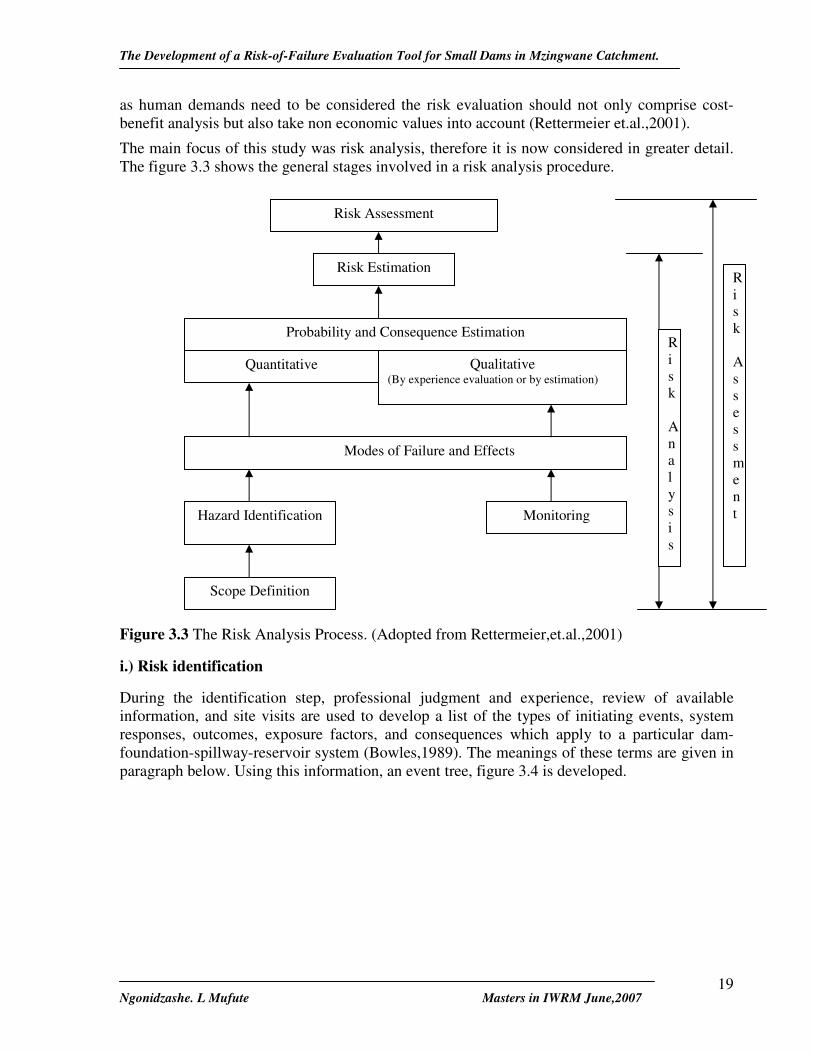
The main focus of this study was risk analysis, therefore it is now considered in greater detail. The figure 3.3 shows the general stages involved in a risk analysis procedure.
Figure 3.3 The Risk Analysis Process. (Adopted from Rettermeier,et.al.,2001)
i.) Risk identification
During the identification step, professional judgment and experience, review of available information, and site visits are used to develop a list of the types of initiating events, system responses, outcomes, exposure factors, and consequences which apply to a particular dam-foundation-spillway-reservoir system (Bowles,1989). The meanings of these terms are given in paragraph below. Using this information, an event tree, figure 3.4 is developed.
Risk Assessment
Probability and Consequence Estimation
Hazard Identification Monitoring
Qualitative (By experience evaluation or by estimation)
Quantitative
Risk Estimation
Modes of Failure and Effects
Scope Definition
Risk Analysis
Risk Assessment
The Development of a Risk-of-Failure Evaluation Tool for Small Dams in Mzingwane Catchment.
Ngonidzashe. L Mufute Masters in IWRM June,2007
20
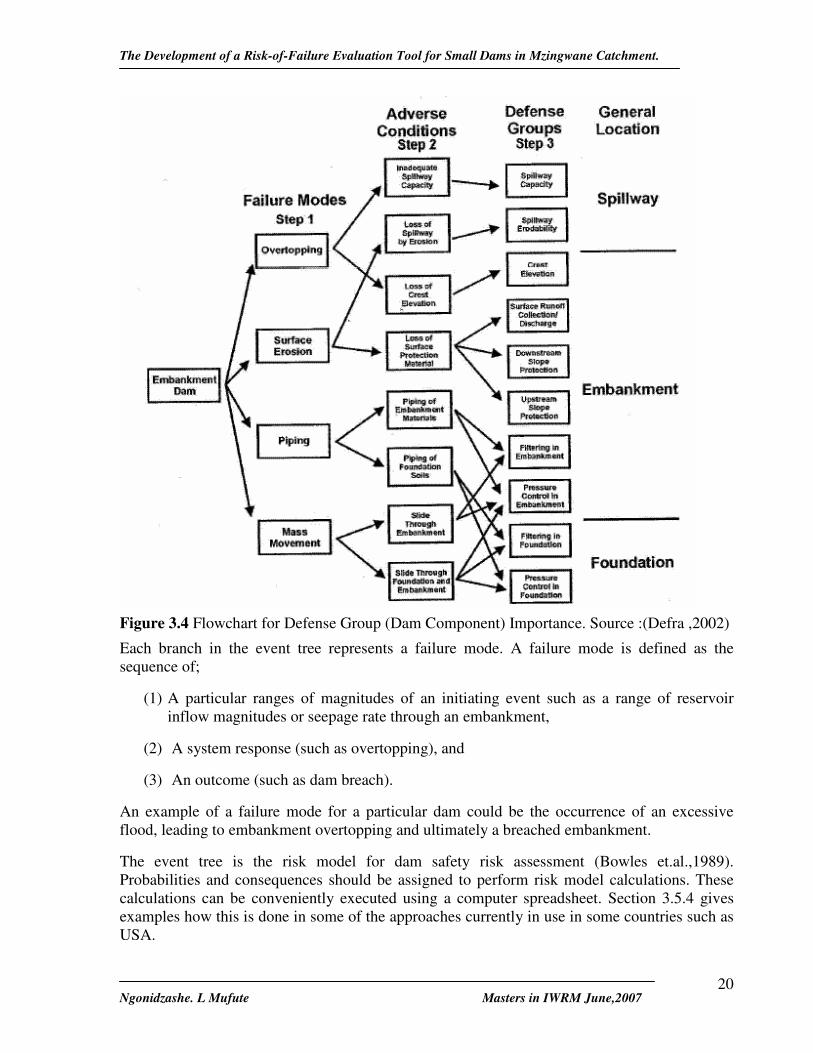
Figure 3.4 Flowchart for Defense Group (Dam Component) Importance. Source :(Defra ,2002)
Each branch in the event tree represents a failure mode. A failure mode is defined as the sequence of;
(1) A particular ranges of magnitudes of an initiating event such as a range of reservoir inflow magnitudes or seepage rate through an embankment,
(2) A system response (such as overtopping), and
(3) An outcome (such as dam breach).
An example of a failure mode for a particular dam could be the occurrence of an excessive flood, leading to embankment overtopping and ultimately a breached embankment.
The event tree is the risk model for dam safety risk assessment (Bowles et.al.,1989). Probabilities and consequences should be assigned to perform risk model calculations. These calculations can be conveniently executed using a computer spreadsheet. Section 3.5.4 gives examples how this is done in some of the approaches currently in use in some countries such as USA.

The Development of a Risk-of-Failure Evaluation Tool for Small Dams in Mzingwane Catchment.
Ngonidzashe. L Mufute Masters in IWRM June,2007
21
Initiating events can be classified as external or internal. External events include earthquakes, floods, and upstream dam failure. Internal events include chemical/ physical changes in soil or concrete properties or latent construction defects (Rettermeier et. al.;Bowles,1989). At low levels these events would not normally lead to dam failure. However, at high inflow rates a rapid rise in pool level could lead to overtopping for example.
Consequences of dam failure are classified as life loss and economic losses, which include property damage, cost of dislocations, and loss of project benefits. Environmental and social consequences of dam failure also can be considered. (Rettermeier et. al., 2001;Bowles,1989)
By performing a preliminary risk assessment, the relative importance of various factors can be assessed. For example the importance of hydrologic loading versus seismic loading, gate failure versus toe erosion can be assessed. This information can be used to make sure that relatively minor risk contributors are not given a disproportionate or unjustifiable part of the dam safety evaluation effort.
ii.) Risk Estimation.
Involves assigning probabilities to each branch in the event-tree model (Figure 3.4) and assessing the consequences of dam failure for each failure mode.
The product of the second step is an estimate of the probability of failure and life loss or economic consequences that would be associated with each failure mode, or combination of failure modes, for the existing dam. If these risks are unacceptable, the assessment proceeds to the process called risk mitigation or risk aversion, which is a risk assessment stage.
3.5.4 Risk Based Approaches from Different Countries. Several risk based approaches are used in many countries in the world. They are focused towards prevention of life, economic loses and infrastructural damage in the area downstream of dams. So hazard classification of dams was an important factor of the approaches. i.) ANCOLD, Australia The Australian National Committee on Large Dams (ANCOLD) first published its “Guidelines to Risk Assessment” in 1994. This publication and other relevant ANCOLD guidelines are summarized in Table A.9 in appendix 5.Some of the main points relevant to these guidelines may be summarized as: a) There are seven hazard classes, obtained from a matrix of five ranges of population at risk and four classes of damage and loss. b) The return period of the design flood is obtained from a risk study. c) In regard to probability of adverse events, at this stage there is no comprehensive methodology for assessing the probability of failure for a dam on the basis of visual observations of a dam’s condition (Defra, 2002). ii.) Portugal
The Development of a Risk-of-Failure Evaluation Tool for Small Dams in Mzingwane Catchment.
Ngonidzashe. L Mufute Masters in IWRM June,2007
22
This Portuguese Risk Index Evaluation was an early attempt to form an integrated system for assessing risks of dam failure (Defra, 2002). The assessment table A.10 in appendix 5 summarises the risk evaluation procedure which includes calculating the global risk index, although it is unclear how this index related to subsequent works. The main points are (a) 11 aspects of the dam are considered, grouped under the external dam condition and the impact on failure (b) There are six possible levels of condition/ risk for each aspect, some being quantitative (For example the. probability of exceedance of a flood) whilst others are qualitative. iii.) Federal Emergency Management Agency (FEMA) The Agency came up with a system for preliminary safety evaluation of existing dams in the United States (Defra ,2002). As well as analytical techniques, it included tables for; - Assigning a condition score to four elements of embankment dam condition and three elements of concrete dam condition (example in Table A.11) in appendix 5 - The probability of failure is allocated, depending on the ‘evaluation scores’. The basis of these probabilities, could not be established. iv.) Bureau of Reclamation (BOR) The BOR manages 362 dams in the 17 western states of the US. The BOR safety programme was officially implemented in 1978. A technical priority system was developed in 1986 to rank dams. The main points are: a) Risk is defined as (probability of load) x (probability of adverse response given load) x (consequence given adverse response) b) Loads are considered under four categories namely, static, hydrologic, seismic, operation and maintenance, 30% of the marks being assigned to each of the first three and 10% to the last category c) It appears to be a qualitative ranking system, rather than relating to absolute probabilities v.) Army Corps of Engineers (USACE) The UASCE is responsible for federal dams in the eastern USA. A condition rating procedure was issued in 1999, which had the objective of “developing a rating procedure that describes the current condition of embankment dams in a uniform manner” (Derfra ,2002). It also produced a procedure for the prioritisation of maintenance and repair activities on embankment dams. Although it includes a system for ranking the relative importance of different threats, this is based on expert judgment rather than any probabilistic based system. Some of the key points relevant to this approach are: (a) The development of the condition index (CI) (description of factor) methodology included a series of week long meetings with a panel of dam safety experts, who were asked a series of structured questions that related their technical experience to various aspects of embankment dam maintenance and repair. During each meeting embankment dams were inspected in order to validate the procedures that had been developed.
The Development of a Risk-of-Failure Evaluation Tool for Small Dams in Mzingwane Catchment.
Ngonidzashe. L Mufute Masters in IWRM June,2007
23
(b) The hazard potential was put into one of three classes; namely loss limited to owner, no loss of life but some damage to third parties and loss of one or more lives (c) A Condition Index (CI) is obtained, between zero and 100 based on a rating procedure that describes the current condition of a structure in a uniform manner. CI’s are intended to be relatively objective measurements based on the series of questions used as part of the expert judgment. (e) A flow chart for the defense (Dam component) group importance is given in Figure 3.4 includes; - Four failure modes (overtopping, surface erosion, piping, mass movement) - Eight adverse conditions (cause or location of failure mode) - Ten defense groups (an element that can be assessed and governs the cause of failure) (f) Tables are given for each component, describing how the condition of that component is quantified. (g) These ten components are then ranked in terms of relative condition. The priority ranking within the 10 defense groups is formed as a product of the following three numbers representing: - Dam importance factor (consequence of failure) - Importance of the defense group in relation to other defense groups on a
Given dam (from expert elicitation and does not change often) - Defense group condition factor (100-CI)/100 (determined annually based on site inspection) (h) An overall condition index is then calculated by summing the output of above. vi.) Washington State’s Risk Based Approach. It is a Risk Based Approach in a standard based framework. Under this approach probability methods, risk concepts, and elements of risk assessment are combined with decision making in setting performance standards that provide acceptable minimum levels of protection (Johnson, 2000). This approach is discussed at length in appendix 5. 3.5.5 Trend Towards Risk Based Approaches Risk assessment is still a relatively new approach in the field of dam safety evaluation and decision-making. Interest in the potential for applying risk-based approaches to dam safety decision-making has accelerated in the last few decades (Bowles, 1989). An increasing number of organizations have begun to routinely use risk-based approaches in dam safety evaluation. These now include the U.S. Bureau of Reclamation, the Government of South Africa, the Government of the Netherlands, various Australian dam owners and regulators (Bowles,1989). Section 5.5.4 summarises examples of risk based approaches from various countries. Some factors that have lead to the increasing use of risk-based approaches include the following: 1. The absence of functional features, which are now considered to be the state-of-the-art in dam design, but which were not incorporated in many existing dams (such as downstream filters in embankments to dissipate pore pressure in the event of significant seepage.
The Development of a Risk-of-Failure Evaluation Tool for Small Dams in Mzingwane Catchment.
Ngonidzashe. L Mufute Masters in IWRM June,2007
24
2. The greater magnitude of extreme flood events i.e. PMF, which are prescribed using today’s standards based approaches that currently have limitations in predicting such events. 3. The high cost of remedial works to address dam deficiencies such as inadequate spillways, and eroded dam walls. 3.5.6 Comparison Between Standards and Risk Based Approaches. We use the term, “standards based approach”, to refer to the approach to design and evaluation of dams in which a satisfactory safety condition is defined by either:
a) Compliance with prescribed performance measures or loading conditions; or b) b) Use of the current state-of-the-art (or practice) meaning the generally accepted
present-day approach to dam design, evaluation, and construction (Bowles et.al.,1997). The term “risk based approach” is used to refer to the approach to design and evaluation of dams in which an acceptable safety condition is defined using information provided from a risk assessment and other decision inputs. Risk based approaches focus on predicting dam performance and the confidence (or uncertainty) associated with these predictions. In contrast, the sole use of traditional approaches emphasizes factors of safety and compliance with standards, and do not provide defined clear indications of the level of confidence that is being attained in achieving satisfactory performance. However most of the risk-based approaches in use in various countries (section 5.5.4) incorporate testing, monitoring, and analysis, which are part of the design based approaches. The degree of confidence in performance prediction in risk-based approaches is often be improved by testing, monitoring, and analysis. 3.5.7 Components of a Comprehensive Risk Management Program A comprehensive dam safety risk management program should include many other components in addition to risk assessment for evaluating existing dam safety and alternative remedial actions. These other components are: 1. Provision of an appropriately designed, well maintained, and regularly exercised emergency warning system and emergency action plan. 2. A comprehensive monitoring and surveillance program with clear assignment of responsibilities for timely review and follow-up on collected data and reports. 3. A well trained operations and maintenance staff. 4. A well planned, adequately funded, and properly executed maintenance program. 5. Routine inspections and periodic in-depth inspections and comprehensive dam safety reviews and updates of any previously conducted risk assessments that are being relied upon for dam safety decisions. 6. An effective public consultation program. All of these are important interrelated components in a comprehensive risk management program for any high hazard dam. 3.5.8 The Zimbabwean Scenario

The Development of a Risk-of-Failure Evaluation Tool for Small Dams in Mzingwane Catchment.
Ngonidzashe. L Mufute Masters in IWRM June,2007
25
Apart from the water act, which lays down various rules for small dam construction in the legal and administrative sphere, there are no regulations or laws governing dam design in Zimbabwe (Kabell, 1987). This was also highlighted by officials from ZINWA during a an informal interview. At DDF, the institution responsible for small community dams, standards and design parameters are left entirely to the discretion and judgment of the engineer. However various principles and practices have evolved with experience over the years. There are however several guidelines that have been produced in the country on the design, construction and maintenance of small, medium sized and large dams. Examples are;
- A Guide to Design and Construction of Medium Sized Earth Dams in Zimbabwe (Shaw, 1977),
- Guidelines to the Design of Dams ( Kabell, 1987), - Design and Construction of Small Earth Dams (Muyambo, 2000) - The Zimbabwe Water Act of 1998 (Government of Zimbabwe, 1998)
However ZINWA, the organisation mandated to for the designing, construction and maintenance of medium sized and large dams in Zimbabwe has also produced its own design , construction and maintenance guidelines. Risk based approaches are not being used in Zimbabwe according to outcomes of interviews held with ZINWA and DDF personnel. 3.5.9 The Need to develop a suitable risk of failure evaluation tool for small dams in
Mzingwane catchment. Although there are risk of failure evaluation tools from other countries as described in section 3.5.4. The tools are not suitable for use in the area of study, some of the reasons for this are;
- The main focus of risk of failure evaluation approaches described in section……is evaluating the risk of loss of life in the downstream area of the dam. According to the hazard rating of dams (ASWCC,2002;Dam safety branch,2000; FEMA,1987) The small dams in Zimbabwe have a low hazard classification as they are mostly located were there are few properties and homes that are located immediately downstream of the dams.
- They are based on quantitative data from regular monitoring and surveillance which is not possible on the small dams in the study area which do not have monitoring equipment. Also, regular inspection, monitoring and maintenance are not done due to lack of resources. In addition, according to assessments done on the ground during the course of this study, small dams in the area of study are not equipped with any monitoring devices such as piezometers for monitoring seepage.
- The approaches described in section 3.5.4 are also based on national standards .They are also no standards in Zimbabwe for dam design as noted in section 3.5.8
- There is need to identify failure causing deficiencies that are relevant to dams in Zimbabwe. Hence risk of failure approach based on these needs to be developed.

The Development of a Risk-of-Failure Evaluation Tool for Small Dams in Mzingwane Catchment.
Ngonidzashe. L Mufute Masters in IWRM June,2007
26
CHAPTER 4. METHODOLOGY This section is divided into 2 main sections, the first section is for the methodology for the assessment of the physical condition of small dams (sections 4.1 to 4.5) The second is for the development of the risk evaluation tool (section 4.6) 4.1 Reviewing of Records and Literature on Small Dams. Reviewing of material on small dams in the area of study was done. Plans, specifications, construction history, records of operation, repairs, major floods and maintenance that could be obtained or located were reviewed. The material was obtained from DDF but was not comprehensive. This was done so as to gain an understanding of how small dams in the area of study are designed constructed and maintained and what conditions the dams have been subjected to. Design, construction and maintenance guidelines for small dams in Zimbabwe and other counties were also reviewed. 4.2 Interviews o Interviews with community members and individual farmers who own small dams were
done to get some information on the history (construction, management and maintenance etc) of the small dams in the Sub catchment.
o Key informants from institutions such as DDF, AREX and NGOs involved in small dam construction, management and maintenance were also interviewed. This was done so as to understand their involvement in the work and how they work with each other.
4.3 Field Measurements, Inspections, and Assessments Inspections, measurements, monitoring and assessments were done on dam embankments, spillways, outlet and inlet works, visible areas of foundations, abutments and micro-catchment. In this study, micro catchment was defined as the environs of a small dam. This is taken as an area within a radius of 200m from the shores of the dam at full supply level. According to the findings of the socio economic surveys by Sithole and Senzanje (2006), 200m was considered by community members as the longest distance they are willing to travel to the reservoir to fetch water and carry it manually for gardens or other activities such as brick making that take place around small reservoirs. So this guided the definition of the micro-catchment Rapid and more detailed physical condition assessments were carried out. Rapid assessments were more of qualitative (visual) and more to do with maintenance and inspection issues where as detailed assessments were more of quantitative (measurements) and more to do with design issues. The assessments were done in accordance with design, construction and maintenances guidelines from Zimbabwe and other countries (WEDC,2006;RELMA,2005; ASWCC, 2002; CARE Zimbabwe,2002;NZSOLD, 1997;FEMA, 1987; Kabell,1987;Shaw,1977;US Government, 1977). Rapid assessments were done on 44 small dams and detailed assessments were done on 9 of the 44 dams. The assessments were done so as;
- To identify if the small dams are being managed according to the design, construction and maintenance guidelines mentioned above
The Development of a Risk-of-Failure Evaluation Tool for Small Dams in Mzingwane Catchment.
Ngonidzashe. L Mufute Masters in IWRM June,2007
27
- To assess the current physical condition and identify maintenance deficiencies on the dams and were possible the causes of this,
- To get as much information as possible on the type of failure causing factors such as (seepage and erosion) that are relevant to the small dams in the area of study. This information was used in the development and calibration of the risk of failure evaluation tool.
4.3.1 Rapid Assessment of the Physical Condition of Small Dams
The activities as described below were done by physically walking and inspecting the dam wall starting from the crest on one end, walking to the other end inspecting the crest and the up stream slope. The spillway was then inspected after which the training-walls and the downstream slope were also inspected. The reservoir sides and throwback area were assessed by walking through and inspecting. In this process the following was done;
o Inspecting for seepage: Areas inspected included the down stream slope, downstream toe, abutments, areas near and on spillways and around and adjacent to outlets. Wet spots, or muddy areas, growth of greener grass than in surrounding areas, which can indicate the presence of concentrated seepage, were looked out for. Checking for the occurrence of ponding just at the toe of the embankment was also done.
o Checking for cracking.( no threatening cracks were found) If cracking had been observed, the following was to be done; - Noting the type i.e. desiccation, transverse or longitudinal cracking - Photographing and/or recording the location, depth, length, and width (using a tape measure) of the cracks.
o Checking for depressions: The following was done; - Photographing and/or recording the location, size, and depth of the depression.
o Checking for sinkholes: Where a sinkhole was observed the following was done; The location was noted and recorded.
o Checking for stability This was done by checking for and noting the presence of slides, scarping, toe bulging
and arc – shaped cracks on upstream, crest and downstream slopes of the embankment. o Checking for erosion
- Rills, gullies, ruts, or other signs of surface runoff erosion on the upstream and downstream shoulders, spillways and abutments were looked for.
- Unique problems, such as livestock or recreational vehicles that may be contributing to erosion were also checked for. Were surface runoff erosion was observed the following was done;
- Recording findings and /or photographing the area. - Determining the extent or severity of the damage
o Checking for inappropriate vegetative growth: -Trees and shrubs were looked for on all areas of the dam. Findings were recorded, including the size and extent of the inappropriate vegetation.
o Checking for debris; Where debris (due to sliding on embankments or blocking spillway) was seen in and around the dam wall; photographing and or /recording of observations was done.
The Development of a Risk-of-Failure Evaluation Tool for Small Dams in Mzingwane Catchment.
Ngonidzashe. L Mufute Masters in IWRM June,2007
28
o Checking for presence of burrowing animals and termite mounds; Where they were evident, photographs of the area and/or records of size and number were taken.
o Checking for and recording any signs of deterioration, blockages and piping on inlets, outlets and drains was also done.
o Checking for the presence of a spillway/s on the dams was done. o Checking whether the dams have toe drains to prevent seepage from weakening the dam
embankment was done. o Checking if the earth dams have a rip- rap layer especially on the upstream slope was
also done. o Noting soil type used for construction of earthen embankments by visual assessments.
o Assessing the micro catchment condition (soils, erosion, vegetation condition and human activity) was also done. This was done by moving around the area within 200m of the dam measured from the estimated full supply level, visually assessing the condition of the soils, vegetation condition and human activity within this area. Soil types (general descriptions such as sandy, loam, gravely or clay) Vegetation cover and severity of erosion were also estimated according to descriptions given in Appendix 4.
4.3.2 Detailed Assessment of the Physical Condition of Small Dams
The following was done; o Measurements to assess the side slopes and crest of the embankment (length, width,
steepness of slopes and slope height) were carried out using tap measures and survey equipment).
o Measurements to assess for freeboard loss/ adequacy of freeboard. - Measuring the vertical height difference between crest of the dam and the lowest point on the spillway using surveying equipment (Dumpy level). - Estimating spillway width using a tape measure. - Determining spillway slopes (both upstream and downstream where possible) using a dumpy level. -determining catchment area sizes by marking of catchment areas of the dams on the 1: 50000 topographic maps of the study area and a plani meter was then used to determine the catchment area sizes1. o Collecting soil samples from downstream slope of the embankment. This was done
through shallow auguring to a depth of 10cm. At least one sample per dam was collected and soil types were then visually and technically identified. Particle size analysis (Hydrometer method and sieve analysis) and soil consistency tests (Determination of plastic and liquid limits) were done (USA Government, 1977; Smith, 1981; Soil Science and Agricultural Engineering (SSAE), University of Zimbabwe (UZ) student soil physics practical handout). The soil analysis was done in the Soil Science and Agricultural Engineering soil physics laboratory, at the University of Zimbabwe.
1 On small dams where the catchment area was too small to be determined from the 1:50000 topographical maps, it was estimated in the field by estimating the area visually.
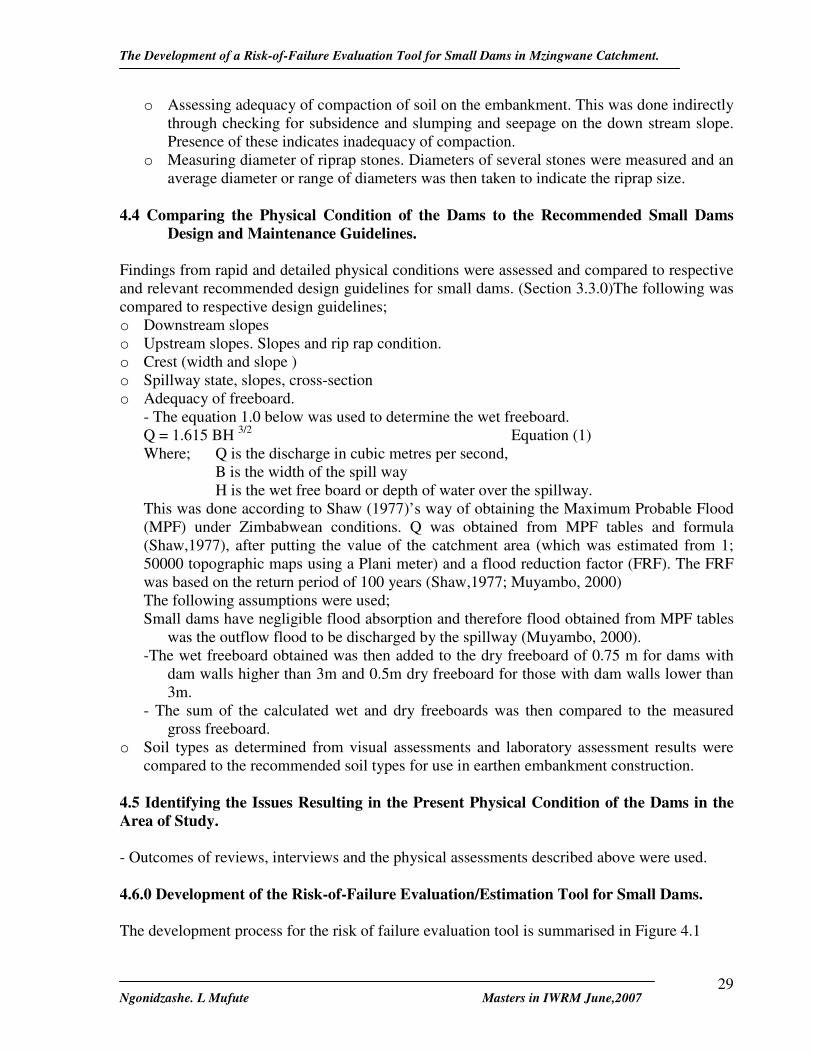
The Development of a Risk-of-Failure Evaluation Tool for Small Dams in Mzingwane Catchment.
Ngonidzashe. L Mufute Masters in IWRM June,2007
29
o Assessing adequacy of compaction of soil on the embankment. This was done indirectly through checking for subsidence and slumping and seepage on the down stream slope. Presence of these indicates inadequacy of compaction.
o Measuring diameter of riprap stones. Diameters of several stones were measured and an average diameter or range of diameters was then taken to indicate the riprap size.
4.4 Comparing the Physical Condition of the Dams to the Recommended Small Dams
Design and Maintenance Guidelines. Findings from rapid and detailed physical conditions were assessed and compared to respective and relevant recommended design guidelines for small dams. (Section 3.3.0)The following was compared to respective design guidelines; o Downstream slopes o Upstream slopes. Slopes and rip rap condition. o Crest (width and slope ) o Spillway state, slopes, cross-section o Adequacy of freeboard.
- The equation 1.0 below was used to determine the wet freeboard. Q = 1.615 BH 3/2 Equation (1) Where; Q is the discharge in cubic metres per second, B is the width of the spill way H is the wet free board or depth of water over the spillway. This was done according to Shaw (1977)’s way of obtaining the Maximum Probable Flood (MPF) under Zimbabwean conditions. Q was obtained from MPF tables and formula (Shaw,1977), after putting the value of the catchment area (which was estimated from 1; 50000 topographic maps using a Plani meter) and a flood reduction factor (FRF). The FRF was based on the return period of 100 years (Shaw,1977; Muyambo, 2000) The following assumptions were used; Small dams have negligible flood absorption and therefore flood obtained from MPF tables
was the outflow flood to be discharged by the spillway (Muyambo, 2000). -The wet freeboard obtained was then added to the dry freeboard of 0.75 m for dams with
dam walls higher than 3m and 0.5m dry freeboard for those with dam walls lower than 3m.
- The sum of the calculated wet and dry freeboards was then compared to the measured gross freeboard.
o Soil types as determined from visual assessments and laboratory assessment results were compared to the recommended soil types for use in earthen embankment construction.
4.5 Identifying the Issues Resulting in the Present Physical Condition of the Dams in the Area of Study. - Outcomes of reviews, interviews and the physical assessments described above were used.
4.6.0 Development of the Risk-of-Failure Evaluation/Estimation Tool for Small Dams. The development process for the risk of failure evaluation tool is summarised in Figure 4.1
The Development of a Risk-of-Failure Evaluation Tool for Small Dams in Mzingwane Catchment.
Ngonidzashe. L Mufute Masters in IWRM June,2007
30
Figure 4.1. The Development Process for the Risk of Failure Evaluation Tool. The detailed process for the development of the tool is now given below. 4.6.1 Assessments of Small Dams in the Study Area This was done during the rapid and detailed assessments. As the assessments were being done, management conditions, and the factors that were used in the development of the tool were identified and noted. Information looked for included; - Responsibility for management of the assessed dams, - design, construction and maintenance records for small dams, - inspections ,surveillance and monitoring on small dams, - Probabilistic precipitation data showing precipitation magnitude-frequency
relationships which was meant to be used to check adequacy of spillways, 4.6.2 Identification of Factors/Criteria Used to Assess Risk. The factors were identified and listed according to the guidelines for the design and construction of small dams (RELMA, 2005; Muyambo, 2000; NZSOLD, 1997; Shaw, 1977;USA Government, 1977) and guidelines for the inspection and maintenance of small dams. (WEDC, 2006;RELMA, 2005; ASWCC,2002; NZSOLD,1997;FEMA,1987). The selection of the factors to be used in the tool was also guided by the rapid and detailed assessments that were carried out in the area of study. These assessments helped to identify which factors of the ones given in guidelines are relevant to the situation on the ground in the area of study. The factors such as seepage, erosion and piping used in the development of the tool were identified and listed in the first column of table A.6 4.6.3 The Development of a Method for Standardizing the Description of the Risk Factors. This process aimed to standardize the description of the physical condition of dams or the seriousness of the dam deficiencies or risk factors. For example what is meant by ‘sparse’ and ‘extensive’, in describing tree growth and erosion respectively on an embankment was defined.
Assessment of the small dams in the study area
Standardisation of the description of the risk factors
Identification of risk factors
Assigning weights to the factors
Ranking of the influence of the risk factors on causing dam failure
The development of the scoring system
Description of the overall risk of failure of a dam
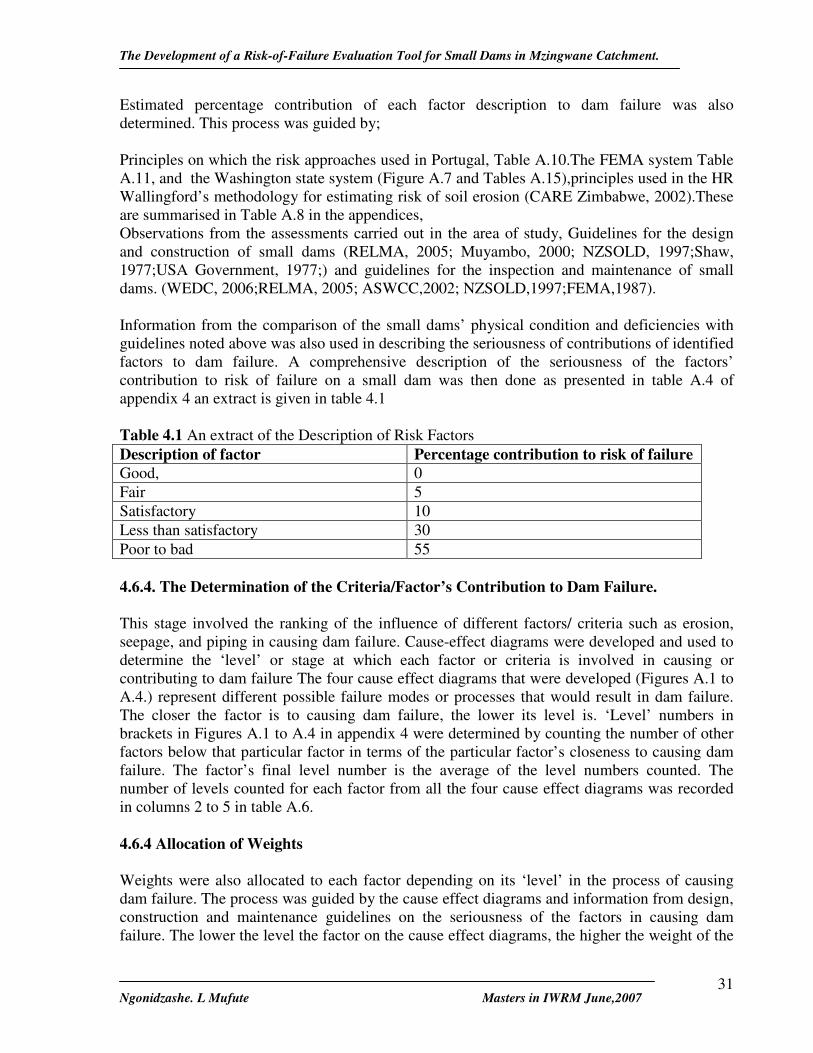
The Development of a Risk-of-Failure Evaluation Tool for Small Dams in Mzingwane Catchment.
Ngonidzashe. L Mufute Masters in IWRM June,2007
31
Estimated percentage contribution of each factor description to dam failure was also determined. This process was guided by; Principles on which the risk approaches used in Portugal, Table A.10.The FEMA system Table A.11, and the Washington state system (Figure A.7 and Tables A.15),principles used in the HR Wallingford’s methodology for estimating risk of soil erosion (CARE Zimbabwe, 2002).These are summarised in Table A.8 in the appendices, Observations from the assessments carried out in the area of study, Guidelines for the design and construction of small dams (RELMA, 2005; Muyambo, 2000; NZSOLD, 1997;Shaw, 1977;USA Government, 1977;) and guidelines for the inspection and maintenance of small dams. (WEDC, 2006;RELMA, 2005; ASWCC,2002; NZSOLD,1997;FEMA,1987).
Information from the comparison of the small dams’ physical condition and deficiencies with guidelines noted above was also used in describing the seriousness of contributions of identified factors to dam failure. A comprehensive description of the seriousness of the factors’ contribution to risk of failure on a small dam was then done as presented in table A.4 of appendix 4 an extract is given in table 4.1 Table 4.1 An extract of the Description of Risk Factors Description of factor Percentage contribution to risk of failure Good, 0 Fair 5 Satisfactory 10 Less than satisfactory 30 Poor to bad 55 4.6.4. The Determination of the Criteria/Factor’s Contribution to Dam Failure. This stage involved the ranking of the influence of different factors/ criteria such as erosion, seepage, and piping in causing dam failure. Cause-effect diagrams were developed and used to determine the ‘level’ or stage at which each factor or criteria is involved in causing or contributing to dam failure The four cause effect diagrams that were developed (Figures A.1 to A.4.) represent different possible failure modes or processes that would result in dam failure. The closer the factor is to causing dam failure, the lower its level is. ‘Level’ numbers in brackets in Figures A.1 to A.4 in appendix 4 were determined by counting the number of other factors below that particular factor in terms of the particular factor’s closeness to causing dam failure. The factor’s final level number is the average of the level numbers counted. The number of levels counted for each factor from all the four cause effect diagrams was recorded in columns 2 to 5 in table A.6. 4.6.4 Allocation of Weights Weights were also allocated to each factor depending on its ‘level’ in the process of causing dam failure. The process was guided by the cause effect diagrams and information from design, construction and maintenance guidelines on the seriousness of the factors in causing dam failure. The lower the level the factor on the cause effect diagrams, the higher the weight of the
The Development of a Risk-of-Failure Evaluation Tool for Small Dams in Mzingwane Catchment.
Ngonidzashe. L Mufute Masters in IWRM June,2007
32
factor. Altogether 6 levels or stages in were determined from the cause effect diagrams. For factors at level 6, which contribute the least to dam failure were allocated a weighting index of 1. Those factors at level 1, the most serious contributors to dam failure were allocated a weighting index of 6. The weighting indices of 1 to 6 were chosen to simplify the allocation of the indices to the 6 levels. The actual weight of each factor was then obtained from equation 2 Weight of factor = weighting index /6 Equation (2) The weighting index was divided by 6 so as to express the weight as fraction of unity. This means that the highest weight was 1 and the lowest was 0.17. Tables 9.7 and 9.8 show the relationship between levels, weighting indices and weights of the factors considered. 4.6.5 Applying the Tool For the purposes of applying the tool to evaluate the risk of failure of a dam, scores are allocated to each factor based on its factor description percentage and weight. The factor description percentage is allocated based on the observations from the field. The observations are described in the ‘standard’ format developed as described in section 4.6.3. Each factor’s risk of failure score is obtained as shown by equation 3. Factor risk of failure score = Factor description percentage *factor weight The factor description percentage is divided by 100 so as to convert the percentage into a fraction so the overall score is represented as a fraction The overall risk of failure score for the small dam is obtained from equation (4) The overall risk of failure score for a dam is then classified as being low, moderate, high or very high according to table 4.2. Table 4.2 Classification of the Overall a Dam’s Risk of Failure Score Overall Risk of Failure Score 0-0.05 0.05-0.1 0.1-0.15 Greater than 0.15 Description Low Moderate High Very High 4.6.6 Basis for the classification for the classification System The obtained overall risk of failure scores were compared with what was observed during assessments in the field. For example, Siwaze Dam is well managed by ZINWA and the inspection of the dam revealed that it was in good condition. This implies that its risk of failure was low. Its risk score was therefore used to guide the range for the ‘low’ classification.
Factor risk of failure score
Factor description percentage *factor weight =
100 equation …
Overall risk of failure score for small dam
� Factor risk of failure score Number of factors considered
= Equation ………. Overall risk of failure score for small dam
� Factor risk of failure score Number of factors considered
= Equation (4)
Factor risk of failure score
Factor description percentage *factor weight =
100 Equation (3)

The Development of a Risk-of-Failure Evaluation Tool for Small Dams in Mzingwane Catchment.
Ngonidzashe. L Mufute Masters in IWRM June,2007
33
Shagwe had seepage problems and its risk of failure is therefore very high according to dam safety guidelines such as FEMA, (2000). Its risk score together with that from the already breached dams Ngwabi and Chobukwa, were used to guide the definition of the ‘very high’ class of the risk score classification table. 4.7 Data Handling and Processing Data processing and handling was done using the Micro Soft Excel package.

The Development of a Risk-of-Failure Evaluation Tool for Small Dams in Mzingwane Catchment.
Ngonidzashe. L Mufute Masters in IWRM June,2007
34
CHAPTER 5 RESULTS AND DISCUSSION 5.1.0 Reviews The records of information that were obtained on the design, construction and management of small dams in the study area were not comprehensive. AREX managed to supply information containing only names of small dams in the area of study. NGOs working on small dams in the area could not supply the required information. No recorded information on the management of small dams was found from community institutions like dam committees. A small dams inventory for Insiza small dams obtained from DDF Filabusi District Offices contained information such as name, map number and grid reference location, catchment area size, mean annul runoff (MAR) and dam capacities. Most of the information however was either incomplete or had missing sections. The inventory did not contain the full list of all the communal small dams in the study area including some of the studied dams. Also, of the dams in the study area, only Avoca dam’s capacity was in the inventory. It was given as 60 000m3. A total of 50 small dams on the inventory were from the study area. This figure varied slightly from that obtained from an inventory from an AREX officer for the area. The AREX inventory indicated that the area of study had 57 small dams. The catchment areas of small dams in Insiza District as given on the DDF inventory ranged from 0.01 km2 to 134 km2. For the 9 dams on which detailed studies were carried out, the catchment areas ranged from 0.16 km2 to 16.7 km2. These catchment areas where determined as explained in section 4.3.2 and from the DDF inventory The inventory, which was last updated about 4 years ago, also contained information on the organizations, which were chairing dam committees. According to the inventory, DDF chaired 19 dams in the area of study whilst CADEC chaired 4, Christian Care chaired 2, the community members chaired no dam committees and 18 dams were indicated as having no chairing institution. The institution indicated as chairing was the responsible institution for coordinating all management issues to do with the small dam concerned. However interviews with the communities on the ground revealed that most of the dam committees are presently defunct. They and were only functional in the early years of dam operation. This was especially evident on small dams constructed by DDF. No recorded information on dam maintenance was found from NGOs, DDF and community members. No design documents for dams in the study are were found but some design drawings for small dams from other areas in Insiza district were found at DDF. These designs were found to meet design guideline recommendations for example, details of crest widths, and slopes sizes were found to meet design recommendations. This means that the dams constructed by DDF in the study area were most likely also to have been constructed following recommended design guidelines. 5.1.1 Implication of the Outcome of Reviews, Interviews and Assessments on the Development of the Risk of Failure Evaluation Tool.

The Development of a Risk-of-Failure Evaluation Tool for Small Dams in Mzingwane Catchment.
Ngonidzashe. L Mufute Masters in IWRM June,2007
35
Risk of failure approaches used in other countries such as USA and Australia are based on the availability of updated records on maintenance, inspections and surveillance on small dams. (Section 3.5.4) However no maintenance records are kept for small dams in the area of study. This implies that such approaches were not suitable for risk of failure assessments in the study area. 5.2.0 Interviews and Discussions 5.2.1 Role of DDF According to interviews held with DDF staff at head office in Harare and at Filabusi district office in Matebeleland South, DDF are the custodians of small dams in Zimbabwe. They are responsible for construction and maintenance of small communal dams. This is in agreement with findings from earlier studies such as Sithole and Senzanje (2006). When NGOs or any other institution want to construct small dams in any area, they approach DDF who will then supervise or coordinate the exercise from feasibility studies right through to hand over to the communities. It also came out in the interviews that DDF and communities are supposed to be jointly responsible for maintenance but DDF is currently not doing any maintenance work because of lack resources. Lack of resources such as funds for maintenance and rehabilitation, transport and obsolete equipment were sited as the biggest problems that DDF personnel face in doing their work in small dams. 5.2.2. Role of NGOs World Vision (WV) and CADEC were the main NGOs involved in construction and rehabilitation work on small dams in the area of study. Of the dams studied, Christian Care was involved in the construction of one dam, Chehondo in ward 9. Where as CADEC was involved in the construction or rehabilitation of at least 4 of the assessed dams, all of which were in ward 6.The NGOs indicated that they liaised with all relevant stakeholders involved in small dams sector; such as Rural District Councils (RDCs), AREX, DDF, local communities and contractors. They were facilitators in the programs. They sourced and pay contractors who constructed the dams. They also involved villagers in the construction and maintenance of small dams under food for work programs. In some cases they would pay transport and subsistence allowances for officials from government institutions they worked with. They also supplied to the communities, basic tools for construction or maintenance such as shovels, wheel burrows and picks. The NGOs handed over management of the constructed dams to the community after basic training on maintenance. Both NGOs also indicated that there is need to train the current DDF dam staff as they allege that it is mostly new and little experienced in dam issues. This they claim is compromising the availability of expert advice on issues of small dams to the communities they work with. They also claimed that because of limited equipment available to DDF for dam construction and rehabilitation, coupled with inexperienced staff, they have been forced in most cases to hire private contractors to design and construct the dams.
The Development of a Risk-of-Failure Evaluation Tool for Small Dams in Mzingwane Catchment.
Ngonidzashe. L Mufute Masters in IWRM June,2007
36
5.2.3 Role of AREX It was also found out in an interview with an AREX official for the area of study that AREX is not directly involved in the construction and management of small dams but other institutions such as NGOs work with them in activities to do with small dams. This is because AREX officials are generally well known and respected in the communities and are used as a gateway into the community. AREX also work with communities on issues such as good agricultural practices in the irrigation plots and nutrition gardens. They are also involved in the pegging and demarcation of the plots and gardens. 5.2.4 Stakeholder Collaboration Even though it was mentioned in interviews with both NGOs and DDF that these organizations collaborate in their work on small dams, the communities on the ground claimed that the NGOS are the ones who come to assist the communities in small dams maintenance and rehabilitation. They also claimed that the NGOs are doing this mostly on their own without the involvement of DDF. This shows that the level of stakeholder collaboration is limited. Improved stakeholder collaboration would go a long way in improving the level of maintenance and repair of dams on the ground, there by reducing the number of dams that fail. Reduced dam failure would result in increased security of water availability and hence more sustained livelihoods in the rural communities. 5.3 Rapid Physical Assessments A total of 44 dams were visited during the assessments. The physical condition of the dams was assessed using design and construction, inspection and maintenance guidelines as explained in the methodology section. Interviews were also carried out with community members at the same time assessments were done. The assessed dams were in Wards 4 to 9 and in Ward 12.These Wards make up the Godlhwayo area. The number of dams assessed represents 77.2% of the total number of dams that are officially recognized in the area. Five dams or 11.4% of the visited dams were in a Small Scale Commercial Farming area (ward 8), the rest are in communal areas. Of the visited dams, one is owned and managed by ZINWA (Siwaze dam), 4 of the dams are farmer owned or managed dams and the rest are community owned or managed communal dams. Three of the farmer owned dams were also used by the surrounding communities for their domestic and livestock water needs. Below is a summary of the rapid assessments results and discussion. More detailed information on results of the rapid assessment is found in Appendix 2. Seepage does not seem to be a big problem in the area of study as it was noted that 97.7% of the assessed dams had no signs of unwanted seepage on their earthen embankments. Only 4.5% of the assessed dams had leakages on the masonry sections of their dam walls. The lack of serious cracks and bulging on the embankment walls was also an indication that the small dams’ embankment walls were well compacted during construction and that the dam walls are stable. The existence of spillways (on 100% of assessed dams), riprap (on 40.9% of the
The Development of a Risk-of-Failure Evaluation Tool for Small Dams in Mzingwane Catchment.
Ngonidzashe. L Mufute Masters in IWRM June,2007
37
assessed dams), use of recommended soils for construction of embankments (on 100% of the sampled soils) and the existence of toe drains (on 84.1% of assessed dams), is an indication that design and construction guidelines were to a larger extend followed in the construction of the small dams in the area of study. The poor physical state of the dams indicated for example by the presence of erosion (on 68.2% of assessed dams), wide spread scarping (on 77.3% of the studied dams), removal of fence (on 45.5%) of the assessed dams implies a general lack of repair and maintenance of the small dams in the study area. The lack of maintenance of dams in the area of study is also supported by the lack of functional maintenance committees on at least 72% of the assessed dams, meaning that small dams repair and maintenance work in such areas is absent or irregular. Siltation was found to be evident on 79.5% of the assessed dams; this indicates that there are a lot of sediments being transported by the streams or rivers on which the dams are located. This further indicates that there is need to improve the soil and water conservation practices in the dam catchment areas in the study area. It should however be noted that the siltation assessments were qualitative. Therefore more conclusive results should be obtained through detailed studies on siltation. At least one dam had its spillway raised without expert advice. This together with the existence leaking spillways, which are repeatedly repaired unsuccessfully by the communities, as well as wide spread scarping and erosion indicates the lack of involvement in dam maintenance by the dam experts such as those from DDF. Complete dam failure was also noted to have already occurred on four dams; on 2 as a result of overtopping of the embankment and breaching, on 1 as a result of spillway sill breaching and the other as a result of siltation. The breached dams were said to have failed due to cyclone Eline induced floods in the year 2000. One of the dams, which failed due to a breached embankment, is Maninginingi dam located in ward 9. An assessment of the dam showed that the spillway was completely blocked by soil and trees about 4m tall were growing in the spillway channel. This indicates that the spillway blockage was a major contributor to the breaching. Chobukwa dam in ward 6 was the other dam that had a breached embankment. Detailed assessments revealed that its spillway was inadequate. The other failed dam had a breached spillway. Although assessments on the ground indicated that a 4 metre tall tree, which was found at the point where the breach occurred, could have weakened the spillway sill, inadequacy of the dam’s spillway was also confirmed during detailed assessments as a contributory factor to the failure. Relevant factors to small dams in the area of study such as erosion, seepage and others that were used in the development of the risk evaluation tool were also identified during the rapid assessments. The full list of these factors is given in table A.6 (first column).
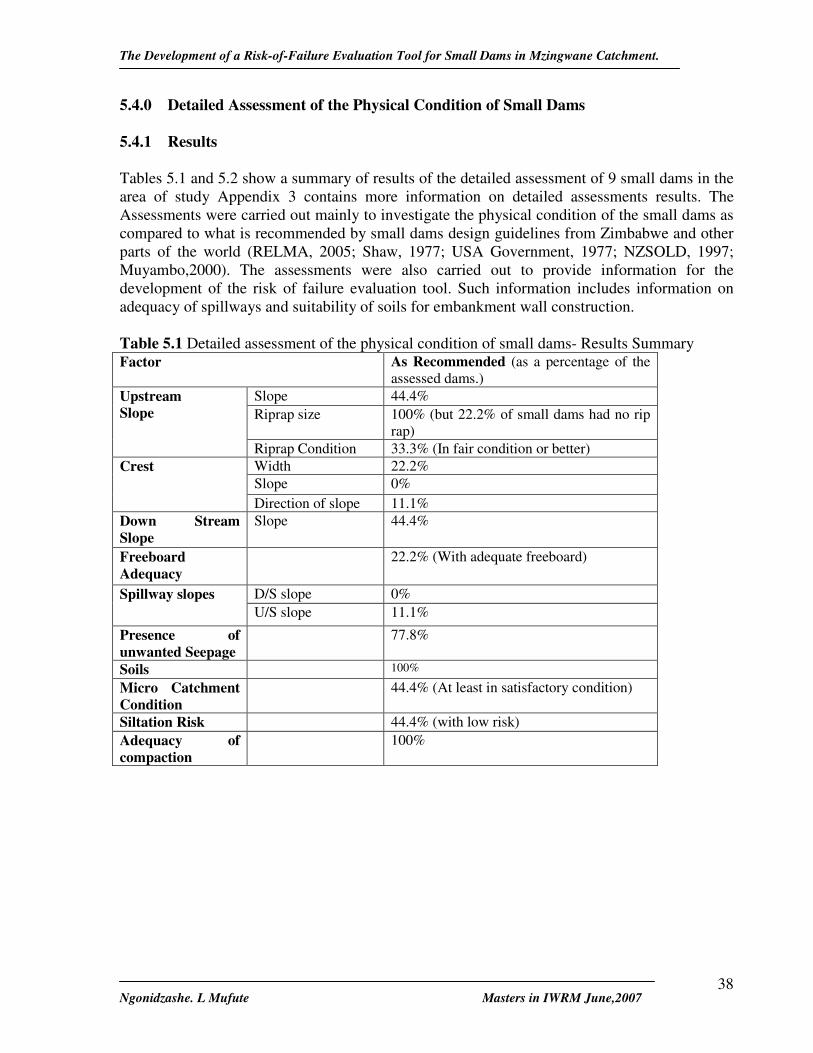
The Development of a Risk-of-Failure Evaluation Tool for Small Dams in Mzingwane Catchment.
Ngonidzashe. L Mufute Masters in IWRM June,2007
38
5.4.0 Detailed Assessment of the Physical Condition of Small Dams 5.4.1 Results Tables 5.1 and 5.2 show a summary of results of the detailed assessment of 9 small dams in the area of study Appendix 3 contains more information on detailed assessments results. The Assessments were carried out mainly to investigate the physical condition of the small dams as compared to what is recommended by small dams design guidelines from Zimbabwe and other parts of the world (RELMA, 2005; Shaw, 1977; USA Government, 1977; NZSOLD, 1997; Muyambo,2000). The assessments were also carried out to provide information for the development of the risk of failure evaluation tool. Such information includes information on adequacy of spillways and suitability of soils for embankment wall construction. Table 5.1 Detailed assessment of the physical condition of small dams- Results Summary Factor As Recommended (as a percentage of the
assessed dams.) Slope 44.4% Riprap size 100% (but 22.2% of small dams had no rip
rap)
Upstream Slope
Riprap Condition 33.3% (In fair condition or better) Width 22.2% Slope 0%
Crest
Direction of slope 11.1% Down Stream Slope
Slope 44.4%
Freeboard Adequacy
22.2% (With adequate freeboard)
D/S slope 0% Spillway slopes U/S slope 11.1%
Presence of unwanted Seepage
77.8%
Soils 100%
Micro Catchment Condition
44.4% (At least in satisfactory condition)
Siltation Risk 44.4% (with low risk) Adequacy of compaction
100%

The Development of a Risk-of-Failure Evaluation Tool for Small Dams in Mzingwane Catchment.
Ngonidzashe. L Mufute Masters in IWRM June,2007
39
Table 5.2 Laboratory Soil Analysis Results Sample Name %Weight of material
< no. 200 sieve (75um) % Clay content
Plastic Limit
Liquid Limit
Plasticity Index PI
USC Classification
Dewa 33 11.51 15 21 6 SM-SC Manza nlhophe
41 17.15 21 29 8 SC
Avoca 25 10.26 16 17 1 SM-SC Mzambani 50 27.77 16 33 17 SC Chobukwa (Light)
38 1.63 19 37 18 SC
Chobukwa (Red) 36 2.5 21 35 14 SC Jubele Dube 41 24.42 13 28 15 SC Ngwabi 29 12.24 15 21 6 SM-SC Shagwe 37 15.24 15 29 14 SC Majelimani 30 7.86 22 28 6 SM-SC
5.4.2 Discussion of Detailed Assessments Results Poor embankment slopes condition (on 56.6% of the assessed dams) and poor riprap condition (on 66.7% of assessed dams) are some of the factors that further give more weight to the assertion that there is poor maintenance of small dams in the area of study. Only 22% of the assessed dams had adequate freeboards, this means that the majority of the dams (78%) are susceptible to failure by floods overtopping the dam walls due to inadequate spillways. The inadequate spillways could be mostly due to erosion, which is evident on one of the assessed dams, which failed due to overtopping of the embankment. Chobukwa, one of the failed dams discussed above, has a combination of a masonry and earthen embankment. Its spillway is very small (only about 4.6m wide and 80cm deep). The spillway is engraved in the middle of the masonry section. This spillway as mentioned under the rapid assessment results section above was also found inadequate. This indicate that some of the dams though to a smaller extend were not adequately designed. The dam was constructed by an NGO, with the assistance of the local community. All the soils used for the construction of embankments were within the recommended type for dam wall construction. The soils were found to be all poorly graded coarse grained soils. Of the collected samples, 60% were found to be in the SC (Sandy clays) class and 40% were in the SM-SC class (clayey-sand -silt), according to the Unified Soil Classification (USC) system (Shaw, 1977; USA Government, 1977). Table 5.2.Contains a summary of the soil analysis results. 5.5.0. Other Outcomes from the Assessments, Interviews and Discussions with Community Members 5.5.1 Dam Management DDF used to carry out repairs and maintenance on dams they constructed or inherited from pre- independence institutions. Such dams constitute about 68% (30 dams) of the dams assessed. According to community members interviewed, there are no functional dam committees on

The Development of a Risk-of-Failure Evaluation Tool for Small Dams in Mzingwane Catchment.
Ngonidzashe. L Mufute Masters in IWRM June,2007
40
such dams. This means that no body is currently being responsible for the management of these small dams. DDF are currently incapacitated to carry out their mandate of looking after small state constructed communal dams. This coupled with unclear hand over –talk over take over policies have resulted in small dams they constructed or inherited not being maintained fully and hence deteriorating in their physical condition. The communities, to which the dams are handed over, are also short of resources to maintain the dams. Where NGOs are assisting the communities by providing basic inspection and maintenance training the dams are relatively in a better condition (on 18% of the studied dams). This shows that with little organization, training and material assistance, communities can improve the way they look after dams. On 18% of the assessed dams especially in ward 6, there were no official dam committees in place but the councillor, Village development committee and traditional leadership mobilized the community to do minimal maintenance such as cutting down trees and repair works when breaching is imminent. This was being done with assistance from NGOs such as World Vision and CADEC. The NGOs provided food rations to the villagers involved in doing the work. They also provided basic tools such as shovels, picks and wheel burrows needed to do the repair and maintenance work. The assistance by the NGOs was limited to the dams which were rehabilitated or constructed by the NGOs. The communities were also trained in basic maintenance such as dealing with termite mounds and cutting down trees on the embankment. However like everywhere else in the areas in which the assessments were done, the community members showed signs of limited technical knowledge on how to tackle issues such as erosion dam walls, riprap deterioration, scarping and leaking spillway sills. Such dams however were in much better physical condition than that of the dams, which were handed over to the communities by DDF and there was no external assistance in repair and maintenance. There were no regular maintenance programs in place and records of inspections and maintenance on all the assessed dams. The presence of erosion, scarping, poor riprap condition and leaking spillway sills revealed a lack of expert advice and involvement in the repair and maintenance of dams in the area of study. These dam defects require expert attention. On 15.9% of the dams visited which were constructed or inherited by DDF, the local communities led by village development committees, the councillor and traditional leaders mobilized community for labour to do the repair work and to raise funds for the works. On such dams there were no official dam committees in place and no regular maintenance was carried out. The interviewed community members indicated that repair works were only done when it was necessary such as when a dam breach is imminent This was because they did not have enough resources or any external assistance to carrying out the repair and maintenance work. Of the assessed dams owned or initiated by farmers 50% were relatively better maintained than those formerly managed by DDF. However issues such as erosion, scarping and riprap deterioration were also being neglected. In 4.5% (50% of farmer initiated dams assessed) of the assessed dams, which were owned or initiated by farmers were virtually not being taken care of
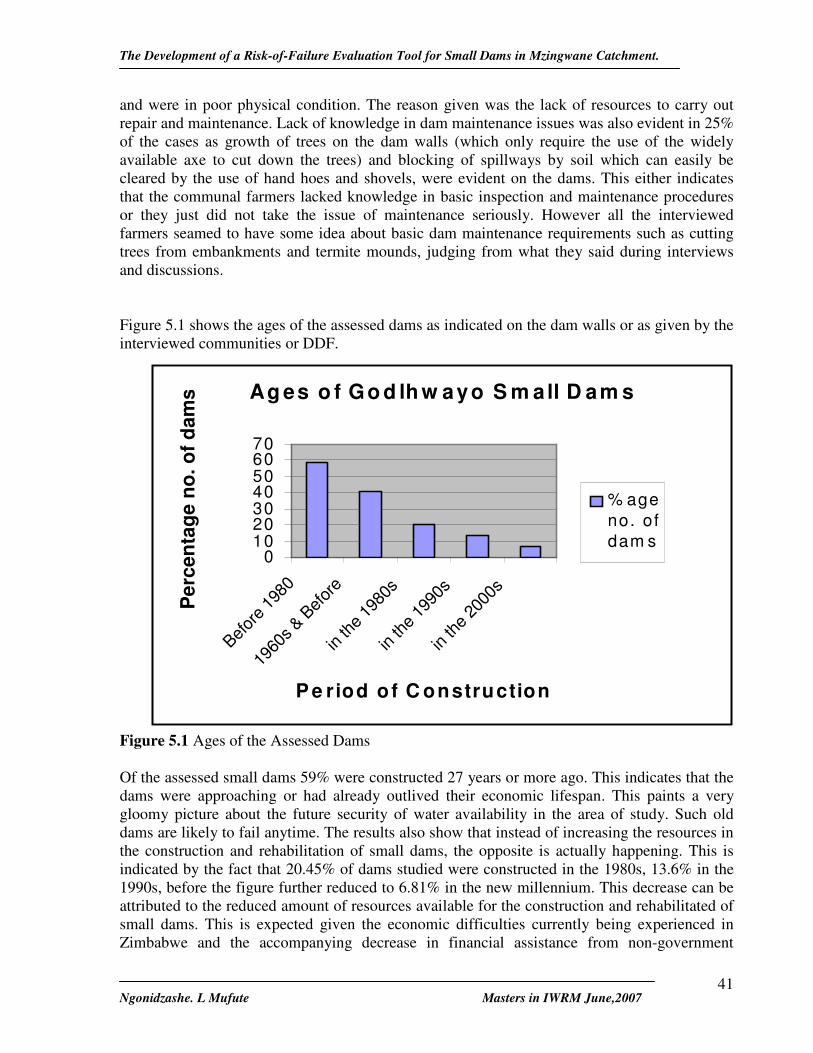
The Development of a Risk-of-Failure Evaluation Tool for Small Dams in Mzingwane Catchment.
Ngonidzashe. L Mufute Masters in IWRM June,2007
41
and were in poor physical condition. The reason given was the lack of resources to carry out repair and maintenance. Lack of knowledge in dam maintenance issues was also evident in 25% of the cases as growth of trees on the dam walls (which only require the use of the widely available axe to cut down the trees) and blocking of spillways by soil which can easily be cleared by the use of hand hoes and shovels, were evident on the dams. This either indicates that the communal farmers lacked knowledge in basic inspection and maintenance procedures or they just did not take the issue of maintenance seriously. However all the interviewed farmers seamed to have some idea about basic dam maintenance requirements such as cutting trees from embankments and termite mounds, judging from what they said during interviews and discussions. Figure 5.1 shows the ages of the assessed dams as indicated on the dam walls or as given by the interviewed communities or DDF.
Figure 5.1 Ages of the Assessed Dams Of the assessed small dams 59% were constructed 27 years or more ago. This indicates that the dams were approaching or had already outlived their economic lifespan. This paints a very gloomy picture about the future security of water availability in the area of study. Such old dams are likely to fail anytime. The results also show that instead of increasing the resources in the construction and rehabilitation of small dams, the opposite is actually happening. This is indicated by the fact that 20.45% of dams studied were constructed in the 1980s, 13.6% in the 1990s, before the figure further reduced to 6.81% in the new millennium. This decrease can be attributed to the reduced amount of resources available for the construction and rehabilitated of small dams. This is expected given the economic difficulties currently being experienced in Zimbabwe and the accompanying decrease in financial assistance from non-government
Ag es o f Go d lh w ayo S m all D am s
010203040506070
Before
1980
1960
s & B
efore
in the
1980
s
in the
1990
s
in the
2000
s
P e riod of C onstruction
Per
cent
age
no. o
f dam
s
% ageno. ofdam s
The Development of a Risk-of-Failure Evaluation Tool for Small Dams in Mzingwane Catchment.
Ngonidzashe. L Mufute Masters in IWRM June,2007
42
sources such as international donors. The issue of reduced number of suitable undeveloped dam sites does not fully explain the decrease in dam construction as resources could still be channelled towards rehabilitation of existing dams that are in poor condition or have failed due to overtopping. 5.6 The Current Physical Condition of the Dams as Compared to the Recommended
Small Dams Design and Maintenance Guidelines. The results of both the rapid assessments and the detailed assessments (Table 5.1) and as discussed above, show that the current physical condition of the dams is not as recommended by the design and maintenance guidelines (section 2.6) The findings also confirmed that maintenance of dams was minimal to absent and Inspections are rarely carried out. No small dam maintenance records are kept in the area of study. Also according to the results, erosion, tree and shrub growth, deteriorating riprap, inadequate slopes, seepage and loss of freeboard are some of the common deficiencies on the dams. However given that 91 % of the dams assessed were designed and constructed by DDF (The official government agency responsible for small dams affairs in Zimbabwe) or NGOs through experienced contractors, the majority of the dams in the area of study are likely to have been constructed according to recommended guidelines. But due to neglect, old age and poor quality construction, their current physical condition is not as recommended. 5.7 Issues Resulting in the Present Physical Condition of the Small Dams in the Study
Area. These issues came out in the discussions, interviews and assessments of the physical condition of the small dams as mentioned above. The issues are now summarized below: • Lack of repair and maintenance is the major reason why the dams are in the poor
physical state. • The lack of repair and maintenance is primarily due to the lack of resources being
experienced by DDF, the institution mandated to design, construct and manage small dams in Zimbabwe. The institution is experiencing shortages of funds for carrying out its work on small dams. Their equipment is mostly obsolete .DDF also has a shortage of vehicles to go to the dam sites. There is high staff turnover and the new DDF staff also needs training and experience in order for them to effectively carry out their duties.
• The hand over takeover policies of the DDF for the management of dams between them and the communities are not clear. This has resulted in the communities being unsure of their role in small dams management
• There is limited stakeholder collaboration especially between DDF and the NGOs that are involved in the small dams sector.
• NGOs are however working on at least 18% of the studied dams. They construct, rehabilitate or help communities with basic tools for repair and maintenance of the small dams. The assistance by NGOS in providing tools for basic maintenance and giving food rations to the community members involved in the repair and maintenance work has resulted in a notable improvement in the carrying out of basic dam maintenance in the areas in which they operate. Such basic maintenance include as cutting down of trees on embankments and destroying termite mounds. However more technically
The Development of a Risk-of-Failure Evaluation Tool for Small Dams in Mzingwane Catchment.
Ngonidzashe. L Mufute Masters in IWRM June,2007
43
demanding problems such as erosion, scarping and leaking spillways remain largely unsolved.
• The prevalence of the more technically demanding dam deficiencies mentioned above indicates that the involvement of dam experts in the repair and maintenance of dams is largely missing. This further exposes the vital missing role that is normally played by DDF.
• Some communities (in 15% of the assessed dams) are trying to repair and maintain dams on their own. These communities have basic knowledge of inspection and maintenance issues but they lack the financial resources and equipment to carry out more involving work such as repairing scarped slopes. There is also lack of properly organized structures such as functional dam committees to carryout the repair and maintenance work. This coupled with lack of policy guidelines on the role of communities in the management of small dams is also resulting in situations whereby no one is held responsible for doing or supervising the work.
• Lack of incentives is also discouraging some otherwise committed members of the community from carrying out the work as they fill they would be doing work that benefits all users of the dam at little or no return. Worse still they get little assistance from the majority of the people who benefit from using the dam.
• The majority of the dams, 59% were constructed before independence (1980) and are old, past their economic lifespan or approaching it. It is most likely that such dams can fail any time and are no longer holding their designed capacity of water. Wear and tear and old age have therefore taken their toll on such dams, hence their current poor condition.
• According to the community members interviewed, Cyclone Eline despite resulting in the breaching of at least 3 dams in the area also left the majority of the dams in a very poor condition. It is highly unlikely that most of these dams will survive floods of the magnitude of those caused by the cyclone. Cyclone Eline occurred in the year 2000. It caused heavy flooding in most parts of the Mzingwane catchment resulting in damage to infrastructure such as dams. At least 68.2% of the assessed dams showed effects of erosion as shown by the results (section 5.3).
5.8 The Implication of the Physical Condition of the Small Dams to Dam Failure and
Security of Water Availability. As noted in the sections above, the majority of the dams’ condition is poor. Some of the deficiencies as noted in sections above are that; • Siltation is widespread, • Spillways are inadequate, • Slopes are scarped, • There is seepage in some dams and • The majority of the dams are beyond their economic life span. These issues therefore, indicate that the risk of dam failure is high, in the area of study. This in turn means that the security of water availability is very much threatened in this area where small dams are major source water.
The Development of a Risk-of-Failure Evaluation Tool for Small Dams in Mzingwane Catchment.
Ngonidzashe. L Mufute Masters in IWRM June,2007
44
5.9 0 The Risk of Failure Evaluation Tool 5.9.1 Introduction This is a tool that is meant to assist water resources managers especially those involved in the maintenance, repair and rehabilitation of small dams to evaluate the risk of failure of a particular dam. The tool, illustrated in a template form in table 5.3 is meant to assist the managers to make objective decisions in ranking the risk of failure of small dams. The authorities in charge of small dams generally experience resource constraints especially funds to maintain and rehabilitate dams. This is the case with DDF in Zimbabwe, according to the key respondents interviews held with DDF personnel. In situations were resources are scarce there is need to prioritise the allocation of the few resources available. The risk assessment tool brings more objectivity in selecting the dams which are most affected by lack of care. It helps to systematically and more objectively classify the risk of failure of small dams, hence assisting in the selection or prioritisation of dams to prioritise and attend to first. The tool makes use of criteria such as seepage, erosion piping and many others that are traditionally used to assess the condition of dams. It estimates the extent to which these factors or criteria affect a particular dam in relation to dam failure. Scores and weights are allocated to each particular factor or criteria depending on its associated effect on dam condition and its presence on a particular dam. It was revealed during assessments and interviews in the study area that
- There were no design, construction and maintenance records that are available for the dams in the study area.
- There is no regular maintenance, inspection and surveillance that is done on the small dams mainly due to lack of resources,
- There no surveillance and monitoring instrumentation that was noted on the small dams during assessments,
- Probabilistic precipitation data showing precipitation magnitude-frequency relationships was not available for the area of study. Such data is needed for extreme events such as floods to implement risk based approaches such as one implemented by the Washington State (Appendix 5)This data is used in determining adequacy of spillway for existing dams when using the risk based approaches based on probabilistic data like the one used in the Washington State.
From the above findings it noted that risk based approaches based on probabilistic data and strict inspection, monitoring of instrumentation, surveillance maintenance programmes cannot be applicable in the study area. Hence a risk evaluation tool based on available design, construction and maintenance guidelines without the application of probabilistic data was developed. A non probabilistic but numerical risk evaluation system was there fore developed so as to quantify the risk of failure associated with the small dams. Table 5.3 below shows a template of the tool risk evaluation tool which was developed following the methodology described in section 4.6. It can be presented in the form of a spreadsheet. Table 5.4. is then used to classify the overall risk of failure of a dam as low, moderate, high or very high.
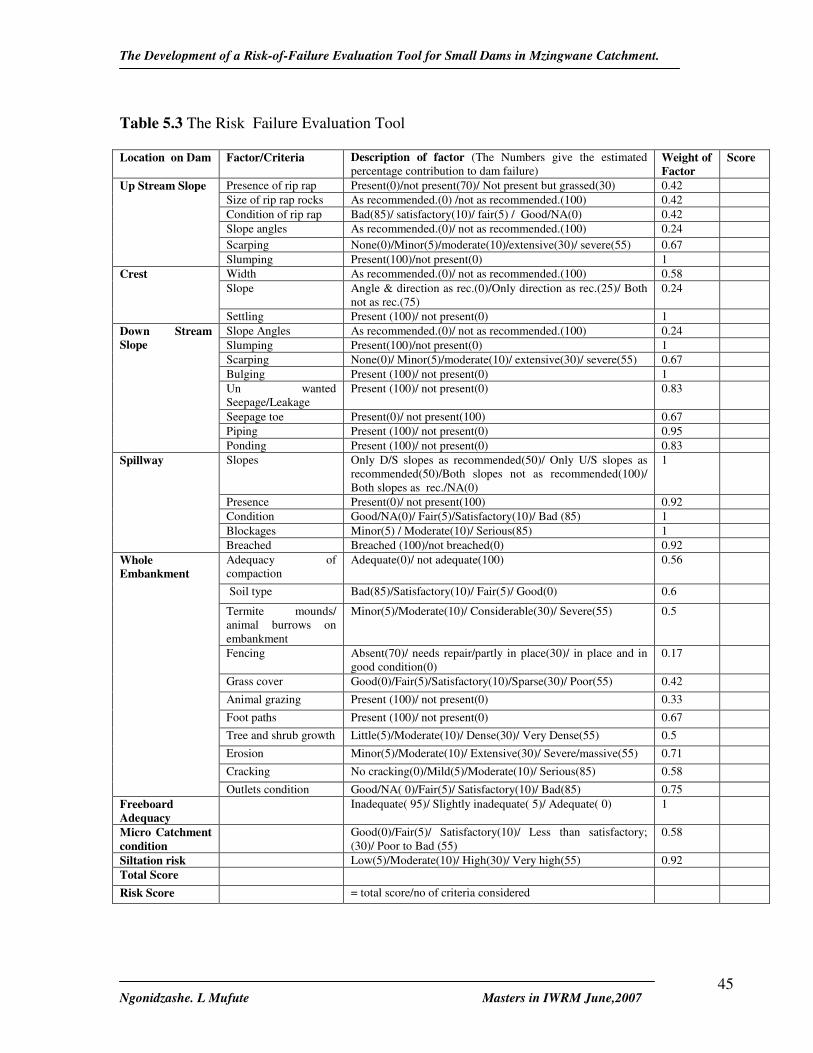
The Development of a Risk-of-Failure Evaluation Tool for Small Dams in Mzingwane Catchment.
Ngonidzashe. L Mufute Masters in IWRM June,2007
45
Table 5.3 The Risk Failure Evaluation Tool
Location on Dam Factor/Criteria Description of factor (The Numbers give the estimated percentage contribution to dam failure)
Weight of Factor
Score
Presence of rip rap Present(0)/not present(70)/ Not present but grassed(30) 0.42 Size of rip rap rocks As recommended.(0) /not as recommended.(100) 0.42 Condition of rip rap Bad(85)/ satisfactory(10)/ fair(5) / Good/NA(0) 0.42 Slope angles As recommended.(0)/ not as recommended.(100) 0.24 Scarping None(0)/Minor(5)/moderate(10)/extensive(30)/ severe(55) 0.67
Up Stream Slope
Slumping Present(100)/not present(0) 1 Width As recommended.(0)/ not as recommended.(100) 0.58 Slope Angle & direction as rec.(0)/Only direction as rec.(25)/ Both
not as rec.(75) 0.24
Crest
Settling Present (100)/ not present(0) 1 Slope Angles As recommended.(0)/ not as recommended.(100) 0.24 Slumping Present(100)/not present(0) 1 Scarping None(0)/ Minor(5)/moderate(10)/ extensive(30)/ severe(55) 0.67 Bulging Present (100)/ not present(0) 1 Un wanted Seepage/Leakage
Present (100)/ not present(0) 0.83
Seepage toe Present(0)/ not present(100) 0.67 Piping Present (100)/ not present(0) 0.95
Down Stream Slope
Ponding Present (100)/ not present(0) 0.83 Slopes Only D/S slopes as recommended(50)/ Only U/S slopes as
recommended(50)/Both slopes not as recommended(100)/ Both slopes as rec./NA(0)
1
Presence Present(0)/ not present(100) 0.92 Condition Good/NA(0)/ Fair(5)/Satisfactory(10)/ Bad (85) 1 Blockages Minor(5) / Moderate(10)/ Serious(85) 1
Spillway
Breached Breached (100)/not breached(0) 0.92 Adequacy of compaction
Adequate(0)/ not adequate(100) 0.56
Soil type Bad(85)/Satisfactory(10)/ Fair(5)/ Good(0) 0.6
Termite mounds/ animal burrows on embankment
Minor(5)/Moderate(10)/ Considerable(30)/ Severe(55) 0.5
Fencing Absent(70)/ needs repair/partly in place(30)/ in place and in good condition(0)
0.17
Grass cover Good(0)/Fair(5)/Satisfactory(10)/Sparse(30)/ Poor(55) 0.42
Animal grazing Present (100)/ not present(0) 0.33
Foot paths Present (100)/ not present(0) 0.67 Tree and shrub growth Little(5)/Moderate(10)/ Dense(30)/ Very Dense(55) 0.5
Erosion Minor(5)/Moderate(10)/ Extensive(30)/ Severe/massive(55) 0.71
Cracking No cracking(0)/Mild(5)/Moderate(10)/ Serious(85) 0.58
Whole Embankment
Outlets condition Good/NA( 0)/Fair(5)/ Satisfactory(10)/ Bad(85) 0.75 Freeboard Adequacy
Inadequate( 95)/ Slightly inadequate( 5)/ Adequate( 0) 1
Micro Catchment condition
Good(0)/Fair(5)/ Satisfactory(10)/ Less than satisfactory; (30)/ Poor to Bad (55)
0.58
Siltation risk Low(5)/Moderate(10)/ High(30)/ Very high(55) 0.92 Total Score
Risk Score = total score/no of criteria considered
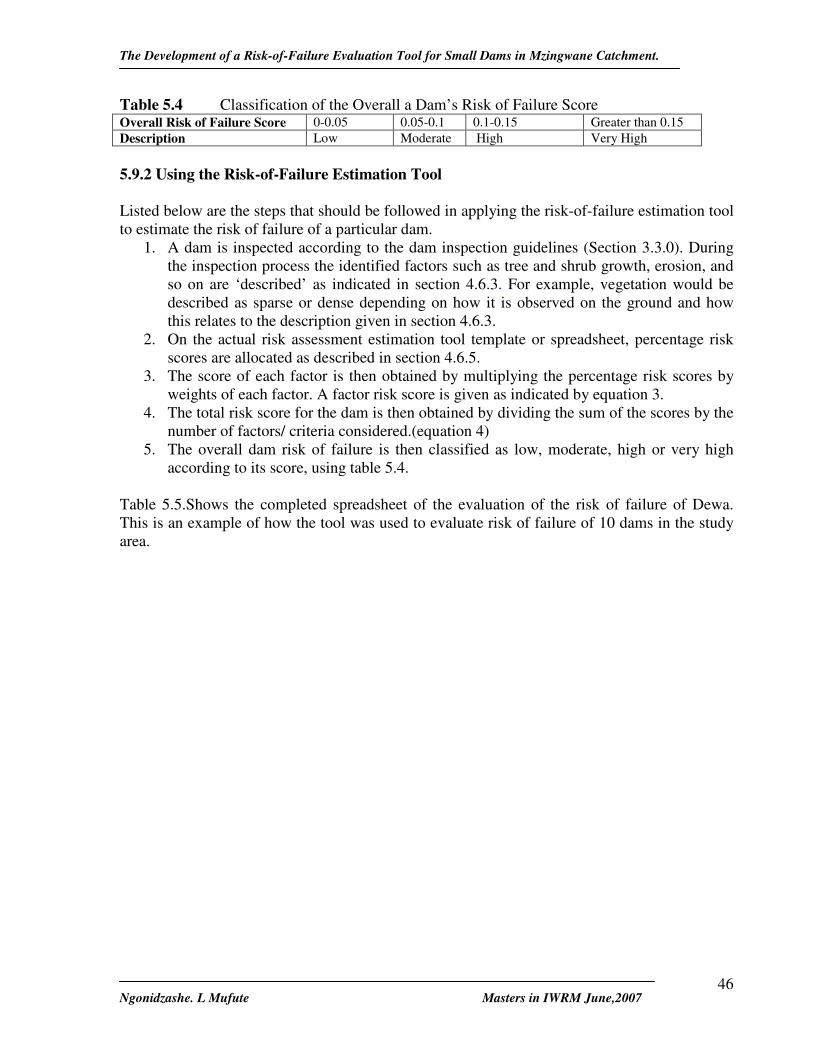
The Development of a Risk-of-Failure Evaluation Tool for Small Dams in Mzingwane Catchment.
Ngonidzashe. L Mufute Masters in IWRM June,2007
46
Table 5.4 Classification of the Overall a Dam’s Risk of Failure Score Overall Risk of Failure Score 0-0.05 0.05-0.1 0.1-0.15 Greater than 0.15 Description Low Moderate High Very High 5.9.2 Using the Risk-of-Failure Estimation Tool Listed below are the steps that should be followed in applying the risk-of-failure estimation tool to estimate the risk of failure of a particular dam.
1. A dam is inspected according to the dam inspection guidelines (Section 3.3.0). During the inspection process the identified factors such as tree and shrub growth, erosion, and so on are ‘described’ as indicated in section 4.6.3. For example, vegetation would be described as sparse or dense depending on how it is observed on the ground and how this relates to the description given in section 4.6.3.
2. On the actual risk assessment estimation tool template or spreadsheet, percentage risk scores are allocated as described in section 4.6.5.
3. The score of each factor is then obtained by multiplying the percentage risk scores by weights of each factor. A factor risk score is given as indicated by equation 3.
4. The total risk score for the dam is then obtained by dividing the sum of the scores by the number of factors/ criteria considered.(equation 4)
5. The overall dam risk of failure is then classified as low, moderate, high or very high according to its score, using table 5.4.
Table 5.5.Shows the completed spreadsheet of the evaluation of the risk of failure of Dewa. This is an example of how the tool was used to evaluate risk of failure of 10 dams in the study area.

The Development of a Risk-of-Failure Evaluation Tool for Small Dams in Mzingwane Catchment.
Ngonidzashe. L Mufute Masters in IWRM June,2007
47
Table 5.5. Spreadsheet of the completed risk evaluation of Dewa Dam Location on Dam
Factor Description of factor. (Number =percentage.) Description of Factor (%)
Weight Score
Presence of rip rap Present (0)/not present(70)/ Not present but grassed(30) 0 0.42 0 Size of rip rap rocks As recommended.(0) /not as recommended.(100) 0 0.42 0 Condition of rip rap Bad(85)/ satisfactory(10)/ fair(5) / Good/NA(0) 85 0.42 0.357 Slope angles As recommended.(0)/ not as recommended.(100) 100 0.24 0.24 Scarping None(0)/Minor(5)/ moderate(10)/ extensive(30)/ severe(55) 30 0.67 0.201
Up Stream Slope
Slumping/Beaching Present(100)/not present(0) 100 1 1 Width As recommended.(0)/ not as recommended.(100) 100 0.58 0.58 Slope Angle & direction as rec.(0)/Only direction as rec.(25)/ Both
not as rec.(75) 75 0.24 0.18
Crest
Settling Present (100)/ not present(0) 0 1 0 Slope Angles As recommended.(0)/ not as recommended.(100) 0 0.24 0 Slumping Present(100)/not present(0) 0 1 0 Scarping None(0)/ Minor(5)/moderate(10)/ extensive(30)/ severe(55) 5 0.67 0.034 Bulging Present (100)/ not present(0) 0 1 0 Un wanted Seepage/Leakage
Present (100)/ not present(0) 0 0.83 0
Seepage toe Present(0)/ not present(100) 0 0.67 0 Piping Present (100)/ not present(0) 0 0.95 0
Down Stream Slope
Ponding Present (100)/ not present(0) 0 0.83 0 Slopes Only D/S slopes as recommended(50)/ Only U/S slopes as
recommended(50)/Both slopes not as recommended(100)/ Both slopes as recommended/NA(0)
100 1 1
Presence Present(0)/ not present(100) 0 0.92 0 Breached Breached (100)/not breached(0) 0 1 0 Condition Good/NA(0)/ Fair(5)/Satisfactory(10)/ Bad (85) 10 1 0.1
Spillway
Blockages Minor(5) / Moderate(10)/ Serious(85) 5 0.92 0.046 Adequacy of compaction
Adequate(0)/ not adequate(100) 0 0.56 0
Soil type Bad(85)/Satisfactory(10)/ Fair(5)/ Good(0) 5 0.6 0.03 Termite mounds/ animal burrows on embankment
Minor(5)/Moderate(10)/ Considerable(30)/ Severe(55) 30 0.5 0.15
Fencing Absent(70)/ needs repair/partly in place(30)/ in place and in good condition(0)
70 0.17 0.119
Grass cover Good(0)/Fair(5) / Satisfactory(10)/ Sparse(30)/ Poor(55) 10 0.42 0.042 Animal grazing Present (100)/ not present(0) 100 0.33 0.33 Foot paths Present (100)/ not present(0) 100 0.67 0.67 Tree and shrub growth Little(5)/Moderate(10)/ Dense(30)/ Very Dense(55) 5 0.5 0.025 Erosion Minor(5)/Moderate(10)/ Extensive(30)/ Severe/massive(55) 30 0.71 0.213 Cracking No cracking(0)/Mild(5)/Moderate(10)/ Serious(85) 0 0.58 0
Whole Embankment
Outlets condition Good/NA( 0)/Fair(5)/ Satisfactory(10)/ Bad(85) 0 0.75 0 Freeboard Adequacy
Inadequate( 95)/ Slightly inadequate( 5)/ Adequate( 0) 5 1 0.05
Micro catchment condition
Good(0)/Fair(5)/ Satisfactory(10)/ Less than satisfactory; (30)/ Poor to Bad (55)
10 0.58 0.058
Siltation risk Low(5)/Moderate(10)/ High(30)/ Very high(55) 30 0.92 0.276 Total Score 5.700
5 Risk of failure score 0.158
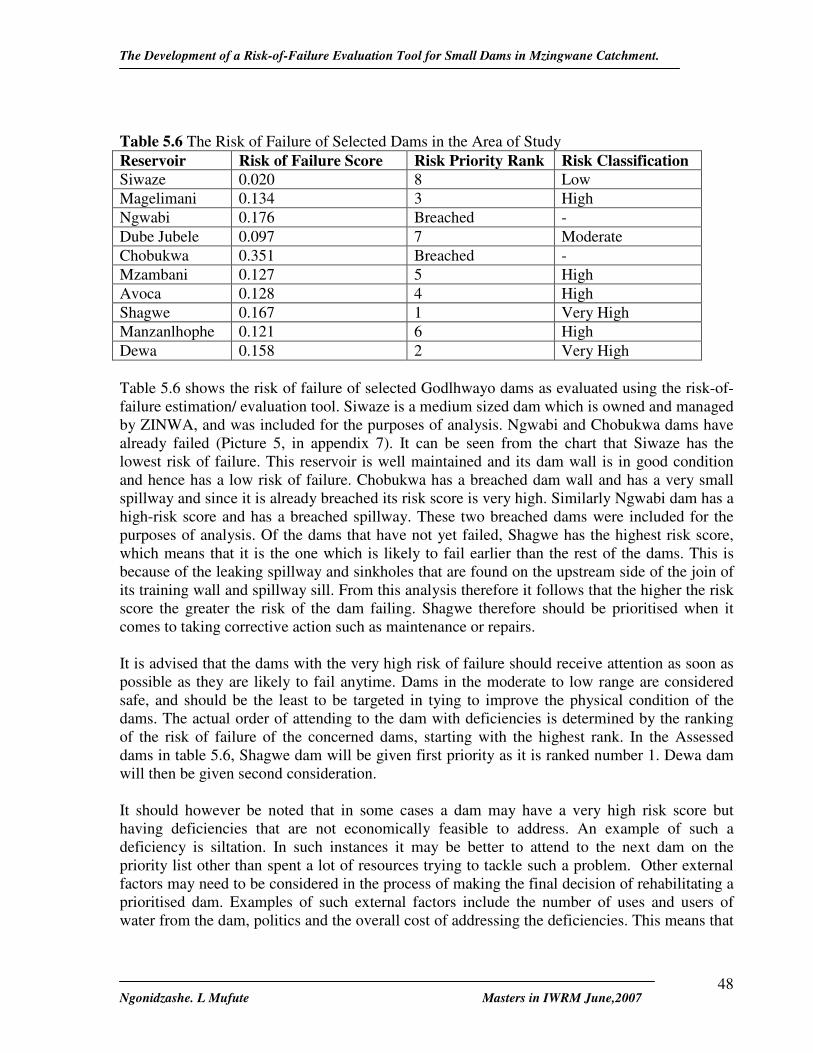
The Development of a Risk-of-Failure Evaluation Tool for Small Dams in Mzingwane Catchment.
Ngonidzashe. L Mufute Masters in IWRM June,2007
48
Table 5.6 The Risk of Failure of Selected Dams in the Area of Study Reservoir Risk of Failure Score Risk Priority Rank Risk Classification Siwaze 0.020 8 Low Magelimani 0.134 3 High Ngwabi 0.176 Breached - Dube Jubele 0.097 7 Moderate Chobukwa 0.351 Breached - Mzambani 0.127 5 High Avoca 0.128 4 High Shagwe 0.167 1 Very High Manzanlhophe 0.121 6 High Dewa 0.158 2 Very High Table 5.6 shows the risk of failure of selected Godlhwayo dams as evaluated using the risk-of-failure estimation/ evaluation tool. Siwaze is a medium sized dam which is owned and managed by ZINWA, and was included for the purposes of analysis. Ngwabi and Chobukwa dams have already failed (Picture 5, in appendix 7). It can be seen from the chart that Siwaze has the lowest risk of failure. This reservoir is well maintained and its dam wall is in good condition and hence has a low risk of failure. Chobukwa has a breached dam wall and has a very small spillway and since it is already breached its risk score is very high. Similarly Ngwabi dam has a high-risk score and has a breached spillway. These two breached dams were included for the purposes of analysis. Of the dams that have not yet failed, Shagwe has the highest risk score, which means that it is the one which is likely to fail earlier than the rest of the dams. This is because of the leaking spillway and sinkholes that are found on the upstream side of the join of its training wall and spillway sill. From this analysis therefore it follows that the higher the risk score the greater the risk of the dam failing. Shagwe therefore should be prioritised when it comes to taking corrective action such as maintenance or repairs. It is advised that the dams with the very high risk of failure should receive attention as soon as possible as they are likely to fail anytime. Dams in the moderate to low range are considered safe, and should be the least to be targeted in tying to improve the physical condition of the dams. The actual order of attending to the dam with deficiencies is determined by the ranking of the risk of failure of the concerned dams, starting with the highest rank. In the Assessed dams in table 5.6, Shagwe dam will be given first priority as it is ranked number 1. Dewa dam will then be given second consideration. It should however be noted that in some cases a dam may have a very high risk score but having deficiencies that are not economically feasible to address. An example of such a deficiency is siltation. In such instances it may be better to attend to the next dam on the priority list other than spent a lot of resources trying to tackle such a problem. Other external factors may need to be considered in the process of making the final decision of rehabilitating a prioritised dam. Examples of such external factors include the number of uses and users of water from the dam, politics and the overall cost of addressing the deficiencies. This means that
The Development of a Risk-of-Failure Evaluation Tool for Small Dams in Mzingwane Catchment.
Ngonidzashe. L Mufute Masters in IWRM June,2007
49
therefore that the tool should be taken as the initial stage in an integrated risk management programme that would help authorities to make decisions on dam maintenance.

The Development of a Risk-of-Failure Evaluation Tool for Small Dams in Mzingwane Catchment.
Ngonidzashe. L Mufute Masters in IWRM June,2007
50
CHAPTER 7. CONCLUSIONS AND RECOMMENDATIONS 7.1 Conclusions All of the assessed small dams are in a poor physical condition. This was indicated for example by the signs of erosion (on at least 68% of assessed small dams) and Tree and shrub growth (66%) on dam walls. With few exceptions, most small communal dams in the study area were built according to recommended design, construction and maintenance guidelines. But their current physical condition is not inline with these guidelines. Evidence to support that the dams were built according to guidelines is as follows; - Most (91%) of the assessed small dams were constructed by official organisations such
as DDF and NGOs who normally engage the services of experts in the design and construction of the dams.
- Assessments of the small dams indicated that recommended design guidelines were generally followed in the construction of the dams. A comparison of some design documents found at DDF with design guidelines showed that they were in line with the guidelines. Other evidence is the fact that 100% the tested soil samples used in the construction of the dam walls were within recommended types. Most dams had design recommended dam wall components such as riprap (68% of dams assessed) and spillways (100% of dams assessed).
However there were clear cases of guidelines not being adequately followed as evidenced on one small dam which was constructed by an NGO being assisted with manual labour by the community. The cement lined spillway of the dam was constructed on the masonry part of the dam wall and it was found to be grossly inadequate. As a result the earthen part of the dam wall was breached. The major reasons why the majority of the studied dams were in poor physical condition are;
i.) The limited repair and maintenance primarily due to the limited capacity of DDF, the institution mandated to design, construct and manage small communal dams in Zimbabwe. As a result of lack of funds and equipment DDF is currently not carrying out any repair and maintenance works on small dams in the study area.
ii.) Due to unclear hand over of dams to communal people by DDF and NGOs, lack of resources, limited training in dam care, general lack of maintenance structures such as functional dam committees and lack of incentives, communities are generally not motivated to maintain the small dams.
iii.) Limited appreciation of the need to maintain small dams by the communities. Even though some communities do not value issues of dam maintenance, some have realised the importance of this as indicated by communities on 15% of the assessed dams who were carrying out basic maintenance without external support.
iv.) A significant number (59%) of the studied small dams were constructed before independence (1980) and are old. They are most likely no longer able to hold their designed capacities of water and are likely to fail any time.
The Development of a Risk-of-Failure Evaluation Tool for Small Dams in Mzingwane Catchment.
Ngonidzashe. L Mufute Masters in IWRM June,2007
51
v.) Cyclone Eline besides resulting in the breaching of at least 3 dams in the area left the majority of the dams in a very poor condition. It is highly unlikely that most of these dams will survive floods of the magnitude of those caused by the cyclone.
The risk of failure evaluation tool that was developed in this study can be used by water resources institutions involved in the management of small dams to estimate the risk of failure associated with each particular dam. This would in turn help them to more systematically and objectively rank the dams that need to be repaired or maintained according to their closeness to failure. Dams, which are ranked as being at the greatest risk, would then be prioritised in the allocation of the resources for repair and maintenance. The tool could therefore go a long way in assisting in the allocation of scarce resources to meet an almost impossible task of maintaining in good condition thousands of small dams scattered across the arid regions of the Mzingwane catchment in Zimbabwe and the Limpopo basin at large. Despite the majority of the dams in the study area being constructed according to recommended design guidelines, due to their poor physical condition resulting from lack of repair and maintenance and old age, the majority of small dams in the study area are at risk of failing. Security of water availability in the study area is therefore threatened. The application of the tool could thus help secure the sustainable availability of water to the rural communities who heavily rely on water from small dams in the arid regions of Zimbabwe and the Limpopo basin. This would go a long way in sustaining the livelihoods of communal people in the arid regions 7.2 Recommendations Sustainable maintenance and rehabilitation systems for small dams should be put in place to ensure that the small dams in the study area remain in good physical condition and water availability is not threatened The following is suggested; - Capacitating DDF to take a leading role in coordinating and guiding the activities
related to the design, construction and management of small dams. Such empowerment should be in the form of training its staff members in technical and Integrated Water Resources Management (IWRM) skills, improving the staff’s conditions of service and providing funding for repairing and buying of equipment and vehicles for use in their work on small dams.
- Resolving ownership and management issues in small dams by making clear the
policies on the role communities in the management of small communal dams. - Facilitation of community participation and management of local pool resources such as
small dams. The communities would then feel that they own the facilities and are fully honoured and empowered to look after them. This may reduce the degree of indifference towards the maintenance of small dams.
- Further studies on the establishment functional dam committees or other structures
through which communities can repair and maintain dams in collaboration with DDF and other stakeholders such as NGOs. This is necessary because the current set up is not working. This is indicated by the lack of functional dam committees in most of the dams

The Development of a Risk-of-Failure Evaluation Tool for Small Dams in Mzingwane Catchment.
Ngonidzashe. L Mufute Masters in IWRM June,2007
52
that were handed over by DDF to the communities in the study area. This is despite the fact that committees were created during the handover of the management of the dams to the local communities.
- Improving the level of stake holder collaboration by the application of (IWRM)
principles such as stakeholder participation and consultation. This can create or facilitate linkages between institutions thereby reducing the impact of lack of resources on dam maintenance. Increased cooperation between NGOs and DDF through the supporting of DDF staff training programmes by NGOs for instance, could reduce the impact of lack of experts to assist communities in dam maintenance.
- Conducting awareness campaigns and training of communities on dam care and the need to maintain the dams. Integrated massive reconstruction, rehabilitation and maintenance programs should then be initiated.
- There is need however for targeting and prioritising dams that are most affected by lack
of care as resources are limiting. This can be facilitated by the use of the risk of failure evaluation tool.
7.3 Areas for Further Research. - Establishment of sustainable maintenance systems such as functional dam committees. - An investigation to establish whether the substantial seepage down stream of certain
studied dams is threatening the dams concerned. - Detailed investigations of both quantity and quality of seepage and leakage that was
observed on some of the studied dams, so as to determine if these are not seriously affecting the dam structures.
- Detailed studies of catchment conditions and siltation into reservoirs and their effect on dam capacities and failure in the area of study.
- Further testing of the developed risk estimation/evaluation tool on dams that are out side the area of application to so as to identify areas that need improvement so as to make it applicable to small dams in different climatic and management set-ups.

The Development of a Risk-of-Failure Evaluation Tool for Small Dams in Mzingwane Catchment.
Ngonidzashe. L Mufute Masters in IWRM June,2007
53
8.0 REFERENCES ASWCC (Arkansas Soil and Water Conservation Commission), 2002. Inspection and
Maintenance Manual for Arkansas Dam Owners. East Capitol, State of Arkansas, USA. http://www.aswcc.arkansas.gov/MAINTENANCE_MANUAL.pdf (Accessed 27 November 2006)
Bowles, D.S., Anderson, L.R., Glove, T.F., 1997. A Role of Risk Assessment in Dam Safety
management. Paper Presented at the Proceedings of the 3rd International Conference Hydropower 97, Trondheim,Norway,June,1997
Bowless, D.S., 1989. Risk Assessment in Dam Safety Decision Making. Paper Presented at the
4th Conference on Risk Based Decision Making in Water Resources, Santa Barbara, CA ,October 15-20,1989.
CARE International in Zimbabwe, 2002. Community Resources Management Guidelines. Dam Safety Branch, 2000. Dam Safety Project Review Guide (June,2000).Dam Safety
Branch,Division of Water Resources Office of the State Engineer , Department of Natural Resources ,Denver, Colorado,USA.
DDF (District Development Fund),2007. Data Base on Small Dams in Insiza District.
Unpublished.
Defra, 2002.Research Contract “Reservoir Safety – Floods and Reservoir Safety Integration”. Final Report Volume 2 of 3. Appendix E. Ref. XU0168 Rev A05. http://www.defra.gov.uk/environment/water/rs/pdf/defra_rs_flood-etc-12.pdf (Accessed 29 May 2007)
FEMA, 1987. Dam Safety: An Owner's Guidance Manual. Federal Emergency Management
Agency, Washington, D.C., FEMA 145, August 1987.
ICOLD (INTERNATIONAL COMMITTEE ON LARGE DAMS), 1998. ICOLD Guidelines on Risk Assessment for Dams
Johnson, D.,2000 .Risk is not a Four Letter Word : Ten Years of Success Using a Risk Based
Dam Safety Approach in Washington.
www.ecy.wa.gov/programs/wr/dams/Images/pdfs/asdso-rp.pdf (Accessed 29 May
2007)
Kabell,T.C.,1987. Guidelines to the Design of Small Dams. Department of Water Resources,
Government of Zimbabwe.
The Development of a Risk-of-Failure Evaluation Tool for Small Dams in Mzingwane Catchment.
Ngonidzashe. L Mufute Masters in IWRM June,2007
54
Love, D., Taigbenu, A.E and Jonger , L., 2005. An over view of the Mzingwane catchment ,
Zimbabwe , a contribution to the waterNet Challenge Program Project 17 “Integrated Water Resources Management for improved livelihoods: Managing risk ,mitigating drought and improving water productivity in the water scarce Limpopo basin” . WaterNet Working Paper, 1. Waternet, Harare, 20p.
Moyo, B., 2005. Impact and Adaptation of Climate Variability on Water Supply Reservoir Yields for the City of Bulawayo. MSc Thesis, Department of Civil Engineering ,University of Zimbabwe.
Muyambo , A., 2000.Design and construction of small earth dams. Government of Zimbabwe, Harare Zimbabwe
NZSOLD (New Zealand Society on Large Dams), 1997. Guidelines on Inspecting Small Dams. NZSOLD, Wellington, New Zealand.
Onema, J.K., 2004. A hydrological assessment of land use changes and human’s effects on
water resources in semi-arid Zimbabwe: the case of the Insiza sub-catchment. MSc Thesis, Department of Civil Engineering ,University of Zimbabwe.
Pisaniello,J.D , Zhifang,W and Mckay, M.,2006. Small Dams safety Issues-Engineering/Policy Models and Community Responses from Australia. IWA Publishing, Australia.
RELMA, 2005. Water from Ponds, Pans and dams. A Manual on Planning , Design , construction and Maintenance ; Technical Handbook No. 42.
Rettermeier,K.,Nilkens,B.,Falkenhagen,B.,Kongeter,J.,2001. New Developments in Dam
Safety –Feasibility Evaluation on Risk Assessment. Institute of Hydraulic Engineering and Water Resources Management ,Aachen University of Technology , Aachen, Germany.
Saunyama, T., 2005. Estimation of Small Reservoir Storage Capacities in Limpopo River Basin
Using Geographical Information Systems (GIS) and Remotely Sensed Surface Areas: A Case Of Mzingwane Catchment. MSc Thesis, Department of Civil Engineering, University of Zimbabwe.
Shaw, D.N, 1977. A guide to design and construction of medium sized earth dams in Zimbabwe. Government of Zimbabwe, Harare Zimbabwe.

The Development of a Risk-of-Failure Evaluation Tool for Small Dams in Mzingwane Catchment.
Ngonidzashe. L Mufute Masters in IWRM June,2007
55
Sithole, P. N., Senzanje, A., 2006. A Socio-Economic Study On Small Reservoir Use, Management and Institutional Issues in Avoca Communal Lands, Insiza District, Gwanda, Limpopo Basin, Zimbabwe. CPWF PN46-Small Reservoir.
WEDC, 2006.Small Earth Dams. Loughborough University Leicestershire.
��������������� �������������� ����� ��� �������������� ������������� ����� (Accessed on 21 October 2006)
Smith ,M.J.,1981.Soil Mechanics ,Fourth Edition. Longman Singapore Publishers Singapore. Soil Science and Agricultural Engineering (SSAE), 2007.University of Zimbabwe (UZ) Student
Soil Physics Practical Handout. Unpublished. USA Government (United States Department of the Interior Bureau of Reclamation),1997.
Design of Small Dams. Zimbabwe Water Act of 1998. Government Printers, Harare, Zimbabwe. ZINWA (Zimbabwe National Water Authority), 2007. File Records on ZINWA Dams.
Unpublished.

The Development of a Risk-of-Failure Evaluation Tool for Small Dams in Mzingwane Catchment.
Ngonidzashe. L Mufute Masters in IWRM June,2007
56
APPENDICES Appendix 1 Interview Questions
A.1.1 Questions Asked to DDF Officials) What is your policy role/mandate in small dams in Zimbabwe? What is your actual role in small dams maintenance and rehabilitation? What are the design, construction and maintenance guidelines that are used by your organisation on its work on small dams? What is the role of communities in the management and maintenance of small dams? Could you please explain the hand over process of management of small dams to the communities? Do farmers/communities approach you when they want to construct small dams and is this mandatory? Do NGOs approach you in siting, designing and construction and maintenance of small dams? What is the procedure that should be followed by anyone who would like to construct small dams in Zimbabwe? What are the problems that you encounter in your work on small dams? A.1.2 Questions Posed to NGO Officials What is your role in small dams? Can you please explain the steps that you go through from feasibility studies to the point you hand over a small dam to the community? Who are the stakeholders that you liaise with in your work in small dams and how do you liaise with them? What are the problems that you encounter in your work and in liaising with other stakeholders in small dams? A.1.3 Questions for Community Members The questions were asked to traditional leaders, councillors, VIDCO chairs, and or elderly community members in a particular area where a dam is located What is your role in the management of small dams? What are the activities that you carry out in the management of small dams? Is there a dam committee for this dam? When was this dam constructed and by who? (Where information is not available on the dam wall) What was your role in the construction of the dam? Has the dam ever been repaired or breached, if so when? Is DDF involved the management and maintenance of small dams in this area? In your view how is this dam affected by siltation? What are the problems that you encounter in trying to manage or maintain the small dams?
The Development of a Risk-of-Failure Evaluation Tool for Small Dams in Mzingwane Catchment.
Ngonidzashe. L Mufute Masters in IWRM June,2007
57
Appendix 2 Rapid Assessment Results Summary Table A.1 Summary of Rapid Assessment Results
Characteristic Description Present Not present Un Wanted
Seepage on embankment
*3 41
Minor Moderate Severe Cracking (Embankment) 1
Minor Moderate Severe Crest Depressions (Due To Erosion)
26 12 1
Present on Spillway
Present on embankment
Present on embankment/train wall joint
Not present Sinkholes
2 1 Stable Not stable Stability 44 Minor/limited Moderate Extensive Severe/Massive Erosion 14 19 9 2 Minor Moderate Extensive Severe/Massive No
Scarping Scarping
10 15 9 8 2 Little or no Sparse Dense Very Dense Vegetative
growth (Trees) 15 13 11 5 No mounds Few Several Many With
huge mounds
Termite Mounds /Animal burrows 5 9 13 17 7
Present on upslope
Not present Present on both slopes
Presence of riprap
26 15 3 Good Fair Satisfactory Bad Condition of
riprap 1 7 8 10 Fence Removed
No fence Partly in place/ needs attention
Ok Other type
Fencing
20 20 3 1 1 Observed Not
observed Other Piping
1 43 Present Not present Masonry section as
spillway Presence of
Emergency spillways 42 2 Overall Good Fair Satisfactory Poor Bad
The Development of a Risk-of-Failure Evaluation Tool for Small Dams in Mzingwane Catchment.
Ngonidzashe. L Mufute Masters in IWRM June,2007
58
condition of spillway
2 4 20 11 7
Minor Moderate Serious Spillway Blockages 37 5 2
Present Not present Presence of toe drains 37 7
Good Fair Satisfactory Bad Soil types 44
Micro Catchment
Good Fair Satisfactory Less than Satisfactory
Poor
1 7 29 6 1 Very High High Moderate Low Siltation risk 4 7 24 9 On the Down slope
On the Up slope
Without outlet Embankment Outlet
12 1 Blocked Partially
blocked Not blocked but damaged/deteriorated
Minor damage / deterioration
Blocked outlets
2 1 5 5 Present Not present Foot path on
embankment 37 7 Limited Pronounced Extensive No Grazing Livestock
Grazing on embankment
8 22 11 3
Poor/ Limited Satisfactory Fair Good Grass Cover 7 29 6 2 Present Not present Substantial
D/stream seepage
2 42
Breached, not repaired
Breached, repaired once
Breached, repaired more than once
Spillway Breaching
3 1 2 Breached, not repaired
Breached and reconstructed
Breached, repaired more than once, breached again
Dam wall Breaching
2 2 Due to spillway breaching
Due to embankment breaching
Due to Siltation Failed dams not holding water
1 2 1 (*The number indicates the number of dams affected by the deficiency)
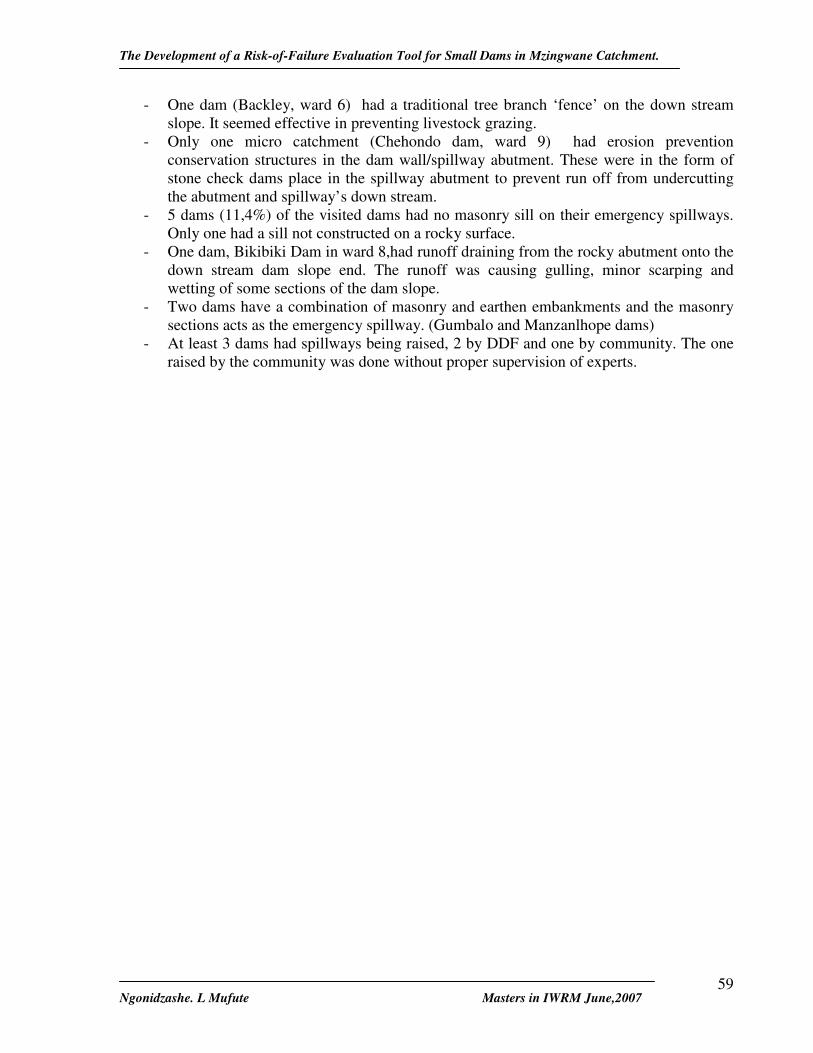
The Development of a Risk-of-Failure Evaluation Tool for Small Dams in Mzingwane Catchment.
Ngonidzashe. L Mufute Masters in IWRM June,2007
59
- One dam (Backley, ward 6) had a traditional tree branch ‘fence’ on the down stream slope. It seemed effective in preventing livestock grazing.
- Only one micro catchment (Chehondo dam, ward 9) had erosion prevention conservation structures in the dam wall/spillway abutment. These were in the form of stone check dams place in the spillway abutment to prevent run off from undercutting the abutment and spillway’s down stream.
- 5 dams (11,4%) of the visited dams had no masonry sill on their emergency spillways. Only one had a sill not constructed on a rocky surface.
- One dam, Bikibiki Dam in ward 8,had runoff draining from the rocky abutment onto the down stream dam slope end. The runoff was causing gulling, minor scarping and wetting of some sections of the dam slope.
- Two dams have a combination of masonry and earthen embankments and the masonry sections acts as the emergency spillway. (Gumbalo and Manzanlhope dams)
- At least 3 dams had spillways being raised, 2 by DDF and one by community. The one raised by the community was done without proper supervision of experts.
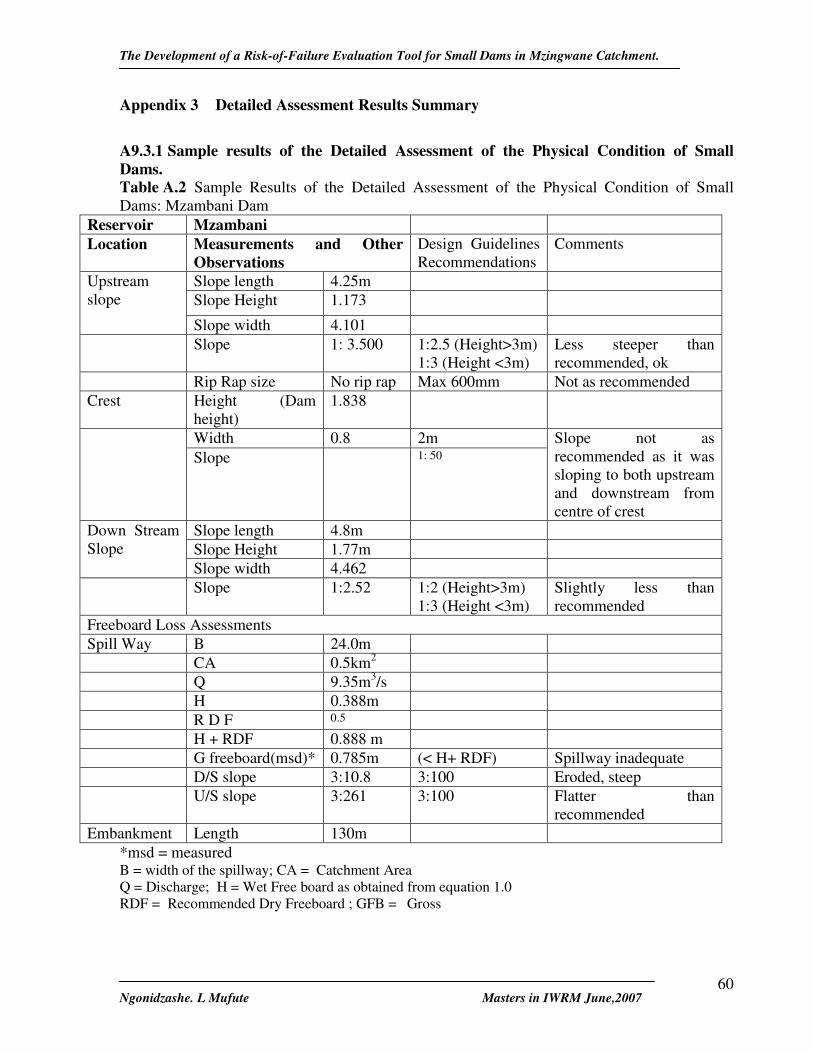
The Development of a Risk-of-Failure Evaluation Tool for Small Dams in Mzingwane Catchment.
Ngonidzashe. L Mufute Masters in IWRM June,2007
60
Appendix 3 Detailed Assessment Results Summary
A9.3.1 Sample results of the Detailed Assessment of the Physical Condition of Small Dams. Table A.2 Sample Results of the Detailed Assessment of the Physical Condition of Small Dams: Mzambani Dam
Reservoir Mzambani Location Measurements and Other
Observations Design Guidelines Recommendations
Comments
Slope length 4.25m Slope Height 1.173
Upstream slope Slope width 4.101 Slope 1: 3.500 1:2.5 (Height>3m)
1:3 (Height <3m) Less steeper than recommended, ok
Rip Rap size No rip rap Max 600mm Not as recommended Crest Height (Dam
height) 1.838
Width 0.8 2m Slope 1: 50
Slope not as recommended as it was sloping to both upstream and downstream from centre of crest
Slope length 4.8m Slope Height 1.77m
Down Stream Slope
Slope width 4.462 Slope 1:2.52 1:2 (Height>3m)
1:3 (Height <3m) Slightly less than recommended
Freeboard Loss Assessments Spill Way B 24.0m CA 0.5km2 Q 9.35m3/s H 0.388m R D F 0.5 H + RDF 0.888 m G freeboard(msd)* 0.785m (< H+ RDF) Spillway inadequate D/S slope 3:10.8 3:100 Eroded, steep U/S slope 3:261 3:100 Flatter than
recommended Embankment Length 130m
*msd = measured B = width of the spillway; CA = Catchment Area Q = Discharge; H = Wet Free board as obtained from equation 1.0 RDF = Recommended Dry Freeboard ; GFB = Gross
The Development of a Risk-of-Failure Evaluation Tool for Small Dams in Mzingwane Catchment.
Ngonidzashe. L Mufute Masters in IWRM June,2007
61
Soils Blackish Sandy clay Soils are within the recommended class. See table 5.2 for Consistency and Sieve Analysis test results Adequacy of compaction analysis No slides, scarping, toe bulging and arc–shaped cracks on upstream, crest and downstream slopes of the embankment. Therefore Compaction was deemed adequate. Seepage No seepage was observed. No seepage toe was observed Micro Catchment analysis and siltation There are few patches of bare ground around the dam covering about 20% of surface area on the sides and around throw back. Gulling was evident around the dam. The area around the reservoir has relatively dense tree cover. About 30% of dam area is covered by short grazed grass which covers the ground like a carpet. Reservoir not seriously threatened by siltation as less than 5% of reservoir area showed signs of siltation. Reeds and tall grass on the area where river enters dam could also be trapping some silt, preventing it from entering reservoir.
9.3.2 Laboratory Soil Analysis Results The summarized results are in table 5.2.

The Development of a Risk-of-Failure Evaluation Tool for Small Dams in Mzingwane Catchment.
Ngonidzashe. L Mufute Masters in IWRM June,2007
62
Table A.3 Detailed Assessment of the Physical Condition of Small Dams- Results : Overall Summary Location on Dam Reservoir Dewa Manzanlhope Shagwe Avoca Mzambani Chobukwa Dube Jubele Ngwabi Magelimani
Slope 1:2.1 1:2.4 - - 1:3.5 - 1:1.9 1:1.29 1:3.5 Riprap size (mm)
50-500 50-400 100-500 50-500 No riprap 50-450 100-400 No riprap 100-300 Upstream Slope
Riprap Condition
Very bad Fair Bad Satisfactory
- Bad Fair - Fair
Height (m)
5.9 1.56 (earthen) 6 (masonry)
5.0 6.6 1.8 4.3 (masonry)
2.3 1.7 4.3
Width 0.6 2.5 (earthen) 5.3 2.2 0.8 - 1 1.5 2.2 Slope 1:38 1:37 -*** -*** -*** - -*** -*** 1:157***
Crest
Direction of slope
Not as rec As rec. Not as rec. Not as rec. Not as rec. - Not as rec. Not as rec. Not as rec.
Down Stream Slope
Slope 1:2.1 1:3 1:2.3 1:1.8 1:2.5 - 1:1.8 1:2.3 1:3.3
Calc.G.F.B 1.907 1.38 1.793 1.2075 0.888 2.043 1.28 0.909 1.348 Msd G.F.B 1.72 1.056 1.532 1.249 0.785 0.829 1.018 0.186 1.382
Freeboard Loss / Adequacy (m)
Adequacy S/tly.Inadequate
Inadequate Slightly In adequate
Adequate Slightly Inadequate
Inadequate S/tly in adequate
In adequate
Adequate
U/S slope 3:20 N/A Not msd 3:108 3:261 N/A 3:600 Eroded 3:208 Spillway slopes D/S slope 3:49 N/A Eroded 1:625 3:11 N/A 3:283 Eroded Eroded
unwanted Seepage
Not present
Present Present Not present
Not present Not present Not present Not present
Not present
Soils SM-SC SC SC SM-SC SC SC SC SM-SC SC Micro Catchment Condition
L/ than satisfactory
Satisfactory Satisfactory
L/ than satisfactory
Fair Poor Fair Fair Less than satisfactory
Area affected 20% 14% 16.7% 20% 5% 70% 1% 11.1% 20% Siltation Risk Risk High Moderate Moderate High Low Very high Low Moderate High
Compaction Ok Ok Ok Ok Ok Ok Ok Ok Ok * Present on the masonry section ,:**Present on the ; *** Sloping towards both upstream slope and down stream slope Calc.G.F.B = Calculated Gross Free Board ; Msd G.F.B = Measured Gross Free Board ; Rec. = Recommended
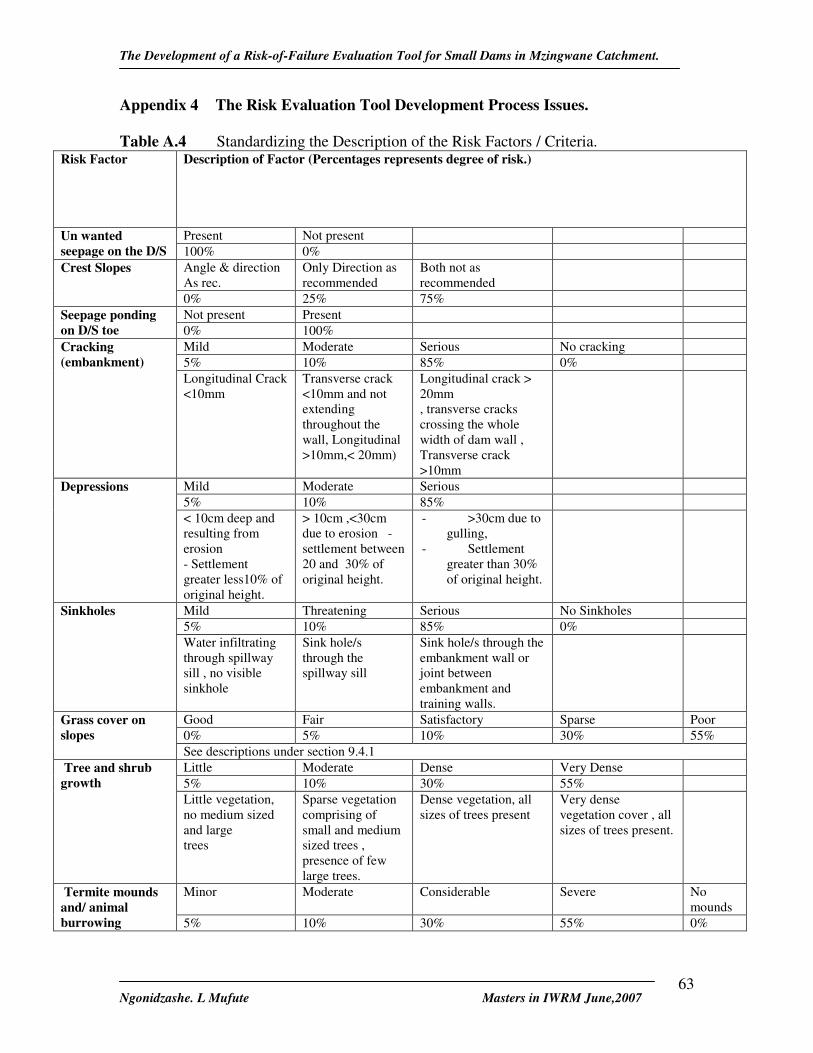
The Development of a Risk-of-Failure Evaluation Tool for Small Dams in Mzingwane Catchment.
Ngonidzashe. L Mufute Masters in IWRM June,2007
63
Appendix 4 The Risk Evaluation Tool Development Process Issues. Table A.4 Standardizing the Description of the Risk Factors / Criteria.
Risk Factor Description of Factor (Percentages represents degree of risk.)
Present Not present Un wanted seepage on the D/S 100% 0%
Angle & direction As rec.
Only Direction as recommended
Both not as recommended
Crest Slopes
0% 25% 75% Not present Present Seepage ponding
on D/S toe 0% 100% Mild Moderate Serious No cracking 5% 10% 85% 0%
Cracking (embankment)
Longitudinal Crack <10mm
Transverse crack <10mm and not extending throughout the wall, Longitudinal >10mm,< 20mm)
Longitudinal crack > 20mm , transverse cracks crossing the whole width of dam wall , Transverse crack >10mm
Mild Moderate Serious 5% 10% 85%
Depressions
< 10cm deep and resulting from erosion - Settlement greater less10% of original height.
> 10cm ,<30cm due to erosion - settlement between 20 and 30% of original height.
- >30cm due to gulling,
- Settlement greater than 30% of original height.
Mild Threatening Serious No Sinkholes 5% 10% 85% 0%
Sinkholes
Water infiltrating through spillway sill , no visible sinkhole
Sink hole/s through the spillway sill
Sink hole/s through the embankment wall or joint between embankment and training walls.
Good Fair Satisfactory Sparse Poor 0% 5% 10% 30% 55%
Grass cover on slopes
See descriptions under section 9.4.1 Little Moderate Dense Very Dense 5% 10% 30% 55%
Tree and shrub growth
Little vegetation, no medium sized and large trees
Sparse vegetation comprising of small and medium sized trees , presence of few large trees.
Dense vegetation, all sizes of trees present
Very dense vegetation cover , all sizes of trees present.
Minor Moderate Considerable Severe No mounds
Termite mounds and/ animal burrowing 5% 10% 30% 55% 0%
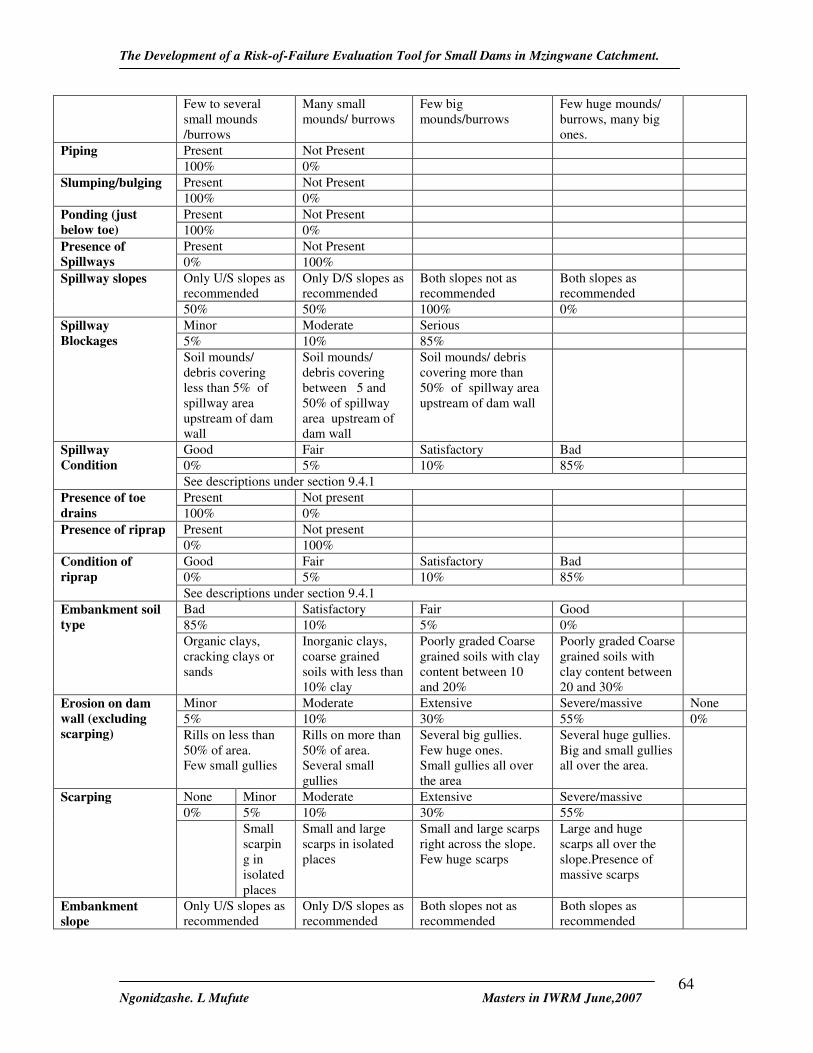
The Development of a Risk-of-Failure Evaluation Tool for Small Dams in Mzingwane Catchment.
Ngonidzashe. L Mufute Masters in IWRM June,2007
64
Few to several small mounds /burrows
Many small mounds/ burrows
Few big mounds/burrows
Few huge mounds/ burrows, many big ones.
Present Not Present Piping 100% 0% Present Not Present Slumping/bulging 100% 0% Present Not Present Ponding (just
below toe) 100% 0% Present Not Present Presence of
Spillways 0% 100% Only U/S slopes as recommended
Only D/S slopes as recommended
Both slopes not as recommended
Both slopes as recommended
Spillway slopes
50% 50% 100% 0% Minor Moderate Serious 5% 10% 85%
Spillway Blockages
Soil mounds/ debris covering less than 5% of spillway area upstream of dam wall
Soil mounds/ debris covering between 5 and 50% of spillway area upstream of dam wall
Soil mounds/ debris covering more than 50% of spillway area upstream of dam wall
Good Fair Satisfactory Bad 0% 5% 10% 85%
Spillway Condition
See descriptions under section 9.4.1 Present Not present Presence of toe
drains 100% 0% Present Not present Presence of riprap 0% 100% Good Fair Satisfactory Bad 0% 5% 10% 85%
Condition of riprap
See descriptions under section 9.4.1 Bad Satisfactory Fair Good 85% 10% 5% 0%
Embankment soil type
Organic clays, cracking clays or sands
Inorganic clays, coarse grained soils with less than 10% clay
Poorly graded Coarse grained soils with clay content between 10 and 20%
Poorly graded Coarse grained soils with clay content between 20 and 30%
Minor Moderate Extensive Severe/massive None 5% 10% 30% 55% 0%
Erosion on dam wall (excluding scarping) Rills on less than
50% of area. Few small gullies
Rills on more than 50% of area. Several small gullies
Several big gullies. Few huge ones. Small gullies all over the area
Several huge gullies. Big and small gullies all over the area.
None Minor Moderate Extensive Severe/massive 0% 5% 10% 30% 55%
Scarping
Small scarping in isolated places
Small and large scarps in isolated places
Small and large scarps right across the slope. Few huge scarps
Large and huge scarps all over the slope.Presence of massive scarps
Embankment slope
Only U/S slopes as recommended
Only D/S slopes as recommended
Both slopes not as recommended
Both slopes as recommended
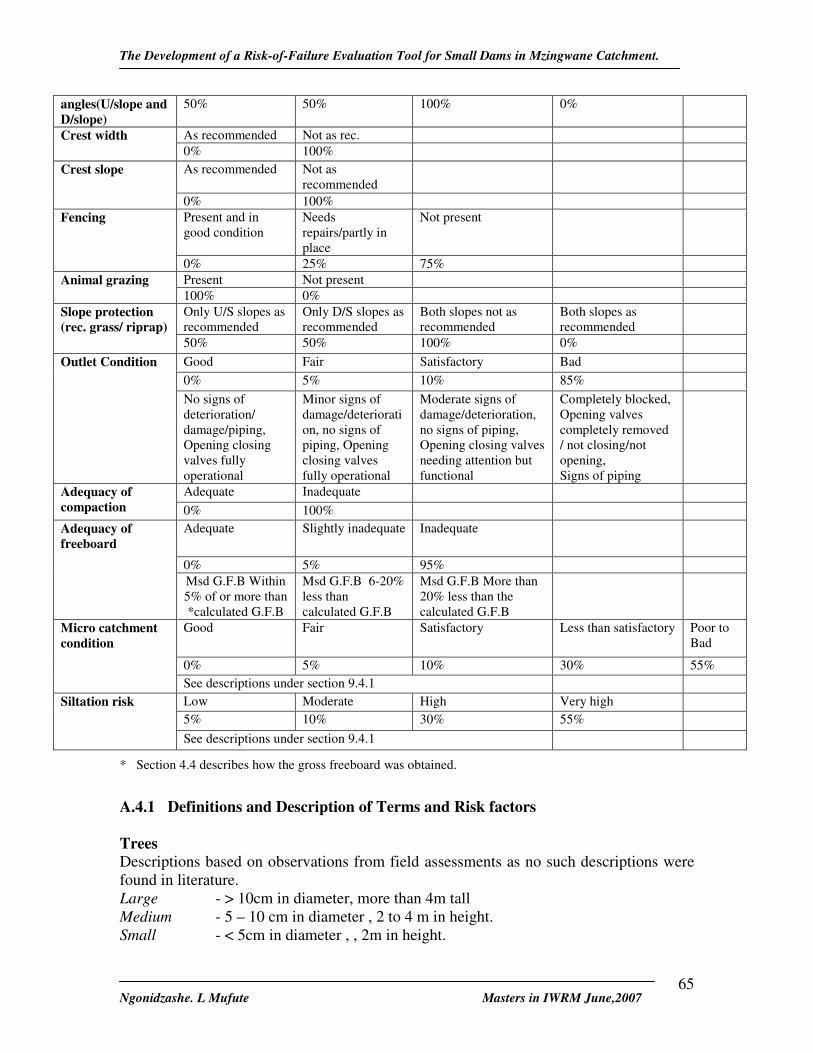
The Development of a Risk-of-Failure Evaluation Tool for Small Dams in Mzingwane Catchment.
Ngonidzashe. L Mufute Masters in IWRM June,2007
65
angles(U/slope and D/slope)
50% 50% 100% 0%
As recommended Not as rec. Crest width 0% 100% As recommended Not as
recommended Crest slope
0% 100% Present and in good condition
Needs repairs/partly in place
Not present Fencing
0% 25% 75% Present Not present Animal grazing 100% 0% Only U/S slopes as recommended
Only D/S slopes as recommended
Both slopes not as recommended
Both slopes as recommended
Slope protection (rec. grass/ riprap)
50% 50% 100% 0% Good Fair Satisfactory Bad 0% 5% 10% 85%
Outlet Condition
No signs of deterioration/ damage/piping, Opening closing valves fully operational
Minor signs of damage/deterioration, no signs of piping, Opening closing valves fully operational
Moderate signs of damage/deterioration, no signs of piping, Opening closing valves needing attention but functional
Completely blocked, Opening valves completely removed / not closing/not opening, Signs of piping
Adequate Inadequate Adequacy of compaction 0% 100%
Adequate Slightly inadequate Inadequate
0% 5% 95%
Adequacy of freeboard
Msd G.F.B Within 5% of or more than *calculated G.F.B
Msd G.F.B 6-20% less than calculated G.F.B
Msd G.F.B More than 20% less than the calculated G.F.B
Good Fair Satisfactory Less than satisfactory Poor to Bad
0% 5% 10% 30% 55%
Micro catchment condition
See descriptions under section 9.4.1 Low Moderate High Very high 5% 10% 30% 55%
Siltation risk
See descriptions under section 9.4.1
* Section 4.4 describes how the gross freeboard was obtained.
A.4.1 Definitions and Description of Terms and Risk factors Trees Descriptions based on observations from field assessments as no such descriptions were found in literature. Large - > 10cm in diameter, more than 4m tall Medium - 5 – 10 cm in diameter , 2 to 4 m in height. Small - < 5cm in diameter , , 2m in height.
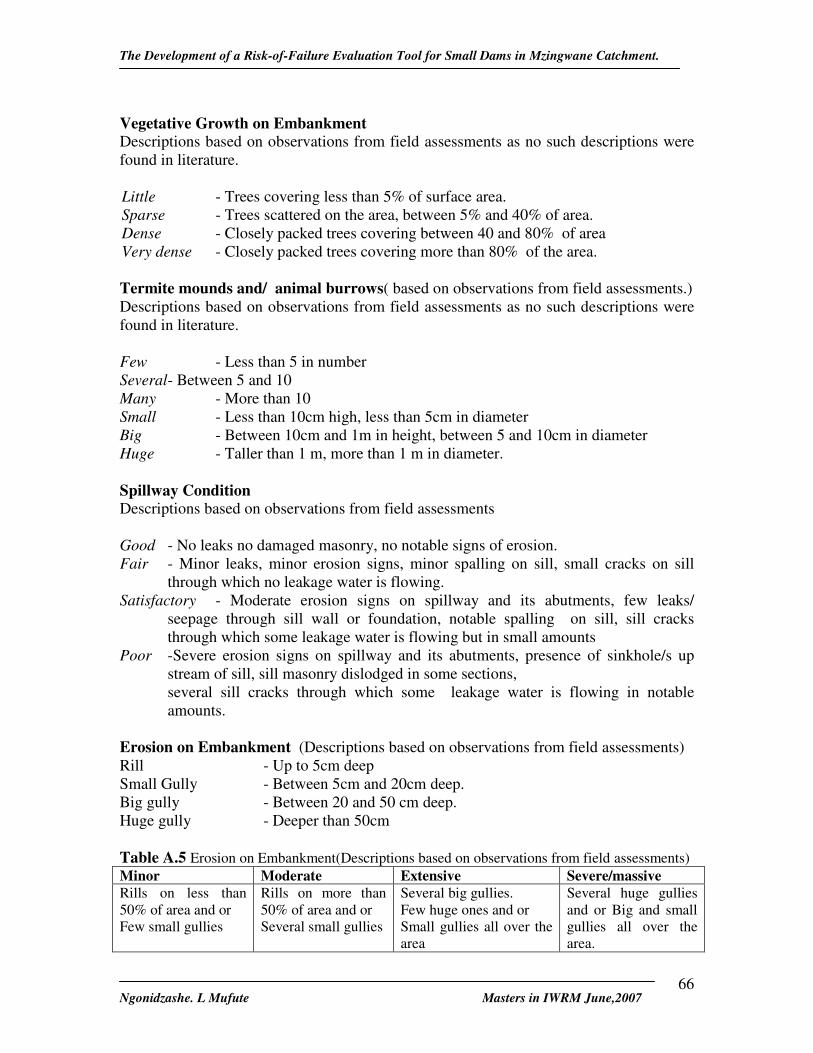
The Development of a Risk-of-Failure Evaluation Tool for Small Dams in Mzingwane Catchment.
Ngonidzashe. L Mufute Masters in IWRM June,2007
66
Vegetative Growth on Embankment Descriptions based on observations from field assessments as no such descriptions were found in literature. Little - Trees covering less than 5% of surface area. Sparse - Trees scattered on the area, between 5% and 40% of area. Dense - Closely packed trees covering between 40 and 80% of area Very dense - Closely packed trees covering more than 80% of the area. Termite mounds and/ animal burrows( based on observations from field assessments.) Descriptions based on observations from field assessments as no such descriptions were found in literature. Few - Less than 5 in number Several- Between 5 and 10 Many - More than 10 Small - Less than 10cm high, less than 5cm in diameter Big - Between 10cm and 1m in height, between 5 and 10cm in diameter Huge - Taller than 1 m, more than 1 m in diameter. Spillway Condition Descriptions based on observations from field assessments Good - No leaks no damaged masonry, no notable signs of erosion. Fair - Minor leaks, minor erosion signs, minor spalling on sill, small cracks on sill
through which no leakage water is flowing. Satisfactory - Moderate erosion signs on spillway and its abutments, few leaks/
seepage through sill wall or foundation, notable spalling on sill, sill cracks through which some leakage water is flowing but in small amounts
Poor -Severe erosion signs on spillway and its abutments, presence of sinkhole/s up stream of sill, sill masonry dislodged in some sections, several sill cracks through which some leakage water is flowing in notable amounts.
Erosion on Embankment (Descriptions based on observations from field assessments) Rill - Up to 5cm deep Small Gully - Between 5cm and 20cm deep. Big gully - Between 20 and 50 cm deep. Huge gully - Deeper than 50cm Table A.5 Erosion on Embankment(Descriptions based on observations from field assessments) Minor Moderate Extensive Severe/massive Rills on less than 50% of area and or Few small gullies
Rills on more than 50% of area and or Several small gullies
Several big gullies. Few huge ones and or Small gullies all over the area
Several huge gullies and or Big and small gullies all over the area.
The Development of a Risk-of-Failure Evaluation Tool for Small Dams in Mzingwane Catchment.
Ngonidzashe. L Mufute Masters in IWRM June,2007
67
Scarping (Descriptions based on observations from field assessments) Small - Less than 30cm deep. Big/ large - Between 30 and 50cm deep Huge - Between 50cm and 1m deep Massive - more than 1m deep. Embankment Slopes Considered to be as recommended if the figure is within 5% of the recommended value. Adequacy of Compaction (Based on inspection guidelines such as FEMA,(1987)and field observations.) Compaction of soil on the embankment is taken as adequate if no signs of bulging are noted on the toes of slopes, no excessive settlement is noted especially on isolated points on the crest. Adequacy of Compaction also taken to infer slope stability. Micro Catchment Issues Definition of Micro Catchment Micro catchment is taken as are within 200m radius of the reservoir measured from the full supply level.. This was arrived at after noting that 200m was noted to be the average maximum distance from which human activities around reservoirs such as gardening and brick making are usually located away from the reservoir. (Sithole and Senzanje, 2006: p36) Relief of Micro Catchment (Guided by HR Walling ford ‘s Methodology for estimating risk of soil erosion CARE Zimbabwe, 2002) Steep - average slope greater than 30% Hilly - 10-30% slope, hills cover more than 50% of micro catchment Rolling -5-10% slope, hills cover less than 50% of micro catchment Relatively flat land - slope between 0 and 5%. Vegetation Cover Around Micro Catchment Micro Catchment (Guided by HR Walling ford ‘s Methodology for estimating risk of soil erosion CARE Zimbabwe, 2002) Bad -Little effective plant cover, ground bare or very sparse cover over 80% of micro
catchment Poor -Less than 30% of micro catchment is under good grass cover or forest cover Less than satisfactory - 30-40% of micro catchment is under good grass cover or forest
cover Satisfactory -41-50% of micro catchment is under good grass cover or forest
cover Fair -51-60% of micro catchment is under good grass cover or forest
cover
The Development of a Risk-of-Failure Evaluation Tool for Small Dams in Mzingwane Catchment.
Ngonidzashe. L Mufute Masters in IWRM June,2007
68
Good - More than 60% of micro catchment is under good grass cover or forest cover
Erosion Signs in Micro Catchment (Guided by HR Walling ford ‘s Methodology for estimating risk of soil erosion CARE Zimbabwe, 2002) Minor - Few actively eroding gullies draining directly into dam and /or
watercourses; little undercutting of river banks along main water courses.
Moderate - Some actively eroding gullies draining directly into dam and /or watercourses; moderate undercutting of riverbanks along main watercourses.
Extensive -Many actively eroding gullies draining directly into dam and /or watercourses ; active undercutting of riverbanks along main watercourses
Grazing in the Micro Catchment (Based on Field observations) Minimal - Little signs of grazing on the grass. Moderate - Clearly visible signs of grazing, but grass not grazed to the
ground level. Extensive - Grass grazed all over the micro catchment, grass grazed to the
ground level in some places Severe - Grass grazed all over the micro catchment, grass grazed to the
ground level in most places. Micro Catchment Condition (Based on field observations and Principles used in the HR Wallingford’s Methodology for estimating soil erosion risk) Satisfactory - Moderate grazing, satisfactory vegetation cover, no gardens and fields
within 30m of watercourses, some fields within the micro catchment, moderate signs of erosion
Less than satisfactory - Extensive grazing, satisfactory vegetation cover, and or few gardens and no fields within 30m of watercourses, and or moderate signs of erosion
Poor - Extensive grazing, poor vegetation cover, few gardens and fields within 30m of watercourses, extensive signs of erosion
Bad - Severe grazing, bad vegetation cover, many gardens and some fields within 30m of watercourses, extensive to severe signs of erosion
Siltation risk (Based on Visual observations on assessed dams in the field and literature on effects of siltation on reservoirs such as CARE Zimbabwe,(2002), Page 74)
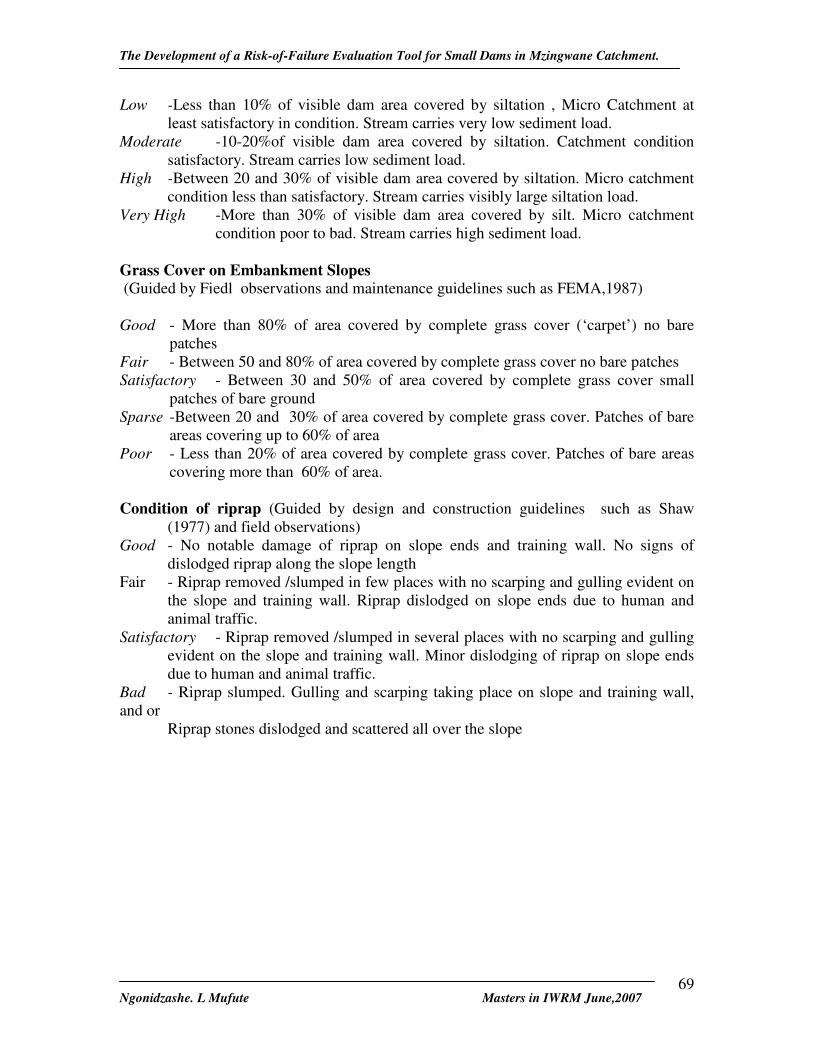
The Development of a Risk-of-Failure Evaluation Tool for Small Dams in Mzingwane Catchment.
Ngonidzashe. L Mufute Masters in IWRM June,2007
69
Low -Less than 10% of visible dam area covered by siltation , Micro Catchment at least satisfactory in condition. Stream carries very low sediment load.
Moderate -10-20%of visible dam area covered by siltation. Catchment condition satisfactory. Stream carries low sediment load.
High -Between 20 and 30% of visible dam area covered by siltation. Micro catchment condition less than satisfactory. Stream carries visibly large siltation load.
Very High -More than 30% of visible dam area covered by silt. Micro catchment condition poor to bad. Stream carries high sediment load.
Grass Cover on Embankment Slopes (Guided by Fiedl observations and maintenance guidelines such as FEMA,1987) Good - More than 80% of area covered by complete grass cover (‘carpet’) no bare
patches Fair - Between 50 and 80% of area covered by complete grass cover no bare patches Satisfactory - Between 30 and 50% of area covered by complete grass cover small
patches of bare ground Sparse -Between 20 and 30% of area covered by complete grass cover. Patches of bare
areas covering up to 60% of area Poor - Less than 20% of area covered by complete grass cover. Patches of bare areas
covering more than 60% of area. Condition of riprap (Guided by design and construction guidelines such as Shaw
(1977) and field observations) Good - No notable damage of riprap on slope ends and training wall. No signs of
dislodged riprap along the slope length Fair - Riprap removed /slumped in few places with no scarping and gulling evident on
the slope and training wall. Riprap dislodged on slope ends due to human and animal traffic.
Satisfactory - Riprap removed /slumped in several places with no scarping and gulling evident on the slope and training wall. Minor dislodging of riprap on slope ends due to human and animal traffic.
Bad - Riprap slumped. Gulling and scarping taking place on slope and training wall, and or
Riprap stones dislodged and scattered all over the slope
The Development of a Risk-of-Failure Evaluation Tool for Small Dams in Mzingwane Catchment.
Ngonidzashe. L Mufute Masters in IWRM June,2007
70
A.4.2 Ranking of Factors/Criteria Cause effect diagrams were used to determine the relationships between the factors, their causes and effects. The cause effect relations were used to determine the levels of each factor in relation to the main problem dam of failure/ breaching. Four failure modes or processes that results in dam failure were identified through brainstorming. As result, 4 cause-effect relation diagrams were determined and as shown in the (A.1 to A.4. An example of how the cause effect diagrams were formulated and levels determined is now given: Referring to figure A.1 , Breaching can result from reduced spillway size (at level 1). Reduced spillway size in turn resulted from siltation (level 2). Siltation was as a result of erosion (level 3). Erosion in turn, was caused by poor catchment condition (level 4). At the same time, Dam failure can result from siltation (level 1). The Siltation resulted from erosion (level 2) which in turn resulted from poor micro catchment condition (level 3).
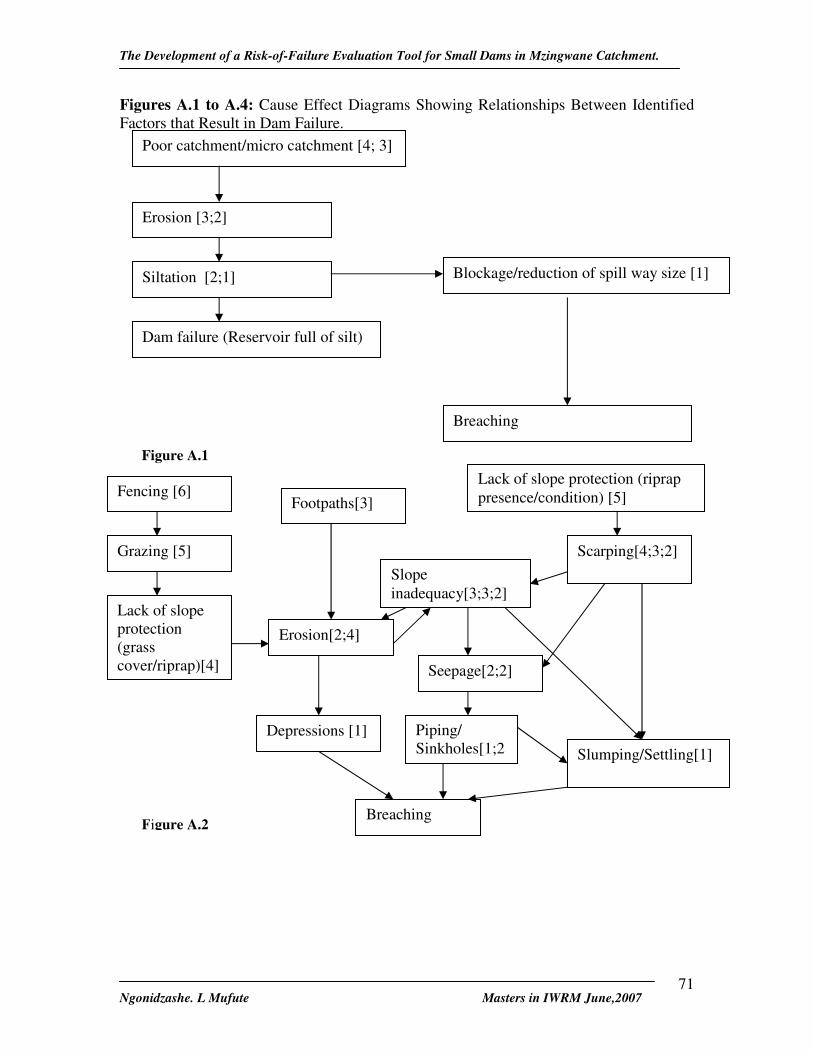
The Development of a Risk-of-Failure Evaluation Tool for Small Dams in Mzingwane Catchment.
Ngonidzashe. L Mufute Masters in IWRM June,2007
71
Figures A.1 to A.4: Cause Effect Diagrams Showing Relationships Between Identified Factors that Result in Dam Failure.
Blockage/reduction of spill way size [1]
Dam failure (Reservoir full of silt)
Breaching
Siltation [2;1]
Erosion [3;2]
Poor catchment/micro catchment [4; 3]
Figure A.1
Lack of slope protection (grass cover/riprap)[4]
Fencing [6]
Grazing [5]
Erosion[2;4]
Slope inadequacy[3;3;2]
Depressions [1]
Breaching
Piping/ Sinkholes[1;2]
Scarping[4;3;2]
Slumping/Settling[1]
Footpaths[3]
Seepage[2;2]
Lack of slope protection (riprap presence/condition) [5]
Figure A.2

The Development of a Risk-of-Failure Evaluation Tool for Small Dams in Mzingwane Catchment.
Ngonidzashe. L Mufute Masters in IWRM June,2007
72
Blockages [2]
Inadequate/lack of spillway [1]
Soil type[3;2]
Seepage Toes {3}
Breaching
Seepage [2]
Inadequate compaction [2]
Spillway Condition [1]
Figure A.3
Settling/Slumping [1]
Ponding [2]
Trees/ shrubs [3;4;5]
Crest width[3;4]
Piping [1;2]
Outlets condition [1;2;3;4] Sinkholes [2;3]
Termite mounds /burrows [3;4;5]
Cracks[3;4]
Soil type[3;4;5]
Breaching
Inadequate compaction [4;5]
Figure A.4
Slumping/Settling [1]
Seepage [2;3]

The Development of a Risk-of-Failure Evaluation Tool for Small Dams in Mzingwane Catchment.
Ngonidzashe. L Mufute Masters in IWRM June,2007
73
Table A.6 Determination of Weights Factor/Criteria Levels Average
level Weight Index
Weight
Trees and shrub growth 4 3 5 4 3 0.50 Soil type 4 3 3 2 5 3.4 3.6 0.60 Termite mounds/burrows 4 3 5 4 3 0.50 Inadequate compaction 4 2 5 3.67 3.33 0.56 Cracks 3 4 3.5 3.5 0.58 Crest width 3 4 3.5 3.5 0.58 Outlets condition 2 3 1 4 2.5 4.5 0.75 Unwanted seepage/Leakage(embankment)
2 2 2 2 2 5 0.83
Sinkholes 3 1 2 2 2 5 0.83 Piping 1 2 1 1,33 5.67 0.95 Fencing 6 6 1 0.17 Animal grazing 5 5 2 0.33 Grass cover 4 5 4.5 2.5 0.42 Rip rap presence/condition 4 5 4.5 2.5 0.42 Embankment Slopes 3 3 2 2.67 *4.33/3 0.24 Erosion 2 4 3 2 2.75 4.25 0.71 Foot paths 3 3 4 0.67 Depressions 1 1 6 1 Inadequate free board/spillway 1 1 6 1 Blockages 2 1 1.5 5.5 0.92 Lack of spillway 1 1 6 1 Spillway condition 1 1 1 6 1 Seepage toes 3 3 4 0.67 Slumping/bulging 1 1 1 1 6 1 Settling 1 1 1 1 1 6 1 Ponding 2 2 5 0.83 Scarping 4 3 2 3 4 0.67 Catchment condition 4 3 3.5 3.5 0.58 Siltation risk 3 1 2 5.5 0.92
* The slope weight was divided by 3 to cater for the contribution of 3 types of slopes (Upstream, crest and Down stream slope) their overall effect is added.
A.4.3 Determination of weights For each factor, all the levels on the cause effect diagrams were noted and recorded in columns 2 to 6 in table A.6. An average level was then computed from these. The higher the level means the further away the characteristic from breaching or dam failure therefore the lower the weight. From the case effect diagrams the highest level was six, that of fencing, therefore this was awarded the lowest weight of 1. The other weights of the levels were determined respectively as shown in the table A.7. Equation 2 was used to convert weight Indices into weights

The Development of a Risk-of-Failure Evaluation Tool for Small Dams in Mzingwane Catchment.
Ngonidzashe. L Mufute Masters in IWRM June,2007
74
Table A.7 Relationships between levels and weights. Level 1 2 3 4 5 6 Weight Index
6 5 4 3 2 1
Weight 1 0.83 0.67 0.50 0.33 0.17 Table A.8 Summary of Description of Catchment Characteristics in HR Wallingford’s Methodology for Estimating Risk of Soil Erosion. Adopted from CARE Zimbabwe, (2002)
Catchment characteristic
Description and erosion factor points allocated (in brackets)
Relief Steep (40) Hilly (30) Rolling (20) Flat (10) Soil Type and drainage
Very Poor (40) Poor (30) Moderate (20) Good (10)
Vegetation cover
Little (40) Fair (30) Good(20) Excellent (5)
Signs of erosion
Extreme (80) High (60) Normal (20) Low (0)

The Development of a Risk-of-Failure Evaluation Tool for Small Dams in Mzingwane Catchment.
Ngonidzashe. L Mufute Masters in IWRM June,2007
75
Appendix 5 Risk Based Approaches from Around the World 1. ANCOLD, Australia (Source: Defra,2002) Table A.9 ANCOLD’s guidelines used in the risk assessment approaches in Australia.
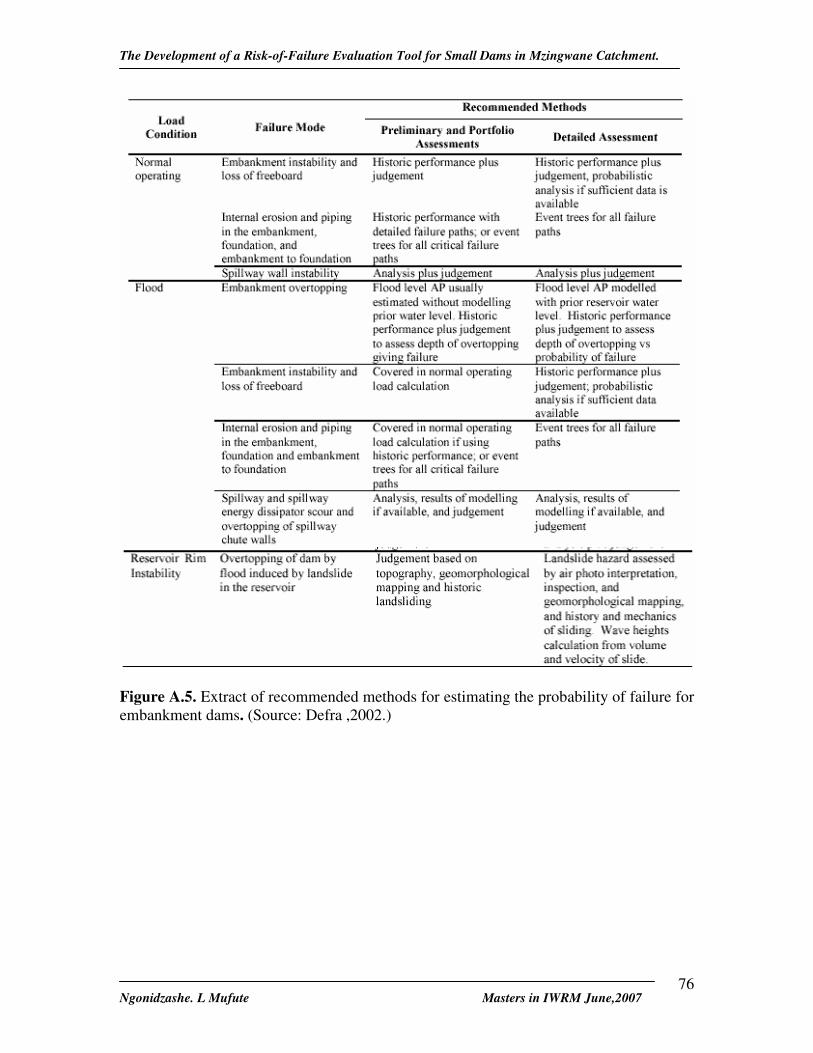
The Development of a Risk-of-Failure Evaluation Tool for Small Dams in Mzingwane Catchment.
Ngonidzashe. L Mufute Masters in IWRM June,2007
76
Figure A.5. Extract of recommended methods for estimating the probability of failure for embankment dams. (Source: Defra ,2002.)
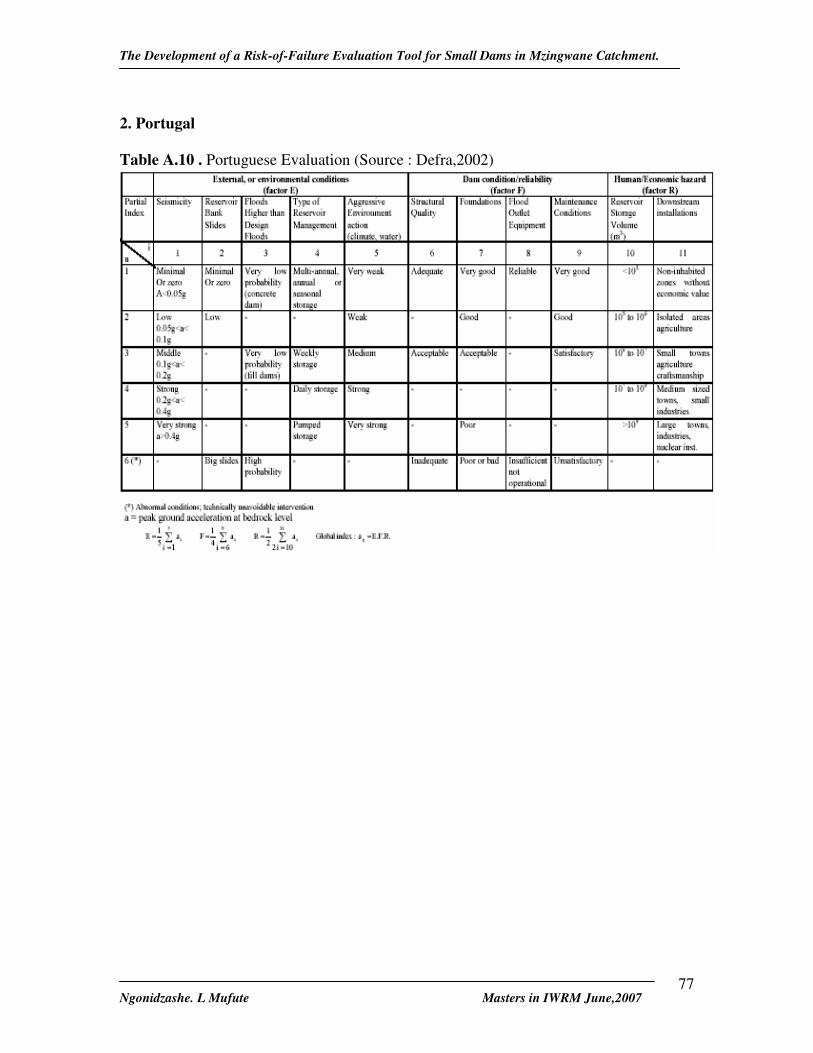
The Development of a Risk-of-Failure Evaluation Tool for Small Dams in Mzingwane Catchment.
Ngonidzashe. L Mufute Masters in IWRM June,2007
77
2. Portugal Table A.10 . Portuguese Evaluation (Source : Defra,2002)
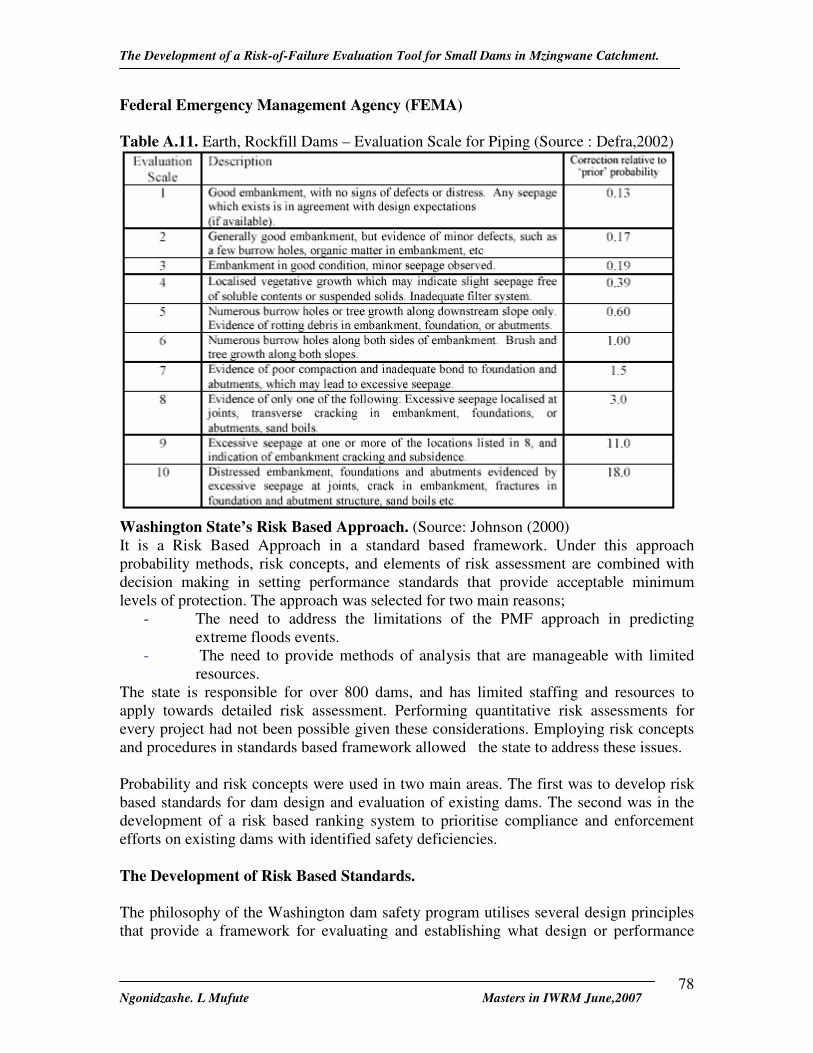
The Development of a Risk-of-Failure Evaluation Tool for Small Dams in Mzingwane Catchment.
Ngonidzashe. L Mufute Masters in IWRM June,2007
78
Federal Emergency Management Agency (FEMA) Table A.11. Earth, Rockfill Dams – Evaluation Scale for Piping (Source : Defra,2002)
Washington State’s Risk Based Approach. (Source: Johnson (2000) It is a Risk Based Approach in a standard based framework. Under this approach probability methods, risk concepts, and elements of risk assessment are combined with decision making in setting performance standards that provide acceptable minimum levels of protection. The approach was selected for two main reasons;
- The need to address the limitations of the PMF approach in predicting extreme floods events.
- The need to provide methods of analysis that are manageable with limited resources.
The state is responsible for over 800 dams, and has limited staffing and resources to apply towards detailed risk assessment. Performing quantitative risk assessments for every project had not been possible given these considerations. Employing risk concepts and procedures in standards based framework allowed the state to address these issues. Probability and risk concepts were used in two main areas. The first was to develop risk based standards for dam design and evaluation of existing dams. The second was in the development of a risk based ranking system to prioritise compliance and enforcement efforts on existing dams with identified safety deficiencies. The Development of Risk Based Standards. The philosophy of the Washington dam safety program utilises several design principles that provide a framework for evaluating and establishing what design or performance
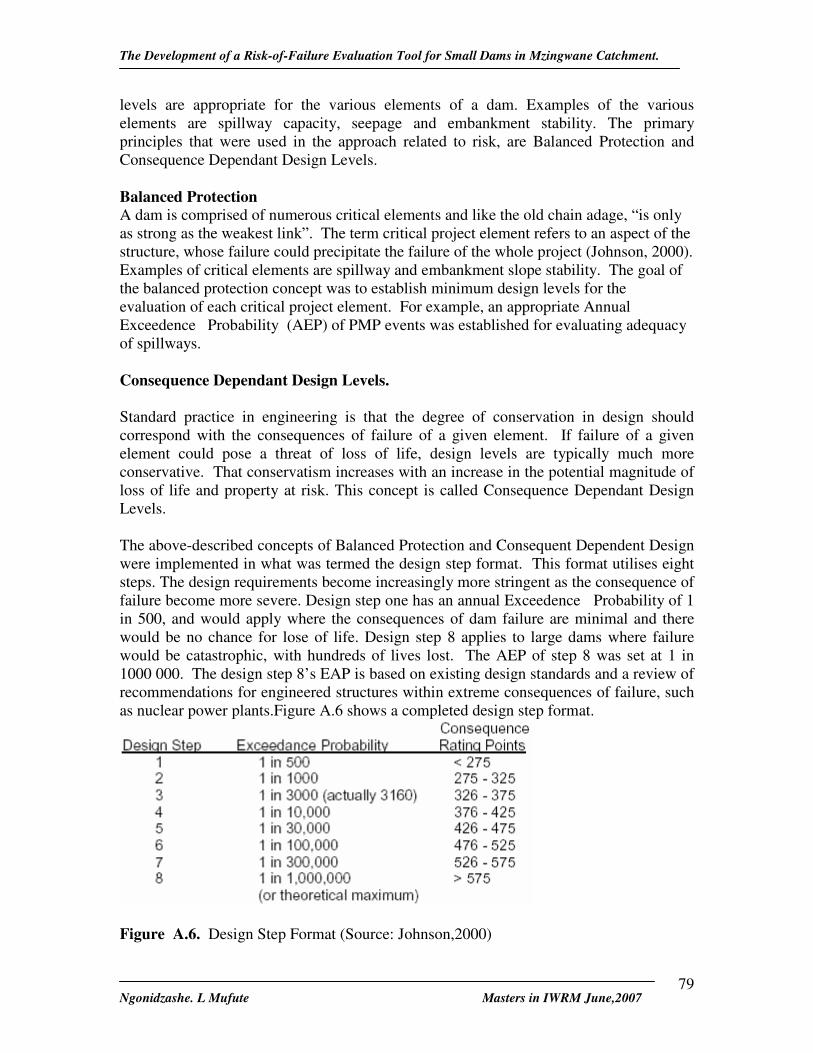
The Development of a Risk-of-Failure Evaluation Tool for Small Dams in Mzingwane Catchment.
Ngonidzashe. L Mufute Masters in IWRM June,2007
79
levels are appropriate for the various elements of a dam. Examples of the various elements are spillway capacity, seepage and embankment stability. The primary principles that were used in the approach related to risk, are Balanced Protection and Consequence Dependant Design Levels. Balanced Protection A dam is comprised of numerous critical elements and like the old chain adage, “is only as strong as the weakest link”. The term critical project element refers to an aspect of the structure, whose failure could precipitate the failure of the whole project (Johnson, 2000). Examples of critical elements are spillway and embankment slope stability. The goal of the balanced protection concept was to establish minimum design levels for the evaluation of each critical project element. For example, an appropriate Annual Exceedence Probability (AEP) of PMP events was established for evaluating adequacy of spillways. Consequence Dependant Design Levels. Standard practice in engineering is that the degree of conservation in design should correspond with the consequences of failure of a given element. If failure of a given element could pose a threat of loss of life, design levels are typically much more conservative. That conservatism increases with an increase in the potential magnitude of loss of life and property at risk. This concept is called Consequence Dependant Design Levels. The above-described concepts of Balanced Protection and Consequent Dependent Design were implemented in what was termed the design step format. This format utilises eight steps. The design requirements become increasingly more stringent as the consequence of failure become more severe. Design step one has an annual Exceedence Probability of 1 in 500, and would apply where the consequences of dam failure are minimal and there would be no chance for lose of life. Design step 8 applies to large dams where failure would be catastrophic, with hundreds of lives lost. The AEP of step 8 was set at 1 in 1000 000. The design step 8’s EAP is based on existing design standards and a review of recommendations for engineered structures within extreme consequences of failure, such as nuclear power plants.Figure A.6 shows a completed design step format.
Figure A.6. Design Step Format (Source: Johnson,2000)
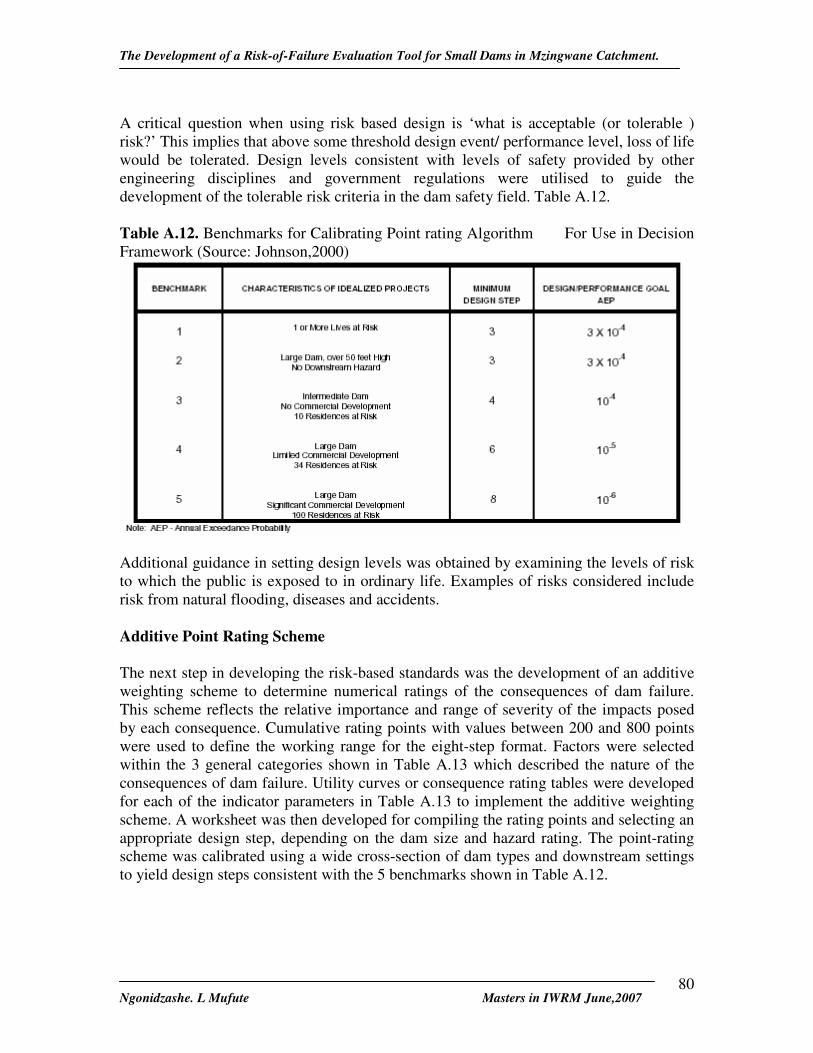
The Development of a Risk-of-Failure Evaluation Tool for Small Dams in Mzingwane Catchment.
Ngonidzashe. L Mufute Masters in IWRM June,2007
80
A critical question when using risk based design is ‘what is acceptable (or tolerable ) risk?’ This implies that above some threshold design event/ performance level, loss of life would be tolerated. Design levels consistent with levels of safety provided by other engineering disciplines and government regulations were utilised to guide the development of the tolerable risk criteria in the dam safety field. Table A.12. Table A.12. Benchmarks for Calibrating Point rating Algorithm For Use in Decision Framework (Source: Johnson,2000)
Additional guidance in setting design levels was obtained by examining the levels of risk to which the public is exposed to in ordinary life. Examples of risks considered include risk from natural flooding, diseases and accidents. Additive Point Rating Scheme The next step in developing the risk-based standards was the development of an additive weighting scheme to determine numerical ratings of the consequences of dam failure. This scheme reflects the relative importance and range of severity of the impacts posed by each consequence. Cumulative rating points with values between 200 and 800 points were used to define the working range for the eight-step format. Factors were selected within the 3 general categories shown in Table A.13 which described the nature of the consequences of dam failure. Utility curves or consequence rating tables were developed for each of the indicator parameters in Table A.13 to implement the additive weighting scheme. A worksheet was then developed for compiling the rating points and selecting an appropriate design step, depending on the dam size and hazard rating. The point-rating scheme was calibrated using a wide cross-section of dam types and downstream settings to yield design steps consistent with the 5 benchmarks shown in Table A.12.

The Development of a Risk-of-Failure Evaluation Tool for Small Dams in Mzingwane Catchment.
Ngonidzashe. L Mufute Masters in IWRM June,2007
81
Table A.13 Numerical Rating Format for Assessing Consequences of Dam Failure (Source: Johnson,2000)
Probabilistic Design Data Before the risk-based standards described above could be implemented, magnitude-frequency relationships were needed for extreme events such as floods and earthquakes. This type of information was available in Washington State but is not readily available to most states in the USA, and much work is still needed around the United States to develop probabilistic precipitation and seismic data for extreme events. Thus, Washington State had the necessary hydrologic data to employ them in a logical and consistent manner in their risk based design/performance practice. This data is used in determining a design storm event with an appropriate AEP to match the design/performance step for the dam in question. This storm is then used to compute the inflow design flood to size the spillway(s) for a new project, or to determine the adequacy of the spillway for an existing dam. In the seismic arena, the state has not yet developed suitable magnitude frequency relationships that can be used in the risk analysis. Design Standards for Other Critical Elements Besides the adequacy of spillway, other critical elements on existing dams such as outlets and seepage need to be considered as well. For these critical elements, a qualitative approach is used, rather than a quantitative assessment. This is achieved through review of the design and identification of deficiencies for the critical element, coupled with a qualitative assessment of the likelihood of failure based on past experience and engineering judgment. Risk Prioritization System

The Development of a Risk-of-Failure Evaluation Tool for Small Dams in Mzingwane Catchment.
Ngonidzashe. L Mufute Masters in IWRM June,2007
82
At the close of the 1980’s, the Dam Safety Office had over 60 dams listed as having safety deficiencies. Many of these dams were projects inspected under the National Dam Safety Program from 1977-81, and had no action toward making repairs in 10 years. With such a large number of unsafe dams, and limited staffing, it became clear to the DSO that some way of prioritizing these projects was needed. Thus, in conjunction with the development of the risk based standards, in 1990 the DSO developed a prioritization ranking system for dams with safety deficiencies. The scoring and ranking algorithm developed by the DSO includes the following key ideas: - For dams with similar deficiencies, those dams with the greatest consequences
should be given higher priority. - For dams with similar consequences, those dams with the more serious
deficiencies should be given higher priority. - For dams with similar deficiencies and similar consequences, those dams with a
poorer chance for warning to the public should be given higher priority. - Dams with only minor deficiencies should be ranked lower than dams with
significant deficiencies, regardless of the consequences. - The risk associated with three minor deficiencies is ranked just below that of one
moderate deficiency. - The risk associated with two moderate deficiencies is ranked just below that of
one major deficiency. - All things being equal, older dams should be given a higher priority. These concepts were then incorporated into developing the equations for computing the number of priority points. Two different equations were developed for computing the priority points. The first equation is for dams where one or more of the safety deficiencies are rated moderate major or emergency. The second equation is for a project where all deficiencies are rated minor. These equations are shown in Table A.14 Table A. 14 Equations for Prioritization Ranking (Source: Johnson,2000)
Rating points were then developed for the consequences, adequacy of warning, and seriousness of deficiencies, as shown in Figure A.7.

The Development of a Risk-of-Failure Evaluation Tool for Small Dams in Mzingwane Catchment.
Ngonidzashe. L Mufute Masters in IWRM June,2007
83
Figure A.7 Rating Points for Prioritization. (Source: Johnson,2000) The seriousness of safety deficiencies are evaluated based on the matrix in Table A.15. This matrix is intended for guidance only, and ultimately, the final rating of seriousness of deficiencies is based on knowledge of the project and on engineering judgment.
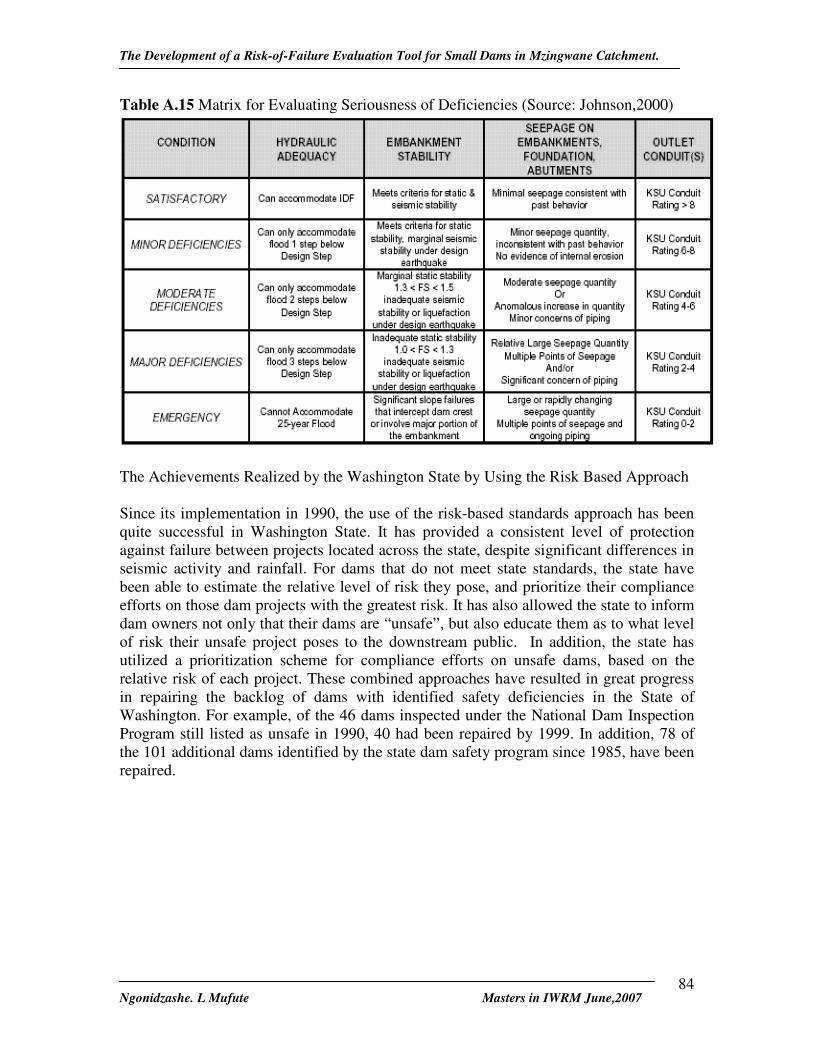
The Development of a Risk-of-Failure Evaluation Tool for Small Dams in Mzingwane Catchment.
Ngonidzashe. L Mufute Masters in IWRM June,2007
84
Table A.15 Matrix for Evaluating Seriousness of Deficiencies (Source: Johnson,2000)
The Achievements Realized by the Washington State by Using the Risk Based Approach Since its implementation in 1990, the use of the risk-based standards approach has been quite successful in Washington State. It has provided a consistent level of protection against failure between projects located across the state, despite significant differences in seismic activity and rainfall. For dams that do not meet state standards, the state have been able to estimate the relative level of risk they pose, and prioritize their compliance efforts on those dam projects with the greatest risk. It has also allowed the state to inform dam owners not only that their dams are “unsafe”, but also educate them as to what level of risk their unsafe project poses to the downstream public. In addition, the state has utilized a prioritization scheme for compliance efforts on unsafe dams, based on the relative risk of each project. These combined approaches have resulted in great progress in repairing the backlog of dams with identified safety deficiencies in the State of Washington. For example, of the 46 dams inspected under the National Dam Inspection Program still listed as unsafe in 1990, 40 had been repaired by 1999. In addition, 78 of the 101 additional dams identified by the state dam safety program since 1985, have been repaired.
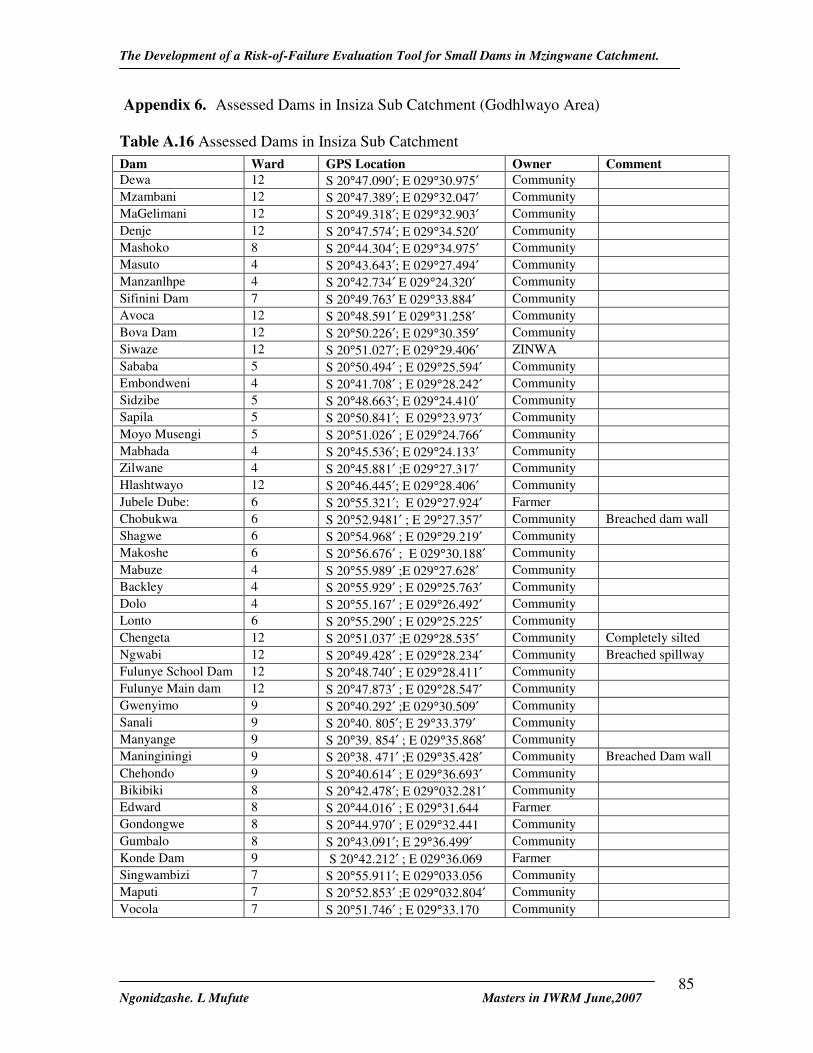
The Development of a Risk-of-Failure Evaluation Tool for Small Dams in Mzingwane Catchment.
Ngonidzashe. L Mufute Masters in IWRM June,2007
85
Appendix 6. Assessed Dams in Insiza Sub Catchment (Godhlwayo Area) Table A.16 Assessed Dams in Insiza Sub Catchment Dam Ward GPS Location Owner Comment Dewa 12 S 20°47.090′; E 029°30.975′ Community Mzambani 12 S 20°47.389′; E 029°32.047′ Community MaGelimani 12 S 20°49.318′; E 029°32.903′ Community Denje 12 S 20°47.574′; E 029°34.520′ Community Mashoko 8 S 20°44.304′; E 029°34.975′ Community Masuto 4 S 20°43.643′; E 029°27.494′ Community Manzanlhpe 4 S 20°42.734′ E 029°24.320′ Community Sifinini Dam 7 S 20°49.763′ E 029°33.884′ Community Avoca 12 S 20°48.591′ E 029°31.258′ Community Bova Dam 12 S 20°50.226′; E 029°30.359′ Community Siwaze 12 S 20°51.027′; E 029°29.406′ ZINWA Sababa 5 S 20°50.494′ ; E 029°25.594′ Community Embondweni 4 S 20°41.708′ ; E 029°28.242′ Community Sidzibe 5 S 20°48.663′; E 029°24.410′ Community Sapila 5 S 20°50.841′; E 029°23.973′ Community Moyo Musengi 5 S 20°51.026′ ; E 029°24.766′ Community Mabhada 4 S 20°45.536′; E 029°24.133′ Community Zilwane 4 S 20°45.881′ ;E 029°27.317′ Community Hlashtwayo 12 S 20°46.445′; E 029°28.406′ Community Jubele Dube: 6 S 20°55.321′; E 029°27.924′ Farmer Chobukwa 6 S 20°52.9481′ ; E 29°27.357′ Community Breached dam wall Shagwe 6 S 20°54.968′ ; E 029°29.219′ Community Makoshe 6 S 20°56.676′ ; E 029°30.188′ Community Mabuze 4 S 20°55.989′ ;E 029°27.628′ Community Backley 4 S 20°55.929′ ; E 029°25.763′ Community Dolo 4 S 20°55.167′ ; E 029°26.492′ Community Lonto 6 S 20°55.290′ ; E 029°25.225′ Community Chengeta 12 S 20°51.037′ ;E 029°28.535′ Community Completely silted Ngwabi 12 S 20°49.428′ ; E 029°28.234′ Community Breached spillway Fulunye School Dam 12 S 20°48.740′ ; E 029°28.411′ Community Fulunye Main dam 12 S 20°47.873′ ; E 029°28.547′ Community Gwenyimo 9 S 20°40.292′ ;E 029°30.509′ Community Sanali 9 S 20°40. 805′; E 29°33.379′ Community Manyange 9 S 20°39. 854′ ; E 029°35.868′ Community Maninginingi 9 S 20°38. 471′ ;E 029°35.428′ Community Breached Dam wall Chehondo 9 S 20°40.614′ ; E 029°36.693′ Community Bikibiki 8 S 20°42.478′; E 029°032.281′ Community Edward 8 S 20°44.016′ ; E 029°31.644 Farmer Gondongwe 8 S 20°44.970′ ; E 029°32.441 Community Gumbalo 8 S 20°43.091′; E 29°36.499′ Community Konde Dam 9 S 20°42.212′ ; E 029°36.069 Farmer Singwambizi 7 S 20°55.911′; E 029°033.056 Community Maputi 7 S 20°52.853′ ;E 029°032.804′ Community Vocola 7 S 20°51.746′ ; E 029°33.170 Community
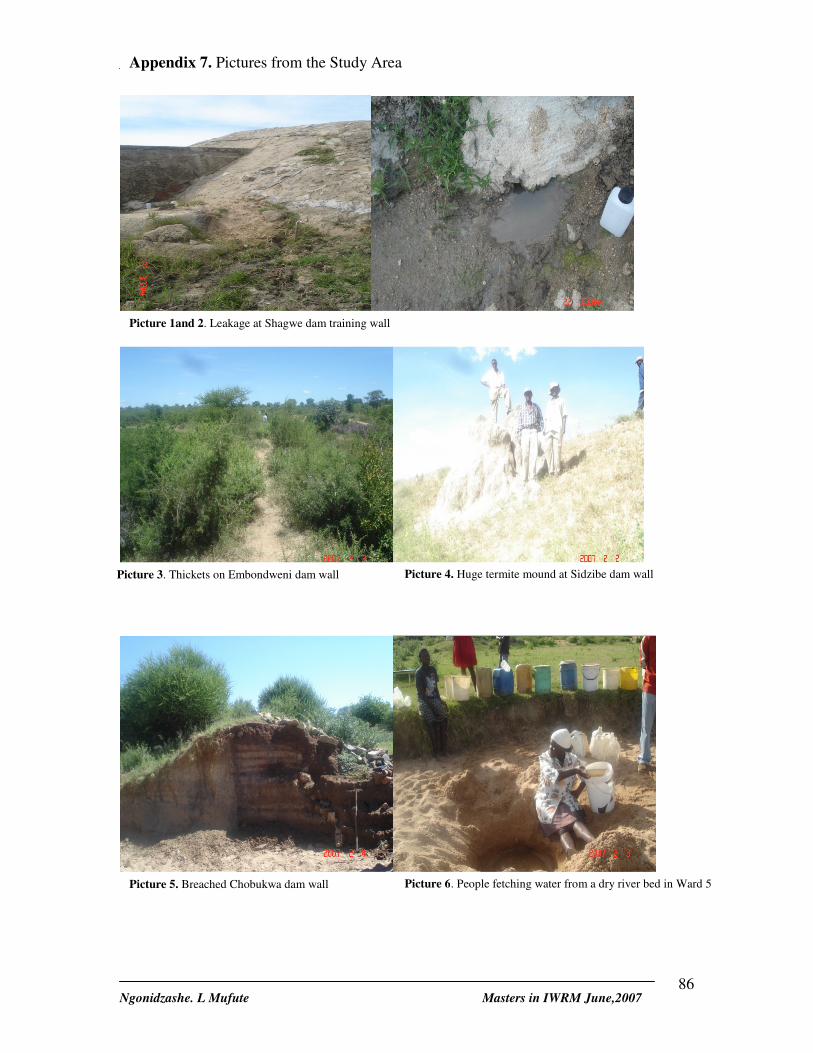
The Development of a Risk-of-Failure Evaluation Tool for Small Dams in Mzingwane Catchment.
Ngonidzashe. L Mufute Masters in IWRM June,2007
86
Picture 5. Breached Chobukwa dam wall Picture 6. People fetching water from a dry river bed in Ward 5
Picture 3. Thickets on Embondweni dam wall Picture 4. Huge termite mound at Sidzibe dam wall
Picture 1and 2. Leakage at Shagwe dam training wall
Appendix 7. Pictures from the Study Area