Embed Size (px)
Citation preview

Copyright is owned by the Author of the thesis. Permission is given for a copy to be downloaded by an individual for the purpose of research and private study only. The thesis may not be reproduced elsewhere without the permission of the Author.

i
THE DEVELOPMENT OF A RELIABLE AND
VALID NETBALL INTERMITTENT ACTIVITY
TEST
A thesis presented in partial fulfilment of the requirements for
the Degree of Master of Science
in Sport and Exercise Science
at Massey University, Auckland,
New Zealand
HELEN JOANNE RYAN
2009

ABSTRACT
The purpose of the present investigation was to identify the exercise intensity of
netball match play in order to assist in the development of a Netball Intermittent
Activity Test (NIAT). A further aim was to assess the criterion validity and the test-
retest reliability of the NIAT. Eleven female netball players (21.4 ± 3.1 years, 1.73 ±
0.06 m, 69.3 ± 5.3 kg and 48.4 ± 4.9 ml·kg-1·min–1 mean ± SD, age, height, body mass
and OV& 2max, respectively) volunteered to participate in the study. Heart rate data was
recorded for all participants from at least two full 60 minute games during Premier
Club competition. Individual maximum heart rate values were acquired for all
subjects from the performance of the Multistage Fitness Test, and used to transform
heart rate recordings into percent maximum heart rate (%HRmax). Patterns in %HRmax
were used to indicate positional grouping when developing the NIAT from time
motion analysis data. Subjects performed two trials of the NIAT separated by at least
seven days. Physiological and performance markers were measured systematically
throughout the NIAT. Exercise intensity as denoted by %HRmax significantly
decreased from the first half of match play to the second half (90.4 ± 2.7% v 88.3 ±
2.8%; p<0.05). Significant differences (p<0.05) were observed between positional
groups and led to the grouping of Defence (D), Centre Court (CC), and Attack (A)
players for NIAT performance. Comparisons of %HRmax between match play and
NIAT performance indicated that the NIAT had good criterion validity for D (match
Mdn = 92.52% vs. NIAT Mdn = 86.27%, p>0.05) and A (match Mdn = 86.95% vs.
NIAT Mdn = 82.93%, p>0.05) players, but that %HRmax during the NIAT (Mdn =
79.70%) was significantly lower than match play (Mdn = 89.70%) for CC group
(p<0.05). Measures of 5 m sprint performance (1.27 ± 0.06 s v 1.25 ± 0.06 s; p>0.05;
r=0.66, p<0.001), vertical jump height (29.12 ± 4.17 cm v 28.82 ± 3.60 cm; p>0.05;
r=0.91, p<0.001), circuit time (107.49 ± 3.22 s v 107.89 ± 4.27 s; p>0.05; r=0.72,
p>0.001) and %HRmax (82.56 ± 4.66% v 81.03 ± 4.13%; p>0.05; r=0.82, p<0.001) for
NIAT1 vs. NIAT2 indicated good test-retest reliability. These data suggest that
netball players experience a reduction in exercise intensity over the duration of a
game, with exercise intensity being related to on-court position. Whilst the NIAT
appears to be a repeatable activity pattern, it is not a good simulation of physiological
strain for all positional groups. More work is required in order to create a netball
simulation that is both reliable and valid for all players.
ii
iii
ACKNOWLEDGEMENTS
This research project would not have been possible were it not for the time and effort
contributed by the participants and local netball infrastructure. In particular I am
indebted to:
Netball North Harbour
Rangitoto Netball Club
Commodores Netball Club
Shore Rovers Netball Club
For the support and guidance they have given me during this research I would like to
acknowledge my supervisors:
Dr. Andrew Foskett
Dr. Alan Walmsley
Finally I would like to thank my family and numerous friends who have been patient
and gone above and beyond in helping me through this process.

iv
TABLE OF CONTENTS
PAGE
Abstract i
Acknowledgements ii
Table of Contents iii
List of Figures vii
List of Tables viii
CHAPTER I INTRODUCTION 1
1.1 Hypotheses 3
CHAPTER II REVIEW OF LITERATURE 4
2.1 Introduction 4
2.2 Physiological Demands of
Intermittent Running Exercise
4
2.2.1 Distance Covered 5
2.2.2 Speed and Intensity of
Player Activity
7
2.2.3 Energy Requirements 10
2.3 Physiological Demands of
Netball
15

v
2.3.1 Positional Patterns 16
2.3.2 Physical Characteristics 17
2.3.3 Maximal Oxygen Uptake 18
2.3.4 Leg Power 19
2.3.5 Activity Patterns 20
2.4 Models for Simulating High
Intensity Exercise
25
2.4.1 Laboratory Based Models 25
2.4.2 Shuttle Running
Simulations
30
2.5 Reliability and Validity 38
2.6 Summary 39
2.6.1 Assumptions of the Study 40
CHAPTER III METHODOLOGY 41
3.1 Introduction 41
3.2 Subject Characteristics 41
3.3 Preliminary Measurements 42
3.3.1 Physical Characteristics 42
3.3.2 Maximal Oxygen Uptake
and Maximum Heart Rate
42

vi
3.4 Game Data 43
3.5 Netball Intermittent Activity
Test
44
3.5.1 Familiarisation 44
3.5.2 Main Trials 45
3.6 Facilities 48
3.7 Statistical Analysis 49
CHAPTER IV RESULTS 52
4.1 Match Data 52
4.1.1 Playing Quarter 52
4.1.2 Positional Group 53
4.2 NIAT Criterion Validity 56
4.3 NIAT Reliability 57
4.3.1 Sprint Time 57
4.3.2 Jump Height 57
4.3.3 Circuit Time 58
4.3.4 Percent Heart Rate
Maximum
59

vii
CHAPTER V DISCUSSION 61
5.1 Match Data 61
5.1.1 Playing Quarter 63
5.1.2 Positional Group 65
5.2 Protocol Validity 70
5.3 Protocol Reliability 76
5.3.1 Sprint Time 76
5.3.2 Jump Height 78
5.3.3 Circuit Time 79
5.3.4 Percent Heart Rate
Maximum
81
5.4 Conclusion 83
5.5 Limitations of the Study and
Recommendations for Future
Research
84
REFERENCES 87
APPENDICES

viii
LIST OF FIGURES
Figure Title Page
3.1 Diagrammatical Representation of the NIAT 46
3.2 Diagrammatical Representation of the Skill Circuit
within the NIAT
47
3.3 Photograph of a Participant Completing Skill
Circuit during NIAT
48
4.1 Mean %HRmax for the Four Quarters of Match Play 52
4.2 Comparison of Mean % HRmax between Match
Halves
53
4.3 Mean %HRmax during Match Play for the Different
Positional Groups
54
4.4 Median % time in Heart Rate Zone by Positional
Group
55
4.5 Median % HRmax for Positional Groups in Match
and NIAT
56
LIST OF TABLES
Table Title Page
2.1 Heart Rate Intensity Zones 24
3.1 Activity Patterns During Skill Section of the NIAT
Protocol by Positional Variation
45
4.1 Median OV& 2max and HRmax values by positional
group
53
4.2 Mean NIAT performance times (± standard
deviations)
58
4.3 Pearson’s correlation (r), intra-class correlation
coefficients (ICC), standard error of measurement
(SEM), 95% confidence intervals (95% CI), and
coefficient of variation (CV) for NIAT performance
60
4.4 Absolute limits of agreement (LOA) for NIAT
performance
60
ix
CHAPTER I
INTRODUCTION
Netball is New Zealand’s top sporting activity for females with registered members
totaling more than 120,000 in over 1000 clubs nationwide (Netball New Zealand
[online]). The game requires explosive movements such as short, fast sprints, quick
stops, and many changes in direction (Neal & Sydney-Smith, 1992). The physiological
stress experienced by a player during a game will vary with numerous factors, including
the playing environment, the opponents’ skill, and the closeness of the match (Steele &
Chad, 1991), which all cause variation in movement patterns during a game. The
unpredictable nature of netball game-play could be one reason for the absence of
intervention research on netball match performance.
Athletes, trainers, and coaches often need to invest a considerable amount of time
researching the physiological aspects of their sport while striving to improve performance
(Cronin et al., 2001). This is particularly difficult in team situations where it may not be
possible to assess every athlete individually. If all players can be assessed in a similar
way during a test that is not time intensive this would be a huge advantage to the coach.
If this test could be developed to investigate other factors that could improve
performance, for example training regimes or dietary intervention, it would give trainers
another advantage in the development of optimum performance. Furthermore, if this test
replicated the physiological demands of a game it could act as a training tool for coaches
- 1 -

to ensure their athletes are adequately prepared for the physiological aspect of the
particular sport.
Current intervention research into netball uses various methods of assessment to
investigate physiological aspects of netball including basic sprinting movement
(O’Donoghue and Cassidy, 2002), and sprints on a cycle ergometer (Blee et al., 1999).
Although these studies give informative results about elements of individual
physiological fitness in netball players, the testing methods appear to lack ecological
validity because they do not fully represent the movement patterns involved in a game of
netball. Other authors have investigated tests for specific netball activities such as chest
passing (Cronin et al., 2001) and agility (Farrow et al., 2005). However, intervention
research into the game as a whole is scarce, possibly because of the lack of structure
during the game. Therefore, there appears to be a need for the development of a
controlled simulation that could be used for the assessment of training regimes and
selected interventions. This study aims to design a Netball Intermittent Activity Test
(NIAT) through the use of previous time motion analysis data (Steele & Chad, 1991).
This study aims to further quantify the physiological demands of netball match play by
recording heart rate data, and utilize these data to validate the NIAT. To ensure the NIAT
is a simulation of actual netball activity validity will be assessed against a criterion
measure of physiological strain. Any simulation developed will need to be repeatable on
any one occasion in order that any physiological differences observed are due to
interventions rather than a change in exercise intensity. Therefore, an attempt will also be
made to establish the reliability of the NIAT.
- 2 -

1.1 Hypotheses
The primary null hypotheses for the present investigation were:
H01: Mean %HRmax will not differ between quarter and positional group during
competition games.
H02: Mean %HRmax will not differ between competition games and the NIAT.
H03: Mean %HRmax, sprint times, jump heights and circuit times will not differ
between NIAT Trials.
H04: Sprint and jump performance will not change throughout the duration of
the NIAT.
- 3 -
CHAPTER II
REVIEW OF LITERATURE
2.1 Introduction
Research into the physiological demands of netball is relatively rare within the current
sport science literature. Investigations have often focused on other intermittent sports
such as soccer, rugby and hockey, drawing conclusions relevant to these games.
Although these sports are structurally different from netball, they all share a common
intermittent nature and as such lend themselves to comparison. The first section of this
literature review will cover the physiological demands of team sports similar to netball in
order to highlight the activity profile of intermittent sport. A review of the current netball
physiological literature will be presented to identify links with other intermittent activity
profiles. Researchers have further attempted to replicate the demands of intermittent
profiles by creating laboratory and field-based simulations; the final section of the review
will attempt to describe and critique some of these simulations.
2.2 Physiological demands of intermittent running exercise
Intermittent activity profiles are found in field and court games where two or more
players are participating for example soccer, hockey, rugby, and racquet sports. These
sports are characterized by periods of maximal or near maximal intensity effort followed
by lower intensity periods, often of short duration (see Glaister, 2005 for a detailed
- 4 -

review). The physiological demands of intermittent exercise are often more complex than
continuous sports such as running (Bangsbo, 1993; Drust et al., 2000b), and place unique
demands on muscle metabolism because supply of energy is required for multiple
functions, being needed for both contraction of muscles, and restoration of homeostasis
(Balsom et al., 1992). Various methods have been used to record data on the
physiological demands of intermittent sports with the earliest being time motion analysis.
The development of better technology over time has allowed for sport-specific
measurement of physiological aspects of sport in the field e.g. portable heart rate
monitors (Ali & Farrally, 1991; Larsson, 2003). The measurement of physiological
markers during match play has resulted in the production of more descriptive data about
the physiological stress experienced during team games, to support the previous match
analysis data. Although there are some time motion analysis data for netball in the
literature, there is very little information on the physiological stresses experienced during
the game.
2.2.1 Distance covered
Authors often report data on total distance covered during team sports when performing
time motion analysis. There is great variation among male sports with studies on rugby
union reporting total match distances of 4-7 km (Deutsch et al., 1998), rugby league
research reporting 6-8 km (Meir et al., 1993), while soccer players complete longer
distances of 8-12 km (Van Gool et al., 1988; Mohr et al., 2003; Rampini et al., 2007a;
2007b). Similar distances of approximately 10.5 km have been reported for female
soccer players (Krustrup et al., 2005). Racquet sport athletes cover lesser distances,
depending on the length of the game, with badminton players covering up to 2 km (Liddle
- 5 -

et al., 1996). Many of these studies used athletes of similar professional or elite caliber
and employed similar time motion analysis methods and so should, theoretically, be
comparable. The variance in total distance covered between intermittent sports is likely a
reflection of the difference in playing time. For example, soccer players appear to cover
the largest distances and also have the longest games times at 90 minutes. Racquet sports
may vary considerably on reported distances covered as games will last for as long as it
takes for victory. Larger distances covered in field sports versus court games may also be
a reflection of playing surface area, with football, rugby and hockey pitches being
considerably larger than basketball, tennis and badminton courts. A netball game
typically lasts 60 minutes and the court surface area is similar to that in basketball.
Therefore, it seems likely that netball players will cover longer distances than racquet
sport athletes but shorter distances than athletes in sports such as rugby union and soccer,
which are performed on larger fields of play over longer durations.
There is evidence in the literature of large inter- and intra-individual variations in the
distances covered in intermittent sports. The intra-individual variation may be attributed
to positional variations identified in rugby union (Deutsch et al., 1998), rugby league
(Meir et al., 1993), and soccer (Mohr et al., 2003; Rampini et al., 2007a). This is also
likely to be the case in netball where positional play is strongly evident. Although
distance covered has often been used to estimate energy expenditure during a game
(Drust et al., 2007), the very nature of intermittent sports makes this estimation
problematic since the intensity at which the distances are covered is not taken into
account.
- 6 -

2.2.2 Speed and intensity of player activity
Variation in the total distances covered by different positional groups has been analysed
further to indicate that there is also disparity in the intensity covered over those distances
(Deutsch et al., 1998; Mohr et al., 2003). It is often the distance covered at high-intensity
that distinguished positional groups, and also class of player as elite players covered
larger distances at a high intensity than sub-elite players (Mohr et al., 2003). In addition,
there was a reduction in total distance covered and distance covered at high-intensity in
the second half or toward the end of each half of the game (Lothian & Farrally, 1994;
Mohr et al., 2003; Krustrup et al., 2005). However, two of these studies only used one
game for analysis (Lothian & Farrally, 1994; Mohr et al., 2003), which could mean that
the observed fatigue could be a reflection of that particular game only. However, these
results do give us a clearer picture of the physiological demands of intermittent sports by
indicating that fatigue appears to result in an attenuation of high-intensity activity towards
the end of the game despite seemingly long periods of aerobic-type activity. This may
also be the case in netball match play, although the shorter match time and the presence
of quarter breaks in play during a netball match may negate the fatigue effect shown in
other intermittent sports.
Many authors report data from time motion analysis as the percentage of total time spent
in different activity categories (Mayhew & Wenger, 1985; Docherty et al., 1988; Spencer
et al., 2004; Duthie et al., 2005; Rampini et al., 2007a). This allows for better comparison
between intermittent sports as it takes the difference in match duration into account.
- 7 -

Aerobic, low-intensity activity makes up varying proportions of total game time in
intermittent sports. Reported values include 85% in rugby union (Docherty et al., 1988);
90% in rugby league (Meir et al., 1993); 88% in soccer (Mayhew & Wenger, 1985); 94%
in Australian rules football (Dawson et al., 2004); 87% in male field hockey (Spencer et
al., 2004); and 78% in female field hockey (Lothian & Farrally, 1994). These proportions
exhibit some variation between the various different sports. In contrast, the high-intensity
or anaerobic proportion of activity is much more variable ranging from 5.6% in male field
hockey (Spencer et al., 2004) to 21.9% in female field hockey (Lothian & Farally, 1994).
These differences may be due to the definition of high-intensity activities within the time
motion analysis with some authors including game specific activities (Docherty et al.,
1988; Meir et al., 1993; Lothian & Farrally, 1994), and some simply classifying running-
only type activities (Mayhew & Wenger, 1985; Dawson et al., 2004; Spencer et al.,
2004). The different activity profiles in these studies may also be a result of different
research practices. For example, some authors only collated time motion analysis data for
one game (Lothian & Farally, 1994; Spencer et al., 2004), potentially resulting in the
intensity profile reflecting that game only and not the sport as a whole. Other authors
presented data from two or more games (Dawson et al., 2004; Docherty et al., 1988;
Mayhew & Wenger, 1985; Meir et al., 1993) giving more depth to the intensity profile for
the particular sport. In addition, the skill differences between the sports often make it
difficult to compare them with each other, for example the high level of body contact in
rugby union may result in a weakened comparison to lower-body contact sports such as
hockey and soccer.. However, the low-intensity periods of work are important in terms of
recovery from the high-intensity intervals and so in this respect it is not surprising that
many intermittent sports exhibit similarly high proportions of aerobic activity compared
- 8 -

to high intensity activity. As an intermittent sport, it could be expected that in netball,
low-intensity effort will be similar in proportion to other intermittent sports and equally
important in recovery from high-intensity activity.
There appears to be a continuing trend in intermittent sport motion analysis of positional
differences in match activity, identified in rugby union (Docherty et al., 1988; Deutsch et
al., 1998; Duthie et al., 2005), rugby league (Meir et al., 1993), soccer (Rampini et al.,
2007a), Gaelic football (McErlean et al., 2000) and hockey (Spencer et al., 2004). This is
an interesting observation since these sports are played on a field that is relatively large
and players are not limited to one specific area by the rules of the game as they are in
netball. However, in their study on Super 12 rugby games Duthie and Colleagues (2005)
recognized the activity differences as an indication of the high level of specificity
required in certain positional roles within the game, for example the activity profile of the
Forwards was strongly affected by the frequency of efforts involving static exertion
(rucks, mauls and scrums). This would indicate that it is not only the area of activity and
distance covered that determines the physiological response to intermittent sport, but also
the type and nature of the activity or skill performed. It would be likely that netball
would have similar position-specific differences to rugby since netball is position-specific
in nature, with different roles being assigned to each position in the game. Because the
role of a Defender in netball is noticeably different from a Shooter, it follows that their
observed activity patterns will also differ. For example, the action of shooting should
never be observed for Defenders since only Goal Shooter and Goal Attack are permitted
to shoot under the rules of the game. Similar to the findings from Duthie and colleagues
- 9 -

(2005) that static exertions increase total work it could be that certain static exertions such
as defense of a shot (by the Goal Defence and Goal Keeper) add more to the exertion
profile of these positions than other players on court.
2.2.3 Energy requirements
Many team sports with intermittent activity patterns last for an hour or more (Glaister,
2005) and have changes in activity on average every 4-6 seconds (Spencer et al., 2004;
Stroyer et al., 2004; Krustrup et al., 2005). As previously mentioned, this complex nature
often makes the physiological profile more demanding than continuous-style sports
(Bangsbo, 1993). A further elevation to energetic cost is the constant need for team sport
players to be involved in stopping, starting, turning and changing activity. Energy
expenditure is elevated in backwards and sideways running when compared to forwards
running (Reilly, 1997), which indicates that netball match play would have an elevated
energetic cost compared with running as a result of activities such as stopping, starting,
and running backwards, which are common in a netball game.
A large proportion of the energy cost data from intermittent sports is obsolete, and recent
studies are scarce. However, some authors have attempted to use the heart rate-oxygen
uptake (HR- OV& 2) relationship determined from laboratory testing and heart rates
recorded during game play to estimate energy expenditure from individual HR- OV& 2
regression equations (Ali & Farally, 1991; Coutts et al., 2003). It has been suggested that
this method is likely to over-estimate energy expenditure as a result of the effects that
other factors such as ambient conditions, psychological strain, and static activities will
- 10 -

have on heart rate during intermittent sports (Reilly, 1997). However, it has been used in
non-steady state exercise (Bot & Hollander, 2000) and also soccer (Bangsbo, 1993),
where individual HR- OV& 2 regression equations generated OV& 2 values that were not
significantly different from measured values. Therefore, it may be possible to estimate
the energetic cost of netball from individual HR- OV& 2 regression equations.
2.2.3.1 Aerobic contribution
Individual HR- OV& 2 regression equations applied to heart rate data collected during match
play have indicated the average exercise intensity of intermittent sports including female
soccer at 77% OV& 2max (Krustrup et al., 2005), and rugby union at 80% OV& 2max (Coutts et
al., 2003). Significantly lower values were observed during tennis (Christmass et al.,
1998; Smekal et al., 1998; Ferrauti et al., 2001) and badminton (Majumdar et al., 1997)
match play with estimates of between 50-70% OV& 2max over the duration of the game,
perhaps further reflecting the effects of lesser game duration and playing area. Ogushi
and colleagues (1993) did attempt to estimate work intensity during soccer match-play
using a portable, modified Douglas bag system. This study reported lower values than
studies using HR- OV& 2 relationships (47% OV& 2max to 61% OV& 2max), but the results were
not fully representative of either a full game or the full population cohort since expired
gas collection only occurred during small portions of the game, and only two student
participants were used. Further, the results collected from these two individuals may
have been limited by the restrictive nature of wearing Douglas bag equipment while
playing soccer. Because results were unclear it is still difficult to say how netball would
compare with other intermittent sports. However, the duration of netball and the size of
- 11 -
playing area involved in a game indicate it may fall between racquet sports and field
sports at around 70% OV& 2max.
Heart rate is a good indicator of circulatory strain during intermittent sports and so can
give an estimate of the type and intensity of exercise performed (Drust et al., 2007).
Heart rate responses to match play in intermittent sports are more widely published,
particularly in soccer where mean values ranging from 152-186 beats·min-1 have been
reported (Ali & Farally, 1991; Stroyer et al., 2004; Krustrup et al., 2005; Edwards &
Clark, 2006). This range appears to be associated with the level of player studied with
two studies reporting that elite players exhibited higher mean match heart rates than their
recreational counterparts (Edwards & Clark, 2006; Stroyer et al., 2004). Mean heart rate
values for rugby league and basketball players also fall within a similar range to soccer
players at around 165 beats·min-1 (Coutts et al., 2003) and 171 beats·min-1 (Abdelkrim et
al., 2007) respectively, whereas tennis players appear to report slightly lower mean heart
rate values in the range of 140-155 beats·min-1 (Bergeron et al., 1991; Smekal et al.,
1998), another possible reflection of the differences in playing area and match duration
between field and court sports. However, much of these data are difficult to compare
since they are not related to a criterion measure such as a proportion of maximal heart rate
(HRmax). Some authors have sought to report this information as well, with mean
documented values of 86% HRmax in soccer (Krustrup et al., 2005; Edwards & Clark,
2006); 81% HRmax in tennis (Christmass et al., 1998; Smekal et al., 1998); 89% HRmax in
basketball (McInnes et al., 1995); 87% HRmax in badminton (Liddle et al., 1996;
Majumdar et al., 1997); and 84% HRmax in rugby league (Coutts et al., 2003). Large
- 12 -

ranges are seen within sporting disciplines, often due to the calibre and age of the subjects
used. For example, the study by Edwards and Clark (2006) revealed that professional
soccer players work at a higher percentage of HRmax over the duration of the game than
their recreational counterparts and so are probably better able to withstand higher absolute
physiological strain throughout the duration of a game. This links back to time motion
analysis data on the speed and intensity of intermittent sport players in that elite players
often exhibit higher levels of high intensity running than sub-elite players (Mohr et al.,
2003). It is suggested a similar situation exists in netball with elite players working at a
higher overall intensity than their recreational counterparts.
Some authors have reported heart rate data that reflect patterns in the time motion
analysis data, with heart rates differing between the first and second halves of the game.
This indicates a reduction in intensity since normally heart rate would normally increase
over the duration of exercise as a result of cardiovascular drift (Ali & Farrally, 1991;
Edwards & Clark, 2006). However, this trend was not observed in female soccer games
(Krustrup et al., 2005) or in rugby league (Coutts et al., 2003), where mean heart rate
values did not differ between game halves in those study populations. The clarity of this
intensity pattern is further complicated by the fact that all of the above studies only
collected heart rate data during one match in their respective sports. This could mean that
the observed patterns were a reflection of that particular game only and not of the sport as
a whole. The observation of variation in activities performed by different positional
groups was further supported by Deutsch and colleagues (1998) who illustrated positional
variations in the time spent in prescribed heart rate zones in rugby union games.
- 13 -

Therefore, it is expected that heart rate data from netball game play will exhibit similar
patterns to the time motion analysis data already available in the literature and so would
be a suitable basis for development of a simulation.
2.2.3.2 Anaerobic contribution
Time motion analysis data from the current literature indicate that the physiological
profile of intermittent sports has a fairly low anaerobic contribution to the energy supply.
However, it has been recognized that the ability to perform this anaerobic element of the
game consistently can be a crucial performance outcome (Stroyer et al., 2004). Blood
lactate concentration has been used as an indication of anaerobic contribution to energy
requirements because lactate is a product of the anaerobic glycolytic pathway. Some
authors have reported mean values of lactate concentration at cessation of game play in
rugby union of 2.8 mmol·l-1 (Docherty et al., 1988), soccer as 3.7 mmol·l-1 (Edwards &
Clark, 2006), and tennis as 2.3 mmol·l-1 (Bergeron et al., 1991). These values suggest
that these intermittent sports do not require a large anaerobic energy contribution. The
lactate values collated could be an indication of the large aerobic contribution to
intermittent sports. Periods of low intensity work within intermittent profiles allow for
clearance of lactate possibly built up during high intensity work. Researchers in sports
such as rugby union, rugby league and basketball have attempted to take further
measurements during natural breaks in play, indicating a larger contribution to match play
activity from anaerobic metabolism with values of lactate concentration ranging from 4.8-
8.4 mmol·l-1 (McInnes et al., 1995; Deutsch et al., 1998; Abdelkrim et al., 2007; Coutts et
al., 2003). Other studies have indicated peak values of lactate concentration from 7
mmol·l-1 to >10 mmol·l-1 in singles tennis (Christmass et al., 1998), soccer (Bangsbo,
- 14 -

1997), rugby league (Coutts et al., 2003) and rugby union (McLean, 1992; Deutsch et al.,
1998), which indicate a more substantial anaerobic contribution to the energetic demands
of intermittent sports. However, blood lactate values will only reflect the work done in
the five minutes prior to taking the blood sample (Bangsbo, 1997). These higher reported
lactate values indicate, therefore, that at some point during these games the lactate
threshold is breached but that the lower intensity periods allow for clearance of lactate to
allow players to continue performing higher intensity intervals. Results taken during
rugby league match play give a slightly clearer picture of the anaerobic energy profile of
the sport, for example first half values of lactate concentration (8.4 ± 1.8 mmol·l-1) being
higher than second half (5.9 ± 2.5 mmol·l-1) (Coutts et al., 2003) reflected a drop-off in
intensity of activity which supported the findings from analysis of time-motion and heart
rate data from rugby league observations. It appears that physiological data from other
intermittent sports often reflects patterns in the intensity profile of time motion analysis
data. Therefore, it appears likely that physiological data in the form of heart rate
collected from netball match play will reflect the time motion analysis data observed for
netball match play.
2.3 Physiological Demands of Netball
Netball can be classified as an intermittent sport because it includes short fast sprints and
frequent changes in direction in the activity profile (Neal & Sydney-Smith, 1992). The
game is played on a court of 15.25 m by 30.5 m, the length being divided into thirds.
Players are restricted to specific areas of the court; the Centre is allowed in all thirds,
- 15 -

players with Attack or Defence in the title in two consecutive thirds, while Goal Shooters
and Goal Keepers are only permitted in one third of the court. Therefore, activities often
occur over short distances and there appears to be a highly explosive nature to the game
with many quick movements and jumps or leaps (Steele & Milburn, 1987), which
indicates that netball has an important anaerobic energy contribution and should reflect
this pattern in activity data. The following section will describe the nature of netball by
examining the small amount of physiological netball data that currently exists. By
examining any differences between netball and other intermittent sports a conclusion can
be reached on the importance of a netball-specific activity simulation.
2.3.1 Positional patterns
Because netball is played on a relatively small court and the rules of the game restrict
player movement on court, it could be said that each of the seven positions has its own set
of physiological characteristics, and some authors have presented data to reflect this
(Otago, 1983; Woolford & Angove, 1991; 1992). However, many authors have found
patterns in various collected data, including anthropometric, fitness attribute and time
motion analysis data, which indicate that positional grouping may be possible. The most
common method has been to group attacking (Goal Shooter [GS] and Goal Attack [GA]),
centre-court (Centre [C], Wing Attack [WA] and Wing Defence [WD]), and defending
players (Goal Defence [GD] & Goal Keeper [GK]) (Bale & Hunt, 1986; Chad & Steele,
1991; Steele & Chad, 1991; Cooper et al., 2002), although other potential patterns have
been identified (Allison, 1978; Otago, 1983). The common groups have often been based
on positional similarities in data such as height and mass, and skill differences between
the groups. Significant differences have been identified between positional groups in
- 16 -
physiological data among the intermittent sports such as rugby union and soccer that have
larger areas of activity. In netball match play it would be expected that the discrete
positional patterns of play governing the game and the individual skills required by each
position will lead to netball players exhibiting positional differences in physiological and
activity data
2.3.2 Physical characteristics
Many netball studies have investigated the physical characteristics of players of various
ability. Netball players have been identified as being taller and heavier than female
players in other sports (Withers & Roberts, 1981), and similar in stature to elite female
basketball players (Bale & Hunt, 1986). The literature indicates that the height of netball
players has a large range from 1.63 m to over 1.80 m, with a trend for elite (i.e. State and
National) players to be taller than club or “successful” players (Barham & Wilson, 1981;
Bale & Hunt, 1986; Chad & Steele, 1991; Neal & Sydney-Smith, 1992; Blee et al., 1999;
Hopper et al., 1999; Cronin et al., 2001; Fallon et al., 2001; Cooper et al., 2002). There
are also positional variations in height with defence and attack players often being taller
than centre-court players (Bale & Hunt, 1986; Chad & Steele, 1991; Cooper et al., 2002).
It has been identified that taller players execute certain skills more successfully, including
rebounding, defending shots and intercepting (Chad & Steele, 1991).
The importance of body mass to sports like netball with an explosive element is related to
the power-to-body weight ratio (Chad & Steele, 1991). Body mass data for netballers
indicate a range of 60-71 kg (Barham & Wilson, 1981; Chad & Steele, 1991; Neal &
- 17 -

Sydney-Smith, 1992; Blee et al., 1999; Cronin et al., 2001; Fallon et al., 2001; Cooper et
al., 2002). However, the trend towards greater body mass with increasing standard of
player was only shown in one study (Hopper et al., 1999) and was absent from another
(Bale & Hunt, 1986). It may be the case those playing at a higher standard will exhibit a
higher power-to-body weight ratio than those playing at a lower standard and that it is this
that separates their ability rather than their absolute body mass. There was also a trend
for attackers and defenders to exhibit greater body mass than centre court players (Bale &
Hunt, 1986; Cooper et al., 2002), although this was probably related to their larger
stature. Previous authors have indicated that there were no differences in body fat mass
between positional groups (Bale & Hunt, 1986), supporting the idea that the extra mass of
attacking and defensive players is a result of their larger stature and not of increased
adiposity.
2.3.3 Maximal Oxygen Uptake
Relatively few authors have sought to quantify the aerobic power of netball players at any
level, although there is some indication that maximal oxygen uptake among
representative netball players is lower than that for representative hockey players
(Withers & Roberts, 1981). It would appear that aerobic power of netball players lies in
the range of 42-49 ml·kg-1·min-1 (Withers & Roberts, 1981; Chad & Steele, 1991; Blee et
al., 1999; O’Donoghue & Cassidy, 2002), although data from various groups of athletes
in Australia has indicated a range from 33 ml·kg-1·min-1 to 62 ml·kg-1·min-1, depending on
the level of player with elite players in the upper range (Ellis et al., 2000). Netballers
appear to have similar maximal oxygen uptake values to athletes in other female sports
such as basketball (38-61 ml·kg-1·min-1), hockey (36-65 ml·kg-1·min-1), soccer (35-61
- 18 -
ml·kg-1·min-1), and tennis (41-57 ml·kg-1·min-1) (Ellis et al., 2000). However, more recent
data on the netball population are needed to complement these findings in order to give us
a clearer picture of the aerobic power of modern day netball players. This is particularly
important in the wake of changes to the game. For example, most modern netball
matches are 60 minutes in length; previous research has been based on 40 minute games
(Otago, 1983). Changes such as this may have altered the physiological make-up of the
netball population over time.
2.3.4 Leg power
Leg power data for netball players are also relatively scarce, which is concerning because
the explosive nature of the game could mean that leg power is an important component of
superior performance. Jumps are often made to catch passes or to intercept a high ball
from an opponent, and so it follows that the ability to jump higher could improve
performance in these skills. Those authors who have tested for leg power have often used
different methods, making the data hard to compare. Withers and Roberts (1981) found
that the representative players in their cohort had an average power of 953 W
(approximately 13 W·kg-1 body mass) using sprinting up a flight of stairs at 58% incline
as an assessment. Light gates recorded time taken from the 8th to the 12th stair (a total
vertical distance of 0.661 m); with vertical velocity and power calculated from the
distance and relevant time values. The authors indicated that netball players exhibited a
significantly higher absolute power output than female hockey and softball players (813.4
W and 800.7 W respectively), which was probably indicative of the more explosive type
movements such as changes of direction and jumps in netball compared with other female
intermittent sports. Blee et al. (1999) recorded power output during a 10 second maximal
- 19 -

effort cycle ergometer test and obtained power: mass ratios of around 15 W·kg-1 body
mass. This difference from the Withers and Roberts (1981) study was not only a probable
consequence of a different test population but also a result of the different methods used
to assess power output.
Other methods of assessing leg power have included the use of vertical jump and sprint
data, which are more game-relevant assessments because the movements are performed
during match play. Vertical jump data have been reported in some studies, but again
results are difficult to compare because different methodologies and equipment were
used. It appears that elite netballers jump between of 42 and 44 cm during jump and
reach tests (Blee et al., 1999; Chad & Steele, 1991). Sprint data for netballers are also
relatively scarce. One study indicated that National players sprinted 20-metres in 3.6-3.8
seconds (O’Donoghue & Cassidy, 2002). However, the relevance of assessing a 20-metre
sprint is unclear as time motion analysis data from netball match play indicates that
players only sprint on average for 0.1-0.6 s (Steele & Chad, 1991). This sprinting activity
is likely to occur when trying to lose an opponent or make an interception, and so the
faster these movements are made the more successful the performance outcome.
Therefore, it is likely that assessing sprint speed over a shorter distance would be more
applicable.
2.3.5 Activity patterns
The activity profile of netball players has been described by both time motion analysis
and actual physiological data collection. A large proportion of the time motion analysis
- 20 -

data are obsolete, and some even take the form of simple observations rather than
scientific time motion analysis (Allison, 1978). One of the first main time motion
analysis studies (in Queensland, Australia in 1983) took the form of coding video tape of
games involving three international teams in a tri-test series (Otago, 1983). The activity
categories used were basic consisting of shuffle, sprint, slow jog, pass, guard, defend and
goal. General observations indicated that the majority of activity time was spent
shuffling, and that there was a wide range in the proportion of the game spent sprinting
(6.7-36.3% of total time). The data also indicated that the percentage of total game time
spent in possession of the ball was between of 7.5 and 18.8%. However, the data
indicated differences among individual positions and identified the activity profile for
each position. The relatively clear picture of movement patterns for the game that
emerged may not be relevant to the modern game because the match was played as two
20-minute halves whereas today a game would be played as four 15-minute quarters. The
video recording used to collate the time motion analysis data originated from a television
broadcast and was not recorded specifically for the purpose of the study. This meant that
there were times when players were not in view of the camera and certain assumptions
were made about the activity patterns outside of camera view. These included
assumptions that unless a player moved into view of the camera to receive a pass, they
were not performing any vigorous activity. This may have led to an underestimation of
the proportion of vigorous activity for all positions, but particularly those who were out of
vision more regularly.
- 21 -

In 1991 Steele and Chad carried out time motion analysis on a 60 minute game, and also
used more detailed activity analysis categorising activities as locomotor (standing,
walking, jogging, running, sprinting, shuffling) and non-locomotor (shooting, pass, centre
pass, catch, toss up, jump, leap, rebound, defend, guard). The video recording was
specifically for the analysis of activity for this study and ensured that players were always
in view of one of the two cameras. They reported data in terms of repetitions of the
activity; average time spent in activity and percent total game time in that activity and
split groups into centre court (C), shooters (S) and defenders (D). Overall, the highest
proportion of match time was spent standing or walking forward, although positional
differences were seen. Centre court players spent significantly less time standing (C
22.3% vs. S 38.3% vs. D 35.8%) and more time jogging (C 13.8% vs. S 5.6% vs. D 4.8%)
and running (C 3.3% vs. S 2.0% vs. D 1.0%), while shooters spent significantly less time
walking forward (S 21.8% vs. C 28.9%) than centre-court players. According to these
data the proportion of game time spent sprinting was 0%, which differed significantly
from the findings of the earlier study. It was, however, recognized that sprinting did
occur in the number of repetitions data, and the proportion merely reflected that sprinting
was a minor activity when listed with the many locomotor and non-locomotor activities
identified in the game. The short-distance over which sprints occur during a netball game
may also have meant than sprint movements may have been missed when the data were
coded thereby underestimating the amount of game time spent sprinting. Interestingly the
total mean contribution of non-locomotor movements involving ball possession (pass,
catch, toss up, shoot) was a maximum of 5.5% of total game time for any one player,
which was approximately three minutes of an entire match. The majority of the time was
- 22 -

spent in locomotor activity with defenders spending the most time in non-locomotor
activity without the ball at 14.6% total game time.
In order to assess the actual physiological strain associated with a netball game Woolford
and Angove have published two research articles examining heart rates recorded during
netball matches (Woolford and Angove, 1991; 1992). The earlier article compared match
data to those collected during training sessions, while the latter article presented the same
data examining positional specific trends within game play. Participants were three
members of a regional senior team competing in a National titles tournament. The
maximum heart rate (HRmax) of each subject was determined using an incremental
treadmill test in order to convert match heart rate data to %HRmax. The time spent in one
of four intensity zones shown in Table 1 was calculated. The results show that in the
court positions observed (WA, GA, C & WD) there were differences in the time spent in
each heart rate zone, with GA spending the most time in Zone 1. However, the authors
did recognise that the three games used to capture the data for GA were the most closely
contested three out of the nine games studied during the tournament. They also reported
high intra-individual differences in time spent in heart rate zones when a person remained
in the same playing position (as much as 25% more time spent in the highest heart rate
zone), and when players changed positions during the game there was also a difference in
time spent in heart rate zone. For example, when one player started a game at WA and
moved to C at half time her overall game intensity was lower compared with games in
which she played C first and/or when she played C or WA for the whole game. However,
because a full set of results in terms of playing positions and matches were not studied, it
- 23 -

is impossible to say if these results show a clear outcome of the effect of changing
position on game intensity. The study did give some insight into the physiological strain
experienced by players during netball games by indicating the mean time spent in various
heart rate zones, which could correlate with exercise intensity and how hard the player is
working. However, a more comprehensive data set, which would include all playing
positions, would be required for a more complete picture.
Table 2.1 Heart Rate Intensity Zones (Woolford & Angove, 1991; 1992)
Limits Physiological definition
Zone 1 > 95% HRmax Indicative of maximal oxygen uptake
Zone 2 85-95% HRmax Zone where individual anaerobic threshold occurs
Zone 3 75-85% HRmax Zone where lactate threshold occurs
Zone 4 < 75% HRmax Aerobic zone
The relatively small amount of netball physiology research available indicates that while
the game does have similarities to other intermittent sports, there are also some clear
differences specifically in the movement patterns performed during a netball game. It
could be said that netball has its own discrete set of movements, particularly power-based
movements such as jumping and leaping to catch passes and to make interceptions, which
set it aside from other intermittent sports. Therefore, it would not be plausible to utilize a
simulation based on time motion analysis data from intermittent sports such as soccer,
rugby union or field hockey to investigate the physiology of netball. A separate
simulation based only on time motion analysis data from netball games has merit.
- 24 -

However, since this type of simulation does not yet exist in the scientific literature it will
be necessary to examine simulations from other intermittent sports in order to gain an
insight into design techniques that have proven successful for previous researchers.
2.4 Models for Simulating High-Intensity Exercise
The most ecologically valid way of assessing the effects of an intervention on an aspect
of an individual’s physiology during a sport is to apply the intervention to a real game
setting. However, research indicates that the intensity and type of movement experienced
in intermittent sports varies because of factors such as the opposition and ambient
conditions (Steele & Chad, 1991), which makes it difficult to assess whether changes in
physiological variables between one match and the next are a result of the intervention or
simply a result of differing match intensities. Difficulty in assessing the efficacy of
interventions in intermittent sports has led to the development of various simulations that
aim to closely replicate the demands of the intermittent sport for which they were
developed. These simulations are usually based on time motion or physiological data for
a specific sport or a combination of both. It has been recognized that these tests are
necessary to establish the benefits of intervention techniques in the form of nutritional,
ergogenic or physical training aids (Deutcsh et al., 1998; Alricsson et al., 2001).
2.4.1 Laboratory based models
Repeated bouts of high-intensity activity are easily replicated in the laboratory situation
and have often been the focus of intermittent exercise research (Balsom et al., 1992)
mainly because of the presence of well-controlled conditions such as ambient
- 25 -

environment and consistency in equipment and surroundings (Drust et al., 2000b;
Larsson, 2003). The laboratory offers a level of control over these factors that minimizes
any affect they may have on the outcomes of the research.
A treadmill simulation based on estimated exercise intensities observed during
competitive singles tennis was designed by Christmass and colleagues (1999). The test
lasted for 90 minutes with subjects running a work: rest circuit at a speed corresponding
to 120% OV& 2peak for 12 seconds and resting completely for 18 seconds many times over.
The study did not make comparisons between match data and the simulation to indicate
the validity of the simulation. However, the authors did suggest that the mean heart rate
response for the intermittent profile in the study (~89% HRmax) was fairly close to that in
match play (~83% HRmax) from a previous study (Christmass et al., 1998) indicating that
exercise intensity was similar in both conditions. However, the fact that the rest periods
were static may reduce the validity of this simulation because it is unlikely that a tennis
player will stand perfectly motionless between rallies or points for the time used in the
simulation. The musculature involved in tennis match-play will also be largely different
to that involved whilst purely running, particularly with respect to the movements made
by the upper limbs in hitting the ball. It would follow therefore that a sport such as
netball will involve different muscle groups to carry out movements such as jumping and
throwing to those involved in just running, and that these movements should be included
in a simulation.
- 26 -

Testing the efficacy of treadmill-based tests was the focus of two investigations into
tennis, with slightly different methodologies. Smekal and colleagues (2000) examined
the differences in performing incremental testing procedures on a treadmill versus a field
situation. Results indicated that measurements of heart rate and OV& 2 at the individual
anaerobic threshold were significantly higher in the field-based test (mean HR 175
beats·min-1; mean OV& 2 47.8 ml·kg·-1min-1) than those seen on the treadmill (mean HR
165 beats·min-1; mean OV& 2 44.4 ml·kg·-1min-1). Similarly, Ferrauti et al. (2001) showed
that, when working at the same proportion of OV& 2max, mean measurements of heart rate
(140 vs. 126 beats·min-1), lactate concentration (1.53 vs. 1.01 m·mol-1), blood glucose
concentration (5.45 vs. 4.34 m·mol-1) and respiratory exchange ratio (0.93 vs. 0.88) were
significantly higher during a tennis match than during a treadmill run. Both these studies
indicate that the metabolic profile of intermittent sports is different from running on a
treadmill, with game activities exhibiting a strong emphasis on glycolysis (through
evidence of lactate production as a by-product) and glycogenolysis (as a consequence of
the high intensity nature of the activity profile) as energy sources in tennis. It follows that
a treadmill-based test may not be appropriate to simulate the metabolic effects of netball.
A soccer-specific intermittent test was developed by Drust and colleagues (2000b) and
performed on a treadmill. It was based on movement activities observed by Reilly and
Thomas (1976). Activity patterns included walking, jogging, cruising and sprinting, and
each was given its own discrete speed. The test was split into two 22 ½ minute cycles
consisting of 23 discrete activity bouts: six each of walking and jogging, three cruises and
eight sprints. These activity patterns were performed in a non-cyclical order, although
- 27 -
predominantly with high-intensity exercise preceding a period of low-intensity exercise.
The original test involved performing this cycle twice in order to replicate one 45-minute
half of a soccer game and it has since been modified to represent a full 90-minute game
(Drust et al., 2000a). In this way the test replicates both the time and activity based
elements of a soccer game, while the estimated energy expenditure value of 68% OV& 2max
falls very close to those previously cited for intermittent sports. This test has been used
as an investigative tool by various soccer researchers (Drust et al., 2000a; Rahnama et al.,
2003; Clarke et al., 2005; Sari-Sarraf et al., 2006). However, the authors themselves
recognise the limitations of the test in that there are no game skills such as kicking and
tackling, there are fewer activity changes than those seen in a soccer game, and utility
movements such as moving sideways and backwards are omitted. There is also the
absence of the acceleration and deceleration phases of changes in direction. The use of a
motorized treadmill in this study meant that the running activity differed from that
experienced during soccer because athletes often alter stride length and stride frequency
to cope with treadmill running (Riley et al., 2008), and made assessment of any power
decrements in high intensity exercise over the course of the test difficult. This issue could
have been rectified by the introduction of a non-motorized treadmill for assessment of
sprint running (Lakomy, 1987). While testing the efficacy of the non-motorized treadmill
for analyzing sprint performance Lakomy (1987) found similarities between free-running
and sprinting on the non-motorized treadmill. However, there were also major
differences including a 20% decline in maximal sprint speed from free running to
treadmill sprinting. While it may be possible to replicate intermittent activity profiles on a
treadmill in terms of intensity, they will lack ecological validity because the very
- 28 -

movements that define the sport in question are absent. Therefore, a netball simulation
must be performed in such a way that sideways, backwards and diagonal movements can
be performed along with forward running.
Further barriers to the use of laboratory based protocols for team sport participants
include expense and accessibility, and poor transfer of results from these tests to physical
performance in specific sports (Alricsson et al., 2001). Many laboratory based tests use
activities such as cycle ergometry or running in a single direction that are not a true
representation of the movement or muscle activity patterns of intermittent team sports and
do not measure sport-specific performance (Smekal et al., 2000; Ferrauti et al., 2001;
Larsson, 2003). Hoffman and colleagues (1996) noted that the inclusion of upper body
exercise into a lower body test elicits substantially different physiological responses,
resulting in differences in the measured values of parameters, including an elevated OV& 2
at a given power output. This would indicate that cycling protocols are not ideal for the
physiological assessment of free-running activities, and therefore would not be
appropriate to simulate a netball game.
In summary, although laboratory based simulations are useful for research in a controlled
environment, they are probably not applicable to intermittent sports due to the lack of
specific movement patterns involved in these sports and the extra inertial energy required
to change these movement patterns at regular intervals. This has repercussions for the
- 29 -
ecological validity, muscle use and metabolic profile observed in the simulation and that
observed in the intermittent sport in question.
2.4.2 Shuttle running simulations
Many authors have recognized the difficulty in replicating physiological aspects of
intermittent sports in controlled laboratory settings and have concluded that field testing
is often more valid and relevant to the sport concerned (Bergeron et al., 1991; Ferrauti et
al., 2001; Cronin & Owen, 2004). Based on this conclusion many authors have attempted
to create simulations in environments with greater ecological validity.
A soccer simulation aimed at replicating the conditions of a game of high intensity was
developed in Europe by Rico-Sanz and colleagues (1999). The simulation was deemed to
be more demanding than an average soccer game, mainly because the lack of walking
elevated the overall intensity of exercise. Participants were required to run at three
different velocities representing the activities of running, jogging and sprinting over 15-
metre shuttles. Players performed three 30-metre laps of running, one lap of jogging and
one of sprinting, totaling 150-metres with the total distance taking one minute to
complete. Stopwatches were used to test for velocity compliance and to time the sprint
performance. Termination of the test occurred when 30-metre sprint time exceeded 7
seconds or when the subject reached volitional fatigue (decided they could not carry on).
The authors indicated that the test could be applied when comparing soccer-specific
endurance levels between players since it reported a time point for exhaustion, a measure
which is often difficult to assess during actual games. The test was also reported to
- 30 -

represent the activities and frequency of the changes in those activities during matches.
Group heart rate during the test fluctuated between 160-200 beats·min-1, reflecting a
similar profile to that seen in other soccer match play research. Limitations in the test
include the absence of a standing or walking rest period, although the protocol was
originally designed to be high-intensity, as indicated through recognition by the authors
that it is significantly more demanding than a normal soccer game. Also, fatigue in the
original study occurred, on average, around 42 minutes. This is not representative of a
full soccer game and will have limited application to intervention studies looking at full
game performance. The protocol has been used to research aspects of fatigue (Rico-Sanz
et al., 1999; Zehnder et al., 2001), and this appears to be its main application. Therefore,
this would only be a reliable model on which to base a netball simulation if it was
designed to investigate fatigue.
At Loughborough University in the UK, Nicholas and colleagues (1995; 2000) used
descriptive data from previous match analysis to design a field test to simulate the activity
pattern of a full soccer game called the Loughborough Intermittent Shuttle Test (LIST).
The LIST was similar to the test set up by Rico-Sanz et al. (1999), although the LIST
used a 20-metre distance and walking activity was included. Three shuttles of 20-metres
were completed for each of walking, jogging and cruising activities, with the latter two
being based on running speeds that would elicit 55% and 95% of a subject’s OV& 2max,
respectively. Sprinting consisted of one 20-metre shuttle, followed by four seconds of
active recovery (walking) to prepare for the next shuttle. Intensity of exercise was strictly
controlled by the presence of an audio signal indicating the half-way point and the end of
- 31 -

a shuttle. This circuit was repeated for 15 minutes, followed by a rest period of three
minutes and each 15-minute block was repeated five times, representing 75 minutes of
activity. The LIST has since been modified by adding an extra 15-minute period to
represent a full 90-minute game (Ali et al., 2007a; Backhouse et al., 2007; Foskett et al.,
2008). The LIST has shown good test-retest reliability and appears to replicate soccer
match play both on an activity level (total distance covered - 11.1km; number of sprints –
55-60; and turns completed ~600) and on a physiological level (blood lactate
concentrations – 5.7-6.2 mmol·l-1; mean heart rates – 169-171 beats·min-1) (Nicholas et
al., 2000). There is no soccer-specific or utility activity in the protocol such as running
backwards and time spent dribbling and passing. The authors recognised that energy
expenditure would be increased during these activities because running while dribbling a
soccer ball increases the net energetic cost by 5.2 kJ·min-1 compared to running at the
same speed without a ball over a range of speeds (Reilly & Ball, 1984). However, match
analysis data failed to report the percentage of game time spent in possession of the ball
possibly because it represented a small proportion of the match. In a review of soccer
data, Reilly (1997) mentioned that distance covered with the ball by top class players
often equated to less than 2% of total distance. Nicholas et al. (2000) concluded that the
LIST protocol could be a useful research tool since it maintains control over both the
environment and the pattern of exercise, both of which are often compromised in the
match situation. The LIST has since been used to assess the physiological effect of
various intervention strategies (Ali et al., 2007a; Backhouse et al., 2007; Foskett et al.,
2008), and modified for use as a performance test to differentiate between standard of
player (Edwards et al., 2003). As a result of the similarities in movement patterns and
- 32 -

physiological observations between the LIST and soccer match play, it is a good model
on which to base a simulation for other intermittent sports including netball.
In order to address the absence of a ball in many of the soccer-specific simulations
Bishop and colleagues (1999) developed a protocol with the inclusion of a ball. They
based the activity patterns on data collected from a previous study by Bangsbo et al.
(1991), calculating approximate distances from mean time and speeds for each activity.
A simple protocol of cyclical activity patterns was then designed for use in a field setting.
The shuttle was 50 metres in length and each cycle contained the following activities: 1
shuttle dribbling a ball through cones, 1 shuttle backwards running, ½ shuttle cruising, ½
shuttle sprinting, 1 shuttle walking. On completion of each shuttle participants moved 5
metres to the side, although the intensity of this movement was not specified. This meant
that an additional 15-metre walk was required at the end of the circuit to return to the
starting point. Each circuit lasted just over two minutes, was performed seven times
(totaling 15 minutes) and the 15-minute exercise bouts were separated by a one and a half
minute rest period. This was repeated three times to represent half of a soccer match,
followed by a 15-minute rest period and then performed again to represent the second half
of the game. Total distance covered during the test was reported to be slightly less than
during the LIST (Nicholas et al., 2000) but still representative of previously reported
soccer data. At 167 beats·min-1 heart rate data for the simulation compared well with
previous data. The use of ball contact and some backwards motion addressed some of the
energy expenditure issues seen with other protocols, although there was still an absence
of other soccer-specific activities such as heading, tackling and jumping, which would
- 33 -

have further increased energy expenditure. Ball contact occurred for a distance of
roughly 2 km, possibly over-estimating the proportion of game-time spent with the ball at
the feet, and as a result match play energy expenditure may have been overestimated
using this simulation. This study highlighted the difficulties of including ball contact in
an intermittent activity test and may provide some justification for excluding this aspect
of a sport from a simulation.
Researchers in sports other than soccer have also attempted to create simulations of game
conditions. Time motion analysis data from first-class rugby union games formed the
basis of a test designed by Deutsch at the University of Otago, New Zealand (2001). The
simulation was not purely a running protocol like those created for soccer, but consisted
of a circuit of 11 different stations performed 14 times. Activities performed on the
stations were a 20-m linear sprint, a 22-m agility sprint (offensive sprint), 4 walking
stations, a dynamic drive using a dynamometer cart, a 33-m agility sprint (defensive
sprint), a 31-m agility sprint (tackle sprint – included use of a tackle bag), ball passing at
a target (passing accuracy) and a 30 m linear sprint. Simulation of a game was achieved
by splitting the 14 circuits into two 40-minute halves with a 10-minute rest at half-time.
Subjects were given 30 seconds to complete each of the 11 stations, with any extra time
left being given as rest. Rugby union can be considered a highly skilled game, with a
relatively high proportion of game time spent in static exertion type activities by certain
groups of players (Deutsch et al., 1998). It would seem, therefore that this test is a good
replication of the activities involved in rugby game play, and it has since been used to
assess the ergogenic affects of caffeine on performance (Stuart et al., 2005). However,
- 34 -

there is relatively little comparison with the actual physiological stress associated with a
rugby game, particularly the different modes of running intensity. Although the total
distance covered during the test at sprinting intensity was close to that reported in the
literature at around 700 m, there was also a further contribution to high intensity exercise
from speed-agility activity. This may mean players were working at a higher overall
exercise intensity during the protocol than they would in a game. Development of a
simulation needs to take into account the movement patterns used to replicate high
intensity activity. This is especially pertinent in netball where straight sprinting appears
to contribute relatively little to the overall activity pattern despite the presence of other
high intensity movement (Steele & Chad, 1992).
Rugby union and soccer are both intermittent sports where the time for completion of the
game is set and extra time is only added on for injury breaks or in tournament situations
to determine a winner. For racquet sports this is not the case, and games can vary in
length quite considerably. Davey and colleagues (2003) attempted to design a simulation
for tennis match play based around match analysis data. Players performed 11 sets each
consisting of a service game (3 minutes 16 s consisting of serves and groundstrokes)
followed by a long recovery (1 minute 30 seconds) followed by a receiving game (3
minutes 10 s consisting of groundstrokes and recovery) followed by a short recovery (30
seconds). The total time taken to complete this protocol was 92 minutes 46 seconds,
which compared favorably with the minimum match length reported from observations
by the authors of actual match play of 95 minutes 28 seconds. However, this was only
the minimum match length and games could exceed this time significantly. Therefore,
- 35 -

extending the length of the test would make it more closely replicate the average match
length to better cover all possible game durations. It is possible that by using the
minimum match length the authors were only replicating the easier games, which were
perhaps completed more quickly because of a weak opponent. However, by applying an
intervention to an average game an overall picture of the effect of that intervention on the
particular intermittent sport may be gained. The authors did conclude, that the simulation
had been successful in replicating the intermittent character of tennis, and that heart rate
measurements during the simulation were very similar to those reported in previous tennis
match data.
Kingsley and colleagues (2006) created two versions of a squash simulation, one to
simulate average match play, and one to quantify squash-specific fitness. Both versions
required players to move to one of eight pre-determined court positions with a racquet in
hand using squash-specific footwork patterns determined from previous notational
analysis. At each court position the participant played a simulated stroke and then
returned to a central “T” position on court. Tight control was maintained over the pattern
and speed of all movements by the use of pre-recorded audio signals. During the squash-
simulation players completed four rallies of eight strokes (each with a different length and
movement pattern), repeated six times to represent a game of approximately 12 minutes
in duration. The authors found that, compared to intense match play, the simulation
exhibited similar results in terms of length of play, physiological responses (mean heart
rate – 179 vs. 180 beats·min-1; mean blood lactate concentration – 1.8 vs. 3.5 mmol·l-1)
and perceived exertion (14 vs. 17). They then used the results from the multi-stage
- 36 -

squash test (MST) to establish that the squash-specific fitness of their subjects was similar
in order to support their findings and confirm that the physiological responses to the
original protocol were a result of the activities performed and not different levels of
fitness. The MST was similar to the simulation, with rallies consisting of one minute
stages. However, the time allowed to reach the simulated-shot court position was
incrementally reduced with each subsequent stage until players reached volitional
exhaustion and could not continue the test. Time to exhaustion was similar across all
subjects (18.0 ± 1.0 minutes). This is important when monitoring physiological responses
to a simulation to ensure that they are a product of the activity patterns only and not a
result of different levels of fitness.
It is clear from the literature that simulations do offer a viable option for assessing the
physiological demands of, and the effects of intervention strategies on, intermittent sport
performance while maintaining a controlled and replicable situation. Examination of
various simulations from intermittent sports indicates that a netball simulation should be
designed from time motion analysis data representing the average game, that it should
include other high intensity movement patterns that just sprinting and that it may be
pertinent to refrain from including ball based activities since these only make up a small
proportion of one player’s game time. The relative success of many of previous
intermittent sport simulations suggests that a similar approach can be applied to netball,
opening up the possibility of further scientific investigation of the game as a whole.
- 37 -

2.5 Reliability & Validity
Reliability is the extent to which a variable can be repeatedly measured in a consistent
manner (Fallowfield et al., 2005). If a test is not reliable then it cannot be considered
valid (Thomas & Nelson, 2001). It will be important to establish whether the NIAT is
reliable before assessing validity. If the NIAT was performed on two separate occasions,
controlling for all other variables, we would expect to see the same results for %HRmax,
sprint time, jump height and circuit time on each occasion. Delivering similar
measurements when the test is repeated at a different time is known as test-retest
reliability (Gratton & Jones, 2004). The test-retest reliability of the NIAT will be
assessed by having all subjects perform the simulation on two occasions. Statistical
analysis will be carried out on data collected from the two trials to establish if the test is
repeatable.
In its most basic form validity is a measure of whether a test is measuring what it is
supposed to measure (Thomas & Nelson, 2001; Gratton & Jones, 2004; Fallowfield et al.,
2005). Basically, is the NIAT actually measuring or displaying the activity patterns and
physiological demands of a netball game? However, validity is not quite as simple and
there are several different forms of the measure. It is important to know exactly which
form you are most interested in before attempting to test for it. Criterion validity refers to
the degree in which results relate to a recognized criterion value. One type of criterion
validity is concurrent validity in which a measuring instrument is administered
concurrently or at about the same time (Thomas & Nelson, 2001). In the current study it
- 38 -

is concurrent validity that is being examined since %HRmax during the test is being
compared to the measured physiological strain criterion value of %HRmax during match
play at the same time during the season/year. Therefore, if the NIAT %HRmax scores
show a good level of validity compared to those from match play it can be said that the
NIAT has good criterion validity.
2.6 Summary
Research examining the physiological demands of intermittent sports is readily available,
although relatively little of it relates to netball. It would appear that netball has some
similarities to the profiles observed in sports such as rugby, soccer and hockey. However,
additional constraints in player movement result in specific netball movement patterns
and clearer positional differences in physiological data. Time motion analysis data give a
clear picture of the movement and activity patterns of netball players, although to gain a
clearer understanding of the physiological strain experienced during a game it is
necessary to obtain a complete data set for the full range of positions in a netball team, the
results of which may also be used to examine the criterion validity of a designed
simulation. For this reason the heart rate profiles of senior netball players will be
collected in the current study to examine positional patterns in match intensity, and to
compare this match intensity data to simulation intensity data.
Simulations of match-activity create a repeatable and controlled method of assessing the
efficacy of intervention trials on intermittent sport profiles. Previous simulations
- 39 -

designed for other intermittent sports have proven reliable and valid and have since been
used to investigate their particular sport further. However, due to the discrete
physiological demands placed upon netball players during a game, along with
consideration of the positional variations, it would appear necessary to develop a
simulation based solely around netball activity data in order to assess the benefits of
selected ergogenic, nutritional and training variables on netball match performance.
Therefore, time motion analysis data from previous research (Steele & Chad, 1991) will
be used to design a simulation that replicates netball movement patterns and activity
intensities. The simulation will be performed on two separate occasions to assess for
reliability.
2.6.1 Assumptions of the study
The following assumptions were made in the present investigation:
i. Similar fitness levels were maintained by individual subjects during the study.
ii. Subjects followed similar hydration, nutritional and training patterns prior to the
collection of both match and NIAT data.
iii. Subjects were sufficiently familiarized with the NIAT protocol during the
investigation to negate any learning effects between trials.
iv. Heart rate was an indicator of the physiological demands of activity only.
- 40 -

CHAPTER III
METHODOLOGY
3.1 Introduction
The study was completed over two netball seasons (each of four months in length) and
consisted of three parts:
◊ Preliminary measurements (including familiarisation)
◊ Game Data
◊ Netball Intermittent Activity Test (NIAT) Main trials.
3.2 Subject Characteristics
Eleven female club netball players participated in the study, which received approval
from the Massey University Human Ethics Committee. All players were regular
participants in a regional Premier Club competition and were training habitually.
Participants were recruited during visits to training sessions. All data were gathered
during the competition phase of the season. Details of the study were outlined to
participants (Appendix A) who then signed a statement of informed consent (Appendix
B) and completed a health questionnaire (Appendix C) prior to beginning the
investigation.
- 41 -

3.3 Preliminary Measurements
A number of preliminary measurements were recorded during the familiarisation trials.
3.3.1 Physical Characteristics
Body mass (69.3 ± 5.3 kg), height (173.3 ± 5.5 cm) and age (21.4 ± 3.1 years) were
recorded. Clothed body mass was measured to the nearest 0.1 kg using a set of digital
scales (UC-321, A&D Co. Ltd., Tokyo, Japan). Height was recorded to the nearest 0.1
cm using a stadiometer (26SM, Surgical & Medical Products).
3.3.2 Maximal Oxygen Uptake ( OV& 2max) & Maximum Heart Rate (HRmax)
Participants performed a Multistage Fitness Test (Ramsbottom et al., 1988) in order to
estimate maximal oxygen uptake. The procedure was fully explained to the participants
on arrival at the testing venue, following which a standardised five minute jogging and
stretching warm-up was performed. Participants wore a coded heart rate monitor (Polar
S610i, Polar, Finland) for the duration of the test. Verbal encouragement was provided
throughout completion of the Multistage Fitness Test.
The Multistage Fitness Test consisted of shuttle runs across a distance of 20 m, with the
running speed being dictated by audible (“beep”) signals from a pre-recorded compact
disc. Running speed was 2.22 m·s-1 initially and increased progressively by
approximately 0.14 m·s-1 every minute. The test required participants to place one foot
on or over the 20-m marked line, failure to do so resulted in a warning. Participants
continued performing the required shuttle pattern until volitional exhaustion or failure to
- 42 -

adhere to the shuttle pattern resulted in them being withdrawn from the test. The level
and shuttle number reached were recorded (Appendix) and a conversion table was used to
estimate OV& 2max (Ramsbottom et al., 1988). The highest heart rate reached during the
test was recorded as a subject’s individual HRmax.
3.4 Game Data
Participants were required to wear a coded heart rate monitor with data storage (Polar
Team System, Polar, Finland) during Premier Club competition. The nature of the coded
heart rate monitors allowed for accurate data collection within the rules of the game. It
was initially intended to collect blood lactate concentration data during match play.
However, consultation with the coaches and umpires involved resulted in the logistics of
this being questioned and the collection of such data was not permitted. The games
consisted of four 15 minute quarters, with three minute breaks at quarter times and a five
minute break at half time. Games were played at the same indoor venue, on the same
night of the week during the season and were played at either 6.45 pm or 8.15 pm. Data
were collected until at least two full games were recorded for each subject. Player
position was noted during the games, and the participants performed their team warm-up
as they usually would during a competition match.
- 43 -

3.5 Netball Intermittent Activity Test (NIAT)
Previous time-motion analysis data (Steele & Chad, 1991) were used to develop an
intermittent activity protocol that replicated movement patterns seen in netball match
play. The test was performed on a netball court, and consisted of a circuit made up of
different activity patterns (Figures 3.1 and 3.2). Participants had 130 seconds to complete
this circuit, with the pace of each activity pattern being self-selected. If the circuit was
completed within 130 seconds, participants were encouraged to undertake a short active
recovery before assuming position to re-start the circuit. The circuit was performed seven
times to represent a 15-minute quarter, and then performed four times to represent a
whole game. Quarter breaks consisted of three minutes, while half time consisted of five
minutes break. Performance data recorded during the test consisted of five metre sprint
speed, vertical jump height and total time taken for each circuit.
Positional variations in the test were distinguished by the activity pattern during the skill
circuit section of the protocol. These patterns are described in Table 3.1.
3.5.1 Familiarisation
Participants were allowed to familiarise themselves with the NIAT protocol by attending
a preliminary trial where they performed one 15-minute block of the NIAT. During this
trial they wore a coded heart rate monitor (Polar S610i) and were also given the
opportunity to become accustomed to the other data-gathering methods used during the
protocol such as the vertical jump and 5-metre sprint.
- 44 -

Table 3.1. Activity patterns during skill section of the NIAT protocol by
positional variation.
Positional Group
Activity between
cones
Activity at front
cones
Activity at back
cones
Circle Defence (D) Shuffle Defend shot Jump
Centre Court (C) Shuffle Jump Jump
Circle Attack (A) Shuffle Shoot Jump
3.5.2 Main trials
Participants performed two main trials of the NIAT, separated by a minimum of five
days. Each trial was performed in the evening at a similar time to when the match data
was collected.
A 30-minute standardised warm up consisting of jogging, footwork patterns, stretching
and ball drills was performed before each trial, replicating the warm-up usually
performed before competition games (see Appendix D for schematic of standard warm
up). Participants were requested to follow the same pattern of food and drink
consumption and physical activity pattern prior to all matches and NIAT trials.
- 45 -
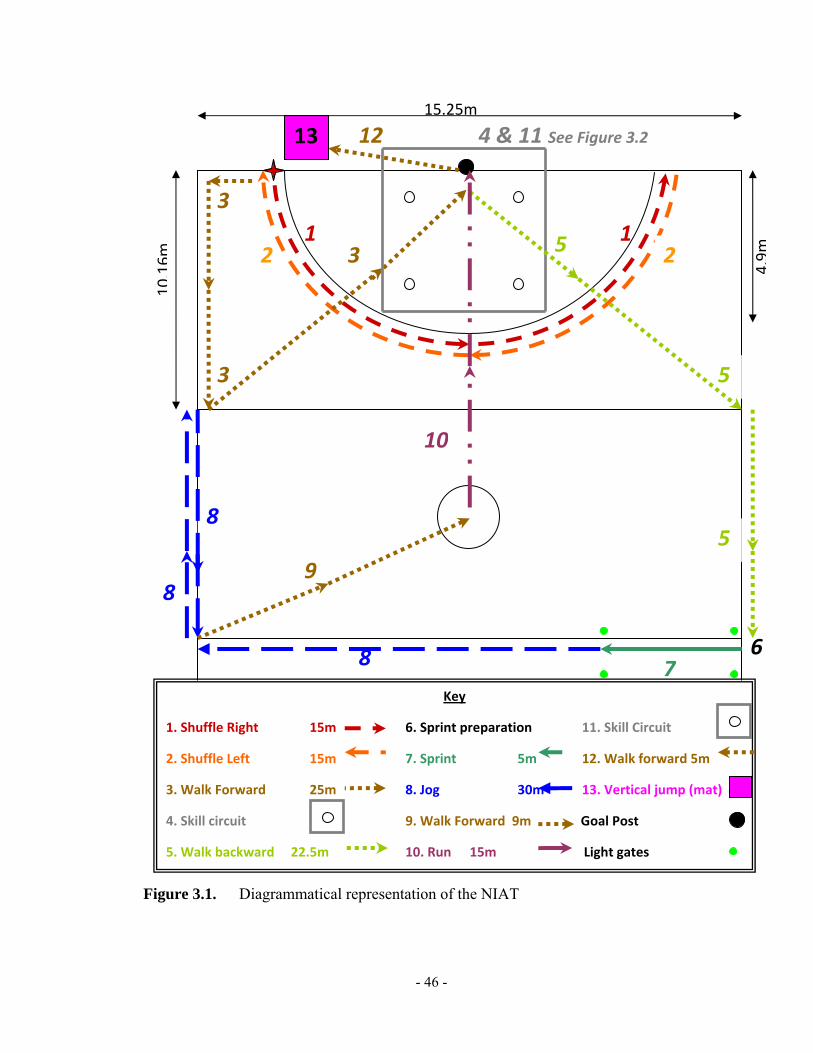
6
15.25m
12
8
4 & 11 See Figure 3.2
10
10
78
9
8
5
53
3
3
2
Figure 3.1. Diagrammatical representation of the NIAT
1 1
13
2
10.16m
5
4.9m
Key
6. Sprint preparation 11. Skill Circuit
2. Shuffle Left 15m 7. Sprint 5m 12. Walk forward 5m
3. Walk Forward 25m 8. Jog 30m 13. Vertical jump (mat)
4. Skill circuit 9. Walk Forward 9m al Post
5. Walk backward 22.5m 10. Run 15m Light gates
1. Shuffle Right 15m
Go
10
- 46 -

Figure 3.2. Diagrammatic representation of the skill circuit within the NIAT. (Participants begin at the central point, shuffle out along the red lines to one of the four cones, perform a skill and then shuffle back to the central point).
Four blocks of 15-min of the NIAT were performed during each trial to match the time
spent playing during competition games. Participants wore coded heart rate monitors
(Polar S610i, Polar, Finland) programmed to record heart rate every five seconds. Sprint
speed over five metres was recorded using wireless timing gates (Brower Speedtrap 2,
USA), vertical jump height was recorded using a jump mat (Speedlight, Australia), and
total circuit time was recorded with a digital clock (Electronic 870A, China). Verbal
encouragement was given during the sprint and jumping activities in order to induce
- 47 -
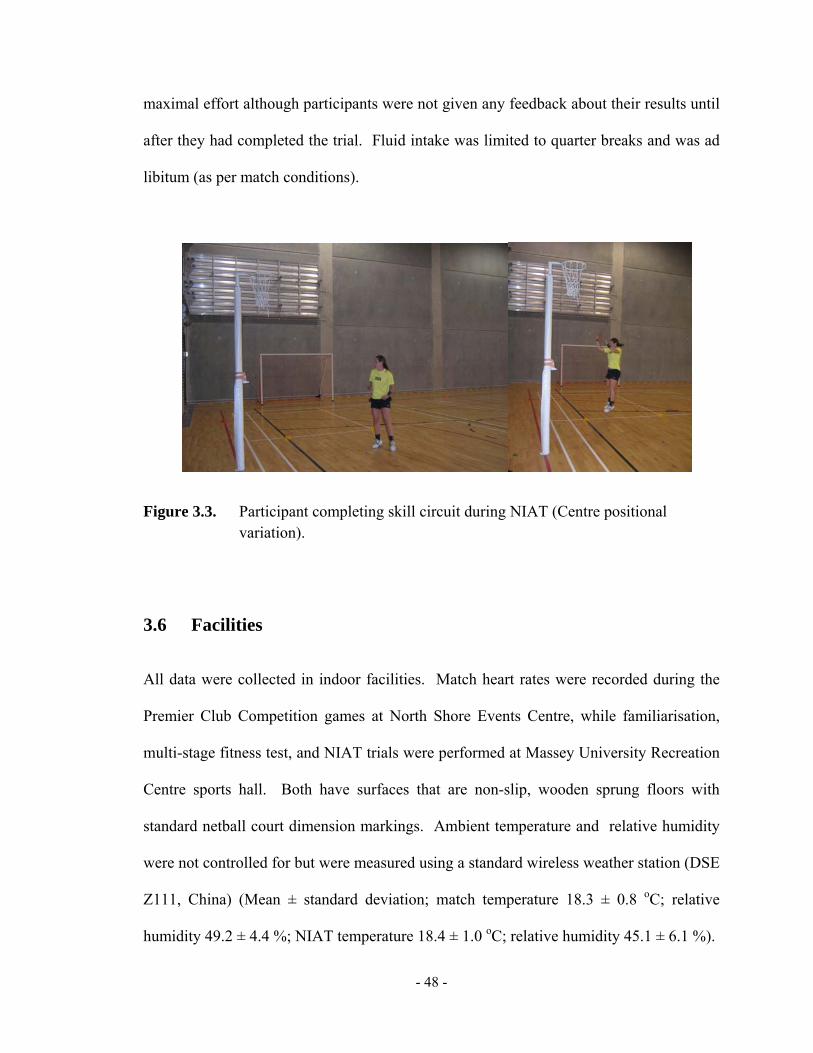
maximal effort although participants were not given any feedback about their results until
after they had completed the trial. Fluid intake was limited to quarter breaks and was ad
libitum (as per match conditions).
Figure 3.3. Participant completing skill circuit during NIAT (Centre positional variation).
3.6 Facilities
All data were collected in indoor facilities. Match heart rates were recorded during the
Premier Club Competition games at North Shore Events Centre, while familiarisation,
multi-stage fitness test, and NIAT trials were performed at Massey University Recreation
Centre sports hall. Both have surfaces that are non-slip, wooden sprung floors with
standard netball court dimension markings. Ambient temperature and relative humidity
were not controlled for but were measured using a standard wireless weather station (DSE
Z111, China) (Mean ± standard deviation; match temperature 18.3 ± 0.8 oC; relative
humidity 49.2 ± 4.4 %; NIAT temperature 18.4 ± 1.0 oC; relative humidity 45.1 ± 6.1 %).
- 48 -
3.7 Statistical Analysis
All data were tested for parametric assumptions of normality (Kolmogorov-Smirnov) and
homogeneity of variance (Levene’s test) at p<0.05.
Match data for mean %HRmax was grouped in three different ways and each analysed
separately. Firstly, mean %HRmax for all players was separated into four playing quarters
(1st, 2nd, 3rd, and 4th), which were all compared with each other to give an indication of any
changes in match intensity over the duration of the game. Mean %HRmax for the whole
game was then compared between positional groups (Defences n = 3, Wings n = 3,
Centres n = 2, and Attacks n = 3) to examine if match intensity data supported previously
identified positional groupings. The analysis on heart rate data during match play
grouped across four playing quarters (Q1 D(10) = 0.14, ns; Q2 D(10) = 0.18, ns; Q3
D(11) = 0.18, ns; Q4 D(11) = 0.18, ns; equal variances F(3, 38) = 0.43, ns) and across
four positional groups (D D(12) = 0.12, ns; W D(12) = 0.14, ns; C D(8) = 0.19, ns; A
D(10) = 0.15, ns; equal variances F(3, 38) = 0.71, ns) indicated positive assumptions of
normality and homogeneity of variance (p>0.05). Therefore, two-way analysis of
variance (ANOVA) with playing quarter and positional group as fixed factors was used to
determine differences in heart rate data during match play. Bonferroni tests were
performed post-hoc to determine where any differences lay. The intensity data for match
play was also examined further by looking at time spent in heart rate zone for each
positional group. Time in heart rate zone for positional groups violated assumptions of
normality and homogeneity (p<0.05). Analysis was carried out using Kruskall-Wallis
non-parametric test, with post-hoc Mann-Whitney U tests to determine any differences in
- 49 -

intensity between the four positional groups. At this stage null hypothesis H01 was
rejected or accepted depending on the outcome of the analysis.
Data for mean %HRmax during the game was compared to mean %HRmax during the
NIAT to examine the criterion validity of the NIAT. Positional groupings in this section
of the analysis depended upon the outcome of the previous analysis of mean %HRmax
during match play. This indicated that positional grouping for the NIAT should reflect
the similarity in exercise intensity between the C and W group, so that these combine to
form one Centre Court group (CC, n = 5), and thus three groups in total. Heart rate data
for condition (NIAT vs. Match) was found to violate the assumption of normality and
homogeneity, specifically %HRmax for the Defence group in NIAT (D(24) = 0.351,
p<0.05) and unequal variance was found within the %HRmax NIAT data set (F(2,85) =
8.721, p<0.05). Therefore, heart rate for condition data were analysed using Wilcoxin
signed ranks test. At this stage null hypothesis H02 was rejected or accepted depending
on the outcome of the analysis.
Subject characteristic data for estimated OV& 2max and HRmax between positional groups
violated assumptions of normality and homogeneity (p<0.05) and so were analysed using
Kruskall-Wallis non-parametric tests, with post-hoc Mann-Whitney U tests.
- 50 -

Test-retest validity was assessed for the NIAT by comparing sprint times, jump height,
circuit times and mean %HRmax between NIAT1 and NIAT2. These parameters were also
examined over the duration of both NIAT trials in order to examine for effects of fatigue.
All data collected during the NIAT trials and grouped according to trial were shown to be
normal and homogenous (p>0.05) and so two-way analysis of variance (ANOVA) with
repeated measures was applied to protocol data to determine any differences between
trials (NIAT1 vs. NIAT2). Pearson’s correlation (r) and intra-class correlation
coefficients (ICC) were used to assess reliability between sets of scores. The method
chosen to calculate ICC was the “two-way random” method, as suggested by Atkinson
and Nevill (1998), using SPSS (version 16.0). The standard error of measurement (SEM)
was also used to assess test-retest reliability using the most common method of SEM =
s√1 – ICC (Atkinson & Nevil, 1998). The SEM covers only 68% of the population (s
standard deviation (s)) and so to make it applicable to 95% of the population (i.e. 1.96 s),
the 95% confidence intervals (95% CI) were calculated by multiplying the SEM by 2.
The coefficient of variation (CV) was used as a further method to assess reliability of the
NIAT data by dividing the standard deviation by the mean and multiplying by 100. The
final method of assessing repeatability was the “95% absolute levels of agreement”
(LOA) as proposed by Bland and Altman (1986). The methods used to assess reliability
are similar to those used to assess the reliability of soccer skill tests (Ali et al., 2007b). At
this stage null hypotheses H03 and H04 were rejected or accepted depending on the
outcome of the analysis. The null hypotheses were rejected at an alpha level of p<0.05
unless otherwise stated.
- 51 -

CHAPTER IV
RESULTS
4.1 Match Data
4.1.1 Playing Quarter
There was a significant main effect of game quarter on %HRmax during match play (F (3,
26) = 3.42, p<0.05, ω2 = 0.03). Post-hoc tests revealed a difference in %HRmax between
Quarters 1 and 3, and 1 and 4 respectively. However, these differences were not
significant at the alpha level (Quarter 1 vs. Quarter 3 p = 0.053; Quarter 1 vs. Quarter 4 p
= 0.053) (Figure 4.1). Further analysis of %HRmax between match halves using two-way
analysis of variance (ANOVA) with playing half and positional group as fixed factors
revealed a significantly lower %HRmax in the second half of match play compared to the
first F (1, 13) = 6.65, p<0.05, ω2 = 0.005 (Figure 4.2).
80.00
82.00
84.00
86.00
88.00
90.00
92.00
94.00
Q1 Q2 Q3 Q4Match Quarter
Mea
n %
HR
max
Figure 4.1 Mean (± SD) % HRmax for the four quarters of match play.
- 52 -

*
80.00
82.00
84.00
86.00
88.00
90.00
92.00
94.00
H1 H2Match Half
Mea
n %
HR
max
Figure 4.2 Comparison of match %HRmax between halves (mean ± SD).
* Significantly different from H1 (p<0.05)
4.1.2 Positional Group
There were no significant differences between positional groups for OV& 2max (H(2) = 5.07,
p>0.05) and HRmax (H(2) = 1.20, p>0.05); (Table 4.1).
Table 4.1 Median OV& 2max and HRmax values by positional group.
Positional Group Median OV& 2max
(ml·kg-1·min-1)
Median HRmax
(beats·min-1)
Defence (n=3) 45.6 196.0
Wings (n=3) 51.3 199.5
Centres (n=2) 51.2 202.0
Attacks (n=3) 48.4 194.0
- 53 -

There was a significant main effect of playing position on %HRmax during match play F
(3, 26) = 20.25, p<0.001, ω2 = 0.63. Post hoc t-test revealed that %HRmax for Defence
players was significantly higher during the game than all other positions (p<0.005), and
%HRmax for Centres was significantly higher than Attack players (p<0.005) (Figure 4.3).
78.00
80.00
82.00
84.00
86.00
88.00
90.00
92.00
94.00
96.00
Defence Wings Centres AttacksPositional Group
Mea
n %
HR
max
*†
Figure 4.3 Mean (± SD) %HRmax during match play for the different positional groups.
* Significantly different from all other positional groups (p<0.005)
† Significantly different from Attack (P<0.005)
There was no significant difference between percent of total game time (%time) spent in
HR Zones 1, 2 and 4 between positional groups (heart rate zones are defined in Table
2.1). The non-parametric tests revealed a significant difference between positional
groups for %time in Zone 3 (H(3) = 7.227, p<0.05). Mann-Whitney tests were used post-
- 54 -

hoc, looking at differences between Attacks and all other positions. A Bonferroni
correction was applied and so all effects are reported at a 0.0167 level of significance. It
appeared that %time in Zone 3 was no different between Attacks and Defence (U = 0, r =
-0.80), Attacks and Wings (U = 0, r = -0.80), and Attacks and Centres (U = 0, r = -0.77).
Results are illustrated in Figure 4.4.
Zone 4Zone 3Zone 2Zone 1
Heart Rate Zone
100.00
80.00
60.00
40.00
20.00
0.00
Med
ian
% T
ime
in Z
one
Circle Attack Centres Wings Circle Defence
Positional Group
Figure 4.4 Median % time in Heart Rate Zone by positional group.
- 55 -

4.2 NIAT Criterion Validity
For the Defence group %HRmax was not significantly different between match play (Mdn
= 92.52%) and NIAT (Mdn = 86.27%), T = 0, p>0.05. For Centre Court players,
%HRmax was significantly higher during match play (Mdn = 89.70%) than during NIAT
(Mdn = 79.70%; T = 0, p<0.05, r = -0.91). For the Attack group % HRmax was not
significantly different between match play (Mdn = 86.95%) and NIAT (Mdn = 82.93%; T
= 0, p>0.05) (Figure 4.5).
0.00
10.00
20.00
30.00
40.00
50.00
60.00
70.00
80.00
90.00
100.00
Defence (n=3) Centre Court (n=5) Attacks (n=3)Positional Group
Med
ian
%H
Rm
ax
MatchNIATa
Figure 4.5 Median % HRmax for Positional Groups in Match and NIAT.
a Significantly higher than protocol (p<0.05)
- 56 -

4.3 NIAT Reliability
4.3.1 Sprint Time
There was no significant difference in sprint data between NIAT trials (F (1, 10) = 1.39,
p>0.05) (Table 4.2). There was also no significant difference in sprint data between
quarters of NIAT trial, F (3, 30) = 1.52, p>0.05. Furthermore, there was no significant
interaction between NIAT trial and quarter for sprint data, F (3, 30) = 1.27, p>0.05.
There was a moderate correlation between trials for 5 m sprint time (r = 0.66, p<0.001;
Table 4.3). The ICC for sprint time, although calculated differently, shows an identical
result as the Pearson’s correlation (Table 4.3). The SEM and 95% CI for sprint time were
low (0.03 and 0.07s respectively) indicating reliability of this aspect of the NIAT. The
CV for sprint time was acceptable (4.8%) (Table 4.3). The LOA for 5 m sprint time
(Table 4.4) indicated a small amount of random error (± 0.10s).
4.3.2 Jump Height
There was no significant difference in jump height data between NIAT trials, F (1, 10) =
0.38, p>0.05 (Table 4.2). There was also no significant difference in jump height data
between quarters of NIAT trial, F (3, 30) = 0.23, p>0.05. Further, there was no
significant interaction between NIAT trial and quarter for jump data, F (3, 30) = 0.79,
p>0.05. There was a good correlation between trials for vertical jump height (r = 0.91,
p<0.001). The ICC for vertical jump height shows a nearly identical result as the
Pearson’s correlation. The SEM and 95% CI for jump height were low (1.23 and 2.46
cm) indicating reliability of this aspect of the NIAT. The CV for jump height was over
10% (13.4%) indicating that there may have been some variance in jump height between
- 57 -

the two trials. The LOA for jump height indicated a moderate amount of random error (±
3.43 cm).
Table 4.2 Mean NIAT performance times (± standard deviations)
NIAT 1 NIAT2 Mean
5m sprint time (s) 1.27 (± 0.06) 1.25 (± 0.06) 1.26 (± 0.06)
Vertical jump height
(cm)
29.12 (± 4.17) 28.82 (± 3.60) 28.97 (± 3.87)
Circuit time (s) 107.49 (± 3.22) 107.89 (± 4.27) 107.69 (± 3.77)
%HRmax 82.56 (± 4.66) 81.03 (± 4.13) 81.80 (± 4.50)
4.3.3 Circuit Time
Mauchly’s test indicated that the assumption of sphericity had been violated for the main
effect of quarter, χ2 (5) = 19.34, p<0.05, and for the interaction of trial and quarter, χ2 (5)
= 16.08, p<0.05. Therefore, degrees of freedom were corrected using the Greenhouse-
Geisser estimates of sphericity (ε = 0.45 for the main effect of quarter, and 0.68 for the
main interaction effect of trial and quarter). There was no significant difference in circuit
time between NIAT trials, F (1, 10) = 0.33, p>0.05 (Table 4.2). There was also no
significant difference in circuit time between quarters of NIAT, F (1.34, 13.35) = 1.49,
p>0.05. Further, there was no significant interaction between NIAT trial and quarter for
circuit time, F (2.04, 20.44) = 2.06, p>0.05. There was a moderate correlation between
trials for circuit time (r = 0.72, p<0.001). The ICC for circuit time shows a nearly
- 58 -

identical result as the Pearson’s correlation. The SEM and 95% CI for circuit time were
low (2.08 and 4.16 s) indicating reliability for this aspect of the NIAT. The CV for circuit
time was acceptable (3.5%). The LOA for circuit time indicated a small amount of
random error (± 5.80 s).
4.3.4 Percent Heart Rate Maximum (%HRmax)
Mauchly’s test indicated that the assumption of sphericity had been violated for the main
effect of quarter, χ2 (5) = 23.14, p<0.01. Therefore, degrees of freedom were corrected
using the Greenhouse-Geisser estimates of sphericity (ε = 0.43). There was no significant
difference in %HRmax between NIAT trials, F (1, 10) = 4.19, p>0.05 (Table 4.2). There
was also no significant difference in %HRmax between quarters of NIAT, F (1.29, 12.94)
= 2.06, p>0.05. There was a significant interaction effect between quarter and NIAT,
F(3, 30) = 3.60, p<0.05. This indicates %HRmax was different between quarters
depending on which trial was observed. To break down this interaction, contrasts were
calculated comparing NIAT trials and all quarters to the first quarter. This revealed a
significant interaction when comparing 1st Quarter to 4th Quarter for NIAT1 compared to
NIAT2, F (1, 10) = 6.78, r = 0.64. Looking at the interaction graphs these reflect that the
decrease in %HRmax from NIAT1 to NIAT2 is not as large in 4th Quarter as it is in 1st
Quarter. The remaining contrasts revealed no significant interaction term when
comparing Quarters between Trial 1 and Trial 2. There was a good correlation between
trials for %HRmax (r = 0.82, p<0.001). The ICC for %HRmax shows a nearly identical
result as the Pearson’s correlation. The SEM and 95% CI for %HRmax were low (1.95
and 3.90%) indicating reliability for this aspect of the NIAT. The CV for %HRmax was
- 59 -

acceptable (5.5%). The LOA for %HRmax indicated a small amount of random error (±
5.35%).
Table 4.3 Pearson’s correlation (r), intra-class correlation coefficients (ICC), standard error of measurement (SEM), 95% confidence intervals (95% CI), and coefficient of variation (CV) for NIAT performance.
Variable r ICC SEM 95% CI CV (%)
5m sprint time 0.66 0.66 ± 0.03 (s) ± 0.07 (s) 4.76
Vertical jump height 0.91 0.90 ± 1.23 (cm) ± 2.46 (cm) 13.36
Circuit time 0.72 0.70 ± 2.08 (s) ± 4.16 (s) 3.50
%HRmax 0.82 0.81 ± 1.95% ± 3.90% 5.50
Table 4.4 Absolute limits of agreement (LOA) for NIAT performance.
Variable LOA
(Mean bias ± 1.96 s)
5m sprint time 0.02 ± 0.10 (s)
Vertical jump height 0.30 ± 3.43 (cm)
Circuit time -0.40 ± 5.80 (s)
%HRmax 1.53 ± 5.35 (%)
- 60 -

CHAPTER V
DISCUSSION
The aim of the current study was to design a reliable Netball simulation that closely
resembled the physiological strain experienced during an actual netball match. Heart rate
data collected during match play indicated the need for three different positional
variations of the NIAT according to the different intensities experienced during the game;
one for Defence players, one for Centre Court players (combination of Wings and
Centres) and one for Attack players. The NIAT was then designed using previous time
motion analysis data (Steele & Chad, 1991), and heart rate data recorded during the NIAT
was compared to those taken in match play to determine criterion validity. In the current
population the NIAT showed good criterion validity for Defence and Attack players, but
not Centre Court. However, results indicate that the NIAT is reliable.
5.1 Match Data
The current study indicated an overall mean (± SD) %HRmax for all subjects during match
play of 89.6 (± 3.4) %. There are currently no other studies in the sport science literature
that report data for mean %HRmax in netball match-play for comparison, although the
value in the current study is close to that observed in male elite basketball of 87.0 ± 2%
(McInnes et al., 1995), reflecting the similarities in game activities between netball and
basketball. Mean %HRmax in the current study is similar to values shown in female
soccer (87.0%; Krustrup et al., 2005), but the values for both female populations are
- 61 -
higher than those shown in male soccer (82.5%; Edwards & Clark, 2006), male singles
tennis (81.0%; Christmass et al., 1998; Smekal et al., 1998), and male rugby league
(84.3%; Coutts et al., 2003). It may be that female athletes are predisposed to exhibiting
higher heart rates as a proportion of their maximum during intermittent sports than their
male counterparts. One explanation for this is that in males a greater quantity of blood
can be carried to the working muscle, resulting in female participants having to increase
their heart rate further than males to adequately supply the muscle under similar exercise
intensities (Shephard, 2000). The latter author also recognises a greater rise of core
temperature in females than in males at similar exercise intensities, resulting in higher
heart rate responses in women.
Some authors have recognised the limitations to using heart rate data during intermittent
exercise due to the fact that it does not immediately reflect exercise intensity variations
(Christmass et al., 1998). In the current study variations in heart rate occurred during the
course of the game as a reflection of the intermittent nature of activity. However, heart
rate can give an illustration of mean exercise intensity, and therefore a useful index of
overall physiological strain (Christmass et al., 1998; Coutts et al., 2003), and has been
shown to be a feasible means of estimating energy expenditure in elite hockey (Boyle et
al., 1994). The average exercise intensity in the current study indicates a high level of
aerobic loading, although other sports with similar intensity patterns have indicated that a
combination of anaerobic and aerobic energy production is required in order to perform
high intensity exercise in short bursts, whilst recovering adequately from these bursts to
maintain performance over the entire match (Allen, 1989; Liddle et al., 1996). Otago
- 62 -
(1983) recognised that netball players require a good level of aerobic fitness in order to
aid in recovery during the intermittent high intensity nature of the game.
5.1.1 Playing Quarter
The current investigation indicated that there was a significant difference in %HRmax
between playing quarters of the total game, although statistical analyses was unable to
reveal the exact location of this difference at the alpha level (p<0.05). The statistical
analyses and graphical representation of the results does indicate some tendency for
%HRmax to decline over the duration of the game, with a statistically non-significant
difference between the first quarter and third and fourth quarters. Further analysis of the
heart rate data, comparing halves instead of quarters, revealed a significantly higher
%HRmax in the first half (90.36 ± 2.69%) of match play compared to the second half
(88.26 ± 2.76%; p<0.05). This trend is supported by studies indicating that heart rate
values decrease over the course of a soccer game, with first half values often being
significantly higher than second half values (Ali & Farrally, 1991; Edwards & Clark,
2006). Activity data focused on soccer appears to confirm findings from heart rate
studies since total distance covered, distance covered at high intensity and time spent
performing high intensity running have been found to decrease both towards the end of a
45-minute half, and in the second half of a 90-minute game (Mohr et al., 2003; Krustrup
et al., 2005; Rampini et al., 2007b), although one study found no significant reductions in
high intensity exercise performance over time (Bangsbo, 1994) When the activity pattern
is kept constant over time (as in the current study with the NIAT), there appears to be no
significant temporal effect on heart rate (since %HRmax was not different between the four
quarters of the NIAT). This suggests that during netball match play, the pattern of
- 63 -

activity is reducing in intensity for some reason. Explanations offered for the pattern of
reduced activity in other intermittent sports include the effects of fatigue resulting in less
effort being contributed in the latter part of the game (Ali & Farrally, 1991; Rebelo et al.,
1998; Krustrup et al., 2005), and the possibility that the result of the game may have an
impact on the participant’s work rate (Ali & Farally, 1991; Woolford & Angove, 1991).
Lothian and Farrally (1994) found that there was significantly less time spent in high
intensity activity in the second half of a women’s hockey game compared to the first.
They suggested that the score towards the end of the game may have been a factor in
reducing the activity pattern of the players, but further analysis revealed that all players
had lower work rates in the second half regardless of the score. Therefore, they
concluded that the effects of fatigue contribute towards the reduced work rate in the
second half of a game of hockey. The notion of score having an activity pattern outcome
was further rejected by data from soccer where games that had a difference in score of
more than one goal showed no systematic differences in activity patterns from closer
matches (Mohr et al., 2003). The previous authors also suggested that fatigue occurs
temporarily during a soccer game, leading to periods of reduced high-intensity exercise
performance to allow for recovery.
The observed pattern in heart rate in the current study suggests that the effects of fatigue
lead to a drop-off in activity intensity in the latter parts of the game, with data collected
from participants completing full games (i.e. no substitutions) and games against a variety
of standard of opposition (i.e. different results). Brief systematic analysis of netball
activities by Barham and Wilson (1981) revealed some observations of reduced activity in
- 64 -
the last quarter of a game including a reduced frequency of jumping and passing the ball
on the run, which may be indications of a lower activity level towards the end of a game
similar to hockey and soccer. The intensity reduction notion in intermittent sports gains
further support by the finding of a lack of significant difference in motion categories
between first and second halves of elite male hockey games where unlimited substitutions
serve to attenuate the effects of fatigue (Spencer et al., 2004). However, without the
presence of time-motion analysis data in the current study a definitive conclusion about
any reductions in exercise intensity during the game cannot be reached.
Edwards and Clark (2006) recognised that success in intermittent sports is related to a
player’s ability to sustain high intensities over the duration of the game. The current
study indicates that fatigue could be a factor in netball in the latter stages of the game,
resulting in a reduction in exercise intensity. In order to achieve success, therefore, it will
be important for coaches to find a training method or ergogenic aid to assist in the
maintenance of high intensity exercise over the duration of a netball game above that
achieved by opposition players. The development of a valid and reliable simulation
would provide a valuable tool for research into such methods and aids and as such adds
further justification to the current research.
5.1.2 Positional Group
There were no significant differences between positional groups for parameters of aerobic
fitness OV& 2max and HRmax. This indicates that there should be little or no effects on heart
- 65 -

rate during the game due to fitness attributes and any differences in %HRmax between
positions should be due to exercise intensity alone.
There was a significant main effect of playing position on %HRmax during match play
with Defence players showing significantly higher %HRmax values to all other positions,
and Centres showing significantly higher %HRmax values to Attack players. This
indicates that Defence players worked at the highest intensity over the duration of the
game and were significantly different from other positions on court in this respect. The
other three groups had some similarities in the cardiac strain exhibited, and it appears that
the Wing positions were similar to both Centres and Attacks. This would be expected
since Wings are required to perform a similar skill set to Centres but play in a similar
court area to Goal Attack. The higher intensity exercise exhibited by the Defensive group
indicates that a separate simulation should be designed with this group in mind. Centre
and Attack groups should also have simulations designed to meet their positional needs,
and it was decided that Wings should be grouped with Centres due to the similar skill sets
of the positional groups. This is a similar positional pattern to that already indicated in
netball for other physiological variables in the literature (Bale & Hunt, 1986; Chad &
Steele, 1991; Cooper et al., 2002), and also reflects previous time motion analysis data on
netball match play (Steele & Chad, 1991).
In the early nineteen-nineties Woolford and Angove (1991; 1992) attempted to describe
heart rate data during match play but only gave full data sets for four positions: WA, GA,
- 66 -

C and WD. Contrary to the present investigation these investigators found that it was the
GA (a member of the Attack group) who exhibited the highest heart rates for the duration
of the game. However, they did go on to recognise that the games analysed for the GA
were three of the hardest games encountered in the competition and this may have served
to positively skew the GA’s heart rate data. The authors concluded that both the nature of
the opposition and the activity pattern of the game serve to influence the intensity that the
game is played at. In the current investigation the heart rate profiles were obtained from
games with various end results: some close games, some convincing wins and some
significant losses. In this way it is hoped that the current data set reflects the heart rate
response to an average game of netball and gives a good idea of the positional variation in
heart rate response.
Variations in activity and the intensity of that activity in intermittent sports such as soccer
and hockey has been related to aerobic fitness, particularly in female subjects (Lothian &
Farrally, 1994; Krustrup et al., 2005; Rampini et al., 2007a). These authors indicated that
the ability to perform high intensity exercise over the duration of the game was related to
the individual player’s aerobic power. This may explain some of the differences in heart
rate response in the current study. However, examination of participants’ estimated
maximal oxygen uptake results from the Multistage Fitness Test indicated no significant
positional group differences in aerobic fitness. There did appear to be a slight but non-
significant difference in the aerobic fitness of the Defence group from comparisons of
OV& 2max, with subject number potentially negating any significant differences between
positional groups. However, the difference did not appear to be large enough to create the
- 67 -

level of significance in heart rate response to match situations compared to the other
positions, although it would be beneficial to strengthen this data set with more subjects in
future research. It is more likely, therefore, that it is the activity pattern of Defence
players that creates this higher physiological strain, with defensive activities being
performed at higher intensities and for longer time periods. This is likely due to the
nature of a Defensive player’s movements, which are often not planned and are in
response to those of the attacking player. It is also likely that many of these movements
are high intensity ones such as sprinting and leaping to make an interception, and jumping
to defend a shot at goal. This could, therefore, lead to a conclusion similar to that made
in tennis in that physiologic responses are dependant upon the nature and character of the
playing pattern rather than the subjects’ physical ability (Smekal et al., 1998). It is
suggested, therefore, that simulation models for the three positional groups should not
adjust speeds of activity patterns according to the individual’s aerobic power.
Time spent in prescribed heart rate zones in the current study indicated only a significant
difference in the time spent in Zone 3 (75-85% HRmax) between positional groups. Post-
hoc tests failed to identify the location of this significance due to the Bonferroni
correction. However, observation of Figure 4.3 does indicate some non-significant trends
in the data, which may have been significant had sample size in the present study been
larger. It would appear that D spend more time in Zone 1 (95% HRmax), and it is likely
that it is the time in this high-intensity heart rate zone that led to this group having a
significantly higher average %HRmax than the other groups. It would also appear that C
spent more time in Zone 2 (85-95% HRmax) than the other groups, which may account for
- 68 -
the C having a higher average %HRmax than the A group. Further, W and A appeared to
spend more time in the lower intensity Zone 3 (75-85% HRmax) than the other two
positional groups. It would appear, therefore, that W and A carry out less high-intensity
activity and have more time for recovery, resulting in the average %HRmax for these two
positional groups being lower than that for D and C.
The D players in the current study spend just under 30% of their match time in Zone 1. It
has been suggested that durations of near maximal work such as this will require a large
contribution from anaerobic pathways (Deutsch et al., 1998). It is also likely that lactate
concentrations in the blood would be high for all positional groups, since lactate
production usually exceeds elimination above approximately 75% HRmax (Woolford &
Angove, 1992; Liddle et al., 1996). When lactate concentration is high there is a resultant
decrease in the pH of the blood from the build up of H+ (McArdle et al., 2000; Powers &
Howley, 2001). Both the acidosis and lactate itself have been shown to reduce muscle
force by various mechanisms including impairment of excitation-contraction coupling
(Favero et al., 1997; Metzger & Fitts, 1987) and decreasing Ca2+ release from the
sarcoplasmic reticulum (Hill et al., 2001; Stackhouse et al., 2001). Acidosis may further
induce fatigue by influencing pain receptors in the brain (Bogdanis et al., 1994) or by
reducing key glycolytic enzyme activity (Krebs et al., 1959; Chasiotis et al., 1982). If
lactate concentrations in the current population were high during match play, this would
have contributed to the apparent significant drop off in exercise intensity during the
second half of the game. However, this suggestion cannot be supported without the
presence of blood lactate concentration measures, which were not included in the present
- 69 -
study due to procedural concerns by coaches and umpires. In order to more accurately
assess the roles of specific energy systems within netball it would be suggested that any
future study include such measures.
The lack of significance in %HRmax between quarters has led to only a partial rejection of
null hypothesis H01: Mean %HRmax does not differ between quarter but does differ
between positional groups during competition games in the present study. This could
lead to creation of a revised null hypothesis H01(b): Mean %HRmax does not differ
between match halves and positional groups during competition games, which would
subsequently be rejected.
5.2 NIAT Validity
Results from the comparison of match heart rates against heart rates recorded during the
NIAT indicated that differences between the two conditions were not significant for D
and A groups (mean differences were 6.3% and 4.0% respectively). This indicates that
the NIAT activity pattern for the positional groups of D and A was close in intensity to
that experienced during a match. There was, however, a significant difference between
match and NIAT %HRmax for the C group (mean difference was 10.0%), indicating that
the NIAT did not elicit a similar physiological response as match play for this group, and
involved an overall lower intensity than is usually experienced during the game. Sample
size in the current study meant that non-parametric statistics were used to analyse the
- 70 -

results and may leave the conclusions open to criticism. It may be that a larger
population will be needed before any conclusions can be firmly made as to the validity of
the NIAT.
Ecological validity in the current study would refer to the degree in which the NIAT
obviously involves performance of netball match play activities. Since the NIAT was
based on time motion analysis data from netball match play (Steele & Chad, 1992) it
should follow that the NIAT has a good level of face validity. However, some
adaptations were made to the time motion analysis data in order to create an activity
pattern that was easily replicated and had more control. The NIAT also excluded the use
of the ball, except in the A variation where a shooting skill was added. The time motion
analysis data used to create the NIAT described a total of 23 different activities. It was
felt that this would make the NIAT too complicated and so this was reduced to 10
activities and the proportion of game time spent in each activity adjusted accordingly.
Previous authors have identified that intermittent sports protocols need to simulate some
components of match play but that they also need to maintain a certain level of control
(Davey et al., 2003). It was inevitable, therefore, that the repetition of this smaller group
of activity patterns would lead to a higher total number of repetitions than was observed
for certain activity patterns in the time motion analysis data (shuffle, sprint, jump).
However, there was an overall reduction in the total repetitions of different activities from
match play to the NIAT (Differences; A = 528; C=689; D=421). This may contribute
towards the significant difference seen in exercise intensity between match play and
NIAT for the C group since they have the largest difference in repetitions. Previously,
- 71 -

authors have suggested that changes in activity created a higher energetic demand as a
consequence of increased energy expenditure from the need to overcome inertia (Lothian
& Farrally, 1995). A comparison of the movement patterns observed in the time motion
analysis data and estimated for the NIAT for each positional group is included in
Appendix E.
There was also a noticeable difference in the total percent of time spent in various activity
patterns for all three positional groups compared to previous TMA data (Steele & Chad,
1992). All three groups spent much more total time shuffling in the NIAT than in match
play (A = +12.7%; C = +10.5%; D = +12.0%). The intensity of shuffling is not clear
from the literature and so this may have had an effect on the overall activity profile for all
positional groups. The A and D positional groups spent noticeably less amount of total
time standing than they would do in a match (A = -27.0%; D = -25.9%) and this may
have had an influence on their %HRmax being artificially closer to that recorded in a game
as they would have had much less time at this low intensity recovery and therefore less
chance for heart rate to reduce. Centres spent less time jogging than has been observed in
a game (-5.9%) and this may have had a different effect on the exercise intensity for this
positional group than experienced in a match. However, when reviewing the face validity
of the LIST, Nicholas and colleagues (2000) indicated that it was necessary for players to
spend less relative time in low-intensity recovery movements such as walking and
jogging, and more relative time in high-intensity activities such as cruising and sprinting
in their soccer simulation. They attributed this to the self-paced character of a soccer
game leading to a natural drop-off in intensity to ensure completion of 90 minutes,
- 72 -
contrasting with the LIST – a structured protocol. It may be necessary, therefore, to adapt
the NIAT to ensure it does not take into account a drop off in intense activity as the result
of fatigue and have players spend more relative time in high-intensity activities to ensure
a structured test that simulates the physiological strain of netball match play.
Research has suggested that certain aspects of time motion analysis data may not have
good intra-tester reliability for sports such as rugby union (Duthie et al., 2003). Measures
of total time spent in certain individual movements such as walking, jogging, sprinting
and standing had only moderate to poor reliability. The time motion analysis data used to
develop the NIAT (Steele & Chad, 1991) indicated a good level of reliability, but only
compared the movement categories for one subject for the first quarter of the match. It is
possible that reliability errors increased with different players or over the duration of the
match. Duthie et al. (2003) indicated that it was the lowest (i.e. standing) and highest
(striding and sprinting) intensity activities that had the poorest reliability, with even slight
differences in these categories causing a noticeable change in overall exercise intensity.
Further, it has been recognised that some activities in court sports, such as repetitive
shuffling, are more difficult to quantify than running activities (McInnes et al., 1995).
Therefore, the quantity of shuffling in the time motion analysis data for netball may be
unreliable. If this were the case it is possible that the NIAT does not adequately reflect
the actual movement activities of a netball match and offers an explanation for some of
the difference in physiological strain observed between the two conditions. In order to
gain a better understanding of this relationship it would be necessary to carry out time
motion analysis on the subjects whose heart rate data were also being recorded.
- 73 -
It is clear from time motion analysis data in netball (Steele & Chad, 1991) that the
majority of movements do not extend beyond 10 s in duration. This suggests a similar
pattern to that found in rugby union, where there is particular loading on the
Phosphocreatine (PCr) stores for energy production (Docherty et al., 1988), although this
only occurs when exercise intensity is high (Powers & Howley, 2001). The latter authors
indicate that resynthesis of the PCr stores requires additional oxygen during recovery
periods, which would require an increase in heart rate to ensure adequate delivery. This
pattern has been observed in other intermittent sports (Drust et al., 2000b). The
difference in the current study appears to be that periods of lower intensity exercise in the
NIAT are longer but less frequent than in match play. If recovery periods are longer,
heart rates will fall lower than those seen in the match situation due to less emphasis on
PCr store resynthesis. This likely contributed to the overall lower heart rates seen in
NIAT versus match play for all positional groups, but specifically for C group since
during match time they have comparably shorter rest periods in between high intensity
exercise than they experienced in the NIAT. In fact, this work: rest ratio has been shown
to be as important in determining the physical demands of intermittent sports such as
rugby union as total time or distance covered at different intensities (McLean, 1992).
Otago (1982) indicated that work: rest ratios for a 40 minute netball game were usually 1:
3 or greater, which is different to the NIAT (mean work: rest ratio 1: 7). This may be a
reflection of the different match durations, or could simply be an indication that recovery
periods in the NIAT are too long compared to actual netball match play. The length of
recovery periods accounts for some of the observation that the NIAT is less strenuous
- 74 -

than match play observed through the difference in heart rate data between the two
conditions and the lack of noticeable fatigue during the NIAT. However, work: rest ratios
for the modern 60 minute game are unavailable and it is likely that the pattern of high
intensity exercise to lower intensity recovery in the NIAT is different to that seen in
netball match play, particularly for C players.
Previous research has indicated that heart rates during competition are higher than during
practice due to psychological influences, indicated by increased catecholamine excretion
in competition compared to practice (Baron et al., 1992). In fact, it has been recognised
that the psychological stresses of match play are difficult to replicate in a controlled
environment and are likely to have an effect on physiological variables affected by
psychological factors such as stress and anxiety (Edwards & Clark, 2006; Sari-Sarraf et
al., 2006; Antonacci et al., 2007). The authors of the latter two studies recognised that
intermittent sport athletes may find it more difficult to replicate the exercise intensity of
competition in the absence of strong motivation in experimental settings, and
corresponded intensity results from their simulation more closely to those of a training
session than match-play. It is possible that in the present study the centre court players
felt less motivational arousal during the NIAT than they did during the game and leading
to overall lower heart rates.
Szabo et al. (1994) found that during cycling exercise a mild mental challenge was
capable of inducing an increase in heart rate compared to when no challenge was
- 75 -
presented. It is likely that the mental challenge associated with netball match play is
greater than that elicited in the NIAT for the C group and that this led to the differences in
heart rate between the two conditions. A factor that may have contributed to this was the
lack of a specific skill to C players in the circuit compared to the D and A groups (defend
and shoot respectively). The time motion analysis data (Steele & Chad, 1991) reveals
that C players do spend a small proportion of the game defending and guarding (1.3 and
2.5% respectively). It is possible that a specific skill, such as simulated defence of the
ball or player could create a mental stimulus that would increase heart rate further during
the NIAT for the C group. The lack of specific skill may have also had some bearing on
the motivation that the C group felt during the NIAT, resulting in the intensity they
completed the test at being lower than they would usually experience during match play.
Further research in this area is required.
5.3 NIAT Reliability
5.3.1 Sprint Time
In the present study there was no significant difference in sprint speed over 5 m between
trials, correlations between trials were moderate, standard errors and 95% confidence
intervals were low, coefficient of variations were acceptable and the 95% absolute levels
of agreement indicated only a small amount of random error. These statistics indicate
that the sprint element of the NIAT has moderate-good test-retest reliability.
- 76 -
There was also no significant difference in 5-m sprint speed over the duration of the
NIAT, indicating that other activity within the NIAT had no fatiguing effect on sprints of
this distance. Some authors have recognised the importance of maintenance of sprinting
type activity over the duration of other intermittent sports such as soccer, indicating that
being able to maintain sprint speed may be a key performance outcome (Edwards et al.,
2003; Stroyer et al., 2004). It has also been indicated that soccer players have a reduction
in the ability to perform repeated sprints as a consequence of the intermittent profile of
the sport (Rebelo et al., 1998). As previously mentioned, it has been suggested that speed
endurance in intermittent sports is reliant on the resynthesis of PCr stores (Nicholas et al.,
1995), which are involved in energy production for short-term intense exercise such as
sprinting (Powers & Howley, 2001). During recovery periods the resynthesis of PCr is
normally fairly rapid (Sahlin et al., 1979). When repeated sprints are performed with
adequate periods of lower intensity exercise separating them, PCr resynthesis is sufficient
to allow maintenance of sprint performance over time (Nicholas et al., 1995). During the
NIAT participants are required to perform seven 5 m sprints in each quarter of the game,
with each sprint being separated by approximately 2 minutes of generally lower-intensity
exercise. It would appear that the NIAT allows for adequate recovery of the PCr energy
system to enable sprint speed to be maintained over the duration of the test. It is likely
that this is similar to netball match play, where sprinting activity contributes a relatively
low proportion to the overall profile (Steele & Chad, 1991), although it may be a
reduction in this type of activity that causes the reduced exercise intensity observed
towards the end of match play in the current study. The resynthesis of PCr stores also
accounts for some contribution to the aerobic loading shown in the heart rate profile of
match play, since PCr synthesis relies on the availability of oxygen (Sahlin et al., 1979).
- 77 -

It follows then that heart rates will remain elevated after a bout of short-term high
intensity exercise in order to assist in the recovery of PCr stores and will be reflected in
the mean %HRmax values for match play in the current study. This supports the notion of
a decrease in sprint exercise towards the end of the game, since a reduction in the
recovery from this type of exercise will result in a decline in exercising heart rate, as seen
in the current study.
The mean (± SD) 5-m sprint time over the two trials was 1.26 (± 0.06) s. This was higher
than mean values for National (1.13 ± 0.07 s) and State (1.15 ± 0.10 s) level players from
Australia when sprinting speed alone was assessed (Ellis & Smith, 2000). The players in
the current study were aware of the need to complete multiple sprints and other activities
over the course of the test and this may have resulted in a reduction in sprinting speed
compared to performing a single sprint. In fact, the sprinting speeds in the current study
are more likely to reflect those seen in a game situation when other activity is being
performed.
5.3.2 Jump Height
Results for jump height indicated no significant difference between trials of the NIAT.
Other reliability tests between the two trials indicated good correlations and low SEM and
95% CI. However, CV indicated that there may have been a certain amount of variance
between the two trials and LOA showed a moderate amount of random error. The
vertical jump test element of the NIAT appears to have moderate test-retest reliability.
- 78 -

Time appeared to have no significant effect on jump height over the course of the NIAT,
with results remaining consistent over the four quarters of the test. It is likely that the
explosive action of a vertical jump is also fuelled by the ATP-PCr system, although it has
been suggested that a vertical jump test will not tax the ATP-PCr system maximally
(Powers & Howley, 2001), and so the length of recovery from this exercise will be
shorter than longer periods of higher intensity exercise. With the vertical jump test being
performed at the end of each of the seven circuits it is likely that sufficient lower-intensity
exercise is performed to allow for the recovery of this energy system so that similar
amounts of power are able to be produced over time.
The mean ± SD vertical jump height over the two trials was 28.97 ± 3.87 cm. This is
lower than scores for elite and National players (range 40-62 cm) (Blee et al., 1999; Chad
& Steele, 1991; Ellis & Smith, 2000), and State players (range 34-52 cm) when jump
height is recorded without any previous strenuous activity. Again, this may be due to
participants’ prior knowledge of the activity patterns and repetition of jumping ability.
However, in the current study participants performed the vertical jump test without the
use of an arm swing, which is a different methodology to those used in the comparison
studies. It is likely that much of the variation in jump height is due to this methodological
difference, and may not allow for good comparison of results.
5.3.3 Circuit Time
No significant difference between NIAT trials was observed for the measure of circuit
time. Circuit time between NIAT trials was shown to be moderately correlated, with low
- 79 -

SEM and 95% CI values, acceptable CV and LOA showing only a small amount of
random error This indicates that the test-retest reliability for time to complete the activity
circuit in the NIAT is moderate-good.
There was no significant difference between the four quarters of the NIAT in circuit time.
This is a good indication that participants completed the circuit at similar exercise
intensity over the duration of the test, reflecting a good level of reliability within the
circuit activity pattern. The lack of increase in circuit time over the four quarters also
indicates that participants were able to maintain the exercise intensity for the duration of
the test, and were not adversely affected by any fatigue caused by the pattern of activity.
This is likely to be another cause of the discrepancy in %HRmax values between matches
and NIAT as the activity pattern in the NIAT was not sufficiently strenuous to cause the
observed drop-off in exercise intensity seen in match play. It would seem, therefore that
the NIAT needs to be adapted to include more high-intensity exercise than it currently
involves.
The mean (± SD) circuit time over the two trials was 107.69 (± 3.77) s. This was, on
average, some 22 s below the permitted time to complete the circuit (130 s). However,
due to recording logistics time to complete the circuit was recorded from the time the
participant stepped on to the vertical jump mat (prior to performing the vertical jump),
eliminating this element of the circuit from the total time. Therefore, although the time
taken to complete the circuit was less than that allowed, it is probably closer than the
- 80 -
results from this study suggest if the vertical jump performance is taken into account.
However, indications that the circuit was performed quicker than the allotted time may
reflect a slightly overall higher exercise intensity for the duration of the NIAT than was
intended from the time motion analysis data (Steele & Chad, 1991). This is an interesting
observation since it would seem that the NIAT does, in fact, elicit a lower physiological
response than that observed during a game. This may add weight to the argument that
time motion analysis data underestimates the time spent in high-intensity activity or
overestimates the time spent in low-intensity activity. Again, for adequate comparison it
may be necessary to carry out time motion analysis data on the study participants to gain
a clearer understanding of this relationship.
5.3.4 Percent Heart Rate Maximum (%HRmax)
There was no significant difference in %HRmax between NIAT1 and NIAT2 in the current
study. The correlation between the two trials was shown to be good, whilst SEM and
95% CI were low, CV was acceptable and LOA indicated only a small amount of random
error. This indicates that there is a good level of test-retest reliability for %HRmax
measures when performing the NIAT.
No significant difference between quarters of the NIAT in %HRmax reflected the pattern
for circuit time, where exercise intensity remained the same over the duration of the test.
This is contrary to the pattern of heart rate activity observed in netball match play in the
current study and may give weight to the notion that there is a reduction in activity over
the duration of the game, since activity in the NIAT remained the same throughout. It
- 81 -

may be expected during intermittent high-intensity exercise of this nature to observe some
cardiovascular drift due to the effects of a rise in core body temperature (Drust et al.,
1999). However, the lack of this observation could indicate that the periods of lower
intensity exercise within the intermittent profile are sufficient to attenuate any extra stress
on the cardiovascular system (Powers & Howley, 2001). Despite consistency over time
in the activity intensity in NIAT (as shown by no change in circuit time over time), heart
rates did not show signs of cardiovascular drift. The observation of no differences in
environmental conditions between match play and NIAT trials adds weight to this
argument since cardiovascular drift usually occurs in heated environments. However,
more information on the core temperature and hydration status of players during the
NIAT would be needed to confirm the presence or absence of cardiovascular drift effects.
The observation of an interaction effect in the NIAT %HRmax data revealed that the
decrease in %HRmax from NIAT1 to NIAT2 was not as large in the 4th Quarter as it was in
the 1st Quarter. This may reflect a psychological influence on heart rate data, whereby
participants felt a higher level of anxiety during NIAT1, particularly in the first quarter
due to the unfamiliar nature of the test and surroundings. Previous studies have shown
that exposure to stressful situations will result in an elevation in pre-performance heart
rate (Smith et al., 1988), which will inevitably have an effect on performance heart rate if
the participants saw the NIAT1 as stressful. Unfortunately, pre-performance heart rates
were not recorded in the current study to enable a firm conclusion.
- 82 -

The mean (± SD) %HRmax over the two trials was 81.8 ± (4.5)%. This is lower than the
observed mean %HRmax in match play in the current study of 89.6 (± 3.4)% and reflects
the lower exercise intensity in the NIAT vs. match play, particularly for the C group as
previously discussed.
The current study indicates that the NIAT has a moderate level of test-retest reliability for
the recorded parameter of vertical jump, moderate-good level of test-retest reliability for
5 m sprint and circuit time, and good test-retest reliability for %HRmax. This leads to the
acceptance of null hypothesis H03: mean %HRmax, sprint times, jump heights and circuit
times will not differ between NIAT trials, and also to the conclusion that the NIAT is a
repeatable pattern of activity. The lack of a noticeable fatiguing effect on performance of
vertical jump and 5 m sprint also leads to acceptance of null hypothesis H04: sprint and
jump performance will not change throughout the duration of the NIAT.
5.4 Conclusion
For the current study population it can be concluded that exercise intensity (as measured
by %HRmax) decreases from the first to the second half of netball match play. Positional
differences in exercise intensity have also been observed, with Defenders exhibiting the
highest overall cardiovascular strain. This observation has led to the grouping of players
into three activity-based positional groups; Defenders (D), Centres (C), and Attackers
(A). The NIAT appears to elicit a valid physiological response as measured by %HRmax
- 83 -

for D and A, but not for C where exercise intensity in NIAT is significantly lower than in
match play. In conclusion, the NIAT is a reliable and valid netball intermittent activity
simulation for D and A groups only in the current study population.
5.5 Limitations of the study and recommendations for future research
Some of the results in the current study are limited by sample size, particularly for the
validity aspect of the NIAT. Small sample size for these data necessitated the use of non-
parametric statistics, which hold less power than their parametric counterparts and may
have led to some misleading results. It is suggested that a larger population group is
examined in future in order to more adequately assess the reliability and criterion validity
of the NIAT.
Much of the time motion analysis and exercise intensity data on netball in the literature is
obsolete and may not reflect the demands of the modern game. This may have had an
effect of an overall reduction in the intensity of the NIAT compared to match play,
possibly allowing for longer recovery times compared to high-intensity bouts. In order to
establish if this is the case it is suggested that time motion analysis data is recorded
alongside heart rate data for matches, to be compared with the same subjects in
performing the NIAT. This would lead to clearer observations of discrepancies in
exercise intensity from one condition to the other and will allow for adaptation of the
- 84 -
NIAT activity pattern to more closely replicate that of the modern game. If adaptation
occurs then reliability of the NIAT will need to be re-established.
A further limitation of the current study is the lack of other physiological measures to
compare between match and NIAT. Blood lactate concentrations or expired air collection
may have provided more information about exercise intensity and the roles of specific
energy systems within netball. This could have provided valuable comparisons for
assessing criterion validity to match play in the NIAT. Any future research into the
validity of the NIAT should look at including some of these measures.
Psychological influences may have had a limiting factor on heart rate results in the
current study. Participants may have been affected by the effects of anxiety, arousal or
motivation, which would have had a resultant effect on the heart rate results for both
match play and NIAT. It is difficult to control for any of these influences, however a
measure of pre-performance heart rates would indicate the presence of any anxiety in
either condition. It may be further necessary to add a mental challenge into the NIAT to
replicate the challenges faced during a netball game, possibly adding a decision making
skill into the circuit.
- 85 -

Once the validity and reliability of the NIAT has been fully established it will then have
the potential to be used to assess how training methods and ergogenic aids might be used
to improve netball-related performance parameters.
- 86 -

REFERENCES
Abdelkrim, N.B., El Fazaa, S., and El Ati, J. (2007). Time-motion analysis and
physiological data of elite under-19-year-old basketball players during competition.
British Journal of Sports Medicine, 41, 69-75.
Allen, G.D. (1989). Activity patterns and physiological responses of elite touch players
during competition. Journal of Human Movement Studies, 17, 207-215.
Ali, A., and Farrally, M. (1991). Recording soccer players’ heart rates during matches.
Journal of Sports Sciences, 9, 183-189.
Ali, A., Williams, C., Nicholas, C.W., and Foskett, A. (2007a). The influence of
carbohydrate-electrolyte ingestion on soccer skill performance. Medicine and Science in
Sports and Exercise, 39 (11), 1969-1976.
Ali, A., Williams, C., Hulse, M., Strudwick, A., Reddin, J., Howarth, L., Eldred, J., Hirst,
M., and McGregor, S. (2007b). Reliability and validity of two tests of soccer skill.
Journal of Sports Sciences, 25 (13), 1461-1470.
Allison, B. (1978). A practical application of specificity in netball training. Sports
Coach, 2 (2), 9-13.
- 87 -

Alricsson, M., Harms-Ringdahl, K., and Werner, S. (2001). Reliability of sports related
functional tests with emphasis on speed and agility in young athletes. Scandanavian
Journal of Medicine and Science in Sports, 11, 229-232.
Atkinson, G., and Nevil, A.M. (1998). Statistical methods for assessing measurement
error (reliability) in variables relevant to sports medicine. Sports Medicine, 26 (4), 217-
238.
Antonacci, L., Mortimer, L.F., Rodrigues, V.M., Coelho, D.B., Soares, D.D., and Silami-
Garcia, E. (2007). Competition, estimated, and test maximum heart rate. Journal of
Sports Medicine and Physical Fitness, 47 (4), 418-421.
Backhouse, S.H., Ali, A., Biddle, S.J.H., and Williams, C. (2007). Carbohydrate
ingestion during prolonged high-intensity intermittent exercise: impact on affect and
perceived exertion. Scandanavian Journal of Medicine and Science in Sport, 17 (5), 605-
610.
Bale, P. and Hunt, S. (1986). The physique, body composition and training variables of
elite and good netball players in relation to playing position. The Australian Journal of
Science and Medicine in Sport, 18 (4), 16-19.
- 88 -

Balsom, P.D., Seger, J.Y., Sjődin, B., and Ekblom, B. (1992). Maximal-intensity
intermittent exercise: effect of recovery duration. International Journal of Sports
Medicine, 13, 528-533.
Bangsbo, J., Norregard, L., and Thorsoe, F. (1991). Activity profile of competition
soccer. Canadian Journal of Sports Science, 16 (2), 110-116.
Bangsbo, J. (1993). The Physiology of Soccer. Bagsvaerd: Denmark, HO + Storm.
Bangsbo, J. (1994). The physiology of soccer with special reference to intense
intermittent exercise. Acta Physiologica Scandinavica, 619, 1-155.
Bangsbo, J. (1997). The physiology of intermittent activity in football. In T. Reilly, J.
Bangsbo, & M. Hughes (Eds.), Science and Football III (pp. 43-53). London, E & FN
Spon.
Barham, P., and Wilson, N.C. (1981). Skill and fitness assessment of netball players.
Sports Coach, 5 (3), 20-24.
Baron, R., Petschnig, R., Bachl, N., Raberger, G., Smekal, G., and Kastner, P. (1992).
Catecholamine excretion and heart rate as factors of psychophysical stress in table tennis.
International Journal of Sports Medicine, 13 (7), 501-505.
- 89 -
Bergeron, M.F., Maresh, C.M., Kraemer, W.J., Abraham, A., Conroy, B., and Gabaree, C.
(1991). Tennis: a physiological profile during match play. International Journal of
Sports Medicine, 12, 474-479.
Bishop, N.C., Blannin, A.K., Robson, P.J., Walsh, N.P., and Gleeson, M. (1999). The
effects of carbohydrate supplementation on immune responses to a soccer-specific
exercise protocol. Journal of Sports Sciences, 17, 787-796.
Bland, J.M., and Altman, D.G. (1986). Statistical methods for assessing agreement
between two methods of clinical measurement. Lancet, I, 307-310.
Blee, T., Goodman, C., Dawson, B., and Stapff, A. (1999). The effect of intramuscular
iron injections on serum ferritin levels and physical performance in elite netballers.
Journal of science and medicine in sport, 2 (4), 311-321.
Bogdanis, G.C., Nevill, M.E., and Lakomy, H.K.A. (1994). Effects of previous dynamic
arm exercise on power output during repeated maximal sprint cycling. Journal of Sports
Sciences, 12 (4), 363-370.
Bot, S.D.M., and Hollander, A.P. (2000). The relationship between heart rate and oxygen
uptake during non-steady state exercise. Ergonomics, 43, 1578-1592.
- 90 -

Boyle, P.M., Mahoney, C.A., and Wallace, W.F. (1994). The competitive demands of
elite male field hockey. Journal of Sports Medicine and Physical Fitness, 34 (3), 235-
241.
Chad, K.E., and Steele, J.R. (1991). Physiological characteristics of skilled netball
players. Australian Sports Commission.
Chasiotis, D., Hultman, E., and Sahlin, K. (1982). Acidotic depression of cyclic AMP
accumulation and phosphorylase b to a transformation in skeletal muscle of man. Journal
of Physiology, 335, 197-204.
Christmass, M.A., Richmond, S.E., Cable, N.T., Arthur, P.G., and Hartmann, P.E. (1998).
Exercise intensity and metabolic response in singles tennis. Journal of Sports Sciences,
16, 739-747.
Christmass, M.A., Dawson, B., Passeretto, P., and Arthur, P.G. (1999). A comparison of
skeletal muscle oxygenation and fuel use in sustained continuous and intermittent
exercise. European Journal of Applied Physiology, 80, 423-435.
- 91 -
Clarke, N., Drust, B., MacLaren, D.P.M., and Reilly, T. (2005). Strategies for hydration
and energy provision during soccer-specific exercise. International Journal of Sports
Nutrition and Exercise Metabolism, 15 (6), 625-640.
Cooper, S-M., Reid, C., and Hanton, S. (2002). Androgyny of physique , somatotype and
psychological androgyny in successful netball players. Journal of Sports Sciences, 20
(1), 33-34.
Coutts, A., Reaburn, P., and Abt, G. (2003). Heart rate, blood lactate concentration and
estimated energy expenditure in a semi-professional rugby league team during a match: a
case study. Journal of Sports Sciences, 21, 97-103.
Cronin, J., McNair, R.J., and Marshall, R.N. (2001). Velocity specificity, combination
training and sport specific tasks. Journal of Science and Medicine in Sport, 4, 168-178.
Cronin, J.B., and Owen, G.J. (2004). Upper-body strength and power assessment in
women using a chest pass. Journal of Strength and Conditioning Research, 18 (3), 401-
404.
Davey, P.R., Thorpe, R.D., and Williams, C. (2003). Simulated tennis matchplay in a
controlled environment. Journal of Sports Sciences, 21, 459-467.
- 92 -

Dawson, B., Hopkinson, R., Appleby, B., Stewart, G., and Roberts, C. (2004).
Comparison of training activities and game demands in the Australian Football League.
Journal of Science and Medicine in Sport, 7 (3), 292-301.
Deutsch, M.U., Maw G.J., Jenkins, D., and Reaburn, P. (1998). Heart rate, blood lactate
and kinematic data of elite colts (under 19) rugby union players during competition.
Journal of Sports Sciences, 16, 561-570.
Deutsch, M. (2001). The Physiology of Rugby: Effects of Playing Position, Playing Level
and Creatine Supplementation. Dunedin: University of Otago, School of Physical
Education.
Docherty, D., Wenger, H.A., and Neary, P. (1988). Time motion analysis related to the
physiological demands of rugby. Journal of Human Movement Studies, 14, 269-277.
Drust, B., Reilly, T., and Cable, N.T. (1999). Comparison of the physiological responses
to soccer-specific intermittent exercise and continuous exercise at the same average
intensity. Journal of Sports Sciences, 17, 32.
Drust, B., Cable, N.T., and Reilly, T. (2000a). Investigation of the effects of pre-cooling
on the physiological responses to soccer-specific intermittent exercise. European Journal
of Applied Physiology, 81, 11-17.
- 93 -

Drust, B., Reilly, T., and Cable, N.T. (2000b). Physiological responses to laboratory-
based soccer-specific intermittent and continuous exercise. Journal of Sports Sciences,
18, 885-892.
Drust, B., Atkinson, G., and Reilly, T. (2007). Future perspectives in the evaluation of
the physiological demands of soccer. Sports Medicine, 37 (9), 783-805.
Duthie, G., Pyne, D., and Hooper, S. (2005). Time motion analysis of 2001 and 2002
Super 12 rugby. Journal of Sports Sciences, 23 (5), 523-530.
Edwards, A.M., Macfayden, A.M., and Clark, N. (2003). Test performance indicators
from a single soccer specific test differentiate between highly trained and recreationally
active soccer players. Journal of Sports Medicine and Physical Fitness, 43 (1), 14-20.
Edwards, A.M., and Clark, N.A. (2006). Thermoregulatory observations in soccer match-
play: professional and recreational level applications using an intestinal pill system to
measure core temperature. British Journal of Sports Medicine, 40 (2), 133-138.
Ellis, L., Gastin, P., Lawrence, S., Savage, B., Buckeridge, A., Stapff, A., Tumilty, D.,
Quinn, A., Woolford, S., and Young, W. (2000). Protocols for the physiological
assessment of team sport players. In C.J. Gore (Ed.), Physiological Tests for Elite
Athletes (pp. 128-44). Champaign, IL: Human Kinetics.
- 94 -

Ellis, L., and Smith, P. (2000). Protocols for the physiological assessment of netball
players. In C.J. Gore (Ed.), Physiological Tests for Elite Athletes (pp. 302-10).
Champaign, IL: Human Kinetics.
Fallon, K.E., Fallon, S.K., and Boston, T. (2001). The acute phase response and exercise:
court and field sports. British Journal of Sports Medicine, 35, 170-173.
Fallowfield, J.L., Hale, B.J., and Wilkinson, D.M. (2005). Using Statistics in Sport and
Exercise Research. Chichester: Lotus Publishing.
Farrow, D., Young, W., and Bruce, L. (2005). The development of a test of reactive
agility for netball: a new methodology. Journal of Science and Medicine in Sport, 8 (1),
52-60.
Favero, T.G., Zable, A.C., Colter, D., and Abramson, J.J. (1997). Lactate inhibits Ca2+-
activated Ca2+-channel activity from skeletal muscle sarcoplasmic reticulum. Journal of
Applied Physiology, 82, 447-452.
Ferrauti, A., Bergeron, M.F., Pluim, B.M., and Weber, K. (2001). Physiological
responses in tennis and running with similar oxygen uptake. European Journal of
Applied Physiology, 85, 27-33.
- 95 -

Foskett, A., Williams, C., Boobis, L., and Tsintzas, K. (2008). Carbohydrate availability
and muscle energy metabolism during intermittent running. Medicine and Science in
Sports and Exercise, 40 (1), 96-103.
Glaister, M. (2005). Multiple sprint work: physiological responses, mechanisms of
fatigue and the influence of aerobic fitness. Sports Medicine, 35 (9), 757-777.
Gratton, C., and Jones, I. (2004). Research Methods for Sports Studies. Oxon:
Routledge.
Hill, C.A., Thompson, M.W., Ruell, P.A., Thom, J.M., and White, M.J. (2001).
Sarcoplasmic reticulum function and muscle contractile character following fatiguing
exercise in humans. Journal of Physiology, 531 (3), 871-878.
Hoffman, M.D., Kassay, K.M., Zeni, A.I., and Clifford, P.S. (1996). Does amount of
exercising muscle alter aerobic demand of dynamic exercise. European Journal of
Applied Physiology, 74, 541-547.
Hopper, D.M., McNair, P., and Elliott, B.C. (1999). Landing in netball: effects of taping
and bracing the ankle. British Journal of Sports Medicine, 33, 409-413.
- 96 -

Kingsley, M., James, N., Kilduff, L.P., Dietzig, R.E., and Dietzig, B. (2006). An exercise
protocol that simulates the activity patterns of elite junior squash. Journal of Sports
Sciences, 24 (12), 1291-1296.
Krebs, E.G., Graves, D.J., and Fischer, E.H. (1959). Factors affecting the activity of
muscle phophorylase b kinase. Journal of Biological Chemistry, 234 (11), 2867-2873.
Krustrup, P., Mohr, M., Ellingsgaard, H., and Bangsbo, J. (2005). Physical demands
during an elite female soccer game: importance of training status. Medicine and Science
in Sports and Exercise, 37 (7), 1242-1248.
Lakomy, H.K.A. (1987). The use of a non-motorized treadmill for analyzing sprint
performance. Ergonomics, 3, 627-637.
Larsson, P. (2003). Global positioning system and sport-specific testing. Sports
Medicine, 33 (15), 1093-1101.
Liddle, S.D., Murphy, M.H., and Bleakley, W. (1996). A comparison of the
physiological demands of singles and doubles badminton: a heart rate and time-motion
analysis. Journal of Human Movement Studies, 30, 159-176.
- 97 -

Lothian, F., and Farrally, M. (1994). A time-motion analysis of women’s hockey.
Journal of Human Movement Studies, 26, 255-265.
Lothian, F., and Farrally, M. (1995). A comparison of methods for estimating oxygen
uptake during intermittent exercise. Journal of Sports Sciences, 13, 491-497.
McArdle, W.D., Katch, F.I., and Katch, V.L. (2000). Essentials of Exercise Physiology
(2nd Ed.). Philadelphia, Pa: Lea & Febiger.
McErlean, C.A., Cassidy, J., and O’Donoghue, P.G. (2000). Time-motion analysis of
gender and positional effects on work rate in elite Gaelic football competition. Journal of
Human Movement Studies, 38, 269-286.
McInnes, S.E., Carlson, J.S., Jones, C.S., and McKenna, M.J. (1995). The physiological
load imposed on basketball players during competition. Journal of Sports Sciences, 13,
387-397.
McLean, D.A. (1992). Analysis of the physiological demands of international rugby
union. Journal of Sports Sciences, 10, 285-296.
- 98 -

Majumdar, P., Khanna, G.L., Malik, V., Sachdeva, S., Arif, M., and Mandal, M. (1997).
Physiological analysis to quantify training load in badminton. British Journal of Sports
Medicine, 31, 342-345.
Mayhew, S.R., and Wenger, H.A. (1985). Time motion analysis of professional soccer.
Journal of Human Movement Studies, 11, 49-52.
Meir, R., Arthur, D., and Forrest M. (1993). Time and motion analysis of professional
rugby league: a case study. Strength and Conditioning Coach, 3, 24-29.
Metzger, J.M., and Fitts, R.H. (1987). Role of intracellular pH in muscle fatigue. Journal
of Applied Physiology, 62, 1392-1397.
Mohr, M., Krustrup, P., and Bangsbo, J. (2003). Match performance of high-standard
soccer players with special reference to development of fatigue. Journal of Sports
Sciences, 21, 519-528.
Neal, R.J., and Sydney-Smith, M. (1992). The effects of footfall pattern and passing
height on ground reaction forces in netball. Australian Journal of Science and Medicine
in Sport, 24, 73-78.
- 99 -
Netball New Zealand [online]. Available: www.netballnz.co.nz [Accessed on 17th
October 2007].
Nicholas, C.W., Williams, C., Lakomy, H.K.A, Phillips, G., and Nowitz, A. (1995).
Influence of ingesting a carbohydrate-electrolyte solution on endurance capacity during
intermittent high-intensity shuttle running. Journal of Sports Sciences, 13, 283-290.
Nicholas, C.W., Nuttal, F.E., and Williams, C. (2000). The Loughborough Intermittent
Shuttle Test: a field test that simulates the activity pattern of soccer. Journal of Sports
Sciences, 18, 97-104.
O’Donoghue, P.G., and Cassidy, D. (2002). The effect of specific intermittent training on
the fitness of international netball players. Journal of Sports Sciences, 20 (1), 56-57.
Ogushi, T., Ohashi, J., Nagahama, H., Isokawa, M., and Suzuki, S. (1993). Work
intensity during soccer match play (a case study). In T. Reilly, J. Calrys, & A. Stibbe
(Eds.), Science and Football II (pp. 121-123). London, E & FN Spon.
Otago, L. (1983). A game analysis of the activity patterns of netball players. Sports
Coach, 7 (1), 24-28.
- 100 -
Powers, S.K., and Howley, E.T. (2001). Exercise Physiology: Theory and Application to
Fitness and Performance (4th Ed.). NY: McGraw-Hill.
Rahnama, N., Reilly, T., Lees, A., and Graham-Smith, P. (2003). Muscle fatigue induced
by exercise simulating the work rate of competitive soccer. Journal of Sports Sciences,
21, 933-942.
Rampini, E., Bishop, D., Marcora, S.M., Ferrari Bravo, D., Sassi, R., and Impellizzeri,
F.M. (2007a). Validity of simple field tests as indicators of match-related physical
performance in top-level professional soccer players. International Journal of Sports
Medicine, 28, 228-235.
Rampini, E., Coutts, A.J., Castagna, C., Sassi, R., and Impellizzeri, F.M. (2007b).
Variation in top level soccer match performance. International Journal of Sports
Medicine, 28, 1018-1024.
Ramsbottom, R., Brewer, J., and Williams, C. (1988). A progressive shuttle run test to
estimate maximal oxygen uptake. British Journal of Sports Medicine, 22, 141-144.
Rebelo, N., Krustrup, P., Soares, J., and Bangsbo, J. (1998). Reduction in intense
intermittent exercise performance during a soccer match. Journal of Sports Sciences, 16,
482-483.
- 101 -
Reilly, T., and Thomas, V. (1976). A motion analysis of work-rate in different positional
roles in professional football match-play. Journal of Human Movement Studies, 2, 87-97.
Reilly, T., and Ball, D. (1984). The net physiological cost of dribbling a soccer ball.
Research Quarterly for Exercise and Sport, 55 (3), 267-271.
Reilly, T. (1997). Energetics of high-intensity exercise (soccer) with particular reference
to fatigue. Journal of Sports Sciences, 15, 257-263.
Rico-Sanz, J., Zehnder, M., Buchli, R., Dambach, M., and Boutellier, U. (1999). Muscle
glycogen degradation during simulation of a fatiguing soccer match in elite soccer players
examined noninvasively by 13C-MRS. Medicine and Science in Sports and Exercise, 31
(11), 1587-1593.
Riley, P.O., Dicharry, J., Franz, J., Croce, U.D., Wilder, R.P., and Kerrigan, D.C. (2008).
A kinematics and kinetic comparison of overground and treadmill running. Medicine and
Science in Sports and Exercise, 40 (6), 1093-1100.
Sahlin, K., Harris, R.C., and Hultman, E. (1979). Resynthesis of creatine phosphate in
human muscle after exercise in relation to intramuscular pH and availability of oxygen.
Scandanavian Journal of Clinical and Laboratory Investigation, 39 (6), 551-557.
- 102 -

Sari-Sarraf, V., Reilly, T., and Doran, D. (2006). Salivary IgA responses to intermittent
and continuous exercise. International Journal of Sports Medicine, 27, 1-7.
Shephard, R.J. (2000). Exercise and training in women, part I: influence of gender on
exercise and training responses. Canadian Journal of Applied Physiology, 25 (1), 19-34.
Smekal, G., Rihacek, C., Pokan, R., Baron, R., Tschan, H., and Bachl, N. (1998).
Physiological demands of tennis match play. Medicine and Science in Sports and
Exercise, 30 (5), S189.
Smekal, G., Pokan R., von Duvillard, S.P., Baron, R., Tschan, H., and Bachl, N. (2000).
Comparison of laboratory and “on-court” endurance testing in tennis. International
Journal of Sports Medicine, 21, 242-249.
Smith, N.C., Burwitz, L., and Jakeman, P. (1988). Precompetitive anxiety and motor
performance: a psychophysiological examination. Journal of Sports Sciences, 6, 115-
130.
Spencer, M., Lawrence, S., Rechichi, C., Bishop, D., Dawson, B., and Goodman, C.
(2004). Time-motion analysis of elite field hockey, with special reference to repeated-
sprint activity. Journal of Sports Sciences, 22, 843-850.
- 103 -

Stackhouse, S.K, Reisman, D.S., and Binder-Macleod, S.A. (2001). Challenging the role
of pH in skeletal muscle fatigue. Physical Therapy, 81, 1897-1903.
Steele, J.R., and Chad, K.E. (1991). Relationship between movement patterns performed
in match play and in training by skilled netball players. Journal of Human Movement
Studies, 20, 249-278.
Steele, J.R., and Milburn, P.D. (1987). A kinematic analysis of netball landing technique.
Australian Journal of Science and Medicine in Sport, 19 (1), 23-27.
Stroyer, J., Hansen, L., and Klausen, K. (2004). Physiological profile and activity pattern
of young soccer players during match play. Medicine and Science in Sports and Exercise,
36 (1), 168-174.
Stuart, G.R., Hopkins, W.G., Cook, C., and Cairns, S.P. (2005). Multiple effects of
caffeine on simulated high-intensity team-sport performance. Medicine and Science in
Sports and Exercise, 37 (11), 1998-2005.
Szabo, A., Peronnet, F., Gauvin, L., and Furedy, J. J. (1994). Mental challenge elicits
“additional” increases in heart rate during low and moderate intensity cycling.
International Journal of Psychophysiology, 17 (3), 197-204.
- 104 -

Thomas, J.R., and Nelson, J.K. (2001). Research Methods in Physical Activity (4th
Edition). Champaign, IL: Human Kinetics.
Van Gool., D., van Gerven, D., and Boutmas, J. (1988). The physiological load imposed
on soccer players. In T. Reilly, A. Lees, K. Davids, & W. J. Murphy (Eds.), Science and
Football (pp. 51-58). London, E & F.N Spon.
Withers, R.T., and Roberts, R.G.D. (1981). Physiological profiles of representative
women softball, hockey and netball players. Ergonomics, 24 (8), 583-591.
Woolford, S., and Angove, M. (1991). A comparison of training techniques and game
intensities for national level netball players. Sports Coach, 14, 18-21.
Woolford, S., and Angove, M. (1992). Game intensities in elite level netball: position
specific trends. Sports Coach, 15 (2), 28-32.
Zehnder, M., Rico-Sanz, J., Kühne, G., and Boutellier, U. (2001). Resynthesis of muscle
glycogen after soccer specific performance examined by 13C-magnetic resonance
spectroscopy in elite players. European Journal of Applied Physiology, 84, 443-447.
- 105 -

APPENDICES

APPENDIX A
The development of a valid and reliable netball performance field test.
PARTICIPANT INFORMATION SHEET
Invitation to Participate in Research Study My name is Helen Ryan and I am currently preparing a thesis for an M.Sc. in Sport Science at Massey University. This year I am completing a research study to develop a protocol that closely simulates physiological and skill patterns in netball for use in intervention trials. Minimal research has been carried out into the game of netball; in particular the intervention techniques that would help improve match performance. I intend to develop and validate a field test that can be used in the future for netball research. Participant Recruitment All participants (over the age of 16) will be recruited from Netball North Harbour Premier teams. There are two parts to this study; Part A and Part B. I aim to recruit approximately 45 participants for the study. During Part A, all participants will be asked to complete a multi-stage shuttle run test (‘bleep’ test) whilst wearing heart rate monitors. Heart rates will be monitored during NNH Premier competition games. Part B involves performance of the field test on three separate occasions. Risks/Discomforts of the study include: • Feeling fatigued from performing maximal exercise in the ‘bleep’ test (Part A only). • Feeling fatigued as if you had just played a 60-minute netball game (Part B only). Project Procedures and Participant Involvement Part A of the research project involves the establishment of individual heart rate zones for each participant. You will be asked to complete a ‘bleep’ test protocol whilst wearing a heart rate monitor during a selected training session at your home training venue (30 minutes) or at a pre-arranged time at Massey University Recreation Centre. You will also be asked to complete a Heath Screening Questionnaire relating to health status, prior medical issues, and medications taken. This screening questionnaire is used to ascertain information that may conflict with the study, (i.e. if you are taking any medications that may interfere with the outcome of the study), and may ultimately exclude you from participating. The information obtained on all study questionnaires is strictly confidential and will be used for the purposes of the present study only. Part B of the research project will involve further collection of heart rate data from matches in your NNH Premier competition schedule, and during performance of the research protocol. Should you play in two or more NNH Premier competition games (equivalent to 120 minutes worth of data) you will be asked to provide approximately an hour and a half of your time on three different days. The first day will involve familiarization (approximately 30 minutes) of a 60-minute activity that resembles the activity pattern of a netball game. The activity will involve walking, jogging, cruising, sprinting and utility movements. During this activity heart rate will be recorded.
During the second and third days you will be asked to complete the 60-minute activity while heart rates will be taken. The data will be used to validate the netball specific test. Participant’s Rights You are under no obligation to accept this invitation. Should you choose to participate, you have the right to: • Decline to answer any particular question (although in the case of the Health Screening Questionnaire any missing answer will be viewed as a positive statement and may lead to exclusion from the study). • Withdraw from the study at any time, even after signing a consent form (if you choose to withdraw you cannot withdraw your data from the analysis after the data collection has been completed) • Ask any questions about the study at any time during participation • Provide information on the understanding that your name will not be used unless you give permission to the researcher • Be given access to a summary of the project findings when it is concluded Confidentiality All data collected will be used solely for research purposes and has the possibility of being presented in a professional journal. All personal information will be kept confidential by assigning identifiers to each participant. No names will be visible on any papers on which you provide information. All data/information will be dealt with in confidentiality and will be stored in a secure location for five years on the Massey University Albany campus. After this time it will be disposed of by an appropriate staff member from the Sport and Exercise Science department. Project Contacts If you have any questions regarding this study, please do not hesitate to contact any of the following people for assistance: • Helen Ryan: (09)414-0800 ext. 41160; 021 0571187; [email protected] • Dr. Andrew Foskett (Research Supervisor, Sport and Exercise Science, Massey University): (09) 414-0800 ext.41104; [email protected]• Dr. Alan Walmsley (Research Supervisor, Sport and Exercise Science, Massey University): (04)
801 5799 ext.6749; [email protected] Committee Approval Statement This project has been reviewed and approved by the Massey University Human Ethics Committee: Northern, Application 06/002. If you have any concerns about the conduct of this research, please contact A/Prof Ann Dupuis, Acting Chair, Massey University Human Ethics Committee: Northern, telephone 09 414 0800 x9054, email [email protected]. Compensation for Injury If physical injury results from your participation in this study, you should visit a treatment provider to make a claim to ACC as soon as possible. ACC cover and entitlements are not automatic and your claim will be assessed by ACC in accordance with the Injury Prevention, Rehabilitation and Compensation Act 2001. If your claim is accepted, ACC must inform you of your entitlements, and must help you access those entitlements. Entitlements may include, but not be limited to, treatment costs, travel costs for rehabilitation, loss of earnings, and/or lump sum for permanent impairment. Compensation for mental trauma may also be included, but only if this is incurred as a result of physical injury. If your ACC claim is not accepted you should immediately contact the researcher. The researcher will initiate processes to ensure you receive compensation equivalent to that to which you would have been entitled had ACC accepted your claim.

APPENDIX B Participant Code:___________
The development of a valid and reliable netball performance field test.
PARTICIPANT CONSENT FORM
This consent form will be held for a minimum period of five (5) years
I have read the Information Sheet and have had the details of the study explained to me. My questions have been answered to my satisfaction, and I understand that I may ask further questions at any time. I understand that I have the right to withdraw from the study at any time and to decline to answer any particular questions. I agree to provide information to the researcher on the understanding that my name will not be used without my permission. (The information will be used only for this research and publications arising from this research project). I agree to participate in this study under the conditions set out in the Information Sheet.
Signature: _____________________________________________ Date_____________________
Full Name (printed) _________________________________________________________________
Phone Number_____________________ Age ___________ Date of Birth ________________
Address____________________________________________________________________________
Email_____________________________________________________________________________
Witnessed by:________________________________ Date_______________

APPENDIX C
Participant Code:__________
The development of a valid and reliable netball performance field test.
HEALTH SCREEN QUESTIONNAIRE FOR STUDY VOLUNTEERS
This questionnaire is designed to ensure that participants of a research study are currently in good health and have had no significant medical problems in the past. It is also designed to ensure participants’ own continuing well being and to avoid the possibility of individual health issues confounding study outcomes. Please complete this brief questionnaire to confirm fitness to participate:
1. At present, do you have any health problem for which you are: a. on medication, prescribed or otherwise….…………………… Yes □ No □ b. attending your general practitioner………….......……………. Yes □ No □ c. on a hospital waiting list…….………………...……………….. Yes □ No □
2. In the past two years, have you had any illness that required you to: a. consult your GP…………………………………………. ……… Yes □ No □ b. attend a hospital outpatient department……………… ……… Yes □ No □ c. be admitted to the hospital……………………………...……… Yes □ No □
3. Have you ever had any of the following: a. Convulsion/epilepsy……………………………………..……… Yes □ No □ b. Asthma…………………………………………………… ……… Yes □ No □ c. Eczema…………………………………………………………… Yes □ No □ d. Diabetes………………………….…………………........……… Yes □ No □ e. A blood disorder………………………………………………… Yes □ No □ f. Head injury…………………………….………………………… Yes □ No □ g. Digestive problems………………………………..…… ……… Yes □ No □ h. Heart problems…………………………………..……... ……… Yes □ No □ i. Problems with bones or joints………….……………………… Yes □ No □ j. Disturbance of balance/co-ordination………………………… Yes □ No □ k. Numbness in hands or feet…………………………….……… Yes □ No □ l. Disturbance of vision……………………..…………….……… Yes □ No □ m. Ear/hearing problems……………….………………….……… Yes □ No □ n. Thyroid problems………………………………………..……… Yes □ No □ o. Kidney or liver problems………………………………...……… Yes □ No □ p. An allergic reaction……………….……………………………… Yes □ No □
4. Has any, otherwise healthy, member of your family under the age of 35 died suddenly during or soon after exercise? Yes □ No □ If YES to any question, please describe briefly if you wish (e.g. to confirm problem was/is short lived, insignificant or well controlled)_______________ _________________________________________________________________ _________________________________________________________________ _________________________________________________________________ Thank you for your co-operation!

APPENDIX D Schematic of standard warm-up
Activity Detail Time
Jogging Up to a specific point on court,
turn then back.
Around 1 minute
Sprint drills & ballistic
stretches
High knees, heel flicks, little feet,
lunges etc.
Around 4 minutes
Individual needs stretching Static/further ballistic stretching
depending on individual
preference
Around 5 minutes
Passing drills In 2s with a ball, sharpening
basic patterns in preparation for
the game
Around 5 minutes
Individual drills In 2s with a ball, focusing on
specific movement patterns for
playing position/ skill preference
Around 5 minutes
Team drills Ball work as a team, specific
patterns relative to areas of play
Around 10 minutes

APPENDIX E Match vs. NIAT Activity Patterns (Time motion analysis, Steele & Chad, 1991 vs. estimated NIAT movement analysis) For movement patterns involved in NIAT only Defenders
Total Repetitions Average Time spent per repetition (s)
% of Total Time Activity
Match NIAT Match NIAT Match NIATStand 304 192 4.2 3.1 42.9 17.0
Walk Forward 301 84 2.7 8.8 27.4 21.2 Walk Backward 132 28 2.0 15.0 8.9 12.0
Shuffle 158 336 1.9 2.3 10.1 22.1 Jog 107 28 1.4 12.0 5.1 9.6 Run 30 28 1.2 4.5 1.2 3.6
Sprint 0 28 0.1 1.0 0.0 0.8 Jump 43 140 1.1 1.0 1.6 4.0
Defend 49 168 1.8 2.0 2.9 9.6 Shoot 0 0 0 0 0.0 0.0 Total 1123 1032 N/A N/A N/A N/A
Total for all match activities
1453
N/A
N/A
N/A
N/A
N/A
Centres
Total Repetitions Average Time spent per repetition (s)
% of Total Time Activity
Match NIAT Match NIAT Match NIATStand 306 360 2.6 2.2 24.6 22.5
Walk Forward 375 84 2.8 8.8 32.5 21.0 Walk Backward 156 28 2.1 15.0 10.1 11.9
Shuffle 247 336 1.5 2.3 11.4 21.9 Jog 277 28 1.8 12.0 15.4 9.5 Run 92 28 1.2 4.5 3.4 3.6
Sprint 3 28 0.6 1.0 0.1 0.8 Jump 40 308 0.8 1.0 1.0 8.7
Defend 39 0 1.3 0.0 1.5 0.0 Shoot 0 0 0.0 0.0 0.0 0.0 Total 1534 1200 N/A N/A N/A N/A
Total for all match activities
1889
N/A
N/A
N/A
N/A
N/A
Attacks
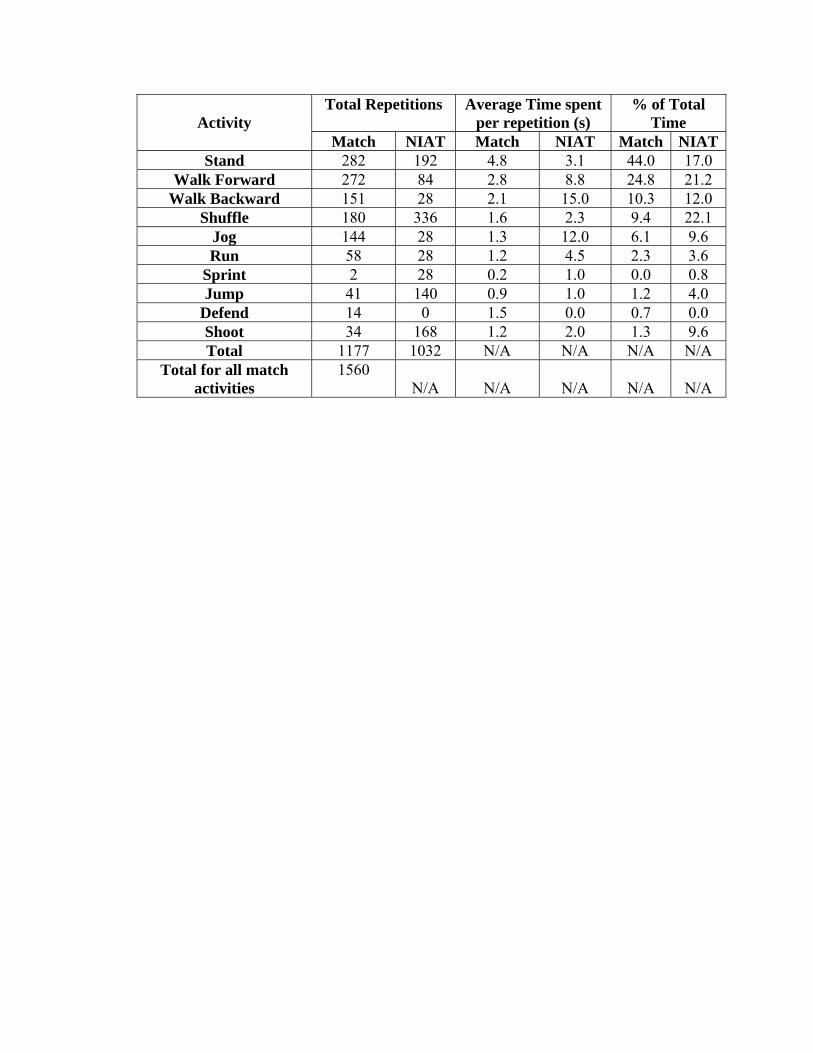
Total Repetitions Average Time spent per repetition (s)
% of Total Time Activity
Match NIAT Match NIAT Match NIATStand 282 192 4.8 3.1 44.0 17.0
Walk Forward 272 84 2.8 8.8 24.8 21.2 Walk Backward 151 28 2.1 15.0 10.3 12.0
Shuffle 180 336 1.6 2.3 9.4 22.1 Jog 144 28 1.3 12.0 6.1 9.6 Run 58 28 1.2 4.5 2.3 3.6
Sprint 2 28 0.2 1.0 0.0 0.8 Jump 41 140 0.9 1.0 1.2 4.0
Defend 14 0 1.5 0.0 0.7 0.0 Shoot 34 168 1.2 2.0 1.3 9.6 Total 1177 1032 N/A N/A N/A N/A
Total for all match activities
1560 N/A
N/A
N/A
N/A
N/A